Tbx1 is required autonomously for cell survival and fate in the pharyngeal core mesoderm to form the...
17
Tbx1 is required autonomously for cell survival and fate in the pharyngeal core mesoderm to form the muscles of mastication Ping Kong 1, { , Silvia E. Racedo 1, { , Stephania Macchiarulo 1 , Zunju Hu 1 , Courtney Carpenter 2 , Tingwei Guo 1 , Tao Wang 3 , Deyou Zheng 1,4 and Bernice E. Morrow 1, ∗ 1 Department of Genetics, Albert Einstein College of Medicine, 1301 Morris Park Avenue, Bronx, NY 10461, USA, 2 Department of Surgery, Montefiore Medical Center, 111 East 210th Street, Bronx, NY 10467, USA, 3 Department of Epidemiology and Population Health, Department of Genetics, Albert Einstein College of Medicine, 1300 Morris Park Avenue, Bronx, NY 10461, USA and 4 Departments of Neurology and Neuroscience, Department of Genetics, Albert Einstein College of Medicine, 1300 Morris Park Avenue, Bronx, NY 10461, USA Received October 17, 2013; Revised February 21, 2014; Accepted March 24, 2014 Velo-cardio-facial/DiGeorge syndrome, also known as 22q11.2 deletion syndrome, is a congenital anomaly disorder characterized by craniofacial anomalies including velo-pharyngeal insufficiency, facial muscle hypotonia and feeding difficulties, in part due to hypoplasia of the branchiomeric muscles. Inactivation of both alleles of mouse Tbx1, encoding a T-box transcription factor, deleted on chromosome 22q11.2, results in reduction or loss of branchiomeric muscles. To identify downstream pathways, we performed gene profiling of microdissected pharyngeal arch one (PA1) from Tbx1 1/ 1 and Tbx1 2/ 2 embryos at stages E9.5 (somites 20 – 25) and E10.5 (somites 30 – 35). Basic helix – loop – helix (bHLH) transcription factors were reduced, while sec- ondary heart field genes were increased in expression early and were replaced by an increase in expression of cellular stress response genes later, suggesting a change in gene expression patterns or cell populations. Lineage tracing studies using Mesp1 Cre and T-Cre drivers showed that core mesoderm cells within PA1 were pre- sent at E9.5 but were greatly reduced by E10.5 in Tbx1 2/ 2 embryos. Using Tbx1 Cre knock-in mice, we found that cells are lost due to apoptosis, consistent with increase in expression of cellular stress response genes at E10.5. To determine whether Tbx1 is required autonomously in the core mesoderm, we used Mesp1 Cre and T-Cre mesodermal drivers in combination with inactivate Tbx1 and found reduction or loss of branchiomeric muscles from PA1. These mechanistic studies inform us that Tbx1 is required upstream of key myogenic genes needed for core mesoderm cell survival and fate, between E9.5 and E10.5, resulting in formation of the branchio- meric muscles. INTRODUCTION Velo-cardio-facial syndrome (MIM # 192430)/DiGeorge syn- drome (MIM# 188400), also known as 22q11.2 deletion syn- drome (22q11DS), is caused by a 1.5–3 million base pair hemizygous 22q11.2 deletion and is characterized by cardiac, immune and craniofacial anomalies. Craniofacial malforma- tions consist of submucous or overt cleft palate, platybasia and velo-pharyngeal insufficiency (VPI) (1 – 3). VPI symptoms include feeding or swallowing difficulties during infancy and hypernasal speech later. One cause of VPI is the existence of a submucous cleft palate and/or muscle hypotonia, both present in most 22q11DS patients (3 – 5). In addition to VPI, some 22q11DS children have asymmetric crying facies, which is char- acterized by drooping of one side of the mouth during crying. It is thought that this phenotype is caused in part by branchiomeric muscle hypoplasia (6). The branchiomeric muscles are specific to the head and neck, but do not include extraocular muscles or the tongue. When com- pared with the somites in the body, branchiomeric muscles derive † These two authors contributed equally to the manuscript. ∗ To whom correspondence should be addressed. Email: [email protected] # The Author 2014. Published by Oxford University Press. All rights reserved. For Permissions, please email: [email protected] Human Molecular Genetics, 2014, Vol. 23, No. 16 4215–4231 doi:10.1093/hmg/ddu140 Advance Access published on April 4, 2014 at Yeshiva Univ Libraries AECOM Cardozo YU on June 16, 2015 http://hmg.oxfordjournals.org/ Downloaded from
Transcript of Tbx1 is required autonomously for cell survival and fate in the pharyngeal core mesoderm to form the...

Tbx1 is required autonomously for cell survivaland fate in the pharyngeal core mesoderm to formthe muscles of mastication
Ping Kong1,{, Silvia E. Racedo1,{, Stephania Macchiarulo1, Zunju Hu1, Courtney Carpenter2,
Tingwei Guo1, Tao Wang3, Deyou Zheng1,4 and Bernice E. Morrow1,∗
1Department of Genetics, Albert Einstein College of Medicine, 1301 Morris Park Avenue, Bronx, NY 10461, USA,2Department of Surgery, Montefiore Medical Center, 111 East 210th Street, Bronx, NY 10467, USA, 3Department of
Epidemiology and Population Health, Department of Genetics, Albert Einstein College of Medicine, 1300 Morris Park
Avenue, Bronx, NY 10461, USA and 4Departments of Neurology and Neuroscience, Department of Genetics, Albert
Einstein College of Medicine, 1300 Morris Park Avenue, Bronx, NY 10461, USA
Received October 17, 2013; Revised February 21, 2014; Accepted March 24, 2014
Velo-cardio-facial/DiGeorge syndrome, also known as 22q11.2 deletion syndrome, is a congenital anomalydisorder characterized by craniofacial anomalies including velo-pharyngeal insufficiency, facial musclehypotonia and feeding difficulties, in part due to hypoplasia of the branchiomeric muscles. Inactivation ofboth alleles of mouse Tbx1, encoding a T-box transcription factor, deleted on chromosome 22q11.2, results inreduction or loss of branchiomeric muscles. To identify downstream pathways, we performed gene profilingof microdissected pharyngeal arch one (PA1) from Tbx11/1 and Tbx12/2 embryos at stages E9.5 (somites 20–25) and E10.5 (somites 30–35). Basic helix–loop–helix (bHLH) transcription factors were reduced, while sec-ondary heart field genes were increased in expression early and were replaced by an increase in expressionof cellular stress response genes later, suggesting a change in gene expression patterns or cell populations.Lineage tracing studies using Mesp1Cre and T-Cre drivers showed that core mesoderm cells within PA1 were pre-sent at E9.5 but were greatly reduced by E10.5 in Tbx12/2 embryos. Using Tbx1Cre knock-in mice, we found thatcells are lost due to apoptosis, consistent with increase in expression of cellular stress response genes at E10.5.To determine whether Tbx1 is required autonomously in the core mesoderm, we used Mesp1Cre and T-Cremesodermal drivers in combination with inactivate Tbx1 and found reduction or loss of branchiomeric musclesfrom PA1. These mechanistic studies inform us that Tbx1 is required upstream of key myogenic genesneeded for core mesoderm cell survival and fate, between E9.5 and E10.5, resulting in formation of the branchio-meric muscles.
INTRODUCTION
Velo-cardio-facial syndrome (MIM # 192430)/DiGeorge syn-drome (MIM# 188400), also known as 22q11.2 deletion syn-drome (22q11DS), is caused by a 1.5–3 million base pairhemizygous 22q11.2 deletion and is characterized by cardiac,immune and craniofacial anomalies. Craniofacial malforma-tions consist of submucous or overt cleft palate, platybasia andvelo-pharyngeal insufficiency (VPI) (1–3). VPI symptomsinclude feeding or swallowing difficulties during infancy and
hypernasal speech later. One cause of VPI is the existence of asubmucous cleft palate and/or muscle hypotonia, both presentin most 22q11DS patients (3–5). In addition to VPI, some22q11DS children have asymmetric crying facies, which is char-acterized by drooping of one side of the mouth during crying. It isthought that this phenotype is caused in part by branchiomericmuscle hypoplasia (6).
The branchiomeric muscles are specific to the head and neck,but do not include extraocular muscles or the tongue. When com-pared with the somites in the body, branchiomeric muscles derive
†These two authors contributed equally to the manuscript.
∗To whom correspondence should be addressed. Email: [email protected]
# The Author 2014. Published by Oxford University Press. All rights reserved.For Permissions, please email: [email protected]
Human Molecular Genetics, 2014, Vol. 23, No. 16 4215–4231doi:10.1093/hmg/ddu140Advance Access published on April 4, 2014
at Yeshiva U
niv Libraries A
EC
OM
Cardozo Y
U on June 16, 2015
http://hmg.oxfordjournals.org/
Dow
nloaded from
from unsegmented cranial paraxial mesoderm in the central coreof the pharyngeal arches during embryogenesis (7,8). The coremesoderm cells within pharyngeal arch 1 (PA1) form themuscles of mastication required for chewing. Basic helix–loop–helix (bHLH) transcription factors are central to branchio-meric myogenesis. Four bHLH transcription factor genes, Tcf21(Capsulin), Msc (MyoR), Myf5 and MyoD, play a critical role incraniofacial muscle formation. Tcf21 and Msc work redundantlyto regulate the first step of the specification of the branchiomericmuscles; in their combined absence, the muscles do not formfrom the core mesoderm Tcf21 and Msc act upstream of Myf5and MyoD needed for differentiation (9,10).
In addition to the bHLH transcription factors, additionaltranscription factor genes play critical roles in formingthe branchiomeric muscles and they include Pitx2 and Isl1(11–16). Pitx2 is required early for craniofacial muscledevelopment (14,15). Lhx2 encodes another homeodomaintranscription factor required for branchiomeric muscle devel-opment (17). Thus far, Tcf21, Msc, Pitx2, Isl1 and Lhx2 arethe known key transcription factor genes required for earlycraniofacial muscle development upstream of Myf5 andMyoD; none lies in the 22q11.2 region deleted in affectedindividuals.
The TBX1 gene is located within the 22q11.2 region that ishemizygously deleted in patients. It encodes a transcriptionfactor that is part of the T-box gene family. Haploinsufficiencyof TBX1 is believed to be responsible for most of the physicaldefects in 22q11DS patients, including craniofacial anomalies(18–20). Mouse models have been useful in dissecting Tbx1function during embryogenesis. Tbx1+/2 mice have milddefects at reduced penetrance, while Tbx12/2 mice die atbirth with overt cleft palate and reduced or missing branchio-meric muscles, absent thymus and parathyroid glands and asingle cardiac outflow tract instead of a separate aorta and pul-monary trunk (18–20). The distal pharyngeal arches do notform in Tbx12/2 mutant embryos, and thus, their derivativesdo not form. The first pharyngeal arch is the only one presentin mutant embryos and it appears grossly normal. Themuscles of mastication form from the mandibular portion ofpharyngeal arch one (PA1) and include the masseter, pterygoidand temporalis muscles, which are intermittently absent inTbx12/2 embryos (21). Relevant to this, mouse geneticstudies suggest that Tbx1 acts downstream of Tcf21, Pitx2and Isl1 and upstream of Lhx2, Myf5 and MyoD(14,17,21,22). Tbx1 is not required for initial core mesodermformation or specification, because core mesodermal cells arepresent at E9.5, but it is required later to pattern the muscles(21). The mechanism responsible for craniofacial muscle lossin Tbx1 mutant embryos is unknown.
Major goals here are to identify new genes and pathwaysdownstream of Tbx1 so as to determine why the muscles of mas-tication do not form in PA1 and finally, whether Tbx1 is requiredcell autonomously, as was raised in the past for chick (23), but notconclusively proved in mouse models. We found that Tbx1 isrequired for determining cell fate as well as survival, betweenE9.5 and E10.5, in the core mesoderm needed autonomouslyto form the muscles of mastication. This provides mechanisticevidence explaining why the craniofacial muscles do not formwhen Tbx1 is inactivated.
RESULTS
Expression of PA1 core mesoderm genes reduced in Tbx12/2
embryos
In situ hybridization was performed on Tcf21, Msc, Myf5 andMyoD in Tbx1+/+ and Tbx12/2 mutant embryos at E9.5(somites, 20–25) and E10.5 (somites, 30–35) as shown inFigure 1. Whole-mount in situ hybridization at E10.5 was fol-lowed by analysis of tissue sections to visualize the pattern of ex-pression inside the embryos (Fig. 1). Expression appeared to bein the core mesoderm. All the four genes were expressed in PA1at both stages in Tbx1+/+ embryos, except MyoD, whose expres-sion was not detected in PA1 at E9.5 (Fig. 1). The Tcf21 and Mscgenes were expressed in PA1 in Tbx12/2 embryos at E9.5, butnot E10.5 (Fig. 1). In contrast, Myf5 was absent in null mutantembryos at E9.5 and E10.5 (Fig. 1). Frontal whole-mountimages are shown depicting gene expression patterns withrespect to Tbx1 showing expression of the four bHLH genes ina similar region of PA1 (Fig. 1).
To build molecular connections between Tbx1 and the fourbHLH genes as well as to identify new genes for branchiomericmyogenesis, gene expression profiling was performed frommicrodissected PA1 tissues from Tbx1+/+ and Tbx12/2
mutant embryos at E9.5. We did not perform microarray analysison Tbx1+/2 embryos because they have no obvious craniofacialmuscle defects (21,24). We first examined genes that werereduced in expression in the microarrays (Supplementary Mater-ial, Table S1). Ingenuity pathway analysis (IPA) and hand cur-ation was done to create a gene network as shown inFigure 2A. The gene network included the genes that werereduced in expression in Tbx12/2 embryos (gray fill; Fig. 2A),the four bHLH genes discussed above (Fig. 1) and connectinggenes identified by IPA irrespective of known function(Fig. 2A). We also evaluated gene expression levels in PA1 byquantitative reverse transcriptase–polymerase chain reaction(qRT–PCR; Fig. 2B). There are some differences between insitu hybridization, microarray and qRT–PCR results, butoverall they showed a consistent differential expressionpattern. For example, expression of Tcf21 as detected by whole-mount in situ hybridization was not visibly changed in Tbx12/2
embryos at E9.5, but was lost in mutant embryos at E10.5(Fig. 1). In contrast, Tcf21 expression was significantlyreduced in Tbx12/2 embryos by microarray (SupplementaryMaterial, Table S1) and qRT–PCR (Fig. 2B) analyses at E9.5and E10.5. MyoD expression was not detected by in situ hybrid-ization analysis of Tbx1+/+ embryos, nor was expressiondetected in the microarrays at E9.5 (somites 20–25). MyoDprobes failed in the microarray at E10.5, possibly due to tech-nical problems with the specific probe. Expression of MyoDwas detected by qRT–PCR and it was reduced in Tbx12/2
embryos at E9.5 and E10.5 (Fig. 2B).The IPA network contains genes that have been previously
found to be genetically or molecularly connected to the differen-tially expressed genes in this study, but they may not showexpression change in our system. This is because the IPAnetwork builds connections based upon genes and their relation-ships from papers reported in the literature. For example, Shh andAsh2l were part of the IPA network but were not changed in ex-pression by microarray or qRT–PCR. We included a list of top
4216 Human Molecular Genetics, 2014, Vol. 23, No. 16
at Yeshiva U
niv Libraries A
EC
OM
Cardozo Y
U on June 16, 2015
http://hmg.oxfordjournals.org/
Dow
nloaded from

Figure 1. Basic HLH transcription factor genes, Tcf21, Msc, Myf5 and MyoD, in Tbx1+/+ versus Tbx12/2 embryos at E9.5 and E10.5. Lateral views of Tbx1+/+ versusTbx12/2 embryos at E9.5 (somite count, 20–25) and E10.5 (somite count, 30–40) are shown following whole-mount in situ hybridization with probes for Tcf21, Msc,Myf5 and MyoD. Coronal histological sections of the PA1 region from E10.5 embryos are shown next to the whole-mount images. Arrow points to core mesodermexpression domain of Tcf21 in PA1. The image below shows whole-mount coronal views of the first and second pharyngeal arch in Tbx1+/+ embryos at E9.5 and E10.5after whole-mount in situ hybridization, using antisense probes to the four bHLH genes. Cartoons are shown below to depict expression patterns of individual probes.
Human Molecular Genetics, 2014, Vol. 23, No. 16 4217
at Yeshiva U
niv Libraries A
EC
OM
Cardozo Y
U on June 16, 2015
http://hmg.oxfordjournals.org/
Dow
nloaded from

Figure 2. Gene network of PA1 genes reduced in expression at E9.5 in Tbx12/2 embryos. (A) The network of genes that were reduced in expression in Tbx12/2
embryos when compared with Tbx1+/+ embryos (.1.5-fold change, P , 0.05) was created using IPA (http://www.ingenuity.com/products/ipa). The top networkis depicted here. The genes reduced in expression are highlighted by gray fill, and additional genes connected to them based on IPA network analysis are indicatedas diamonds. The lines indicate relationships between genes that could directly or indirectly interact. Genes reduced in expression but not linked to this network can befound in the Supplementary Material, Table S1. (B) Quantitative RT-PCR of PA1 tissue from Tbx1+/+ and Tbx12/2 embryos at E9.5. The X-axis indicates genesanalyzed and Y-axis represents fold change of expression in PA1 tissue from Tbx12/2 relative to Tbx1+/+controls at E9.5. Error bars, s.e.m. (n ¼ 3). (C) Genesreduced in expression in Tbx12/2 embryos at E9.5 were analyzed at the Genemania website (http://www.genemania.org/) to identify top enriched functions. Weprovide the FDR (false discovery rate) score estimated in Genemania by the Benjamini–Hochberg correction.
4218 Human Molecular Genetics, 2014, Vol. 23, No. 16
at Yeshiva U
niv Libraries A
EC
OM
Cardozo Y
U on June 16, 2015
http://hmg.oxfordjournals.org/
Dow
nloaded from

gene ontology networks identified from IPA analysis (Fig. 2C).The most significant category identified was embryonic organmorphogenesis with 16 of 215 genes connected to this particularnetwork (Fig. 2C). Similarly, genes important for mesenchymaland neural crest cell development were reduced in expression(Fig. 2C).
We performed a similar gene profiling experiment at E10.5 todetermine whether the sameor different genes were reduced in ex-pression (Supplementary Material, Table S2). We found that 20genes were changed similarly between Tbx1+/+ and Tbx12/2
embryos at stages E9.5 and E10.5. A subset of genes changed inthe microarray as well as the four bHLH genes were tested byqRT–PCR (Supplementary Material, Fig. S1; SupplementaryMaterial, Table S2). The qRT–PCR results (Supplementary Ma-terial, Fig. S1) were consistent with the microarray results, exceptfor the expression of Msc and MyoD, for which were not signifi-cantly changed (or detected; MyoD) by microarray analysis, butthere expression was reduced by qRT–PCR analysis. Basedupon the gene lists fromE9.5 andE10.5 (Supplementary Material,Tables S1 and S2) and qRT–PCR analysis (Fig. 2B; Supplemen-tary Material, Fig. S1), we performed in situ hybridization todetect patterns of Foxc1, Foxc2, Sim2, Lhx2, Lrrn1 and Chrdl1gene expression in Tbx1+/+ and Tbx12/2 embryos.
We evaluated the spatial and temporal pattern of expression ofthese six genes in PA1 at E9.5 and E10.5. We separated the ana-lysis to those known to be expressed in the core mesoderm fromthose expressed in the neural crest mesoderm. Two of the genes,
Lhx2 and Lrrn1, were expressed in the core mesoderm at E9.5and three of the genes, Lhx2, Chrdl1 and Lrrn1, were expressedat E10.5 in Tbx1+/+ embryos (Fig. 3). The gene Lhx2 encodes aLIM homeobox transcription factor that is required for craniofa-cial muscle formation. Recent studies showed that Lhx2 actsdownstream of Tbx1, Pitx2 and Tcf21 in the core mesodermfor branchiomeric muscle formation (17); however, we wantedto check expression in our Tbx1 mutant allele. Expression ofthe Pitx2 gene, although not changed in the PA1 microarraystudy, was slightly but significantly increased by qRT–PCR ana-lysis (Fig. 2B). This data was included in the network shown inFigure 2A. Lhx2 was expressed in the core mesoderm inTbx1+/+ embryos at E9.5 and E10.5 but absent from PA1 inTbx12/2 embryos at both stages (Fig. 3).
The Lrrn1 (neuronal leucine-rich repeat-1, NLRR-1) geneencodes a transmembrane glycoprotein localized on the cellsurface. The gene is expressed in developing somites (25). TheLrrn1 gene was weakly expressed in the core mesoderm ofPA1 in Tbx1+/+ embryos at E9.5 and strongly expressed atE10.5. Expression of Lrrn1 was absent in Tbx12/2 embryos atE9.5 and E10.5 (Supplementary Material, Tables S1 and 2;Fig. 3). Of interest, a previous report demonstrated that Lrrn1 ex-pression was reduced in MyoD2/2 myogenic cells in culture(26). This suggests a possible functional role of Lrrn1 in bran-chiomeric myogenesis.
The Chrdl1 (Chordin like 1) gene is a closely related Bonemorphogenic protein (Bmp) antagonist gene family member to
Figure 3. Tbx1, Lhx2, Lrrn1 and Chrdl1 expression in the core mesoderm in Tbx1+/+ versus Tbx12/2 embryos at E9.5 and E10.5. Lateral views of whole-mount in situhybridization of Tbx1+/+ and Tbx12/2 embryos at E9.5 and E10.5 with antisense probes for Tbx1 (Wt only), Lhx2, Lrrn1 and Chrdl1. Coronal tissue sections from asubset of the whole-mount stained embryos are shown adjacent to the whole-mount images. Chrdl1 is not expressed in the core mesoderm in Tbx1+/+ embryos at E9.5;thus, no images are shown for Tbx12/2 embryos at this stage. Lhx2, Lrrn1 and Chrdl1 were not expressed in the core mesoderm in Tbx12/2 embryos so only whole-mount images are shown.
Human Molecular Genetics, 2014, Vol. 23, No. 16 4219
at Yeshiva U
niv Libraries A
EC
OM
Cardozo Y
U on June 16, 2015
http://hmg.oxfordjournals.org/
Dow
nloaded from

Chordin (27). Chrdl1 is expressed in the neural plate, forebrainand pharyngeal apparatus core mesoderm among other tissues(27). Chrdl1 was not specifically expressed in PA1 in Tbx1+/+
embryos at E9.5 as determined by in situ hybridization analysis(Fig. 3). Although we did not find specific PA1 expression by insitu hybridization in Tbx1+/+ embryos at E9.5, core PA1 expres-sion was observed in a different report (26). This differencecould be due to slight embryo stage differences, mouse strainor probe quality differences. On the other hand, specific PA1 ex-pression by this method was observed at E10.5 (Fig. 3), similar towhat was previously reported (26). PA1 expression was lost inTbx12/2 embryos at E10.5, although forelimb bud expressionremained (Fig. 3). Chrdl1 expression as determined by micro-array and qRT–PCR analysis was present in PA1 of Tbx1+/+
embryos at E9.5 and E10.5 and it was reduced in Tbx12/2
embryos at both stages (Supplementary Material, Tables S1and 2; Fig. 2B; Supplementary Material, Fig. S1).
The Fgf10 gene, important downstream of Tbx1 in multipletissues, was previously shown to be expressed in the core meso-derm of the pharyngeal arches (28,29) and is part of the genenetwork shown in Figure 2A. Fgf10 shows a very small reductionof expression in PA1 in Tbx12/2 embryos by microarray ana-lysis (Supplementary Material, Table S1) and qRT–PCR atE9.5 (Fig. 2B). Consistent with this, we previously found thatFgf10 is present in the core mesoderm in Tbx1+/+ embryos butdiffusely expressed in PA1 tissue of Tbx12/2 embryos at E9.5,rather than being absent (30).
Reduced expression of genes for craniofacial development inTbx12/2 embryos
Neural crest cell (NCC) mesoderm lies in the first pharyngealarch between the core mesoderm and surrounding epithelia.The Foxc1 and Foxc2 genes encode proteins that belong to theforkhead family of transcription factors. Both genes act redun-dantly for cardiac and vascular development in neural crestmesoderm as well as somitogenesis (31). As mentioned above,we found that expression of the Foxc1 gene was reduced inTbx12/2 when compared with Tbx1+/+ embryos at E9.5 andE10.5 by both microarray and qRT–PCR analyses (Supplemen-tary Material, Figs S1 and 2B). We performed in situ hybridiza-tion to determine whether the pattern of expression changed inTbx12/2 embryos at E9.5 and at E10.5. The Foxc1 gene wasbroadly expressed in Tbx1+/+ embryos at E9.5 and more specif-ically expressed in the caudal PA1 at E10.5 (Fig. 4A and B). Ex-pression was similar between Tbx1+/+ when compared withTbx12/2 embryos at E9.5, but localized to a smaller region inTbx12/2 embryos at E10.5 (Fig. 4A).
In contrast to Foxc1, we did not detect a change in expressionof Foxc2 at E9.5 in the microarray experiment (SupplementaryMaterial, Table S1) and did not perform qRT–PCR at thisstage. We observed a similar diffuse pattern of expression inPA1 for Foxc2, as for Foxc1 in Tbx1+/+ and Tbx12/2
embryos by in situ hybridization at E9.5 (Fig. 4A). Consistentwith microarray and qRT–PCR findings (Supplementary Mater-ial, Table S2 and Fig. S1), there was loss of expression in PA1 atE10.5 in Tbx12/2 embryos by in situ hybridization analysis(Fig. 4A; Supplementary Material, Fig. S1).
The Sim2 gene encodes a bHLH transcription factor gene(single-minded, Drosophila) expressed in the pharyngeal
arches and is required to form the secondary palate, tongue andpterygoid process (32). The muscles of mastication are stillpresent in Sim22/2 mutant mice, and thus, it is not required forbranchiomeric myogenesis (32). We did not observe expressionof Sim2 by in situ hybridization or microarray analysis inTbx1+/+ embryos at E9.5 (Fig. 4A). Sim2 is expressed in the pha-ryngeal arches at E10.5 in Tbx1+/+ embryos. It appears to be ad-jacent to the Tbx1 expression domain, although we cannot ruleout that Sim2 expression may partially overlap with that ofTbx1 (Fig. 4B). The area of expression is reduced in Tbx12/2
embryos but not absent at this stage (Fig. 4). At E10.5, expressionof Sim2, as determined by microarray (Supplementary Material,
Figure 4. Foxc1, Foxc2 and Sim2 expression in PA1 in Tbx1+/+ versus Tbx12/2
embryos at E9.5 and E10.5. (A) Lateral views of whole-mount in situ hybridiza-tion of probes for Foxc1, Foxc2 and Sim2 in Tbx1+/+ and Tbx12/2 embryos atE9.5 and E10.5. Enlarged lateral views of the PA1 region in the whole-mount spe-cimens is shown below each whole embryo view. (B) Cartoon of lateral andcoronal views (shown below) of Tbx1, Foxc1, Foxc2 and Sim2. Expressiondomain of Tbx1 is in the core mesoderm.
4220 Human Molecular Genetics, 2014, Vol. 23, No. 16
at Yeshiva U
niv Libraries A
EC
OM
Cardozo Y
U on June 16, 2015
http://hmg.oxfordjournals.org/
Dow
nloaded from

Table S2) and qRT–PCR (Supplementary Material, Fig. S1)analysis, was reduced in Tbx12/2 embryos. The specific patternsof expression in PA1 tissue of Foxc1, Foxc2, Sim2 and Tbx1 areshown in lateral and frontal views in the cartoon inFigure 4B. Changes in expression of all three genes implicatepossible roles downstream of Tbx1 in either craniofacialmuscle and/or bone development.
Increased expression of PA1 genes in Tbx12/2 embryos
We examined genes increased in expression in Tbx1+/+ versusTbx12/2 mutant embryos at E9.5 by gene expression microarrayanalysis (Fig. 5). As for genes reduced in expression describedabove, we performed gene network analysis (Fig. 5A). Manyof the genes increased in expression at E9.5 (gray fill; Fig. 5A)are known genes for cardiac development and differentiation(Fig. 5B). A subset of the genes that were increased in expressionin the microarray in Tbx12/2 mutant embryos at E9.5 weretested and confirmed by qRT–PCR of dissected PA1 tissue(Fig. 2B). Based upon the results, it is possible that loss ofTbx1 results in a change in fate of the core mesoderm from thecraniofacial pattern to the cardiac differentiation program. Totest this, we performed in situ hybridization analysis. Ectopic ex-pression of Gata4, Gata5, Gata6 and Tbx20 transcription factorgenes extended rostrally to the caudal tip of PA1, but were notdetected in the core mesoderm (Fig. 5C). This suggests that in-crease in expression may not be due to cell fate change in thecore mesoderm from the craniofacial to the cardiac specific de-velopmental pathways. Furthermore, additional cardiac specificgenes were also ectopically expressed rostrally in Tbx12/2
embryos, such as Myl7, Actc1 and Tbx5 (33). They wereexpressed in the caudal part of PA1 but were not detected inthe core mesoderm (33).
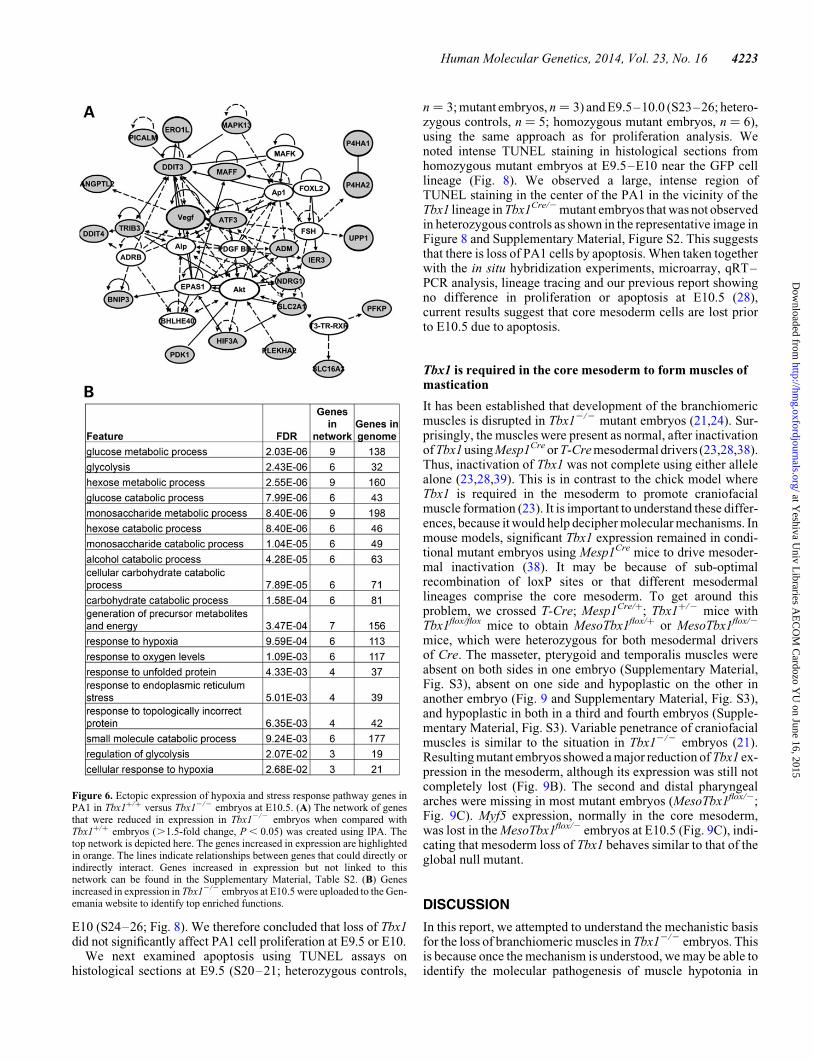
At E10.5, we found a different set of genes increased in expres-sion by gene profiling of PA1 tissue in Tbx12/2 embryos versusTbx1+/+ embryos. We detected enrichment of stress responseand glucose metabolism genes (Fig. 6). Four genes were increasedin expression in the microarrays at E9.5 and E10.5 in PA1 tissue inTbx12/2 embryos: Mapk13, Rarres2, Lipg and Vldlr (Supple-mentary Material, Table S2). We validated enhanced expressionof Mapk13 at E9.5 and E10.5 in Tbx12/2 mutant embryos byqRT–PCR, albeit with some differences in the extent of upregula-tion in expression between microarray and the qRT–PCR assays(Fig. 2B; Supplementary Material, Fig. S1). Mapk13 encodesmitogen-activated protein kinase 13 (p38 delta) and it is importantfor promoting cell survival in response to cell stress (34). Rarres2encodes a retinoic acid receptor responder (tazarotene induced) 2,also referred to as Chemerin, an adipokine, and is a retinoic acidresponsive gene (29). Lipg encodes a lipase and Vldlr encodesvery low density lipoprotein receptor and it is upregulated in re-sponse to hypoxia (35). Several genes increased in expressionbelong to the Vegf, hypoxia response pathway and Akt, cellularsurvival pathways as indicated (Fig. 6). This may implicate thepresence of cellular stress or apoptosis.
Core mesodermal tissue is lost in Tbx12/2 embryos betweenE9.5 and E10.5
To determine the embryonic stage when tissue forming thesemuscles is reduced or lost in Tbx12/2 mutant embryos, we
crossed T-Cre; Mesp1Cre/+; Tbx1+/2 mice with RCEEGFP/EGFP;Tbx1+/2 mice and dissected embryos to perform lineage tracing.We combined the two mesodermal Cre drivers together toensure more complete fate mapping of the lineage (Meso-Cre).Fortunately, neither T-Cre nor Mesp1Cre/+ results in ectopicloxP site recombination in vivo (28,36). At E9.5, the mesodermallineage was seen in the pharyngeal apparatus and heart, asexpected (Fig. 7I–P). Core mesodermal tissue was apparent inPA1 in Tbx1+/+ and Tbx12/2 embryos (Fig. 7K, L, O and P).Existence of core mesodermal cells (21) is supported by the pres-ence of Tcf21 and Msc mRNA expression at E9.5 in Tbx12/2
embryos (Fig. 1).The situation was different at E10.5, where the mesodermal
lineage covered a larger area of the embryo, including thesomites (Fig. 7A–D); however, the cell lineages were largelyreduced or absent in the same region from Tbx12/2 embryos(Fig. 7E–H). This is consistent with loss of mRNA expressionof all core mesodermal genes at E10.5 (Supplementary Material,Table S2). The results suggest that the core mesoderm cells aregreatly reduced or lost between E9.5 and E10.5. We observeda small patch of unstained cells surrounded by robustly labeledNCCs in Tbx12/2 embryos using a Wnt1-Cre driver and aROSA26-LacZ reporter to trace the NCCs in Tbx12/2 embryosat E10.5, indicating that at least some mesodermal cells arepresent, perhaps of a different lineage (28).
Increased apoptosis in the core mesoderm of Tbx12/2
embryos at E9.5–E10
To determine whether there is a change in cell proliferation orapoptosis accounting for loss of core mesodermal gene expres-sion, we used Tbx1Cre/+ mice (37) to perform lineage tracing.Tbx1Cre/+ is a knock-in and there is a replacement of part of theTbx1 coding region with Cre recombinase on one allele, therebyinactivating Tbx1 (37). Previous studies showed that proliferationof mesenchymal cells in the pharyngeal apparatus was reduced atE8.5 in Mesp1Cr-e-mediated Tbx1 conditional null mutantembryos (38), suggesting cell autonomous differences in prolifer-ation early in development. We evaluated cell proliferation fromE9.5 (S20–25) to E10.0 (S26–29) in Tbx1Cre/+; RCEEGFP/+ (het-erozygous control) and Tbx1Cre/2; RCEEGFP/+ (mutant) embryosby dual immunofluorescence with antibodies against GFP andanti-phospho Histone H3 (Ser10). Tbx1+/2 mice have nodefects in craniofacial muscles, making it possible to use theknock-in line for comparative lineage tracing. We calculated theaverage number of Tbx1 lineage cells (GFP fluorescence) and pro-liferating cells (Rhodamine fluorescence) per tissue section forheterozygous controls (WT; Fig. 8B) and mutant embryos (KO;Fig. 8B). At E9.5, heterozygous control embryos had similarnumbers of Tbx1 lineage and proliferating cells (19.3/section,15.0/section; n ¼ 3) with homozygous null mutant embryos(17.4/section, 14.5/section; n ¼ 4). Closer to E10, heterozygouscontrols tended to have more Tbx1 lineage cells than in homozy-gous mutant embryos (39.9/section, n ¼ 3 versus.16.8/section,n ¼ 6; P ¼ 0.12), while proliferating cells were similar betweenthe two genotypes (31.0/section; n ¼ 3 versus. 33.1/section;n ¼ 6). We noted qualitatively that proliferation occurred in fewcells and evenly across the entire PA1 tissue in control andmutant embryos at E9.5 (S20–21; data not shown) and E9.5–
Human Molecular Genetics, 2014, Vol. 23, No. 16 4221
at Yeshiva U
niv Libraries A
EC
OM
Cardozo Y
U on June 16, 2015
http://hmg.oxfordjournals.org/
Dow
nloaded from

Figure 5. Ectopic expression of cardiac genes in PA1 in Tbx1+/+ versus Tbx12/2 embryos at E9.5. (A) The network downstream of Tbx1 was created using genes thathad a .1.5-fold increase, P , 0.05 by microarray analysis (gray fill). Genes not changed in expression significantly in the microarray or qRT–PCR assay, but con-nected to those based upon the software generated connections, are indicated as uncolored circles. The lines indicate relationships between genes that could be direct orindirect in nature. Genes increased in expression but not linked to the network were removed but can be found in the Supplementary Material, Table S1. (B) Genesincreased in expression in Tbx12/2 embryos at E9.5 were analyzedat the Genemania website to identify top enriched functions. We provide the FDR score estimated inGenemania by the Benjamini–Hochberg correction. (C) Whole-mount in situ hybridization was performed on in Tbx1+/+ versus Tbx12/2 embryos at E9.5 withprobes to the genes indicated. Tissue sections are shown adjacent to whole embryo images. The arrows in Tbx20 images point to regions of ectopic expression.Regions of ectopic expression of Gata5 and Gata6 in Tbx1+/+ versus Tbx12/2 embryos are shown as arrows in the cropped images.
4222 Human Molecular Genetics, 2014, Vol. 23, No. 16
at Yeshiva U
niv Libraries A
EC
OM
Cardozo Y
U on June 16, 2015
http://hmg.oxfordjournals.org/
Dow
nloaded from
E10 (S24–26; Fig. 8). We therefore concluded that loss of Tbx1did not significantly affect PA1 cell proliferation at E9.5 or E10.
We next examined apoptosis using TUNEL assays onhistological sections at E9.5 (S20–21; heterozygous controls,
n ¼ 3; mutant embryos, n ¼ 3) and E9.5–10.0 (S23–26; hetero-zygous controls, n ¼ 5; homozygous mutant embryos, n ¼ 6),using the same approach as for proliferation analysis. Wenoted intense TUNEL staining in histological sections fromhomozygous mutant embryos at E9.5–E10 near the GFP celllineage (Fig. 8). We observed a large, intense region ofTUNEL staining in the center of the PA1 in the vicinity of theTbx1 lineage in Tbx1Cre/2 mutant embryos that was not observedin heterozygous controls as shown in the representative image inFigure 8 and Supplementary Material, Figure S2. This suggeststhat there is loss of PA1 cells by apoptosis. When taken togetherwith the in situ hybridization experiments, microarray, qRT–PCR analysis, lineage tracing and our previous report showingno difference in proliferation or apoptosis at E10.5 (28),current results suggest that core mesoderm cells are lost priorto E10.5 due to apoptosis.
Tbx1 is required in the core mesoderm to form muscles ofmastication
It has been established that development of the branchiomericmuscles is disrupted in Tbx12/2 mutant embryos (21,24). Sur-prisingly, the muscles were present as normal, after inactivationof Tbx1 using Mesp1Cre or T-Cre mesodermal drivers (23,28,38).Thus, inactivation of Tbx1 was not complete using either allelealone (23,28,39). This is in contrast to the chick model whereTbx1 is required in the mesoderm to promote craniofacialmuscle formation (23). It is important to understand these differ-ences, because it would help decipher molecular mechanisms. Inmouse models, significant Tbx1 expression remained in condi-tional mutant embryos using Mesp1Cre mice to drive mesoder-mal inactivation (38). It may be because of sub-optimalrecombination of loxP sites or that different mesodermallineages comprise the core mesoderm. To get around thisproblem, we crossed T-Cre; Mesp1Cre/+; Tbx1+/2 mice withTbx1flox/flox mice to obtain MesoTbx1flox/+ or MesoTbx1flox/2
mice, which were heterozygous for both mesodermal driversof Cre. The masseter, pterygoid and temporalis muscles wereabsent on both sides in one embryo (Supplementary Material,Fig. S3), absent on one side and hypoplastic on the other inanother embryo (Fig. 9 and Supplementary Material, Fig. S3),and hypoplastic in both in a third and fourth embryos (Supple-mentary Material, Fig. S3). Variable penetrance of craniofacialmuscles is similar to the situation in Tbx12/2 embryos (21).Resulting mutant embryos showed a major reduction of Tbx1 ex-pression in the mesoderm, although its expression was still notcompletely lost (Fig. 9B). The second and distal pharyngealarches were missing in most mutant embryos (MesoTbx1flox/2;Fig. 9C). Myf5 expression, normally in the core mesoderm,was lost in the MesoTbx1flox/2 embryos at E10.5 (Fig. 9C), indi-cating that mesoderm loss of Tbx1 behaves similar to that of theglobal null mutant.
DISCUSSION
In this report, we attempted to understand the mechanistic basisfor the loss of branchiomeric muscles in Tbx12/2 embryos. Thisis because once the mechanism is understood, we may be able toidentify the molecular pathogenesis of muscle hypotonia in
Figure 6. Ectopic expression of hypoxia and stress response pathway genes inPA1 in Tbx1+/+ versus Tbx12/2 embryos at E10.5. (A) The network of genesthat were reduced in expression in Tbx12/2 embryos when compared withTbx1+/+ embryos (.1.5-fold change, P , 0.05) was created using IPA. Thetop network is depicted here. The genes increased in expression are highlightedin orange. The lines indicate relationships between genes that could directly orindirectly interact. Genes increased in expression but not linked to thisnetwork can be found in the Supplementary Material, Table S2. (B) Genesincreased in expression in Tbx12/2 embryos at E10.5 were uploaded to the Gen-emania website to identify top enriched functions.
Human Molecular Genetics, 2014, Vol. 23, No. 16 4223
at Yeshiva U
niv Libraries A
EC
OM
Cardozo Y
U on June 16, 2015
http://hmg.oxfordjournals.org/
Dow
nloaded from

22q11DS patients. In order to generate hypotheses for possiblemechanisms, we performed gene profiling at two developmentalstages, at E9.5 and at E10.5, which turned out to be critical stagesfor Tbx1 function, because at these stages core mesodermalgene expression declines coincident with loss of cells due toapoptosis.
Tbx1 may be required to maintain Tcf21 and Msc geneexpression
We found that at stages E9.5 and/or E10.5, Tcf21, Msc, Myf5 andMyoD were decreased in expression. This is somewhat surpris-ing for Tcf21, especially at E9.5, since it is known that whenTcf21 is inactivated Tbx1 expression is reduced, suggestingthat it acts downstream of Tcf21 (17). This work suggests thatTbx1 might be required to maintain Tcf21 expression at E9.5 toE10.5. Expression of both Tcf21 and Msc were absent fromPA1 at E10.5. Our observation that Tcf21 expression was lost
in Tbx12/2 embryos at E10.5 is in contrast to a previous reportindicating that Tcf21 was still expressed in their Tbx12/2
mutant embryos at this stage (40). This discrepancy could bedue to differences in somite counts for which ranges definestage, difference in alleles or to differences in genetic back-grounds. Overall, the new findings in this experiment are thatTcf21 and Msc are reduced in expression at E10.5 in ourTbx12/2 embryos.
In previous studies, when mouse Tcf21 and Msc were bothinactivated, muscles of mastication did not form due to apoptosisof core mesoderm cells by E10.5 (41). The timing of both geneexpression changes and enhanced apoptosis suggests that lossof tissue in Tbx12/2 null mutant embryos might be explained,in part, by failure to maintain Tcf21 and Msc expression. Thisis because Tcf21 and Msc act upstream of Myf5 and MyoD andare required for survival of the core mesoderm (10). Reductionin Myf5 and MyoD expression in Tbx12/2 mutant embryoscould be a direct or indirect result of loss of Tcf21 and Msc
Figure 7. Mesodermal fate mapping in Tbx1+/+ versus Tbx12/2 embryos at E9.5 and E10.5. Mesodermal fate mapping was performed using Mesp1Cre with T-Crealleles and RCEEGFP/+mice in Tbx1+/+ versus Tbx12/2 littermates at E9.5 (I–P) and E10.5 (A–H). Lateral views of Tbx1+/+ (A–D and I–L) and Tbx12/2 (E–H andM–P) mutants are shown as bright (A, E, I and M) and darkfield (B, F, J and N) views. The red arrow points to the region of the presence or absence of core mesodermaltissue in Tbx1+/+ versus Tbx12/2 at E9.5 and E10.5. An enlarged image of the PA1 region is shown to the right of the images (C, G, K and O). On the far right arecoronal cryosections of the same embryos depicting the core mesodermal cells (D, H, L and P). Dapi stain was used to visualize PA1 at E9.5 (L and P).
4224 Human Molecular Genetics, 2014, Vol. 23, No. 16
at Yeshiva U
niv Libraries A
EC
OM
Cardozo Y
U on June 16, 2015
http://hmg.oxfordjournals.org/
Dow
nloaded from

expression. This would implicate direct or indirect transcription-al regulation of Tcf21 and Msc. Relevant to this, it has remainedan enigma in the field as to whether Tbx1 has cell autonomousfunctions in the core mesoderm. In the chick model, downregu-lation of Tbx1 in the core mesoderm tissue in vitro resulted in lossof branchiomeric muscles, but in the mouse model, use of singlemesodermal drivers of Cre recombinase was unable to complete-ly disrupt Tbx1 resulting in continued presence of the muscles ofmastication (23). By simultaneously using two different meso-dermal Cre drivers, we were able to demonstrate that Tbx1 hascell autonomous functions in promoting myogenesis in thistissue. This suggests that a main function of Tbx1 is to maintain
direct or indirect regulation of Tcf21 and Msc expression, as wellas other genes, in the core mesoderm of PA1.
One question is whether this is a direct effect or whether Tbx1in the mesodermal core indirectly signals to neural crest mesen-chymal cells, which then inhibit myogenesis (21). Although wecannot directly answer this question, we do know that completeinactivation of Tbx1 or partial inactivation of Tbx1 using T-Cremice (mesodermal inactivation) alters patterns of expressionpattern of many neural crest expressed genes and results inectopic expression of Hoxa2 (28). However, the muscles of mas-tication still formed in T-Cre mediated Tbx1 conditional mutants(28). When taken together, this suggests that changes in neural
Figure 8. Proliferation and apoptosis of PA1 in Tbx1+/+ versus Tbx12/2 embryos. (A) Immunofluorescence images of tissue sections to visualize the Tbx1 lineage(GFP, green) and either cell proliferation (anti-phospho Histone H3 (Ser10); red fluorescence; top) or apoptosis (TUNEL); red fluorescence; bottom) in Tbx1 hetero-zygous (Het) and homozygous mutant (KO) embryos are shown. Dapi fluorescent stain to visualize nuclei and identify the tissue is shown in blue. The somite counts ofthe Tbx1+/+ and Tbx12/2 embryos are indicated (S24; S25). (B) Cell proliferation analysis. Statistical analysis was performed to determine whether cell proliferationwas the same or different between Tbx1 heterozygous and homozygous null mutant embryos. The bar graph depicts average count per section with error bars fromStudent’s t-test indicated.
Human Molecular Genetics, 2014, Vol. 23, No. 16 4225
at Yeshiva U
niv Libraries A
EC
OM
Cardozo Y
U on June 16, 2015
http://hmg.oxfordjournals.org/
Dow
nloaded from

crest mesenchymal gene patterns alone cannot account for lossof core mesoderm tissue, and likely Tbx1 has cell autonomousroles in the core mesodermal cells.
Genes acting downstream of Tbx1 in the core mesoderm
In addition to Tcf21, Msc, Myf5 and MyoD, several interestinggenes were altered when Tbx1 was inactivated that might alsoexplain resulting phenotypes. We identified two newly recog-nized core mesodermal genes, Chrdl1 and Lrrn1, which were
reduced in expression in Tbx12/2 embryos. Both are interestinggenes that have not been studied with respect to formation of themuscles of mastication. The Chrdl1 gene encodes a Bmp antag-onist that has many different developmental functions. Thehuman CHRDL1 gene maps to the X chromosome. Recently,mutations in CHRDL1 have been identified in humans causingX-linked megalocornea (MGC1; MIM#309300) (42). This isconsistent with its expression pattern in the developing eye(43). There is not a mouse knockout allele available for Chrdl1to further analyze the craniofacial muscles. However,
Figure 9. Mesodermal Tbx1 is required to form the muscles of mastication. (A) Transverse histological sections of Mesp1Cre/+; T-Cre; Tbx1flox/+ and Mesp1Cre/+;T-Cre; Tbx1flox/2 (MesoTbx1flox/+ or MesoTbx1flox/2) embryos at E17.5 stained with hematoxylin and eosin. Adipocytes have largely replaced muscles of mastication(right). The masseter muscle is present unilaterally, but hypoplastic, and a pterygoid muscle is present unilaterally (additional images are in the Supplementary Ma-terial, Fig. S3), but again, is severely hypoplastic.ma ¼ masseter. (B) Lateral views of whole-mount in situ hybridization of antisense probe for Tbx1 in MesoTbx1flox/+
and MesoTbx1flox/2 littermates at E9.5. Mesodermal expression of Tbx1 in heterozygous embryos is greatly reduced, but still present in conditional mutants. (C)Lateral views of whole-mount in situ hybridization of antisense probe for Myf5 in MesoTbx1flox/+ and MesoTbx1flox/2 littermates at E10.5. Enlarged pharyngealregion from in situ hybridization images are shown below whole embryo views. Arrow points to the Myf5 core mesoderm expression domain. Expression was dimin-ished in conditional null mutant embryos.
4226 Human Molecular Genetics, 2014, Vol. 23, No. 16
at Yeshiva U
niv Libraries A
EC
OM
Cardozo Y
U on June 16, 2015
http://hmg.oxfordjournals.org/
Dow
nloaded from

craniofacial muscle defects have not been reported in humanswith inactivating mutations. It is possible, based upon thehuman patient studies that Chrdl1 may not be essentialbecause other genes serve redundant functions. Chordin(Chrd) encodes another member of the gene family, but it isnot expressed in the core mesodermal tissue, implicating otherBmp antagonists as possibly serving redundant functions. TheGrem1 gene encodes a Bmp antagonist and we found by micro-array and qRT–PCR that it was reduced in expression inTbx12/2 embryos. Inactivation of Grem1 causes embryonic le-thality with kidney and skeletal defects (44). Grem1 is also im-portant for regulating myogenic progenitor cell proliferation inskeletal muscle (45). The gene was weakly expressed in themesoderm of PA1 in Tbx1+/+ as well as Tbx12/2 embryos(21), suggesting that it may not be greatly affected by the Tbx1mutation. More work would need to be performed to understandthe function of Chrdl1, Grem1 and other Bmp antagonists down-stream of Tbx1.
Lrrn1, encoding a transmembrane protein, was reduced in ex-pression at E9.5 in Tbx12/2 embryos. It has a specific expressionpattern in the telencephalon, core mesoderm and somites.Despite its intriguing expression pattern, Lrrn12/2 micesurvive to adulthood (46). This would indicate that it is not essen-tial for craniofacial muscle development. As for Chrdl1, Lrrn1might act redundantly with another gene(s). Relevant to this,there are three Lrrn family members in the mouse genome:Lrrn1, Lrrn2 and Lrrn3 (25), indicating that Lrrn2 or Lrrn3might act redundantly. Chick Lrrn2 is expressed in the secondpharyngeal arch (PA2) core mesoderm but not PA1 (47).Neither Lrrn2 nor Lrrn3 is expressed in PA1 in mouseembryos at similar stages (25). Other more distant familymembers exist, sharing leucine-rich repeats (LRRs) andimmunoglobulin-like (Ig) domains (48), suggesting thatperhaps some of these might act redundantly with Lrrn1.
The two additional genes of interest that were identified areTcf12 and Ash2l. Both proteins TCF12 and ASH2L separatelyinteract physically with myogenic regulatory factors, such asTCF21. The TCF12 protein, like the myogenic regulatoryfactors, is a bHLH E-box class of transcription factors, and assuch can heterodimerize. Specifically, TCF21 can physicallyinteract with TCF12 (49) implicating a possible molecular inter-action. Ash2l (absent, small or homeotic-like, Drosophila)encodes a transcription regulator with histone methyltransferaseactivity. MYF5 and ASH2L are present in a shared protein–protein complex within cultured primary mouse myoblasts(50). Of interest, ASH2L physically interacts with TBX1 as iden-tified using a yeast two hybrid screen (51). This suggests a pos-sible molecular connection between ASH2L, TBX1 and MYF5proteins. Another chromatin modifier, SETD7 (SET domaincontaining lysine methyltransferase 7), physically interactswith MYOD for myoblast differentiation (52) and separatelyinteracts with TBX1 (53). Ash21 and Setd7 genes identified aspart of the Tbx1 gene network in PA1 were not changed inmRNA expression in Tbx12/2 embryos at E9.5 (Fig. 2B), butwe may speculate that there are posttranslational modificationsthat alter protein–protein interactions.
One reason for loss of craniofacial muscle gene expressioncould be due to a change in cell fate, such as the cardiaclineage. This is because we found ectopic expression ofcardiac morphogenetic genes, such as GATA4, GATA5,
GATA6 and Tbx5. However, these genes are not expressed inthe core mesoderm, but are expressed in the caudal part of PA1in Tbx12/2 embryos. The data are more consistent with loss ofthe core mesodermal lineage, as determined by fate mappingstudies and apoptosis assays. Once precursors undergo apop-tosis, the branchiomeric muscles can no longer form.
Genes downstream of Tbx1 for pharyngeal development
There are other functions of Tbx1 in craniofacial developmentbesides forming the branchiomeric muscles. One importantfunction is to control formation of the aortic arch arteries andtheir remodeling to form the asymmetric aortic arch. Tbx1 isrequired for development and remodeling of the aortic arch arter-ies and mutant mice have similar defects as seen in 22q11DSpatients (19,36,54). Tbx1 was recently shown to act upstreamof the Gbx2 homeodomain transcription factor gene in the pha-ryngeal ectoderm and Gbx2 acts upstream of Slit and Robo sig-naling in the neural crest cells for development of pharyngealarch arteries 3, 4 and 6 (54). We found that Gbx2, Robo1 andSlit1 were reduced in expression in PA1 at E9.5 and/or E10.5,suggesting possible defects in PA1 artery formation.
There are other genes important for vascular developmentreduced in expression in Tbx12/2 embryos. The Foxc1 andFoxc2 as well as Cxcl12 genes were reduced in expression inPA1 at E9.5 and/or E10.5. The two Forkhead transcriptionfactor genes act redundantly upstream of CXCL12 ligand andits receptor CXCR4, and these proteins are required for chemo-taxic motility of endothelial cells to form blood vessels (55). Weobserved a change in pattern of Foxc1 expression and dimin-ished Foxc2 expression in the PA1 tissue in Tbx12/2 embryosat E10.5 coincident with microarray results. Neural crest cellsdo migrate into PA1 as determined by lineage tracing usingWnt1-Cre and a ROSA26-LacZ reporter gene in Tbx12/2
embryos and appear to be grossly normal (28). This work sug-gests that there is a change in cell fate rather than loss of tissue.
These genes may have roles in addition to that of vascular de-velopment. Specifically, knockout of Foxc2 in the mouse resultsin cleft palate along with malformed mandible, skull bones andabsent middle ear bones, similar to what is observed in Tbx12/2
embryos (31). Related to this, Sim2 was reduced in expression inTbx12/2 embryos at E10.5. Sim2 encodes a transcription factorexpressed in neural crest mesenchymal cells required forforming bones of the craniofacial region, including the palate(32). Based upon the in situ hybridization experiments presentedin this report, we cannot rule out partial expression of Sim2 innon-neural crest mesoderm; however, there are no obvious cra-niofacial muscle defects in Sim22/2 embryos (31). It is possiblethat altered Foxc2 and Sim2 expression in PA1 in Tbx12/2
embryos could contribute to the presence of a cleft palate andother craniofacial bone defects in later staged Tbx12/2
embryos. Similarly, changes in expression of these genesmight help understand the basis of defects in the proximal man-dible in PA1 in Tbx12/2 embryos (28). We previously found thatFgf8 and Bmp4 expression in the PA1 ectoderm at E10.5, as wellas some downstream effector genes, was shifted laterally. Wedid not detect significant changes in gene expression levels ofFgf8 and Bmp4 (28). Additional genes that were reduced in ex-pression that are expressed in neural crest mesenchymal cellsbut not yet linked to Tbx1 are Sox10, Six1 or Six2 (56–58). It
Human Molecular Genetics, 2014, Vol. 23, No. 16 4227
at Yeshiva U
niv Libraries A
EC
OM
Cardozo Y
U on June 16, 2015
http://hmg.oxfordjournals.org/
Dow
nloaded from

is possible that change in Fgf8 and Bmp4 expression patternscould be a cause or effect of changes in expression pattern ofthese genes.
Hypoxic stress in PA1 of Tbx12/2 embryos
The mechanism by which loss of Tbx1 results in increased apop-tosis is not known. Some clues for this are derived from gene pro-filing at E10.5, where we found increased expression of hypoxicstress response genes. One trivial possibility for this increase isthat PA1 cells undergo hypoxic stress secondary to vascular pro-blems when Tbx1 is inactivated (36,54). Tbx1 is expressed earlyin development, before E8.5, but yet apoptosis does not takeplace until E9.5-E10.0. Similarly, many stress response geneswere increased in expression by E10.5 but not at E9.5. This sug-gests that Tbx1 may act with other genes to promote cell survivaland stress in surrounding cells at these critical stages. Furtherstudies of novel and known genes altered in expression or func-tion between E9.5 and E10.5 should shed light on the relativehierarchy of stress response genes downstream of Tbx1.
SUMMARY
Our work demonstrates a key function of Tbx1 in the core meso-derm itself for maintenance of cells and when inactivated, resultsin loss of muscles of mastication. We developed a gene networkin which genes responsible for mesenchymal cell differentiationwere highlighted as those reduced in expression or downregu-lated in the absence of Tbx1. We found that genes for cellstress are increased by E10.5 at a time period when the coremesoderm cells have undergone apoptosis. This sets the stagefor future studies to identify direct transcriptional target genesand fully elucidate its role in myogenesis and or cell survival.
MATERIALS AND METHODS
Mouse mutants
The following mouse mutant alleles used in this study have beendescribed previously: Tbx1+/2 (20), RCEEGFP/+ (59), Tbx1flox/+
(39), Tbx1Cre/+ (60), (Mesp1Cre/+ (61) and T-Cre (62). Tbx1+/2
mice, used to obtain Tbx12/2 embryos, have been maintainedcongenic in the Swiss Webster background. To generateT-Cre; Mesp1Cre/+; Tbx1flox/2 embryos, T-Cre transgenic micewere crossed to Tbx1+/2 mice, on a mixed Swiss Webster back-ground, to obtain T-Cre; Tbx1+/2 mice, and these were thencrossed with Mesp1Cre/+mice to generate T-Cre; Mesp1Cre/+;Tbx1+/2 mice. These mice were then further crossed with theTbx1flox/flox mice in a Swiss Webster background. Wild-typeand T-Cre; Mesp1Cre/+; Tbx1flox/+ littermates were used as con-trols in relevant experiments. All other mouse strains used weremaintained in a mixed Swiss Webster background. PCR strat-egies for mouse genotyping have been described in the originalreports.
Histology
Mouse embryos were isolated in phosphate-buffered saline(PBS) and fixed in 10% neutral buffered formalin (Sigma) over-night. Following fixation, the embryos were dehydrated through
a graded ethanol series, embedded in paraffin and sectioned at5 mm. All sections were stained with hematoxylin and eosinusing standard protocols. Some of the work was performed inthe Einstein Histopathology Core Facility (http://www.einstein.yu.edu/histopathology/page.aspx).
RNA in situ hybridization
Whole-mount and tissue section RNA in situ hybridization withnon-radioactive probes was performed as previously described(63,64), using PCR-based probes (Supplementary Material,Table S3).
Gene profiling
To obtain enough RNA for microarray hybridization experi-ments, dissected mandibular arches from three Tbx1+/+ andthree Tbx12/2 E9.5 and E10.5 embryos were pooled accordingto genotype, with three microarrays performed at each stage,in total. The tissue was homogenized in Buffer RLT(QIAGEN). Total RNA was isolated with the RNeasy MicroKit according to the manufacturer’s protocol. Quality and quan-tity of total RNA were determined using an Agilent 2100 Bioa-nalyzer (Agilent) and an ND-1000 Spectrophotometer(NanoDrop), respectively. Biotinylated single-stranded cDNAtargets were amplified from 100 ng (ng) starting total RNAusing the Ovation RNA Amplification System V2 and FL-Ovation cDNA Biotin Module V2 (NuGEN). A total of3.75 mg of cDNA from the last step was hybridized to the Gen-eChip Test3 array (Affymetrix) to test the quality of thelabeled target. Nucleic acid samples that passed quality controlwere then hybridized to the Affymetrix Mouse GeneST 1.0(E9.5) or Affymetrix GeneChip Mouse Genome 430 2.0Arrays (E10.5). Hybridization, washing, staining and scanningwere performed in the Genomics Core at Einstein (http://www.einstein.yu.edu/genetics/CoreFacilities.aspx?id=23934)according to the Affymetrix manual. The microarray data havebeen uploaded to the GEO database (GSE30980 GSE35013).
Microarray statistical analysis for Affymetrix mouse geneST arrays
GeneChip data were analyzed with oligo and limma (LinearModels for Microarray Analysis), which are two librariespresent in the R package. Briefly, the original Affymetrix Gene-Chip CEL files generated by the Genomics Core were importedand summarized at the probe set level or at the transcript clusterlevel using the oligonucleotide library. Robust multi-arrayaverage (RMA) method was used to normalize, backgroundcorrect and summarize. The data were converted to logarithmicscale and the significance analysis was performed using thetwo-sample t-test with a cut-off of unadjusted P-value of,0.05. The statistical analysis was performed using theLimma package.
Pathway and network analysis
Genes with a nominal P-value of ,0.05 and a fold change of≥1.3 were considered to be differently expressed and used tofind associated and enriched biological processes and network
4228 Human Molecular Genetics, 2014, Vol. 23, No. 16
at Yeshiva U
niv Libraries A
EC
OM
Cardozo Y
U on June 16, 2015
http://hmg.oxfordjournals.org/
Dow
nloaded from

pathways using IPA and Genemania (http://www.ncbi.nlm.nih.gov/pubmed/20576703) for gene pathway groups shown inFigs 2C and 5.
Quantitative reverse transcriptase–polymerase chainreaction
To obtain enough total RNA and minimize the variability of geneexpression in individual embryos, each tube contained microdis-sected PA1s at E10.5 from four embryos. Total RNA was isolatedfrom dissected tissues from three independent biological repli-cates using the RNeasy Micro Kit (Qiagen) and analyzed forsample purity and integrity using BioAnalyzer instrumentation.The mRNA levels were measured by TaqMan Gene ExpressionAssays (Applied Biosystems) for each gene and were carriedout in triplicate using Ipo8 for the E9.5 and Gapdh for the E10.5studies as normalization controls. TaqMan probes and primersets were obtained from the Applied Biosystems’ Gene Expres-sion Assay database (http://allgenes.com). Samples were run in96-well plates (10 ml final volume per reaction) on an ABI7900HT Q-PCR apparatus. The sodium dodecyl sulfate 2.2 soft-ware platform (Applied Biosystems) was used for the computerinterface with the ABI 7900HT PCR System to generate normal-ized data, compare samples and calculate the relative quantity.Statistical significance of the difference in gene expression wasestimated using the two-tailed t-test.
Proliferation and apoptosis on tissue sections
After fixation as described for whole-mount direct fluorescenceand embryo freezing, frozen sections were obtained at a thick-ness of 10 mm and then permeabilized in 0.5% Triton X-100for 5 min. Blocking was performed with 5% serum (goat ordonkey) in PBS/0.1% Triton X-100 (PBT) for 1 h. Primary anti-body was diluted in blocking solution (1:500) and incubated for1 h. Proliferation of cells was assessed by immunofluorescenceusing the primary antibody anti-phospho Histone H3 (Ser10),a mitosis marker (06–570 Millipore). Sections were washed inPBT and incubated with secondary antibody for 1 h. Secondaryantibody was Alexa Fluor 568 goat a-rabbit IgG (A11011 Invi-trogen) at 1:500. Slides were mounted in hard-set mountingmedium with DAPI (Vector Labs H-1500). Images were cap-tured using a Zeiss Axio Observer microscope. To perform stat-istical analysis of cell proliferation, we first calculated theaverage cell counts per tissue section for each embryo. Then,we estimated the mean and standard error of the average cellcounts for control and mutant groups and compared themusing the t-test. Apoptosis was assessed on frozen 10 mm thicksections by using DeadEnd Fluorometric TUNEL System(G3250 Promega) following the manufacturer’s instructions.Natural GFP from the reporter or antibodies to GFP was usedto distinguish the core mesodermal cells in both assays describedabove.
SUPPLEMENTARY MATERIAL
Supplementary Material is available at HMG online.
ACKNOWLEDGEMENTS
We thank the Department of Surgery at Montefiore MedicalCenter for providing salary support for Dr Carpenter. Wethank Dr Antonio Baldini for the Tbx1Cre mice. We thank DrMark Lewandoski for the T-Cre mice. We thank NousinHaque and Harpreet Singh for their technical help. We acknow-ledge the Einstein Histopathology Core for embedding embryosand the Genomics Core for performing the gene expression pro-filing.
Conflict of Interest statement. None declared.
FUNDING
This work was supported by grants from the National Institutesof Health (R01HL088698 and P01HD070454, B.E.M.).
REFERENCES
1. Bryson-Richardson, R.J. and Currie, P.D. (2008) The genetics of vertebratemyogenesis. Nat. Rev. Genet., 9, 632–646.
2. Shprintzen, R.J. (2008) Velo-cardio-facial syndrome: 30 years of study. Dev.Dis. Res. Rev., 14, 3–10.
3. Shprintzen, R.J. and Marrinan, E. (2009) Velopharyngeal insufficiency:diagnosis and management. Curr. Opin. Otolaryngol. Head Neck Surg., 17,302–307.
4. Zim, S., Schelper, R., Kellman, R., Tatum, S., Ploutz-Snyder, R. andShprintzen, R. (2003) Thickness and histologic and histochemical propertiesof the superior pharyngeal constrictor muscle in velocardiofacial syndrome.Arch. Facial Plast. Surg., 5, 503–510.
5. Lypka, M., Bidros, R., Rizvi, M., Gaon, M., Rubenstein, A., Fox, D. andCronin, E. (2010) Posterior pharyngeal augmentation in the treatment ofvelopharyngeal insufficiency: a 40-year experience. Ann. Plast. Surg., 65,48–51.
6. Akcakus, M., Ozkul, Y., Gunes, T., Kurtoglu, S., Cetin, N., Kisaarslan, A.P.and Dundar, M. (2003) Associated anomalies in asymmetric crying faciesand 22q11 deletion. Genet. Couns., 14, 325–330.
7. Noden, D.M. (1983) The embryonic origins of avian cephalic and cervicalmuscles and associated connective tissues. Am. J. Anat., 168, 257–276.
8. Trainor, P.A., Tan, S.S. and Tam, P.P. (1994) Cranial paraxial mesoderm:regionalisation of cell fate and impact on craniofacial development in mouseembryos. Development, 120, 2397–2408.
9. Lu, J., Webb, R., Richardson, J.A. and Olson, E.N. (1999) MyoR: amuscle-restricted basic helix-loop-helix transcription factor thatantagonizes the actions of MyoD. Proc. Natl. Acad. Sci. USA., 96, 552–557.
10. Moncaut, N., Cross, J.W., Siligan, C., Keith, A., Taylor, K., Rigby, P.W. andCarvajal, J.J. (2012) Musculin and TCF21 coordinate the maintenance ofmyogenic regulatory factor expression levels during mouse craniofacialdevelopment. Development, 139, 958–967.
11. Semina, E.V., Reiter, R., Leysens, N.J., Alward, W.L., Small, K.W., Datson,N.A., Siegel-Bartelt, J., Bierke-Nelson, D., Bitoun, P., Zabel, B.U. et al.(1996) Cloning and characterization of a novel bicoid-related homeoboxtranscription factor gene, RIEG, involved in Rieger syndrome. Nat. Genet.,14, 392–399.
12. Kioussi, C., Briata, P., Baek, S.H., Wynshaw-Boris, A., Rose, D.W. andRosenfeld, M.G. (2002) Pitx genes during cardiovascular development.Cold Spring Harb. Symp. Quant. Biol., 67, 81–87.
13. Ai, D., Liu, W., Ma, L., Dong, F., Lu, M.-F., Wang, D., Verzi, M.P., Cai, C.,Gage, P.J., Evans, S. et al. (2006) Pitx2 regulates cardiac left-rightasymmetry by patterning second cardiac lineage-derived myocardium. Dev.Biol., 296, 437–449.
14. Dong, F., Sun, X., Liu, W., Ai, D., Klysik, E., Lu, M.F.,Hadley, J., Antoni,L.,Chen, L., Baldini, A. et al. (2006) Pitx2 promotes development of splanchnicmesoderm-derived branchiomeric muscle. Development, 133, 4891–4899.
15. Shih, H.P., Gross, M.K. and Kioussi, C. (2007) Cranial muscle defects ofPitx2 mutants result from specification defects in the first branchial arch.Proc. Natl. Acad. Sci. USA., 104, 5907–5912.
Human Molecular Genetics, 2014, Vol. 23, No. 16 4229
at Yeshiva U
niv Libraries A
EC
OM
Cardozo Y
U on June 16, 2015
http://hmg.oxfordjournals.org/
Dow
nloaded from

16. Nathan, E., Monovich, A., Tirosh-Finkel, L., Harrelson, Z., Rousso, T.,Rinon, A., Harel, I., Evans, S.M. and Tzahor, E. (2008) The contribution ofIslet1-expressing splanchnic mesoderm cells to distinct branchiomericmuscles reveals significant heterogeneity in head muscle development.Development, 135, 647–657.
17. Harel, I., Maezawa, Y., Avraham, R., Rinon, A., Ma, H.Y., Cross, J.W.,Leviatan, N., Hegesh, J., Roy, A., Jacob-Hirsch, J. et al. (2012) Pharyngealmesoderm regulatory network controls cardiac and head musclemorphogenesis. Proc. Natl. Acad. Sci. USA., 109, 18839–18844.
18. Jerome, L.A. and Papaioannou, V.E. (2001) DiGeorge syndrome phenotypein mice mutant for the T-box gene, Tbx1. Nat. Genet., 27, 286–291.
19. Lindsay, E.A., Vitelli, F., Su, H., Morishima, M., Huynh, T., Pramparo, T.,Jurecic, V., Ogunrinu, G., Sutherland, H.F., Scambler, P.J. et al. (2001) Tbx1haploinsufficieny in the DiGeorge syndrome region causes aortic archdefects in mice. Nature, 410, 97–9101.
20. Merscher, S., Funke, B., Epstein, J.A., Heyer, J., Puech, A., Lu, M.M.,Xavier, R.J., Demay, M.B., Russell, R.G., Factor, S. et al. (2001) TBX1 isresponsible for cardiovascular defects in velo-cardio-facial/DiGeorgesyndrome. Cell, 104, 619–629.
21. Kelly, R.G., Jerome-Majewska, L.A. and Papaioannou, V.E. (2004) Thedel22q11.2 candidate gene Tbx1 regulates branchiomeric myogenesis.Hum. Mol. Genet., 13, 2829–2840.
22. Grifone, R., Jarry, T., Dandonneau, M., Grenier, J., Duprez, D. and Kelly,R.G. (2008) Properties of branchiomeric and somite-derived muscledevelopment in Tbx1 mutant embryos. Dev. Dyn., 237, 3071–3078.
23. Dastjerdi, A., Robson, L., Walker, R., Hadley, J., Zhang, Z.,Rodriguez-Niedenfuhr, M., Ataliotis, P., Baldini, A., Scambler, P. andFrancis-West, P. (2007) Tbx1 regulation of myogenic differentiation in thelimb and cranial mesoderm. Dev. Dyn., 236, 353–363.
24. Liao, J., Kochilas, L., Nowotschin, S., Arnold, J.S., Aggarwal, V.S., Epstein,J.A., Brown, M.C., Adams, J. and Morrow, B.E. (2004) Full spectrum ofmalformations in velo-cardio-facial syndrome/DiGeorge syndrome mousemodels by altering Tbx1 dosage. Hum. Mol. Genet., 13, 1577–1585.
25. Haines, B.P., Gupta, R., Jones, C.M., Summerbell, D. and Rigby, P.W.(2005) The NLRR gene family and mouse development: Modifieddifferential display PCR identifies NLRR-1 as a gene expressed in earlysomitic myoblasts. Dev. Biol., 281, 145–159.
26. Seale, P., Ishibashi, J., Holterman, C. and Rudnicki, M.A. (2004) Musclesatellite cell-specific genes identified by genetic profiling of MyoD-deficientmyogenic cell. Dev. Biol., 275, 287–300.
27. Coffinier, C., Tran, U., Larrain, J. and De Robertis, E.M. (2001) Neuralin-1 isa novel Chordin-related molecule expressed in the mouse neural plate. Mech.
Dev., 100, 119–122.28. Aggarwal, V.S., Carpenter, C., Freyer, L., Liao, J., Petti, M. and Morrow,
B.E. (2010) Mesodermal Tbx1 is required for patterning the proximalmandible in mice. Dev. Biol., 344, 669–681.
29. Mussig, K., Staiger, H., Machicao, F., Thamer, C., Machann, J., Schick, F.,Claussen, C.D., Stefan, N., Fritsche, A. and Haring, H.U. (2009) RARRES2,encoding the novel adipokine chemerin, is a genetic determinant ofdisproportionate regional body fat distribution: a comparative magneticresonance imaging study. Metabolism, 58, 519–524.
30. Aggarwal, V.S., Liao, J., Bondarev, A., Schimmang, T., Lewandoski, M.,Locker, J., Shanske, A., Campione, M. and Morrow, B.E. (2006) Dissectionof Tbx1 and Fgf interactions in mouse models of 22q11DS suggestsfunctional redundancy. Hum. Mol. Genet., 15, 3219–3228.
31. Kume, T., Jiang, H., Topczewska, J.M. and Hogan, B.L. (2001) The murinewinged helix transcription factors, Foxc1 and Foxc2, are both required forcardiovascular development and somitogenesis. Genes Dev., 15, 2470–2482.
32. Shamblott, M.J., Bugg, E.M., Lawler, A.M. and Gearhart, J.D. (2002)Craniofacial abnormalities resulting from targeted disruption of the murineSim2 gene. Dev. Dyn., 224, 373–380.
33. Liao, J., Aggarwal, V.S., Nowotschin, S., Bondarev, A., Lipner, S. andMorrow, B.E. (2008) Identification of downstream genetic pathways ofTbx1 in the second heart field. Dev. Biol., 316, 524–537.
34. Ozawa, S., Ito, S., Kato, Y., Kubota, E. and Hata, R. (2010) Human p38 deltaMAP kinase mediates UV irradiation induced up-regulation of the geneexpression of chemokine BRAK/CXCL14. Biochem. Biophys. Res.Commun., 396, 1060–1064.
35. Shakib, K., Norman, J.T., Fine, L.G., Brown, L.R. andGodovac-Zimmermann, J. (2005) Proteomics profiling of nuclear proteinsfor kidney fibroblasts suggests hypoxia, meiosis, and cancer may meet in thenucleus. Proteomics, 5, 2819–2838.
36. Zhang, Z., Cerrato, F., Xu, H., Vitelli, F., Morishima, M., Vincentz, J.,Furuta, Y., Ma, L., Martin, J.F., Baldini, A. et al. (2005) Tbx1 expression inpharyngeal epithelia is necessary for pharyngeal arch artery development.Development, 132, 5307–5315.
37. Balmer, J.E. and Blomhoff, R. (2002) Gene expression regulation by retinoicacid. J. Lip. Res., 43, 1773–1808.
38. Zhang, Z., Huynh, T. and Baldini, A. (2006) Mesodermal expression of Tbx1is necessary and sufficient for pharyngeal arch and cardiac outflow tractdevelopment. Development, 133, 3587–3595.
39. Arnold, J.S., Werling, U., Braunstein, E.M., Liao, J., Nowotschin, S.,Edelmann, W., Hebert, J.M. and Morrow, B.E. (2006) Inactivation of Tbx1in the pharyngeal endoderm results in 22q11DS malformations.Development, 133, 977–987.
40. Sambasivan, R., Gayraud-Morel, B., Dumas, G., Cimper, C., Paisant, S.,Kelly, R.G. and Tajbakhsh, S. (2009) Distinct regulatory cascades governextraocular and pharyngeal arch muscle progenitor cell fates. Dev. Cell, 16,810–821.
41. Lu, J.R., Bassel-Duby, R., Hawkins, A., Chang, P., Valdez, R., Wu, H., Gan,L., Shelton, J.M., Richardson, J.A. and Olson, E.N. (2002) Control of facialmuscle development by MyoR and capsulin. Science, 298, 2378–2381.
42. Webb, T.R., Matarin, M., Gardner, J.C., Kelberman, D., Hassan, H., Ang,W., Michaelides, M., Ruddle, J.B., Pennell, C.E., Yazar, S. et al. (2012)X-linked megalocornea caused by mutations in CHRDL1 identifies anessential role for ventroptin in anterior segment development. Am. J. Hum.Genet., 90, 247–259.
43. Sakuta, H., Suzuki, R., Takahashi, H., Kato, A., Shintani, T., Iemura, S.,Yamamoto, T.S., Ueno, N. and Noda, M. (2001) Ventroptin: a BMP-4antagonist expressed in a double-gradient pattern in the retina. Science, 293,111–115.
44. Michos, O., Panman, L., Vintersten, K., Beier, K., Zeller, R. and Zuniga, A.(2004) Gremlin-mediated BMP antagonism induces theepithelial-mesenchymal feedback signaling controlling metanephric kidneyand limb organogenesis. Development, 131, 3401–3410.
45. Frank, N.Y., Kho, A.T., Schatton, T., Murphy, G.F., Molloy, M.J., Zhan, Q.,Ramoni, M.F., Frank, M.H., Kohane, I.S. and Gussoni, E. (2006) Regulationof myogenic progenitor proliferation in human fetal skeletal muscle byBMP4 and its antagonist Gremlin. J. Cell Biol., 175, 99–110.
46. Tang, T., Li, L., Tang, J., Li, Y., Lin, W.Y., Martin, F., Grant, D., Solloway,M., Parker, L., Ye, W. et al. (2010) A mouse knockout library for secretedand transmembrane proteins. Nat. Biotech., 28, 749–755.
47. Andreae, L.C., Lumsden, A. and Gilthorpe, J.D. (2009) Chick Lrrn2, a noveldownstream effector of Hoxb1 and Shh, functions in the selective targetingof rhombomere 4 motor neurons. Neural Dev., 4, 27.
48. Homma, S., Shimada, T., Hikake, T. and Yaginuma, H. (2009) Expressionpattern of LRR and Ig domain-containing protein (LRRIG protein) in theearly mouse embryo. Gene Exp. Pattn., 9, 1–26.
49. Tandon, P., Miteva, Y.V., Kuchenbrod, L.M., Cristea, I.M. and Conlon, F.L.(2013) Tcf21 regulates the specification and maturation of proepicardialcells. Development, 140, 2409–2421.
50. McKinnell, I.W., Ishibashi, J., Le Grand, F., Punch, V.G., Addicks, G.C.,Greenblatt, J.F., Dilworth, F.J. and Rudnicki, M.A. (2008) Pax7 activatesmyogenic genes by recruitment of a histone methyltransferase complex. Nat.Cell Biol., 10, 77–84.
51. Stoller, J.Z., Huang, L., Tan, C.C., Huang, F., Zhou, D.D., Yang, J., Gelb,B.D. and Epstein, J.A. (2010) Ash2l interacts with Tbx1 and is requiredduring early embryogenesis. Exp. Biol. Med. (Maywood), 235, 569–576.
52. Tao, Y., Neppl, R.L., Huang, Z.P., Chen, J., Tang, R.H., Cao, R., Zhang, Y.,Jin, S.W. and Wang, D.Z. (2011) The histone methyltransferase Set7/9promotes myoblast differentiation and myofibril assembly. J. Cell Biol., 194,551–565.
53. Chen, L., Fulcoli, F.G., Ferrentino, R., Martucciello, S., Illingworth, E.A.and Baldini, A. (2012) Transcriptional control in cardiac progenitors: Tbx1interacts with the BAF chromatin remodeling complex and regulates Wnt5a.PLoS Genet., 8, e1002571.
54. Calmont, A., Ivins, S., Van Bueren, K.L., Papangeli, I., Kyriakopoulou, V.,Andrews, W.D., Martin, J.F., Moon, A.M., Illingworth, E.A., Basson, M.A.et al. (2009) Tbx1 controls cardiac neural crest cell migration during archartery development by regulating Gbx2 expression in the pharyngealectoderm. Development, 136, 3173–3183.
55. Hayashi, H. and Kume, T. (2008) Forkhead transcription factors regulateexpression of the chemokine receptor CXCR4 in endothelial cells andCXCL12-induced cell migration. Biochem. Biophys. Res. Commun., 367,584–589.
4230 Human Molecular Genetics, 2014, Vol. 23, No. 16
at Yeshiva U
niv Libraries A
EC
OM
Cardozo Y
U on June 16, 2015
http://hmg.oxfordjournals.org/
Dow
nloaded from

56. Kutejova, E., Engist, B., Mallo, M., Kanzler, B. and Bobola, N. (2005)Hoxa2 downregulates Six2 in the neural crest-derived mesenchyme.Development, 132, 469–478.
57. Gavalas, A., Trainor, P., Ariza-McNaughton, L. and Krumlauf, R. (2001)Synergy between Hoxa1 and Hoxb1: the relationship between archpatterning and the generation of cranial neural crest. Development, 128,3017–3027.
58. Oliver, G., Wehr, R., Jenkins, N.A., Copeland, N.G., Cheyette, B.N.,Hartenstein, V., Zipursky, S.L. and Gruss, P. (1995) Homeobox genes andconnective tissue patterning. Development, 121, 693–705.
59. Sousa, V.H., Miyoshi, G., Hjerling-Leffler, J., Karayannis, T. and Fishell, G.(2009) Characterization of Nkx6–2-derived neocortical interneuronlineages. Cere. Cortex, 19(Suppl 1), 1–10.
60. Vitelli, F., Huynh, T. and Baldini, A. (2009) Gain of function of Tbx1 affectspharyngeal and heart development in the mouse. Genesis, 47, 188–195.
61. Saga, Y., Miyagawa-Tomita, S., Takagi, A., Kitajima, S., Miyazaki, J. andInoue, T. (1999) MesP1 is expressed in the heart precursor cells andrequired for the formation of a single heart tube. Development, 126,3437–3447.
62. Perantoni, A.O., Timofeeva, O., Naillat, F., Richman, C., Pajni-Underwood,S., Wilson, C., Vainio, S., Dove, L.F. and Lewandoski, M. (2005)Inactivation of FGF8 in early mesoderm reveals an essential role in kidneydevelopment. Development, 132, 3859–3871.
63. Hidai, H., Bardales, R., Goodwin, R., Quertermous, T. and Quertermous,E.E. (1998) Cloning of capsulin, a basic helix-loop-helix factor expressed inprogenitor cells of the pericardium and the coronary arteries. Mech. Dev., 73,33–43.
64. Alappat, S.R., Zhang, Z., Suzuki, K., Zhang, X., Liu, H., Jiang, R., Yamada,G. and Chen, Y. (2005) The cellular and molecular etiology of the cleftsecondary palate in Fgf10 mutant mice. Dev. Biol., 277, 102–113.
Human Molecular Genetics, 2014, Vol. 23, No. 16 4231
at Yeshiva U
niv Libraries A
EC
OM
Cardozo Y
U on June 16, 2015
http://hmg.oxfordjournals.org/
Dow
nloaded from