Mesoderm-specific transcript is associated with fat mass expansion in response to a positive energy...
13
The FASEB Journal • Research Communication Mesoderm-specific transcript is associated with fat mass expansion in response to a positive energy balance Larissa Nikonova,* Robert A. Koza,* Tamra Mendoza,* Pei-Min Chao,* James P. Curley, † and Leslie P. Kozak* ,1 *Pennington Biomedical Research Center, Baton Rouge, Louisiana, USA; and † Darwin College, University of Cambridge, Madingley, UK ABSTRACT A 50-fold variation in mRNA and protein levels of the mesoderm-specific transcript gene (Mest) in white fat of C57BL/6J (B6) mice fed an obesogenic diet is positively correlated with expansion of fat mass. MEST protein was detected only in adipocytes, in which its induction occurred with both unsaturated and satu- rated dietary fat. To test the hypothesis that MEST modulates fat mass expansion, its expression was com- pared to that of stearoyl CoA desaturase (Scd1) in B6 mice exposed to diets and environmental temperatures that generated conditions separating the effects of food intake and adiposity. Under a range of conditions, Mest expression was always associated with variations in adiposity, whereas Scd1 expression was associated with the amount of saturated fat in the diet. Mest mRNA was expressed at its highest levels during early postnatal growth at the onset of the most rapid phase of fat mass expansion. MEST is localized to the endoplasmic retic- ulum/Golgi apparatus where its putative enzymatic properties as a lipase or acyltransferase, predicted from sequence homology with members of the / fold hydrolase superfamily, can enable it to function in lipid accumulation under conditions of positive energy balance. Variations in adiposity and Mest expression in genetically identical mice also provides a model of epigenetic regulation.—Nikonova, L., Koza, R. A., Men- doza, T., Chao, P.-M., Curley, J. P., Kozak, L. P. Mesoderm-specific transcript is associated with fat mass expansion in response to a positive energy balance. FASEB J. 22, 000 – 000 (2008) Key Words: nutritional programming epigenetics / fold hydrolase imprinted genes obesity Variability in diet-induced obesity among geneti- cally identical C57BL/6J (B6) mice has characteristics suggesting that the phenotypic differences are deter- mined by an underlying epigenetic mechanism (1– 4). Not only is adiposity highly variable, but so is the expression of genes in adipose tissue for which plausi- ble roles in the regulation of adiposity have been proposed (3). These genes include secreted frizzled related protein 5 (Sfrp5), an inhibitor of Wnt signaling whose other family members (i.e., Sfrp2) have been shown to repress the Wnt signaling pathway and permit the entrance of preadipocytes into the adipogenic pathway (5, 6); bone morphogenetic protein 3 (Bmp3), which represses bone formation when inactivated (7); and plasminogen activator inhibitor (Serpine1), with potential involvement in increasing the vasculature required for adipose tissue expansion (8). In contrast to these genes, the well-known transcription factors of adipogenesis are essentially invariant, as are other biomarkers of adipocytes, including enzymes of lipo- genesis (3). However, the most variable expression, with mRNA levels ranging over 50-fold in adipose tissue, is found for the gene encoding mesoderm- specific transcript (Mest). In B6 mice with variable diet-induced obesity, Mest expression is positively cor- related with both adiposity and genes of Wnt and Bmp3 signaling. Mest has also been reported in other studies to be overexpressed in adipose tissue from obese mice (9). Transgenic mice in which Mest is overexpressed from the aP2 promoter show enlarged adipocytes; however, no increase in obesity was observed (10). Mice with gene-targeted inactivation of Mest exhibit growth retar- dation and behavioral defects, but no effects on adipos- ity were noted (11). These phenotypes of Mest knock- out mice, together with the fact that Mest is an imprinted paternally expressed gene (12, 13), suggest that Mest has an important role in development; how- ever, its function in adipose tissue expansion is unclear. Although its enzymatic/biochemical function has not been established, MEST is a member of a / fold hydrolase superfamily, whose members also include lipases, acyltransferases, and esterases (14, 15). MEST has the highly conserved catalytic triad, serine 145- histidine 146-aspartate 147, within the conserved se- quence motif for lipases and serine proteases (acces- sion number NP_032616); thus, it is possible that MEST has a role in lipid metabolism, even though its specific enzymatic activity has not yet been identified. Our previous data showing that expression of Mest in fat biopsies correlated with increased adiposity, even before mice were switched to a high-fat diet, has led to 1 Correspondence: Pennington Biomedical Research Cen- ter, 6400 Perkins Rd., Baton Rouge, LA 70808, USA. E-mail: [email protected] doi: 10.1096/fj.08-108266 1 0892-6638/08/0022-0001 © FASEB The FASEB Journal article fj.08-108266. Published online July 21, 2008.
Transcript of Mesoderm-specific transcript is associated with fat mass expansion in response to a positive energy...
The FASEB Journal • Research Communication
Mesoderm-specific transcript is associated with fat massexpansion in response to a positive energy balance
Larissa Nikonova,* Robert A. Koza,* Tamra Mendoza,* Pei-Min Chao,*James P. Curley,† and Leslie P. Kozak*,1
*Pennington Biomedical Research Center, Baton Rouge, Louisiana, USA; and †Darwin College,University of Cambridge, Madingley, UK
ABSTRACT A 50-fold variation in mRNA and proteinlevels of the mesoderm-specific transcript gene (Mest)in white fat of C57BL/6J (B6) mice fed an obesogenicdiet is positively correlated with expansion of fat mass.MEST protein was detected only in adipocytes, in whichits induction occurred with both unsaturated and satu-rated dietary fat. To test the hypothesis that MESTmodulates fat mass expansion, its expression was com-pared to that of stearoyl CoA desaturase (Scd1) in B6mice exposed to diets and environmental temperaturesthat generated conditions separating the effects offood intake and adiposity. Under a range of conditions,Mest expression was always associated with variations inadiposity, whereas Scd1 expression was associated withthe amount of saturated fat in the diet. Mest mRNA wasexpressed at its highest levels during early postnatalgrowth at the onset of the most rapid phase of fat massexpansion. MEST is localized to the endoplasmic retic-ulum/Golgi apparatus where its putative enzymaticproperties as a lipase or acyltransferase, predictedfrom sequence homology with members of the �/�fold hydrolase superfamily, can enable it to function inlipid accumulation under conditions of positive energybalance. Variations in adiposity and Mest expression ingenetically identical mice also provides a model ofepigenetic regulation.—Nikonova, L., Koza, R. A., Men-doza, T., Chao, P.-M., Curley, J. P., Kozak, L. P.Mesoderm-specific transcript is associated with fat massexpansion in response to a positive energy balance.FASEB J. 22, 000–000 (2008)
Key Words: nutritional programming � epigenetics � �/� foldhydrolase � imprinted genes � obesity
Variability in diet-induced obesity among geneti-cally identical C57BL/6J (B6) mice has characteristicssuggesting that the phenotypic differences are deter-mined by an underlying epigenetic mechanism (1–4).Not only is adiposity highly variable, but so is theexpression of genes in adipose tissue for which plausi-ble roles in the regulation of adiposity have beenproposed (3). These genes include secreted frizzledrelated protein 5 (Sfrp5), an inhibitor of Wnt signalingwhose other family members (i.e., Sfrp2) have beenshown to repress the Wnt signaling pathway and permit
the entrance of preadipocytes into the adipogenicpathway (5, 6); bone morphogenetic protein 3 (Bmp3),which represses bone formation when inactivated (7);and plasminogen activator inhibitor (Serpine1), withpotential involvement in increasing the vasculaturerequired for adipose tissue expansion (8). In contrastto these genes, the well-known transcription factors ofadipogenesis are essentially invariant, as are otherbiomarkers of adipocytes, including enzymes of lipo-genesis (3). However, the most variable expression,with mRNA levels ranging over 50-fold in adiposetissue, is found for the gene encoding mesoderm-specific transcript (Mest). In B6 mice with variablediet-induced obesity, Mest expression is positively cor-related with both adiposity and genes of Wnt and Bmp3signaling.
Mest has also been reported in other studies to beoverexpressed in adipose tissue from obese mice (9).Transgenic mice in which Mest is overexpressed fromthe aP2 promoter show enlarged adipocytes; however,no increase in obesity was observed (10). Mice withgene-targeted inactivation of Mest exhibit growth retar-dation and behavioral defects, but no effects on adipos-ity were noted (11). These phenotypes of Mest knock-out mice, together with the fact that Mest is animprinted paternally expressed gene (12, 13), suggestthat Mest has an important role in development; how-ever, its function in adipose tissue expansion is unclear.Although its enzymatic/biochemical function has notbeen established, MEST is a member of a �/� foldhydrolase superfamily, whose members also includelipases, acyltransferases, and esterases (14, 15). MESThas the highly conserved catalytic triad, serine 145-histidine 146-aspartate 147, within the conserved se-quence motif for lipases and serine proteases (acces-sion number NP_032616); thus, it is possible that MESThas a role in lipid metabolism, even though its specificenzymatic activity has not yet been identified.
Our previous data showing that expression of Mest infat biopsies correlated with increased adiposity, evenbefore mice were switched to a high-fat diet, has led to
1 Correspondence: Pennington Biomedical Research Cen-ter, 6400 Perkins Rd., Baton Rouge, LA 70808, USA. E-mail:[email protected]
doi: 10.1096/fj.08-108266
10892-6638/08/0022-0001 © FASEB
The FASEB Journal article fj.08-108266. Published online July 21, 2008.
the hypothesis that Mest plays an essential role in theexpansion of adipose tissue during positive energybalance. The alternative hypothesis is that Mest is regu-lated by dietary fat. To test these hypotheses, we havedissociated changes in adipose tissue expansion fromdietary input by manipulating diet and environmentaltemperature in B6 wild-type mice. Additional tests ofthe hypotheses were made through the analyses of Mestand stearoyl CoA desaturase (Scd1) knockout models.These experiments have led to a model for adiposetissue expansion in mice with a positive energy balancewhereby MEST, located in the endoplasmic reticulum(ER), facilitates the uptake of lipid from the circulationthrough its enzymatic function on lipid metabolismand/or accumulation.
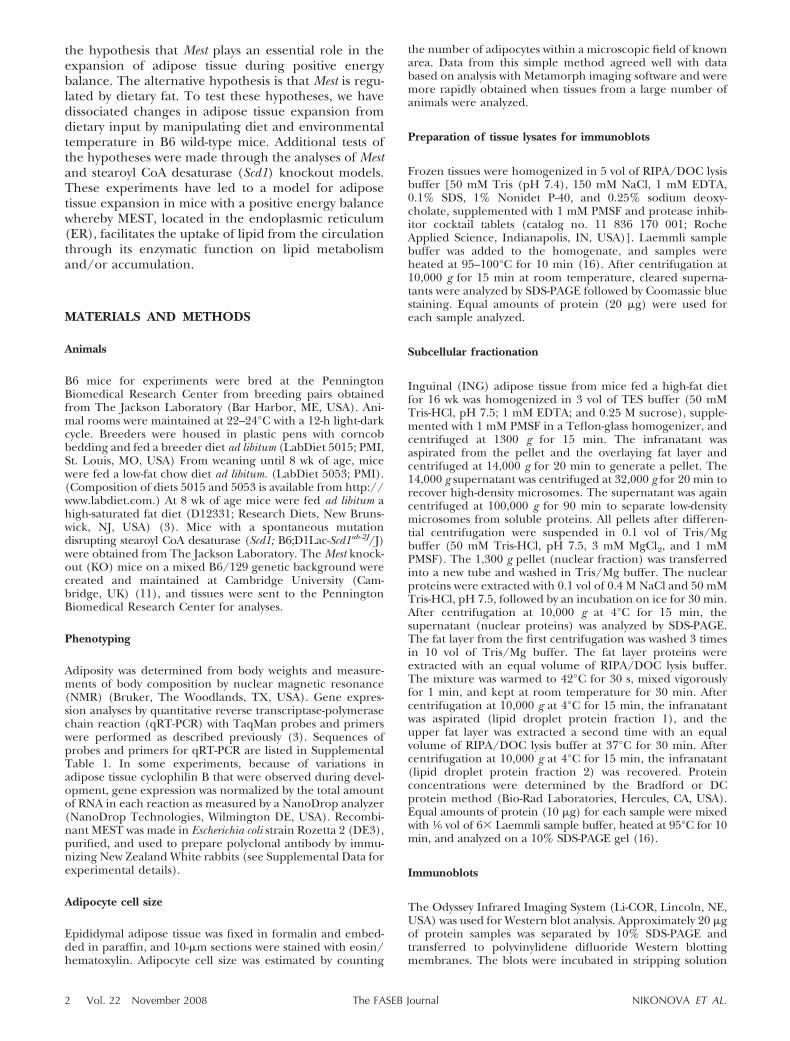
MATERIALS AND METHODS
Animals
B6 mice for experiments were bred at the PenningtonBiomedical Research Center from breeding pairs obtainedfrom The Jackson Laboratory (Bar Harbor, ME, USA). Ani-mal rooms were maintained at 22–24°C with a 12-h light-darkcycle. Breeders were housed in plastic pens with corncobbedding and fed a breeder diet ad libitum (LabDiet 5015; PMI,St. Louis, MO, USA) From weaning until 8 wk of age, micewere fed a low-fat chow diet ad libitum. (LabDiet 5053; PMI).(Composition of diets 5015 and 5053 is available from http://www.labdiet.com.) At 8 wk of age mice were fed ad libitum ahigh-saturated fat diet (D12331; Research Diets, New Bruns-wick, NJ, USA) (3). Mice with a spontaneous mutationdisrupting stearoyl CoA desaturase (Scd1; B6;D1Lac-Scd1ab-2J/J)were obtained from The Jackson Laboratory. The Mest knock-out (KO) mice on a mixed B6/129 genetic background werecreated and maintained at Cambridge University (Cam-bridge, UK) (11), and tissues were sent to the PenningtonBiomedical Research Center for analyses.
Phenotyping
Adiposity was determined from body weights and measure-ments of body composition by nuclear magnetic resonance(NMR) (Bruker, The Woodlands, TX, USA). Gene expres-sion analyses by quantitative reverse transcriptase-polymerasechain reaction (qRT-PCR) with TaqMan probes and primerswere performed as described previously (3). Sequences ofprobes and primers for qRT-PCR are listed in SupplementalTable 1. In some experiments, because of variations inadipose tissue cyclophilin B that were observed during devel-opment, gene expression was normalized by the total amountof RNA in each reaction as measured by a NanoDrop analyzer(NanoDrop Technologies, Wilmington DE, USA). Recombi-nant MEST was made in Escherichia coli strain Rozetta 2 (DE3),purified, and used to prepare polyclonal antibody by immu-nizing New Zealand White rabbits (see Supplemental Data forexperimental details).
Adipocyte cell size
Epididymal adipose tissue was fixed in formalin and embed-ded in paraffin, and 10-�m sections were stained with eosin/hematoxylin. Adipocyte cell size was estimated by counting
the number of adipocytes within a microscopic field of knownarea. Data from this simple method agreed well with databased on analysis with Metamorph imaging software and weremore rapidly obtained when tissues from a large number ofanimals were analyzed.
Preparation of tissue lysates for immunoblots
Frozen tissues were homogenized in 5 vol of RIPA/DOC lysisbuffer [50 mM Tris (pH 7.4), 150 mM NaCl, 1 mM EDTA,0.1% SDS, 1% Nonidet P-40, and 0.25% sodium deoxy-cholate, supplemented with 1 mM PMSF and protease inhib-itor cocktail tablets (catalog no. 11 836 170 001; RocheApplied Science, Indianapolis, IN, USA)]. Laemmli samplebuffer was added to the homogenate, and samples wereheated at 95–100°C for 10 min (16). After centrifugation at10,000 g for 15 min at room temperature, cleared superna-tants were analyzed by SDS-PAGE followed by Coomassie bluestaining. Equal amounts of protein (20 �g) were used foreach sample analyzed.
Subcellular fractionation
Inguinal (ING) adipose tissue from mice fed a high-fat dietfor 16 wk was homogenized in 3 vol of TES buffer (50 mMTris-HCl, pH 7.5; 1 mM EDTA; and 0.25 M sucrose), supple-mented with 1 mM PMSF in a Teflon-glass homogenizer, andcentrifuged at 1300 g for 15 min. The infranatant wasaspirated from the pellet and the overlaying fat layer andcentrifuged at 14,000 g for 20 min to generate a pellet. The14,000 g supernatant was centrifuged at 32,000 g for 20 min torecover high-density microsomes. The supernatant was againcentrifuged at 100,000 g for 90 min to separate low-densitymicrosomes from soluble proteins. All pellets after differen-tial centrifugation were suspended in 0.1 vol of Tris/Mgbuffer (50 mM Tris-HCl, pH 7.5, 3 mM MgCl2, and 1 mMPMSF). The 1,300 g pellet (nuclear fraction) was transferredinto a new tube and washed in Tris/Mg buffer. The nuclearproteins were extracted with 0.1 vol of 0.4 M NaCl and 50 mMTris-HCl, pH 7.5, followed by an incubation on ice for 30 min.After centrifugation at 10,000 g at 4°C for 15 min, thesupernatant (nuclear proteins) was analyzed by SDS-PAGE.The fat layer from the first centrifugation was washed 3 timesin 10 vol of Tris/Mg buffer. The fat layer proteins wereextracted with an equal volume of RIPA/DOC lysis buffer.The mixture was warmed to 42°C for 30 s, mixed vigorouslyfor 1 min, and kept at room temperature for 30 min. Aftercentrifugation at 10,000 g at 4°C for 15 min, the infranatantwas aspirated (lipid droplet protein fraction 1), and theupper fat layer was extracted a second time with an equalvolume of RIPA/DOC lysis buffer at 37°C for 30 min. Aftercentrifugation at 10,000 g at 4°C for 15 min, the infranatant(lipid droplet protein fraction 2) was recovered. Proteinconcentrations were determined by the Bradford or DCprotein method (Bio-Rad Laboratories, Hercules, CA, USA).Equal amounts of protein (10 �g) for each sample were mixedwith 1⁄6 vol of 6� Laemmli sample buffer, heated at 95°C for 10min, and analyzed on a 10% SDS-PAGE gel (16).
Immunoblots
The Odyssey Infrared Imaging System (Li-COR, Lincoln, NE,USA) was used for Western blot analysis. Approximately 20 �gof protein samples was separated by 10% SDS-PAGE andtransferred to polyvinylidene difluoride Western blottingmembranes. The blots were incubated in stripping solution
2 Vol. 22 November 2008 NIKONOVA ET AL.The FASEB Journal
(100 mM 2-mercaptoethanol, 2% SDS, and 62.5 mM Tris-HCl, pH 6.8) at 55°C for 30 min. After washing in water for 30min and in Tris-buffered saline (10 mM Tris-HCl and 0.9%NaCl, pH 7.5) for three 10-min washes, the membranes wereincubated for 1 h with blocking solution from Li-COR andthen incubated overnight at room temperature with specificrabbit antiserum against MEST diluted 1:1000 in blockingsolution. Rabbit antibody against recombinant MEST wasprepared in our laboratory as described in the SupplementalData. Blots were also analyzed for glyceraldehyde-3-phosphatedehydrogenase (mouse anti-GAPDH monoclonal antibodydiluted 1:5000; Abcam, Cambridge, UK); perilipin (rabbitpolyclonal antibody diluted 1:1000; Research Diagnostics,Concord, MA, USA) and calnexin (rabbit polyclonal anti-body, diluted 1:2000; Stressgen, San Diego, CA, USA) fol-lowed by reactions with corresponding secondary antibodiesaccording to the manufacturers’ protocols.
Statistics
Statistical analyses were performed by ANOVA for multiplegroups and Student’s t test for paired comparisons usingStatview (1999; SAS Institute, Cary, NC) and Microsoft Excel(2003).
RESULTS
Expression of adipose tissue Mest is associated withvariable adiposity in B6 mice
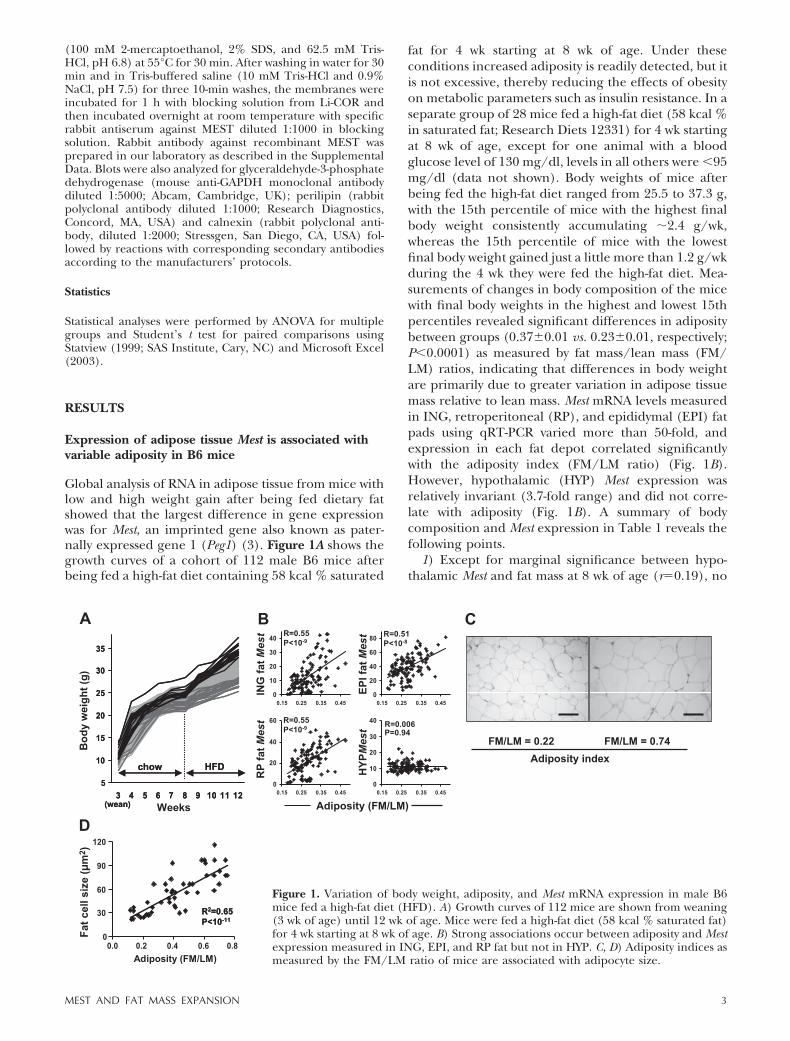
Global analysis of RNA in adipose tissue from mice withlow and high weight gain after being fed dietary fatshowed that the largest difference in gene expressionwas for Mest, an imprinted gene also known as pater-nally expressed gene 1 (Peg1) (3). Figure 1A shows thegrowth curves of a cohort of 112 male B6 mice afterbeing fed a high-fat diet containing 58 kcal % saturated
fat for 4 wk starting at 8 wk of age. Under theseconditions increased adiposity is readily detected, but itis not excessive, thereby reducing the effects of obesityon metabolic parameters such as insulin resistance. In aseparate group of 28 mice fed a high-fat diet (58 kcal %in saturated fat; Research Diets 12331) for 4 wk startingat 8 wk of age, except for one animal with a bloodglucose level of 130 mg/dl, levels in all others were �95mg/dl (data not shown). Body weights of mice afterbeing fed the high-fat diet ranged from 25.5 to 37.3 g,with the 15th percentile of mice with the highest finalbody weight consistently accumulating �2.4 g/wk,whereas the 15th percentile of mice with the lowestfinal body weight gained just a little more than 1.2 g/wkduring the 4 wk they were fed the high-fat diet. Mea-surements of changes in body composition of the micewith final body weights in the highest and lowest 15thpercentiles revealed significant differences in adipositybetween groups (0.37�0.01 vs. 0.23�0.01, respectively;P�0.0001) as measured by fat mass/lean mass (FM/LM) ratios, indicating that differences in body weightare primarily due to greater variation in adipose tissuemass relative to lean mass. Mest mRNA levels measuredin ING, retroperitoneal (RP), and epididymal (EPI) fatpads using qRT-PCR varied more than 50-fold, andexpression in each fat depot correlated significantlywith the adiposity index (FM/LM ratio) (Fig. 1B).However, hypothalamic (HYP) Mest expression wasrelatively invariant (3.7-fold range) and did not corre-late with adiposity (Fig. 1B). A summary of bodycomposition and Mest expression in Table 1 reveals thefollowing points.
1) Except for marginal significance between hypo-thalamic Mest and fat mass at 8 wk of age (r�0.19), no
Figure 1. Variation of body weight, adiposity, and Mest mRNA expression in male B6mice fed a high-fat diet (HFD). A) Growth curves of 112 mice are shown from weaning(3 wk of age) until 12 wk of age. Mice were fed a high-fat diet (58 kcal % saturated fat)for 4 wk starting at 8 wk of age. B) Strong associations occur between adiposity and Mestexpression measured in ING, EPI, and RP fat but not in HYP. C, D) Adiposity indices asmeasured by the FM/LM ratio of mice are associated with adipocyte size.
3MEST AND FAT MASS EXPANSION
other correlations involving hypothalamic Mest weresignificant.
2) No significant correlations were found betweenMest and lean body mass under any condition or at anytime.
3) Weak, but significant, correlations were presentbetween fat mass and Mest in all fat depots at 8 wk ofage, before the mice were fed a high-fat diet and withbody weight at 3 wk of age. The data suggest that theeffects of Mest are not dependent on a high-fat diet butare accentuated by the increase in a positive energybalance, which is stimulated by a high-fat diet.
4) The strong R values (R ranging from 0.68 to 0.81)between Mest expression in different fat depots, as wellas the high correlations of Mest with adiposity (FM/LMratio) in mice fed a high-fat diet, indicate that theadiposity index of an animal is determined by a mech-anism that affects adiposity systemically and is notrestricted to a specific regional fat depot.
Microscopic examination of tissue sections of ING fatfrom mice fed a high-fat diet for 8 wk indicated thatmice with a lower adiposity index have smaller adipo-cytes (Fig. 1C). Estimates of adipocyte size in a cohort of50 B6 mice with a range of adiposity indices showed avery strong association (r�0.81, P�1011) betweenadiposity indices and adipocyte size (Fig. 1D). The datasuggest that variation in adipocyte size is a majorsubphenotype determining variability to diet-inducedobesity.
An antibody generated in rabbits against bacteriallyexpressed recombinant murine MEST was used todetermine whether MEST protein levels correlate withmRNA expression in adipose tissue (see Supplemental
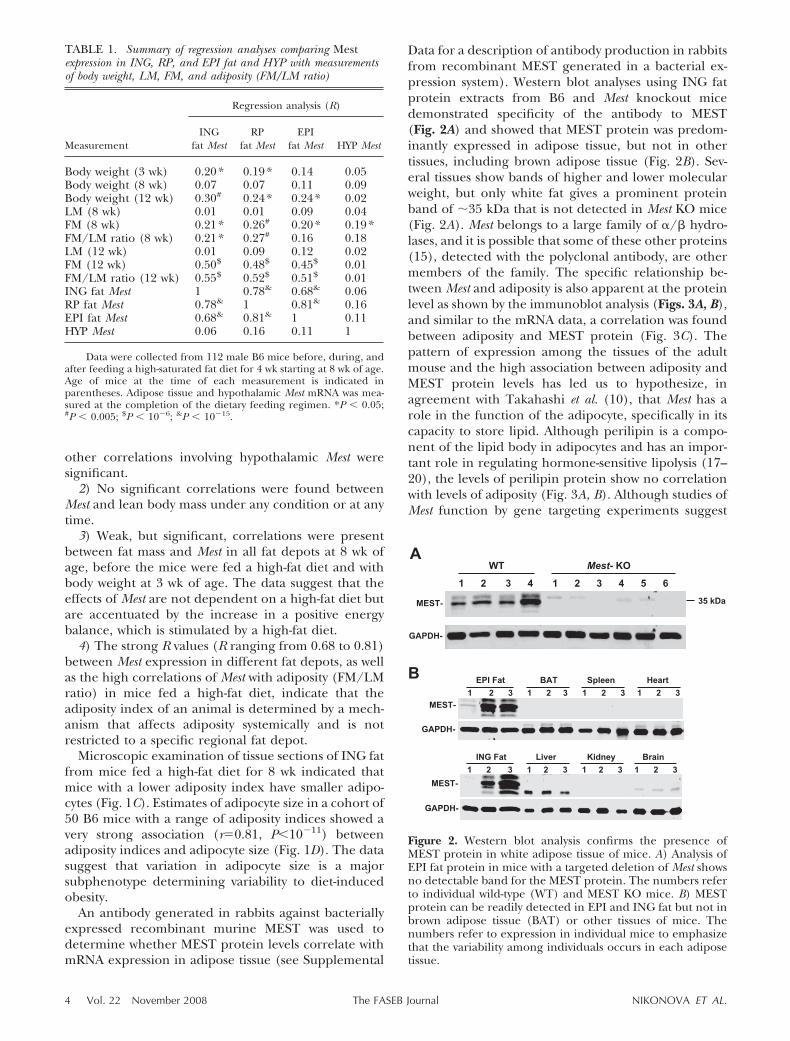
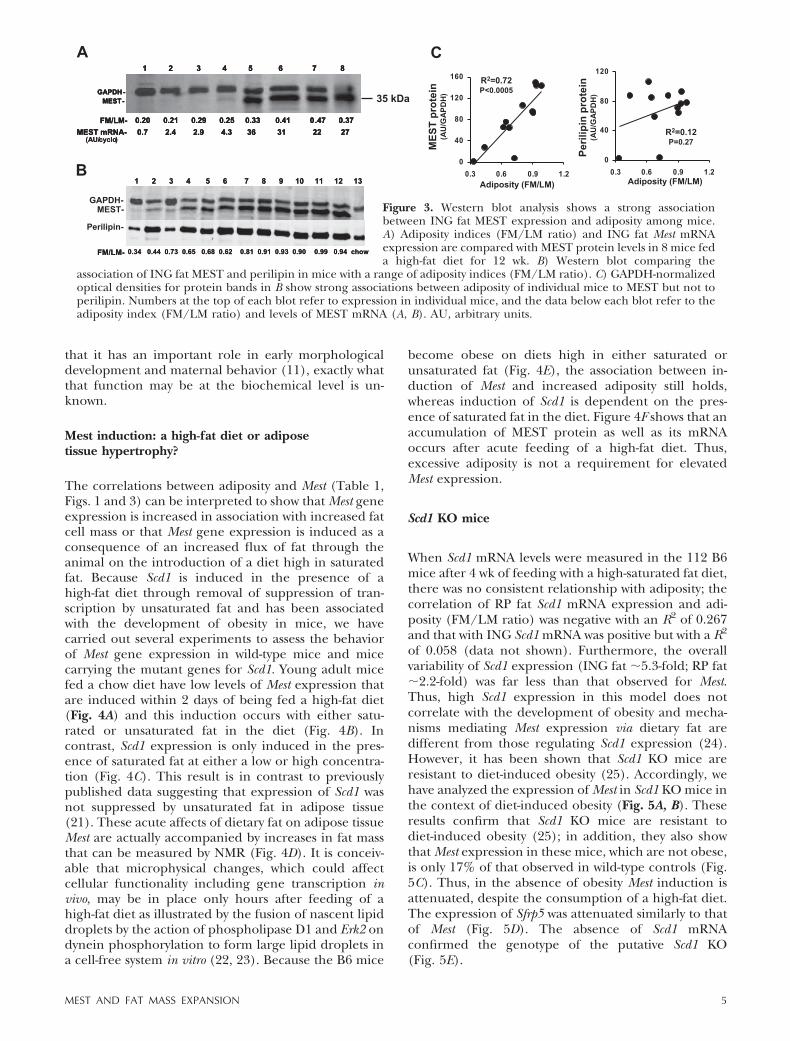
Data for a description of antibody production in rabbitsfrom recombinant MEST generated in a bacterial ex-pression system). Western blot analyses using ING fatprotein extracts from B6 and Mest knockout micedemonstrated specificity of the antibody to MEST(Fig. 2A) and showed that MEST protein was predom-inantly expressed in adipose tissue, but not in othertissues, including brown adipose tissue (Fig. 2B). Sev-eral tissues show bands of higher and lower molecularweight, but only white fat gives a prominent proteinband of �35 kDa that is not detected in Mest KO mice(Fig. 2A). Mest belongs to a large family of �/� hydro-lases, and it is possible that some of these other proteins(15), detected with the polyclonal antibody, are othermembers of the family. The specific relationship be-tween Mest and adiposity is also apparent at the proteinlevel as shown by the immunoblot analysis (Figs. 3A, B),and similar to the mRNA data, a correlation was foundbetween adiposity and MEST protein (Fig. 3C). Thepattern of expression among the tissues of the adultmouse and the high association between adiposity andMEST protein levels has led us to hypothesize, inagreement with Takahashi et al. (10), that Mest has arole in the function of the adipocyte, specifically in itscapacity to store lipid. Although perilipin is a compo-nent of the lipid body in adipocytes and has an impor-tant role in regulating hormone-sensitive lipolysis (17–20), the levels of perilipin protein show no correlationwith levels of adiposity (Fig. 3A, B). Although studies ofMest function by gene targeting experiments suggest
Figure 2. Western blot analysis confirms the presence ofMEST protein in white adipose tissue of mice. A) Analysis ofEPI fat protein in mice with a targeted deletion of Mest showsno detectable band for the MEST protein. The numbers referto individual wild-type (WT) and MEST KO mice. B) MESTprotein can be readily detected in EPI and ING fat but not inbrown adipose tissue (BAT) or other tissues of mice. Thenumbers refer to expression in individual mice to emphasizethat the variability among individuals occurs in each adiposetissue.
TABLE 1. Summary of regression analyses comparing Mestexpression in ING, RP, and EPI fat and HYP with measurementsof body weight, LM, FM, and adiposity (FM/LM ratio)
Measurement
Regression analysis (R)
INGfat Mest
RPfat Mest
EPIfat Mest HYP Mest
Body weight (3 wk) 0.20* 0.19* 0.14 0.05Body weight (8 wk) 0.07 0.07 0.11 0.09Body weight (12 wk) 0.30# 0.24* 0.24* 0.02LM (8 wk) 0.01 0.01 0.09 0.04FM (8 wk) 0.21* 0.26# 0.20* 0.19*FM/LM ratio (8 wk) 0.21* 0.27# 0.16 0.18LM (12 wk) 0.01 0.09 0.12 0.02FM (12 wk) 0.50$ 0.48$ 0.45$ 0.01FM/LM ratio (12 wk) 0.55$ 0.52$ 0.51$ 0.01ING fat Mest 1 0.78& 0.68& 0.06RP fat Mest 0.78& 1 0.81& 0.16EPI fat Mest 0.68& 0.81& 1 0.11HYP Mest 0.06 0.16 0.11 1
Data were collected from 112 male B6 mice before, during, andafter feeding a high-saturated fat diet for 4 wk starting at 8 wk of age.Age of mice at the time of each measurement is indicated inparentheses. Adipose tissue and hypothalamic Mest mRNA was mea-sured at the completion of the dietary feeding regimen. *P � 0.05;#P � 0.005; $P � 106; &P � 1015.
4 Vol. 22 November 2008 NIKONOVA ET AL.The FASEB Journal
that it has an important role in early morphologicaldevelopment and maternal behavior (11), exactly whatthat function may be at the biochemical level is un-known.
Mest induction: a high-fat diet or adiposetissue hypertrophy?
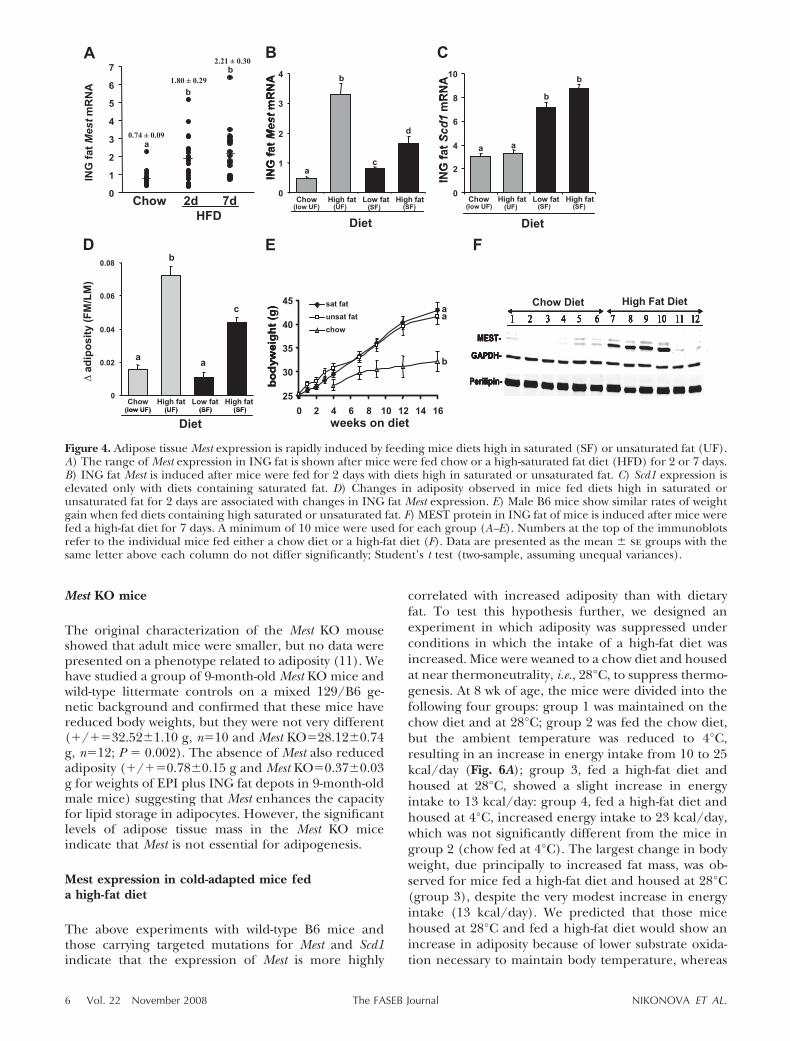
The correlations between adiposity and Mest (Table 1,Figs. 1 and 3) can be interpreted to show that Mest geneexpression is increased in association with increased fatcell mass or that Mest gene expression is induced as aconsequence of an increased flux of fat through theanimal on the introduction of a diet high in saturatedfat. Because Scd1 is induced in the presence of ahigh-fat diet through removal of suppression of tran-scription by unsaturated fat and has been associatedwith the development of obesity in mice, we havecarried out several experiments to assess the behaviorof Mest gene expression in wild-type mice and micecarrying the mutant genes for Scd1. Young adult micefed a chow diet have low levels of Mest expression thatare induced within 2 days of being fed a high-fat diet(Fig. 4A) and this induction occurs with either satu-rated or unsaturated fat in the diet (Fig. 4B). Incontrast, Scd1 expression is only induced in the pres-ence of saturated fat at either a low or high concentra-tion (Fig. 4C). This result is in contrast to previouslypublished data suggesting that expression of Scd1 wasnot suppressed by unsaturated fat in adipose tissue(21). These acute affects of dietary fat on adipose tissueMest are actually accompanied by increases in fat massthat can be measured by NMR (Fig. 4D). It is conceiv-able that microphysical changes, which could affectcellular functionality including gene transcription invivo, may be in place only hours after feeding of ahigh-fat diet as illustrated by the fusion of nascent lipiddroplets by the action of phospholipase D1 and Erk2 ondynein phosphorylation to form large lipid droplets ina cell-free system in vitro (22, 23). Because the B6 mice
become obese on diets high in either saturated orunsaturated fat (Fig. 4E), the association between in-duction of Mest and increased adiposity still holds,whereas induction of Scd1 is dependent on the pres-ence of saturated fat in the diet. Figure 4F shows that anaccumulation of MEST protein as well as its mRNAoccurs after acute feeding of a high-fat diet. Thus,excessive adiposity is not a requirement for elevatedMest expression.
Scd1 KO mice
When Scd1 mRNA levels were measured in the 112 B6mice after 4 wk of feeding with a high-saturated fat diet,there was no consistent relationship with adiposity; thecorrelation of RP fat Scd1 mRNA expression and adi-posity (FM/LM ratio) was negative with an R2 of 0.267and that with ING Scd1 mRNA was positive but with a R2
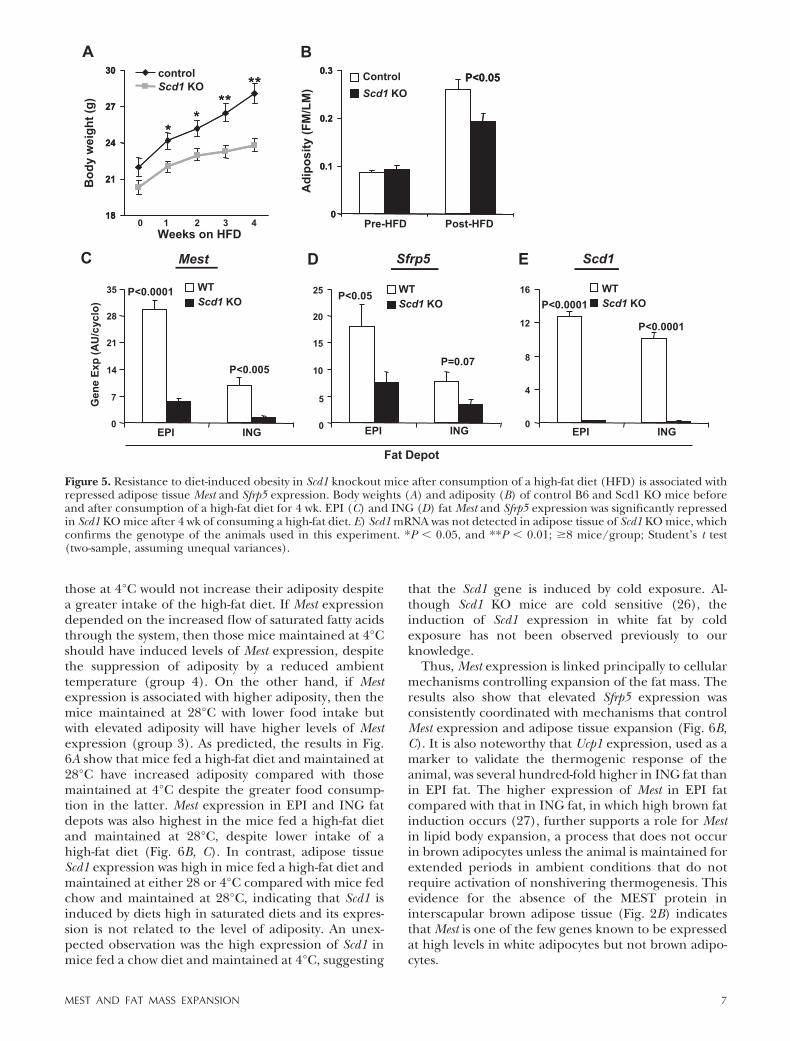
of 0.058 (data not shown). Furthermore, the overallvariability of Scd1 expression (ING fat �5.3-fold; RP fat�2.2-fold) was far less than that observed for Mest.Thus, high Scd1 expression in this model does notcorrelate with the development of obesity and mecha-nisms mediating Mest expression via dietary fat aredifferent from those regulating Scd1 expression (24).However, it has been shown that Scd1 KO mice areresistant to diet-induced obesity (25). Accordingly, wehave analyzed the expression of Mest in Scd1 KO mice inthe context of diet-induced obesity (Fig. 5A, B). Theseresults confirm that Scd1 KO mice are resistant todiet-induced obesity (25); in addition, they also showthat Mest expression in these mice, which are not obese,is only 17% of that observed in wild-type controls (Fig.5C). Thus, in the absence of obesity Mest induction isattenuated, despite the consumption of a high-fat diet.The expression of Sfrp5 was attenuated similarly to thatof Mest (Fig. 5D). The absence of Scd1 mRNAconfirmed the genotype of the putative Scd1 KO(Fig. 5E).
Figure 3. Western blot analysis shows a strong associationbetween ING fat MEST expression and adiposity among mice.A) Adiposity indices (FM/LM ratio) and ING fat Mest mRNAexpression are compared with MEST protein levels in 8 mice feda high-fat diet for 12 wk. B) Western blot comparing the
association of ING fat MEST and perilipin in mice with a range of adiposity indices (FM/LM ratio). C) GAPDH-normalizedoptical densities for protein bands in B show strong associations between adiposity of individual mice to MEST but not toperilipin. Numbers at the top of each blot refer to expression in individual mice, and the data below each blot refer to theadiposity index (FM/LM ratio) and levels of MEST mRNA (A, B). AU, arbitrary units.
5MEST AND FAT MASS EXPANSION
Mest KO mice
The original characterization of the Mest KO mouseshowed that adult mice were smaller, but no data werepresented on a phenotype related to adiposity (11). Wehave studied a group of 9-month-old Mest KO mice andwild-type littermate controls on a mixed 129/B6 ge-netic background and confirmed that these mice havereduced body weights, but they were not very different(/�32.52�1.10 g, n�10 and Mest KO�28.12�0.74g, n�12; P � 0.002). The absence of Mest also reducedadiposity (/�0.78�0.15 g and Mest KO�0.37�0.03g for weights of EPI plus ING fat depots in 9-month-oldmale mice) suggesting that Mest enhances the capacityfor lipid storage in adipocytes. However, the significantlevels of adipose tissue mass in the Mest KO miceindicate that Mest is not essential for adipogenesis.
Mest expression in cold-adapted mice feda high-fat diet
The above experiments with wild-type B6 mice andthose carrying targeted mutations for Mest and Scd1indicate that the expression of Mest is more highly
correlated with increased adiposity than with dietaryfat. To test this hypothesis further, we designed anexperiment in which adiposity was suppressed underconditions in which the intake of a high-fat diet wasincreased. Mice were weaned to a chow diet and housedat near thermoneutrality, i.e., 28°C, to suppress thermo-genesis. At 8 wk of age, the mice were divided into thefollowing four groups: group 1 was maintained on thechow diet and at 28°C; group 2 was fed the chow diet,but the ambient temperature was reduced to 4°C,resulting in an increase in energy intake from 10 to 25kcal/day (Fig. 6A); group 3, fed a high-fat diet andhoused at 28°C, showed a slight increase in energyintake to 13 kcal/day: group 4, fed a high-fat diet andhoused at 4°C, increased energy intake to 23 kcal/day,which was not significantly different from the mice ingroup 2 (chow fed at 4°C). The largest change in bodyweight, due principally to increased fat mass, was ob-served for mice fed a high-fat diet and housed at 28°C(group 3), despite the very modest increase in energyintake (13 kcal/day). We predicted that those micehoused at 28°C and fed a high-fat diet would show anincrease in adiposity because of lower substrate oxida-tion necessary to maintain body temperature, whereas
Figure 4. Adipose tissue Mest expression is rapidly induced by feeding mice diets high in saturated (SF) or unsaturated fat (UF).A) The range of Mest expression in ING fat is shown after mice were fed chow or a high-saturated fat diet (HFD) for 2 or 7 days.B) ING fat Mest is induced after mice were fed for 2 days with diets high in saturated or unsaturated fat. C) Scd1 expression iselevated only with diets containing saturated fat. D) Changes in adiposity observed in mice fed diets high in saturated orunsaturated fat for 2 days are associated with changes in ING fat Mest expression. E) Male B6 mice show similar rates of weightgain when fed diets containing high saturated or unsaturated fat. F) MEST protein in ING fat of mice is induced after mice werefed a high-fat diet for 7 days. A minimum of 10 mice were used for each group (A–E). Numbers at the top of the immunoblotsrefer to the individual mice fed either a chow diet or a high-fat diet (F). Data are presented as the mean � se groups with thesame letter above each column do not differ significantly; Student’s t test (two-sample, assuming unequal variances).
6 Vol. 22 November 2008 NIKONOVA ET AL.The FASEB Journal
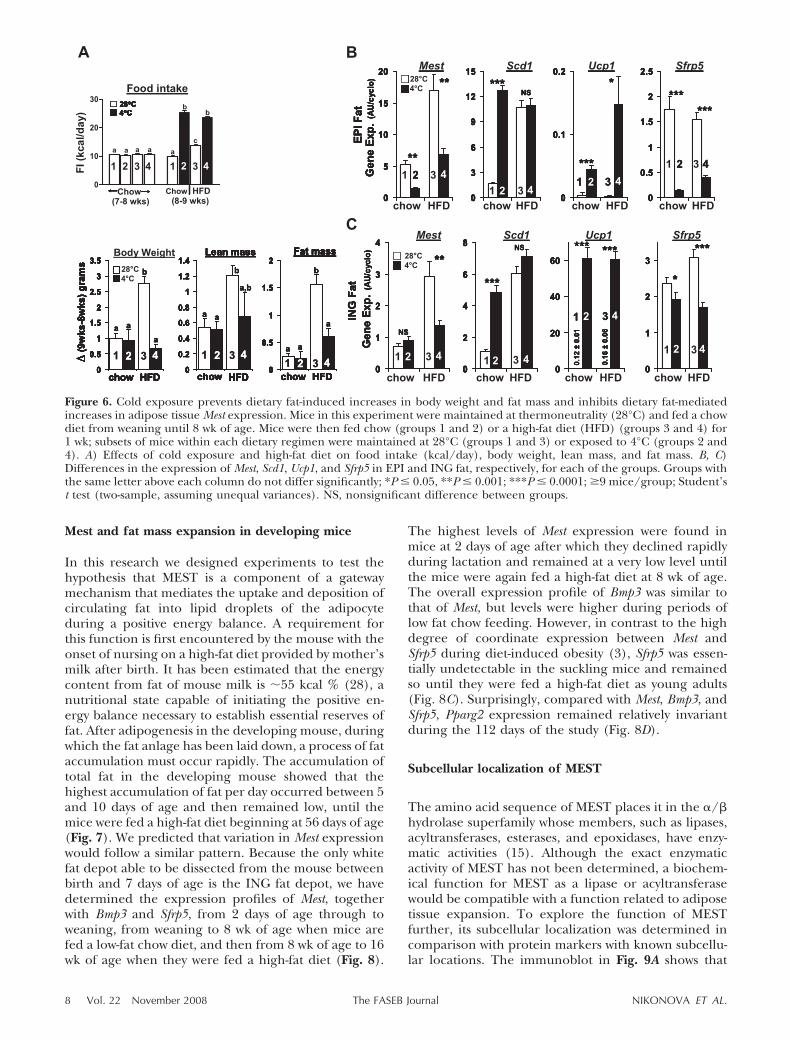
those at 4°C would not increase their adiposity despitea greater intake of the high-fat diet. If Mest expressiondepended on the increased flow of saturated fatty acidsthrough the system, then those mice maintained at 4°Cshould have induced levels of Mest expression, despitethe suppression of adiposity by a reduced ambienttemperature (group 4). On the other hand, if Mestexpression is associated with higher adiposity, then themice maintained at 28°C with lower food intake butwith elevated adiposity will have higher levels of Mestexpression (group 3). As predicted, the results in Fig.6A show that mice fed a high-fat diet and maintained at28°C have increased adiposity compared with thosemaintained at 4°C despite the greater food consump-tion in the latter. Mest expression in EPI and ING fatdepots was also highest in the mice fed a high-fat dietand maintained at 28°C, despite lower intake of ahigh-fat diet (Fig. 6B, C). In contrast, adipose tissueScd1 expression was high in mice fed a high-fat diet andmaintained at either 28 or 4°C compared with mice fedchow and maintained at 28°C, indicating that Scd1 isinduced by diets high in saturated diets and its expres-sion is not related to the level of adiposity. An unex-pected observation was the high expression of Scd1 inmice fed a chow diet and maintained at 4°C, suggesting
that the Scd1 gene is induced by cold exposure. Al-though Scd1 KO mice are cold sensitive (26), theinduction of Scd1 expression in white fat by coldexposure has not been observed previously to ourknowledge.
Thus, Mest expression is linked principally to cellularmechanisms controlling expansion of the fat mass. Theresults also show that elevated Sfrp5 expression wasconsistently coordinated with mechanisms that controlMest expression and adipose tissue expansion (Fig. 6B,C). It is also noteworthy that Ucp1 expression, used as amarker to validate the thermogenic response of theanimal, was several hundred-fold higher in ING fat thanin EPI fat. The higher expression of Mest in EPI fatcompared with that in ING fat, in which high brown fatinduction occurs (27), further supports a role for Mestin lipid body expansion, a process that does not occurin brown adipocytes unless the animal is maintained forextended periods in ambient conditions that do notrequire activation of nonshivering thermogenesis. Thisevidence for the absence of the MEST protein ininterscapular brown adipose tissue (Fig. 2B) indicatesthat Mest is one of the few genes known to be expressedat high levels in white adipocytes but not brown adipo-cytes.
Figure 5. Resistance to diet-induced obesity in Scd1 knockout mice after consumption of a high-fat diet (HFD) is associated withrepressed adipose tissue Mest and Sfrp5 expression. Body weights (A) and adiposity (B) of control B6 and Scd1 KO mice beforeand after consumption of a high-fat diet for 4 wk. EPI (C) and ING (D) fat Mest and Sfrp5 expression was significantly repressedin Scd1 KO mice after 4 wk of consuming a high-fat diet. E) Scd1 mRNA was not detected in adipose tissue of Scd1 KO mice, whichconfirms the genotype of the animals used in this experiment. *P � 0.05, and **P � 0.01; �8 mice/group; Student’s t test(two-sample, assuming unequal variances).
7MEST AND FAT MASS EXPANSION
Mest and fat mass expansion in developing mice
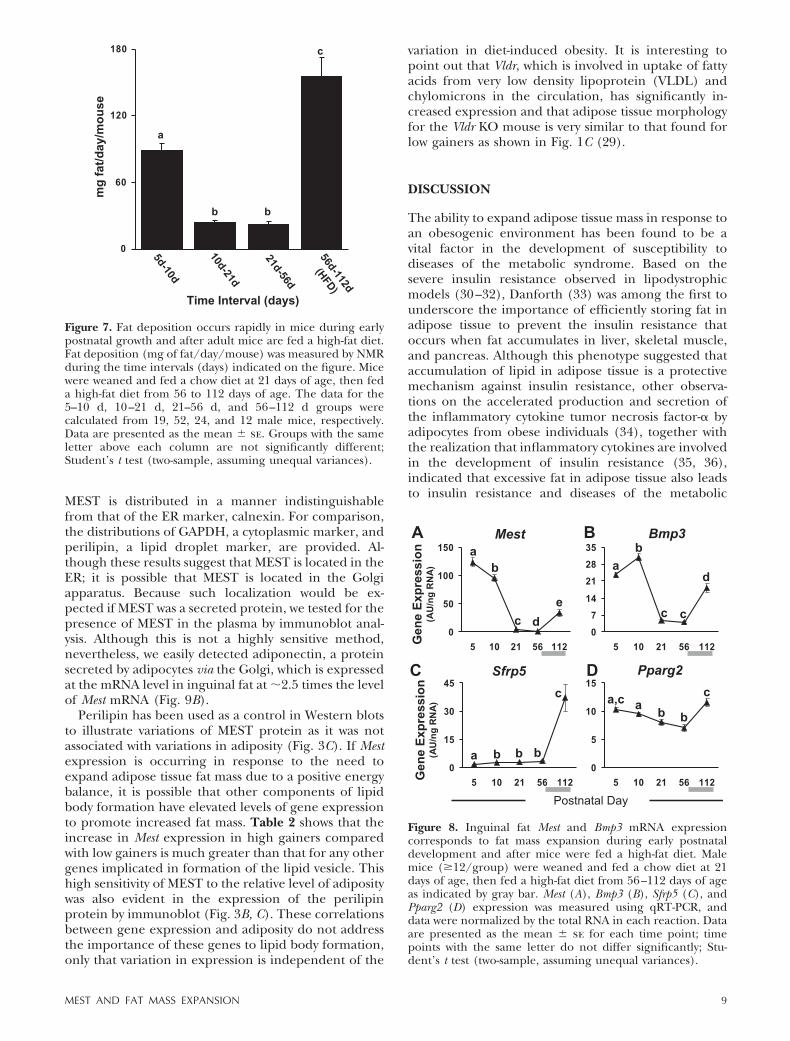
In this research we designed experiments to test thehypothesis that MEST is a component of a gatewaymechanism that mediates the uptake and deposition ofcirculating fat into lipid droplets of the adipocyteduring a positive energy balance. A requirement forthis function is first encountered by the mouse with theonset of nursing on a high-fat diet provided by mother’smilk after birth. It has been estimated that the energycontent from fat of mouse milk is �55 kcal % (28), anutritional state capable of initiating the positive en-ergy balance necessary to establish essential reserves offat. After adipogenesis in the developing mouse, duringwhich the fat anlage has been laid down, a process of fataccumulation must occur rapidly. The accumulation oftotal fat in the developing mouse showed that thehighest accumulation of fat per day occurred between 5and 10 days of age and then remained low, until themice were fed a high-fat diet beginning at 56 days of age(Fig. 7). We predicted that variation in Mest expressionwould follow a similar pattern. Because the only whitefat depot able to be dissected from the mouse betweenbirth and 7 days of age is the ING fat depot, we havedetermined the expression profiles of Mest, togetherwith Bmp3 and Sfrp5, from 2 days of age through toweaning, from weaning to 8 wk of age when mice arefed a low-fat chow diet, and then from 8 wk of age to 16wk of age when they were fed a high-fat diet (Fig. 8).
The highest levels of Mest expression were found inmice at 2 days of age after which they declined rapidlyduring lactation and remained at a very low level untilthe mice were again fed a high-fat diet at 8 wk of age.The overall expression profile of Bmp3 was similar tothat of Mest, but levels were higher during periods oflow fat chow feeding. However, in contrast to the highdegree of coordinate expression between Mest andSfrp5 during diet-induced obesity (3), Sfrp5 was essen-tially undetectable in the suckling mice and remainedso until they were fed a high-fat diet as young adults(Fig. 8C). Surprisingly, compared with Mest, Bmp3, andSfrp5, Pparg2 expression remained relatively invariantduring the 112 days of the study (Fig. 8D).
Subcellular localization of MEST
The amino acid sequence of MEST places it in the �/�hydrolase superfamily whose members, such as lipases,acyltransferases, esterases, and epoxidases, have enzy-matic activities (15). Although the exact enzymaticactivity of MEST has not been determined, a biochem-ical function for MEST as a lipase or acyltransferasewould be compatible with a function related to adiposetissue expansion. To explore the function of MESTfurther, its subcellular localization was determined incomparison with protein markers with known subcellu-lar locations. The immunoblot in Fig. 9A shows that
Figure 6. Cold exposure prevents dietary fat-induced increases in body weight and fat mass and inhibits dietary fat-mediatedincreases in adipose tissue Mest expression. Mice in this experiment were maintained at thermoneutrality (28°C) and fed a chowdiet from weaning until 8 wk of age. Mice were then fed chow (groups 1 and 2) or a high-fat diet (HFD) (groups 3 and 4) for1 wk; subsets of mice within each dietary regimen were maintained at 28°C (groups 1 and 3) or exposed to 4°C (groups 2 and4). A) Effects of cold exposure and high-fat diet on food intake (kcal/day), body weight, lean mass, and fat mass. B, C)Differences in the expression of Mest, Scd1, Ucp1, and Sfrp5 in EPI and ING fat, respectively, for each of the groups. Groups withthe same letter above each column do not differ significantly; *P � 0.05, **P � 0.001; ***P � 0.0001; �9 mice/group; Student’st test (two-sample, assuming unequal variances). NS, nonsignificant difference between groups.
8 Vol. 22 November 2008 NIKONOVA ET AL.The FASEB Journal
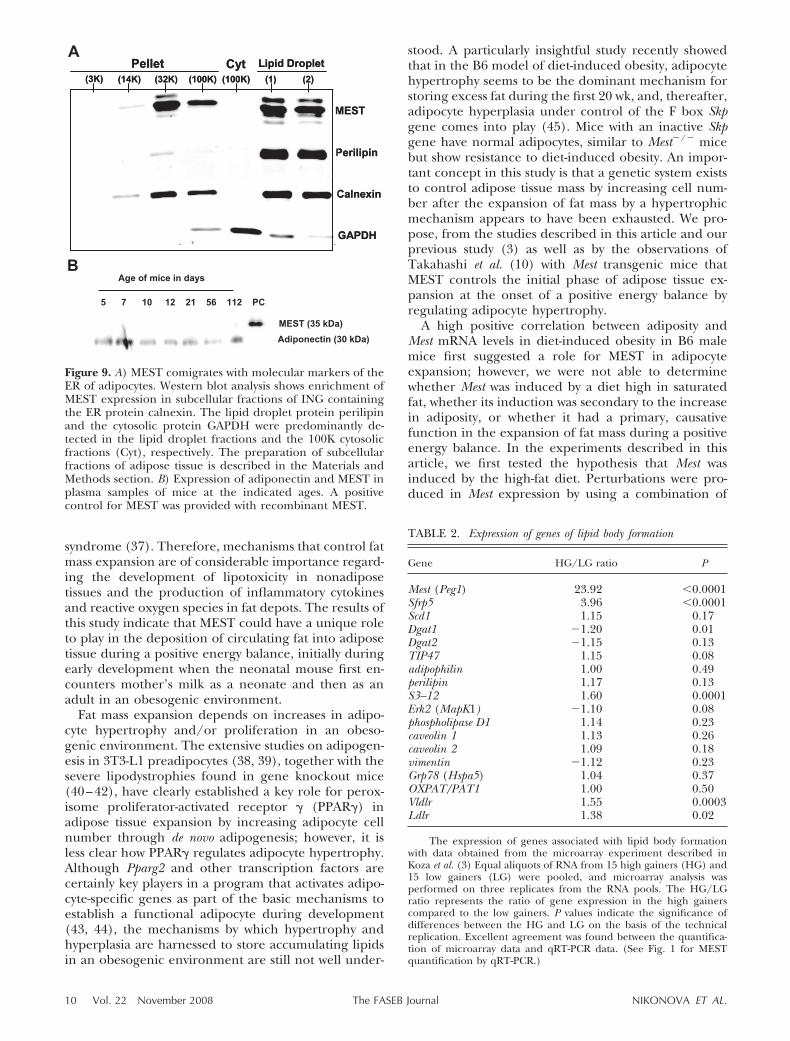
MEST is distributed in a manner indistinguishablefrom that of the ER marker, calnexin. For comparison,the distributions of GAPDH, a cytoplasmic marker, andperilipin, a lipid droplet marker, are provided. Al-though these results suggest that MEST is located in theER; it is possible that MEST is located in the Golgiapparatus. Because such localization would be ex-pected if MEST was a secreted protein, we tested for thepresence of MEST in the plasma by immunoblot anal-ysis. Although this is not a highly sensitive method,nevertheless, we easily detected adiponectin, a proteinsecreted by adipocytes via the Golgi, which is expressedat the mRNA level in inguinal fat at �2.5 times the levelof Mest mRNA (Fig. 9B).
Perilipin has been used as a control in Western blotsto illustrate variations of MEST protein as it was notassociated with variations in adiposity (Fig. 3C). If Mestexpression is occurring in response to the need toexpand adipose tissue fat mass due to a positive energybalance, it is possible that other components of lipidbody formation have elevated levels of gene expressionto promote increased fat mass. Table 2 shows that theincrease in Mest expression in high gainers comparedwith low gainers is much greater than that for any othergenes implicated in formation of the lipid vesicle. Thishigh sensitivity of MEST to the relative level of adipositywas also evident in the expression of the perilipinprotein by immunoblot (Fig. 3B, C). These correlationsbetween gene expression and adiposity do not addressthe importance of these genes to lipid body formation,only that variation in expression is independent of the
variation in diet-induced obesity. It is interesting topoint out that Vldr, which is involved in uptake of fattyacids from very low density lipoprotein (VLDL) andchylomicrons in the circulation, has significantly in-creased expression and that adipose tissue morphologyfor the Vldr KO mouse is very similar to that found forlow gainers as shown in Fig. 1C (29).
DISCUSSION
The ability to expand adipose tissue mass in response toan obesogenic environment has been found to be avital factor in the development of susceptibility todiseases of the metabolic syndrome. Based on thesevere insulin resistance observed in lipodystrophicmodels (30–32), Danforth (33) was among the first tounderscore the importance of efficiently storing fat inadipose tissue to prevent the insulin resistance thatoccurs when fat accumulates in liver, skeletal muscle,and pancreas. Although this phenotype suggested thataccumulation of lipid in adipose tissue is a protectivemechanism against insulin resistance, other observa-tions on the accelerated production and secretion ofthe inflammatory cytokine tumor necrosis factor-� byadipocytes from obese individuals (34), together withthe realization that inflammatory cytokines are involvedin the development of insulin resistance (35, 36),indicated that excessive fat in adipose tissue also leadsto insulin resistance and diseases of the metabolic
Figure 7. Fat deposition occurs rapidly in mice during earlypostnatal growth and after adult mice are fed a high-fat diet.Fat deposition (mg of fat/day/mouse) was measured by NMRduring the time intervals (days) indicated on the figure. Micewere weaned and fed a chow diet at 21 days of age, then feda high-fat diet from 56 to 112 days of age. The data for the5–10 d, 10–21 d, 21–56 d, and 56–112 d groups werecalculated from 19, 52, 24, and 12 male mice, respectively.Data are presented as the mean � se. Groups with the sameletter above each column are not significantly different;Student’s t test (two-sample, assuming unequal variances).
Figure 8. Inguinal fat Mest and Bmp3 mRNA expressioncorresponds to fat mass expansion during early postnataldevelopment and after mice were fed a high-fat diet. Malemice (�12/group) were weaned and fed a chow diet at 21days of age, then fed a high-fat diet from 56–112 days of ageas indicated by gray bar. Mest (A), Bmp3 (B), Sfrp5 (C), andPparg2 (D) expression was measured using qRT-PCR, anddata were normalized by the total RNA in each reaction. Dataare presented as the mean � se for each time point; timepoints with the same letter do not differ significantly; Stu-dent’s t test (two-sample, assuming unequal variances).
9MEST AND FAT MASS EXPANSION
syndrome (37). Therefore, mechanisms that control fatmass expansion are of considerable importance regard-ing the development of lipotoxicity in nonadiposetissues and the production of inflammatory cytokinesand reactive oxygen species in fat depots. The results ofthis study indicate that MEST could have a unique roleto play in the deposition of circulating fat into adiposetissue during a positive energy balance, initially duringearly development when the neonatal mouse first en-counters mother’s milk as a neonate and then as anadult in an obesogenic environment.
Fat mass expansion depends on increases in adipo-cyte hypertrophy and/or proliferation in an obeso-genic environment. The extensive studies on adipogen-esis in 3T3-L1 preadipocytes (38, 39), together with thesevere lipodystrophies found in gene knockout mice(40–42), have clearly established a key role for perox-isome proliferator-activated receptor � (PPAR�) inadipose tissue expansion by increasing adipocyte cellnumber through de novo adipogenesis; however, it isless clear how PPAR� regulates adipocyte hypertrophy.Although Pparg2 and other transcription factors arecertainly key players in a program that activates adipo-cyte-specific genes as part of the basic mechanisms toestablish a functional adipocyte during development(43, 44), the mechanisms by which hypertrophy andhyperplasia are harnessed to store accumulating lipidsin an obesogenic environment are still not well under-
stood. A particularly insightful study recently showedthat in the B6 model of diet-induced obesity, adipocytehypertrophy seems to be the dominant mechanism forstoring excess fat during the first 20 wk, and, thereafter,adipocyte hyperplasia under control of the F box Skpgene comes into play (45). Mice with an inactive Skpgene have normal adipocytes, similar to Mest/ micebut show resistance to diet-induced obesity. An impor-tant concept in this study is that a genetic system existsto control adipose tissue mass by increasing cell num-ber after the expansion of fat mass by a hypertrophicmechanism appears to have been exhausted. We pro-pose, from the studies described in this article and ourprevious study (3) as well as by the observations ofTakahashi et al. (10) with Mest transgenic mice thatMEST controls the initial phase of adipose tissue ex-pansion at the onset of a positive energy balance byregulating adipocyte hypertrophy.
A high positive correlation between adiposity andMest mRNA levels in diet-induced obesity in B6 malemice first suggested a role for MEST in adipocyteexpansion; however, we were not able to determinewhether Mest was induced by a diet high in saturatedfat, whether its induction was secondary to the increasein adiposity, or whether it had a primary, causativefunction in the expansion of fat mass during a positiveenergy balance. In the experiments described in thisarticle, we first tested the hypothesis that Mest wasinduced by the high-fat diet. Perturbations were pro-duced in Mest expression by using a combination of
Figure 9. A) MEST comigrates with molecular markers of theER of adipocytes. Western blot analysis shows enrichment ofMEST expression in subcellular fractions of ING containingthe ER protein calnexin. The lipid droplet protein perilipinand the cytosolic protein GAPDH were predominantly de-tected in the lipid droplet fractions and the 100K cytosolicfractions (Cyt), respectively. The preparation of subcellularfractions of adipose tissue is described in the Materials andMethods section. B) Expression of adiponectin and MEST inplasma samples of mice at the indicated ages. A positivecontrol for MEST was provided with recombinant MEST.
TABLE 2. Expression of genes of lipid body formation
Gene HG/LG ratio P
Mest (Peg1) 23.92 �0.0001Sfrp5 3.96 �0.0001Scd1 1.15 0.17Dgat1 1.20 0.01Dgat2 1.15 0.13TIP47 1.15 0.08adipophilin 1.00 0.49perilipin 1.17 0.13S3–12 1.60 0.0001Erk2 (MapK1) 1.10 0.08phospholipase D1 1.14 0.23caveolin 1 1.13 0.26caveolin 2 1.09 0.18vimentin 1.12 0.23Grp78 (Hspa5) 1.04 0.37OXPAT/PAT1 1.00 0.50Vldlr 1.55 0.0003Ldlr 1.38 0.02
The expression of genes associated with lipid body formationwith data obtained from the microarray experiment described inKoza et al. (3) Equal aliquots of RNA from 15 high gainers (HG) and15 low gainers (LG) were pooled, and microarray analysis wasperformed on three replicates from the RNA pools. The HG/LGratio represents the ratio of gene expression in the high gainerscompared to the low gainers. P values indicate the significance ofdifferences between the HG and LG on the basis of the technicalreplication. Excellent agreement was found between the quantifica-tion of microarray data and qRT-PCR data. (See Fig. 1 for MESTquantification by qRT-PCR.)
10 Vol. 22 November 2008 NIKONOVA ET AL.The FASEB Journal
wild-type mice and mice carrying inactivated genes forScd1 and Mest together with variation in diets andenvironmental temperature to determine whether theinduction of Mest is caused by a high-fat diet or whetherit is primarily associated with increased fat mass expan-sion. These studies showed that without exceptionincreases in adipose tissue expansion are accompaniedby increased expression of Mest. On the other hand,increased Mest expression is not always associated withincreased fat in the diet. In one experiment in which wemanipulated the ambient temperature to reduce adi-posity but increase dietary fat intake, we observed thatMest expression was higher in B6 mice fed a high-fatdiet and maintained at thermoneutrality comparedwith mice fed the high-fat diet and maintained at 4°C.The latter resulted in increased consumption of ahigh-fat diet and a reduction of fat stores because ofincreased substrate oxidation to maintain body temper-ature. In contrast, if the ambient temperature is in-creased to 28°C, consumption of the high-fat diet isreduced, but both adiposity and Mest expression wereincreased. Thus, Mest expression is linked to adiposity,but Scd1 expression is linked to diets containing satu-rated fat. In another experiment, Scd1 KO mice werefed a high-saturated fat diet and shown to be resistant tothe development of obesity as observed previously (25).In our experiment, reduced adiposity was associatedwith a drastic reduction in Mest expression (Fig. 5C),indicating that the high-fat diet is not sufficient for Mestinduction. Rather the correlation is between the levelof adiposity and Mest. Alternatively, it is possible thatinduction of Mest requires unsaturated fats that arenormally produced by Scd1 but are missing in the Scd1KO mice. However, adipose tissue of mice expresseshigh levels of Scd2 (21), which is fully capable ofsynthesizing unsaturated fatty acids. Therefore, re-duced Mest expression is not likely to be determined bythe inability of adipose tissue to synthesize unsaturatedfatty acids in the absence of Scd1, and this finding onceagain underscores the strong correlation of Mest withfat mass.
Our experiments do not support the hypothesis thatMest expression is induced as a secondary consequenceof an increase in adiposity as a result of a positiveenergy balance. Several experimental observations per-tinent to this conclusion are as follows: 1) Mest expres-sion is already higher in mice destined to be highgainers even before the introduction of a high-fat diet(3); 2) Mest becomes induced in adult mice within 2days of being fed a high-fat diet, before significantchanges in adiposity can be detected by NMR (Fig. 4);3) the highest levels of Mest mRNA are found in theneonatal mouse at the onset of fat mass accretionbefore fat depots are established and then Mest mRNAlevels gradually decline during the following days ofdevelopment when fat mass is expanding at a slowerrate (Fig. 8); and 4) adipose tissue in Mest KO mice hasnormal morphology, but at reduced levels. These ex-perimental data suggest that MEST is a component of a
mechanism in the ER facilitating the uptake of fat intothe adipocyte for storage in lipid droplets.
In addition to its expression patterns under nutri-tional manipulations and during development, a rolefor MEST in fat mass expansion comes from its molec-ular characteristics. Foremost, MEST is localized to theER, a site where the VLDL receptor and diacylglycerideacyl transferase 1 (DGAT1) function, together withlipoprotein lipase in the vascular endothelium, to takeup fatty acids from the circulation and repackage theminto triglycerides (TGs) for assembly into the lipiddroplet . These functions of the ER in lipid storagesuggest that the function of MEST in the ER may besimilarly related to TG storage. Secondarily, the enzy-matic role for MEST in the ER to facilitate storage of fatis suggested from putative enzymatic functions of �/�fold hydrolase proteins and, indeed, the presence ofthe catalytic triad at serine 145-histidine 146-aspartate147 of MEST strongly suggest an enzymatic function forMEST as a lipase or acyltransferase (15, 47). Such anenzymatic function could, accordingly, supplement thecapacity of DGAT1 or other lipase activities associatedwith TG metabolism in the ER to efficiently store excesscalories in adipose tissue during a positive energybalance.
It is indicative of the potential importance of the �/�fold hydrolase family of proteins in lipid metabolismthat the �/� fold CGI-58 protein has recently beenfound to an integral component of the lipid dropletwhere it mediates the accessibility of hormone-sensitivelipase (HSL) to the lipid droplet (48). Not only doesCGI-58 regulate HSL, but also its binding affinity toadipose tissue triglyceride lipase (ATGL) is essential forthe enzymatic activity of ATGL. However, unlike MEST,which has the active site structure necessary for anenzymatically functional protein, CGI-58 lacks the es-sential serine in the catalytic triad and therefore func-tions as an accessory/carrier protein.
In summary, the profound importance of imprintedgenes for the normal development of mammalianorganisms from the embryo to the mature fetus hasbeen well established (http://www.mgu.har.mrc.ac.uk/research/imprinting/). On the other hand, a rolefor imprinted genes in the normal physiology of adultmammals is relatively unknown. In this article we haveshown that the Mest gene is almost undetectable insomatic tissues of the adult mouse, until it enters acondition of positive energy balance after the feedingof a high-fat diet. Under these conditions induction ofMest occurs selectively in mature white adipocyteswithin a subpopulation of genetically identical mice;however, the induction of both adiposity and Mest ishighly variable among individual mice. Microarray anal-yses of �33,000 targets showed that Mest overexpressionin adipose tissue of high vs. low weight-gaining mice isgreater than that of any other gene, including thoseassociated with lipid body formation. Immunoblot ex-periments indicate that MEST is localized to the ER orGolgi apparatus where other proteins associated withexpansion of the lipid body of the mature adipocyte are
11MEST AND FAT MASS EXPANSION
located. The fact that MEST is a member of the �/�fold hydrolase family with an intact catalytic triad in itsactive site suggests a function for MEST in adiposetissue expansion that is related to its enzymatic activityas a lipase or acyl transferase.
We thank Dr. Indu Kheterpal and the Proteomic Core foranalysis of MEST by mass spectroscopy and Dr. Barbara Kozakfor making the photomicrographs. We thank Cody Giardinofor excellent technical assistance. This research was sup-ported by a grant from the Health Excellence Fund of theState of Louisiana and grants P-30 DK072476 and P20-RR021945 from the National Institutes of Health. J. P. C. wassupported by a fellowship from the Leverhulme Trust.
REFERENCES
1. Burcelin, R., Crivelli, V., Dacosta, A., Roy-Tirelli, A., and Tho-rens, B. (2002) Heterogeneous metabolic adaptation ofC57BL/6J mice to high-fat diet. Am. J. Physiol. Endocrinol. Metab.282, E834–E842
2. De Fourmestraux, V., Neubauer, H., Poussin, C., Farmer, P.,Falquet, L., Burcelin, R., Delorenzi, M., and Thorens, B. (2004)Transcript profiling suggests that differential metabolic adapta-tion of mice to a high fat diet is associated with changes in liverto muscle lipid fluxes. J. Biol. Chem. 279, 50743–50753
3. Koza, R. A., Nikonova, L., Hogan, J., Rim, J. S., Mendoza, T.,Faulk, C., Skaf, J., and Kozak, L. P. (2006) Changes in geneexpression foreshadow diet-induced obesity in genetically iden-tical mice. PLoS Genet. 2, e81
4. Enriori, P. J., Evans, A. E., Sinnayah, P., Jobst, E. E., Tonelli-Lemos, L., Billes, S. K., Glavas, M. M., Grayson, B. E., Perello, M.,Nillni, E. A., Grove, K. L., and Cowley, M. A. (2007) Diet-induced obesity causes severe but reversible leptin resistance inarcuate melanocortin neurons. Cell Metab. 5, 181–194
5. Ross, S. E., Hemati, N., Longo, K. A., Bennett, C. N., Lucas,P. C., Erickson, R. L., and MacDougald, O. A. (2000) Inhibitionof adipogenesis by Wnt signaling. Science 289, 950–953
6. Bennett, C. N., Ross, S. E., Longo, K. A., Bajnok, L., Hemati, N.,Johnson, K. W., Harrison, S. D., and MacDougald, O. A. (2002)Regulation of Wnt signaling during adipogenesis. J. Biol. Chem.277, 30998–31004
7. Daluiski, A., Engstrand, T., Bahamonde, M. E., Gamer, L. W.,Agius, E., Stevenson, S. L., Cox, K., Rosen, V., and Lyons, K. M.(2001) Bone morphogenetic protein-3 is a negative regulator ofbone density. Nat. Genet. 27, 84–88
8. Rupnick, M. A., Panigrahy, D., Zhang, C. Y., Dallabrida, S. M.,Lowell, B. B., Langer, R., and Folkman, M. J. (2002) Adiposetissue mass can be regulated through the vasculature. Proc. Natl.Acad. Sci. U. S. A. 99, 10730–10735
9. Soukas, A., Cohen, P., Socci, N. D., and Friedman, J. M. (2000)Leptin-specific patterns of gene expression in white adiposetissue. Genes Dev. 14, 963–980
10. Takahashi, M., Kamei, Y., and Ezaki, O. (2005) Mest/Peg1imprinted gene enlarges adipocytes and is a marker of adipocytesize. Am. J. Physiol. Endocrinol. Metab. 288, E117–E124
11. Lefebvre, L., Viville, S., Barton, S. C., Ishino, F., Keverne, E. B.,and Surani, M. A. (1998) Abnormal maternal behaviour andgrowth retardation associated with loss of the imprinted geneMest. Nat. Genet. 20, 163–169
12. Kobayashi, S., Kohda, T., Miyoshi, N., Kuroiwa, Y., Aisaka, K.,Tsutsumi, O., Kaneko-Ishino, T., and Ishino, F. (1997) HumanPEG1/MEST, an imprinted gene on chromosome 7. Hum. Mol.Genet. 6, 781–786
13. Lefebvre, L., Viville, S., Barton, S. C., Ishino, F., and Surani,M. A. (1997) Genomic structure and parent-of-origin-specificmethylation of Peg1. Hum. Mol. Genet. 6, 1907–1915
14. Ollis, D. L., Cheah, E., Cygler, M., Dijkstra, B., Frolow, F.,Franken, S. M., Harel, M., Remington, S. J., Silman, I., Schrag,
J., Sussman, J. L., Verschueren, K. H. G., and Goldman, A.(1992) The �/� hydrolase fold. Protein Eng. 5, 197–211
15. Holmquist, M. (2000) �/�-Hydrolase fold enzymes: structures,functions and mechanisms. Curr. Protein Pept. Sci. 1, 209–235
16. Laemmli, U. K. (1970) Cleavage of structural proteins duringthe assembly of the head of bacteriophage T4. Nature 227,680–685
17. Martinez-Botas, J., Anderson, J. B., Tessier, D., Lapillonne, A.,Chang, B. H., Quast, M. J., Gorenstein, D., Chen, K. H., andChan, L. (2000) Absence of perilipin results in leanness andreverses obesity in Leprdb/db mice. Nat. Genet. 26, 474–479
18. Tansey, J. T., Sztalryd, C., Gruia-Gray, J., Roush, D. L., Zee, J. V.,Gavrilova, O., Reitman, M. L., Deng, C. X., Li, C., Kimmel, A. R.,and Londos, C. (2001) Perilipin ablation results in a lean mousewith aberrant adipocyte lipolysis, enhanced leptin production,and resistance to diet-induced obesity. Proc. Natl. Acad. Sci.U. S. A. 98, 6494–6499
19. Greenberg, A. S., Egan, J. J., Wek, S. A., Garty, N. B., Blanchette-Mackie, E. J., and Londos, C. (1991) Perilipin, a major hormon-ally regulated adipocyte-specific phosphoprotein associated withthe periphery of lipid storage droplets. J. Biol. Chem. 266,11341–11346
20. Blanchette-Mackie, E. J., Dwyer, N. K., Barber, T., Coxey, R. A.,Takeda, T., Rondinone, C. M., Theodorakis, J. L., Greenberg,A. S., and Londos, C. (1995) Perilipin is located on the surfacelayer of intracellular lipid droplets in adipocytes. J. Lipid Res. 36,1211–1226
21. Kaestner, K. H., Ntambi, J. M., Kelly, T. J., Jr., and Lane, M. D.(1989) Differentiation-induced gene expression in 3T3–L1preadipocytes: a second differentially expressed geneencoding stearoyl-CoA desaturase. J. Biol. Chem. 264, 14755–14761
22. Andersson, L., Bostrom, P., Ericson, J., Rutberg, M., Magnus-son, B., Marchesan, D., Ruiz, M., Asp, L., Huang, P., Froh-man, M. A., Boren, J., and Olofsson, S. O. (2006) PLD1 andERK2 regulate cytosolic lipid droplet formation. J. Cell Sci.119, 2246 –2257
23. Bostrom, P., Rutberg, M., Ericsson, J., Holmdahl, P., Andersson,L., Frohman, M. A., Boren, J., and Olofsson, S. O. (2005)Cytosolic lipid droplets increase in size by microtubule-depen-dent complex formation. Arterioscler. Thromb. Vasc. Biol. 25,1945–1951
24. Ntambi, J. M. (1999) Regulation of stearoyl-CoA desaturase bypolyunsaturated fatty acids and cholesterol. J. Lipid Res. 40,1549–1558
25. Ntambi, J. M., Miyazaki, M., Stoehr, J. P., Lan, H., Kendziorski,C. M., Yandell, B. S., Song, Y., Cohen, P., Friedman, J. M., andAttie, A. D. (2002) Loss of stearoyl-CoA desaturase-1 functionprotects mice against adiposity. Proc. Natl. Acad. Sci. U. S. A. 99,11482–11486
26. Lee, S. H., Dobrzyn, A., Dobrzyn, P., Rahman, S. M., Miyazaki,M., and Ntambi, J. M. (2004) Lack of stearoyl-CoA desaturase 1upregulates basal thermogenesis but causes hypothermia in acold environment. J. Lipid Res. 45, 1674–1682
27. Guerra, C., Koza, R. A., Yamashita, H., Walsh, K., and Kozak,L. P. (1998) Emergence of brown adipocytes in white fat in miceis under genetic control: effects on body weight and adiposity.J. Clin. Invest. 102, 412–420
28. Barnett, S. A., and Dickson, R. G. (1984) Milk production andconsumption and growth of young of wild mice after tengenerations in a cold environment. J. Physiol. 346, 409–417
29. Goudriaan, J. R., Tacken, P. J., Dahlmans, V. E., Gijbels, M. J.,van Dijk, K. W., Havekes, L. M., and Jong, M. C. (2001)Protection from obesity in mice lacking the VLDL receptor.Arterioscler. Thromb. Vasc. Biol. 21, 1488–1493
30. Ross, S. R., Graves, R. A., and Spiegelman, B. M. (1993)Targeted expression of a toxin gene to adipose tissue: trans-genic mice resistant to obesity. Genes Dev. 7, 1318–1324
31. Moitra, J., Mason, M. M., Olive, M., Krylov, D., Gavrilova, O.,Samuels-Marcus, B., Feigenbaum, L., Lee, E., Aoyama, T.,Eckhaus, M., Reitman, M. L., and Vinson, C. (1998) Life withoutwhite fat: a transgenic mouse. Genes Dev. 12, 3168–3181
32. Shimomura, I., Hammer, R. E., Richardson, J. A., Ikemoto, S.,Bashmakov, Y., Goldstein, J. L., and Brown, M. S. (1998) Insulinresistance and diabetes mellitus in transgenic mice expressingnuclear SREBP-1c in adipose tissue: model for congenital gen-eralized lipodystrophy. Genes Dev. 12, 3182–3194
12 Vol. 22 November 2008 NIKONOVA ET AL.The FASEB Journal
33. Danforth, E., Jr. (2000) Failure of adipocyte differentiationcauses type II diabetes mellitus? Nat. Genet. 26, 13
34. Hotamisligil, G. S., Shargill, N. S., and Spiegelman, B. M. (1993)Adipose expression of tumor necrosis factor-�: direct role inobesity-linked insulin resistance. Science 259, 87–91
35. Lang, C. H., Dobrescu, C., and Bagby, G. J. (1992) Tumornecrosis factor impairs insulin action on peripheral glucosedisposal and hepatic glucose output. Endocrinology 130, 43–52
36. Feinstein, R., Kanety, H., Papa, M. Z., Lunenfeld, B., andKarasik, A. (1993) Tumor necrosis factor-� suppresses insulin-induced tyrosine phosphorylation of insulin receptor and itssubstrates. J. Biol. Chem. 268, 26055–26058
37. Hotamisligil, G. S. (2006) Inflammation and metabolic disor-ders. Nature 444, 860–867
38. Tontonoz, P., Hu, E., and Speigelman, B. M. (1994) Stimulationof adipogenesis in fibroblasts by PPAR�2, a lipid-activatedtranscription factor. Cell 79, 1147–1156
39. Rosen, E. D., and Spiegelman, B. M. (2000) Molecular regula-tion of adipogenesis. Annu. Rev. Cell Dev. Biol. 16, 145–171
40. Barak, Y., Nelson, M. C., Ong, E. S., Jones, Y. Z., Ruiz-Lozano, P.,Chien, K. R., Koder, A., and Evans, R. M. (1999) PPAR� isrequired for placental, cardiac, and adipose tissue development.Mol. Cell 4, 585–595
41. Rosen, E. D., Sarraf, P., Troy, A. E., Bradwin, G., Moore, K.,Milstone, D. S., Spiegelman, B. M., and Mortensen, R. M. (1999)PPAR� is required for the differentiation of adipose tissue invivo and in vitro. Mol. Cell 4, 611–617
42. Ren, D., Collingwood, T. N., Rebar, E. J., Wolffe, A. P., andCamp, H. S. (2002) PPAR� knockdown by engineered transcrip-tion factors: exogenous PPAR�2 but not PPAR�1 reactivatesadipogenesis. Genes Dev. 16, 27–32
43. Graves, R. A., Tontonoz, P., and Spiegelman, B. M. (1992)Analysis of a tissue-specific enhancer: ARF6 regulates adipo-genic gene expression. Mol. Cell. Biol. 12, 1202–1208
44. Tontonoz, P., Hu, E., Graves, R. A., Budavari, A. I., andSpiegelman, B. M. (1994) mPPAR�2: tissue-specific regulator ofan adipocyte enhancer. Genes Dev. 8, 1224–1234
45. Sakai, T., Sakaue, H., Nakamura, T., Okada, M., Matsuki, Y.,Watanabe, E., Hiramatsu, R., Nakayama, K., Nakayama, K. I.,and Kasuga, M. (2007) Skp2 controls adipocyte proliferationduring the development of obesity. J. Biol. Chem. 282, 2038–2046
46. Murphy, D. J., and Vance, J. (1999) Mechanisms of lipid-bodyformation. Trends Biochem. Sci. 24, 109–115
47. Carter, P., and Wells, J. A. (1988) Dissecting the catalytic triad ofa serine protease. Nature 332, 564–568
48. Lass, A., Zimmermann, R., Haemmerle, G., Riederer, M.,Schoiswohl, G., Schweiger, M., Kienesberger, P., Strauss, J. G.,Gorkiewicz, G., and Zechner, R. (2006) Adipose triglyceridelipase-mediated lipolysis of cellular fat stores is activated byCGI-58 and defective in Chanarin-Dorfman Syndrome. CellMetab. 3, 309–319
Received for publication March 14, 2008.Accepted for publication June 19, 2008.
13MEST AND FAT MASS EXPANSION