Task Force on Incomes and Adjustment in the Atlantic Fishery
118
Prepared for the Task Force on Incomes and Adjustment in the Atlantic Fishery
-
Upload
khangminh22 -
Category
Documents
-
view
2 -
download
0
Transcript of Task Force on Incomes and Adjustment in the Atlantic Fishery

Prepared for the
Task Force on Incomes and Adjustment in the Atlantic Fishery
Published by:
Communications Directorate Department of Fisheries and Oceans Ottawa, Ontario KlA 0E6
DF0/4937
©Minister of Supply and Services Canada 1993 Cat. No. Fs 41-40/5-1993E ISBN 0-662-21158-8
Les textes en français sont disponibles sur demande
Printed on Recycled Paper
The Fish Processing Sector in Atlantic Canada: Financial Performance and Sustainable Core
by
W. P. Moore, Debora Walsh Iona Worden, J. D. MacDonald
Coopers & Lybrand
April, 1993
The views expressed in this paper are the responsibility of the authors and do not necessarily reflect the views of the Task Force or the Government of Canada.

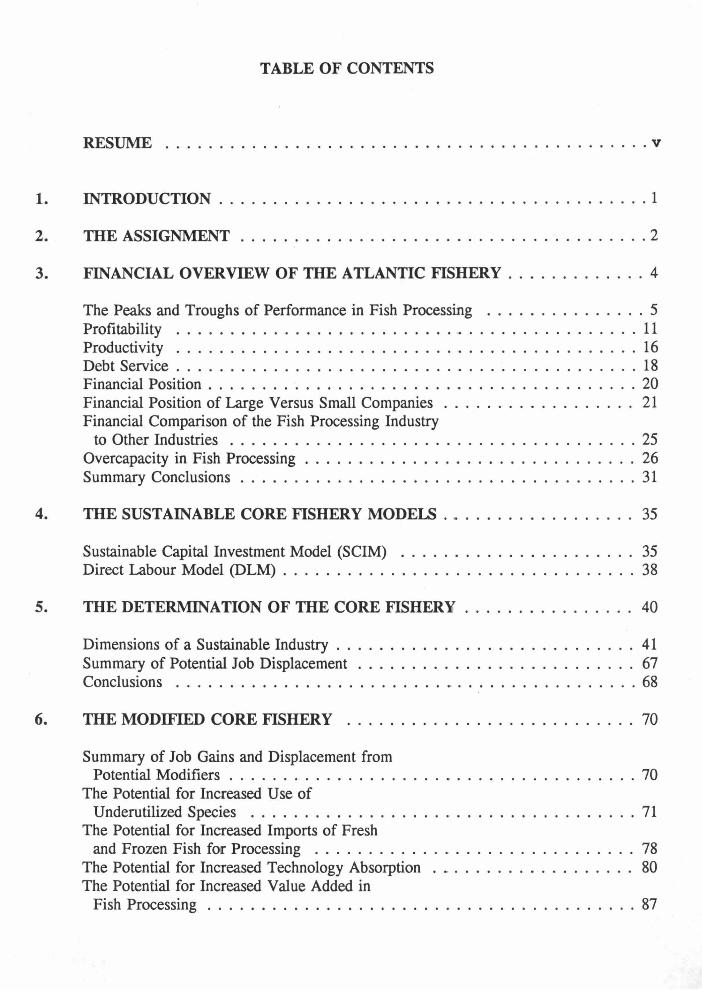
TABLE OF CONTENTS
RESUME ............................................. V
1. INTRODUCTION ........................................ 1
2. THE ASSIGNMENT ...................................... 2
3. FINANCIAL OVERVIEW OF TIIE ATLANTIC FISHERY ............. 4
The Peaks and Troughs of Performance in Fish Processing . . . . . . . . . . . . . . . 5 Profitability . . . . . . . . . . . . . . . . . . . . . . . . . . . . . . . . . . . . . . . . . . . 11 Productivity ........................................... 16 Debt Service . . . . . . . . . . . . . . . . . . . . . . . . . . . . . . . . . . . . . . . . . . . 18 Financial Position . . . . . . . . . . . . . . . . . . . . . . . . . . . . . . . . . . . . . . . . 20 Financial Position of Large Versus Small Companies . . . . . . . . . . . . . . . . . . 21 Financial Comparison of the Fish Processing Industry
to Other Industries .. ...... .............................. 25 Overcapacity in Fish Processing . . . . . . . . . . . . . . . . . . . . . . . . . . . . . . . 26 Summary Conclusions . . . . . . . . . . . . . . . . . . . . . . . . . . . . . . . . . . . . . 31
4. THE SUSTAINABLE CORE FISHERY MODELS . • ................ 35
Sustainable Capital Investment Model (SCIM) . . . . . . . . . . . . . . . . . . . . . . 35 Direct Labour Model (DLM) ................................. 38
5. THE DETERMINATION OF THE CORE FISHERY . . . . . . . . . . . . . . . . 40
Dimensions of a Sustainable Industry . . . . . . . . . . . . . . . . . . . . . . . . . . . . 41 Summary of Potential Job Displacement . . . . . . . . . . . . . . . . . . . . . . . . . . 67 Conclusions . . . . . . . . . . . . . . . . . . . . . . . . . . . . . . . . . . . . . . . . . . . 68
6. THE MODIFIED CORE FISHERY . . . . . . . . . . . . . . . . . . . . . . . . . . . 70
Summary of Job Gains and Displacement from Potential Modifiers . . . . . . . . . . . . . . . . . . . . . . . . . . . . . . . . . . . . . . 70
The Potential for Increased Use of Underutilized Species .................................... 71
The Potential for Increased Imports of Fresh and Frozen Fish for Processing . . . . . . . . . . . . . . . . . . . . . . . . . . . . . . 78
The Potential for Increased Technology Absorption . . . . . . . . . . . . . . . . . . . 80 The Potential for Increased Value Added in
Fish Processing . . . . . . . . . . . . . . . . . . . . . . . . . . . . . . . . . . . . . . . . 87

APPENDICES
APPENDIX 1: TABLE OF CONTENTS FOR REPORT ONE, TWO AND THREE ... 89
APPENDIX II: MONTHLY DISTRIBUTION OF TIER 1, 2, AND 3 JOBS, 1990 .... 93
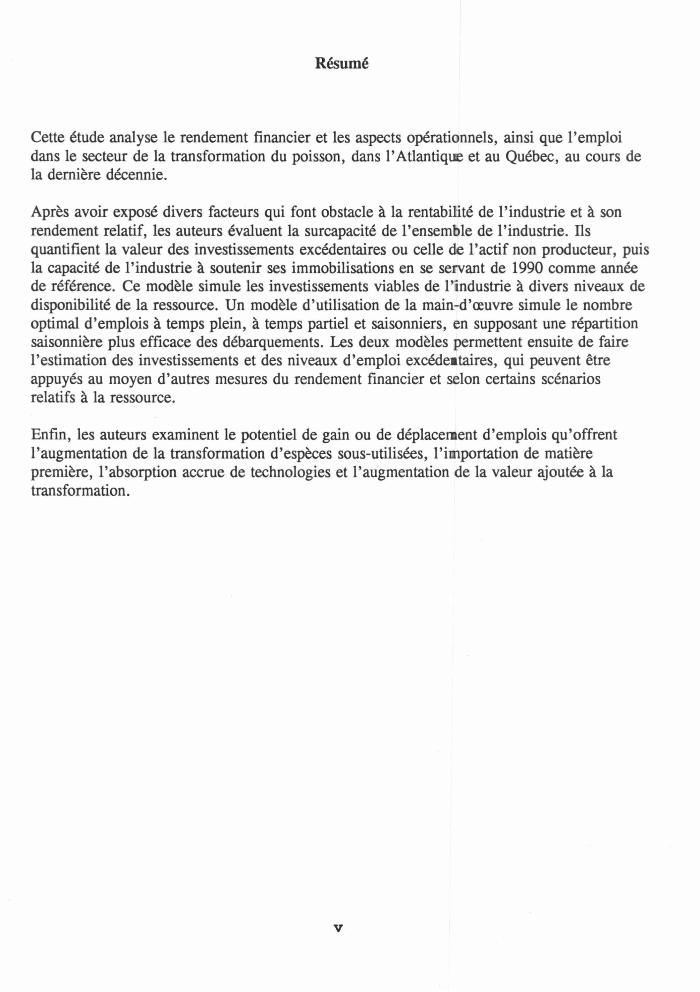
Résumé
Cette étude analyse le rendement financier et les aspects opérationnels, ainsi que l'emploi dans le secteur de la transformation du poisson, dans l'Atlantique et au Québec, au cours de la dernière décennie.
Après avoir exposé divers facteurs qui font obstacle à la rentabilité de l'industrie et à son rendement relatif, les auteurs évaluent la surcapacité de l'ensemble de l'industrie. Ils quantifient la valeur des investissements excédentaires ou celle de l'actif non producteur, puis la capacité de l'industrie à soutenir ses immobilisations en se servant de 1990 comme année de référence. Ce modèle simule les investissements viables de l'industrie à divers niveaux de disponibilité de la ressource. Un modèle d'utilisation de la main-d'œuvre simule le nombre optimal d'emplois à temps plein, à temps partiel et saisonniers, en supposant une répartition saisonnière plus efficace des débarquements. Les deux modèles permettent ensuite de faire l'estimation des investissements et des niveaux d'emploi excédeataires, qui peuvent être appuyés au moyen d'autres mesures du rendement financier et selon certains scénarios relatifs à la ressource.
Enfin, les auteurs examinent le potentiel de gain ou de déplacement d'emplois qu'offrent l'augmentation de la transformation d'espèces sous-utilisées, l'importation de matière première, l'absorption accrue de technologies et l'augmentation de la valeur ajoutée à la transformation.
V
1. INTRODUCTION
In March 1992 the Minister of Fisheries, Mr. John Crosbie, and the Minister for Employment and Immigration, Mr. Bernard Valcourt, announced the membership and terms of reference for the Task Force on Incarnes and Adjustment in the Atlantic fishery. This action was spurred by the 1991 Atlantic groundfish catch failure which highlighted the need to address the problem of overcapacity and unstable incarnes in the fishing industry. The mandate of the Task Force, chaired by Richard Cashin and including members of the Atlantic business, legal, and academic community, is to develop a comprehensive long term strategy for the industry that will work towards stability and profitability for the industry's participants.
2. THE ASSIGNMENT
The Fisheries and Marine Group of Coopers & Lybrand Consulting Group were contracted by the Task Force through Fisheries and Oceans (DFO) to undertake a comprehensive review and analysis of the fish processing sector in Atlantic Canada. The principal objectives of the assignment were:
• to document and analyze the activity and performance, both financial and operational, of the fish processing industry and certain aspects of fisb harvesting for the period 1977 to 1990;
• to utilize the output of that analysis to develop two predictive models that would estimate the level of sustainable capital investment possible and optimum for the fish processing industry or the core fishery, a measure of overcapacity that the sustainable capital investment implied, and an optimal labour utilization scenario; and
• to then further modify these scenarios for possible future changes in resource availability, technology change, and increased value added which is described as the modified core.
While the work of the Task Force was precipitated by the crisis in the groundfish fishery, the analysis undertaken by Coopers & Lybrand includes all species of groundfish, pelagics, and molluscs and crustaceans.
The vast majority of the information and detailed data used in this report is data collected on a regular or special purpose basis by Fisheries and Oceans. The data has been presented here in its original form or is utilized to derive other indicators of the industry. Coopers & Lybrand is cognizant of the weaknesses of much of this data, a fact which has been confirmed by DFO, and bas highlighted potential problems or margins of error where possible. It is certain that the precision and validity of the analysis undertaken in this report is a function of, and therefore lirnited by, the quality of the original data. While no estimate is made of the margin of error overall resulting from errors and omissions in the data, Coopers & Lybrand is confident that the information presented is the best available and does not materially impede the intended output of this undertaking.
The results of this review are presented in three separate documents as follows:
• Report One, which includes the financial overview of the industry, the core fishery, and the modified core;
• Report Two, which documents the historical review of the industry, including the trends and dynarnic of the Atlantic industry and a comparison of certain aspects of the Atlantic Canadian fish processing sector with Iceland and Norway; and
• Report Three, which contains the models employed in this analysis as well as a user's guide to their structure and utilization.
A detailed Table of Contents for all three reports is found in Appendix 1. It is strongly recommended that this document be read in conjonction with the two companion reports.
Note to Reader:
Report Three was not published as a Task Force Background Study. However, several copies have been deposited with the Department of Fisheries and Oceans Library in Ottawa.
3. FINANCIAL OVERVIEW OF THE ATLANTIC FISHERY
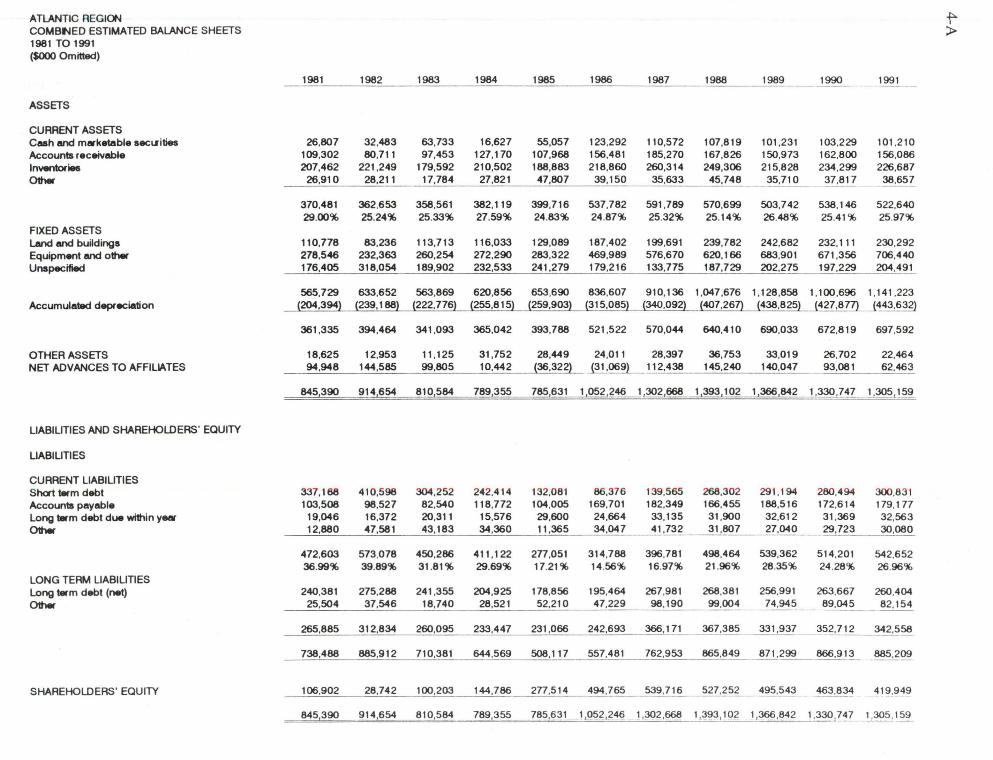
The following analysis is based on combined industry balance sheet and incarne profiles for the eleven year period 1981 to 1991. The figures provided for the period 1981 to 1987 are based on detailed aggregated financial statement data provided by Statistics Canada for the fish processing industry. This information, based on data from 300 to 400 companies each year, captured a significant majority of the industry, ranging from 98.27% to 121.68%1
• To provide continuity, the data was adjusted to reflect the total industry.
Since 1987, however, Statistics Canada has discontinued collecting detailed financial information from the fish processing industry in the same format or the same sample size. The financial profiles from 1988 to 1991, therefore, have been generated using regression and other analysis, using data from several sources:
• Dun & Bradstreet (D&B) detailed aggregated industry financial data covering 1987 to 1991, generally dealing with small and medium-sized companies in fish processing;
• ail of Canada's major chartered banks, and any other lender or institution having a loan portfolio in the fish processing industry (data collected by survey by Coopers & Lybrand);
• lndustry, Science & Technology (ISTC) data related to capital investment and fixed asset investment, covering the period 1981 to 1991;
• Fisheries & Oceans (DFO) data dealing with production volumes, and unit values for landings and production; and,
• the financial statements for the large public companies operating in the industry, specifically covering the period 1984 to 1991.
Reference was also made to aggregated data contained in a 1992 study by Peat Marwick, related to Newfoundland companies directly affected by the Northern cod crisis.
1 The financial data utilized was known to include non-domestic activity which has been estimated and accounted for.
4
ATLANTIC REGION f'" COMBNED ESTIMATED BALANCE SHEETS > 1981 TO 1991 ($000 Omitted)
1981 1982 1983 1984 1985 1986 1987 1988 1989 1990 1991
ASSETS
CURRENT ASSETS Cash and market.able aecll'ities 26,807 32,483 63,733 16,627 55,057 123,292 110,572 107,819 101,231 103,229 101 ,210 Accounts receivable 109,302 80,711 97,453 127,170 107,968 156,481 185,270 167,826 150,973 162,800 156,086 Inventories 207,462 221 ,249 179,592 210,502 188,883 218,860 260,314 249,306 215,828 234,299 226,687 Other 26,910 28,211 17,784 27,821 47,807 39,150 35,633 45,748 35,710 37,817 38,657 -------
370,481 362,653 358,561 382,119 399,716 537,782 591 ,789 570,699 503,742 538,146 522,640 29.00% 25.24% 25.33% 27.59% 24.83% 24.87% 25.32% 25.14% 26.48% 25.41% 25.97%
FIXED ASSETS Land and buildings 110,778 83,236 113,713 116,033 129,089 187,402 199,691 239,782 242,682 232,111 230,292 Equipment and other 278,546 232,363 260,254 272,290 283,322 469,989 576,670 620,166 683,901 671,356 706,440 Unapecified 176,405 318,054 189,902 232,533 241,279 179,216 133,775 187,729 202,275 197,229 204,491
565,729 633,652 563,869 620,856 653,690 836,607 910,136 1,047 ,676 1,128,858 1,100,696 1,141 ,223 Accumulatlld depreciation (204,394) (239,188) (222,776) (255,815) (259,903) (315,085) (340,092) (407,26Z) (438,825) (427,87Z) 443,632
361,335 394,464 341,093 365,042 393,788 521,522 570,044 640,410 690,033 672,819 697,592
OTHER ASSETS 18,625 12,953 11, 125 31,752 28,449 24,011 28,397 36,753 33,019 26,702 22,464 NET ADVANCES TO AFFILIATES 94,948 144,585 99,805 10,442 (36,322) (31 ,069) 112,438 145,240 140,047 93,081 62,463
845,390 914,654 810,584 789,355 785,631 1,052 ,246 1,302 ,668 1,393,102 1,366 ,842 1,330 ,747 1 ,30~159
LIABILITIES AND SHAREHOLDERS' EQUITY
LIABILITIES
CURRENT LIABILITIES Short wm debt 337, 168 41 0,598 304,252 242,4 14 132,081 86,376 139,565 268,302 291 ,194 280,494 300,831 Accounts payable 103,508 98,527 82,540 118,772 104,005 169,701 182,349 166,455 188,516 172,614 179,177 Long wm debt due within YNI 19,046 16,372 20,311 15,576 29,600 24,664 33,135 31 ,900 32,612 31 ,369 32,563 Other 12,880 47,581 43,183 34,360 11,365 34,047 41,732 31,807 27,040 29,723 30,080
472,603 573,078 450,286 411 ,122 277,051 314,788 396,781 498,464 539,362 514 ,201 542,652 36.99% 39.89% 31.81% 29.69% 17.21% 14.56% 16.97% 21 .96% 28.35% 24.28% 26.96%
LONG TERM LIABILITIES Long wm debt (net) 240,381 275,288 241 ,355 204,925 178,856 195,464 267,981 268,381 256,991 263,667 260,404 Other 25,504 37,546 18,740 28,521 52,210 47,229 98,190 99,004 74,945 89,045 - 82,154
265,885 312,834 260,095 233,447 231,066 242,693 366,171 367,385 331,937 352,712 342,558
738,488 885,912 710,381 644,569 508,117 557.481 762,953 865,849 871.~ 866,913 885,209
SHAREHOLDERS' EQUITY 106,902 28,742 100,203 144,786 277,514 494,765 539,716 527,252 495,543 - 463 .~~ 419,949
845 390 914,654 810,584 789 355 785,631 1~,246 . J . 3()2 .~ 1 ,~93 , 102 1,366,842 1 , 330,7~ ~305 , 159
For the period 1981 to 1987, base financial data represented approximately 80% to 100% of actual annual industry activity based on value of revenues, and therefore required only minor annual adjustment to develop profiles covering the entire industry.
For the period 1988 to 1991, base data represented approximately 50% to 60% of actual annual industry activity, and therefore required somewhat greater adjustment.
Therefore, base data in any given year represented at least 50% of total industry activity. Further, certain bench-mark data was obtained, particularly related to fixed asset investment (ISTC) and debt (financial institutions).
The result of this analysis is a series of annual profiles, considered to be representative of the industry, and covering the period 1981 to 1991.
While these financial profiles are presented in financial statement form, they do not purport to represent the actual aggregated financial statements of the participants in the industry. Therefore, any reference to the data, taken outside the context of this analysis, may not be suitable for other purposes and may in fact be misleading.
The following will focus on providing a financial picture of the Atlantic fishery. Specifically, the analysis will review the profitability, productivity, debt service capacity, and financial position of the whole industry. This analysis will be further refined with a commentary on the distinct financial position differences between small and large companies and a financial comparison of fish processing to other industries. Finally, the issue of overcapacity will be analyzed and discussed at length with summary conclusions for the section overall.
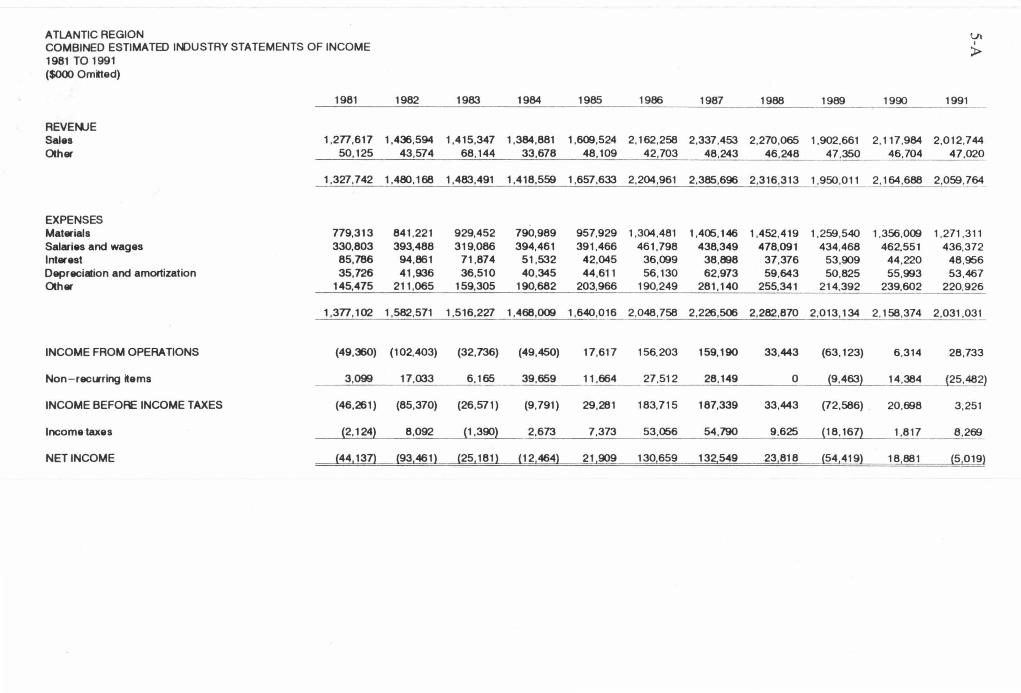
Numbers contained within brackets represent lasses or negative amounts.
The Peaks and Troughs of Performance In Fish Processing
A detailed financial analysis for the Atlantic fishing industry is presented in this report for the eleven year period 1981 to 1991. To further the understanding of the dynamic of the industry, certain critical "windows" representing the commonly identified peaks and troughs in the industry in recent times, in particular since extension of the Canadian fishing zone to 200 miles in 1977, are highlighted. In addition to the information provided on the common drivers of
• exchange rates • interest rates • U.S. per capita consumption of seafood • resource availability (indexed to 1989)
ATLANTIC REGION VI COMBINED ESTIMATED l~USTRY STATEMENTS OF INCOME 1
> 1981 TO 1991 ($000 Om~ed)
1981 1982 1983 1984 1985 1986 1987 1988 1989 1990 1991
REVEt>UE Sales 1.2n.611 1,436,594 1,415,347 1,384,881 1,609,524 2,162,258 2,337,453 2,270,065 1,902,661 2,117,984 2,012.744 Other 50, 125 43,574 68,144 33,678 48, 109 42,703 48,243 46,248 47,350 46,704 47,020
1,327,742 1 .4~ . 168 1,483,491 1,418,559 1,657,633 2,204,961 2,385,696 2,316,313 1,950,011 2,164,688 2,059,764
EXPENSES Materials 779,313 841 ,221 929,452 790,989 957,929 1,304,481 1,405, 146 1,452,419 1,259,540 1,356,009 1,271 ,311 Salaries and wages 330,803 393,488 319,086 394,461 391,466 461,798 438,349 478,091 434,468 462,551 436,372 Inter est 85,786 94,861 71.874 51,532 42,045 36,099 38,898 37,376 53,909 44,220 48,956 Depreciation and amortization 35,726 41,936 36,510 40,345 44,611 56,130 62,973 59,643 50,825 55,993 53,467 Other 145,475 211 ,065 159,305 190,682 203,966 190,249 281 ,140 255,341 214,392 239,602 220,926
1,3n.102 1,582,571 1,516,227 1,468,009 1,640,016 2,048,758 2,226,506 2,282,870 2,013,134 2, 158,374 2,031 ,031
INCOME FROM OPERATIONS (49,360) (102,403) (32,736) (49,450) 17,617 156,203 159,190 33,443 (63 ,123) 6 ,314 28,733
Non - recll'ring items 3 ,099 17,033 6 ,165 39,659 11 ,664 27,512 28,149 0 (9,463) 14,384 (25,482)
INCOME BEFOAE INCOME TAXES (46,261) (85,370) (26,571) (9,791) 29,281 183,715 187,339 33,443 (72 ,586) 20,698 3 ,251
lncome taxes (2, 124) 8,092 (1 ,390) 2,673 7,373 53,056 54,790 9.625 (18, 167) 1,817 8,269
NETINCOME (44, 137) (93,461) (25,181) (12,464) 21 ,909 130,659 132,549 23,818 (54,419) 18,881 (5 ,019)
information is provided on the general industry environment for these periods. It is intended to provide the reader with a more complete understanding of the industry dynamic during these periods of extreme variation in industry performance.
A Trough • The Groundfish Industry Crisis 1980 - 1981
The financial pressures that were brought to bear on the Atlantic coast fishing companies in the early 1980s were the result, in part, of the extended debt loads resulting from the industry's general overly enthusiastic response and highly optimistic expectations of extension of Canada's fishing zone to 200 miles in 1977. Spurred by government incentives (it is reported that in 1980 $46 million of the $157 million invested in fish processing was provided by government agencies), companies significantly increased their investment in fishing fleets and plants, investment that was financed largely through borrowing. It was the practice at the time to maintain, and finance, large inventories of frozen groundfish as companies aggressively harvested groundfish resources in the early part of the year to ensure as large a share of the established quota as possible. These practices, when combined with unprecedented interest rates and other unfavourable external factors, led to the financial crisis of 1980 -1981.
This financial crisis saw the closure of plants, the lay-off of thousands of workers, and the severe financial distress of many of the key industry players. In 1980 it was reported that at least 50% of fish processing companies were losing money; by 1981 the estimate had increased to 70% of the industry. For the Atlantic Canada industry the crisis was characterised by:
• severely weakened financial positions resulting from increasing costs in the face of declining market prices. The attached Combined Estimated Industry Statements of Incarne show a collective net incarne loss in 1981 of $44 million;
• increasing groundfish harvests. Total groundfish landings in 1981 were 27% higher than 1978;
• despite falling prices, labour and other costs were increasing and significantly decreasing gross margins;
• huge groundfish inventory build up as the U.S. market for groundfish, on which the industry was highly dependent, softened;
• unprecedented interest rates, nearing 20% which made the cost of doing business, especially carrying inventory, extremely high;
• significantly expanded debt load of the fishing companies due, in large part to the expansionary environment fed by the promise of the 200 mile extension, very
~·
optimistic projections on future resource availability, and the existence of several incentive programs to expand fish processing capacity;
• a competitive fishing environment that did not allow a planned harvest of fish in response to market conditions as is the case under the existing Enterprise Allocation program; and
• exchange rates that ranged between $0.855 - .834.
In response to the distress, the government struck the Kirby Commission to recommend on "how to achieve and maintain a viable Atlantic fishing industry" the result of which was an operational and financial restructuring of the industry. The Commission created two super-companies with improved balance sheets; a costly re-configuration that was intended to bolster the industry to withstand the inevitable cyclical downturns. The restructuring was completed in 1984 and the restructured companies, National Sea Products, and Fishery Products International soon entered into the heyday of the fishery, the boom period of 1986 -1987.
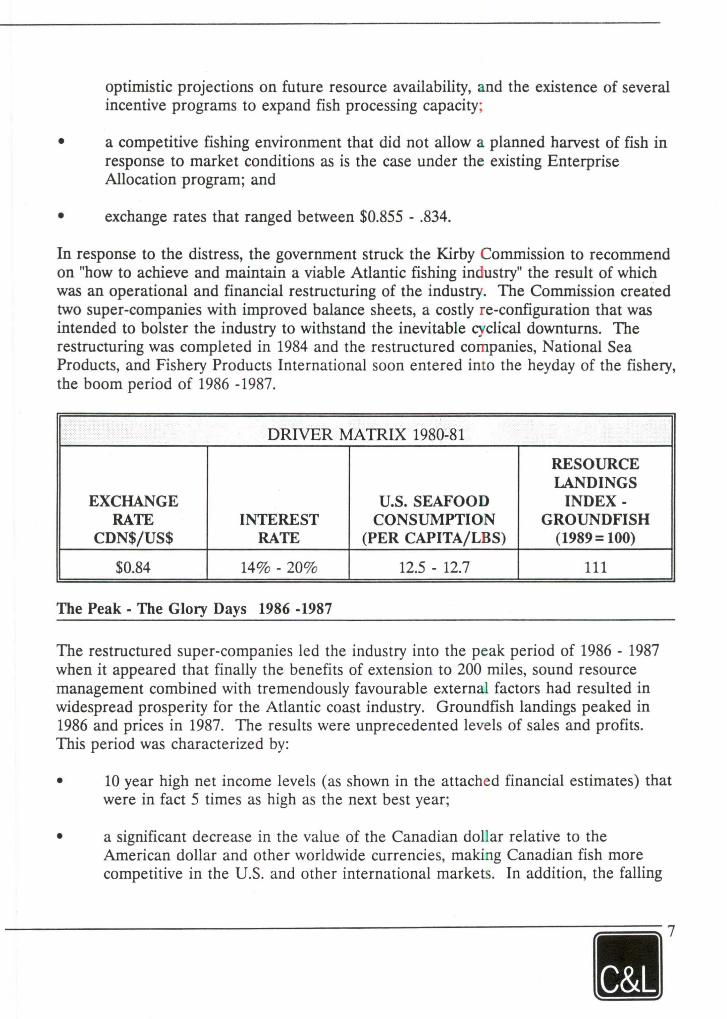
DRIVER MATRIX 1980-81
RESOURCE LANDINGS
EX CHANGE U.S. SEAFOOD INDEX· RATE INTEREST CONSUMPTION GROUNDFISH
CDN$/US$ RATE (PER CAPITA/LBS) (1989= 100)
$0.84 14% - 20% 12.5 - 12.7 111
The Peak. The Glory Days 1986 -1987
The restructured super-cornpanies led the industry into the peak period of 1986 - 1987 when it appeared that finally the benefits of extension to 200 miles, sound resource management combined with trernendously favourable external factors had resulted in widespread prosperity for the Atlantic coast industry. Groundfish landings peaked in 1986 and prices in 1987. The results were unprecedented levels of sales and profits. This period was characterized by:
• 10 year high net incarne levels (as shown in the attached financial estirnates) that were in fact 5 tirnes as high as the next best year;
• a significant decrease in the value of the Canadian dollar relative to the American dollar and other worldwide currencies, rnaking Canadian fish more cornpetitive in the U.S. and other international markets. In addition, the falling
Canadian dollar meant that processors, paid in U.S. dollars, could bank more Canadian dollars for each U.S. dollar earned;
• major expansions in international sales of seafood outside the U.S., in particular in Japan where groundfish sales alone expanded by 65% in 1986 from 15,800 tonnes to 24,000 tonnes;
• significant expansion in the food service in the U.S. that was supplied by Atlantic Canadian fish;
• tight supply situations for most groundfish species, i.e. U.S. Atlantic groundfish landings fell by 10,000 tonnes in 1986;
• increasing demand for seafood in the U.S. market. U.S. per capita seafood consumption was on the rise and increased from 15.1 in 1985 to 16.2 in 1987. With a population of 240 million this represented a staggering 3.8 billion pounds of seafood to be consumed;
• rapidly increasing market prices for most seafood products;
• an apparently healthy resource with Atlantic groundfish landings experiencing an eight year high; and
• the introduction of enterprise allocations for the offshore companies allowing controlled, market driven harvesting plans and reduced inventories.
Canadian exports of seafood totalled $2.4 billion (591 thousand tonnes) in 1986 compared to $1.8 billion (556 thousand tonnes) for 1985, an increase of 33% in value and 6% in volume. In 1986 groundfish exports totalled $988 million (285 thousand tonnes) compared to $750 million (262 thousand tonnes) in 1985, an increase of 32% in value and 5% in volume. Export prices increased, for example, on average by 30% for cod blacks, over 50% for frozen cod fillets and 15% for haddock.
Arnericans, still the primary market for Canadian seafood exports (roughly 70% of production), were eating more seafood and paying more for it. The preoccupation with healthy living, the stated benefits of fish consumption, the effects of the fifth year of sustained economic growth in the developed world buoyed seafood demand and prices despite falling prices for alternative proteins. Further support for the industry was provided when initial consumer resistance in the U.S. and Europe to increasing seafood prices was offset by decreases in supply allowing the price pbenomenon to continue into 1987.
•
~·
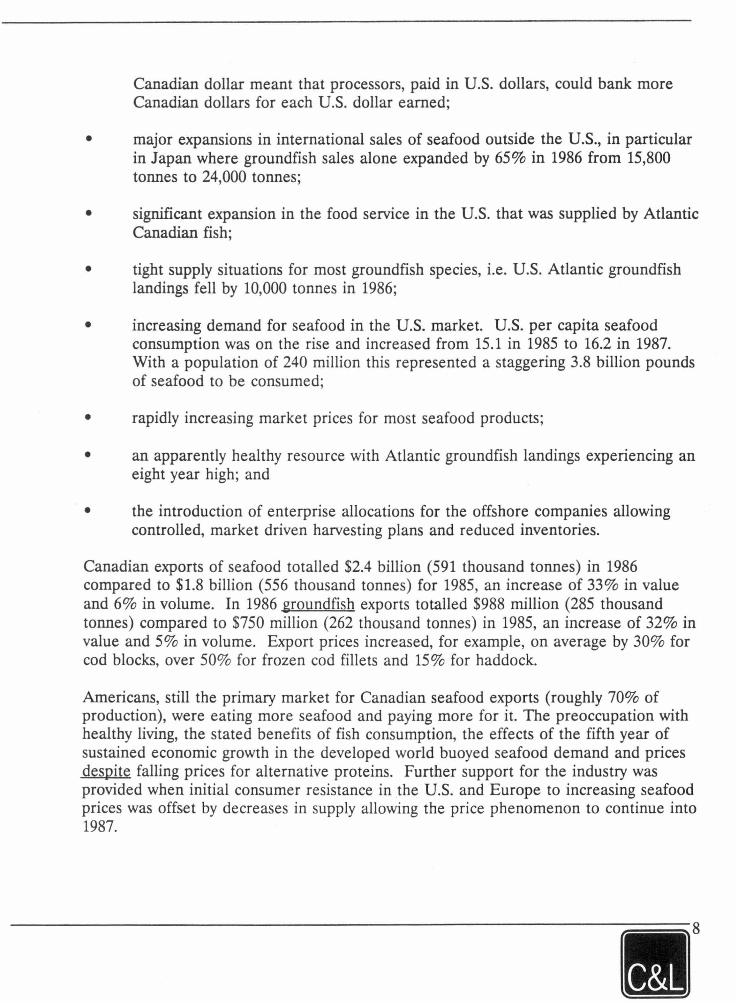
DRIVER MATRIX 1986-87
GROUNDFISH EX CHANGE US SEAFOOD LANDINGS
RATE INTEREST CONSUMPTION INDEX CDN$/US$ RATE (PER CAPITA/LBS.) 1989= 100
$0.737 10% 15.5 -16.2 113
A Trough - The Groundfish Industry Crisis 1991 -1992
The crisis facing the Atlantic coast groundfish industry today is one largely of a decline in resource availability and an overcapacity of fish processing capacity in the face of that decline. This falls hard on the heels of three years of, overall, a less than ideal, indeed challenging environment.
The post "boom", 1988 to 1990 period was characterized as follows:
• the industry had continued to expand its capacity but was diversifying, in some part, into other species such as redfish, shrimp and cultured salmon;
• a dramatic strengthening of the Canadian dollar against other currencies limited the competitiveness of Canadian fish products;
• declining demand for traditional groundfish products in the U.S. market despite the somewhat stable per capita seafood consumption. Americans were eating a wider variety of fish but were moving away from the higher-priced, traditional species;
• declining availability of traditional groundfish resource and the first indications that even more severe cuts in the Northern cod stock were likely;
• fall in the capacity utilization of processing facilities due to declines in resource availability, and plant closures (less than a decade after the initial restructuring);
• decreased groundfish prices ( except for an upturn in 1990) largely attributed to increasing competition from lower-cost substitute species such as the substantial quantities of Alaskan pollock being harvested by the newly Americanized fleet in Alaska (American pollock landings increased from 59,000 tonnes in 1986 to 150,000 tonnes in 1987), and the significant expansion in the aquaculture industry in species such as catfish;
• the beginning of real cost cutting measures in fish processing and upgrading of product mix to make the most of the fish resources available to the processing entities; and
• major realignment in the two major processing companies to rationalize harvesting and processing capacity which eliminated thousands of jobs in fish processing in Atlantic Canada.
The "crisis" years themselves 1991- 1992 were further characterized by:
• severely reduced access to groundfish resources in key stocks such as the Grand Banks and the Northern cod;
• extreme weather conditions that limited the offshore landings from an already reduced resource base for the offshore companies;
• failure of the inshore . fishery due to the extreme weather and ice conditions;
• continued recession in the United States, the principal market for Atlantic groundfish;
• further strengthening of the Canadian dollar relative to the U.S. resulting in lower Canadian dollar revenues for U.S. sales; and
• a softening of seafood consumption.
Once again the industry began to experience plant closures, significantly reduced throughput, and in some cases, significant lasses and financial distress. The problems of 1981 - high interest rates, a competitive fishery, high inventories - were reversed. In fact the industry is faced with interest rates at a twenty year low, most fisheries operating on ITQs or EAs, and virtually non-existent inventories; yet the industry persists in crisis.
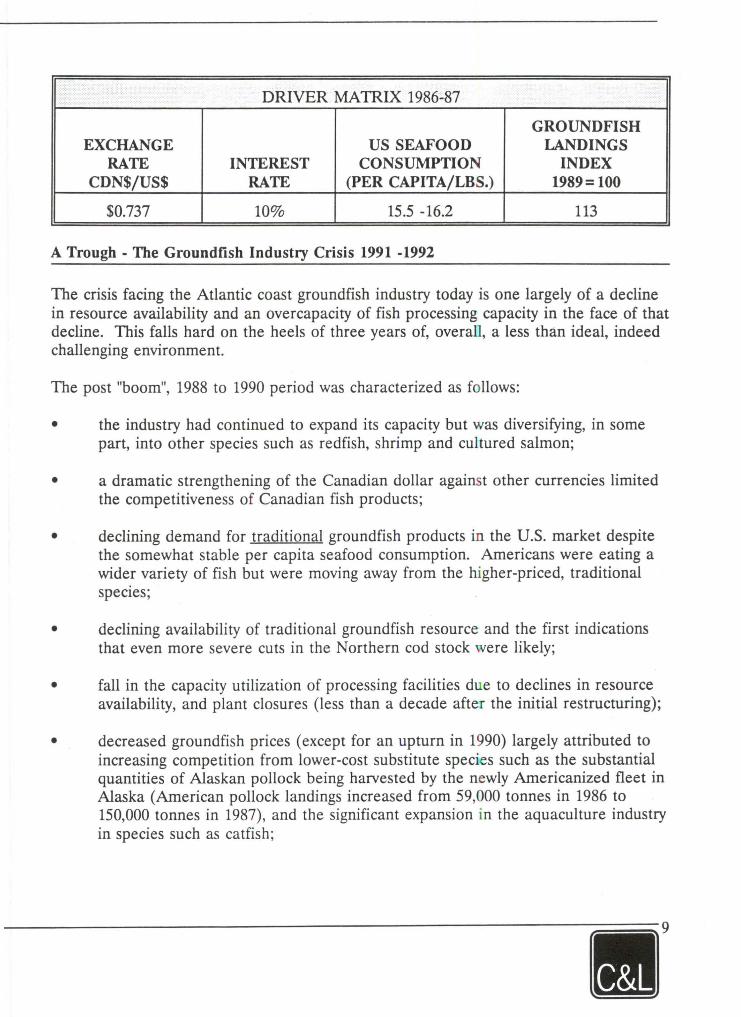
DRIVER MA TRIX 1990-91
EX CHANGE INTEREST US SEAFOOD GROUNDFISH RATE RATE CONSUMPTION LANDINGS
CDN$/US$ PER CAPITA/LBS INDEX 1989= 100
.865 10-13% 15.0 - 14.9 92
~·
Profitability
A review of profitability should consider: operating profitability, return on assets employed, and return on equity invested.
Operating Profitability
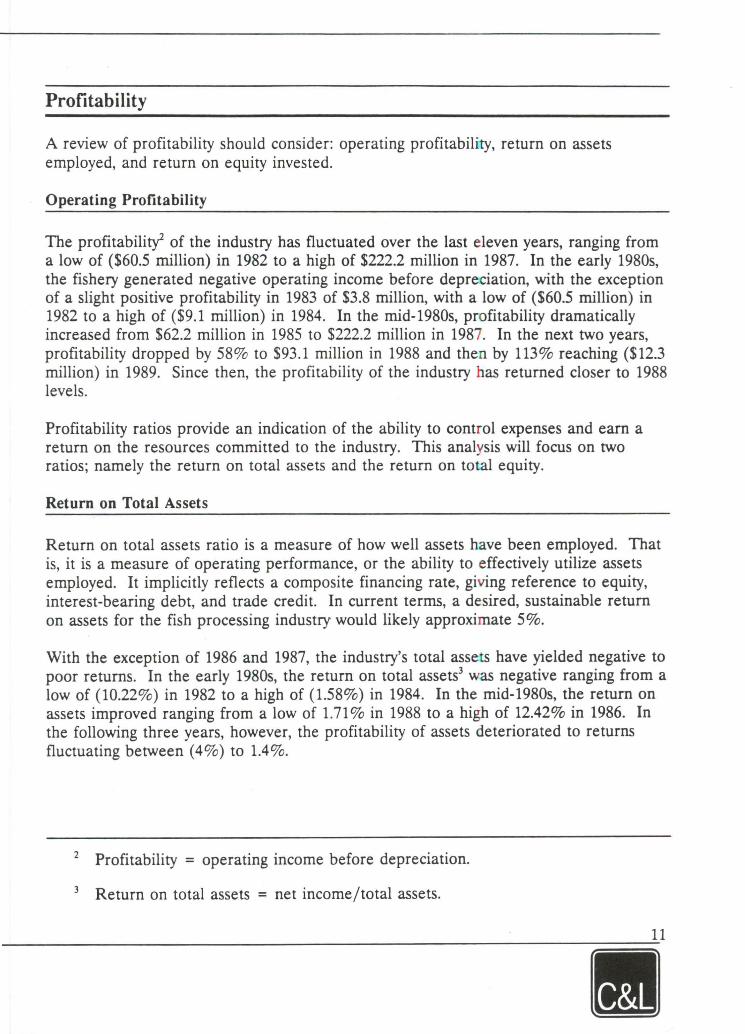
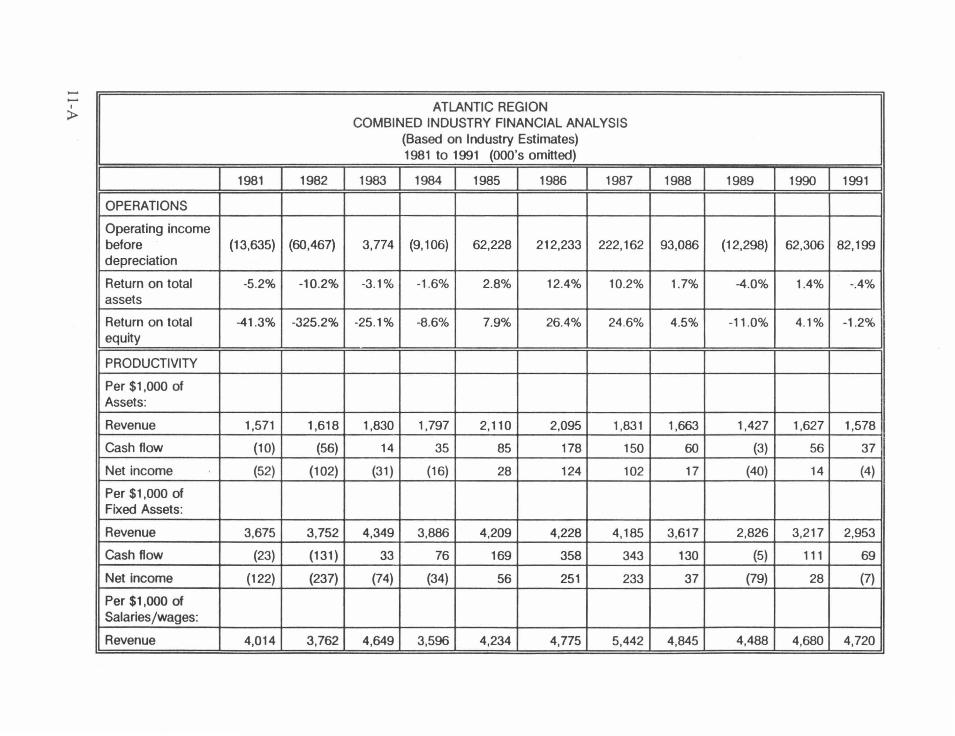
The profitability2 of the industry has fluctuated over the last eleven years, ranging from a low of ($60.5 million) in 1982 to a high of $222.2 million in 1987. In the early 1980s, the fishery generated negative operating incarne before depreciation, with the exception of a slight positive profitability in 1983 of $3.8 million, with a low of ($60.5 million) in 1982 to a high of ($9.1 million) in 1984. In the mid-1980s, profitability dramatically increased frorn $62.2 million in 1985 to $222.2 million in 1987. In the next two years, profitability dropped by 58% to $93.1 million in 1988 and then by 113% reaching ($12.3 million) in 1989. Since then, the profitability of the industry bas returned doser to 1988 levels.
Profitability ratios provide an indication of the ability to control expenses and earn a return on the resources committed to the industry. This analysis will focus on two ratios; namely the return on total assets and the return on total equity.
Return on Total Assets
Return on total assets ratio is a measure of how well assets have been employed. That is, it is a measure of operating performance, or the ability to effectively utilize assets employed. It implicitly reflects a composite financing rate, giving reference to equity, interest-bearing debt, and tracte credit. In current terrns, a desired, sustainable retum on assets for the fish processing industry would likely approximate 5%.
With the exception of 1986 and 1987, the industry's total assets have yielded negative to poor returns. In the early 1980s, the return on total assets3 was negative ranging from a low of (10.22%) in 1982 to a high of (1.58%) in 1984. In the mid-1980s, the retum on assets improved ranging from a low of 1.71 % in 1988 to a high of 12.42% in 1986. In the following three years, however, the profitability of assets deteriorated to returns fluctuating between ( 4%) to 1.4%.
2 Profitability = operating incarne before depreciation.
3 Return on total assets = net incarne/total assets.
ATLANTIC REGION COMBINED INDUSTRY FINANCIAL ANALYSIS
(Based on lndustry Estimates) 1981 to 1991 (OOO's omitted)
1981 1982 1983 1984 1985 1986 1987 1988 1989 1990 1991
OPERATIONS
Operating income before (13,635) (60,467) 3,774 (9, 106) 62,228 212,233 222,162 93,086 (12,298) 62,306 82, 199 depreciation
Return on total -5.2% -10.2% -3.1% -1 .6% 2.8% 12.4% 10.2% 1.7% -4.0% 1.4% -.4% assets
Return on total -41 .3% -325.2% -25.1% -8.6% 7.9% 26.4% 24.6% 4.5% -11.0% 4.1% -1.2% equity
PRODUCTIVITY
Per $1 ,000 of Assets:
Revenue 1,571 1,618 1,830 1,797 2,110 2,095 1,831 1,663 1,427 1,627 1,578
Cash flow (10) (56) 14 35 85 178 150 60 (3) 56 37
Net income (52) (102) (31) (16) 28 124 102 17 (40) 14 (4)
Per $1,000 of Fixed Assets:
Revenue 3,675 3,752 4,349 3,886 4,209 4,228 4,185 3,617 2,826 3,217 2,953
Cash flow (23) (131) 33 76 169 358 343 130 (5) 111 69
Net income (122) (237) (74) (34) 56 251 233 37 (79) 28 (7)
Per $1,000 of Salaries/wages:
Revenue 4,014 3,762 4,649 3,596 4,234 4,775 5,442 4,845 4,488 4,680 4,720
In conclusion, the industry bas been relatively unsuccessful in earning a reasonable rate of return on its assets.
Return on Total Equity
The return on total equity indicates the amount earned on the equity committed to the industry, and provides an indication of investment performance, or performance on capital at risk. This ratio is often used to choose from available investment options. In current terms, a low risk investment ( term deposits, government or large company bonds, T-bills) will yield returns between 7% and 10%, depending on term and liquidity. An at-risk investment, again depending on term and liquidity, will yield anywhere from 10% to 40+ %. A desired, sustainable return on equity for the fish processing industry would likely be a minimum of 15%, given industry structure, liquidity and relative risk.
Similar to the return on total assets, the industry's total equity yielded poor returns in the early 1980s. The return on total equity4 ranged from a low of (325%) to a high of (9%). In the mid-1980s, the return fluctuated between a low of 4.5% in 1988 to a high of 26.4% in 1986. In the following three years, the profitabi ty of equity also deteriorated to returns fluctuating between ( 11 % ) to 4%.
The industry bas been successful in meeting acceptable operating returns in only two of the eleven years under review.
Profitability Drivers
It has been generally held that profitability in the industry has been historically driven by two factors:
• interest rates; • US dollar exchange rates.
To draw conclusions as to profitability factors, changes in profitability were analyzed over the eleven year period 1981 to 1991.
The change in profitability in any given year can be attributed to one or more of the following factors:
4 Return on total equity = net incarne/total equity.
• interest effect; • exchange eff ect; • price effect (net of exchange); • cost effect (net of interest); and • volume effect
The interest effect determines the impact of changes in interest rates on the cost of carrying short and long term debt. The analysis examined bath imputed rates (actual interest costs over actual average debt values), and actual rates based on chartered bank prime rates. It was found that imputed rates closely tracked actual rates over the eleven years.
The exchange effect measures the impact of changes in the annual average exchange rate between the United States and Canada. The analysis assumes that 80% of Atlantic production value is exported to the US.
Price, cost and volume effect are essentially the results of variance analysis. The variance calculations isolate the impact of changes in factors such as selling prices, costs, and volume of production, and determine the impact of each of these factors on overall profitability in a given year.
Analysis of these factors accounts for all of the change in profitability from one year to another.
Analysis of these factors reveals that, contrary to conventional wisdom, the impact of changes in interest and exchange rates has not been nearly as profound as other factors.
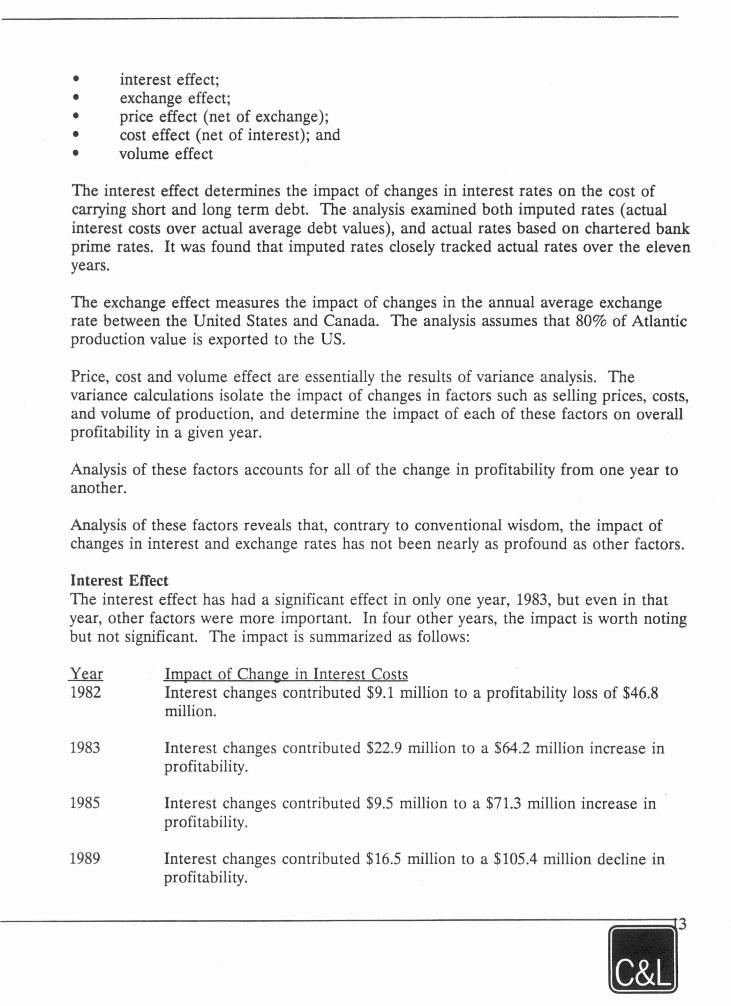
Interest Effect The interest effect has had a significant effect in only one year, 1983, but even in that year, other factors were more important. In four other years, the impact is worth noting but not significant. The impact is summarized as follows:
Year 1982
1983
1985
1989
Impact of Change in Interest Costs Interest changes contributed $9.1 million to a profitability loss of $46.8 million.
Interest changes contributed $22.9 million to a $64.2 million increase in profitability.
Interest changes contributed $9.5 million to a $71.3 million increase in profitability.
Interest changes contributed $16.5 million to a $105.4 million decline in profitability.
1990 Interest changes contributed $9.7 million to a $74.6 million increase in profitabili ty.
Exchange Effect Again, contrary to popular belief, the exchange effect bas been the predominant influencer in only three years. The impact is summarized as follows:
Y ear Impact of Change in Exchange Rates 1985 Exchange rate changes contributed $66.7 million to a profitability
improvement totalling $71.3 million.
1988 Exchange rate changes contributed $142.1 million to a total drop in profitability of $129 .1 million.
1989 Exchange rate changes contributed $59.9 million to a total drop in profitability of $105.4 million.
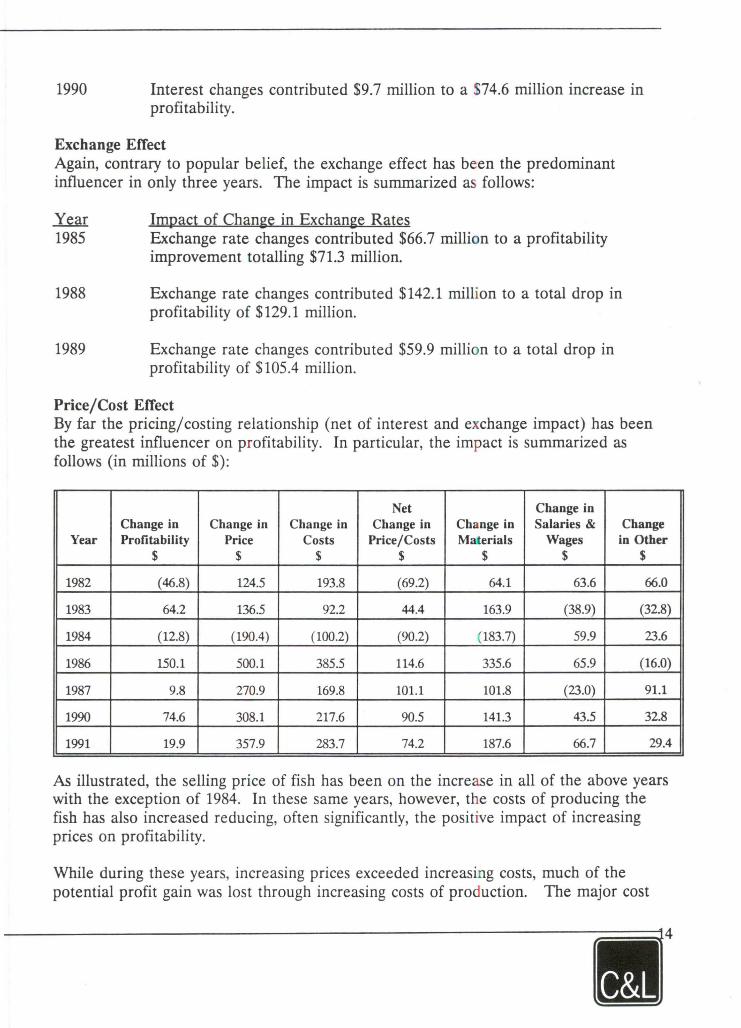
Price/Cost Effect By far the pricing/costing relationship (net of interest and exchange impact) bas been the greatest influencer on profitability. In particular, the impact is summarized as follows (in millions of$):
Net Change in Change in Change in Change in Change in Change in Salaries & Change
Year Profitability Price Costs Price/Costs Materials Wages in Other $ $ $ $ $ $ $
1982 (46.8) 124.5 193.8 (69.2) 64.1 63.6 66.0
1983 64.2 136.5 92.2 44.4 163.9 (38.9) (32.8)
1984 (12.8) (190.4) (100.2) (90.2) (183.7) 59.9 23.6
1986 150.1 500.1 385.5 114.6 335.6 65.9 (16.0)
1987 9.8 270.9 169.8 101.1 101.8 (23.0) 91.1
1990 74.6 308.1 217.6 90.5 141.3 43.5 32.8
1991 19.9 357.9 283.7 74.2 187.6 66.7 29.4
As illustrated, the selling price of fish has been on the increase in ail of the above years with the exception of 1984. In these same years, however, the costs of producing the fish has also increased reducing, often significantly, the positive impact of increasing prices on profitability.
While during these years, increasing prices exceeded increasing costs, much of the potential profit gain was lost through increasing costs of production. The major cost
driver in these years was, by far, the cost of materials which includes raw materials and other direct inputs. If the industry was able to take greater advantage of increasing prices, profitability could have been improved, often materially, over seven of the past ten years. In short, industry needs to improve their ability to control the costs of materials.
It is likely that the inability of industry to contain increasing material costs is, in part, a function of the processing overcapacity in the fishery. The intense competition for the purchase of limited resources drives up shore prices. A reduction in capacity, while certainly not eliminating increases in prices paid to fishermen, should help to contain the rate of change.
Volume EfTect Changes in levels of production have not, by themselves, been a significant determinant of profitability in any year.
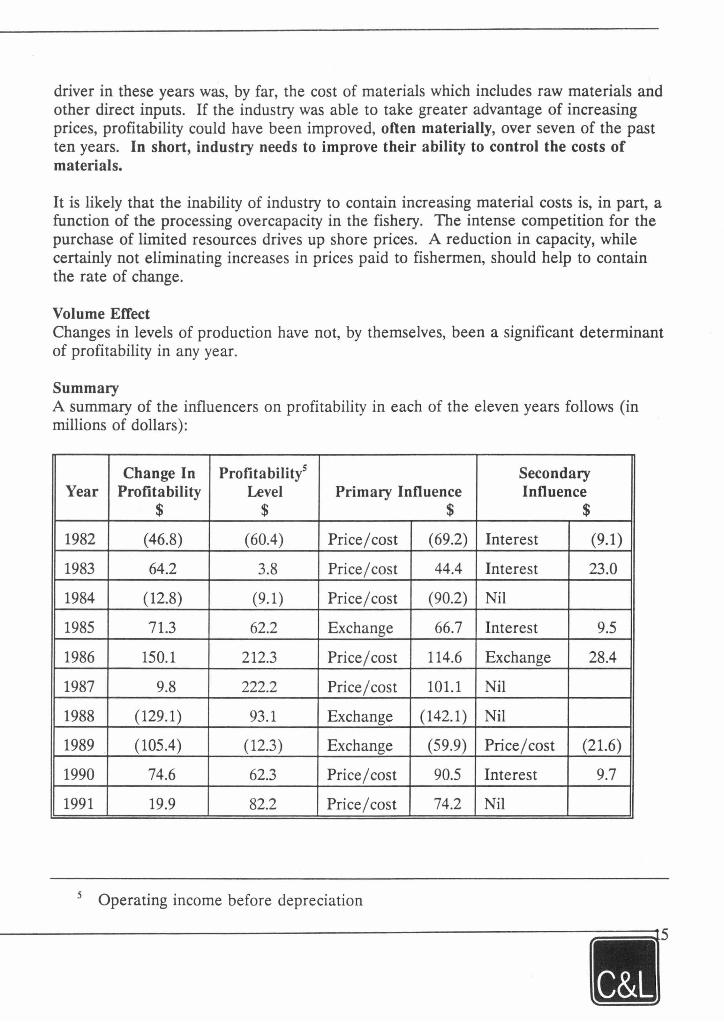
Summary A summary of the influencers on profitability in each of the eleven years follows (in millions of dollars):
Change In Profitability5 Secondary Year Profitability Level Primary Influence Influence
$ $ $ $
1982 (46.8) (60.4) Price/cost (69.2) Interest (9.1)
1983 64.2 3.8 Price/cost 44.4 Interest 23.0
1984 (12.8) (9.1) Price/cost (90.2) Nil
1985 71.3 62.2 Ex change 66.7 Interest 9.5
1986 150.1 212.3 Price/cost 114.6 Ex change 28.4
1987 9.8 222.2 Price/cost 101.1 Nil
1988 (129.1) 93.1 Ex change (142.1) Nil
1989 (105.4) (12.3) Ex change (59.9) Price/cost (21.6)
1990 74.6 62.3 Price/cost 90.5 Interest 9.7
1991 19.9 82.2 Price/cost 74.2 Nil
5 Operating incarne before depreciation
In summary, changes in prices (net of exchange) have been the single most important determinant of profitability in the fish processing industry. lt is very important to note, however, that since 1985, negative changes in profitability have been caused primarily by exchange factors. It is equally important to note that current favourable exchange rates may help mitigate some of the negative consequences of the resource crisis in 1992 and early 1993.
This means that the industry's ability to control costs, in response to changing prices, is the single most important factor in achieving sustained profitability.
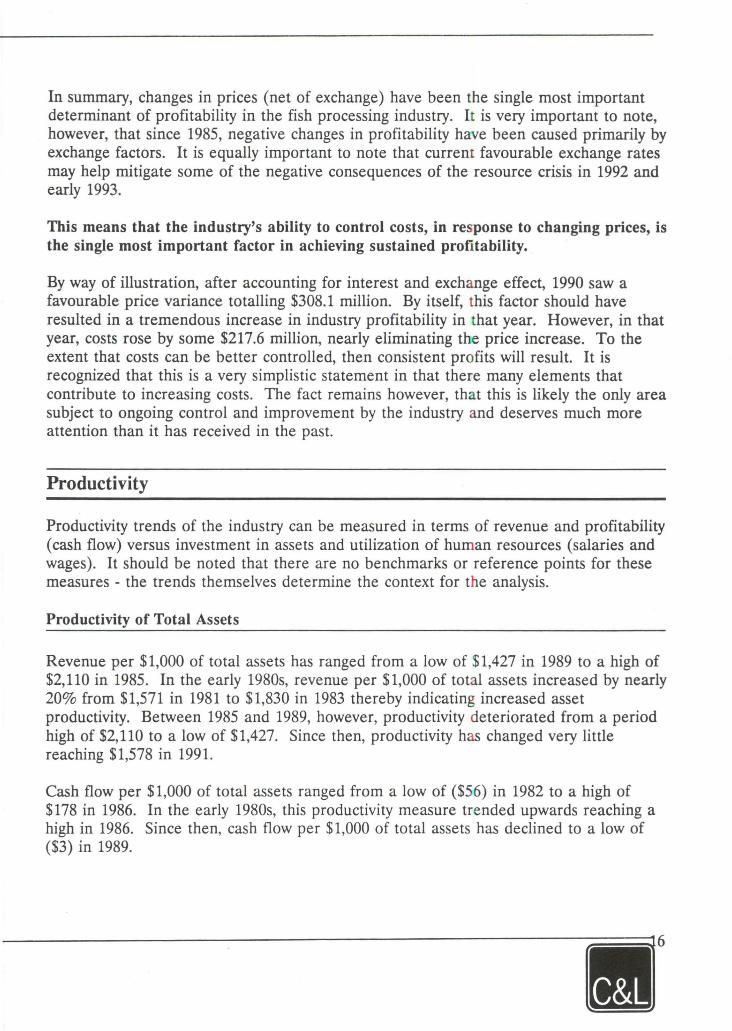
By way of illustration, after accounting for interest and exchange eff ect, 1990 saw a favourable price variance totalling $308.1 million. By itself, this factor should have resulted in a tremendous increase in industry profitability in that year. However, in that year, costs rose by some $217.6 million, nearly eliminating the price increase. To the extent that costs can be better controlled, then consistent profits will result. It is recognized that this is a very simplistic statement in that there many elements that contribute to increasing costs. The fact remains however, that this is likely the only area subject to ongoing contrai and improvement by the industry and deserves much more attention than it has received in the past.
Productivity
Productivity trends of the industry can be measured in terms of revenue and profitability (cash flow) versus investment in assets and utilization of human resources (salaries and wages). It should be noted that there are no benchmarks or reference points for these measures - the trends themselves determine the context for the analysis.
Productivity of Total Assets
Revenue per $1,000 of total assets has ranged from a low of $1,427 in 1989 to a high of $2,110 in 1985. In the early 1980s, revenue per $1,000 of total assets increased by nearly 20% from $1,571 in 1981 to $1,830 in 1983 thereby indicating increased asset productivity. Between 1985 and 1989, however, productivity deteriorated from a period high of $2,110 to a low of $1,427. Since then, productivity has changed very little reaching $1,578 in 1991.
Cash flow per $1,000 of total assets ranged from a low of ($56) in 1982 to a high of $178 in 1986. In the early 1980s, this productivity measure trended upwards reaching a high in 1986. Since then, cash flow per $1,000 of total assets has declined to a low of ($3) in 1989.
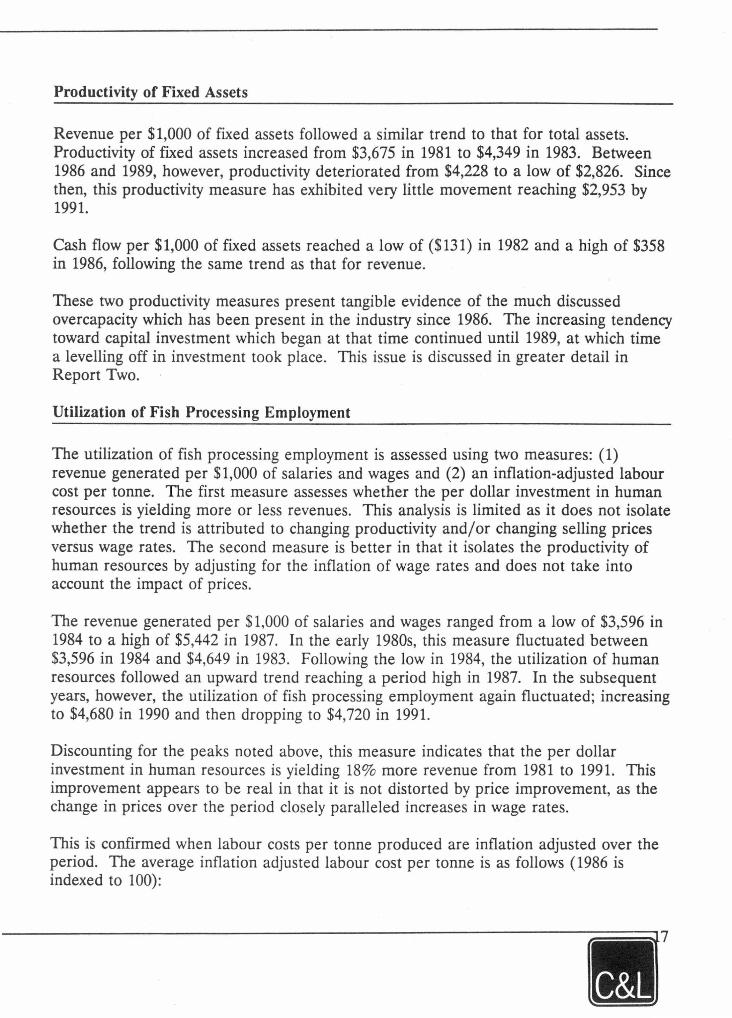
Productivity of Fixed Assets
Revenue per $1,000 of fixed assets followed a similar trend to that for total assets-. Productivity of fixed assets increased from $3,675 in 1981 to $4,349 in 1983. Between 1986 and 1989, however, productivity deteriorated from $4,228 to a low of $2,826. Since then, this productivity measure bas exhibited very little movement reaching $2,953 by 1991.
Cash flow per $1,000 of fixed assets reached a low of ($131) in 1982 and a high of $358 in 1986, following the same trend as that for revenue.
These two productivity measures present tangible evidence of the much discussed overcapacity which bas been present in the industry since 1986. The increasing tendency toward capital investment which began at that time continued until 1989, at which time a levelling off in investment took place. This issue is discussed in greater detail in Report Two.
Utilization of Fish Processing Employment
The utilization of fish processing employment is assessed using two measures: (1) revenue generated per $1,000 of salaries and wages and (2) an inflation-adjusted labour cost per tonne. The first measure assesses whether the per dollar investment in human resources is yielding more or less revenues. This analysis is limited as it does not isolate whether the trend is attributed to changing productivity and/or changing selling prices versus wage rates. The second measure is better in that it isolates the productivity of human resources by adjusting for the inflation of wage rates and does not take into account the impact of prices.
The revenue generated per $1,000 of salaries and wages ranged from a low of $3,596 in 1984 to a high of $5,442 in 1987. In the early 1980s, this measure fluctuated between $3,596 in 1984 and $4,649 in 1983. Following the low in 1984, the utilization of human resources followed an upward trend reaching a period high in 1987. In the subsequent years, however, the utilization of fish processing employment again fluctuated; increasing to $4,680 in 1990 and then dropping to $4,720 in 1991.
Discounting for the peaks noted above, this measure indicates that the per dollar investment in human resources is yielding 18% more revenue from 1981 to 1991. This improvement appears to be real in that it is not distorted by price improvement, as the change in prices over the period closely paralleled increases in wage rates.
This is confirmed when labour costs per tonne produced are inflation adjusted over the period. The average inflation adjusted labour cost per tonne is as follows (1986 is indexed to 100):
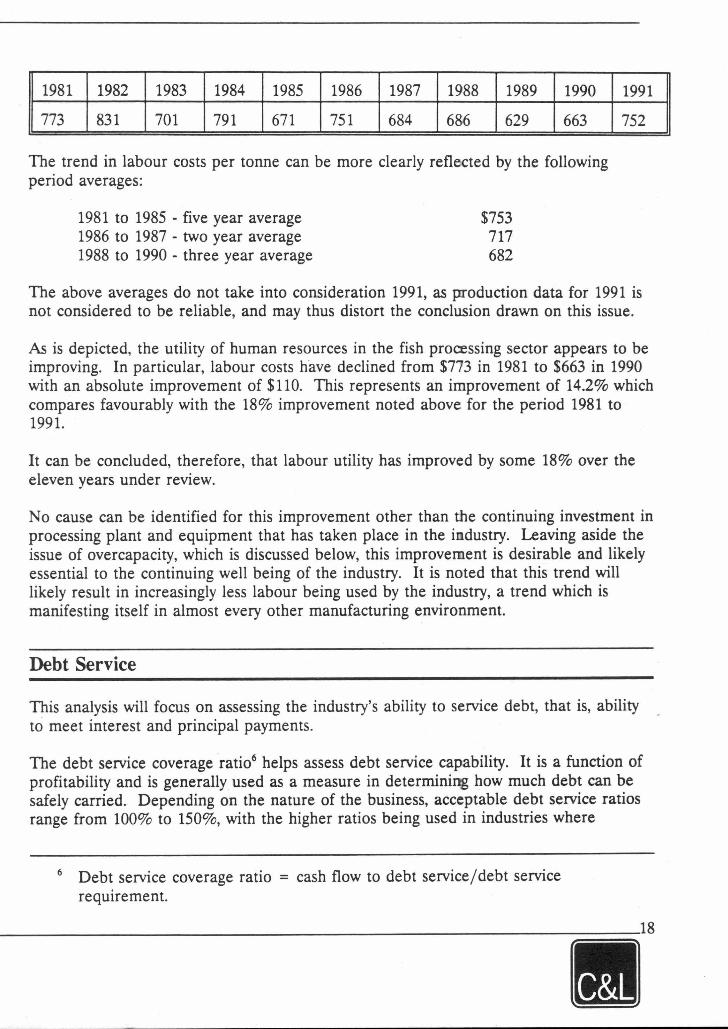
1981 1982 1983 1984 1985 1986 1987 1988 1989 1990
773 831 701 791 671 751 684 686 629 663
The trend in labour costs per tonne can be more clearly reflected by the following period averages:
1981 to 1985 - five year average 1986 to 1987 - two year average 1988 to 1990 - three year average
$753 717 682
1991
752
The above averages do not take into consideration 1991, as production data for 1991 is not considered to be reliable, and may thus distort the conclusion drawn on this issue.
As is depicted, the utility of human resources in the fish proœssing sector appears to be improving. In particular, labour costs have declined from $773 in 1981 to $663 in 1990 with an absolute improvement of $110. This represents an improvement of 14.2% which compares favourably with the 18% improvement noted above for the period 1981 to 1991.
It can be concluded, therefore, that labour utility has improved by some 18% over the eleven years under review.
No cause can be identified for this improvement other than the continuing investment in processing plant and equipment that has taken place in the industry. Leaving aside the issue of overcapacity, which is discussed below, this improvement is desirable and likely essential to the continuing well being of the industry. It is noted that this trend will likely result in increasingly less labour being used by the industry, a trend which is manifesting itself in almost every other manufacturing environment.
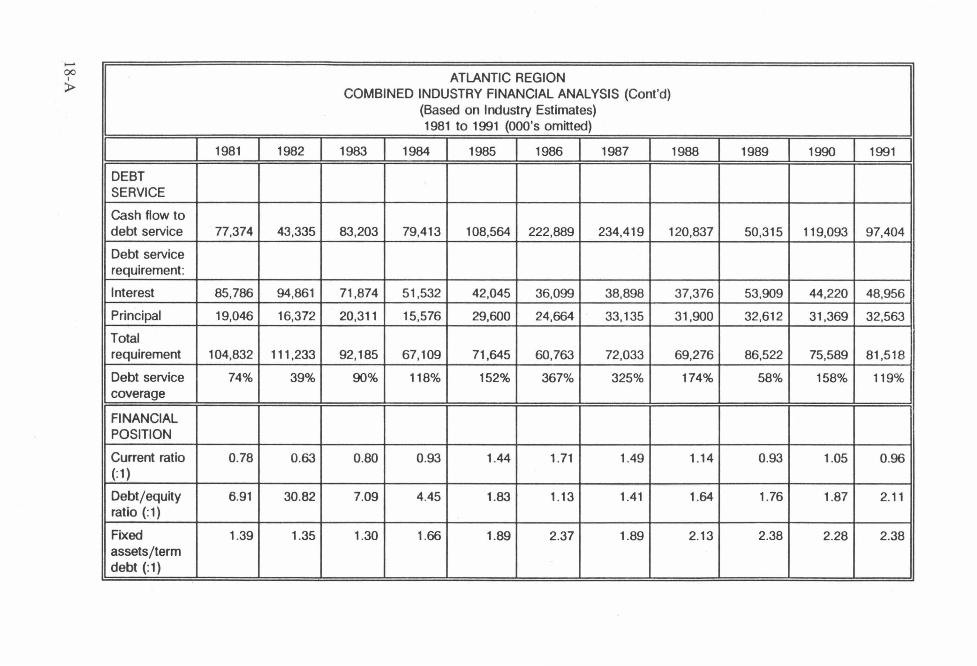
Debt Service
This analysis will focus on assessing the industry's ability to service debt, that is, ability to meet interest and principal payments.
The debt service coverage ratio6 helps assess debt service capability. It is a function of profitability and is generally used as a measure in determining how much debt can be safely carried. Depending on the nature of the business, acceptable debt service ratios range from 100% to 150%, with the higher ratios being used in industries where
6 Debt service coverage ratio = cash flow to debt service/debt service requirement.
-OO ' p
1
DEBT SERVICE
Cash flow to debt service
Debt service requirement:
lnterest
Principal
Total requirement
Debt service coverage
FI NAN CIAL POSITION
Current ratio (: 1)
Debt/equity ratio (:1)
Fixed assets/term debt (:1)
1 1981 1 1982 1
77,374 43,335
85,786 94,861
19,046 16,372
104,832 111,233
74% 39%
0.78 0.63
6.91 30.82
1.39 1.35
ATLANTIC REGION COMBINED INDUSTRY FINANCIAL ANALYSIS (Cont'd)
(Based on lndustry Estimates) 1981 to 1991 (OOO's omitted)
1983 1 1984 1 1985 1 1986 1 1987 1 1988 1 1989 1 1990 1 1991 1
83,203 79,413 108,564 222,889 234.419 120,837 50,315 119,093 97,404
71,874 51,532 42,045 36,099 38,898 37,376 53,909 44,220 48,956
20,311 15,576 29,600 24,664 33,135 31,900 32,612 31,369 32,563
92,185 67,109 71,645 60,763 72,033 69,276 86,522 75,589 81,518
90% 118% 152% 367% 325% 174% 58% 158% 119%
0.80 0.93 1.44 1.71 1.49 1.14 0.93 1.05 0.96
7.09 4.45 1.83 1.13 1.41 1.64 1.76 1.87 2.11
1.30 1.66 1.89 2.37 1.89 2.13 2.38 2.28 2.38
profitability is less predictable or consistent. A typical industrial ratio would be 125% to 130%, meaning that for every $1 required to service interest and principal payments, $1.25 to $1.30 of cash flow is required to provide reasonable comfort that the debt will indeed be serviced.
The industry did not generate adequate cash flow to service its debt requirement in 1981, 1982, 1983, and 1989. In 1982, the industry witnessed the most adverse debt position with a debt service coverage of only 39%. The low ratios of the early 1980s reflect the impact of significant debt burdens combined with high interest rates, whereas the ratio of 58% in 1989 is a result of a dramatic drop in cash flow.
The debt service coverage ratio improved substantially in the mid-1980s ranging from 118% in 1984 to 367% in 1986. Since then the ratio bas been a little more stable, with the exception of 1989, fluctuating between 119% and 174%.
Debt service coverage of 157.5% in 1990 would be considered acceptable, and 1991 would be marginally acceptable at 119.5%. This relative stability is a function of significant equity infusions in the industry in the early 1980s, primarily by governments in large offshore oriented companies. Higher than normal earnings in 1986 and 1987 also strengthened the industry's position. Finally, there bas been some additional equity invested in the late 1980s, primarily to fund operating lasses and charges related to down-sizing.
The ability of the industry to service its debt is being negatively affected by generally increasing levels of borrowing, particularly short term debt. This has been caused by two factors:
1. Significant increases in fixed asset investment from 1985 to 1989, funded to a significant extent by short term borrowings.
2. Declines in operating incarne from 1988 to 1990, with lasses being funded by short term borrowings.
The financial profiles indicate total interest-bearing debt of some $600 million in the industry by the end of 1991, excluding estimated amounts related to non-Atlantic Canadian assets and operations.
A survey of lenders with loans to the industry suggests total debt at the. end of 1992 approaching $800 million, including non-Atlantic Canadian assets. There is clear evidence of increased borrowing, in spite of significant restraint in the lending community.
It is a reasonably safe assumption that the industry will not likely be able to maintain acceptable overall debt service coverage throughout 1992 and 1993. This stress will be
concentrated in groundfish producers, particularly in N ewfoundland. There is also some weakness evident in companies relying heavily on pelagics, due primarily to weak market conditions. While there has been no evidence of significant weakness being experienced by processors of molluscs and crustaceans, very recent comments suggest significant price volatility which may prove disruptive in the short term.
Financial Position
A review of financial ratios serves as a useful indication of the industry's strength. To provide a relatively accurate financial picture of the fish processing sector, this section will review the industry's current, debt to equity, and fixed assets to debt ratios.
Current Ratio
The current ratio is based on current assets and current liabilities. A current asset is one that is cash or will turn in to cash within one year whereas a current liability is one that is due within one year. Analysis of the current ratio provides insight into the industry's ability to pay its short term debt obligations.
A review of the current ratio, reconfirms that the industry was at its strongest, financially, during the mid-1980s. In the early 1980s, the industry's current ratio was less than 1:1 and thus had limited financial capacity to service its short-term debt. Between 1982 and 1986, however, the industry witnessed an improving short-term financial situation with the current ratio increasing from .63:1 to 1.71:1. The current ratio then proceeded to decline reaching a low of .93:1 by 1989 and, in the early 1990s, the ratio hovered around the 1:1 mark.
A widely used rule of thumb is that a company or industry with a current ratio of 2: 1 or more is in good shape in terms of being able to pay maturing current liabilities. Though this ratio by itself can be misleading, the fishery, as an industry, has not in any given year reached close to 2: 1.
Debt/Equity Ratio
The debt to equity ratio7 assesses the balance between the portion of assets being financed by creditors and the portion of assets being financed by the stockholders of the industry. An acceptable debt/equity ratio for a large company is approximately 1:1, while small companies can opera te qui te easily with a ratio of 2.0: 1 to 3.0: 1. A ratio of 1.5: 1 would be considered acceptable for the industry overall.
7 Debt to equity ratio = total liabilities/equity.
~·
The industry's debt to equity ratio has been variable. In the early 1980s, the ratio was quite extreme with a high of 30.82:1 in 1982 and a low of 4.45:1 in 1984. In the mid-1980s, the ratio dramatically declined to 1.83: 1 and 1.13: 1. This trend was caused by massive infusions of government funds during the restructuring of the early 1980s, combined with the high earnings of the mid-1980s. The ratio weakened in the late 1980s, again as a result of significant borrowings to fund capital investment, and exacerbated by significantly weakened earnings. At the end of 1991, the ratio stood at 2.1:1, moving well outside acceptable levels.
Fixed Assets To Term Debt
The fixed assets to term debt ratio determines to what degree the industry is relying on long term financing to fund long term assets. It is a measure of balance within the financial structure.
The fixed assets to term debt ratio declined marginally in the early 1980s from 1.39:1 in 1981 to 1.3:1 in 1983. In the following three years, however, the ratio increased by roughly 80% to 2.37:1 in 1986. This increase indicates that the industry became less dependent on long term debt to finance fixed asset purchases, relying more on retained earnings and short term borrowings. Generally, this situation would suggest some room to increase long term borrowings which would help alleviate working capital stress. The lending community, however, is generally averse to providing term debt to the industry, as the security value of long term assets is now suspect, and weakened earnings generally do not support additional borrowing of any kind.
Financial Position of Large Versus Small Companies
Summary Information, 1987
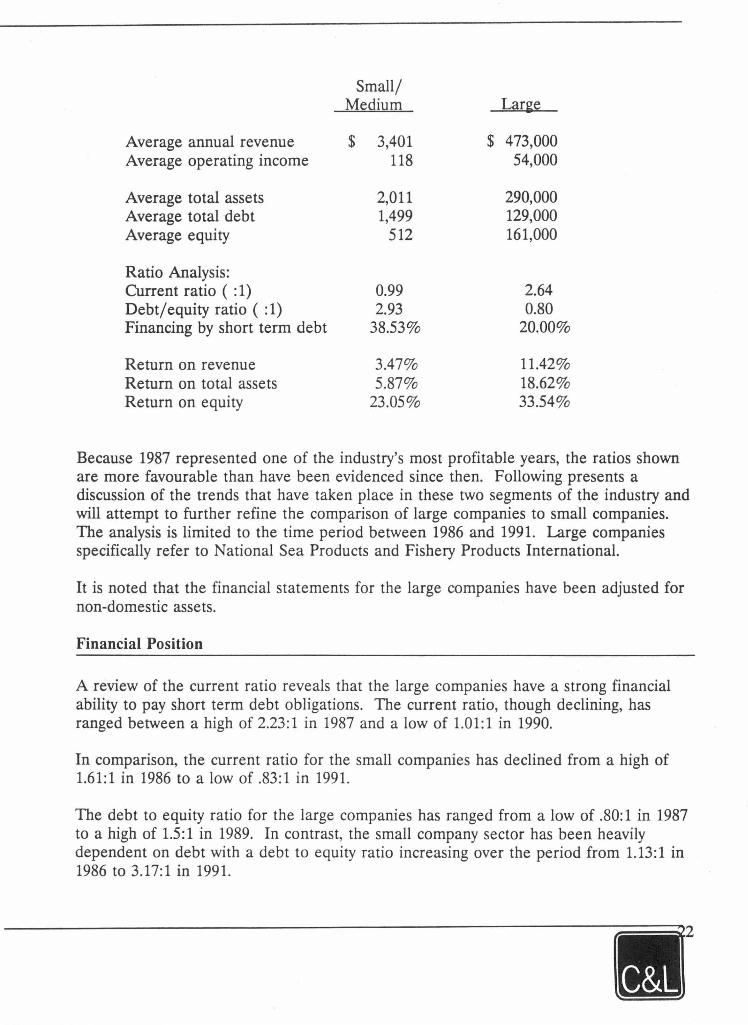
Based on the relatively complete financial information available for 1987, the following is a financial summary comparing large fish processing companies to small and mediumsized enterprises. While profitability and financial strength have changed since 1987, the data serves well in contrasting the two groups. It is noted that this data has not been adjusted for non-domestic assets, and some of the ratios are therefore slightly different from the trend analysis described later, where such adjustments have been made ($000 omitted):
Small/ Medium Large
Average annual revenue $ 3,401 $ 473,000 Average operating incarne 118 54,000
Average total assets 2,011 290,000 Average total debt 1,499 129,000 Average equity 512 161,000
Ratio Analysis: Current ratio ( : 1) 0.99 2.64 Debt/equity ratio ( :1) 2.93 0.80 Financing by short term debt 38.53% 20.00%
Retum on revenue 3.47% 11.42% Return on total assets 5.87% 18.62% Retum on equity 23.05% 33.54%
Because 1987 represented one of the industry's most profitable years, the ratios shown are more favourable than have been evidenced since then. Following presents a discussion of the trends that have taken place in these two segments of the industry and will attempt to further refine the comparison of large companies to small companies. The analysis is lirnited to the time period between 1986 and 1991. Large companies specifically refer to National Sea Products and Fishery Products International.
It is noted that the financial statements for the large companies have been adjusted for non-domestic assets.
Financial Position
A review of the current ratio reveals that the large companies have a strong financial ability to pay short term debt obligations. The current ratio, though declining, bas ranged between a high of 2.23:1 in 1987 and a low of 1.01:1 in 1990.
In comparison, the current ratio for the small companies has declined from a high of 1.61:1 in 1986 to a low of .83:1 in 1991.
The debt to equity ratio for the large companies bas ranged from a low of .80: 1 in 1987 to a high of 1.5:1 in 1989. In contrast, the small company sector has been heavily dependent on debt with a debt to equity ratio increasing over the period from 1.13: 1 in 1986 to 3.17:1 in 1991.
In summary, large and small company financial positions are largely a function of the ability and tendency of the larger companies to raise equity financing, as opposed to debt.
Further, there is evidence to suggest that the small company sector is more consistently profitable, within a smaller band of fluctuation, than the large companies.
Profitability
Over the six year period, the profitability8 of the large fish processing companies bas responded more to changes in the industry. Profitability of large companies bas tended to fall more during years of decline and rise more during years of prosperity. For instance, the profitability of the large companies outperformed the profitability of the small companies in the mid-1980s; however, when the fishery witnessed a downtum in 1989 and 1991, the impact was more detrimental to the profitability of the large companies than to that of the small companies.
The total assets of the large companies yielded strong returns in 1986 and 1987 but then deteriorated in the subsequent year. In the mid-1980s, the return on total assets9 was between 14% and 16%. In the next four years, however, the return on assets ranged from a low of (7.7%) in 1989 to a high of 1.53% in 1988. In contrast, the total assets of small companies yielded low, yet relatively stable, returns. The mid-1980s witnessed higher returns than the latter years; ranging from a low of .03% in 1989 to a high of 9% in 1986.
Similar to the return on total assets, the total equity of large companies yielded high returns in the mid-1980s and then lower retums in the following years. The return on total equity10 ranged from a low of (19%) in 1989 to a high of 34% in 1986.
Characteristics Of Small Companies
The following points characterize smaller enterprises in the industry:
• They tend to rely more heavily on debt financing, as is typical of smaller companies in most industries.
8 Profitability = Cash flow from operations.
9 Retum on total assets = net incarne/total assets.
10 Return on total equity = net incarne/total equity.
• They tend to pay less attention to the balance of financing and often rely on short term borrowings to finance long term assets. This often causes working capital problems, particularly when unexpected events occur requiring working capital, and short term borrowing capability has been used to finance long term assets.
• They tend not to have adequate information and control systems and often rely on rudimentary analysis to support pricing and casting.
• They tend to have limited marketing scope and market intelligence, often relying heavily on intermediaries for marketing effort and penetration. Further, the approach to marketing is often opporturustic, with less emphasis on longer term development or strategy.
• They tend to react more quickly to changing circumstances, as there are usually fewer layers of management, and decisions can be made and implemented on short notice. This does not mean that they are better decision makers, as small enterprises often do not have adequate information for proper decision making.
Conclusion
While the two segments of the industry are somewhat different in make-up and approach, they have both followed the same trends in production volume and profitability.
The larger companies are generally better capitalized, resulting primarily from sigruficant equity infusions that were made in the restructuring of the early 1980s, the benefit of which continues to this day. Accordingly, they are able to absorb financial shocks better than smaller ones. At the same time, because they respond more quickly to changing circumstances, smaller companies tend to be able to survive with less equity and less working capital.
The larger comparues have been more profitable in times of industry prosperity, but they have suffered more when faced with unfavourable conditions. Smaller comparues have generally been more consistently profitable, having better withstood the volatility experienced in recent years.
Having said that, the smaller companies are now in reasonably poor shape. The tendency to use short term debt to finance long term assets, combined with a worsening debt/ equity position, means that they are now vulnerable to continuing difficult conditions, and will likely suffer significantly as a sector in the short term.

N COMPARISON OF FISH PROCESSING INDUSTRY WITH OTHER INDUSTRIES --------- - --- ---
+>-1
>
RETURN ON EQUITY (%) 1980 1981 1982 1983 1984 1985 1986 1987 1988 1989 1990 1991 -- --··-·-----
FOOD MANUFACTURING 2 13.90 13.20 11 .00 13.80 13.70 12.90 13.10 16.00 14.00 11 .50 10.37 6.54 TOTAL MANUFACTURING 2 16.90 11 .40 4.50 8.90 12.00 10.20 10.00 13.10 16.10 11 .00 N/A N/A FISH PROCESSING NIA -41.29 -325.17 -25.13 -8.61 7.89 26.41 24.56 4.52 -10.98 4.07 -1.20 -
PROFIT MARGIN (%) 1980 1981 1982 1983 1984 1985 1986 1987 1988 1989 1990 1991 ----
FOOD MANUFACTURING 3.90 3.50 3.20 3.80 3.80 4.20 4.50 4.70 4.00 3.70 2.24 2.29 TOTAL MANUFACTURING 9.10 7.20 3.80 5.80 7.20 7.00 6.80 8.50 9.30 7.10 N/A N/A FISH PROCESSING N/A -3.48 -5.77 - 1.79 -0.69 0.02 8.33 7.85 1.44 -3.72 0.96 0.16
ASSET TURNOVER RATIO 1980 1981 1982 1983 1984 1985 1986 1987 1988 1989 1990 1991
FOOD MANUFACTURING 2.50 2.50 2.40 2.40 2.30 2.20 2.20 2.10 2.10 2.00 2.50 2.39 TOTAL MANUFACTURING 1.40 1.30 1.20 1.20 1.30 1.30 1.20 1.20 1.20 1.10 N/A N/A FISH PROCESSING NIA 1.57 1.62 1.83 1.80 2.11 2.10 1.83 1.66 1.43 1.63 1.58
1. Due to the large negative retum on equity in 1982 for fish processing, the retum on equity graph is only presented for the period 1983 to 1991 . 2. The financial ratios presented for food manufacturing and total manufacturing comprises corporations with $10 million or more in total assets.
SOURCES: Food Market Commentary, Agriculture Canada, January 1991, p. 20. Statistics Canada, lndustrial Corporation Financial Statistics, cat. no. 61-008.
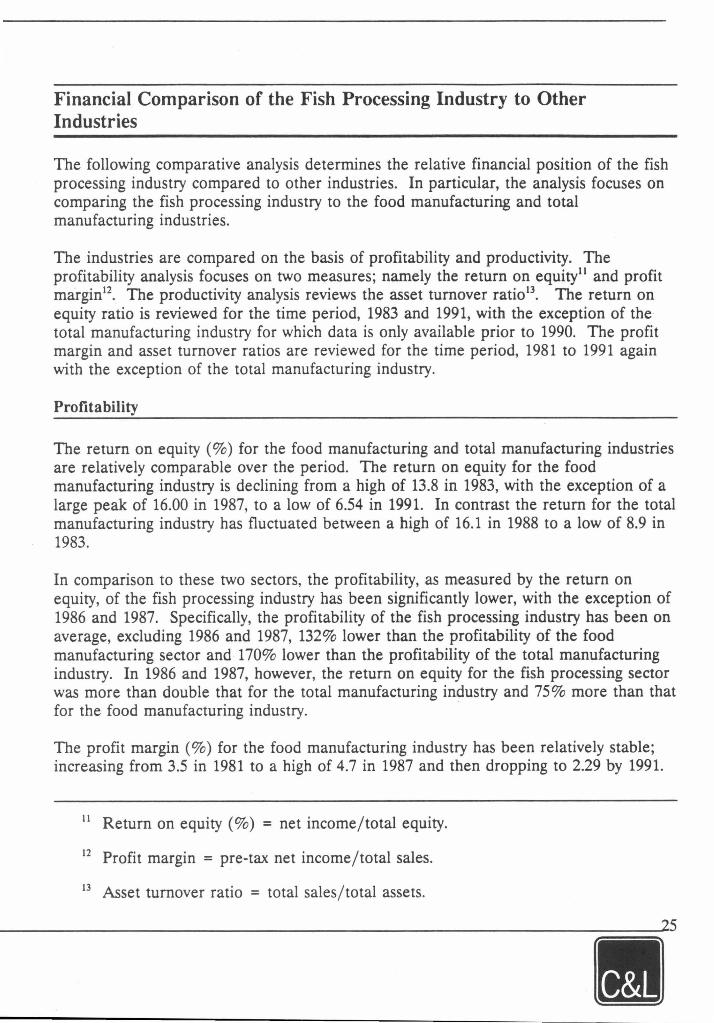
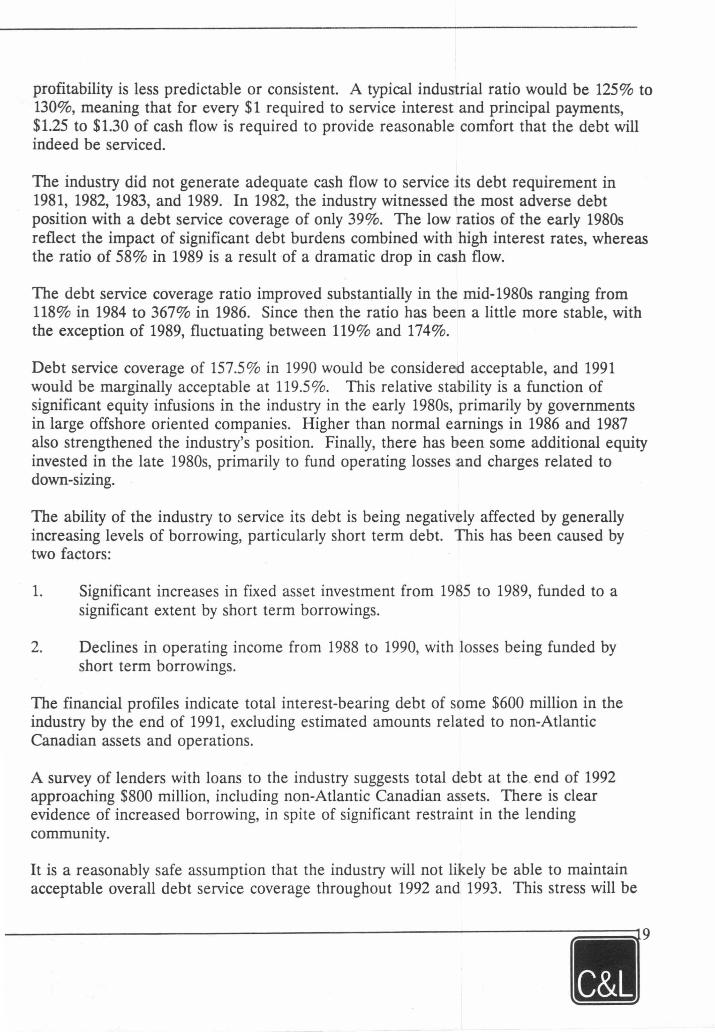
Financial Comparison of the Fish Processing Industry to Other Industries
The following comparative analysis determines the relative financial position of the fish processing industry compared to other industries. In particular, the analysis focuses on comparing the fish processing industry to the food manufacturing and total manufacturing industries.
The industries are compared on the basis of profitability and productivity. The profitability analysis focuses on two measures; namely the return on equity" and profit margin12
• The productivity analysis reviews the asset turnover ratio13• The return on
equity ratio is reviewed for the time period, 1983 and 1991, with the exception of the total manufacturing industry for which data is only available prior to 1990. The profit margin and asset turnover ratios are reviewed for the time period, 1981 to 1991 again with the exception of the total manufacturing industry.
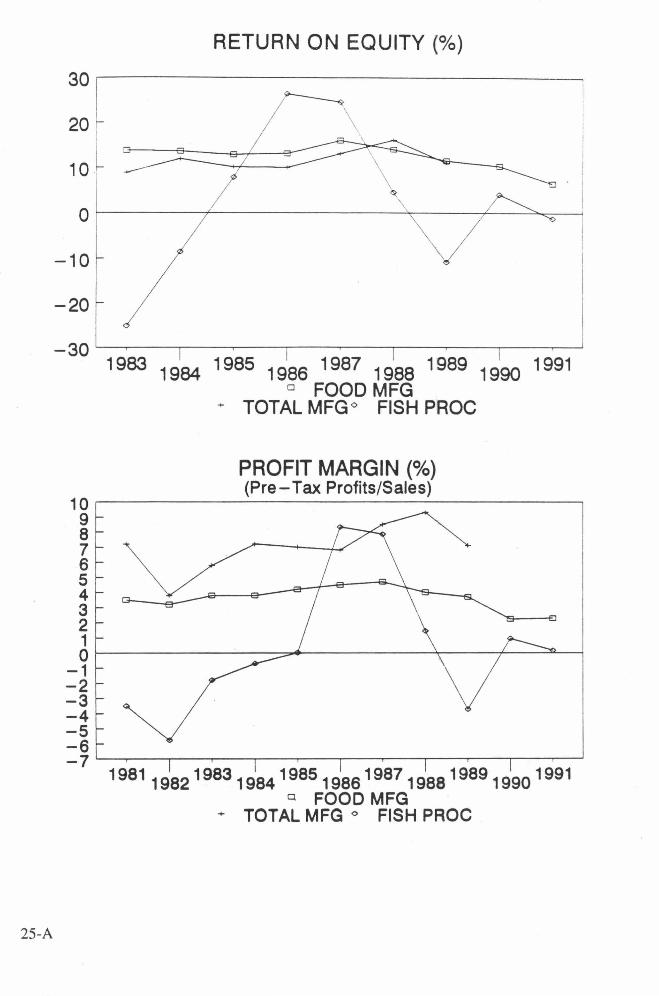
Profitability
The return on equity (%)for the food manufacturing and total manufacturing industries are relatively comparable over the period. The return on equity for the food manufacturing industry is declining from a high of 13.8 in 1983, with the exception of a large peak of 16.00 in 1987, to a low of 6.54 in 1991. In contrast the retum for the total manufacturing industry has fluctuated between a higb of 16.1 in 1988 to a low of 8.9 in 1983.
In comparison to these two sectors, the profitability, as measured by the retum on equity, of the fish processing industry bas been significantly lower, with the exception of 1986 and 1987. Specifically, the profitability of the fish processing industry bas been on average, excluding 1986 and 1987, 132% lower than the profitability of the food manufacturing sector and 170% lower than the profitability of the total manufacturing industry. In 1986 and 1987, however, the return on equity for the fish processing sector was more than double that for the total manufacturing industry and 75% more than that for the food manufacturing industry. ·
The profit margin (%)for the food manufacturing industry bas been relatively stable; increasing from 3.5 in 1981 to a high of 4.7 in 1987 and then dropping to 2.29 by 1991.
11 Return on equity (%) = net incarne/total equity.
12 Profit margin = pre-tax net incarne/total sales.
13 Asset turnover ratio = total sales/total assets.
25-A
30 [
20 1
10 l
-10
-20
RETURN ON EQUITY (%)
\,
1983 1984 1985 1986 1987 1988 1989 1990 1991 ° FOOD MFG
+ TOTAL MFG ° FISH PROC
PROFIT MARGIN (%) (Pre-Tax Profits/Sales)
10,---~~~~~~~~~~~~~~~~~-----,
9 8 7 6 5 4 3 2 1 or--~~~~~~~~~~~~~~-f-~-=-_,
-1 -2 -3 -4 -5 -6 -7'---.------.-~---.-~,------,-~-.----.~----.-~-.----.-~---.-~
19811982198319841985198619871988198919901991 ° FOOD MFG
+ TOTAL MFG ° FISH PROC
In contrast, the profit margin ( % ) for the total manufacturing industry has been higher than that of the food manufacturing industry, fluctuating from a high of 9.3 in 1988 to a low of 3.8 in 1982.
In comparison, the trend in the profit margin for the fish processing industry has dramatically differed from that of the food and total manufacturing. The industry has only managed to reach, or surpass, the level of profitability of the food manufacturing industry in 1986 and 1987.
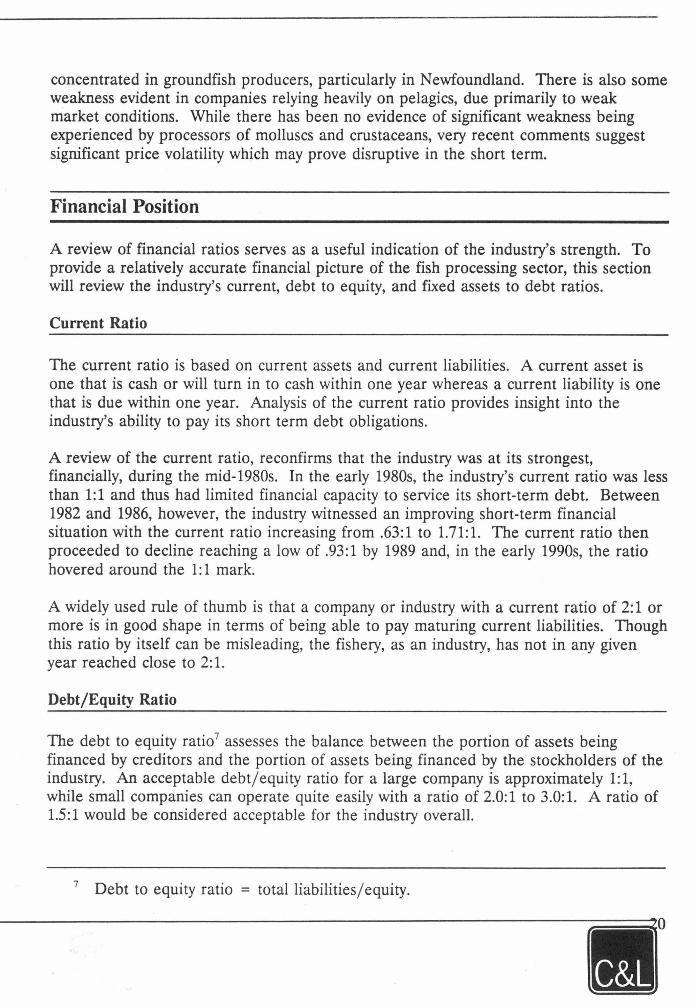
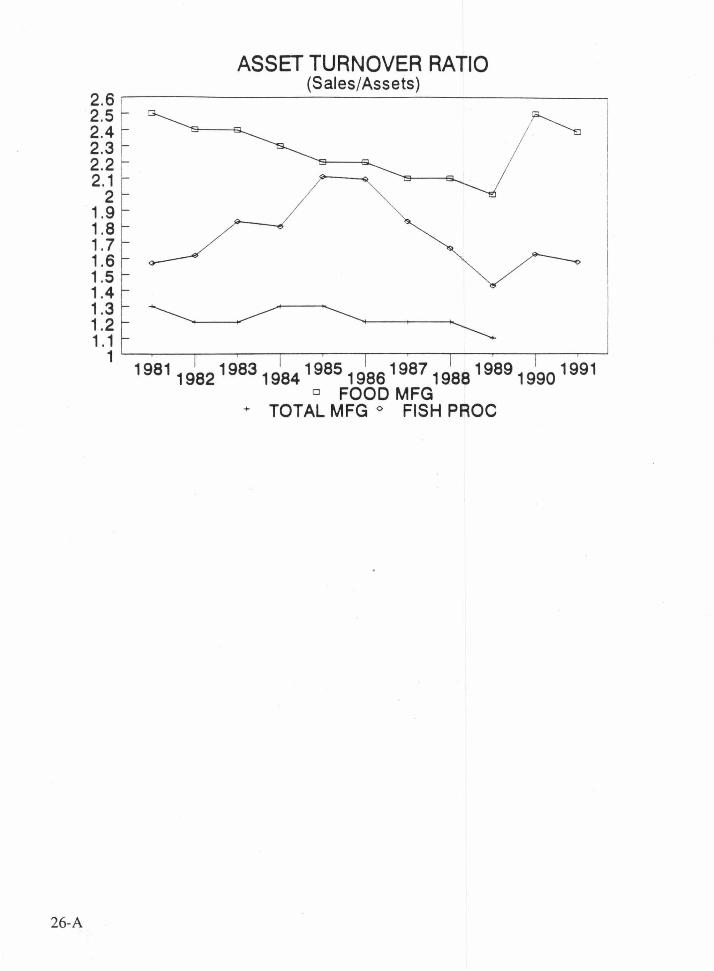
Productivity
The productivity of an industry can be measured by the effectiveness of the utilization of assets. One such measure is the ratio of total sales to assets, or the asset turnover ratio. Specifically, this ratio measures the level of revenue generated by the industry's assets.
The productivity, as measured by the asset turnover ratio, of the food manufacturing industry declined from 2.5 in 1981 to 2.00 in 1989; rose again to 2.5 in 1990; and then slightly dropped to 2.39 in 1991.
In contrast, the productivity of the total manufacturing industry has exhibited little variation, ranging between 1.1 and 1.3.
The asset turnover ratio for the fish processing industry increased from 1.57 in 1981 to 2.11 in 1985; proceeded to decline, with a sharp drop in 1989 to 1.43, and then reaching 1.58 by 1991. Over the period, the productivity of the fish processing industry has been lower than that of the food manufacturing industry but higher than that of the total manufacturing sector. In 1985 and 1986, the productivity of the fish processing industry reached, but did not exceed, that of the food manufacturing sector.
Conclusion
In comparison to the food and total manufacturing sectors, the profitability of the fish processing sector has performed poorly with the exception of 1986 and 1987. While the productivity of the fish processing sector has outperformed the total manufacturing sector, it has never reached the productivity levels of the food manufacturing industry.
Overcapacity In Fish Processing
This topic is perhaps the most discussed issue in the industry today. It is also likely one of the most misunderstood.
26-A
ASSET TURNOVER RATIO (Sales/Assets)
2 . 6 r--~~~~~~~~~~~~~~~~~~
2.5 2.4 2.3 2.2 2.1
2 1.9 1.8 1.7 1.6 1.5 1.4 1.3 1.2 1.1 1'--~~~~~~~~~~~~~~~~~__,
19811982198319841985198619871988198919901991 D FOOD MFG
+ TOTAL MFG ° FISH PROC
By most definitions, overcapacity is a measure of non-producing investment. That is, it represents an attempt to quantify that level of investment which is in excess of that required to handle normal production levels.
The problem in quantifying the level of overcapacity in the industry lies with the notion of capacity itself. Capacity is not a fixed quantum. It is a function of all of the resources available to the industry at any given time, in terms of plant and equipment, capital, and human effort. While plant and equipment are relatively fixed at any given point, capital and human effort can be volatile.
For example, capacity is generally measured in terms of maximum throughput within a time period, eg. number of tonnes processed in month. When capacity is measured in this manner, it is generally deterrnined by individual constraints in the processing cycle, such as such as freezing capacity, or filleting capacity. We may, for instance, be able to fillet 100 tonnes per 40 hour work week, but if we can only freeze 80 tonnes, then our capacity to produce frozen fillets is limited to 80 tonnes.
The difficulty in this approach to capacity measurement is twofold:
1. Certain constraints can be expanded, thereby expanding capacity. If we increase the number of shifts worked from one to two, thereby increasing the work week to 80 hours, we potentially double capacity.
2. Production mix is not fixed. In the above example, we are lirnited to 80 tonnes of frozen fillets in a week, but we can fillet 100 tonnes. If we change our production mix to include fresh fillets, we have effectively increased capacity by 25%.
Because of these factors, approaches that deal with fixed measures of capacity are generally inadequate, and become more inadequale as time passes and variables change.
Accordingly, other approaches have been developed. One of these is used by Statistics Canada. It attempts to measure capacity utilization by equating the value of production with the value of the assets employed. In this approach, the notion of "full capacity utilization" becomes irrelevant, to be replaced by a concept that rnight be called "best capacity utilization".
A derivative of this approach has been utilized he:re. This approach renders moot the notion of overcapacity measured in percentage terms and replaces it with a quantification of the value of non-producing assets.
A summary of the relationship between assets and production follows ($000 ornitted):
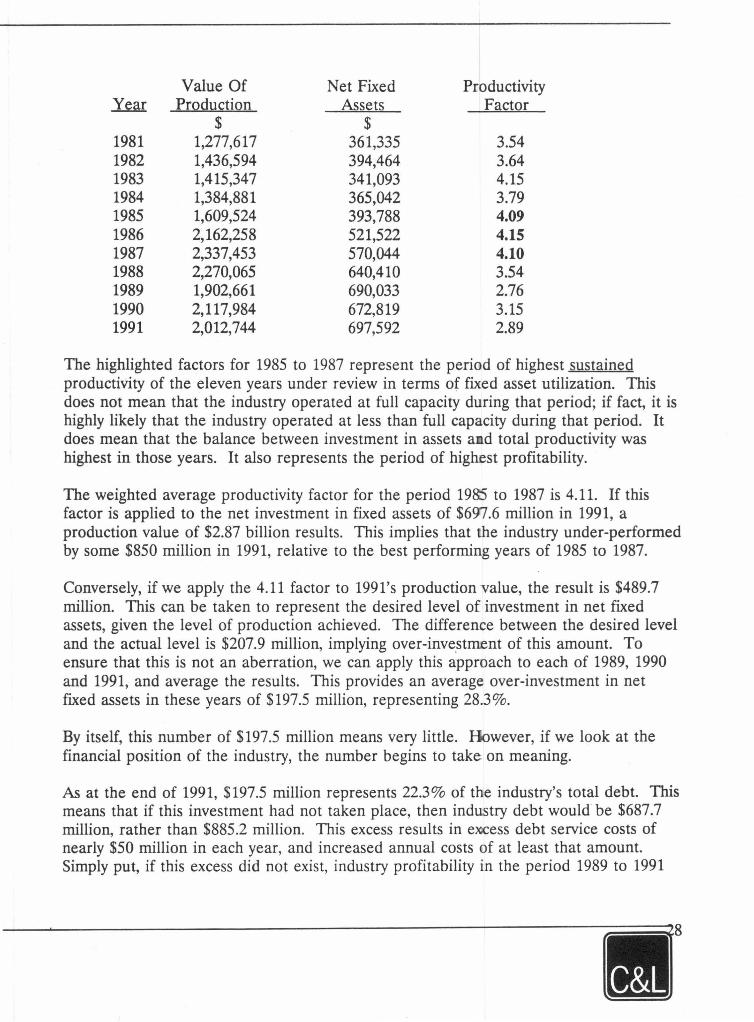
Value Of Net Fixed Productivity Year Production Assets Factor
$ $ 1981 1,277,617 361,335 3.54 1982 1,436,594 394,464 3.64 1983 1,415,347 341,093 4.15 1984 1,384,881 365,042 3.79 1985 1,609,524 393,788 4.09 1986 2,162,258 521,522 4.15 1987 2,337,453 570,044 4.10 1988 2,270,065 640,410 3.54 1989 1,902,661 690,033 2.76 1990 2,117,984 672,819 3.15 1991 2,012,744 697,592 2.89
The highlighted factors for 1985 to 1987 represent the period of highest sustained productivity of the eleven years under review in terms of fixed asset utilization. This does not mean that the industry operated at full capacity during that period; if fact, it is highly likely that the industry operated at less than full capacity during that period. It does mean that the balance between investment in assets a d total productivity was highest in those years. It also represents the period of highest profitability.
The weighted average productivity factor for the period 1985 to 1987 is 4.11. If this factor is applied to the net investment in fixed assets of $697.6 million in 1991, a production value of $2.87 billion results. This implies that the industry under-performed by some $850 million in 1991, relative to the best performing years of 1985 to 1987.
Conversely, if we apply the 4.11 factor to 1991's production value, the result is $489.7 million. This can be taken to represent the desired level of investment in net fixed assets, given the level of production achieved. The difference between the desired level and the actual level is $207.9 million, implying over-inve.stment of this amount. To ensure that this is not an aberration, we can apply this approach to each of 1989, 1990 and 1991, and average the results. This provides an average over-investment in net fixed assets in these years of $197 .5 million, representing 28.3 %.
By itself, this number of $197.5 million means very little. However, if we look at the financial position of the industry, the number begins to take on meaning.
As at the end of 1991, $197.5 million represents 22.3% of the industry's total debt. This means that if this investment had not taken place, then industry debt would be $687.7 million, rather than $885.2 million. This excess results in exicess debt service costs of nearly $50 million in each year, and increased annual costs of at least that amount. Simply put, if this excess did not exist, industry profitability in the period 1989 to 1991
would have exceeded $70 million, as opposed to the aggregate operating loss of $28 million actually experienced for the three year peiiod.
In other terrns, this excess investment has seriously undermined the industry's ability to respond to the current crisis from a position of strength. This excess of $197.5 million represents 47% of the industry's total equity as at the end of 1991. This is effectively non-perforrning equity and this fact significantly changes the appearance of the industry's financial position.
The industry financial position at the end of 1991 is as follows (millions of dollars):
Total assets Total debt Total equity
$1,305.1 885.2 419.9
This position produces a debt/ equity ratio of 2.1: 1, which is generally acceptable as discussed earlier.
If we adjust this position for excess investment of $197.5 million, the following picture results:
Total assets Total debt Total equity
$1,107.6 885.2 222.4
We have adjusted equity rather than debt because we cannot simply make the debt go away - lenders expect to have their loans repaid and generally have the ability to force repayrnent. Under normal circumstances, we should be able to liquidate assets to pay down debt. But current industry circumstances have effectively eliminated any market for fish processing assets, making this strategy difficult if not impossible.
This adjusted picture produces a debt/ equity ratio of nearly 4: 1, which is well outside acceptable levels. A small company can likely survive with such a financial position, but an entire industry consisting of large, medium and small enterprises will have difficulty.
It is very difficult to accurately allocate this excess investment by province because the effects of interprovincial operations and ownership are very difficult to account for. However, using the same technique as applied to the Atlantic overall, best efforts produce the following estimated results ($000 omitted):
-. ~
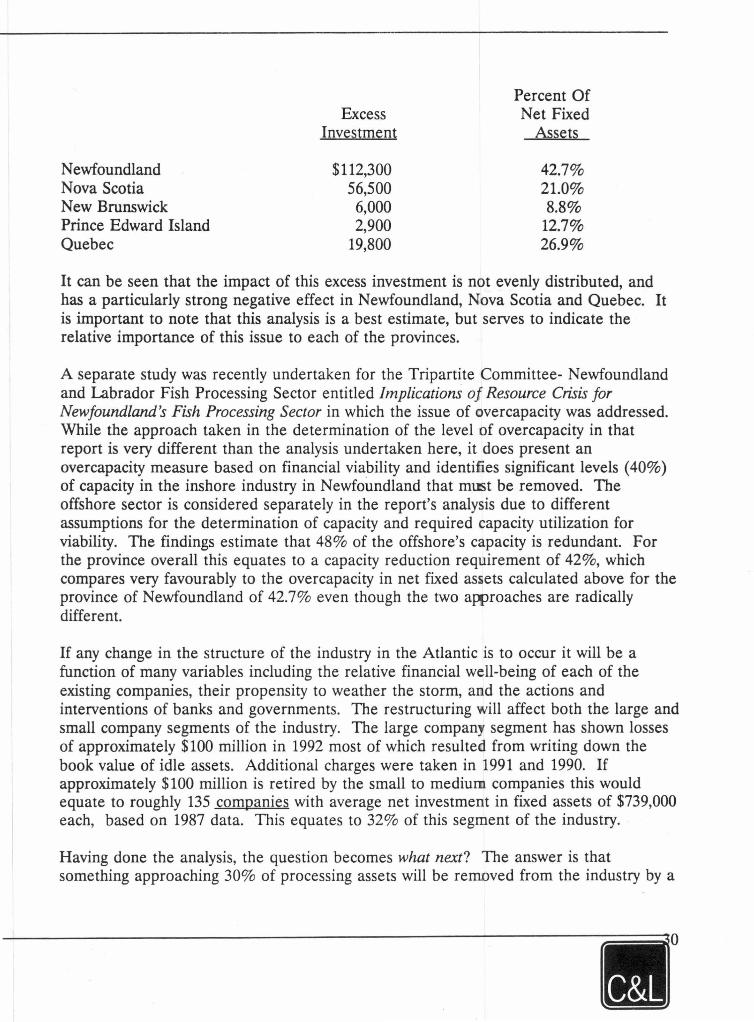
N ewfoundland Nova Scotia New Brunswick Prince Edward Island Que bec
Excess Investment
$112,300 56,500
6,000 2,900
19,800
Percent Of Net Fixed
As sets
42.7% 21.0% 8.8%
12.7% 26.9%
It can be seen that the impact of this excess investment is not evenly distributed, and has a particularly strong negative effect in Newfoundland, Nova Scotia and Quebec. It is important to note that this analysis is a best estimate, but serves to indicate the relative importance of this issue to each of the provinces.
A separate study was recently undertaken for the Tripartite Committee- Newfoundland and Labrador Fish Processing Sector entitled Jmplication.5 of Resource Crisis for Newfoundland's Fish Processing Sector in which the issue of overcapacity was addressed. While the approach taken in the determination of the level of overcapacity in that report is very different than the analysis undertaken here, it does present an overcapacity measure based on financial viability and identifies significant levels ( 40%) of capacity in the inshore industry in Newfoundland that mŒt be removed. The offshore sector is considered separately in the report's analysis due to different assumptions for the determination of capacity and required capacity utilization for viability. The findings estimate that 48% of the offshore's capacity is redundant. For the province overall this equates to a capacity reduction requirement of 42%, which compares very favourably to the overcapacity in net fixed assets calculated above for the province of Newfoundland of 42.7% even though the two awroaches are radically different.
If any change in the structure of the industry in the Atlantic is to occur it will be a function of many variables including the relative financial well-being of each of the existing companies, their propensity to weather the storm, and the actions and interventions of banks and governments. The restructuring will affect both the large and small company segments of the industry. The large company segment has shown losses of approximately $100 million in 1992 most of which resulted from writing down the book value of idle assets. Additional charges were taken in 1991 and 1990. If approximately $100 million is retired by the small to medium companies this would equate to roughly 135 companies with average net investrnent in fixed assets of $739,000 each, based on 1987 data. This equates to 32% of this segment of the industry.
Having done the analysis, the question becornes what next? The answer is that something approaching 30% of processing assets wi-11 be removed from the industry by a
~·
process akin to financial attrition, unless additional equity is produced, or production volumes increase significantly - bath unlikely scenarios.
Attrition will be effected by lenders foreclosing when and if possible, by the weak selling to the strong where assets are desirable, and by the simple closure of assets which do not warrant foreclosure or merit sale. If any value is to be derived from this process, selective attrition would be desired. This would have the best assets kept in the industry, transferred from weak to strong, and deteriorating assets removed.
Summary Conclusions
Giving consideration to all of the foregoing, the following may be said about the performance of the fish processing industry in Atlantic Canada:
• The industry has not been able to achieve acceptable levels of profitability on a consistent basis. Other than 1986 and 1987, performance has been less than marginal. This is so when industry returns are examined in isolation. It is even more evident when fish processing industry returns are compared with food and other manufacturing, where returns have been higher and more consistent during the period under review. But for 1986 and 1987, combined with the government intervention of the early 1980s, the industry would not be able to sustain itself by relying on its own returns.
• It has been generally held that interest and exchange rates have been the predorninant determinants of profitability in the industry. This has not proven to be the case. By far, price volatility, coupled with generally corresponding movements in costs have had a much larger impact on profitability. Exchange rates have had a significant effect in only three years. Although that impact bas been profound, this factor has not been the consistent deterrninant that many have believed. Interest rates have had influence only in the very early 1980s.
• There has been significant productivity improvement in the industry since 1981. This has resulted from continuous large scale investment in plant and equipment, particularly in the mid to late 1980s. Labour utility has improved by 15% or more. While it is not possible to state with absolute certainty the causes for this improvement, it has likely been as a result of increased use of processing technology, combined with increased product utilization. There is clearly tremendous opportunity for further improvement in this area.
• Since the early 1980s, the industry has been able to meet its debt service obligations from operating incarne, with the exception of 1989. In the late 1980s, increasing debt, particularly short term, resulted from massive investment in fixed assets. This, combined with declining profitability, seriously underrnined the
industry's ability to service its debt load, particularly in the face of the resource difficulties. In spite of this, at the end of 1991, the financial structure of the industry was reasonably sound, with significant balance sheet strength displayed by the large companies, and a marginally acceptable financial position being held by small and medium-sized enterprises.
• The significant build-up of producing assets, particularly in the rnid to late 1980s, has seriously underrnined the industry's otherwise acceptable financial position. This overinvestment has the effect of rendering useless nearly 50% of the industry's equity base. Further it has created some $50 million in excess annual operating costs. But for these costs, the industry would have achieved aggregate profitability from 1989 to 1991, versus the aggregate loss actually realized.
There is no ready solution to the problem of overcapacity as there is no market in which assets can be liquidated so that debt can be reduced. A slow process of attrition is likely the only remedy for this situation.
• While large companies have been more profitable in good times, smaller companies have been more consistent in earning income. Large companies have tended to suffer dramatically in difficult circumstances. To some extent, this suffering has been cusbioned by their better balance sheets, but this is not a situation that can be tolerated indefinitely.
In summary, the industry has not shown any evidence that it has been or can be viable on its own. Several explanations have been advanced for this, but there is no obvious remedy immediately available.
From all of the analysis done, combined with numerous discussions with industry leaders, several factors have been identified which have likdy led to the situation being faced today. These are:
• size of industry participant; • access to resources; • barriers to entry; and • the industry as social program.
It is worthwhile to note that the entire Atlantic fish processing industry is not a large enterprise in today's terms. Indeed, even within Atlantic Canada, there are several individual companies, in various industries, whose individual revenues are equal to or greater than the entire output of the regional fisb processing sector. In this context, an argument can be made and supported that the average fish processing company is tao small.
It is clear that there is a minimum size necessary to take advantage of basic processing technology, market access and information, and control and information systems. Sorne have suggested that for a company to be well versed in each of these areas, it would have to have annual revenues of some $25 million. This is some seven times larger than the existing average. As an average, this level is likely significantly higher than need be, as every participant does not have to excel in each of these areas.
Given minimum throughput required to support reasonable investment in marketing, processing technology and information systems, a more likely average size would be $5 million. This level of activity should support the minimum infrastructure necessary to provide acceptable capability in each of these areas. If the average size company in the industry was $5 million, this would mean that in excess of 100 companies would be removed in the consolidation.
Access to resources has been an industry issue since economic expansion. The complaint of most is that access, once given, does not vest, even when enterprise allocations are used. This is because of ministerial discretion and departmental intervention that continue to negate an enterprise's ability to rely absolutely on its supposedly permanent share of the resource base. Indeed, through policies that encourage fleet separation and non-consolidation of fish resources, the emphasis bas been on dis-aggregation.
The result bas been the encouragement of smaller enterprises, many of which are not properly equipped to deal with the complex issues that currently face the industry, and the discouragement of consolidation into slightly larger entities which might be better equipped for continuing viability.
A by-product of this direction has been an artificial elimination of barriers to entry. In any industry, barriers to entry act as a screening process to weed out those who do not have the basic skills and resources necessary for survival and prosperity in the industry. Generally, these barriers occur naturally within an industry, and take the form of limited or restricted access to capital, technology, raw materials, human resources or markets. Public policy in the fishery has acted to remove or reduce many of these barriers such that entry into the industry bas been available to virtually everyone. This bas tended to overpopulate the industry, creating unnecessary competition for resources of all types, and reducing the capability of the participants to that of the lowest common denominator.
Finally, the industry has long been considered a generator of employment and economic activity within the region. In many ways, from both a federal and provincial perspective, it bas taken on the role of a quasi social program. This is clearly evidenced by its legislated interaction with incarne support programs, and the resulting continuing buildup in the number of people working in the industry, in spite of the fact that labour utilization is declining. In some ways, the industry bas benefited from this phenomenon.

However, this connection bas made it possible for the industry to operate free of certain of the fiscal constraints which impose discipline on free enterprise generally. This lack of discipline bas left the industry weaker than it otherwise might be, and certainly less vibrant that it should be.
These issues are complex in the extreme and it is beyond the scope of this review to unravel them. However, the work undertaken herein cleady demonstrates that there are fundamental, structural problems within this industry that require examination if continuing viability, free of social support, is ever to be attained.
4. THE SUSTAINABLE CORE FISHERY MODELS
Two predictive computer models:
• the Sustainable Capital Investment Model (SCIM); and • the Direct Labour Model (DLM)
are used to determine the size and structure of a sustainable core fishery. Specifically, these models have been designed to simulate the impact of changes in resource availability on sustainable investment and employment levels in the fish processing industry on a provincial basis.
The models are primarily based on information collected in the first two phases of this assignment. The following will provide a detailed description of each model.
Sustainable Capital Investment Model (SCIM)
The purpose of the Sustainable Capital Investment Model is to quantify the capacity of the industry to support capital investment. The model simulates the level of investment the industry can sustain at various levels of resource availability.
Limitations on Provincial Analysis
Though the purpose of the model is to simulate the sustainable capital investment level for each province, the reader is cautioned that the model is lirnited in its accuracy to portray provincial investment levels due to weaknesses in the input data. The sustainable capital investment model is based on provincial production and landing statistics presented in the Department of Fisheries and Oceans Annual Statistical Review (ASR). The landings are actual landed volumes and values for each province. The transshipment of landed raw material to other, most likely contiguous, provinces for processing is, however, a common phenomenon. Unfortunately, the data does not isolate what portion of the province's landed value and volume of landings are transferred to other provinces.
The SCIM is therefore limited to the assumption that the province processes only the raw m.aterial that is landed in that province. This assumption skews the financial picture on a provincial basis to the extent of the inter-provincial transfer by either overor under-stated raw material throughput and costs. The determination of the individual
province's sustainable capital investment level would also be skewed, since it is based on the province's net incarne from fish processing.
Despite this fact, the SCIM is accurate on an Atlantic basis thereby providing an overall indication of the impact of changing resource scenarios of the sustainable capital investment for the Atlantic fishery.
Outputs of the Model
As discussed, the purpose of the sustainable capital investment mode! is to determine the financial capabilities of the provincial fisheries to sustain capital investment. The first step in determining the financial capacity to support capital investment is the following debt serviCe calculation:
1) contribution margin14 for each major species grouping by Province; less 2) other costs and interprovincial adjustment.
This capacity for debt service calculation determines the level of cash flow available to service debt. The debt capacity of the industry is then emplnyed to determine the level of debt that such a cash flow can support. The level of supportable debt is, however, only one financing source for capital investment. This analysis must also consider what level of equity the industry can expect to attract. The determination of equity is based on the industry's historie trend of actual debt to equity ratios. Consequently, the debt plus equity estimates measure how much the industry can support in capital investment.
The output of the SCIM is the contribution margin for each major species grouping, namely groundfish, pelagics, and molluscs and crustaceans. On the basis of this output, the analysis then, separate from the SCIM, determines the level of investment that the industry can sustain on a provincial and Atlantic basis for 1990 and the resource scenanos.
The number of direct labour hours required to process each species is also an output of the model. These hours are, in turn, employed as an input into the direct labour model.
Inputs of the SCIM
To gain a better understanding of the model, the following will describe the steps involved in the designing of the Sustainable Capital Investment Madel. Specifically, the first phase of the SCIM involved the determination of the foUowing inputs:
14 Contribution margin is what remains from total sales revenues, after deducting variable expenses, that can be used toward covering fixed expenses and generating profits for that period.
1) the amount of fish landed and processed by province;
2) the historie relationship between landings and production mix;
3) the production and landed unit values;
4) the labour productivity factors for each product form; and
5) the direct and indirect labour wage rates and benefits for processing workers.
The model is dynamic in that it is designed to respond to changes in the input variables. In this case, the landed volume is the only input which is variable; the remaining inputs are held constant or static. Specifically, the model employs the landed volumes to simulate the production mix which is likely to result from this raw material mix. This simulation is ~ased on regression and other analyses of historie trends in volume and mix. The volume of production is then employed to calculate the number of hours required to process each species. In conjunction with the static inputs, the resulting outputs are the value of production, the value of raw material, and the value of labour which are, in turn, the basis of the contribution margin calculation.
For the purposes of testing the accuracy of the SCIM, a test model was designed for 1990. This model is based on actual landings for 1990 and simulates the production mix that is estimated to result from these landings. To test the accuracy of the model, the simulated production volume and value have been compared to actual production levels. With the exception of Prince Edward Island and Quebec, the simulated results are within 8% of actual production activity. The PEI SCIM model simulated production values with 15% of actual whereas the Quebec SCIM model simulated within 14%. · Given the relative size of these fisheries, this level of accuracy was deemed sufficient for the purposes of this model. The accuracy of the 1990 model was also validated by comparing the simulated value of labour to other sources of wage information.
The SCIM model has then been employed to determine the impact of various resource scenarios on sustainable capital investment. In particular, the Task Force on Incarnes and Adjustment has requested the simulation of two resource scenarios. These landings are resource availability scenarios rather than those expected at a certain time period in the future . The specifics of these resource scenarios are as follows:
• Resource Scenario I assumes that the T ACs for major cod stocks are the 10 year projections of average landings at FO. l as calculated by Science Branch of DFO. The landings of remaining species, except herring, are based on a five year average. Herring landings are also based on a five year average but are adjusted for errors and omissions in reporting.
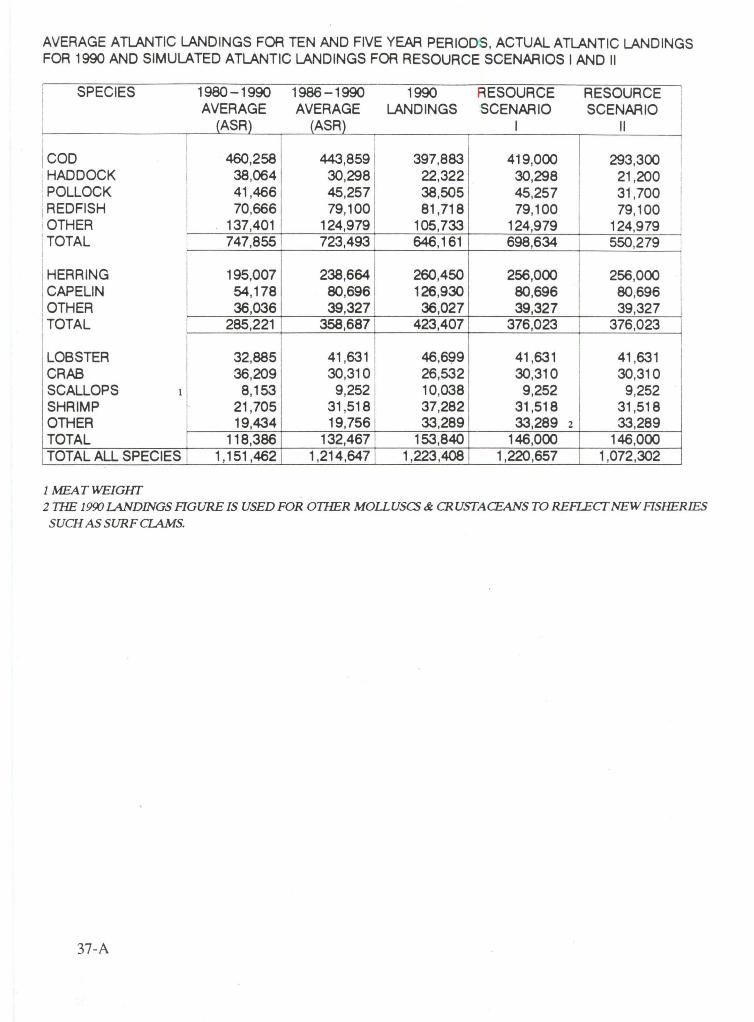
AVERAGE ATLANTIC LANDINGS FOR TEN AND FIVE YEAR PERIODS, ACTUAL ATLANTIC L.ANDINGS FOR 1990 AND SIMUL.ATED ATLANTIC L.ANDINGS FOR RESOURCE SCENARIOS 1AND11
SPECIES 1980-1990 1986-1990 1990 RESOURCE RESOURCE 1 1 AVERAGE AVERAGE LANDINGS SCENARIO SCENARIO ! (ASA) (ASA) 1 Il 1
/coD 460,258 443,859 397,883 419,000 293,300 HADDOCK 38,064 30,298 22,322 30,298 21 ,200 POLLOCK 41,466 45,257 38,505 45,257 31,700 REDFISH 70,666 79,100 81,718 79,100 79,100 OTHER 137,401 124,979 105,733 124,979 124,979 TOTAL 747,855 723,493 646,161 698,634 550,279
HERRING 195,007 238,664 260,450 256,000 256,000 CAP ELIN 54,178 80,696 126,930 80,696 80,696 OTHER 36,036 39,327 36,027 39,327 39,327 TOTAL 285,221 358,687 423,407 376,023 376,023
LOB STER 32,885 41 ,631 46 ,6~9 41 ,631 41,631 CRAS 36,209 30,310 26,532 30,310 30,310 SCALLOPS 1 8,153 9,252 10,038 9,252 9,252 SHRIMP 21,705 31,518 37,282 31,518 31,518 OTHER 19,434 19,756 33,289 33,289 2 33,289 TOTAL 118,386 132,467 153,840 146,000 146,000 TOTAL ALL SPECIES 1,151,462 1,214,647 1,223,408 1,220,657 1,072,302
1 MEAT WEIGHT 2 THE 19<XJ I.ANDINGS FIGURE IS USED FOR OTHER MOUUSCS & CR UST A CEANS TO REFIECT NEW FISHERIES SUCH AS SURF CI.AMS.
37-A
• Resource Scenario II assumes 30% lower landings of cod, haddock, and pollock than estimated in Resource Scenario 1.
In particular, the resource scenarios are presented in the exhibit shown opposite.
Further details on SCIM 1990 and the resource scenario SCIM models are provided in Report 3 of tlris document. It outlines the source of each input and the key assumptions employed in the model.
Direct Labour Model (DLM)
Outputs of the Direct Labour Model
The direct labour mode! provides the following:
• the seasonal utilization of direct, other direct, and indirect labour for each major species grouping; and
• the seasonal utilization of direct labour for each species.
The mode! does not actually depict the actual jobs employed in the fishery but rather the possible number and seasonal distribution of jobs required to optimally process the raw material landed throughout the year. It is based on the assumption that the fish will "flow" to the fish processing facilities to optirnize the utilization of workers over the 12 months of the year. The lack of information isolating the actual seasonality of employment in the fish processing industry bas lirnited, by necessity and design, the structure of the direct labour model.
On the basis of the seasonal utilization of labour in the fishery, the number of people meaningfully employed in the industry has been deterrnined. The analysis deterrnines the number of jobs supported for the following three job categories:
Tier 1 job: Tier 2 job: Tier 3 job:
full-time jobs of 10 months; extended seasonal jobs between 2.5 and 7 months; and highly seasonal jobs.
The labour model does not document how the labour resources are divided amongst the plants. But rather, generates the number of full-time ( defined as 10 month) jobs that could, in a somewhat perfect distribution of resources, be available. The reality of what is possible, without a total restructuring of the industry, is somewhere between the direct labour model and the status quo of some 61,515 individuals being employed in the fishery, many on a seasonal basis.

Inputs of the Direct Labour Model
The direct labour model is based on the following inputs:
1) the number of direct labour hours required to process each species as calculated by the Sustainable Capital Investment Madel; and
2) the three-year historie pattern in landings by species for each province.
The direct labour model is driven by the direct labour hours output of the SCIM. The number of direct labour hours required to process each species is then seasonally allocated based on historie landing patterns.
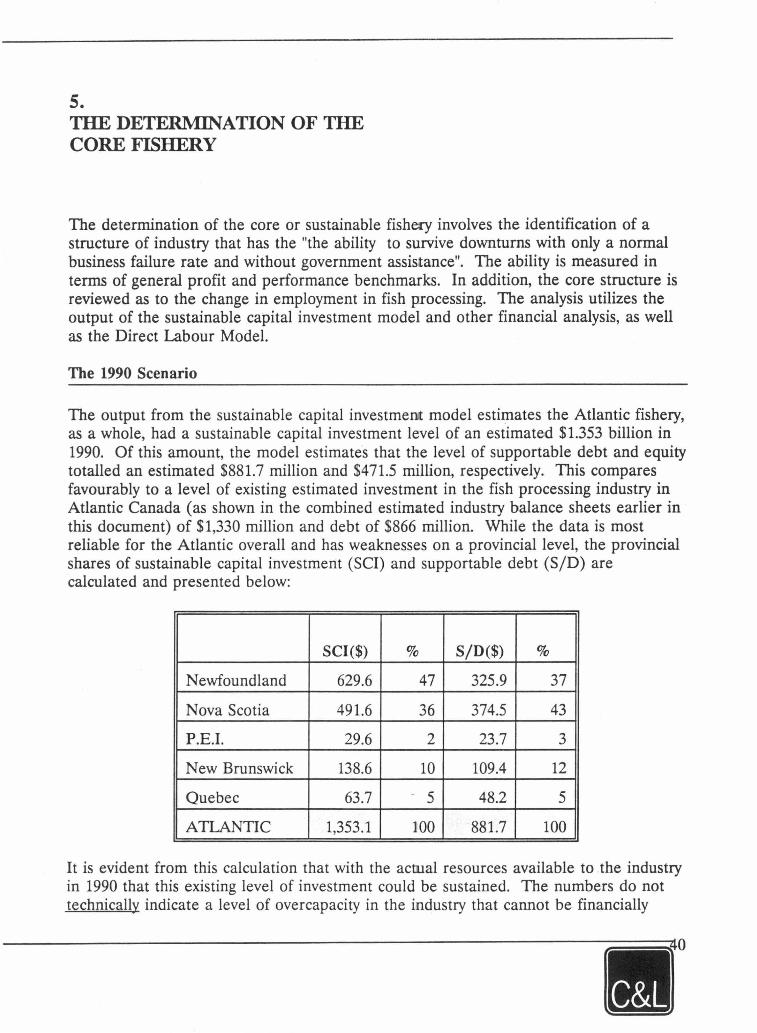
S. THE DETERMINATION OF THE CORE FISHERY
The determination of the core or sustainable fishery involves the identification of a structure of industry that has the "the ability to survive downturns with only a normal business failure rate and without government assistance". The ability is measured in terms of general profit and performance benchmarks. In addition, the core structure is reviewed as to the change in employment in fish processing. The analysis utilizes the output of the sustainable capital investment model and other financial analysis, as well as the Direct Labour Madel.
The 1990 Scenario
The output from the sustainable capital investment model estimates the Atlantic fishery, as a whole, had a sustainable capital investment level of an estimated $1.353 billion in 1990. Of this amount, the model estimates that the level of supportable debt and equity totalled an estimated $881.7 million and $471.5 million, respectively. This compares favourably to a level of existing estimated investment in the fish processing industry in Atlantic Canada (as shown in the combined estimated industry balance sheets earlier in this document) of $1,330 million and debt of $866 million. While the datais most reliable for the Atlantic overall and bas weaknesses on a provincial level, the provincial shares of sustainable capital investment (SCI) and supportable debt (S/D) are calculated and presented below:
SCI($) % S/D($) %
N ewf oundland 629.6 47 325.9 37
Nova Scotia 491.6 36 374.5 43
P.E.I. 29.6 2 23.7 3
New Brunswick 138.6 10 109.4 12
Quebec 63.7 - 5 48.2 5
ATLANTIC 1,353.1 100 881.7 100
It is evident from this calculation that with the acwal resources available to .the industry in 1990 that this existing level of investment could be sustained. The numbers do not technically indicate a level of overcapacity in the industry that cannot be financially
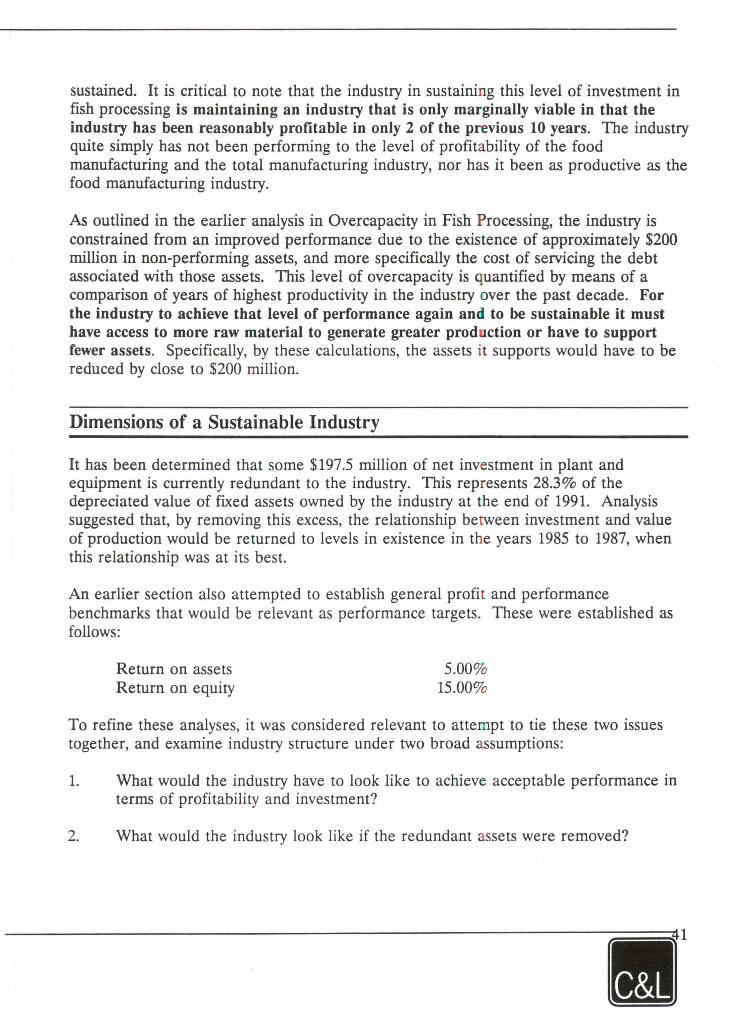
sustained. It is critical to note that the industry in sustaining this level of investment in fish processing is maintaining an industry that is only marginally viable in that the industry bas been reasonably profitable in only 2 of the previous 10 years. The industry quite simply has not been performing to the level of profitability of the food manufacturing and the total manufacturing industry, nor has it been as productive as the food manufacturing industry.
As outlined in the earlier analysis in Overcapacity in Fish Processing, the industry is constrained from an improved performance due to the existence of approximately $200 million in non-performing assets, and more specifically the cost of servicing the debt associated with those assets. This level of overcapacity is quantified by means of a comparison of years of highest productivity in the industry over the past decade. For the industry to achieve that level of performance again and to be sustainable it must have access to more raw material to generate greater production or have to support fewer assets. Specifically, by these calculations, the assets it supports would have to be reduced by close to $200 million.
Dimensions of a Sustainable Industry
It bas been determined that some $197.5 million of net investment in plant and equipment is currently redundant to the industry. This represents 28.3% of the depreciated value of fixed assets owned by the industry at the end of 1991. Analysis suggested that, by removing this excess, the relationship between investment and value of production would be returned to levels in existence in the years 1985 to 1987, when this relationship was at its best.
An earlier section also attempted to establish general profit and performance benchmarks that would be relevant as performance targets. These were established as follows:
Return on assets Retum on equity
5.00% 15.00%
To refine these analyses, it was considered relevant to attempt to tie these two issues together, and examine industry structure under two broad assumptions:
1. What would the industry have to look like to achieve acceptable performance in terms of profitability and investment?
2. What would the industry look like if the redundant assets were removed?
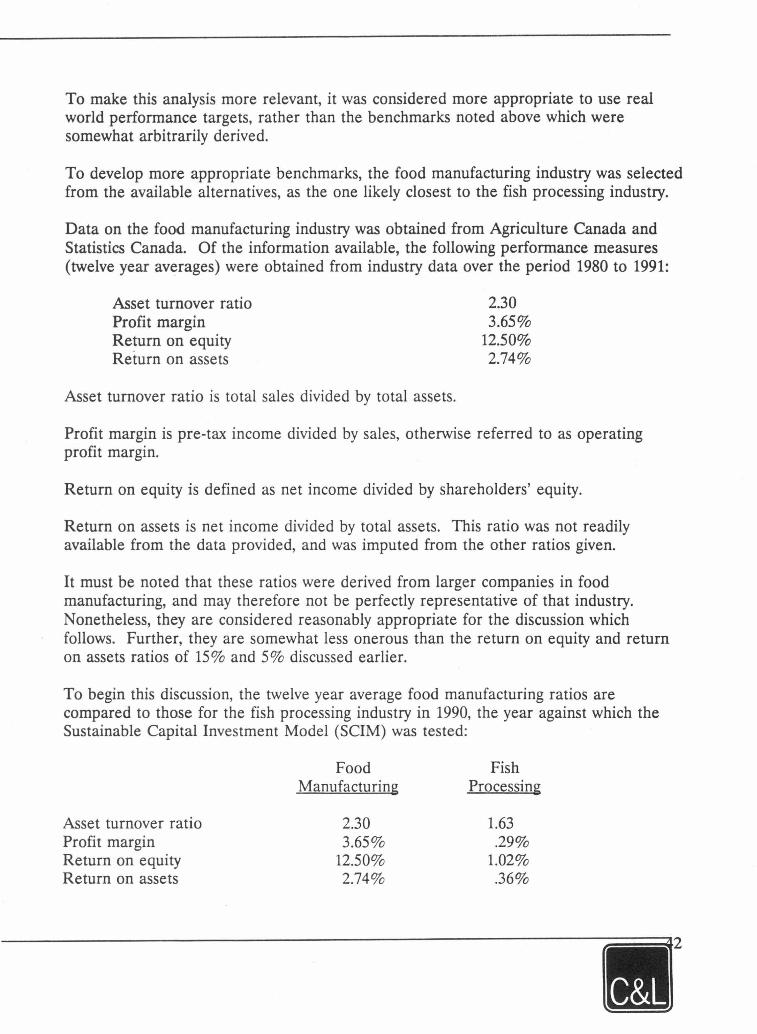
To make this analysis more relevant, it was considered more appropriate to use real world performance targets, rather than the benchmarks noted above which were somewhat arbitrarily derived.
To develop more appropriate benchrnarks, the food manufacturing industry was selected from the available alternatives, as the one likely closest to the fish processing industry.
Data on the food manufacturing industry was obtained from Agriculture Canada and Statistics Canada. Of the information available, the following performance measures (twelve year averages) were obtained from industry data over the period 1980 to 1991:
Asset turnover ratio Profit margin Retum on equity Reiurn on assets
Asset turnover ratio is total sales divided by total assets.
2.30 3.65%
12.50% 2.74%
Profit margin is pre-tax incarne divided by sales, otherwise referred to as operating profit margin.
Return on equity is defined as net incarne divided by shareholders' equity.
Return on assets is net incarne divided by total assets. This ratio was not readily available from the data provided, and was irnputed frorn the other ratios given.
It must be noted that these ratios were derived from larger cornpanies in food rnanufacturing, and rnay therefore not be perfectly representative of that industry. Nonetheless, they are considered reasonably appropriate for the discussion which follows. Further, they are sornewhat less onerous than the return on equity and retum on assets ratios of 15% and 5% discussed earlier.
To begin this discussion, the twelve year average food rnanufacturing ratios are compared to those for the fish processing industry in 1990, the year against which the Sustainable Capital Investrnent Madel (SCIM) was tested:
Asset turnover ratio Profit rnargin Retum on equity Return on assets
Food Manufacturing
2.30 3.65%
12.50% 2.74%
Fish Processing
1.63 .29%
1.02% .36%
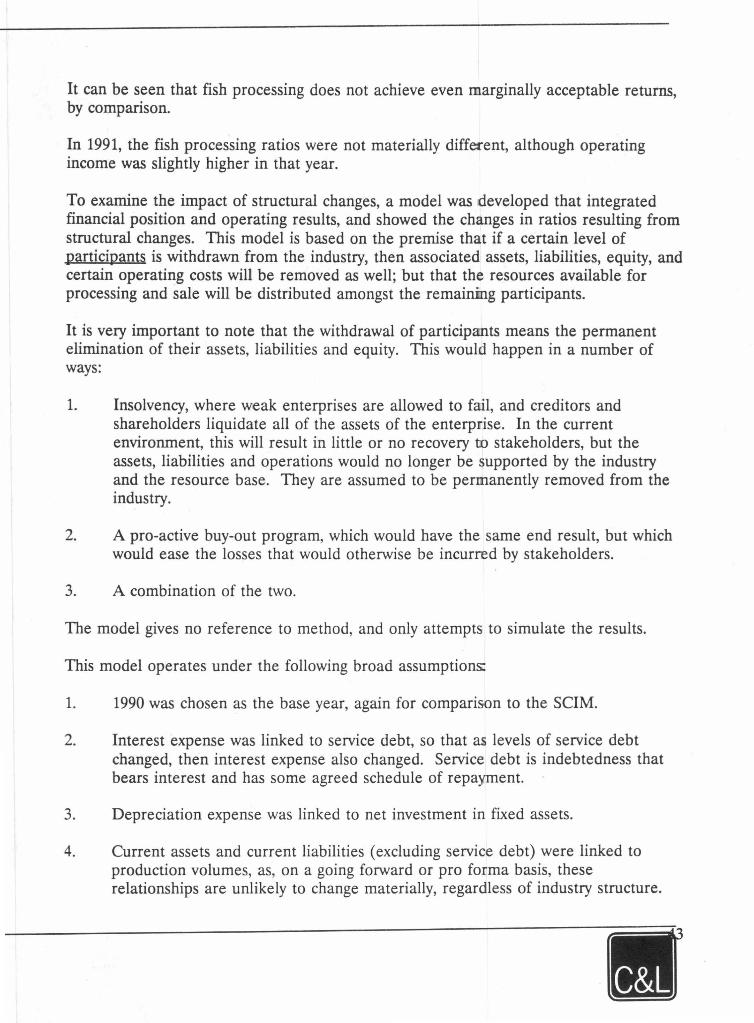
It can be seen that fish processing does not achieve even marginally acceptable returns, by comparison.
In 1991, the fish processing ratios were not materially diffet""ent, although operating incarne was slightly higher in that year.
To examine the impact of structural changes, a model was developed that integrated financial position and operating results, and showed the changes in ratios resulting from structural changes. This model is based on the premise that if a certain level of participants is withdrawn from the industry, then associated assets, liabilities, equity, and certain operating costs will be removed as well; but that the resources available for processing and sale will be distributed amongst the remaining participants.
It is very important to note that the withdrawal of participants means the permanent elimination of their assets, liabilities and equity. This would happen in a number of ways:
1. Insolvency, where weak enterprises are allowed to fail, and creditors and shareholders liquidate all of the assets of the enterprise. In the current environment, this will result in little or no recovery tD stakeholders, but the assets, liabilities and operations would no longer be supported by the industry and the resource base. They are assumed to be permanently removed from the industry.
2. A pro-active buy-out program, which would have the same end result, but which would ease the lasses that would otherwise be incurred by stakeholders.
3. A combination of the two.
The mode! gives no reference to method, and only attempts to simulate the results.
This model operates under the following broad assumptions:
1. 1990 was chosen as the base year, again for comparison to the SCIM.
2. Interest expense was linked to service debt, so that as levels of service debt changed, then interest expense also changed. Service debt is indebtedness that bears interest and bas some agreed schedule of repayment.
3. Depreciation expense was linked to net investment in fixed assets.
4. Current assets and current liabilities ( excluding service debt) were linked to production volumes, as, on a going forward or pro forma basis, these relationships are unlikely to change materially, regardless of industry structure.
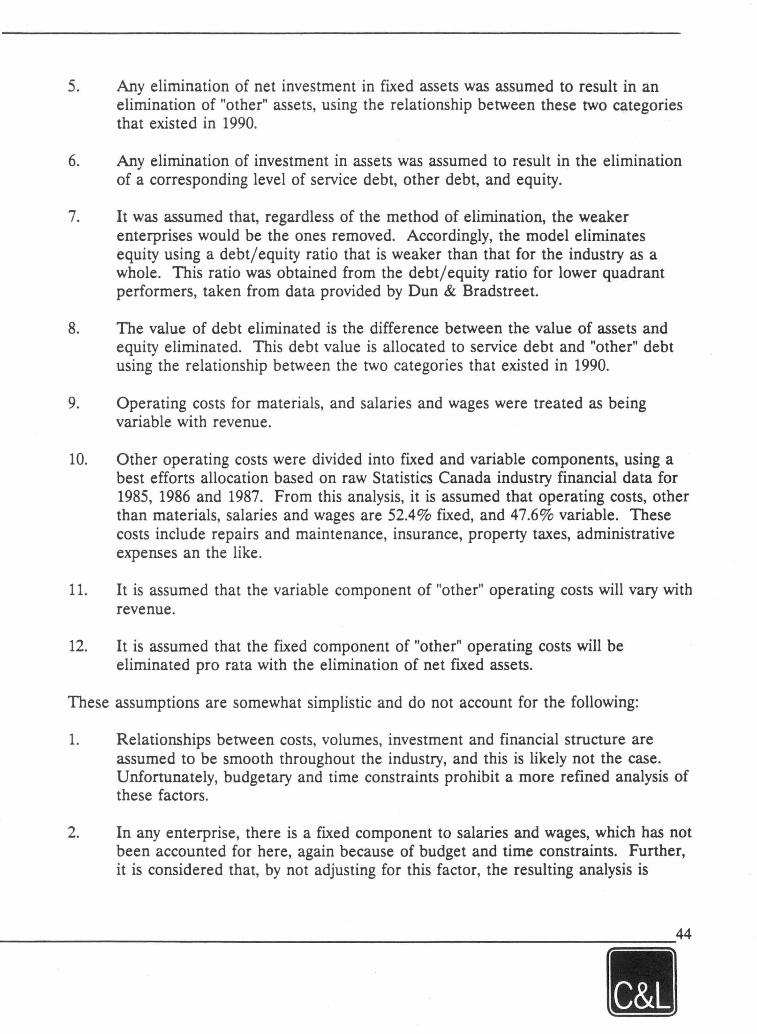
5. Any elimination of net investment in fixed assets was assumed to result in an elimination of "other" assets, using the relationship between these two categories that existed in 1990.
6. Any elimination of investment in assets was assumed to result in the elimination of a corresponding level of service debt, other debt, and equity.
7. It was assumed that, regardless of the method of elimination, the weaker enterprises would be the ones removed. Accordingly, the model eliminates equity using a debt/ equity ratio that is weaker than that for the industry as a whole. This ratio was obtained from the debt/ equity ratio for lower quadrant perf ormers, taken from data provided by Dun & Bradstreet.
8. The value of debt eliminated is the difference between the value of assets and equity eliminated. This debt value is allocated to service debt and "other" debt using the relationship between the two categories that existed in 1990.
9. Operating costs for materials, and salaries and wages were treated as being variable with revenue.
10. Other operating costs were divided into fixed and variable components, using a best efforts allocation based on raw Statistics Canada industry financial data for 1985, 1986 and 1987. From this analysis, it is assumed that operating costs, other than materials, salaries and wages are 52.4% fixed, and 47.6% variable. These costs include repairs and maintenance, insurance, property taxes, administrative expenses an the like.
11. It is assumed that the variable component of "other" operating costs will vary with revenue.
12. It is assumed that the fixed component of "other" operating costs will be eliminated pro rata with the elimination of net fixed assets.
These assumptions are somewhat simplistic and do not account for the following:
1. Relationships between costs, volumes, investment and financial structure are assumed to be smooth throughout the industry, and this is likely not the case. Unfortunately, budgetary and time constraints prohibit a more refined analysis of these factors.
2. In any enterprise, there is a fixed component to salaries and wages, which bas not been accounted for here, again because of budget and time constraints. Further, it is considered that, by not adjusting for this factor, the resulting analysis is
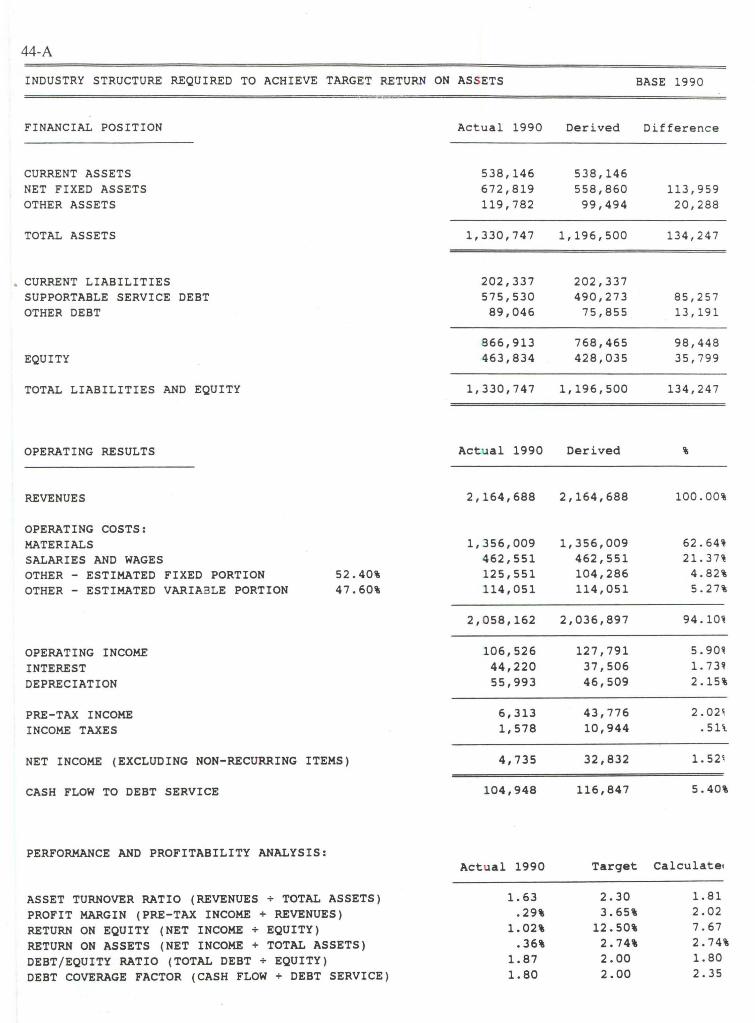
44-A
INDUSTRY STRUCTURE REQUIRED TO ACHIEVE TARGET RE TURN ON AS SETS
FINANCIAL POSITION
CURRENT ASSETS NET FIXED ASSETS OTHER ASSETS
TOTAL ASSETS
• CURRENT LIABILITIES SUPPORTABLE SERVICE DEBT OTHER DEBT
EQUITY
TOTAL LIABILITIES AND EQUITY
OPERATING RESULTS
REVENUES
OPERATING COSTS: MATERIALS SALARIES AND WAGES OTHER - ESTIMATED FIXED PORTION OTHER - ESTIMATED VARIABLE PORTION
OPERATING INCOME INTEREST DEPRECIATION
PRE-TAX INCOME INCOME TAXES
NET INCOME (EXCLUDING NON-RECURRING
CASH FLOW TO DEBT SERVICE
52.40% 47.60%
ITEMS)
PERFORMANCE AND PROFITABILITY ANALYSIS:
ASSET TURNOVER RATIO (REVENUES + TOTAL ASSETS) PROFIT MARGIN (PRE-TAX INCOME + REVENUES) RETURN ON EQUITY (NET INCOME + EQUITY) RETURN ON ASSETS (NET INCOME + TOTAL ASSETS) DEBT/EQUITY RATIO (TOTAL DEBT + EQUITY) DEBT COVERAGE FACTOR (CASH FLOW + DEBT SERVICE)
Actual 1990
538,146 672, 819 119,782
1,330,747
202,337 575,530 89,046
866,913 463,834
1,330,747
Actu al 1990
2,164,688
1,356,009 462,551 125,551 114,051
2,058,162
106,526 44,220 55,993
6,313 1,578
4,735
104,948
Actual 1990
1. 63 .29%
1.02% .36%
1.87 1.80
BASE 1990
Derived
538,146 558,860 99,494
1,196,500
202,337 490,273
75,855
768,465 428,035
1,196,500
Derived
2,164,688
1,356,009 462,551 104,286 114,051
2,036,897
127,791 37,506 46,509
43,776 10,944
32,832
116,847
Target
2.30 3.65%
12.50% 2. 74% 2.00 2.00
Difference
113,959 20,288
134,247
85,257 13 , 191
98,448 35,799
134,247
100.00%
62.60 21.3n
4.82% 5 . 27%
94 . 101
5. 901 1. 731 2.15%
2. 02 1•
.5H
1. 52 1
5.40%
Calculatec
1.81 2.02 7.67 2.74% 1. 80 2.35
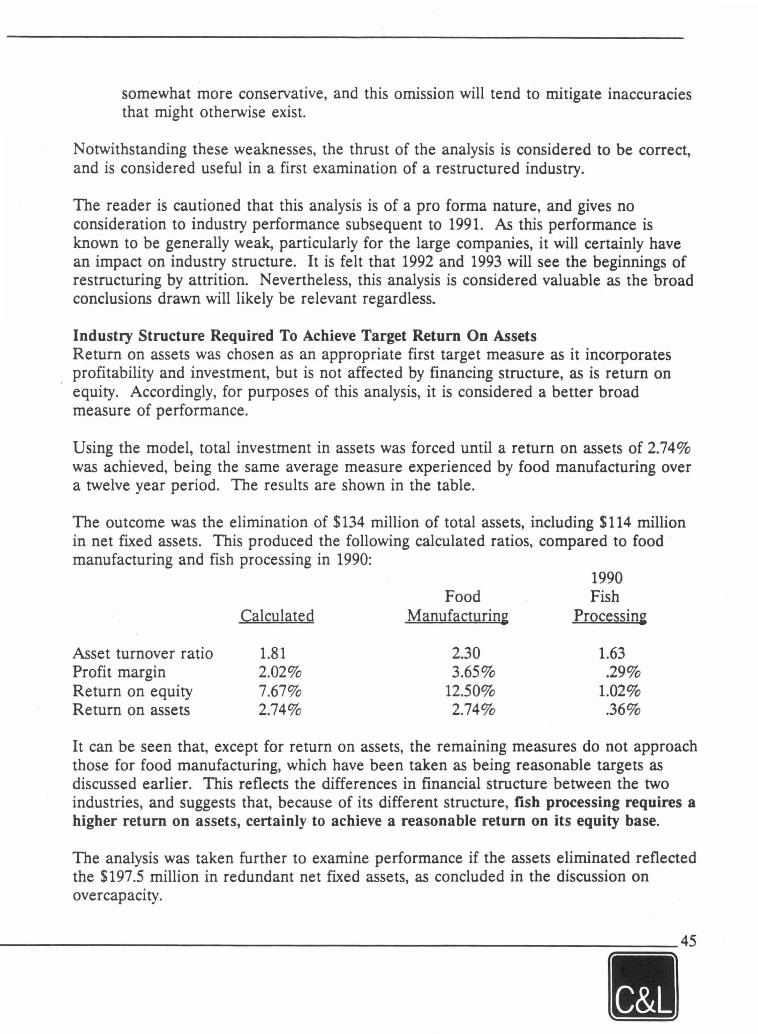
somewhat more conservative, and this omission will tend to mitigate inaccuracies that might otherwise exist.
Notwithstanding these weaknesses, the thrust of the analysis is considered to be correct, and is considered useful in a first examination of a restructured industry.
The reader is cautioned that this analysis is of a pro forma nature, and gives no consideration to industry performance subsequent to 1991. As this performance is known to be generally weak, particularly for the large companies, it will certainly have an impact on industry structure. It is felt that 1992 and 1993 will see the beginnings of restructuring by attrition. N evertheless, this analysis is considered valuable as the broad conclusions drawn will likely be relevant regardless.
lndustry Structure Required To Achieve Target Return On Assets Retum on assets was chosen as an appropriate first target measure as it incorporates profitability and investment, but is not affected by financing structure, as is retum on equity. Accordingly, for purposes of this analysis, it is considered a better broad measure of performance.
Using the model, total investment in assets was forced until a retum on assets of 2.74% was achieved, being the same average measure experienced by food manufacturing over a twelve year period. The results are shown in the table.
The outcome was the elimination of $134 million of total assets, including $114 million in net fixed assets. This produced the following calculated ratios, compared to food manufacturing and fish processing in 1990:
1990 Food Fish
Calculated Manufacturing Processing
Asset turnover ratio 1.81 2.30 1.63 Profit margin 2.02% 3.65% .29% Retum on equity 7.67% 12.50% 1.02% Retum on assets 2.74% 2.74% .36%
It can be seen that, except for retum on assets, the remaining measures do not approach those for food manufacturing, which have been taken as being reasonable targets as discussed earlier. This reflects the differences in financial structure between the two industries, and suggests that, because of its different structure, fish processing requires a higher return on assets, certainly to achieve a reasonable return on its equity base.
The analysis was taken further to examine performance if the assets eliminated reflected the $197.5 million in redundant net fixed assets, as concluded in the discussion on overcapacity.
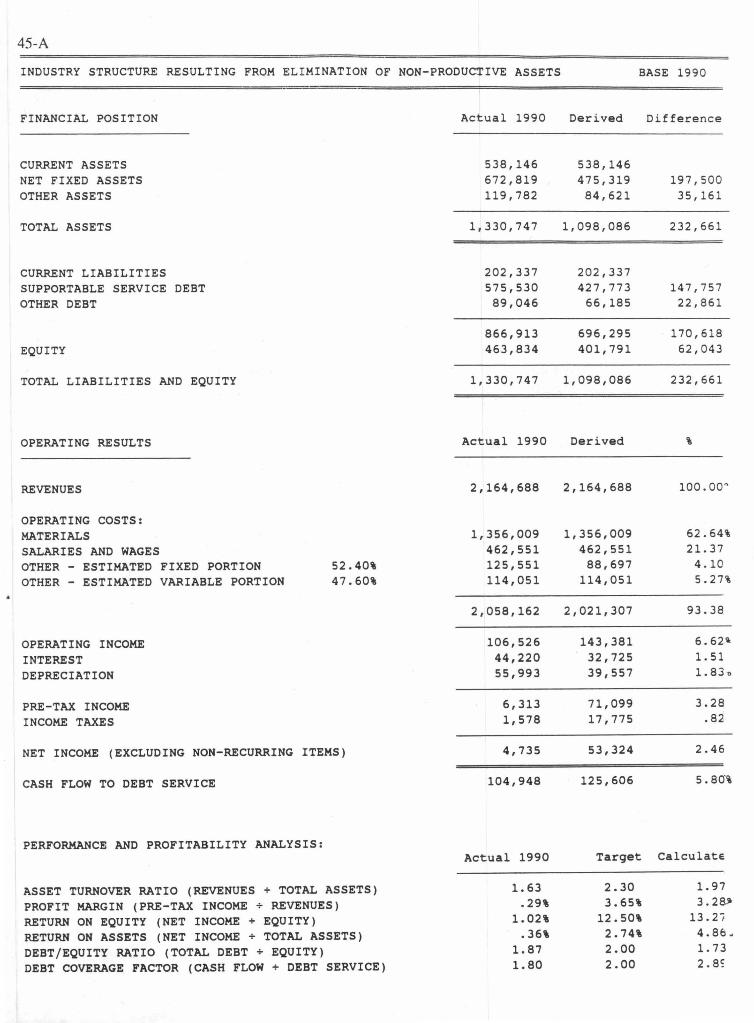
45-A
INDUSTRY STRUCTURE RESULTING FROM ELIMINATION OF NON-PRODUCTIVE ASSETS
FINANCIAL POSITION
CURRENT ASSETS NET FIXED ASSETS OTHER ASSETS
TOTAL ASSETS
CURRENT LIABILITIES SUPPORTABLE SERVICE DEBT OTHER DEBT
EQUITY
TOTAL LIABILITIES AND EQUITY
OPERATING RESULTS
REVENUES
OPERATING COSTS: MATERIALS SALARIES AND WAGES OTHER - ESTIMATED FIXED PORTION OTHER - ESTIMATED VARIABLE PORTION
OPERATING INCOME INTEREST DEPRECIATION
PRE-TAX INCOME INCOME TAXES
52.40\ 47.60\
NET INCOME (EXCLUDING NON-RECURRING ITEMS)
CASH FLOW TO DEBT SERVICE
PERFORMANCE AND PROFITABILITY ANALYSIS:
ASSET TURNOVER RATIO (REVENUES + TOTAL ASSETS) PROFIT MARGIN ( PRE-TAX INCOME + REVENUES) RETURN ON EQUITY (NET INCOME + EQUITY) RETURN ON ASSETS (NET INCOME + TOTAL ASSETS) DEBT/EQUITY RATIO (TOTAL DEBT + EQUITY) DEBT COVERAGE FACTOR (CASH FLOW + DEBT SERVICE)
Actual 1990
538,146 672, 819 119,782
1,330,747
202,337 575,530 89,046
866,913 463,834
1,330,747
Actual 1990
2,164,688
1,356,009 462,551 125,551 114,051
2,058,162
106,526 44,220 55,993
6,313 1,578
4,735
104,948
Actual 1990
1. 63 .29\
1.02\ .36\
1.87 1.80
BASE 1990
Derived
538,146 475,319 84,621
1,098,086
202,337 427,773
66,185
696,295 401,791
1,098,086
Derived
2,164,688
1,356,009 462,551
88,697 114,051
2,021,307
143,381 32,725 39,557
71,099 17,775
53,324
125,606
Target
2.30 3.65\
12.50\ 2.74\ 2.00 2.00
Dif ference
197,500 35,161
232,661
147,757 22,861
170,618 62,043
232,661
100.00"
62.64% 21. 37
4.10 5 . 27%
93 . 38
6 . 62i< 1. 51 1.83 0
3.28 .82
2.46
5. 80"\
Calcula te
1. 97 3. 2B»
13.2 î 4.86. 1. 73 2.8~
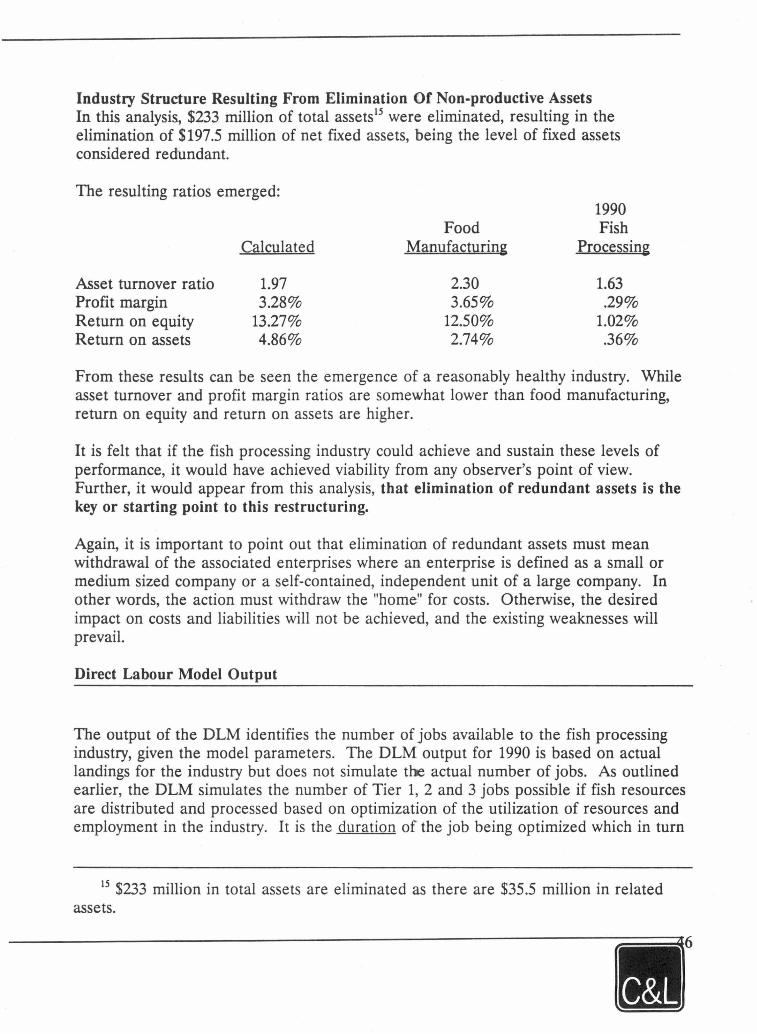
Industry Structure Resulting From Elimination Of Non-productive Assets In this analysis, $233 million of total assets 15 were eliminated, resulting in the elimination of $197.5 million of net fixed assets, being the level of fixed assets considered redundant.
The resulting ratios emerged: 1990
Food Fish Calculated Manufacturing Processing
Asset turnover ratio 1.97 2.30 1.63 Profit margin 3.28% 3.65% .29% Return on equity 13.27% 12.50% 1.02% Return on assets 4.86% 2.74% .36%
From these results can be seen the emergence of a reasonably healthy industry. While asset turnover and profit margin ratios are somewhat lower than food manufacturing, return on equity and return on assets are higher.
It is felt that if the fish processing industry could achieve and sustain these levels of performance, it would have achieved viability from any observer's point of view. Further, it would appear from this analysis, that elimination of redundant assets is the key or starting point to this restructuring.
Again, it is important to point out that eliminatian of redundant assets must mean withdrawal of the associated enterprises where an enterprise is defined as a small or medium sized company or a self-contained, independent unit of a large company. In other words, the action must withdraw the "home" for costs. Otherwise, the desired impact on costs and liabilities will not be achieved, and the existing weaknesses will prevail.
Direct Labour Madel Output
The output of the DLM identifies the number of jobs available to the fish processing industry, given the model parameters. The DLM output for 1990 is based on actual landings for the industry but does not simulate tlle actual number of jobs. As outlined earlier, the DLM simulates the number of Tier 1, 2 and 3 jobs possible if fish resources are distributed and processed based on optimization of the utilization of resources and employment in the industry. It is the duration of the job being optimized which in turn
15 $233 million in total assets are eliminated as there are $35.5 million in related assets.
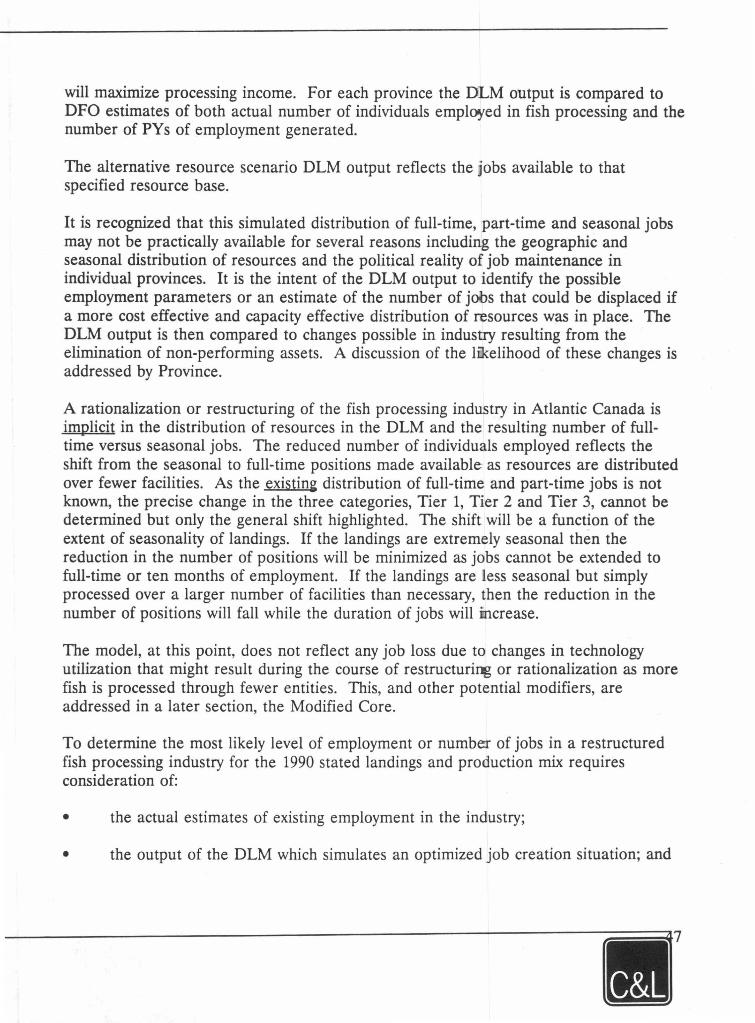
will maximize processing incarne. For each province the DLM output is compared to DFO estimates of bath actual number of individuals empl~ed in fish processing and the number of PY s of employment generated.
The alternative resource scenario DLM output reflects the jobs available to that specified resource base.
It is recognized that this simulated distribution of full-time, part-time and seasonal jobs may not be practically available for several reasons including the geographic and seasonal distribution of resources and the political reality of job maintenance in individual provinces. It is the intent of the DLM output to identify the possible employment parameters or an estimate of the number of jobs that could be displaced if a more cost effective and capacity effective distribution of resources was in place. The DLM output is then compared to changes possible in industry resulting from the elimination of non-performing assets. A discussion of the li.kelihood of these changes is addressed by Province.
A rationalization or restructuring of the fish processing industry in Atlantic Canada is implicit in the distribution of resources in the DLM and the resulting number of fulltime versus seasonal jobs. The reduced number of individuals employed reflects the shift from the seasonal to full-time positions made available as resources are distributed over fewer facilities. As the existing distribution of full-time and part-time jobs is not known, the precise change in the three categories, Tier 1, Tier 2 and Tier 3, cannot be determined but only the general shift highlighted. The shift will be a function of the extent of seasonality of landings. If the landings are extremely seasonal thën the reduction in the number of positions will be minimized as jobs cannot be extended to full-time or ten months of employment. If the landings are less seasonal but simply processed over a larger number of facilities than necessary, then the reduction in the number of positions will fall while the duration of jobs will Ïncrease.
The model, at this point, does not reflect any job loss due to changes in technology utilization that might result during the course of restructuring or rationalization as more fish is processed through fewer entities. This, and other potential modifiers, are addressed in a later section, the Modified Core.
To determine the most likely level of employment or number of jobs in a restructured fish processing industry for the 1990 stated landings and production mix requires consideration of:
• the actual estimates of existing employment in the industry;
• the output of the DLM which simulates an optimized job creation situation; and
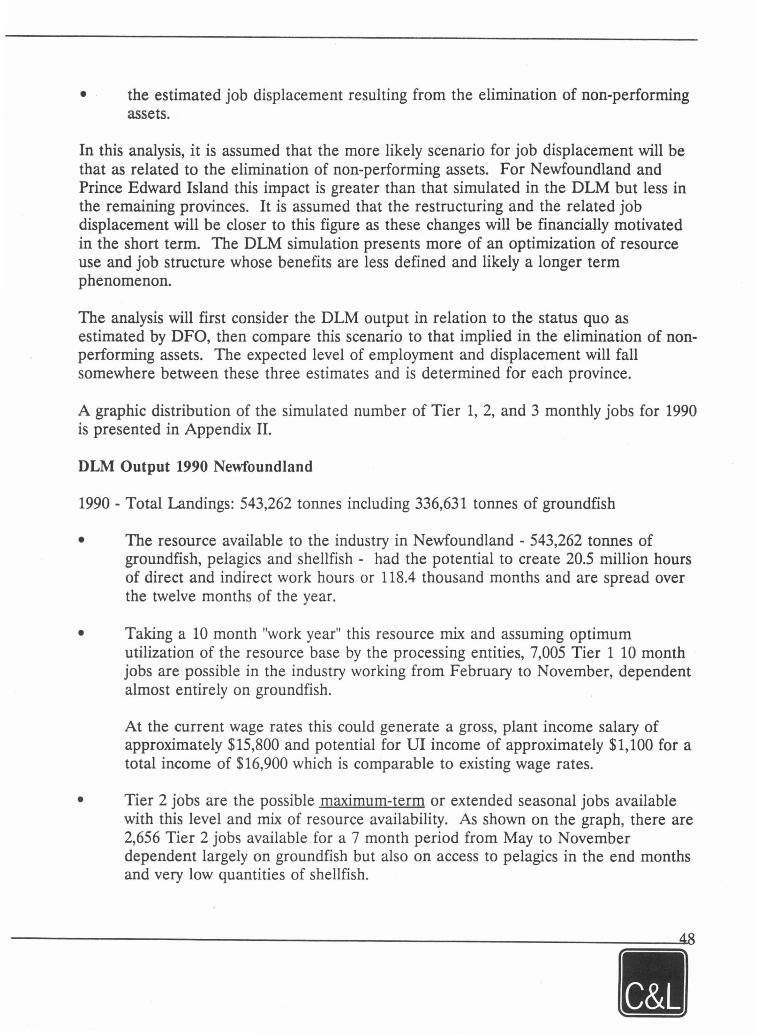
• the estimated job displacement resulting from the elimination of non-performing assets.
In this analysis, it is assumed that the more likely scenario for job displacement will be that as related to the elimination of non-performing assets. For Newfoundland and Prince Edward Island this impact is greater than that simulated in the DLM but less in the remaining provinces. It is assumed that the restructuring and the related job displacement will be doser to this figure as these changes will be financially motivated in the short term. The DLM simulation presents more of an optimization of resource use and job structure whose benefits are less defined and likely a longer term phenomenon.
The analysis will first consider the DLM output in relation to the status quo as estimated by DFO, then compare this scenario to that implied in the elimination of nonperforming assets. The expected level of employment and displacement will fall somewhere between these three estimates and is determined for each province.
A graphie distribution of the simulated number of Tier 1, 2, and 3 monthly jobs for 1990 is presented in Appendix II.
DLM Output 1990 Newfoundland
1990 - Total Landings: 543,262 tonnes including 336,631 tonnes of groundfish
• The resource available to the industry in Newfoundland - 543,262 tonnes of groundfish, pelagics and shellfish - had the potential to create 20.5 million hours of direct and indirect work hours or 118.4 thousand months and are spread over the twelve months of the year.
• Taking a 10 month "work year" this resource mix and assuming optimum utilization of the resource base by the processing entities, 7,005 Tier 1 10 month jobs are possible in the industry working from February to November, dependent almost entirely on groundfish.
At the current wage rates this could generate a gross, plant incarne salary of approximately $15,800 and potential for UI incarne of approximately $1, 100 for a total incarne of $16,900 which is comparable to existing wage rates.
• Tier 2 jobs are the possible maximum-term or extended seasonal jobs available with this level and mix of resource availability. As shown on the graph, there are 2,656 Tier 2 jobs available for a 7 month period from May to November dependent largely on groundfish but also on access to pelagics in the end months and very low quantities of shellfish.
' . •
~
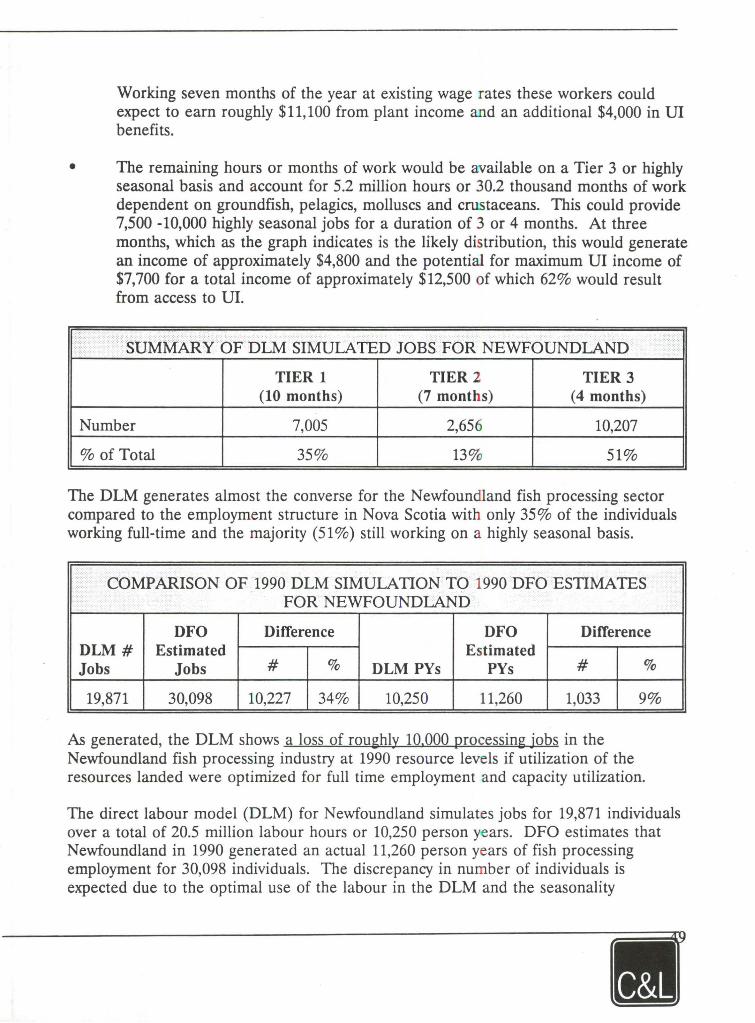
Working seven months of the year at existing wage rates these workers could expect to eam roughly $11, 100 from plant incarne and an additional $4,000 in UI benefits.
• The remaining hours or months of work would be available on a Tier 3 or highly seasonal basis and account for 5.2 million hours or 30.2 thousand months of work dependent on groundfish, pelagics, molluscs and crustaceans. This could provide 7,500 -10,000 highly seasonal jobs for a duration of 3 or 4 months. At three months, which as the graph indicates is the likely distribution, this would generate an incarne of approximately $4,800 and the potential for maximum UI incarne of $7,700 for a total incarne of approximately $12,500 of which 62% would result from access to UI.
> SUMMARY OF DLM SIMULATED JOBS FOR NEWFOUNDLAND
TIER 1 TIER 2 TIER3 (10 months) (7 months) (4 months)
Number 7,005 2,656 10,207
% of Total 35% 13% 51%
The DLM generates almost the converse for the Newfoundland fish processing sector compared to the employment structure in Nova Scotia with only 35% of the individuals working full-time and the majority (51 % ) still working on a highly seasonal basis.
COMPARISON OF 1990 DLM SIMULATION TO 1990 DFO ESTIMATES FOR NEWFOUNDLAND
DFO Difference DFO Difference DLM# Estimated Estimated Jobs Jobs # % DLM PYs PYs # %
19,871 30,098 10,227 34% 10,250 11,260 1,033 9%
As generated, the DLM shows a Joss of roughly 10.000 processing jobs in the Newfoundland fish processing industry at 1990 resource levels if utilization of the resources landed were optimized for full time employment and capacity utilization.
,,
The direct labour model (DLM) for Newfoundland simulates jobs for 19,871 individuals over a total of 20.5 million labour hours or 10,250 persan years. DFO estimates that Newfoundland in 1990 generated an actual 11,260 persan years of fish processing employment for 30,098 individuals. The discrepancy in number of individuals is expected due to the optimal use of the labour in the DLM and the seasonality
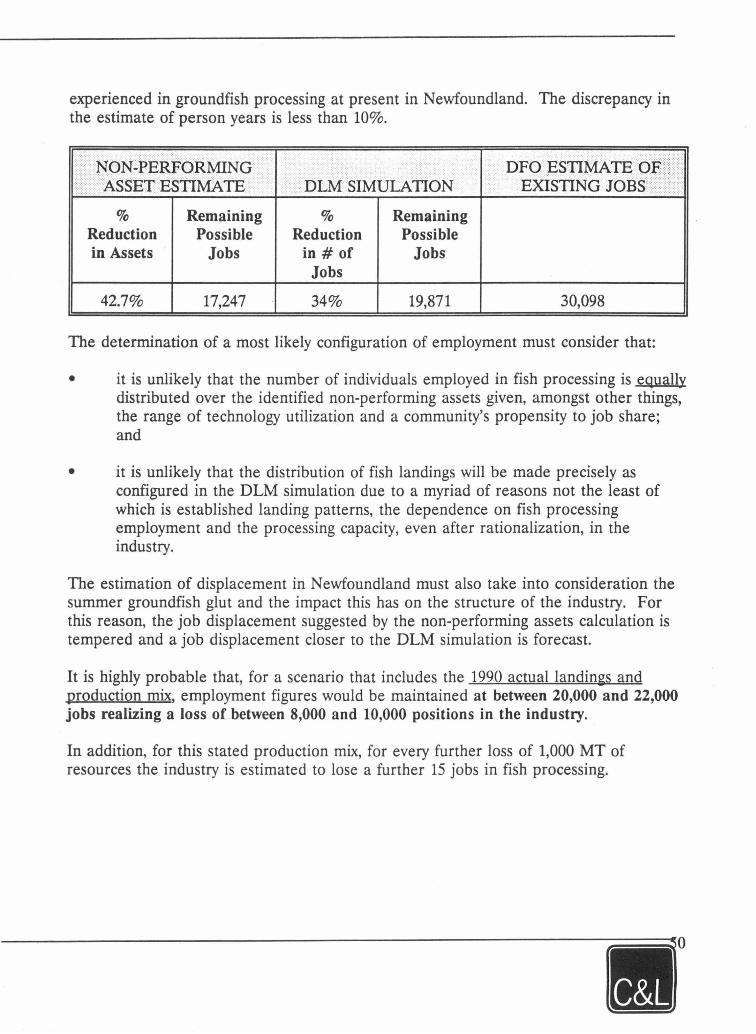
experienced in groundfish processing at present in Newfoundland. The discrepancy in the estimate of persan years is less than 10%.
'''·' NON-PERFORMING
... ASSETESTIMA TE .. DLMSIMULATION D~~~ii~~~i·•••1•••••1••···· % Remaining % Remaining
Reduction Possible Reduction Possible in Assets Jobs in# of Jobs
Jobs
42.7% 17,247 34% 19,871 30,098
The determination of a most likely configuration of employment must consider that:
• it is unlikely that the number of individuals employed in fish processing is equally distributed over the identified non-performing assets given, amongst other things, the range of technology utilization and a community's propensity to job share; and
• it is unlikely that the distribution of fish lanclings will be made precisely as configured in the DLM simulation due to a myriad of reasons not the least of which is established landing patterns, the dependence on fish processing employment and the processing capacity, even after rationalization, in the industry.
The estimation of displacement in Newfoundland must also take into consideration the summer groundfish glut and the impact this bas on the structure of the industry. For this reason, the job displacement suggested by the non-performing assets calculation is tempered and a job displacement doser to the DLM simulation is forecast.
It is highly probable that, for a scenario that includes the 1990 actual landings and production mix, employment figures would be maintained at between 20,000 and 22,000 jobs realizing a loss of between 8,000 and 10,000 positions in the industry.
In addition, for this stated production mix, for every further loss of 1,000 MT of resources the industry is estimated to lose a further 15 jobs in fish processing.
[CM]'
DLM Output 1990 Nova Scotia
Total Landings: 407,224 tonnes 16 including 230,762 tonnes groundfish
• The resource available to the industry Nova Scotia - 407,224 tonnes of groundfish, pelagics and shellfish - had the potential to create roughly 13 million labour hours or 75.8 thousand months of direct and indirect processing work, spread over 12 months of the year.
• Taking a 10 month "work year" this resource mix aoo assuming optimum utilization of the resource base by the processing errtities, 5,088 Tier 1 jobs are possible in the industry working from February to November and dependent largely on groundfish with some pelagic and shellfish throughput.
At the current wage rates this could generate a gross, plant income salary of approximately $16,000 and potential for UI income of approximately $1,10017
for a total income of $17,100 which is comparable to average actual earnings for the industry for 1990.
• Tier 2 jobs are the possible maximum-term or extended seasonal jobs available with this level and mix of resource availability. As shown on the graph there are 1,893 Tier 2 jobs available for a 7 month period from May to November dependent largely on pelagics but also on access to ~roundfish and shellfish.
Working seven months of the year at existing wage rates these workers could expect to eam roughly $11,100 from plant incarne and an additional $4,000 in UI benefits for a total income of roughly $15, 100.
• The remaining hours or months of work would be available on a Tier 3 or highly seasonal basis and account for 2.1 million hours or 12.2 thousand months of work dependent on groundfish, pelagics, molluscs and crustaceans. This could provide . 3, 100 highly seasonal jobs for a duration of 4 months. This would generate an income of approximately $6,300 and the potential for maximum UI incarne of $7,100 for a total incarne of approximately $13,400 af which 53% would result from access to UI.
16 The landings data differs from the MDM due to the adjustment for scallop weights. The MDM is based on round, shell-on weight and the SCIM is based on meat weight.
17 This number is based on the recipient earning 60% of gross earnings during the benefit period and that benefit period extending for the rernainder of the year less a 2 -4 week period.
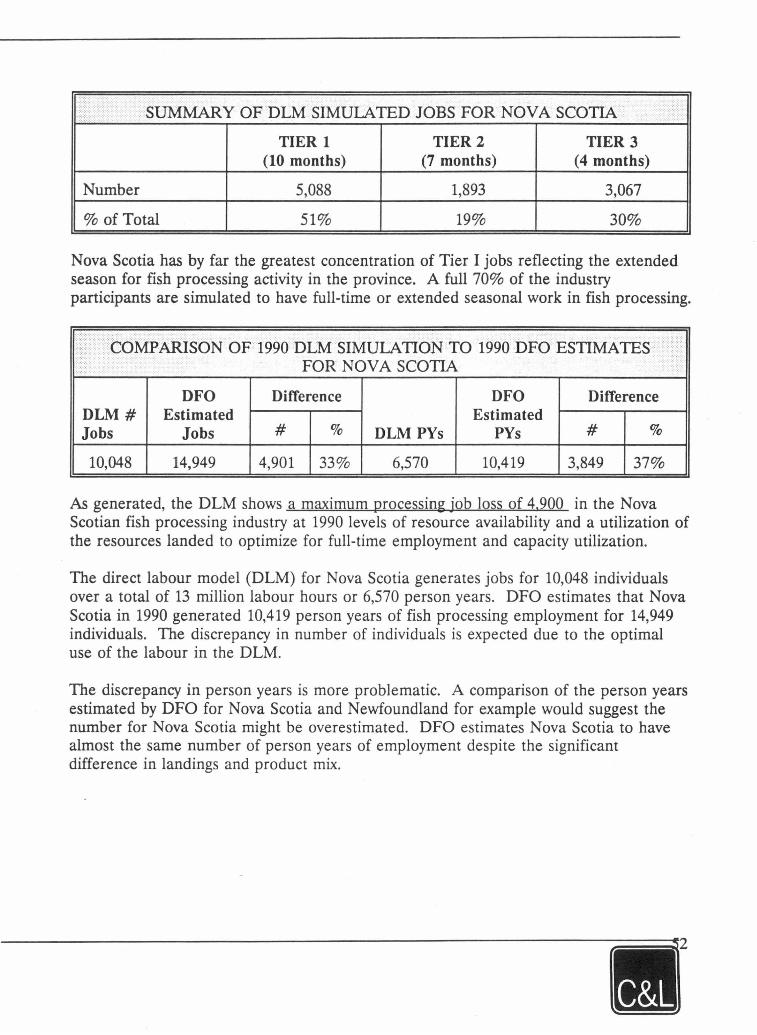
i ./.: .. SUMMARY OFDLM SIMULATED JOBS FOR NOVA SCOTIA ·
TIER 1 TIER2 TIER3 (10 months) (7 months) (4 months)
Number 5,088 1,893 3,067
% of Total 51% 19% 30%
Nova Scotia has by far the greatest concentration of Tier 1 jobs reflecting the extended season for fish processing activity in the province. A full 70% of the industry participants are simulated to have full-time or extended seasonal work in fish processing.
CdMPARISON OF1990 DLM SIMULATION TO 1990 DFO ESTIMATES ·u FOR NOV A SCOTIA
DFO Difference DFO Difference DLM# Estimated Estimated Jobs Jobs # % DLM PYs PYs # %
10,048 14,949 4,901 33% 6,570 10,419 3,849 37%
As generated, the DLM shows a maximum processing job Joss of 4.900 in the Nova Scotian fish processing industry at 1990 levels of resource availability and a utilization of the resources landed to optimize for full-time employment and capacity utilization.
The direct labour model (DLM) for Nova Scotia generates jobs for 10,048 individuals over a total of 13 million labour hours or 6,570 persan years. DFO estimates that Nova Scotia in 1990 generated 10,419 persan years of fish processing employment for 14,949 individuals. The discrepancy in number of individuals is expected due to the optimal use of the labour in the DLM.
The discrepancy in persan years is more problematic. A comparison of the person years estimated by DFO for Nova Scotia and Newfoundland for e.xample would suggest the number for Nova Scotia might be overestimated. DFO estimates Nova Scotia to have almost the same number of persan years of employment despite the significant difference in landings and product mix.
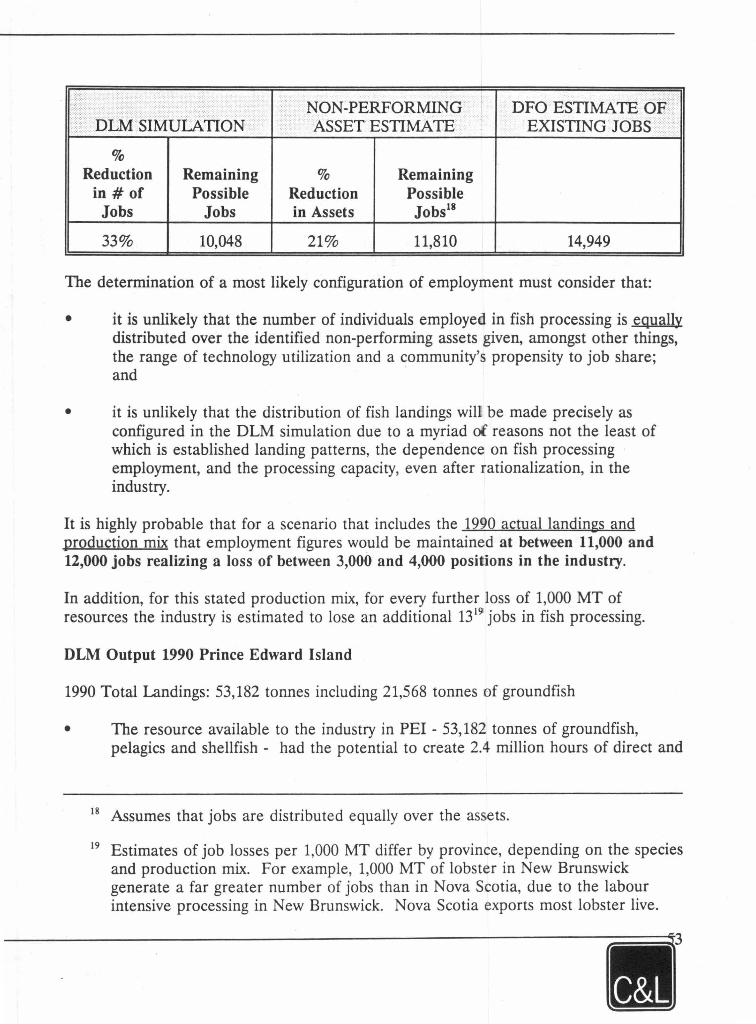
••••••••
> .
NON-PERFORMING DFO ESTIMA TE OF\ .··-.-.·. .·.··. .
DLM SIMULATION ··••2
ASSETESTIMATE EXISTING JOBS ·•· ....•
% Reduction Remaining % Remaining in# of Possible Reduction Possible
Jobs Jobs in Assets Jobs18
33% 10,048 21% 11,810 14,949
The determination of a most likely configuration of employment must consider that:
• it is unlikely that the number of individuals employed in fish processing is equally distributed over the identified non-performing assets given, amongst other things, the range of technology utilization and a community's propensity to job share; and
• it is unlikely that the distribution of fish landings wilI be made precisely as configured in the DLM simulation due to a myriad of reasons not the least of which is established landing patterns, the dependence on fish processing employment, and the processing capacity, even after rationalization, in the industry.
It is highly probable that for a scenario that includes the 1990 actual landings and production mix that employment figures would be maintained at between 11,000 and 12,000 jobs realizing a loss of between 3,000 and 4,000 positions in the industry.
In addition, for this stated production mix, for every further loss of 1,000 MT of resources the industry is estimated to lose an additional 13 19 jobs in fish processing.
DLM Output 1990 Prince Edward Island
1990 Total Landings: 53,182 tonnes including 21,568 tonnes of groundfish
• The resource available to the industry in PEI - 53, 182 tonnes of groundfish, pelagics and shellfish - had the potential to create 2.4 million hours of direct and
18 Assumes that jobs are distributed equally over the assets.
19 Estimates of job losses per 1,000 MT differ by province, depending on the species and production mix. For example, 1,000 MT of lobster in New Brunswick generate a far greater number of jobs than in Nova Scotia, due to the labour intensive processing in New Brunswick. Nova Scotia exports most lobster live.
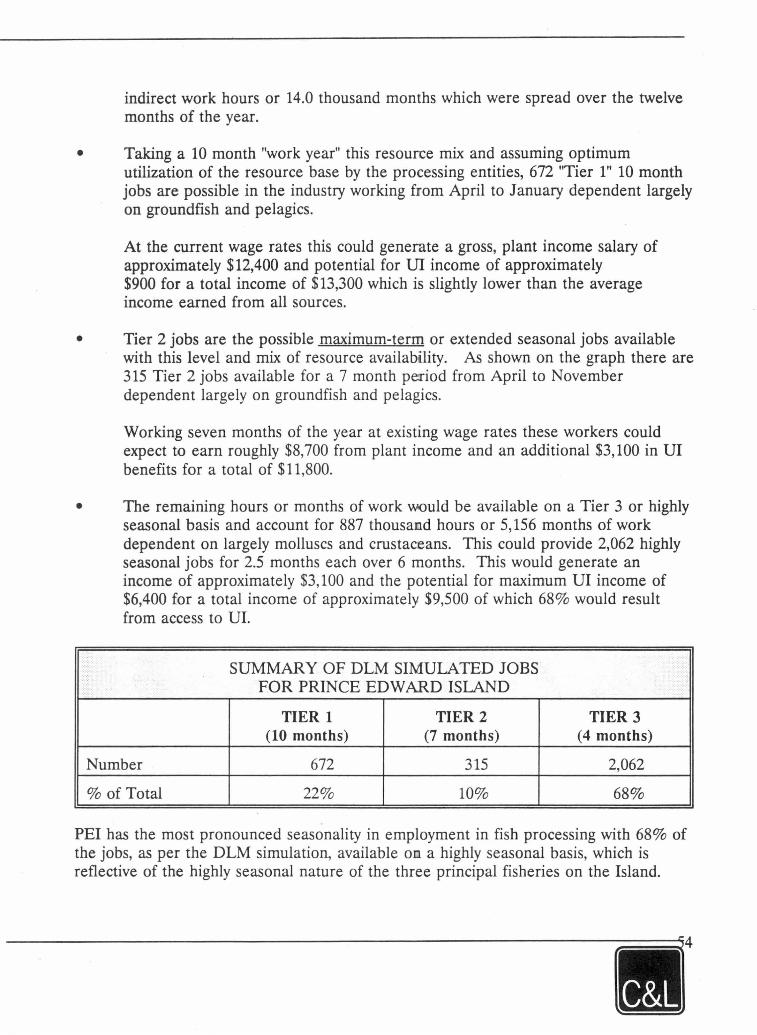
indirect work hours or 14.0 thousand months which were spread over the twelve months of the year.
• Taking a 10 month "work year" this resource mix and assuming optimum utilization of the resource base by the processing entities, 672 "Tier 1" 10 month jobs are possible in the industry working from April to January dependent largely on groundfish and pelagics.
At the current wage rates this could generate a gross, plant incarne salary of approximately $12,400 and potential for UI incarne of approximately $900 for a total incarne of $13,300 which is slightly lower than the average incarne earned from all sources.
• Tier 2 jobs are the possible maximum-term or extended seasonal jobs available with this level and mix of resource availability. As shown on the graph there are 315 Tier 2 jobs available for a 7 month period from April to November dependent largely on groundfish and pelagics.
Working seven months of the year at existing wage rates these workers could expect to earn roughly $8,700 from plant incarne and an additional $3,100 in UI benefits for a total of $11,800.
• The remaining hours or months of work would be available on a Tier 3 or highly seasonal basis and account for 887 thousand hours or 5, 156 months of work dependent on largely molluscs and crustaceans. This could provide 2,062 highly seasonal jobs for 2.5 months each over 6 months. This would generate an incarne of approxima tel y $3, 100 and the potential for maximum UI incarne of $6,400 for a total incarne of approximately $9,500 of which 68% would result from access to UI.
SUMMARY OF DLM SIMULATED JOBS FOR PRINCE EDWARD ISLAND
TIER 1 TIER 2 TIER 3 (10 months) (7 months) (4 months)
Number 672 315 2,062
% of Total 22% 10% 68%
PEI bas the most pronounced seasonality in employment in fish processing with 68% of the jobs, as per the DLM simulation, available on a highly seasonal basis, which is reflective of the highly seasonal nature of the three principal fisheries on the Island.

·•·
COMPARISON OF 1990 DLM SIMULATION TO 1990 DFO ESTIMATES FOR PRINCE EDWARD ISLAND
DFO Difference DFO Difference DLM# Estimated Estimated Jobs Jobs # % DLM PYs PYs # %
3,049 3,214 165 5% 1,211 1,658 447 27%
As generated, the DLM shows a loss of 165 processing jobs in the PEI fish processing sector at 1990 resource levels and if utilization of the resources landed was optimized for fu.11-time employment and capacity utilization. The concentration of work in Tier III jobs ( 68%) indicates that the primary work is available only during the highly seasonal mollusc and crustacean and pelagics seasons and the seasonality is largely a resource rather than structural phenomenon.
The direct labour model (DLM) for PEI generates jobs for 3,049 individuals over a total of 2.4 million labour hours or 1,211 persan years. DFO estimates that PEI in 1990 generated 1,658 persan years of fish processing employment for 3,214 individuals. The low level of discrepancy in number of individuals is reflective of the extreme seasonality of the PEI landings where most of the jobs are only for a short period of time even with the optimal use of landings, and that most of the jobs are in this seasonal peak. The discrepancy in the estimate of persan years is roughly 27%, again resulting in all likelihood from the estimates of highly seasonal workers .
.:: NON-PERFORMING DFO ESTIMATE OF
ASSET ESTIMA TE DLM SIMULATION EXISTING JOBS
% Remaining % Remaining Reduction Possible Reduction Possible in Assets Jobs in# of Jobs Jobs
12.7% 2,806 5% 3,049 3,214
The DLM's output for PEI simulates very low level of job loss. The PEI fish processing industry is characterized, more so than any other province, by extremely seasonal fish landings. This seasonality does not lend itself to a smoothing of jobs over a reduced number of facilities.
The deterrnination of a most likely configuration of employment must consider that:
• it is unlikely that the number of individuals employed in fish processing is equally distributed over the identified non-performing assets given, amongst other things,
the range of technology utilization and a community's propensity to job share; and
• it is unlikely that the distribution of fish landings will be made precisely as configured in the DLM simulation due to a myriad of reasons not the least of which is established landing patterns, the dependence on fish processing employment and the processing capacity, even after rationalization, in the industry.
It is highly probable that, for a scenario that includes the 1990 actual landings and production mix, employment figures would be maintained close to the status quo in PEI, between 2,900 and 3,100 jobs, realizing a loss of between 160 and 300 positions in the industry.
In addition, for this stated production mix, for every further loss of 1,000 MT of resources the industry would lose a further 18 jobs in fish processing.
DLM Output 1990 New Brunswick
1990 Total Landings: 148,557 tonnes including 17,104 tonnes of groundfish
• The resource available to the industry in New Brunswick - 148,557 tonnes of groundfish, pelagics and shellfish - had the potential to create 7.9 million hours of direct and indirect work hours or 45.8 thousand months which were spread over the twelve months of the year.
• Taking a 10 month "work year" this resource mix and assuming optimum utilization of the resource base by the processing entities, 1,264 Tier 1, 10 month jobs are possible in the industry working from April to January dependent largely on groundfish and pelagics.
At the current wage rates this could generate a gross, plant incarne salary of approximately $13,300 and potential for UI incarne of approximately $900 for a total incarne of $14,200, which is comparable to average incarnes.
• Tier 2 jobs are the possible maximum-term or extended seasonal jobs available with this level and mix of resource availability. As shown on the graph there are 2,410 Tïer 2 jobs available for a six month period from May to October dependent largely on pelagics but also on shellfish.
Working six months of the year at existing wage rates these workers could expect to eam roughly $8,000 from plant incarne and an additional $4, 100 in UI Benefits for a total of $12, 100.
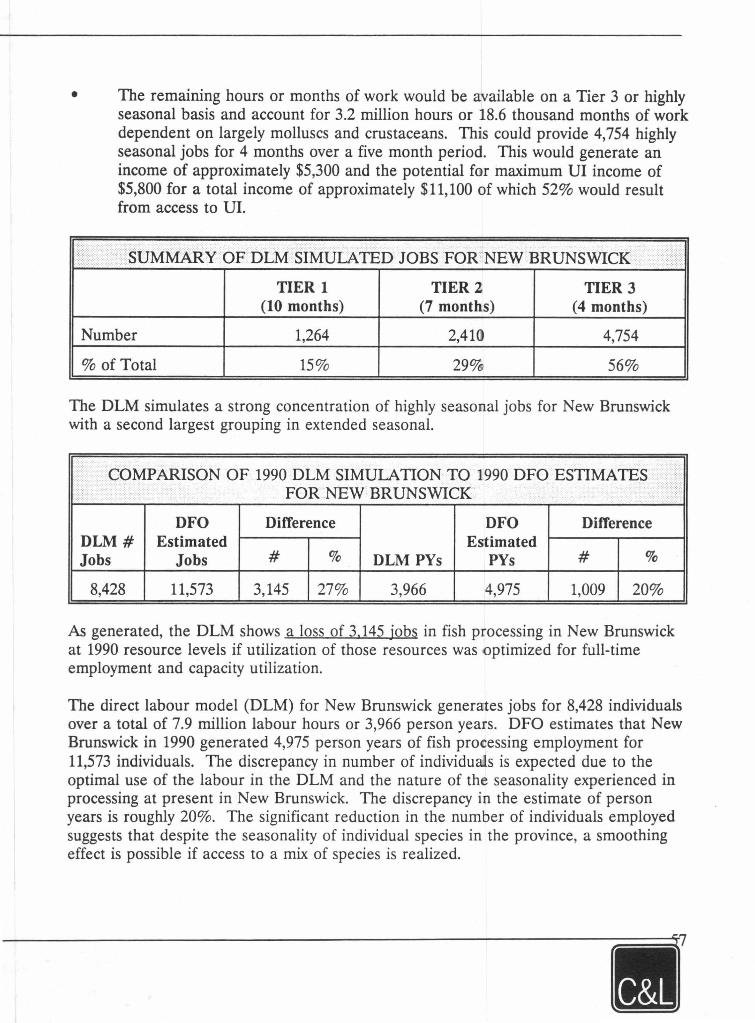
• The remaining hours or months of work would be available on a Tier 3 or highly seasonal basis and account for 3.2 million hours or 18.6 thousand months of work dependent on largely molluscs and crustaceans. This could provide 4,754 highly seasonal jobs for 4 months over a five month period. This would generate an incarne of approximately $5,300 and the potential for maximum UI incarne of $5,800 for a total incarne of approximately $11, 100 of which 52% would result from access to UI.
lir SUMMARY OF DLM SIMULATED JOBS FOR'NEW BRUNSWICK )
TIER 1 TIER2 TIER 3 (10 months) (7 months) (4 months)
Number 1,264 2,410 4,754
% of Total 15% 29% 56%
The DLM simulates a strong concentration of highly seasonal jobs for New Brunswick with a second largest grouping in extended seasonal.
COMPARISON OF 1990 DLM SIMULATION TO 1990 DFO ESTIMATES 1: FOR NEW BRUNSWICK
DFO Difference DFO Difference DLM# Estimated Estimated Jobs Jobs # % DLM PYs PYs # %
8,428 11,573 3,145 27% 3,966 4,975 1,009 20%
As generated, the DLM shows a Joss of 3.145 jobs in fish processing in New Brunswick at 1990 resource levels if utilization of those resources was optimized for full-time employment and capacity utilization.
<
The direct labour model (DLM) for New Brunswick generates jobs for 8,428 individuals over a total of 7.9 million labour hours or 3,966 persan years. DFO estimates that New Brunswick in 1990 generated 4,975 persan years of fish processing employment for 11,573 individuals. The discrepancy in number of individuals is expected due to the optimal use of the labour in the DLM and the nature of the seasonality experienced in processing at present in New Brunswick. The discrepancy in the estimate of persan years is roughly 20%. The significant reduction in the number of individuals employed suggests that despite the seasonality of individual species in the province, a smoothing effect is possible if access to a mix of species is realized.
NON-PERFORMING DFO ESTIMATE OF > DLM SiMULATION AS SET ESTIMA TE EXISTING JOBS
% Remaining % Remaining Reduction Possible Reduction Possible in# of Jobs in Assets Jobs
Jobs
27% 8,428 8.8% 10,555 11,573
The determination of a most likely configuration of employment must consider that:
• it is unlikely that the number of individuals employed in fish processing is equally distributed over the identified non-performing assets given, amongst other things, the range of technology utilization and a community's propensity to job share; and
• it is unlikely that the distribution of fish landings will be made precisely as configured in the DLM simulation due to a myriad of reasons not the least of which is established landing patterns, the dependence on fish processing employment and the processing capacity, even after rationalization, in the industry.
It is highly probable that, for a scenario that includes the 1990 actual landings and production mix. employment figures would be maintained at between 10,000 and 11,000 jobs, realizing a loss of between 500 and 1,500 positions in the industry.
In addition, for this stated production mix, for every further loss of 1,000 MT of resources the industry would lose a further 21 jobs in fish processing.
DLM Output 1990 Quebec
1990 Total Landings: 71, 182 tonnes including 40,096 tonnes of groundfish
• The resource available to the industry in Que bec - 71, 182 tonnes of groundfish, pelagics and shellfish - had the potential to create 2.4 million hours of direct and indirect work hours or 14.1 thousand months which were spread over the twelve months of the year.
• Taking a 10 month "work year" this resource mix and assuming optimum utilization of the resource base by the processing entities, 509 "Tier 1" 10 month jobs are possible in the industry working from April to January dependent largely on groundfish.
. [Ç;J'
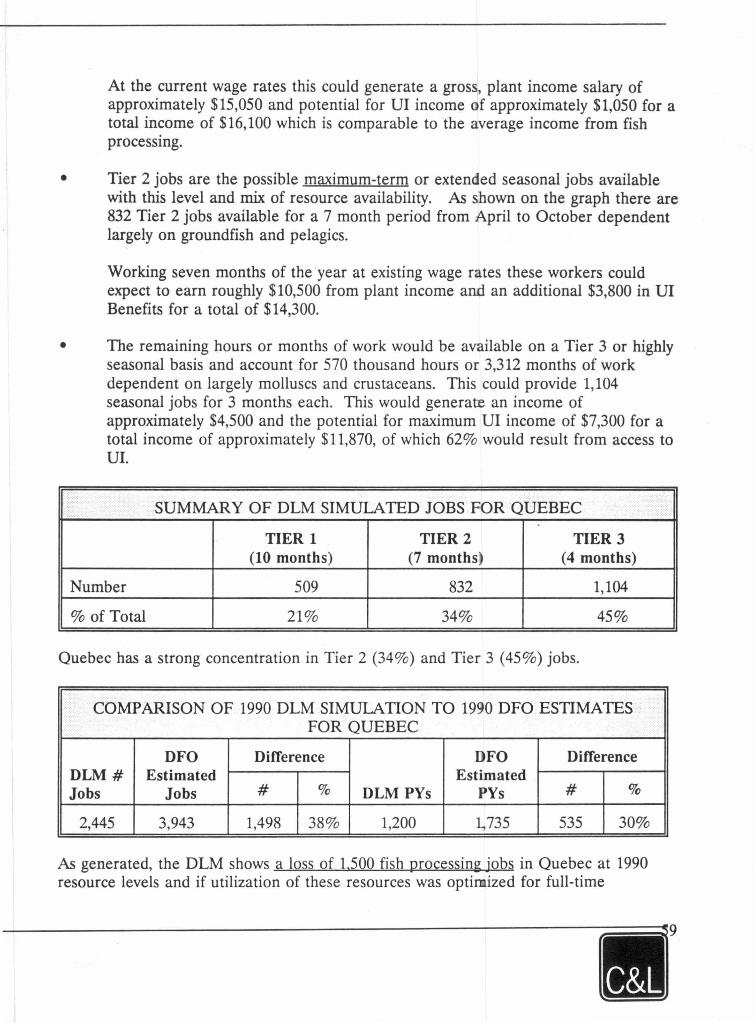
At the current wage rates this could generate a gross, plant incarne salary of approximately $15,050 and potential for UI incarne of approximately $1,050 for a total income of $16, 100 which is comparable to the average incarne from fish processing.
• Tier 2 jobs are the possible maximum-term or extended seasonal jobs available with this level and mix of resource availability. As shown on the graph there are 832 Tier 2 jobs available for a 7 month period from April to October dependent largely on groundfish and pelagics.
Working seven months of the ·year at existing wage rates these workers could expect to earn roughly $10,500 from plant incarne aru.i an additional $3,800 in UI Benefits for a total of $14,300.
• The remaining hours or months of work would be available on a Tier 3 or highly seasonal basis and account for 570 thousand hours or 3,312 months of work deperident on largely molluscs and crustaceans. This could provide 1, 104 seasonal jobs for 3 months each. This would generate an incarne of approximately $4,500 and the potential for maximum UI incarne of $7,300 for a total income of approximately $11,870, of which 62% would result from access to UI.
SUMMARY OF DLM SIMULATED JOBS FOR QUEBEC
TIER 1 TIER2 TIER 3 (10 months) (7 months) (4 months)
Number 509 832 1,104
% of Total 21% 34% 45%
Quebec has a strong concentration in Tier 2 (34%) and Tier 3 (45%) jobs.
COMPARISON OF 1990 DLM SIMULATION TO 1990 DFO ESTIMATES FOR QUEBEC
DFO Difference DFO Difference DLM# Estimated Estimated Jobs Jobs # % DLM PYs PYs # %
2,445 3,943 1,498 38% 1,200 L,735 535 30%
As generated, the DLM shows a loss of 1.500 fish processing jobs in Quebec at 1990 resource levels and if utilization of these resources was optirnized for full-time
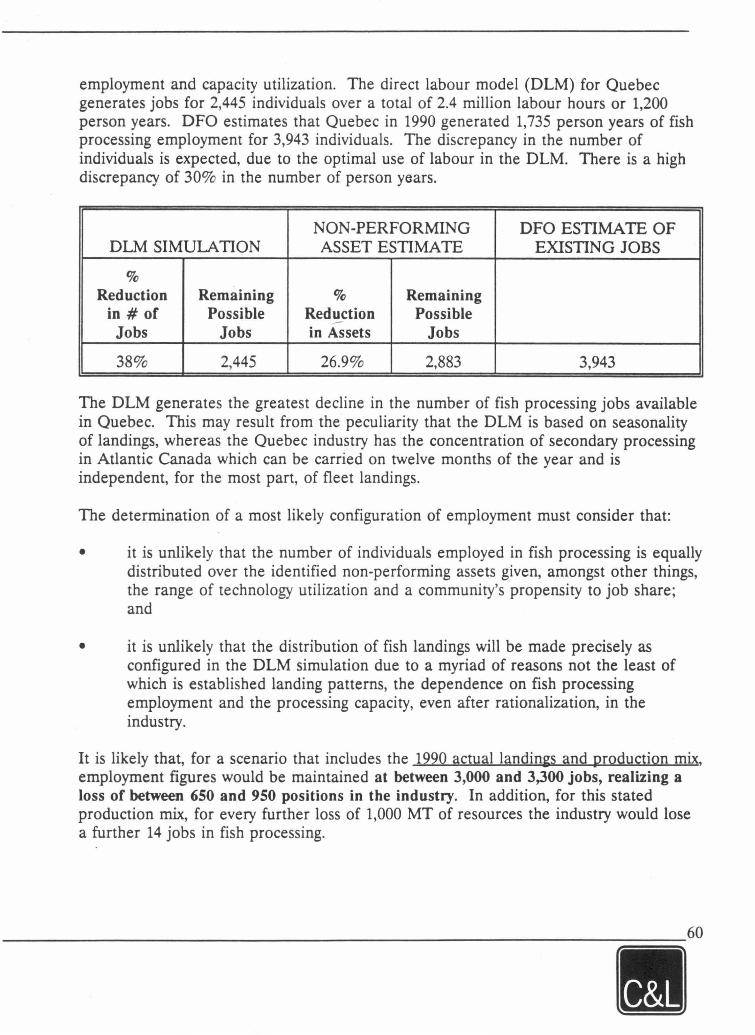
employment and capacity utilization. The direct labour model (DLM) for Quebec generates jobs for 2,445 individuals over a total of 2.4 million labour hours or 1,200 person years. DFO estima tes that Que bec in 1990 generated 1, 735 person years of fish processing employment for 3,943 individuals. The discrepancy in the number of individuals is expected, due to the optimal use of labour in the DLM. There is a high discrepancy of 30% in the number of person years.
NON-PERFORMING DFO ESTIMATE OF DLM SIMULATION ASSET ESTIMA TE EXISTING JOBS
% Reduction Remaining % Remaining in# of Possible Reduction Possible --Jobs Jobs in Assets Jobs
38% 2,445 26.9% 2,883 3,943
The DLM generates the greatest decline in the number of fish processing jobs available in Quebec. This may result from the peculiarity that the DLM is based on seasonality of landings, whereas the Quebec industry has the concentration of secondary processing in Atlantic Canada which can be carried on twelve months of the year and is independent, for the most part, of fleet landings.
The determination of a most likely configuration of employment must consider that:
• it is unlikely that the number of individuals employed in fish processing is equally distributed over the identified non-performing assets given, amongst other things, the range of technology utilization and a community's propensity to job share; and
• it is unlikely that the distribution of fish landings will be made precisely as configured in the DLM simulation due to a myriad of reasons not the least of which is established landing patterns, the dependence on fish processing employment and the processing capacity, even after rationalization, in the industry.
It is likely that, for a scenario that includes the 1990 actual landings and production m~ employment figures would be maintained at between 3,000 and 3,300 jobs, realizing a loss of between 650 and 950 positions in the industry. In addition, for this stated production mix, for every further loss of 1,000 MT of resources the industry would lose a further 14 jobs in fish processing.
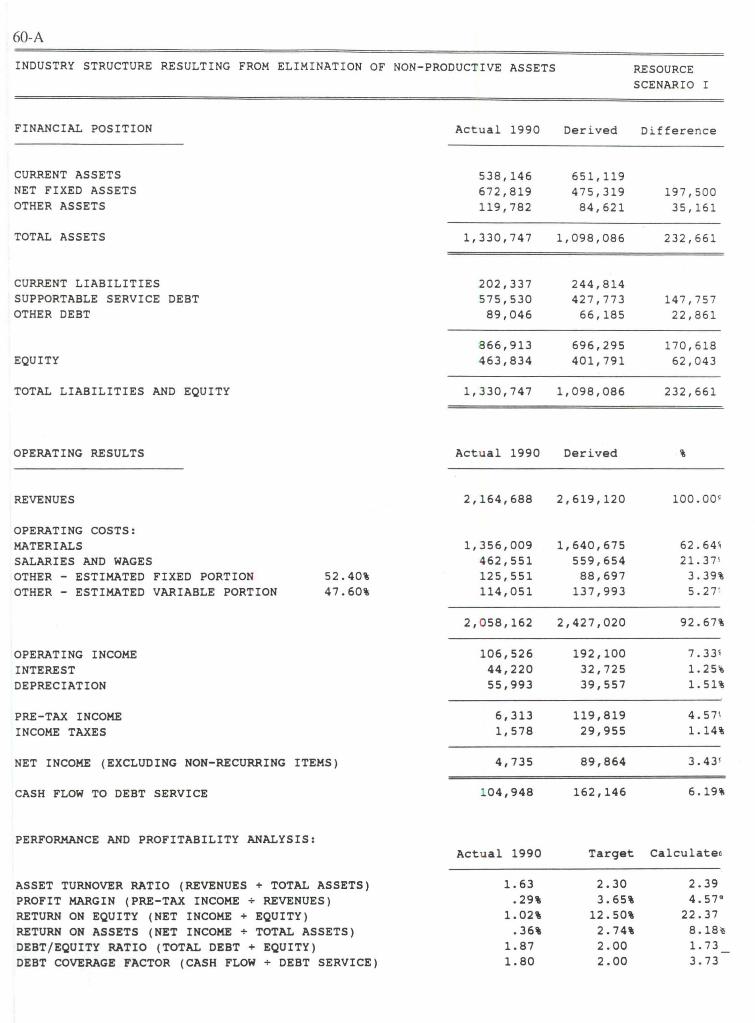
60-A
INDUSTRY STRUCTURE RESULTING FROM ELIMINATION OF NON-PRODUCTIVE ASSETS
FINANCIAL POSITION
CURRENT ASSETS NET FIXED ASSETS OTHER ASSETS
TOTAL ASSETS
CURRENT LIABILITIES SUPPORTABLE SERVICE DEBT OTHER DEBT
EQUITY
TOTAL LIABILITIES AND EQUITY
OPERATING RESULTS
REVENUES
OPERATING COSTS: MATERIALS SALARIES AND WAGES OTHER - ESTIMATED FIXED PORTION OTHER - ESTIMATED VARIABLE PORTION
OPERATING INCOME INTEREST DEPRECIATION
PRE-TAX INCOME INCOME TAXES
52.40\ 47.60\
NET INCOME (EXCLUDING NON-RECURRING ITEMS)
CASH FLOW TO DEBT SERVICE
PERFORMANCE AND PROFITABILITY ANALYSIS:
ASSET TURNOVER RATIO (REVENUES + TOTAL ASSETS) PROFIT MARGIN (PRE-TAX INCOME + REVENUES) RETURN ON EQUITY (NET INCOME + EQUITY) RETURN ON ASSETS (NET INCOME + TOTAL ASSETS) DEBT/EQUITY RATIO (TOTAL DEBT + EQUITY) DEBT COVERAGE FACTOR (CASH FLOW + DEBT SERVICE)
Actual 1990
538,146 672,819 119,782
1,330,747
202,337 575,530 89,046
866,913 463,834
1,330,747
Actual 1990
2,164,688
1,356,009 462,551 125,551 114,051
2, 0 58,162
106,526 44,220 55,993
6,313 1,578
4,735
104,948
Actual 1990
1. 63 .29\
1.02\ .36\
1.87 1.80
RE SOURCE SCENARIO I
Derived
651,119 475,319
84,621
1,098,086
244,814 427,773
66,185
696,295 401,791
1,098,086
Derived
2,619,120
1,640,675 559,654 88,697
137,993
2,427,020
192,100 32,725 39,557
119, 819 29,955
89,864
162,146
Difference
197,500 35,161
232,661
147,757 22,861
170,618 62,043
232,661
100. oos
62. 64 \ 21. 371 3.39\ 5.27 '.
92.67\
7. 33 1
1. 25~ 1. 51%
4. 57 \ 1.14\
3. 43!
6.19%
Target Calculateo
2.30 3.65\
12.50\ 2.74\ 2.00 2.00
2.39 4. 57°
22.37 8 .18\!i 1. 73 3.73
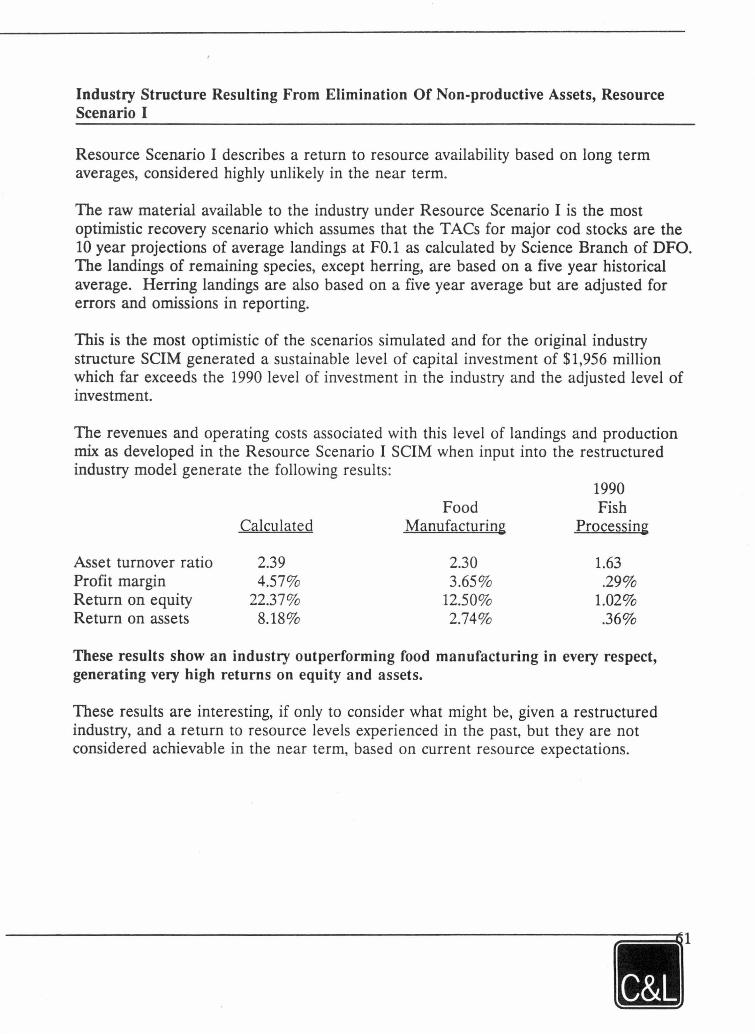
Industry Structure Resulting From Elimination Of Non-productive Assets, Resource Scenario 1
Resource Scenario 1 describes a return to resource availability based on long term averages, considered highly unlikely in the near term.
The raw material available to th~ industry under Resource Scenario 1 is the most optimistic recovery scenario which assumes that the TACs for major cod stocks are the 10 year projections of average landings at FO. l as calculated by Science Branch of DFO. The landings of remaining species, except herring, are based on a five year historical average. Herring landings are also based on a five year average but are adjusted for errors and omissions in reporting.
This is the most optimistic of the scenarios simulated and for the original industry structure SCIM generated a sustainable level of capital investment of $1,956 million which far exceeds the 1990 level of investment in the industry and the adjusted level of investment.
The revenues and operating costs associated with this level of landings and production mixas developed in the Resource Scenario I SCIM when input into the restructured industry model generate the following results:
1990 Food Fish
Calculated Manufacturing Processing
Asset turnover ratio 2.39 2.30 1.63 Profit margin 4.57% 3.65% .29% Return on equity 22.37% 12.50% 1.02% Return on assets 8.18% 2.74% .36%
These results show an industry outperforming food manufacturing in every respect, generating very high returns on equity and assets.
These results are interesting, if only to consider what might be, given a restructured industry, and a return to resource levels experienced in the past, but they are not considered achievable in the near term, based on current resource expectations.
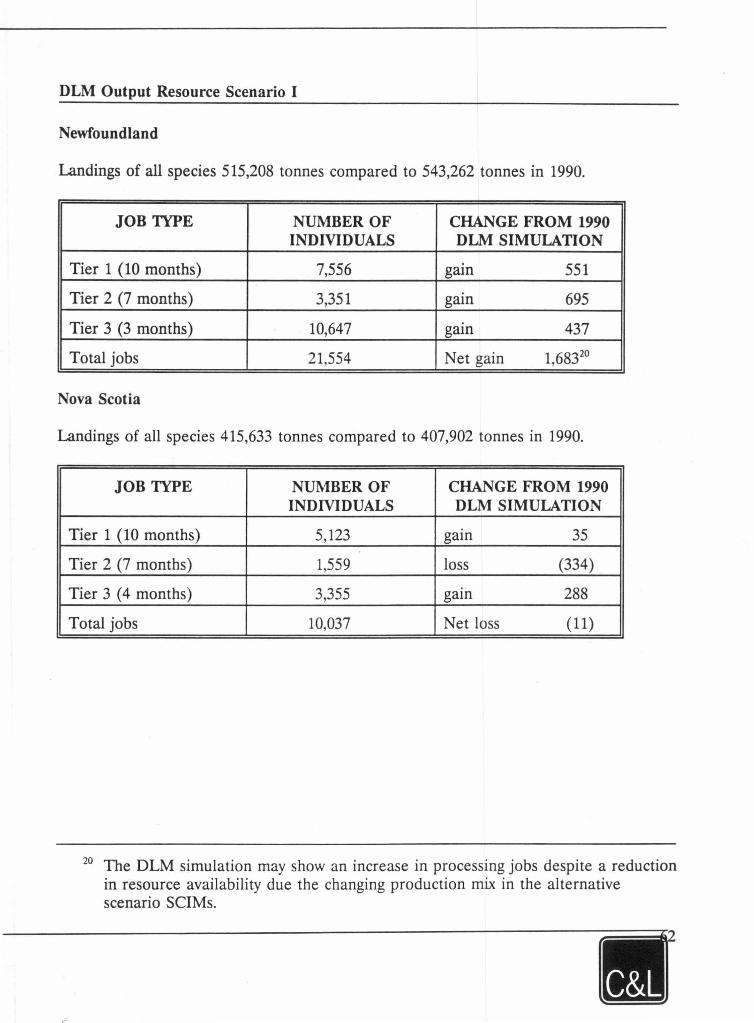
DLM Output Resource Scenario I
Newfoundland
Landings of all species 515,208 tonnes compared to 543,262 tonnes in 1990.
JOB 1YPE NUMBEROF CHANGE FROM 1990 INDIVIDUALS DLM SIMULATION
Tier 1 ( 10 months) 7,556 gam 551
Tier 2 (7 months) 3,351 gain 695
Tier 3 (3 months) 10,647 gain 437
Total jobs 21,554 Net gain 1 68320
'
Nova Scotia
Landings of all species 415,633 tonnes compared to 407,902 tonnes in 1990.
JOB 1YPE NUMBER OF CHANGE FROM 1990 INDIVIDUALS DLM SIMULATION
Tier 1 ( 10 months) 5,123 gam 35
Tier 2 (7 months) 1,559 loss (334)
Tier 3 ( 4 months) 3,355 gam 288
Total jobs 10,037 Net loss (11)
20 The DLM simulation may show an increase in processing jobs despite a reduction in resource availability due the changing production mix in the alternative scenario SCIMs.

Prince Edward Island
Landings of all species 47,784 tonnes compared to 53,182 tonnes in 1990.
JOB 1YPE NUMBER OF CHANGE FROM 1990 INDIVIDUALS DLM SIMULATION
Tier 1 ( 10 months) 669 loss (3)
Tier 2 (7 months) 172 loss (143)
Tier 3 (2.5 months) 2,002 loss (60)
Total jobs 2,843 Net loss (206)
New Brunswick
Landings of all species 157,917 tonnes compared to 148,557 tonnes in 1990.
JOB 1YPE NUMBER OF CHANGE FROM 1990 INDIVIDUALS DLM SIMULATION
Tier 1 ( 10 months) 1,412 gain 148
Tier 2 ( 6 rnonths) 2;769 gain 359
Tier 3 ( 4 months) 5,505 gam 751
Total jobs 9,686 Net gain 1,258
Que bec
Landings of all species 84,000 tonnes compared to 71,182 tonnes in 1990.
JOB 1YPE NUMBER OF CHANGE FROM 1990 INDIVIDUALS DLM SIMULATION
Tier 1 (10 months) 622 gain 113
Tier 2 (7 months) 1,064 gain 232
Tier 3 ( 4 months) 1,580 gain 476
Total jobs 3,266 Net gain 821
63
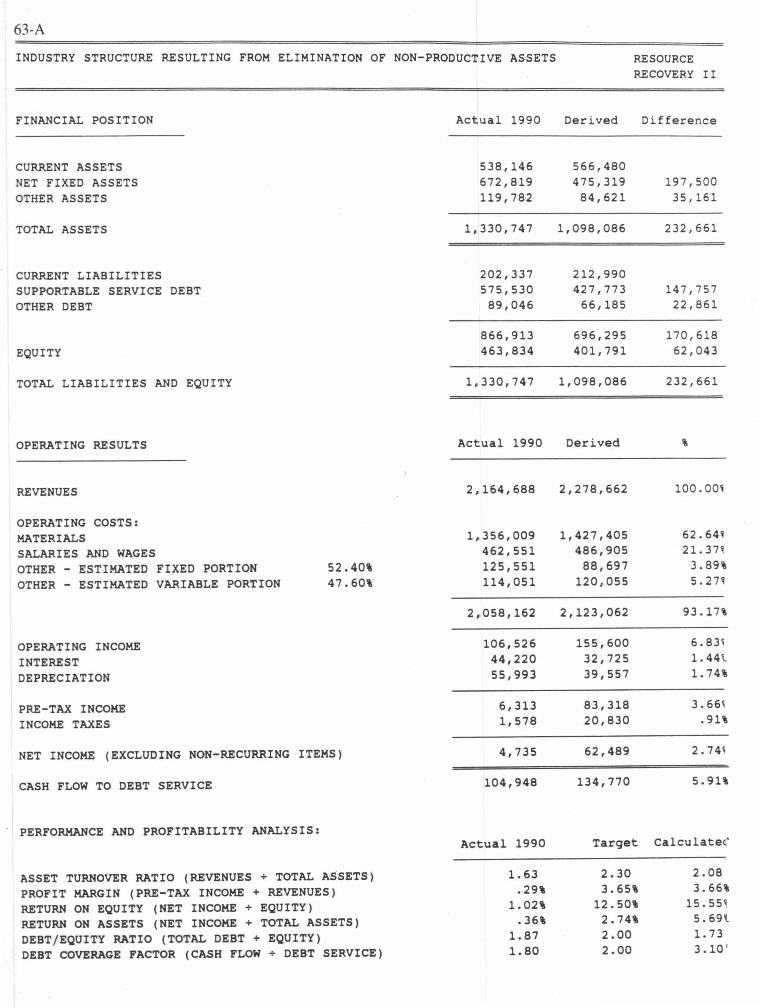
63-A
INDUSTRY STRUCTURE RESULTING FROM ELIMINATION OF NON-PRODUCTIVE ASSETS
FINANCIAL POSITION
CURRENT ASSETS NET FIXED ASSETS OTHER ASSETS
TOTAL ASSETS
CURRENT LIABILITIES SUPPORTABLE SERVICE DEBT OTHER DEBT
EQUITY
TOTAL LIABILITIES AND EQUITY
OPERATING RESULTS
REVENUES
OPERATING COSTS: MATERIALS SALARIES AND WAGES OTHER - ESTIMATED FIXED PORTION OTHER - ESTIMATED VARIABLE PORTION
OPERATING INCOME INTEREST DEPRECIATION
PRE-TA.X INCOME INCOME TAXES
52.40\ 47.60\
NET INCOME (EXCLUDING NON-RECURRING ITEMS)
CASH FLOW TO DEBT SERVICE
PERFORMANCE AND PROFITABILITY ANALYSIS:
ASSET TURNOVER RATIO (REVENUES + TOTAL ASSETS) PROFIT MARGIN (PRE-TA.X INCOME + REVENUES) RETURN ON EQUITY (NET INCOME + EQUITY) RETURN ON ASSETS (NET INCOME + TOTAL ASSETS) DEBT/EQUITY RATIO (TOTAL DEBT + EQUITY) DEBT COVERAGE FACTOR (CASH FLOW + DEBT SERVICE)
Actual 1990
538,146 672,819 119,782
1,330,747
202,337 575,530
89,046
866,913 463,834
1 , 330,747
Actual 1990
2,164,688
1,356,009 462,551 125,551 114,051
2,058,162
106,526 44,220 55,993
6,313 1,578
4,735
104,948
Actual 1990
1. 63 .29\
1.02\ .36\
1.87 1.80
RE SOURCE RECOVERY II
Derived
566,480 475,319 84,621
1,098,086
212,990 427,773
66,185
696,295 401,791
1,098,086
Derived
2,278,662
1,427,405 486,905
88,697 120,055
2,123,062
155,600 32,725 39,557
83,318 20,830
62,489
134,770
Difference
197 , 500 35,161
232,661
147, 757 22,861
170 , 618 62,043
232,661
100. 001
62. 641 21. 37 ~
3.89\ 5.2n
93 . 17%
6. 83 ~
1. 44 t 1. 74%
3. 66~ .91\
2. 74 ~
5 .91\
Target Calculate(
2.30 3.65\
12.50\ 2.74\ 2.00 2.00
2.08 3.66\ 15.55 ~
5.69 t 1. 73 3 . 10 '
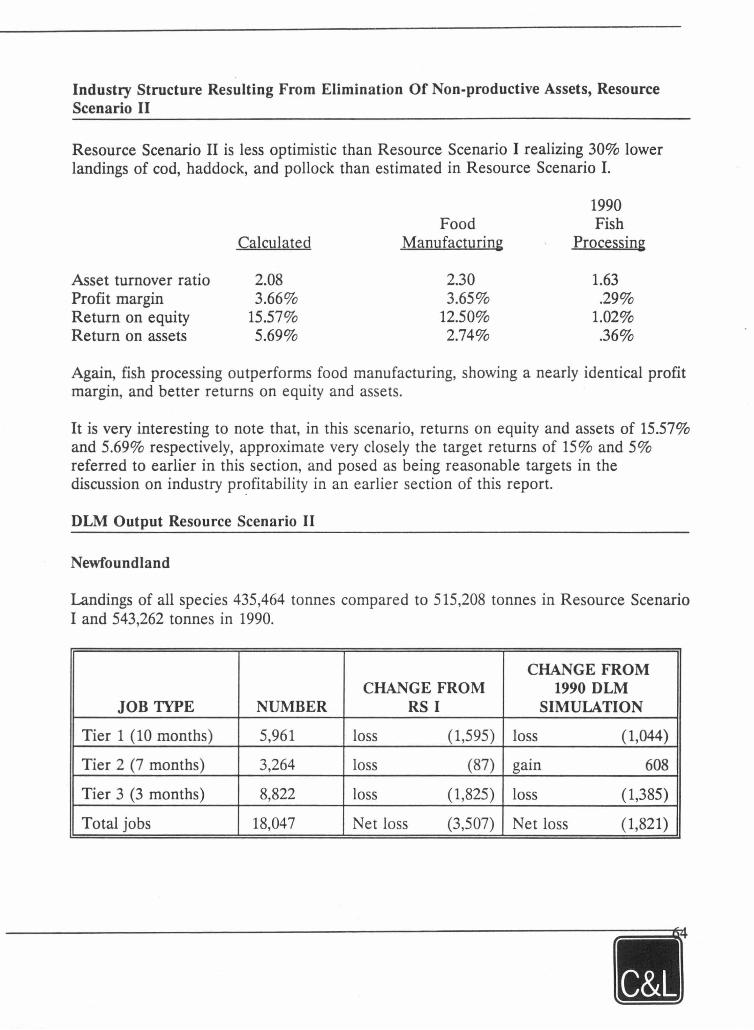
Industry Structure Resulting From Elimination Of Non-productive Assets, Resource Scenario II
Resource Scenario II is less optimistic than Resource Scenario 1 realizing 30% lower landings of cod, haddock, and pollock than estimated in Resource Scenario 1.
1990 Food Fish
CalcuJated Manufacturing Processing
Asset turnover ratio 2.08 2.30 1.63 Profit margin 3.66% 3.65% .29% Retum on equity 15.57% 12.50% 1.02% Retum on assets 5.69% 2.74% .36%
Again, fish processing outperforms food manufacturing, showing a nearly identical profit margin, and better returns on equity and assets.
It is very interesting to note that, in this scenario, returns on equity and assets of 15.57% and 5.69% respectively, approximate very closely the target returns of 15% and 5% referred to earlier in this section, and posed as being reasonable targets in the discussion on industry profitability in an earlier section of this report.
DLM Output Resource Scenario II
Newfoundland
Landings of ail species 435,464 tonnes compared to 515,208 tonnes in Resource Scenario 1 and 543,262 tonnes in 1990.
CHANGE FROM CHANGE FROM 1990 DLM
JOB TYPE NUMBER RS I SIMULATION
Tier 1 (10 months) 5,961 loss (1,595) loss (1,044)
Tier 2 (7 months) 3,264 loss (87) gain 608
Tier 3 (3 months) 8,822 Joss (1,825) Joss (1,385)
Total jobs 18,047 Net loss (3,507) Net loss (1,821)
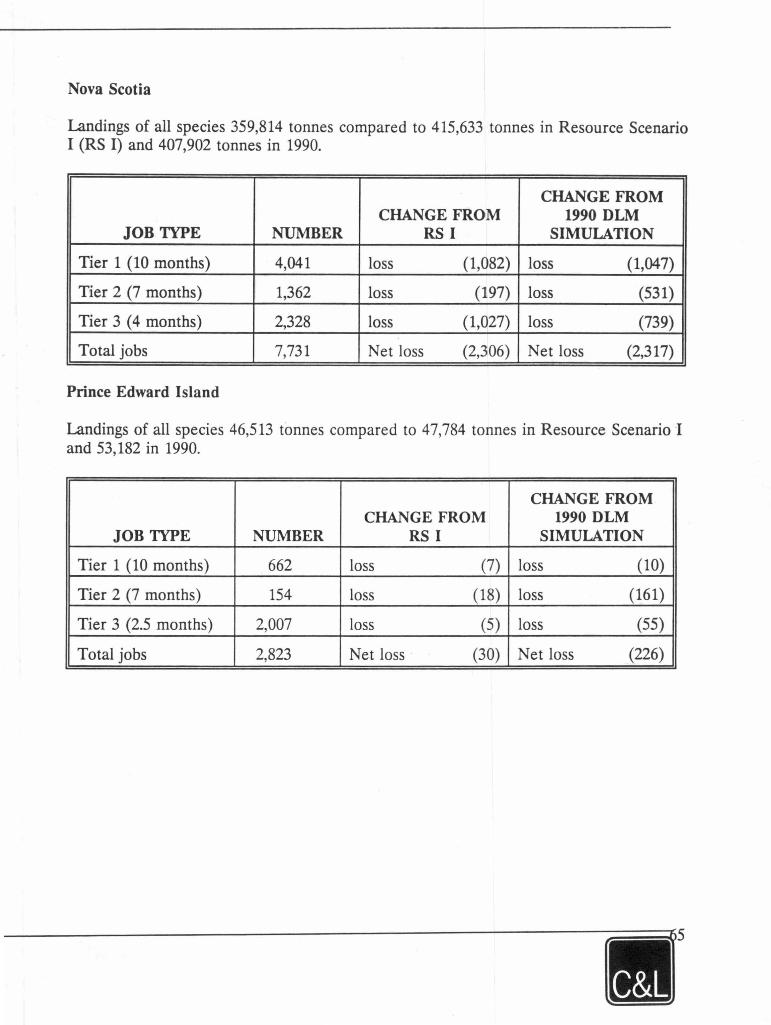
Nova Scotia
Landings of all species 359,814 tonnes compared to 415,633 tonnes in Resource Scenario 1 (RS 1) and 407,902 tonnes in 1990.
CHANGEFROM CHANGEFROM 1990 DLM
JOB TYPE NUMBER RS I SIMULATION
Tier 1 (10 months) 4,041 loss (1,082) loss (1,047)
Tier 2 (7 months) 1,362 loss (197) loss (531)
Tier 3 ( 4 months) 2,328 loss (1,027) loss (739)
Total jobs 7,731 Net loss (2,306) Net loss (2,317)
Prince Edward Island
Landings of all species 46,513 tonnes compared to 47,784 tonnes in Resource Scenario I and 53, 182 in 1990.
CHANGE FROM CHANGE FROM 1990 DLM
JOB TYPE NUMBER RS I SIMUIATION
Tier 1 (10 months) 662 loss (7) loss (10)
Tier 2 (7 months) 154 loss (18) loss (161)
Tier 3 (2.5 months) 2,007 loss (5) loss (55)
Total jobs 2,823 Net loss (30) Net loss (226)
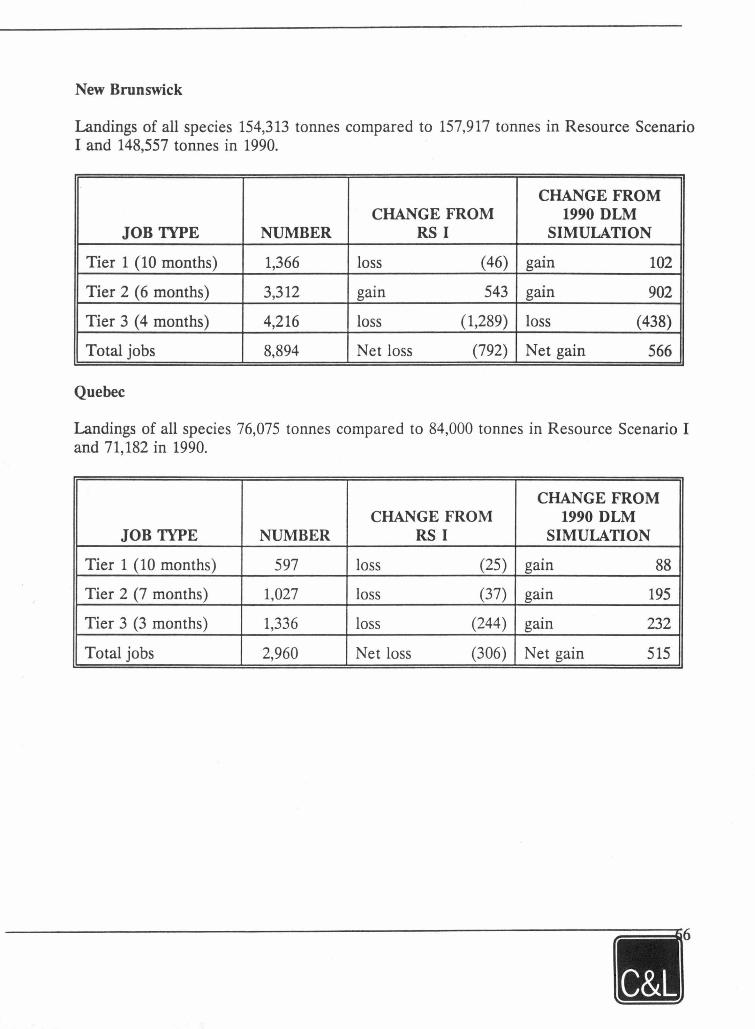
New Brunswick
Landings of all species 154,313 tonnes compared to 157,917 tonnes in Resource Scenario I and 148,557 tonnes in 1990.
CHANGEFROM CHANGE FROM 1990 DLM
JOB 1YPE NUMBER RS 1 SIMULATION
Tier 1 (10 months) 1,366 loss (46) gain 102
Tier 2 ( 6 months) 3,312 gain 543 gam 902
Tier 3 ( 4 months) 4,216 loss (1,289) loss (438)
Total jobs 8,894 Net loss (792) Net gain 566
Que bec
Landings of all species 76,075 tonnes compared to 84,000 tonnes in Resource Scenario I and 71,182 in 1990.
CHANGE FROM CHANGE FROM 1990 DLM
JOB 1YPE NUMBER RS 1 SIMULATION
Tier 1 (10 months) 597 loss (25) gam 88
Tier 2 (7 months) 1,027 loss (37) gain 195
Tier 3 (3 months) 1,336 loss (244) gam 232
Total jobs 2,960 Net loss (306) Net gain 515
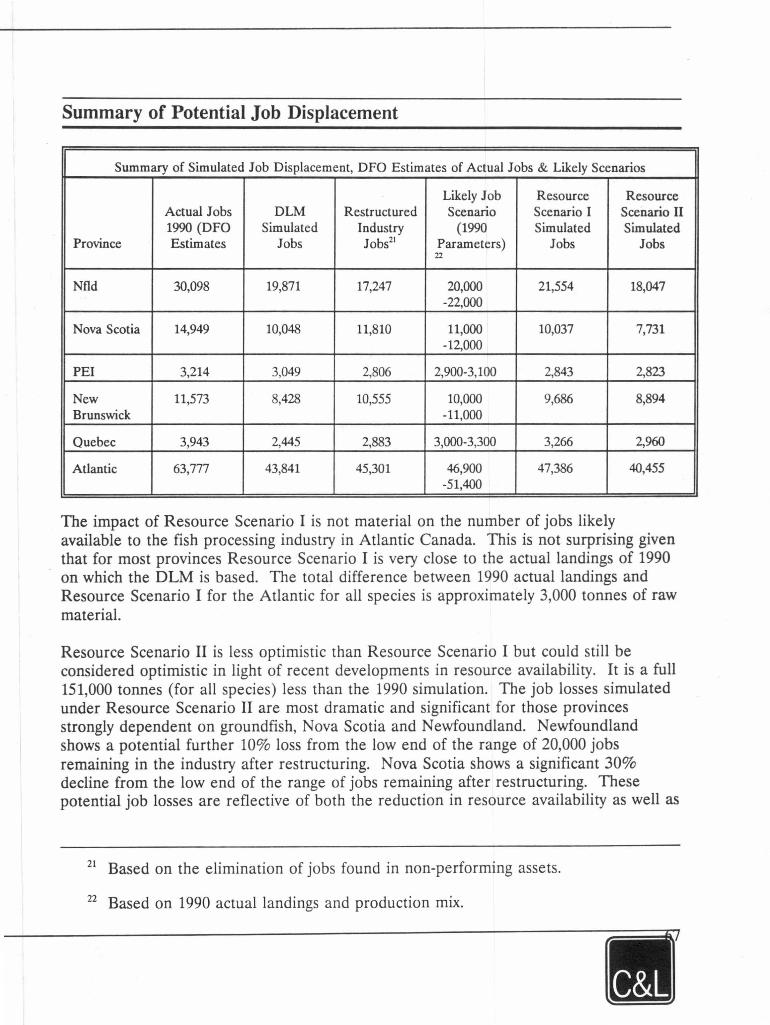
Summary of Potential Job Displacement
Summary of Simulated Job Displacement, DFO Estimates of Actual Jobs & Likely Scenarios
Likely Job Resource Resource Actual Jobs DLM Restructured Scenario Scenario 1 Scenario II 1990 (DFO Simulated Industry (1990 Simulated Simulated
Province Estima tes Jobs Jobs21 Parameters) Jobs Jobs 22
Nfld 30,098 19,871 17,247 20,000 21,554 18,047 -22,000
Nova Scotia 14,949 10,048 11,810 11,000 10,037 7,731 -12,000
PEI 3,214 3,049 2,806 2,900-3,100 2,843 2,823
New 11,573 8,428 10,555 10,000 9,686 8,894 Brunswick -11,000
Que bec 3,943 2,445 2,883 3,000-3,300 3,266 2,960
Atlantic 63,777 43,841 45,301 46,900 47,386 40,455 -51,400
The impact of Resource Scenario I is not material on the number of jobs likely available to the fish processing industry in Atlantic Canada. This is not surprising given that for most provinces Resource Scenario I is very close to the actual landings of 1990 on which the DLM is based. The total difference between 1990 actual landings and Resource Scenario I for the Atlantic for all species is approximately 3,000 tonnes of raw material.
Resource Scenario II is less optimistic than Resource Scenario I but could still be considered optimistic in light of recent developments in resource availability. It is a full 151,000 tonnes (for all species) Jess than the 1990 simulation. The job lasses simulated under Resource Scenario II are most dramatic and significant for those provinces strongly dependent on groundfish, Nova Scotia and Newfoundland. Newfoundland shows a potential further 10% loss from the low end of the range of 20,000 jobs remaining in the industry after restructuring. Nova Scotia shows a significant 30% decline from the low end of the range of jobs remaining after restructuring. These potential job lasses are reflective of both the reduction in resource availability as well as
21 Based on the elimination of jobs found in non-performing assets.
22 Based on 1990 actual landings and production mix.
the forecast change in production mix which differs by province. While these estimates of remaining jobs and related job loss appear extreme relative to the 1990 DFO estimates, they are likely representative of what is happening in Atlantic Canada in light of the dramatic declines in resource availability.
The job estimates for Resource Scenario II are reflective of more than an optirnization of the distribution of traditionally available fish resources, and more than the restructuring of the industry to attain acceptable profit and performance levels. This level of job loss is reflective of the closure of previously performing assets due to the unavailability of resources.
Conclusions
This analysis adds dimension to earlier discussions on overcapacity and profitability, and lends significant credence to the notion that a reduction in number of participants and assets approaching 30% would have a significant positive impact on industry viability. Again, this assumes that such a reduction would see a permanent removal of assets, liabilities and operations, rather than an equivalent scaling back by all current participants.
This point is important because the key is the elimination of fixed costs associated with redundant assets and operations. If these are not eliminated, then nothing is gained.
This analysis also supports earlier discussions concerning the average size of participants in the industry. If a down-sizing was achieved, as discussed above, then revenues of the average company in the industry, excluding Natianal Sea Products and Fishery Products International, would increase from $3.4 million to $4.7 million, based on 1987 data. This approaches the $5 million level discussed earlier, which was considered a desirable level by many in the industry with whom this issue was discussed. Higher enterprise volumes would likely result in higher enterprise operating profits, resulting in increased enterprise ability to support greater investment in technology and market development. These would undoubtedly result in further improvements in industry viability.
This does not mean that big is better. On the cantrary, it is felt that industry volatility places very large enterprises at a distinct disadvantage. But the evidence is clear that there is an optimum size of enterprise, and that it is likely larger than the average size now in existence.
The analysis suggests, therefore, that a restructuring which would see the elirnination of some 30% of the enterprises in the industry wouki prove beneficial.
•
~·

This does not suggest that this is the only strategy to pursue, as there are many other issues that warrant examination such as access to resources, fleet separation, and the like.
It would appear, however, that a rationalization along the lines discussed can help to strengthen an industry which is clearly not viable under current circumstances.
6. THE MODIFIED CORE FISHERY
A core, sustainable fish processing industry is described in earlier sections of this report. As stated the core is defined in terms of general profit, performance and employment. The modified core is defined as the structure of industry that is likely to exist in the short to medium term subject to changes in the following:
• The Potential for Increased Use of Underutilized Species;
• The Potential for Increased Imports of Fresh and Frozen Fish for Processing;
• The Potential for Increased Technology Absorption; and
• The Potential for Increased Value Added in Fish Processing.
Each of these variables has received considerable attention of late due to the changing environment of the industry and the obvious need for certain sectors of the industry to view and do things somewhat differently. As such each of these bas been reviewed and findings as to the likelihood of them impacting on employment in fish processing are presented below. The summary presented below outlines the estimated job gains and displacement from these modifiers and the support for these findings is then presented in detail.
Summary of Job Gains and Displacement from Potential Modifiers
In summary, minimal job gains are expected from increased utilization of turbot and silver hake of both 200 jobs for each species and assigned to Newfoundland for turbot and Nova Scotia for silver hake.
Technology change and absorption is expected to displace roughly 1,900 jobs in fish processing in the short to medium term which are distributed over the five provinces based on the historie share of groundfish landings and the net displacement by province is estimated to be as follows:
~·
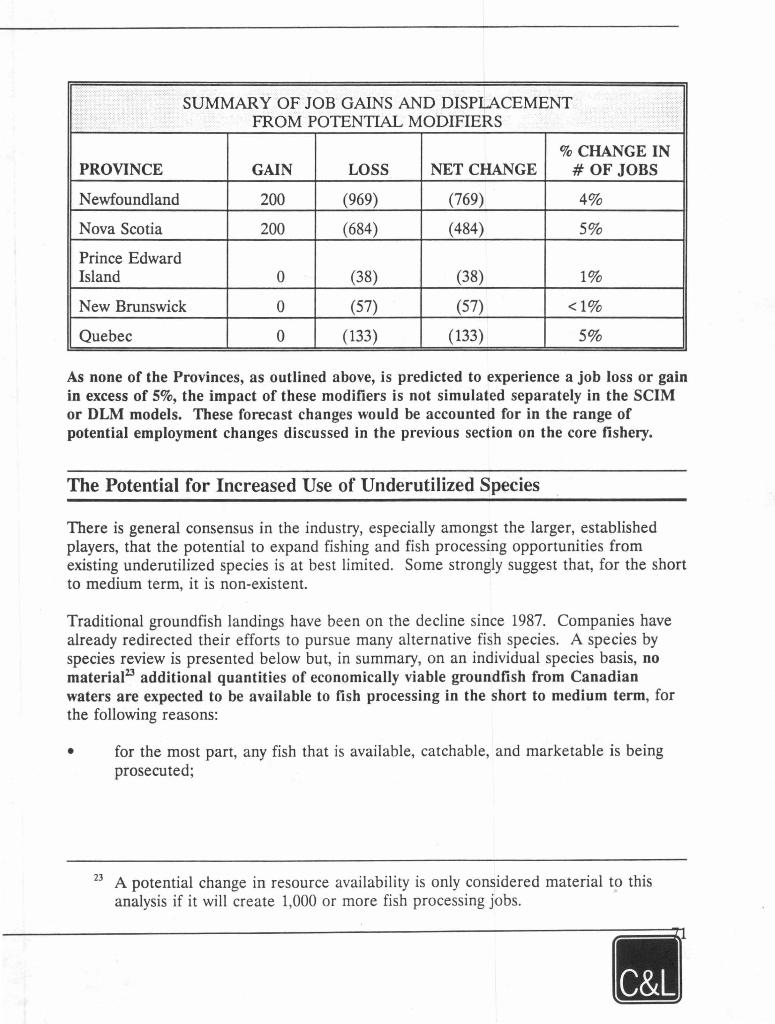
SUMMARY OF JOB GAINS AND DISPIACEMENT FROM POTENTIAL MODIFIERS .
% CHANGE IN PROVINCE GAIN LOSS NET CHANGE #OF JOBS
N ewfoundland 200 (969) (769) 4%
Nova Scotia 200 (684) (484) 5%
Prince Edward Island 0 (38) (38) 1%
New Brunswick 0 (57) (57) <1%
Que bec 0 (133) (133) 5%
As none of the Provinces, as outlined above, is predicted to experience a job Joss or gain in excess of 5%, the impact of these modifiers is not simulated separately in the SCIM or DLM models. These forecast changes would be accounted for in the range of potential employment changes discussed in the previous section on the core fishery.
The Potential for Increased Use of Underutilized Species
There is general consensus in the industry, especially amongst the larger, established players, that the potential to expand fishing and fish processing opportunities from existing underutilized species is at best limited. Sorne strongly suggest that, for the short to medium term, it is non-existent.
Traditional groundfish landings have been on the decline since 1987. Companies have already redirected their efforts to pursue many alternative fish species. A species by species review is presented below but, in summary, on an individual species basis, no material23 additional quantities of economically viable groundfish from Canadian waters are expected to be available to fish processing in the short to medium term, for the following reasons:
• for the most part, any fish that is available, catchable, and marketable is being prosecuted;
23 A potential change in resource availability is only considered material to this analysis if it will create 1,000 or more fish processing jobs.
• the TACs for some stocks have not been adjusted downward to reflect realistic catch levels despite concerted harvesting effort and very low catches and, therefore, in some instances, present an overestimation of resource availability;
• parasitic problems;
• uneconomic catch rates;
• size of fish; and
• uneconomic costs due to low yields and the level of effort required for product and market development.
There are small gains to be made and the cumulative impact of the species reviewed below will be summarized at the end of this section.
Access to and utilization of underutilized species bas been structured by DFO since 1990 through a developmental reserve or pool of underutilized fish resources. Its intent is to encourage and permit harvesters, existing and new entrants, to prosecute fisheries that were not being fully utilized. Under different terms and conditions, depending on the species, companies make application to harvest and process the fish. At the time of the commencement of the program, the pool included quantities of:
• Redfish/ocean perch • Greenland halibut/turbot • Witch • Squid • Cape lin • Mackerel • Silver hake • Argentine • Grenadier
The quantities and species of fish available in the Developmental Pool have changed considerably since its inception in 1990. These changes have resulted from:
• the harvesting successes being realized with the resource to an extent that the fish is removed from the pool and allocated on a more permanent basis to Canadian interests as is the case with redfish/ocean perch which bas received considerable attention over the past three years;
• debate over the availability of the resource such as greenland halibut/ turbot; and
• unavailability of the resource such as squid and capelin species that are quite cyclical in abundance.
Activity for the 1992 Developmental Pool was as follows:
FISH QUOTA CAUGHT/LANDED
SPECIES ZONE (TONNES) (TONNES)
Silver hake 4VWX 37,000 15,800
Mackerel 3&4 16,000 2,500
Turbot 0,2GH 22,000 7,000
Allocations to the Developmental Pool to date for the 1993 fishing season include:
SPECIES ZONE QUOTA (TONNES)
Silver hake 4VWX 48,000
Mackerel 3&4 16,000
A decision on the inclusion of 0, 2GH turbot in the 1993 Developmental Pool is pending.
The following will review the status of those species currently in the Development Pool as well as others that are perceived to hold some opportunity for fish processors, or are of growing interest but, as yet, not allocated to the Developmental Pool.
Groundfish
Redfish Redfish was removed from the Developmental Reserve in 1992, and a special allocation made of 4,000 tonnes for experimental fisheries in areas 2 + 3K and 30. There were no Canadian applications received for access to this fish resource.
Approximately 81 % of redfish allocated through the groundfish management plan was utilized in 1992. The fish left in the water was mostly from zones 2 + 3K and 30 due primarily to the parasite problem experienced in these areas. The parasite common to fish harvested in these waters is an impediment to processing that can only be overcome at considerable processing cost or loss of yield. As this situation is not expected to improve, utilization rates for these stocks are not expected to increase.
Turbot/Greenland Halibut Initially in 1990 there were 37,000 tonnes of turbot allocated to the Developmental Pool in NAFO areas 0, 2GH, and 2J3KL, representing slightly more than 50% of the total
quota for the species. In that year 29% of the overall quota was harvested and 19% of the Developmental allocation.
In 1991 the Developmental Pool allocation fell to 31,000 tonnes representing 52% of the overall quota. In that year 33% of the quota overall was utilized and 36% of the Developmental Pool.
The allocation of 2J3KL turbot was removed from the developmental pool in 1992. This decision resulted from:
• the growing debate on the use of foreign vessels in the Canadian zone, and in particular in 2J3KL;
• the increasing catches (reportedly in the range of 40-50,000 tonnes) of foreign fleets just outside the Canadian line and the uncertainty of the impact of that fishing activity on resource availability inside the line; and
• the mounting question of whether or not the resource was harvestable or merely "paper fish".
In 1992, 5,000 tonnes of the 17,500 tonne regular allocation in 2J3KL was harvested, of which 4,000 tonnes was by the inshore domestic fleet. The domestic harvest was largely the result of a special project to introduce gillnets to the fishery, given the unsuitability of the turbot grounds for trawling. It is DFO's expectation that even greater success will now be realized by this fleet sector in harvesting this fish resource.
The Developmental Pool turbot allocation was then limited in 1992 to 0, 2GH where 7,000 tonnes, or 32%, was harvested. Of this 7,000 tonnes, approximately 2,500 tonnes was harvested by the domestic fleet, which represents the best results to date for this fishery. In 1992, of the total quota for turbot of 73,000 tonnes, 27% was harvested.
As noted previously, the decision on whether or not to include turbot at all in the developmental pool for 1993 is pending.
Landings of turbot by the domestic fleet are on the increase and efforts and landings are likely to continue and increase. It is not known if the problems in harvesting the turbot to date have resulted from inappropriate technology, inexperience, or unavailability of fish in the more traditional waters.
If an additional 20,000 tonnes of turbot were landed from the existing quota of 73,000 tonnes and equal portions of dressed head-off and skinless fillets produced, roughly 200 full-time (10 month) jobs could be created in the industry. This is roughly equivalent to full employment for one medium-sized processing facility but, given the distribution of this fish to inshore harvesters, the benefits are unlikely to be as concentrated.
Grenadier (Roundnose) Grenadier was removed from the Developmental Pool and assigned as an experimental fishery in 1991. There has been very little activity in this species as it is a small fish and difficult to process. Fishery Products International did some experimental harvesting and processing in 1991 but has not dedicated effort to the species.
Grenadier (Roughhead) As there is little science available on this species, no quota has been established for the Developmental Pool or otherwise. This fish is considered somewhat comparable to cod but has long been ignored due to its rough scales which have presented serious processing problems. Vessels fishing turbot in 2J3KL have been experiencing very high by-catches of roughhead grenadier (20-30%) and processors are now expressing interest in it. The Canadian fleet bas no experience with this fish as a directed fishery and, as such, it is likely to continue as a by-catch fishery only.
Sorne product has been produced in N ewfoundland on processing machinery used for small cod but processors have not been able to realize standard whitefish fillet prices. In addition, processing costs are high due to the low (20%) yield realized from this large headed species. Considerable science and market work will have to be done before the full benefit from this species can be realized.
Argentine Scotia Fundy DFO personnel report that there is still little known about the resource base for Argentine and that a 10,000 tonne experimental quota has been assigned. The fish is slightly longer than silver hake, producing a very white, soft fillet of which little is known of the stability or shelf life of the product. Argentine is fished in the silver hake box and has been directed for by the J apanese. There has been no domestic fishery for this species.
Silver Hake The total quota for silver hake for 1992 is 92,250 tonnes, of which 48,000 has been allocated to the Developmental Pool. Silver hake has received a lot of attention in recent years and several attempts have been made at a range of finished products. Most silver hake landed is caught by foreign vessels and frozen round, but several inshore vessels have undertaken experimental fishing trials outside the silver hake box with some success. At least one company in Scotia Fundy intends to produce silver hake to the mince stage, utilizing inshore and offshore harvests. Given the size and perishability of the fish, this processing will be fully mechanized with no band filleting.
If half the existing silver hake quota were harvested and brought ashore for processing to the fillet or mince stage, it would realize roughly 200 full-time (10 month) jobs.
Pelagics
• 3 & 4 Atlantic Mackerel Atlantic mackerel is reported to be able to sustain a combined U.S./ Canadian harvest of up to 200,000 tonnes. Only 12%, or 13,000 tonnes, of the Atlantic Canadian 105,000 tonne TAC was landed in 1992, as the fishery is largely developmental. Canadian companies were encouraged in 1992 by the Minister of Fisheries to develop, through the Developmental Pool, Canadian capabilities to harvest, process and market Atlantic mackerel, and there has been increased activity in area 4.
There are two major impediments to any significant expansion in this fishery in the short to medium term:
• incomplete data on the availability of mackerel resources. Directed fishing effort through joint ventures with foreign fishing vessels in recent years has not been very successful, experiencing low catch rates and low landings overall; and
• the low prices and weak international markets for the mackerel products.
Most of the mackerel currently being harvested is for the bait market and is whole frozen. Given the current situation in the herring fishery, where landings are expected to be reduced significantly with the introduction of dockside monitoring, there would be a market for mackerel for high quality fish meal production. This mackerel would have to be provided at a cost compatible with meal production. In addition, fish meal production is a capital intensive activity with little impact on employment.
The fall run of this mackerel is characterized by larger fish, 500 grams plus, and a high fat content, two prerequisites for the lucrative J apanese market, but there does not appear to be any room for expansion or displacement in this market at present. In addition, increased offshore activity has been stymied by significant quantities of herring by-catch in area 4 as well as resistance from inshore harvesters to any quantity of offshore mackerel being introduced into the mackerel bait market.
Facilities equipped to process herring could easily undertake mackerel processing. New Brunswick has undertaken a concerted harvesting and marketing effort for mackerel products but, due to the global supply, the overall weakness in the marketplace and the uncertainty of the harvest, this species is not expected to increase plant throughput or profitability in the short to medium term.
Atlantic Canadian mackerel landings account for a very small portion of world landings of mackerel (less than 1 % ) in a market where the product is traded as a low value commodity. The cost of production in Canada is not competitive in the global market where the bait price for mackerel in Nova Scotia exceeds the delivered price to Europe.
• Georges Bank (SZ) Herring Landings from the Georges Bank herring stock in the 60s and early 70s were in excess of 375,000 tonnes, supporting the largest Atlantic herring fisbery on the Western Atlantic before the stock virtually disappeared from overfishing and poor recruitment. Since DFO began monitoring this stock in 1986, the available resource has increased threefold and there is optimism for its future utilization. At this point, the size of the stock, the potential for a total allowable catch and the size of fish is uncertain. It is expected that a 5,000 tonne harvest for both American and Canadian harvesters will be approved for 1993 as a catch "not detrimental to the stock" but, before a commercial fishery can be considered, a joint management strategy will have to be developed with the Americans.
This stock is likely, in the long run, to have an impact on employment levels in the Atlantic coast fishery and the financial wellbeing of herring processors. It is not identified in this report as having a material effect in the short to medium term for the following reasons:
• negotiations with the Americans on a joint management plan could be protracted;
• the fish is a 12 hour steam from the nearest Canadian port and this distance bas implications for harvesting techniques and quality of landed product;
• the stock is highly migratory; and
• there is considerable trial fishing required before the stock will be commercially prosecuted.
Whatever fish is available in the short to medium term may serve only as an offsetting harvest for the potential decrease in 4WX herring fishery due to the introduction of dockside monitoring to a fishery where actual landings are assumed to be 20% to 80% higher than reported landings.
Other Species DFO is currently putting together an inventory of other underutilized species in Atlantic Canada, such as sea urchins, dogfish and sea cucumber. The report will include information on stock biomass and availability, current utilization and potential for further utilization. This information will not be available until the spring. Personnel working in Resource Allocation suggest that there is potential for some of these species, although available in significantly smaller quantities, to processors at least as a contribution to plant overhead. While these smaller stocks of underutilized species will not make a material impact on the industry overall, an individual species developed for harvesting and processing could make a significant difference in a specific plant or even community. For example, a subsidiary of Clearwater Fine Foods plans to open a facility
to process shark (dogfish), sea urchin and mackerel. The facility is expected to create 18 seasonal jobs.
In summary, the simulation of the modified core for the industry will reflect an increase of 400 jobs created through the increased activity in turbot and silver hake.
The Potential for Increased lmports of Fresh and Frozen Fish for Processing
The importation of fresh and frozen groundfish products for further processing in Canadian plants is increasing in occurrence and quantity. The practice includes the importation of fresh groundfish from the United States as well as frozen groundfish from the former Soviet Union and other sources. The moratorium in the Northern cod fishery in Newfoundland has forced and encouraged a greater range of companies to look to these sources of fish as an alternative to Canadian fish resources.
Several firms have experience in processing previously frozen groundfish, some of it imported and some Canadian, frozen-at-sea, H&G product. The attempts made over the years to process frozen groundfish have met with varying levels of success, usually on a case by case basis resulting from extreme variances in quality or competence in dealing witb the product. Today there are large and medium size companies importing larger and larger quantities of fish of improving quality that is being slacked and processed into an expanding range of groundfish products. Problems have been experienced with the size and quality of fish but shipments are approved on a load by load basis and growing success is being realized. It has the effect of extending or optimizing the production output and economics of the facility. For a limited number of facilities, this imported fish is the sole source of raw material to the plant. For others it is a supplemental source of raw material expected only to make a contribution to overheads, as opposed to a profit gain.
DFO, early into the moratorium on Northern cod, contracted a preliminary report on this issue as a first step to investigating "ways to import fish available in international markets for processing in northern cod plants".
The source of the vast majority of this fish ta date has been Barent Sea Russian caught groundfish, primarily cod. The purchase of such fish is a practice that has gained widespread use in Scandinavia and Europe in particular Denmark, Norway and Germany where indigenous or traditional sources of fish resources have been in decline. DFO estimates that as much as 100,000 tonnes of frozen at sea cod was imported and processed by these countries in 1992. There are concerns that the existing political situation in Russia does not allow for a meaningful regulation of fisheries activities and as such the longer term viability and health of these fish stocks could be in question. In
•
~·
addition, the evolving political and economic situation in the former Soviet Union makes the continued availability of these fish resources uncertain to say the least.
DFO has undertaken a preliminary investigation into the central purchasing of frozen fish for processing in Atlantic Canadian plants. To ensure economic viability it was expected that the product would have to be subsidized at a rate of $600-700 per tonne or alternatively the fish could be made available on an auction basis. No conclusion has been reached to date. Estimates from government and industry on the likely levels of frozen cod imports range from 15,000 to 25,000 tonnes (within the range estimated by Peat Marwick as available •without disrupting world prices"). This amount could have a material impact on individual firrns who are highly or solely dependent on this source of raw material but would not have a material impact on the industry overall in terrns of financial strength and viability or on the utilization of capital and labour. Even if the fish was distributed through the Resource Short Plant Program (which seerns unlikely at this point) the 32 plants would have access to between 468 and 781 tonnes of product for production. Given the low to non-existent margins on this fish (for most processors especially without government subsidy) the financial benefits are minimal.
If industry was financially able and motivated to further develop the importation of these fish resources, in any significant quantities they would be competing head to head with the Scandinavian and European interests who have a locational comparative advantage and a significant volume, well established business developed with the Russian fleet.
The current resource situation in Atlantic Canada has motivated Canadian firms to look much further afield to sources of supply that might have previously been considered inappropriate for access to fish resources. One Atlantic Canadian firm is reported to be importing fish from West Africa and opportunities for joint venture with less developed nations have been tabled in Canada but to date not pursued in any vigorous fashion. The significant opportunities that could emerge here notwitbstanding, for the short to medium term these sources of fish are not expected to materially impact on the throughput of the industry overall nor the utilization of capital and human resources.
Without government central buying or a structure consortium of large volume users it is highly unlikely that the volume of fish will reach the high end estimate of 25,000 tonnes. If it does it is likely to be concentrated largely in firms that are dedicated to and already experienced with the process realizing highly localized benefits.
Given the above, no change in resource availability through this source is forecast for the short to medium term.
The Potential for Increased Technology Absorption
The Atlantic coast fish processing industry is characterised by processing facilities that vary in size, throughput mix, production mix, and managerial and technological sophistication. The delineation is usually by size with the larger integrated plants utilizing a greater diversity and level of the latest technology to reduce labour costs, increase yield or recovery and quality, and minimize waste.
The potential for increased technology absorption and the impact of that change on the financial and employment profile of the industry is addressed here by principal species groupings: groundfish, pelagics, and mollusc and crustaceans. Within each species groupings, potential and likely changes in the area of process and product technology are identified.
The findings reported here are based on a literature review and communications with equipment manufacturers, technology integration officers with Technomar, National Research Council, the Marine Institute, Technical University of Nova Scotia and other organizations, industry, provincial and federal personnel working directly on the issue of technology integration24
•
The intent of our review of the potential changes in technological absorption was to identify areas in fish processing that could materially change the financial or employment profile of the industry. Materially, for the purposes of this analysis, is considered to be any change that results in the creation or Joss of at least 1.000 jobs.
24 Wayne Van Norden, Baader Canada Ltd., N.S. Austin Kerr, Baader Canada Ltd., N.S. Yves Daigle, Technomar, N.B. Dick Whitaker, CCFI, Marine Institute, NF. Andy Woyewoda, CIFT, TUNS, N.S. Doug Wright, Atlantech, P.E.I. Jan Spinney, Atlantic Quality Concepts, N.B. Alain Gauthier, ISTC, Ottawa Bill Carter, Department of Fisheries, NF. Nigel Allen, Technomar, Corner Brook, NF. Jean Guy Maillet, Pecherie Cap Lumiere Fisheries Ltd., N.B. Dr. E. Graham Bligh, Seafood Consultant, N.S. Brian McNamara, Newfound Resources, NF. George Richard, DOF, N.S. Peter Norsworthy, Tavel, N.S. Members of SP ANS and F ANL
~·

General
There has been considerable focus over the past several years on technology integration in the fish processing industry. New technologies have been introduced, developed and improved in the areas of cost reduction, quality improvement and value added but opinions are varied on how far the industry has progressed in real and relative (to other leading fishing nations) terms .
Many industry spokespersons report that they have responded to the market and bottom line demands of the industry and have "made the move" to automation. A Technology Survey of Canadian Firms published by ISTC in 1990 stated that "most of the integrated and primary processing firms (in their survey) report that they are as competitive as any firms in the world". Working Groups at a 1991 FCC seminar on "Advanced Technology for Cost, Quality and Service Improvement in the Canadian Fishing Industry" reported that there is lack of knowledge of existing technology and that some problems cannot be solved by existing technology. Further, once industry is made aware of technology that does respond to their existing problems that they require a cost justification methodology that is independently developed to assist them in the decision mak.ing process to integrate that technology.
Wbile it is accepted that there are no new technologies available in Europe that are going to revolutionize the industry, there is reportedly more use of automated filleting equipment, automated heading, and gutting equipment, emphasis on quality control, and using technology to improve quality and to improve yields in Scandinavian countries than there is in Atlantic Canada.
Whether or not further significant integration will take place in Atlantic Canada in the short to medium term (in the next 3 - 5 years) will be a function of many variables including:
• the availability of traditional resources;
• the consistency of that supply;
• the distribution of those resources between existing processing facilities;
• the market "drivers" that are present and acknowledged by industry;
• the financial well-being of the industry;
• their knowledge of the technology; and
• the extent to which the technology has been proven and this can be effectively and objectively disseminated to industry participants.
.
[ÇMJ
Groundfish There is general consensus that the groundfish processing industry has made significant progress in the absorption of technologies, especially process technologies, in recent years, in particular since the mid ta late 80s. This absorption has been driven by the following factors:
• the necessity ta maximize production in terms of yield and quality;
• increasing raw material costs;
• the demands of the international marketplace where quality and consistency of product have become principal drivers;
• supported assurances as ta the operational and cost effectiveness of core machinery such as heading, filleting and skinning machines. The payback for this type of machinery is largely (80-85%) in the increase in yield with the remaining savings realized in labour cost reductions; and
• ta some extent the availability of government assistance or financing for this equipment.
A spokesperson for the leading fish processing equipment manufacturer servicing Atlantic Canada reports that 50-60% of plants in Atlantic Canada are "low tech" where they are still hand-filleting, 30-40% are "mid-tech" or partly automated, and 10% are high tech where the latest technology is available throughout the plant. While there are significant differences in how things are done and the level of technological integration in plants in the Atlantic, the following points can be made for the industry overall:
• Skinning machines are commonplace throughout Atlantic Canada (in Newfoundland, for example, it is estimated that 99% of plants including feeder plants are sa equipped) and band skinning is virtually non-existent. Further developments in skinning involve the integration of the skinning machine with a filleting machine.
• The processing equipment industry estimates, and is confirmed by government personnel, that the vast majority of those firms with sufficient raw material throughput to support the investment in groundfish filleting machinery have already made the investment. Baader reports that 80 ta 100 "184" filleting machines are in place in plants in Atlantic Canada. The likely restructuring of the industry and resulting consolidation of fish resources in fewer plants will encourage the use of these machines but for the most part the workers have already been displaced through the introduction of these machines.
• The Baader 184 filleting machine can now be modified to include a pinbone removal capability. There are 15 to 20 of these machines in use in Atlantic Canada. Again the catalyst here is primarily yield recovery but labour savings are also involved. This attachment can displace as many as 7 people per machine even though the requirement for sizing, portioning and trimming still remain. The cost is roughly $250,000 to modify an existing Baader 184 with the pin-bone attachment. While some of the technology field officers feel that this equipment is very likely to be a critical component of the next "wave" of technology integration for plants already using the filleting machine, Baader report that given the resource situation and the likely, at least temporary, displacement of existing Baader 184s, that they would expect to introduce only 20 additional pin bone attachments in the next five years. This would mean a potential displacement in the order of 150 plant workers.
• The size of available redfish has encouraged the somewhat rapid integration of the Baader 153 redfish filleting machine. Baader estimates that as much as 80% of the potential market has been penetrated representing 45 such machines in Atlantic Canada. As the resource requirements for cost efficiency and reasonable payback are similar to the Baader 184 at 2.6 million pounds of fish and, given the existing level of penetration, further integration of this technology is not expected to have a material impact on the industry.
• New machinery to process flatfish to the fillet stage is about to be introduced by Baader to the Atlantic coast fishery. This machine, the Baader 176, can displace up to 13 workers per machine. The machine requires a minium throughput of 2.5 million pounds for cost effectiveness and is estimated to have the potential to produce a yield factor of 5%. Short to medium term expectations for this machinery are with FPI in Newfoundland and other companies in Nova Scotia but are unlikely to have a material (the loss or gain of 1,000 processing jobs) impact in the short to medium term due to the resource availability and the cost of the machinery. Baader estimates that over the next five years that 500 people at most would likely be displaced through the use of this technology.
• While significant advances have been made in the development of technologies for defect (parasite, bone and bruise) detection and removal, it is unlikely that this technology will have a material impact on labour utilization and productivity in the short to medium term. Despite the fact that, on average, defect detection and removal accounted for 20% of the plant labour, engineers working directly in the development of this equipment suggest that it will take a minimum of five years to see the technology in place in industry, and ten years before it is commonplace.
• Weight selection equipment in packing the final product is used extensively in Scandinavia to minimize over-pack and handling, and to eliminate tearing of
.
~
finished fillets which reduces the value of the final product. Technology officers in Atlantic Canada and Baader personnel report that this technology will have to be standard in the industry in the short to medium term to meet the growing market demands for portion controlled fillets. The stringent portion control being introduced which includes product differentiations of only an ounce cannot be met through visual inspection. The costs of manual production are prohibitive and the precision simply cannot be achieved. Anyone attempting to do this by band will be incurring excessive labour costs, likely be packing unacceptable levels of overweight, and not meeting the buye:r specifications.
The capabilities of size grading and packing machinery differ dramatically and some systems can incorporate considerable levels of manual labour. A fully automated line that is sorting by size and then portioning by pack requirements can displace from 25 to 30 persans per line. Baader estimates that anywhere from 50 to 100 of these systems could be expe:cted to be integrated into the Atlantic fisbery over the next five years and have the potential to displace between 1,250 and 2,500 workers.
• Statistical Process Control Systems have been used to only a very lirnited extent by fish processing companies in Atlantic Canada to date. The Canadian industry bas not responded to the same extent as certain Scandinavian countries to the advances in this area despite the ability of the technology to measure and, therefore, improve productivity on the plant floor. There are several reasons proposed for the lag time in the absorption of this technology in Canada, including:
• the technology has not been "proven";
• the production mix in the average processing plant exceeds that of Iceland and Denmark for example and makes significant demands upon this type of technology which, in the minds of some users, it cannot meet. It is believed that the human element still exceeds the capability of the machine in plants where the variables, such as number of species and number of packs, are numerous;
• the filleting and ancillary equipment does not require any skill other than what can be learned in the in-plant training course. The use of computerized production control technology requires a higher level of literacy and capability; and
• the system in itself does not generate a payback. It is a tool for management to use to monitor, contra~ and respond to iriefficiencies in plant production.
84
Job displacement resulting from the integration of such technologies is indirect usually at the office accounting level and through the identification of individual workers causing bottlenecks due to inappropriate abilities or work flow design. For the most part this equipment is used mainly by the larger companies and is not expected to have a material impact on employment.
• Portioning machinery was only introduced by Baader for commercial usage in 1991 in the National Sea Products plant in Arnold's Cove Newfoundland. This machinery only has cost effective applications in facilities that have a consistent supply of large fish. Despite the cost of this machinery to National Sea it has not been redeployed to another facility due to its resource requirements. This equipment is not likely to have a material impact on employment in the industry in the short to medium term.
Pelagics • Processing equipment for pelagics, particularly herring and mackerel, have been
around for 25 years. The Baader 33 is a staple in the herring processing industry and is now being upgraded to the Baader 35 which is a combination of Baader and Arenco technologies. The machine can be used in tandem with a skinning and portioning machine for the marinated herring product. The skinner is a labour saving device but also provides consistency of production which is becoming a more critical component in pelagics production. Market investigations done independent to this study in 1991 reported that buyers were looking for product produced by the Baader 35 machine. Yield improvement is secondary in the decision to utilize filleting equipment in the pelagics production.
Herring processing for all intents and purposes is not done without automated filleting due to the volumes of fish processed and the relatively low margins. For the knobbed, single fillet and butterfly fillet products a filleting machine must be used. The Baader 35 is replacing the older machines as many new entrants process herring and mackerel in the face of dedining groundfish stocks.
In the pelagics sector these moves have, for the most part, been made of necessity due to the high volumes of pelagics processed in a very short period of time, and the size of the fish; both factors making efficient manual processing virtually impossible.
• Work is ongoing with at least one major equipment manufacturer on the development of roe removal technology appropriate for the herring roe industry. It is reported that this is not likely to be available in the short to medium term for integration in to the Atlantic coast fishery. When it is, job displacement in this very seasonal industry could be significant.
.
~
There are no changes expected in the use of technology in the short to medium term in the pelagics processing industry that would have a material impact on financial position or employment levels.
Molluscs and Crustaceans Lobster Lobster processing refers largely to the process of meat extraction for the production of a frozen meat product in tin or specialty pack. Other products include in-shell lobster tails. Canada is currently the sole producer of commercial lobster meat and as such does not look elsewhere for lobster processing technology per se. There are technological applications from other species such as the removal of the tail vein using high pressure water that could be adapted for lobster.
A significant change to lobster meat processing would be the mechanization of the meat removal process. To date there is no technology that can undertake this production process. The principal changes in lobster processing in recent years have been the development of specialty packs moving away from the commodity tin production to a vacuum packed, high-end product for the white table service in the U.S. and Europe. While this product is more labour intensive, the impact on labour utilization it is not significant.
Technological developrnents that are available but not widely irnplemented include the continuous cooker that elirninates the "batch cooking" system of lobster. This system is used prirnarily for crab, but bas been modified for lobster. Lobster processors interviewed were not convinced of the labour saving capabilities of this technology and suggested that the yield enhancement capabilities were the primary catalyst for inclusion in the processing system.
Technology exists to extract the meat from the main body of the lobster that is currently commonly used in the processing of crab meat. This machinery produced a low value mince product and as such is not preferred to band shucking in lobster processing.
Crab There are no major technological improvements or changes forecast for the crab industry in the short to medium term that would materially reduce the number of jobs available to this industry. A recent product development that could have an impact on job creation is the production of a special crab leg product that utilizes crab leg splitting technology.
This is a value added product that is produced using technology that realizes as much as seven fold increases in labour utilization from 1.5 seconds per crab leg to 15 seconds per crab leg. If all crab leg production was diverted to this process as many as 600 jobs could be created in the industry but due to the estimated capital investment required and the likelihood of only a few larger sized firms to make this investment, the short to
medium term impact is forecast to be considerable less. It is not considered material to tbis analysis.
There are no changes expected in the use of technology in the short to medium term in the mollusc and crustacean processing industry that would have a material impact on financial position or employment levels.
Summary Technology change or absorption in the industry is expected to displace roughly 1,900 jobs across the Atlantic in groundfish processing in the short to medium term.
The Potential for Increased Value Added in Fish Processing
There are several distinct considerations in a review of the potential to add value to the production of the Atlantic fish processing industry. They are:
• maxirnizing value of the existing product form through an increase in the overall quality of the product beginning with the harvesting process;
• adding value to the production output by optimizing the product rnix from any given quantity of fish resources; and
• adding value by further processing a given product to the secondary or tertiary stage such as au gratin, breaded or entrée products.
Maxirnizing Value of the Existing Product Forms • The principal barrier to any significant improvement in the overall quality of the
ex.isting range of groundfish products being produced in the processing industry is the quality of the raw material being landed. Conventional wisdom suggests that Atlantic fish quality is acceptable and near the top of achievable quality standards. Emerging information suggests, however, that we have a lot of room for improvement in this area and improvements will result in increased profitability. Surprising to some, this comment applies to both inshore and offshore producers.
In most areas the decline in resource availability has increased the shore competition for raw material which has lessened, if not elirninated, any real dockside grading practices. Fish is not being differentiated at dockside by quality and as such there is little to no direct incentive for the harvester to perform the necessary gutting, bleeding and icing at sea that would ensure a higher if not top quality fish landed. There is absolutely no question that processors are limited in their quality of production by the quality of product being purchased and processed. Improvements in the quality of landed product will definitely
translate into improved margins and profitability for the processors (and the fisherman) but will not have any impact on levels of plant employment.
Improvements have been made and need to be continued in the in-plant storage and handling of fish that will maximize the quality and minimize the damage to the raw material before it is finally put in the end product.
These in-plant changes are not expected to have a material impact on margins but sirnply sustain value due to the quality demands in the market place. They are not expected to materially impact on labour requirements.
Value Added Through Optimization of Product Mix • Value added through improved optimization of product mix is an area in which
there is room for significant improvement in fish processing. Machinery does exist to assist industry in this goal but is not in widespread use for several reasons. It is expected that improvements and refinements in this technology will lead to a more widespread use of the technology in the larger fully integrated facilities, and over-time, to the medium sized fish processors. The integration of this technology and the impact on the industry is addressed in the previous section on The Potential for Increased Technology Absorption. The impact in the short to medium term is not considered material.
Value-Added Through Further Product Development • Value added through further product development in the form of secondary and
tertiary production can definitely improve the incarnes to the industry and increase employment opportunities. Secondary processing can take place virtually anywhere that has relatively good access to the market. It is often investigated as a route to add value to production in the face of declining resource availability and is likely to receive considerable attention in the short to medium term. On the other hand secondary and especially tertiary production is capital intensive and requires significant financial and operational effort to develop products and establish market share. Most critically it requires a consistent, high quality source of raw material in order that markets can be serviced consistently. If consistent supply is not available to the customer, then this effort can be reduced to sporadic activity on a spot market basis.
In light of the, at best, unpredictable state of the resource for groundfish it is unlikely that companies that have not already entered this production area will do so in the short to medium term in any meaningful way. The impact of changes to value added production is not considered material to this analysis.
. . ~·

APPENDIXI
TABLE OF CONTENTS FOR REPORT ONE, TWO AND THREE
TABLE OF CONTENTS
REPORT ONE - FIN AN CIAL PERFORMANCE AND SUST AIN ABLE CORE
1. INTRODUCTION
2. THE ASSIGNMENT
3. FIN AN CIAL OVERVIEW OF THE ATLANTIC FISHERY
The Peaks and Troughs of Performance in Fish Processing Profitability Productivity Debt Service Financial Position Financial Position of Large Versus Small Companies Financial Comparison of the Fish Processing Industry to Other Industries Overcapacity in Fish Processing Summary Conclusions
4. THE SUSTAINABLE CORE FISHERY MODELS
Direct Labour Mode! (DLM)
5. THE DETERMINATION OF THE CORE FISHERY
Dimensions of a Sustainable Industry Summary of Potential Job Displacement Conclusions
6. THE MODIFIED CORE FISHERY
Summary of Job Gains and Displacement from Potential Modifiers The Potential for Increased Use of Underutilized Species The Potential for Increased Imports of Fresh and Frozen Fish for Processing The Potential for Increased Technology Absorption The Potential for lncreased Value Added in Fish Processing
90
REPORT TWO - INDUSTRY TRENDS AND DYNAMICS
1 THE FISHING INDUSTRY IN ATLANTIC CANADA
Importance of the Fishery to the Provincial Economies Dependence of Coastal Communities The Fishery as an Employer Resource A vailability and Principal Fisherles Seasonality of Landings in the Atlantic Fishery The Harvesting Sector Role and Coverage of Fisheries Organizaüons The Processing Sector Markets and Marketing
2 THE TRENDS IN THE ATLANTIC COAST FISHING INDUSTRY
Atlantic Fishery Landings , Values and Unit Prices , by Species Group 1977-1991
Registered Fishing Vessels In the Atlantic Coast Fisàlery 1980-1991 Registered Fish Processing Facilities in Atlantic Ca.acta 1980-1991 Employment in Fish Processing in Atlantic Canada 1980-1991 Seasonality of Landings and Utilization of Processing Capacity Output in the Harvesting and Fish Processing Sectors 1980-1991 Production Trends in Fish Processing Atlantic Canada 1977-1991 Value Added in Fish Processing Capital Investment in the Atlantic Fish Processing Sector 1981-1991
3 THE DYNAMIC OF THE ATLANTIC COAST FISHING INDUSTRY
The Internai and External Drivers The Successful Enterprise
4 COMPARISON OF ATLANTIC CANADA WITH ICELAND AND NORWAY
91
REPORT THREE - DATA MODELS AND DOCUMENTATION
1. DOCUMENT A TI ON OF MASTER DATA MO DEL
2. MASTER DATA MODEL
3. DOCUMENTATION OF SUSTAINABLE CAPITAL INVESTMENT MODEL
4. SUST AIN ABLE CAPITAL INVESTMENT MO DEL
Note to Reader:
Test Model Resource Scenario 1 Resource Scenario II
Report Three was not published as a Task Force Background Study. However, several copies have been deposited with the Department of Fisheries and Oceans Library in Ottawa.
92

APPENDIXII
MONTHL Y DISTRIBUTION OF TIER 1, 2 AND 3 JOBS, 1990
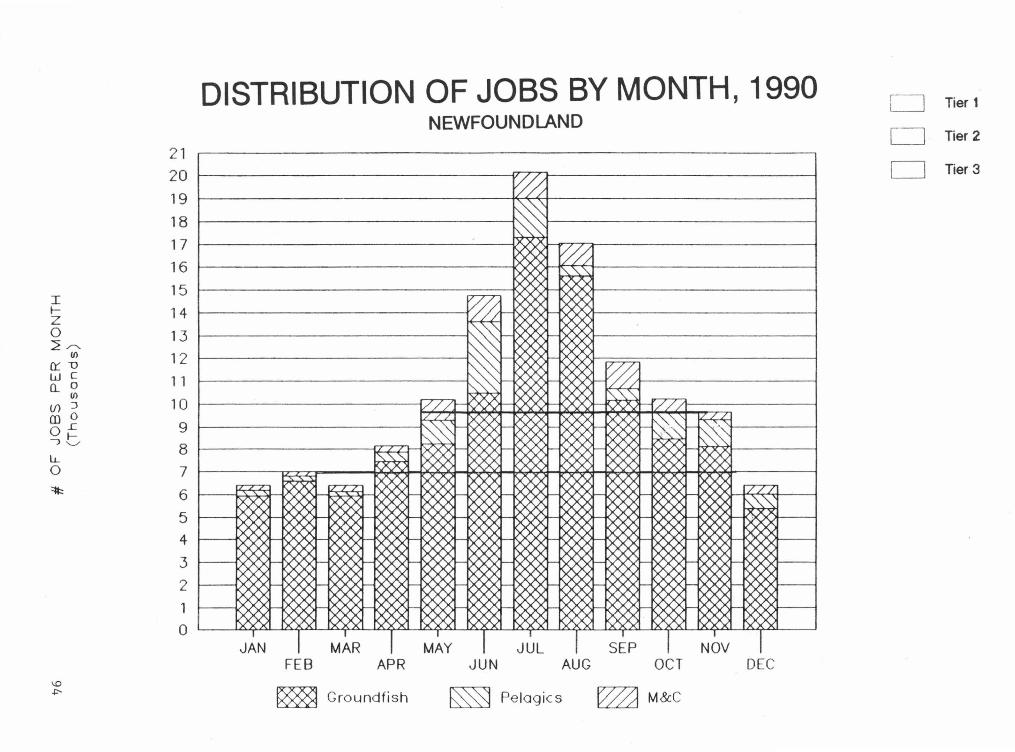
DISTRIBUTION OF JOBS BY MONTH, 1990 CJ Tier 1
NEWFOUNDLAND CJ Tier 2
21 20 CJ Tier 3
19 18 17 16
I 15
1- 14 z 0 13 L.r-...
(1) 12 O'.'. u w c 1 1 o... 0
(1)
(/) :J 10 m o
9 0 ..c --:> t,.
8 u.. 0 7 ::it:: 6
5 4 3 2 1 0
FEB APR JUN AUG OCT DEC
~ Gro undfish ~ Pelagic s ~ M&C
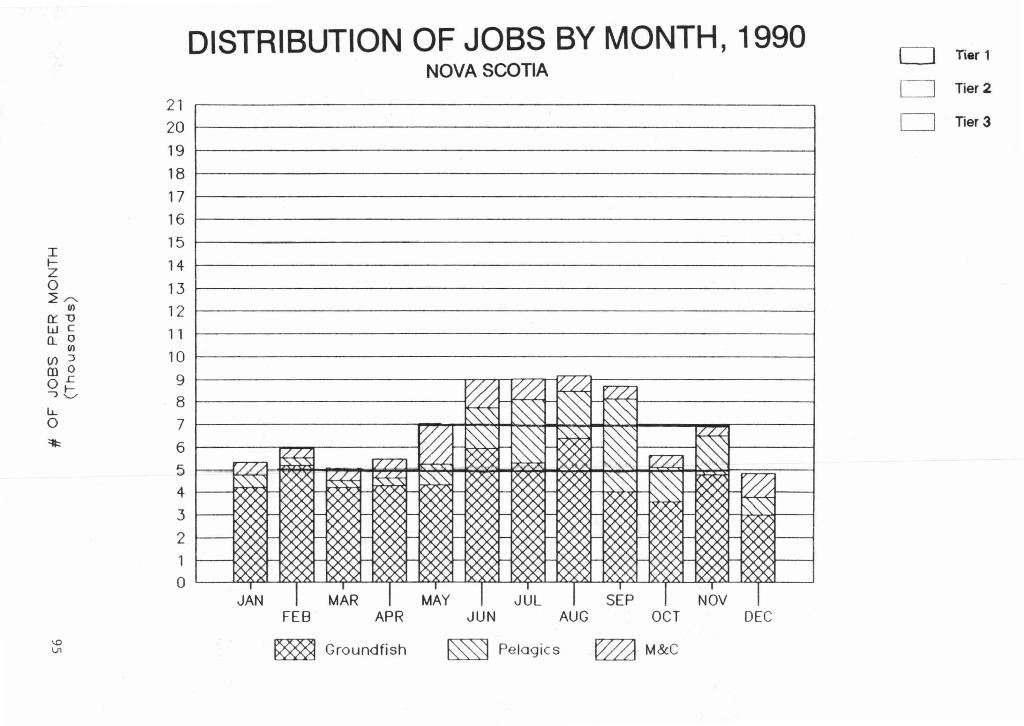
I ~ z 0 :L,,.......
(1)
(}'.'. "U w c o._ 0
(1)
(/) :J m o 0 r: Je u... 0 ~
DISTRIBUTION OF JOBS BY MONTH, 1990 NOVASCOTIA
21 .-------------------------------.
20 r------------------------__J 19 i------------------- -----__J 18 i------------------------__J 17 i------------------------__J 16 i------------------------__J 15 i------------------------__J 14 i------------------------__J 13 i----------------------- -__J 12 i---------------- ---- ---- ---1 11 i------------------- -----__J 10 i------------------------~
9 i--------------u77Tl777r-VZ7J--------~ 8r---------------l
7 r-----------r,'1"7'"/rf'.~~~~~~-+-------------1 6 t------.--.....-------f
5 4 1---V~-fQÇ>ÇX--jfQQ!;:/t-KXJO~OOJ-~X>i-KX'><~'X'><'.~~J
3~~
2 .----,A ...... Ar-""IAAAr-""IAAA
1 i---t000t---KXX>t-1ôô6Hû0<.">f-i(Y0,~~-W')N-~;xJ-1lX,)Ç><;J..-VÇ>ÇXJ-t><~4>C>O<l--__j 0 '--_J..Q.~~~~..o.L...l~~~LJA~~~~.2U_J~~~~4XJ.--1.X.':~__J
FES APR JUN AUG OCT DEC
~ Groundfish ~ Pelagics ~ M&C
CJ Tier 1
~ Tier 2
CJ Tier 3
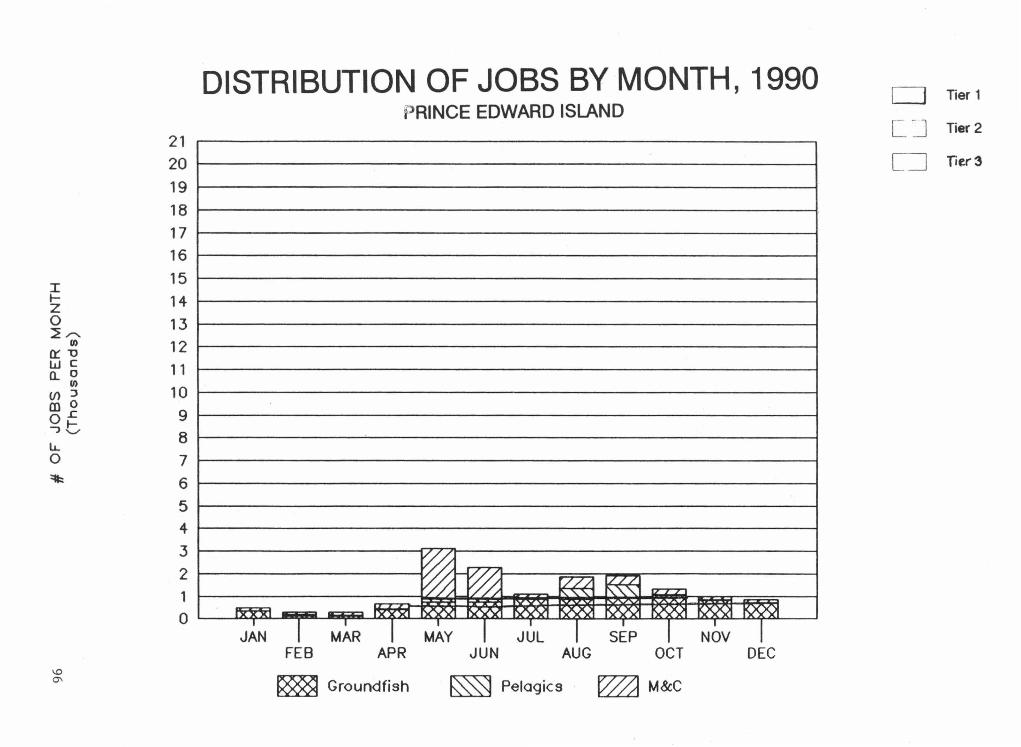
21 20 19 18 17 16
I 15
..... 14 z 0 13 ~.........,.
(1) 12 n:: u w c 11 a_ 0
(1)
Ul ::> 10 m o
9 0L -,c 8
lL. 0 7 ~ 6
5 4 3
2 1
0
DISTRIBUTION OF JOBS BY MONTH, 1990 PRINCE EDWARD ISLAND
~ -~ ~ m ~ IT"'T"'T'1
'~ ~~ ~~
flin?!n ~ -=z::::c:ll IV' 7VI "0N ~ ~ IV\<'VI V\ """
QQÇ IV X(t ~ KX.XJI 1
1 1 1
1 1
1 1 1
1 JAN MAR MAY JUL SEP NOV FEB APR JUN AUG OCT DEC
~ Groundfish ~ Pelogics ~ M&C
c=J Tier 1
[_ ~ Tier 2
C:=J nu3
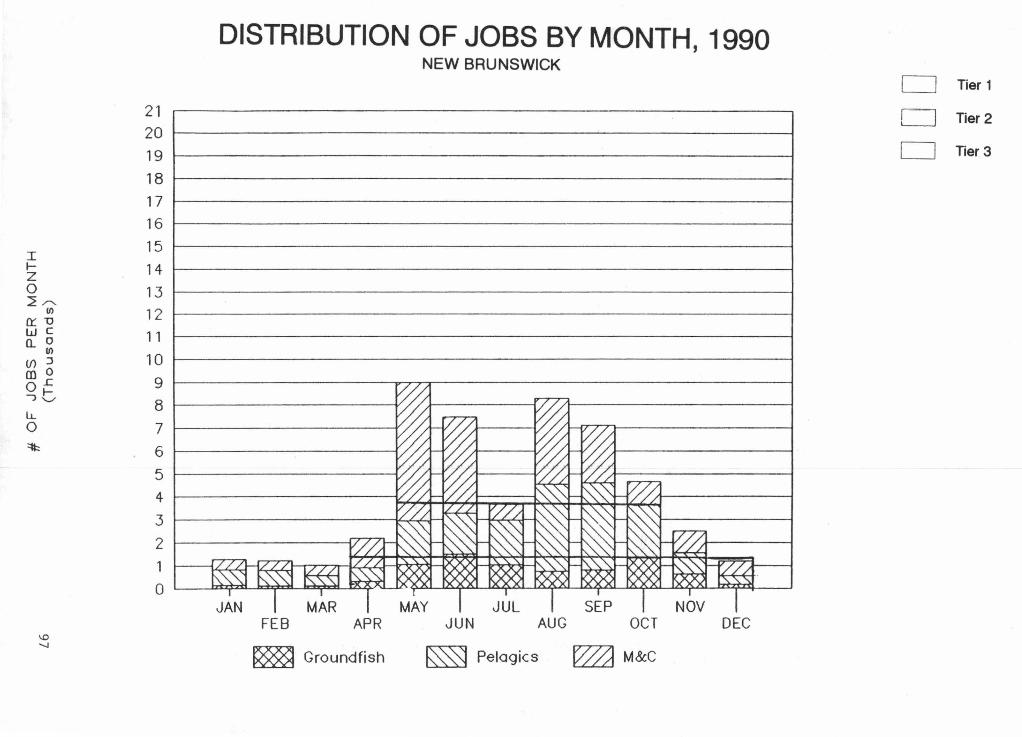
21 20 19 18 17 16
I 15
1- 14 z 0 13 2,,,-.,.
Il) 12 ~u w c 11 o.. 0
Il)
10 (/) :J m o
9 0 .c -, t, 8
u.. 0 7 ~ 6
5 4 3 2 1 0
\0 -...J
DISTRIBUTION OF JOBS BY MONTH, 1990 NEW BRUNSWICK
FEB APR JUN AUG OCT DEC
~ Groundfish ~ Pelogics ~ M&C
c=J Tier 1
CJ Tier2
c=J Tier3
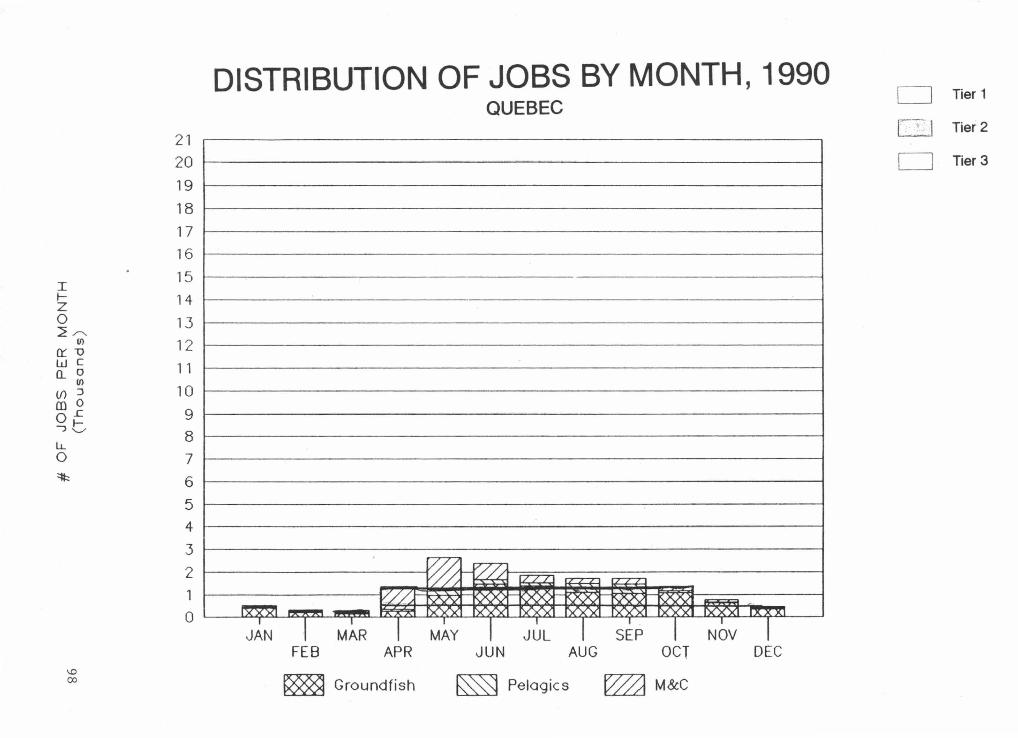
I fz 0 2 /'..
Il)
0::: 1J w c Q_ 0
Il)
l/) :J m o 0 ..c -,0 LL 0 ~
\.0 OO
DISTRIBUTION OF JOBS BY MONTH, 1990 QUEBEC
21
20 r--------------------------____J 19 r--------------------------____J 18 r----------------------------l 17 r--------------------------__J 16 r-------------------------__J 15 r----------------------------J
14 r--------------------------__J 13 r-----------------------------1 12 r----------------------------1 11 r-------------------------__J 10 r-------------------------__J
9 r-------------------------~ 8 i------------------------------1 7 r-----------------------------1 6 r-------------------------__J 5 r-------------------------__J 4 r--------------.:.__ __________ __J 3 r-----------------------------1 2 t-----------t~~~/t-:::IL.L=='..L=--~-"CZ.--rrz7---------l 1V v///'.//,7-.A~VV'>t~~O<~OO~~~~X>~rv~"'~x,.;~IQQ<..,~~N~~~----_J O ~ - -~ ~~~V~"x'X6t-161Y'6-x"V~~l/\ÔN~IY'MX'>l.~l\l\l\.~~l'X"):ÇXY1W-4:11\()(Vl~ij.....t.nr-x-xl
J~N 1 MAR 1 MAY 1 J~L 1 SEP 1 N~V 1 FEB APR JUN AUG OCT DEC
lm Groundfish ~ Pelagics ~M&C
CJ Tier 1
~ Tier 2
CJ Tier 3

Canada