Systematic Localization of Common Disease-Associated Variation in Regulatory DNA
7
DOI: 10.1126/science.1222794 , 1190 (2012); 337 Science et al. Matthew T. Maurano Regulatory DNA Systematic Localization of Common Disease-Associated Variation in This copy is for your personal, non-commercial use only. clicking here. colleagues, clients, or customers by , you can order high-quality copies for your If you wish to distribute this article to others here. following the guidelines can be obtained by Permission to republish or repurpose articles or portions of articles ): February 7, 2013 www.sciencemag.org (this information is current as of The following resources related to this article are available online at http://www.sciencemag.org/content/337/6099/1190.full.html version of this article at: including high-resolution figures, can be found in the online Updated information and services, http://www.sciencemag.org/content/suppl/2012/09/04/science.1222794.DC1.html http://www.sciencemag.org/content/suppl/2012/09/05/science.1222794.DC2.html can be found at: Supporting Online Material http://www.sciencemag.org/content/337/6099/1190.full.html#related found at: can be related to this article A list of selected additional articles on the Science Web sites http://www.sciencemag.org/content/337/6099/1190.full.html#ref-list-1 , 13 of which can be accessed free: cites 45 articles This article http://www.sciencemag.org/content/337/6099/1190.full.html#related-urls 4 articles hosted by HighWire Press; see: cited by This article has been http://www.sciencemag.org/cgi/collection/genetics Genetics subject collections: This article appears in the following registered trademark of AAAS. is a Science 2012 by the American Association for the Advancement of Science; all rights reserved. The title Copyright American Association for the Advancement of Science, 1200 New York Avenue NW, Washington, DC 20005. (print ISSN 0036-8075; online ISSN 1095-9203) is published weekly, except the last week in December, by the Science on February 7, 2013 www.sciencemag.org Downloaded from
-
Upload
independent -
Category
Documents
-
view
2 -
download
0
Transcript of Systematic Localization of Common Disease-Associated Variation in Regulatory DNA
DOI: 10.1126/science.1222794, 1190 (2012);337 Science
et al.Matthew T. MauranoRegulatory DNASystematic Localization of Common Disease-Associated Variation in
This copy is for your personal, non-commercial use only.
clicking here.colleagues, clients, or customers by , you can order high-quality copies for yourIf you wish to distribute this article to others
here.following the guidelines
can be obtained byPermission to republish or repurpose articles or portions of articles
): February 7, 2013 www.sciencemag.org (this information is current as of
The following resources related to this article are available online at
http://www.sciencemag.org/content/337/6099/1190.full.htmlversion of this article at:
including high-resolution figures, can be found in the onlineUpdated information and services,
http://www.sciencemag.org/content/suppl/2012/09/04/science.1222794.DC1.html http://www.sciencemag.org/content/suppl/2012/09/05/science.1222794.DC2.html
can be found at: Supporting Online Material
http://www.sciencemag.org/content/337/6099/1190.full.html#relatedfound at:
can berelated to this article A list of selected additional articles on the Science Web sites
http://www.sciencemag.org/content/337/6099/1190.full.html#ref-list-1, 13 of which can be accessed free:cites 45 articlesThis article
http://www.sciencemag.org/content/337/6099/1190.full.html#related-urls4 articles hosted by HighWire Press; see:cited by This article has been
http://www.sciencemag.org/cgi/collection/geneticsGenetics
subject collections:This article appears in the following
registered trademark of AAAS. is aScience2012 by the American Association for the Advancement of Science; all rights reserved. The title
CopyrightAmerican Association for the Advancement of Science, 1200 New York Avenue NW, Washington, DC 20005. (print ISSN 0036-8075; online ISSN 1095-9203) is published weekly, except the last week in December, by theScience
on
Feb
ruar
y 7,
201
3w
ww
.sci
ence
mag
.org
Dow
nloa
ded
from
Systematic Localization of CommonDisease-Associated Variation inRegulatory DNAMatthew T. Maurano,1* Richard Humbert,1* Eric Rynes,1* Robert E. Thurman,1 Eric Haugen,1
Hao Wang,1 Alex P. Reynolds,1 Richard Sandstrom,1 Hongzhu Qu,1,2 Jennifer Brody,3
Anthony Shafer,1 Fidencio Neri,1 Kristen Lee,1 Tanya Kutyavin,1 Sandra Stehling-Sun,1
Audra K. Johnson,1 Theresa K. Canfield,1 Erika Giste,1 Morgan Diegel,1 Daniel Bates,1
R. Scott Hansen,4 Shane Neph,1 Peter J. Sabo,1 Shelly Heimfeld,5 Antony Raubitschek,6
Steven Ziegler,6 Chris Cotsapas,7,8 Nona Sotoodehnia,3,9 Ian Glass,10 Shamil R. Sunyaev,11
Rajinder Kaul,4 John A. Stamatoyannopoulos1,12†
Genome-wide association studies have identified many noncoding variants associated with commondiseases and traits. We show that these variants are concentrated in regulatory DNA marked bydeoxyribonuclease I (DNase I) hypersensitive sites (DHSs). Eighty-eight percent of such DHSs are activeduring fetal development and are enriched in variants associated with gestational exposure–relatedphenotypes. We identified distant gene targets for hundreds of variant-containing DHSs that may explainphenotype associations. Disease-associated variants systematically perturb transcription factor recognitionsequences, frequently alter allelic chromatin states, and form regulatory networks. We also demonstratedtissue-selective enrichment of more weakly disease-associated variants within DHSs and the de novoidentification of pathogenic cell types for Crohn’s disease, multiple sclerosis, and an electrocardiogramtrait, without prior knowledge of physiological mechanisms. Our results suggest pervasive involvement ofregulatory DNA variation in common human disease and provide pathogenic insights into diverse disorders.
Disease- and trait-associated genetic variantsare rapidly being identified with genome-wide association studies (GWAS) and re-
lated strategies (1). To date, hundreds of GWAShave been conducted, spanning diverse diseasesand quantitative phenotypes (2) (fig. S1A). How-ever, the majority (~93%) of disease- and trait-associated variants emerging from these studieslie within noncoding sequence (fig. S1B), com-plicating their functional evaluation. Several linesof evidence suggest the involvement of a propor-tion of such variants in transcriptional regulatorymechanisms, including modulation of promoter
and enhancer elements (3–6) and enrichment with-in expression quantitative trait loci (eQTL) (3, 7, 8).
Human regulatory DNA encompasses a vari-ety of cis-regulatory elements within which the co-operative binding of transcription factors createsfocal alterations in chromatin structure. Deoxy-ribonuclease I (DNase I) hypersensitive sites (DHSs)are sensitive and precise markers of this actuatedregulatory DNA, and DNase I mapping has beeninstrumental in the discovery and census of hu-man cis-regulatory elements (9). We performedDNase I mapping genome-wide (10) in 349 celland tissue samples, including 85 cell types studiedunder the ENCODE Project (10) and 264 sam-ples studied under the Roadmap EpigenomicsProgram (11). These encompass several classesof cell types, including cultured primary cellswith limited proliferative potential (n = 55); cul-tured immortalized (n = 6), malignancy-derived(n = 18), or pluripotent (n = 2) cell lines; andprimary hematopoietic cells (n = 4) as well aspurified differentiated hematopoietic cells (n =11), and a variety of multipotent progenitor andpluripotent cells (n = 19). We also surveyed reg-ulatory DNA by generating DHS maps from 233diverse fetal tissue samples across days ~60 to160 after conception (late-first to late-second tri-mester of gestation). We used a uniform processingalgorithm to identify DHSs and the surround-ing boundaries of DNase I accessibility (i.e., thenucleosome-free region harboring regulatory fac-tors) (12). We defined an average of 198,180DHSs per cell type (range 89,526 to 369,920;table S1) spanning on average ~2.1% of the ge-
nome. In total, we identified 3,899,693 distinctDHS positions along the genome (collectivelyspanning 42.2%), each of which was detected inone or more cell or tissue types (median = 5).
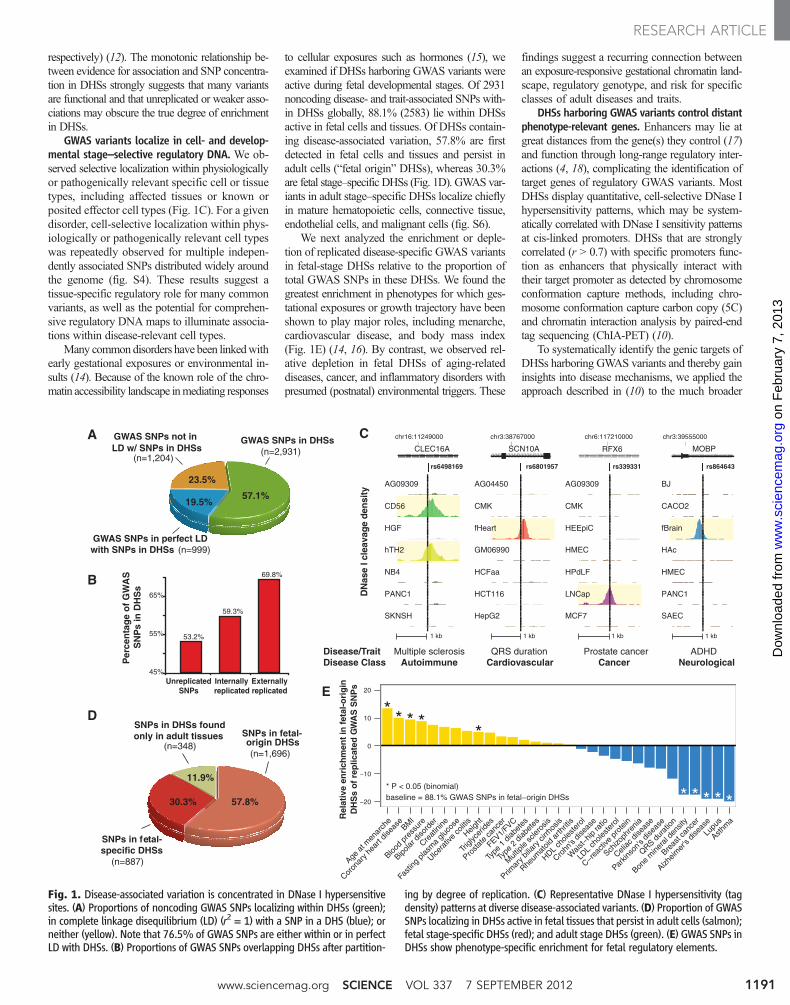
Disease- and trait-associated variants areconcentrated in regulatory DNA. We examinedthe distribution of 5654 noncoding genome-widesignificant associations [5134 unique single-nucleotide polymorphisms (SNPs); fig. S1 andtable S2] for 207 diseases and 447 quantitativetraits (2) with the deep genome-scale maps ofregulatory DNA marked by DHSs. This revealeda collective 40% enrichment of GWAS SNPs inDHSs (fig. S1C, P < 10−55, binomial, compared tothe distribution of HapMap SNPs). Fully 76.6%of all noncoding GWAS SNPs either lie within aDHS (57.1%, 2931 SNPs) or are in completelinkage disequilibrium (LD) with SNPs in a near-by DHS (19.5%, 999 SNPs) (Fig. 1A) (12). To con-firm this enrichment, we sampled variants fromthe 1000 Genomes Project (13) with the same ge-nomic feature localization (intronic versus inter-genic), distance from the nearest transcriptionalstart site, and allele frequency in individuals ofEuropean ancestry. We confirmed significant en-richment both for SNPs within DHSs (P < 10−59,simulation) and also including variants in com-plete LD (r 2 = 1) with SNPs in DHSs (P < 10−37,simulation) (fig. S2).
In total, 47.5% of GWAS SNPs fall withingene bodies (fig. S1B); however, only 10.9% ofintronic GWAS SNPs within DHSs are in strongLD (r2 ≥ 0.8) with a coding SNP, indicating thatthe vast majority of noncoding genic variantsare not simply tagging coding sequence. Analo-gously, only 16.3% of GWAS variants withincoding sequences are in strong LD with variants inDHSs. SNPs on widely used genotyping arrays(e.g., Affymetrix) were modestly enriched with-in DHSs (fig. S2), possibly due to selection ofSNPs with robust experimental performance ingenotyping assays. However, we found no evi-dence for sequence composition bias (table S3).
To further examine the enrichment of GWASSNPs in regulatory DNA, we systematically clas-sified all noncoding GWAS SNPs by the qualityof their experimental replication. This disclosed2436 unreplicated SNPs; 2374 “internally repli-cated” SNPs (confirmed in a second population inthe initial publication); and 324 “externallyreplicated” SNPs (confirmed in an independentstudy) (table S2) (12). We observed a monotonicincrease in the proportion of disease or trait var-iants localizing in DHSs with increasing quality ofGWAS SNP experimental replication (Fig. 1B), aswell as with increasing strength of associationand study sample size (fig. S3). For externally rep-licated noncoding SNPs, 69.8% lie within a DHS(n=226,P<10−14, simulation, fig. S2). To excludethe influence of population stratification, we com-pared the fixation index in African and Europeanpopulations between GWAS SNPs in DHSs andmatched SNPs not in DHSs and found them to benearly identical (FST = 0.0843 versus 0.0847,
1Department of Genome Sciences, University of Washington,Seattle, WA 98195, USA. 2Laboratory of Disease Genomicsand Individualized Medicine, Beijing Institute of Genomics,Chinese Academy of Sciences, Beijing, 100029, China. 3Cardio-vascular Health Research Unit, Department of Medicine,University of Washington, Seattle, WA 98195, USA. 4Depart-ment of Medicine, Division of Medical Genetics, Universityof Washington, Seattle, WA 98195, USA. 5Clinical ResearchDivision, Fred Hutchinson Cancer Research Center, Seattle,WA 98109, USA. 6Immunology Program, Benaroya ResearchInstitute, Seattle, WA 98101, USA. 7Department of Neurology,Yale University School of Medicine, New Haven, CT 06520,USA. 8Department of Genetics, Yale University School of Med-icine, New Haven, CT 06520, USA. 9Division of Cardiology,Department of Medicine, University of Washington, Seattle,WA 98195, USA. 10Division of Genetic Medicine, Departmentof Pediatrics, University of Washington, Seattle, WA 98195,USA. 11Division of Genetics, Brigham and Women’s Hospitaland Harvard Medical School, Boston, MA 02115, USA. 12De-partment of Medicine, Division of Oncology, University ofWashington, Seattle, WA 98195, USA.
*These authors contributed equally to this work.†To whom correspondence should be addressed. E-mail:[email protected]
RESEARCHARTICLE
7 SEPTEMBER 2012 VOL 337 SCIENCE www.sciencemag.org1190
on
Feb
ruar
y 7,
201
3w
ww
.sci
ence
mag
.org
Dow
nloa
ded
from
respectively) (12). The monotonic relationship be-tween evidence for association and SNP concentra-tion in DHSs strongly suggests that many variantsare functional and that unreplicated or weaker asso-ciations may obscure the true degree of enrichmentin DHSs.
GWAS variants localize in cell- and develop-mental stage–selective regulatory DNA. We ob-served selective localization within physiologicallyor pathogenically relevant specific cell or tissuetypes, including affected tissues or known orposited effector cell types (Fig. 1C). For a givendisorder, cell-selective localization within phys-iologically or pathogenically relevant cell typeswas repeatedly observed for multiple indepen-dently associated SNPs distributed widely aroundthe genome (fig. S4). These results suggest atissue-specific regulatory role for many commonvariants, as well as the potential for comprehen-sive regulatory DNA maps to illuminate associa-tions within disease-relevant cell types.
Many commondisorders have been linkedwithearly gestational exposures or environmental in-sults (14). Because of the known role of the chro-matin accessibility landscape inmediating responses
to cellular exposures such as hormones (15), weexamined if DHSs harboring GWAS variants wereactive during fetal developmental stages. Of 2931noncoding disease- and trait-associated SNPs with-in DHSs globally, 88.1% (2583) lie within DHSsactive in fetal cells and tissues. Of DHSs contain-ing disease-associated variation, 57.8% are firstdetected in fetal cells and tissues and persist inadult cells (“fetal origin” DHSs), whereas 30.3%are fetal stage–specific DHSs (Fig. 1D). GWAS var-iants in adult stage–specific DHSs localize chieflyin mature hematopoietic cells, connective tissue,endothelial cells, and malignant cells (fig. S6).
We next analyzed the enrichment or deple-tion of replicated disease-specific GWAS variantsin fetal-stage DHSs relative to the proportion oftotal GWAS SNPs in these DHSs. We found thegreatest enrichment in phenotypes for which ges-tational exposures or growth trajectory have beenshown to play major roles, including menarche,cardiovascular disease, and body mass index(Fig. 1E) (14, 16). By contrast, we observed rel-ative depletion in fetal DHSs of aging-relateddiseases, cancer, and inflammatory disorders withpresumed (postnatal) environmental triggers. These
findings suggest a recurring connection betweenan exposure-responsive gestational chromatin land-scape, regulatory genotype, and risk for specificclasses of adult diseases and traits.
DHSs harboring GWAS variants control distantphenotype-relevant genes. Enhancers may lie atgreat distances from the gene(s) they control (17)and function through long-range regulatory inter-actions (4, 18), complicating the identification oftarget genes of regulatory GWAS variants. MostDHSs display quantitative, cell-selective DNase Ihypersensitivity patterns, which may be system-atically correlated with DNase I sensitivity patternsat cis-linked promoters. DHSs that are stronglycorrelated (r > 0.7) with specific promoters func-tion as enhancers that physically interact withtheir target promoter as detected by chromosomeconformation capture methods, including chro-mosome conformation capture carbon copy (5C)and chromatin interaction analysis by paired-endtag sequencing (ChIA-PET) (10).
To systematically identify the genic targets ofDHSs harboring GWAS variants and thereby gaininsights into disease mechanisms, we applied theapproach described in (10) to the much broader
A GWAS SNPs not inLD w/ SNPs in DHSs
(n=1,204)
GWAS SNPs in DHSs(n=2,931)
GWAS SNPs in perfect LD with SNPs in DHSs (n=999)
57.1%
23.5%
19.5%
C
B
Disease ClassDisease/Trait
Cardiovascular CancerAutoimmuneADHD
NeurologicalProstate cancerQRS durationMultiple sclerosis
rs339331
1 kb
chr6:117210000
RFX6
LNCap
AG09309
CMK
HEEpiC
HMEC
HPdLF
MCF7
rs864643
1 kb
chr3:39555000
MOBP
fBrain
BJ
CACO2
HAc
HMEC
PANC1
SAEC
1 kb
chr3:38767000
SCN10A
fHeart
AG04450
CMK
GM06990
HCFaa
HCT116
HepG2
rs6801957rs6498169
1 kb
chr16:11249000
CLEC16A
AG09309
CD56
HGF
hTH2
NB4
PANC1
SKNSH
DN
ase
I cle
avag
e d
ensi
ty
DSNPs in fetal-origin DHSs(n=1,696)
SNPs in fetal-specific DHSs
(n=887)
SNPs in DHSs foundonly in adult tissues
(n=348)
11.9%
57.8%30.3%
Per
cen
tag
e o
f G
WA
S
S
NP
s in
DH
Ss
53.2%
59.3%
69.8%
45%
55%
65%
UnreplicatedSNPs
Internallyreplicated
Externallyreplicated E
−20
−10
0
10
20
* * * **
* * * * *
Age a
t men
arch
e
Coron
ary h
eart
disea
se BMI
Blood
pres
sure
Bipolar
diso
rder
Creat
inine
Fasti
ng p
lasm
a glu
cose
Ulcera
tive
coliti
s
Height
Trigl
ycer
ides
Prosta
te ca
ncer
FEV1/FVC
Type
1 d
iabet
es
Type
2 d
iabet
es
Mult
iple
scler
osis
Primar
y bilia
ry ci
rrhos
is
Rheum
atoid
arth
ritis
HDL ch
oleste
rol
Crohn
's dis
ease
Wais
t−hip
ratio
LDL
chole
stero
l
C−rea
ctive
pro
tein
Schizo
phre
nia
Celiac
dise
ase
Parkin
son's
dise
ase
QRS dur
ation
Bone
mine
ral d
ensit
y
Breas
t can
cer
Alzheim
er's
disea
se
Lupu
s
Asthm
a
DH
Ss
of
rep
licat
ed G
Rel
ativ
e en
rich
men
t in
fet
al-o
rig
inW
AS
SN
Ps
* P < 0.05 (binomial)baseline = 88.1% GWAS SNPs in fetal−origin DHSs
Fig. 1. Disease-associated variation is concentrated in DNase I hypersensitivesites. (A) Proportions of noncoding GWAS SNPs localizing within DHSs (green);in complete linkage disequilibrium (LD) (r2 = 1) with a SNP in a DHS (blue); orneither (yellow). Note that 76.5% of GWAS SNPs are either within or in perfectLD with DHSs. (B) Proportions of GWAS SNPs overlapping DHSs after partition-
ing by degree of replication. (C) Representative DNase I hypersensitivity (tagdensity) patterns at diverse disease-associated variants. (D) Proportion of GWASSNPs localizing in DHSs active in fetal tissues that persist in adult cells (salmon);fetal stage-specific DHSs (red); and adult stage DHSs (green). (E) GWAS SNPs inDHSs show phenotype-specific enrichment for fetal regulatory elements.
www.sciencemag.org SCIENCE VOL 337 7 SEPTEMBER 2012 1191
RESEARCH ARTICLE
on
Feb
ruar
y 7,
201
3w
ww
.sci
ence
mag
.org
Dow
nloa
ded
from
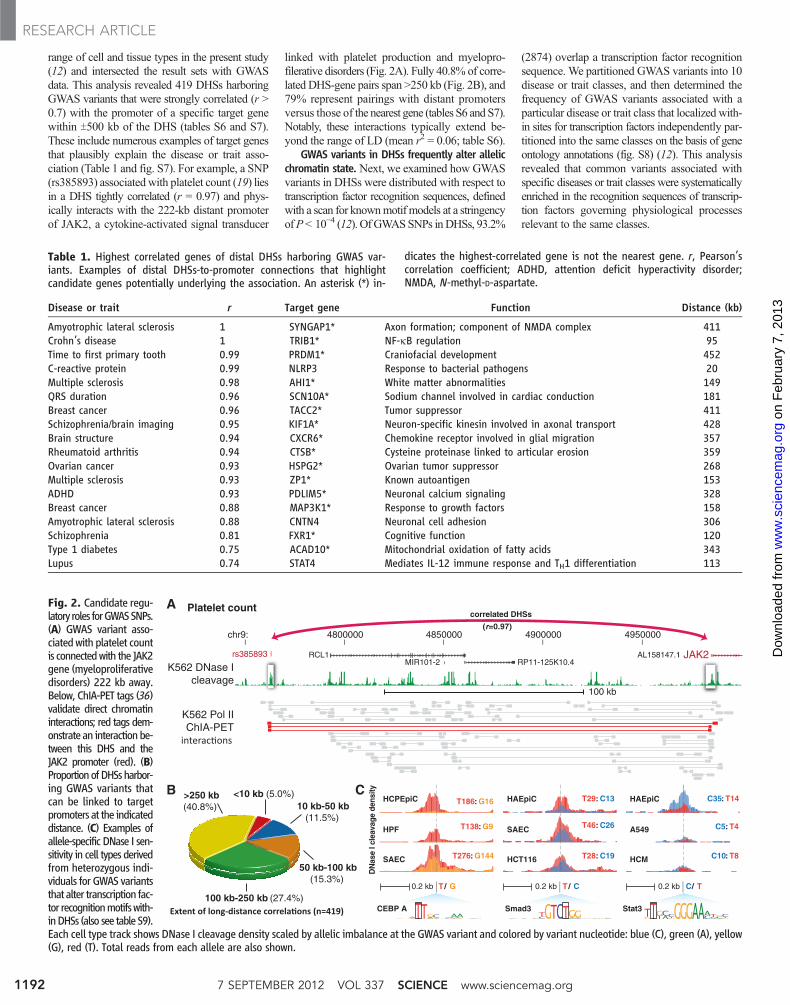
range of cell and tissue types in the present study(12) and intersected the result sets with GWASdata. This analysis revealed 419 DHSs harboringGWAS variants that were strongly correlated (r >0.7) with the promoter of a specific target genewithin T500 kb of the DHS (tables S6 and S7).These include numerous examples of target genesthat plausibly explain the disease or trait asso-ciation (Table 1 and fig. S7). For example, a SNP(rs385893) associated with platelet count (19) liesin a DHS tightly correlated (r = 0.97) and phys-ically interacts with the 222-kb distant promoterof JAK2, a cytokine-activated signal transducer
linked with platelet production and myelopro-filerative disorders (Fig. 2A). Fully 40.8% of corre-lated DHS-gene pairs span >250 kb (Fig. 2B), and79% represent pairings with distant promotersversus those of the nearest gene (tables S6 and S7).Notably, these interactions typically extend be-yond the range of LD (mean r2 = 0.06; table S6).
GWAS variants in DHSs frequently alter allelicchromatin state. Next, we examined how GWASvariants in DHSs were distributed with respect totranscription factor recognition sequences, definedwith a scan for knownmotif models at a stringencyofP< 10−4 (12). OfGWASSNPs inDHSs, 93.2%
(2874) overlap a transcription factor recognitionsequence. We partitioned GWAS variants into 10disease or trait classes, and then determined thefrequency of GWAS variants associated with aparticular disease or trait class that localized with-in sites for transcription factors independently par-titioned into the same classes on the basis of geneontology annotations (fig. S8) (12). This analysisrevealed that common variants associated withspecific diseases or trait classes were systematicallyenriched in the recognition sequences of transcrip-tion factors governing physiological processesrelevant to the same classes.
Fig. 2. Candidate regu-latory roles forGWASSNPs.(A) GWAS variant asso-ciated with platelet countis connectedwith the JAK2gene (myeloproliferativedisorders) 222 kb away.Below, ChIA-PET tags (36)validate direct chromatininteractions; red tags dem-onstrate an interactionbe-tween this DHS and theJAK2 promoter (red). (B)ProportionofDHSsharbor-ing GWAS variants thatcan be linked to targetpromoters at the indicateddistance. (C) Examples ofallele-specific DNase I sen-sitivity in cell types derivedfrom heterozygous indi-viduals for GWAS variantsthat alter transcription fac-tor recognitionmotifswith-inDHSs (also see table S9).Each cell type track shows DNase I cleavage density scaled by allelic imbalance at the GWAS variant and colored by variant nucleotide: blue (C), green (A), yellow(G), red (T). Total reads from each allele are also shown.
A
B
chr9:
100 kb
4800000 4850000 4900000 4950000
RCL1MIR101-2 RP11-125K10.4
AL158147.1 JAK2K562 DNase I
cleavage
rs385893
K562 Pol IIChIA-PET
correlated DHSs
(r=0.97)
Platelet count
<10 kb (5.0%)10 kb-50 kb
(11.5%)
50 kb-100 kb(15.3%)
100 kb-250 kb (27.4%)
>250 kb(40.8%)
C
T / C
T186 : G16
T138 : G9
T276 : G144
T / G0.2 kb
HCPEpiC
HPF
SAEC
0.2 kb
HAEpiC
A549
HCM
C / T0.2 kb
C35 : T14
C5 : T4
C10 : T8
T29: C13
T46: C26
T28: C19
HAEpiC
SAEC
HCT116
Smad3 Stat3CEBP A
DN
ase
I cle
avag
e de
nsity
Table 1. Highest correlated genes of distal DHSs harboring GWAS var-iants. Examples of distal DHSs-to-promoter connections that highlightcandidate genes potentially underlying the association. An asterisk (*) in-
dicates the highest-correlated gene is not the nearest gene. r, Pearson’scorrelation coefficient; ADHD, attention deficit hyperactivity disorder;NMDA, N-methyl-D-aspartate.
Disease or trait r Target gene Function Distance (kb)
Amyotrophic lateral sclerosis 1 SYNGAP1* Axon formation; component of NMDA complex 411Crohn’s disease 1 TRIB1* NF-kB regulation 95Time to first primary tooth 0.99 PRDM1* Craniofacial development 452C-reactive protein 0.99 NLRP3 Response to bacterial pathogens 20Multiple sclerosis 0.98 AHI1* White matter abnormalities 149QRS duration 0.96 SCN10A* Sodium channel involved in cardiac conduction 181Breast cancer 0.96 TACC2* Tumor suppressor 411Schizophrenia/brain imaging 0.95 KIF1A* Neuron-specific kinesin involved in axonal transport 428Brain structure 0.94 CXCR6* Chemokine receptor involved in glial migration 357Rheumatoid arthritis 0.94 CTSB* Cysteine proteinase linked to articular erosion 359Ovarian cancer 0.93 HSPG2* Ovarian tumor suppressor 268Multiple sclerosis 0.93 ZP1* Known autoantigen 153ADHD 0.93 PDLIM5* Neuronal calcium signaling 328Breast cancer 0.88 MAP3K1* Response to growth factors 158Amyotrophic lateral sclerosis 0.88 CNTN4 Neuronal cell adhesion 306Schizophrenia 0.81 FXR1* Cognitive function 120Type 1 diabetes 0.75 ACAD10* Mitochondrial oxidation of fatty acids 343Lupus 0.74 STAT4 Mediates IL-12 immune response and TH1 differentiation 113
7 SEPTEMBER 2012 VOL 337 SCIENCE www.sciencemag.org1192
RESEARCH ARTICLE
on
Feb
ruar
y 7,
201
3w
ww
.sci
ence
mag
.org
Dow
nloa
ded
from
Functional variants that alter transcription fac-tor recognition sequences frequently affect localchromatin structure. At heterozygous SNPs alter-
ing transcription factor recognition sequences,altered nuclease accessibility of the chromatintemplate manifests as an imbalance in the frac-
tion of reads obtained from each allele (20, 21).As the concentration of sequence reads and high-ly overlapping read coverage results in an effec-tive resequencing of DHSs, we could both detectcell types heterozygous for common SNPs andquantify the relative proportions of reads fromeach allele across all cell types (12). This im-balance is indicative of the functional effect ofa particular allele on local chromatin state. Wedetected 584 heterozygous GWAS SNPs withsufficient sequencing coverage, of which 120showed significant allelic imbalance in chroma-tin state [at a false discovery rate (FDR) of 5%].We identified sites where regulatory variants wereassociated with allelic chromatin states, with thepredicted higher-affinity allele exhibiting higheraccessibility (Fig. 2C). In nearly 50% of cases,the magnitude of imbalance was >2:1 (fig. S9).The GWAS SNPs were the sole local sequencedifference between haplotypes, indicating thatdisease-associated variants are responsible formodulating local chromatin accessibility. Fur-ther, at sites with very high sequencing depth(>200×), 38.7% (53/137) show significant allelicimbalance (FDR < 5%). As sensitivity to detectallelic imbalance is governed by sequencing depth,this suggests that nearly 40% of GWAS variantsin similarly sequenced DHSs would be expectedto show allelic imbalance.
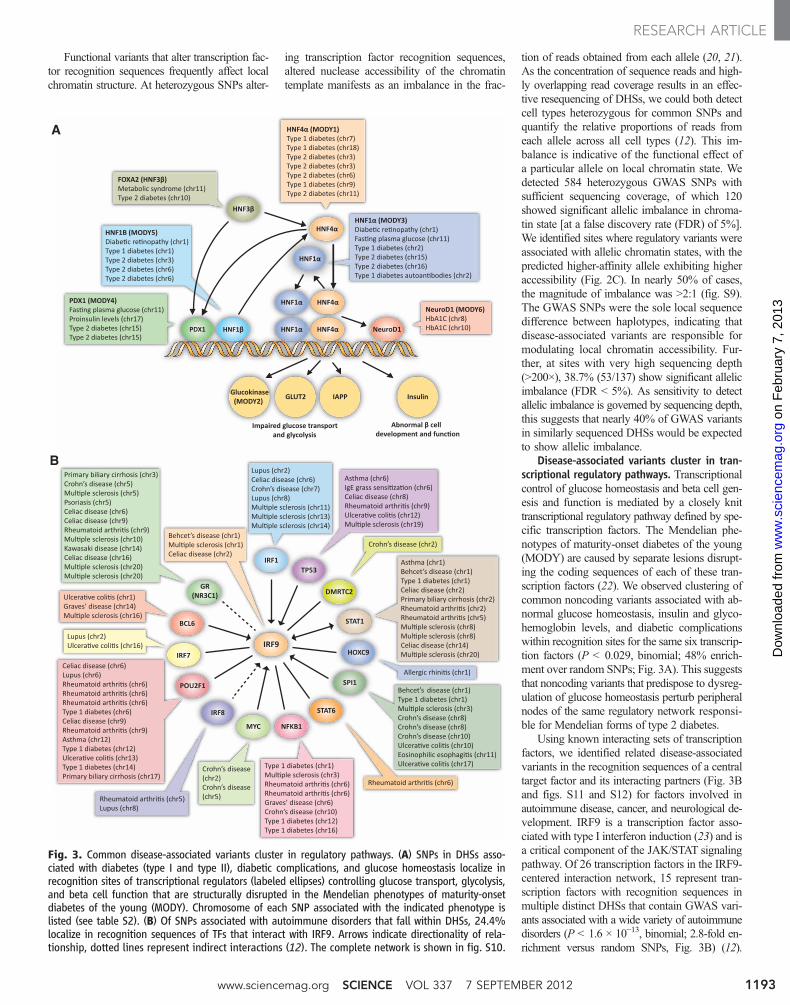
Disease-associated variants cluster in tran-scriptional regulatory pathways. Transcriptionalcontrol of glucose homeostasis and beta cell gen-esis and function is mediated by a closely knittranscriptional regulatory pathway defined by spe-cific transcription factors. The Mendelian phe-notypes of maturity-onset diabetes of the young(MODY) are caused by separate lesions disrupt-ing the coding sequences of each of these tran-scription factors (22). We observed clustering ofcommon noncoding variants associated with ab-normal glucose homeostasis, insulin and glyco-hemoglobin levels, and diabetic complicationswithin recognition sites for the same six transcrip-tion factors (P < 0.029, binomial; 48% enrich-ment over random SNPs; Fig. 3A). This suggeststhat noncoding variants that predispose to dysreg-ulation of glucose homeostasis perturb peripheralnodes of the same regulatory network responsi-ble for Mendelian forms of type 2 diabetes.
Using known interacting sets of transcriptionfactors, we identified related disease-associatedvariants in the recognition sequences of a centraltarget factor and its interacting partners (Fig. 3Band figs. S11 and S12) for factors involved inautoimmune disease, cancer, and neurological de-velopment. IRF9 is a transcription factor asso-ciated with type I interferon induction (23) and isa critical component of the JAK/STAT signalingpathway. Of 26 transcription factors in the IRF9-centered interaction network, 15 represent tran-scription factors with recognition sequences inmultiple distinct DHSs that contain GWAS vari-ants associated with a wide variety of autoimmunedisorders (P < 1.6 × 10⁻¹³, binomial; 2.8-fold en-richment versus random SNPs, Fig. 3B) (12).
A
B
Fig. 3. Common disease-associated variants cluster in regulatory pathways. (A) SNPs in DHSs asso-ciated with diabetes (type I and type II), diabetic complications, and glucose homeostasis localize inrecognition sites of transcriptional regulators (labeled ellipses) controlling glucose transport, glycolysis,and beta cell function that are structurally disrupted in the Mendelian phenotypes of maturity-onsetdiabetes of the young (MODY). Chromosome of each SNP associated with the indicated phenotype islisted (see table S2). (B) Of SNPs associated with autoimmune disorders that fall within DHSs, 24.4%localize in recognition sequences of TFs that interact with IRF9. Arrows indicate directionality of rela-tionship, dotted lines represent indirect interactions (12). The complete network is shown in fig. S10.
www.sciencemag.org SCIENCE VOL 337 7 SEPTEMBER 2012 1193
RESEARCH ARTICLE
on
Feb
ruar
y 7,
201
3w
ww
.sci
ence
mag
.org
Dow
nloa
ded
from
Notably, 24.4% (64/262) of GWAS SNPs withinDHSs of immune cells and associated with auto-immune disease alter one or more of the 15 tran-scription factor motifs from the IRF9-centerednetwork, suggesting that JAK/STAT-mediated typeI interferon responses may have important roles inmediating diverse common inflammatory disorders.This example and those in figs. S11 and S12 illus-trate that disease-associated variants from the sameor related disorders and traits repeatedly localize
within the recognition sequences of transcriptionfactors that form interacting regulatory networks.
Common networks for common diseases.The observation that GWAS variants associatedwith multiple distinct diseases within the samebroader disease class (e.g., inflammation, can-cer) repeatedly localize within the recognitionsites of interacting transcription factors sug-gested that cohorts of such transcription factorsmight form shared regulatory architectures. To
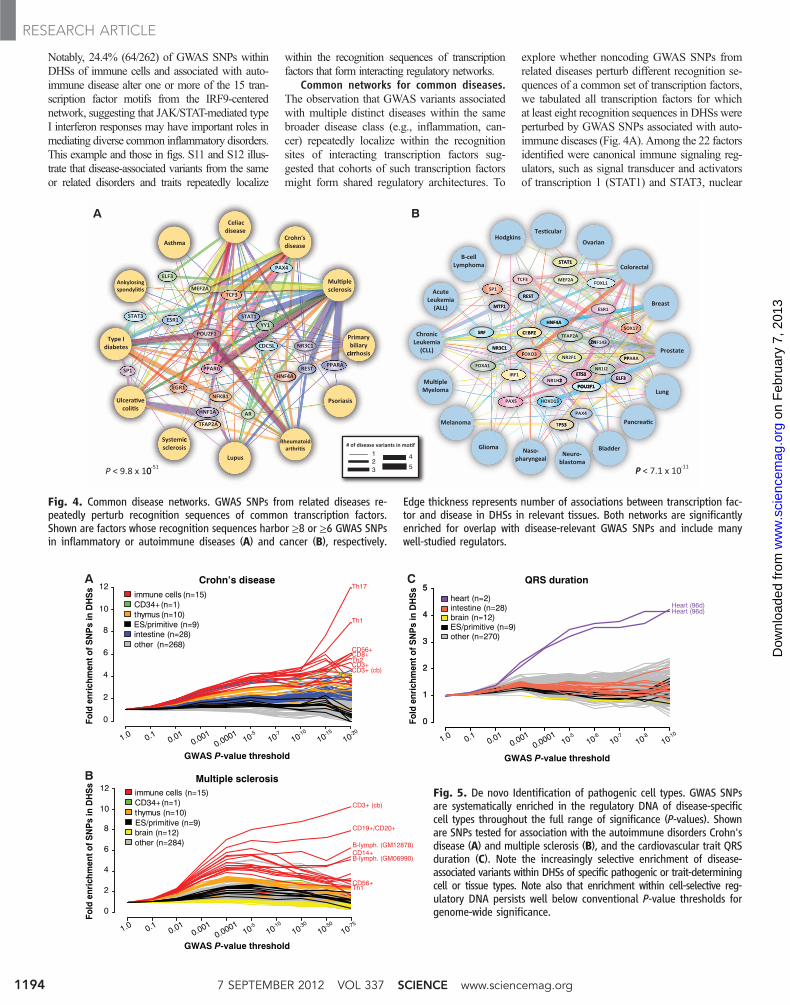
explore whether noncoding GWAS SNPs fromrelated diseases perturb different recognition se-quences of a common set of transcription factors,we tabulated all transcription factors for whichat least eight recognition sequences in DHSs wereperturbed by GWAS SNPs associated with auto-immune diseases (Fig. 4A). Among the 22 factorsidentified were canonical immune signaling reg-ulators, such as signal transducer and activatorsof transcription 1 (STAT1) and STAT3, nuclear
B
A C
0
2
4
6
8
10
12
Fold
enr
ichm
ent o
f SN
Ps
in D
HS
sFo
ld e
nric
hmen
t of S
NP
s in
DH
Ss
Fold
enr
ichm
ent o
f SN
Ps
in D
HS
s
1.0 0.1 0.010.001
0.0001
CD19+/CD20+
CD3+ (cb)
CD3+ (cb)
B-lymph. (GM12878)CD14+B-lymph. (GM06990)
immune cells (n=15)CD34+ (n=1)thymus (n=10)
brain (n=12)other (n=284)
0
2
4
6
8
10
12
GWAS P-value threshold
GWAS P-value threshold
GWAS P-value threshold
1.0 0.1 0.010.001
0.000110-5
10-710-10
10-15
10-20
10-510-6
10-710-8
10-10
10-510-10
10-30
10-50
10-75
Th17
Th1
Th1CD56+
Th2
CD56+CD8+
CD3+
immune cells (n=15)CD34+ (n=1)thymus (n=10)ES/primitive (n=9)
ES/primitive (n=9)
ES/primitive (n=9)
heart (n=2)intestine (n=28)brain (n=12)
intestine (n=28)other
other (n=270) (n=268)
Crohn�s disease QRS duration
Multiple sclerosis
00
11
22
33
44
55
Heart (96d)Heart (96d)
1.0 0.1 0.010.001
0.0001
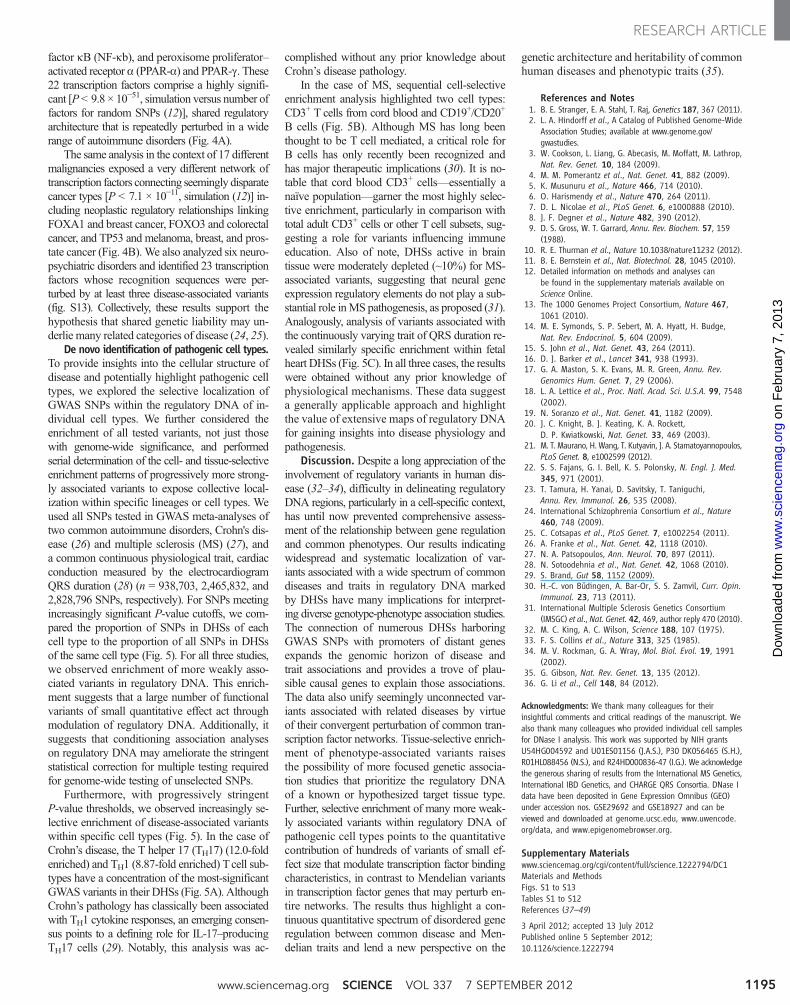
Fig. 5. De novo Identification of pathogenic cell types. GWAS SNPsare systematically enriched in the regulatory DNA of disease-specificcell types throughout the full range of significance (P-values). Shownare SNPs tested for association with the autoimmune disorders Crohn'sdisease (A) and multiple sclerosis (B), and the cardiovascular trait QRSduration (C). Note the increasingly selective enrichment of disease-associated variants within DHSs of specific pathogenic or trait-determiningcell or tissue types. Note also that enrichment within cell-selective reg-ulatory DNA persists well below conventional P-value thresholds forgenome-wide significance.
A B
123
4
5
Fig. 4. Common disease networks. GWAS SNPs from related diseases re-peatedly perturb recognition sequences of common transcription factors.Shown are factors whose recognition sequences harbor ≥8 or ≥6 GWAS SNPsin inflammatory or autoimmune diseases (A) and cancer (B), respectively.
Edge thickness represents number of associations between transcription fac-tor and disease in DHSs in relevant tissues. Both networks are significantlyenriched for overlap with disease-relevant GWAS SNPs and include manywell-studied regulators.
7 SEPTEMBER 2012 VOL 337 SCIENCE www.sciencemag.org1194
RESEARCH ARTICLE
on
Feb
ruar
y 7,
201
3w
ww
.sci
ence
mag
.org
Dow
nloa
ded
from
factor kB (NF-kb), and peroxisome proliferator–activated receptor a (PPAR-a) and PPAR-g. These22 transcription factors comprise a highly signifi-cant [P< 9.8 × 10−51, simulation versus number offactors for random SNPs (12)], shared regulatoryarchitecture that is repeatedly perturbed in a widerange of autoimmune disorders (Fig. 4A).
The same analysis in the context of 17 differentmalignancies exposed a very different network oftranscription factors connecting seemingly disparatecancer types [P < 7.1 × 10⁻¹¹, simulation (12)] in-cluding neoplastic regulatory relationships linkingFOXA1 and breast cancer, FOXO3 and colorectalcancer, and TP53 and melanoma, breast, and pros-tate cancer (Fig. 4B). We also analyzed six neuro-psychiatric disorders and identified 23 transcriptionfactors whose recognition sequences were per-turbed by at least three disease-associated variants(fig. S13). Collectively, these results support thehypothesis that shared genetic liability may un-derlie many related categories of disease (24, 25).
De novo identification of pathogenic cell types.To provide insights into the cellular structure ofdisease and potentially highlight pathogenic celltypes, we explored the selective localization ofGWAS SNPs within the regulatory DNA of in-dividual cell types. We further considered theenrichment of all tested variants, not just thosewith genome-wide significance, and performedserial determination of the cell- and tissue-selectiveenrichment patterns of progressively more strong-ly associated variants to expose collective local-ization within specific lineages or cell types. Weused all SNPs tested in GWAS meta-analyses oftwo common autoimmune disorders, Crohn's dis-ease (26) and multiple sclerosis (MS) (27), anda common continuous physiological trait, cardiacconduction measured by the electrocardiogramQRS duration (28) (n = 938,703, 2,465,832, and2,828,796 SNPs, respectively). For SNPs meetingincreasingly significant P-value cutoffs, we com-pared the proportion of SNPs in DHSs of eachcell type to the proportion of all SNPs in DHSsof the same cell type (Fig. 5). For all three studies,we observed enrichment of more weakly asso-ciated variants in regulatory DNA. This enrich-ment suggests that a large number of functionalvariants of small quantitative effect act throughmodulation of regulatory DNA. Additionally, itsuggests that conditioning association analyseson regulatory DNA may ameliorate the stringentstatistical correction for multiple testing requiredfor genome-wide testing of unselected SNPs.
Furthermore, with progressively stringentP-value thresholds, we observed increasingly se-lective enrichment of disease-associated variantswithin specific cell types (Fig. 5). In the case ofCrohn’s disease, the T helper 17 (TH17) (12.0-foldenriched) and TH1 (8.87-fold enriched) Tcell sub-types have a concentration of the most-significantGWAS variants in their DHSs (Fig. 5A). AlthoughCrohn’s pathology has classically been associatedwith TH1 cytokine responses, an emerging consen-sus points to a defining role for IL-17–producingTH17 cells (29). Notably, this analysis was ac-
complished without any prior knowledge aboutCrohn’s disease pathology.
In the case of MS, sequential cell-selectiveenrichment analysis highlighted two cell types:CD3+ T cells from cord blood and CD19+/CD20+
B cells (Fig. 5B). Although MS has long beenthought to be T cell mediated, a critical role forB cells has only recently been recognized andhas major therapeutic implications (30). It is no-table that cord blood CD3+ cells—essentially anaïve population—garner the most highly selec-tive enrichment, particularly in comparison withtotal adult CD3+ cells or other T cell subsets, sug-gesting a role for variants influencing immuneeducation. Also of note, DHSs active in braintissue were moderately depleted (~10%) for MS-associated variants, suggesting that neural geneexpression regulatory elements do not play a sub-stantial role inMS pathogenesis, as proposed (31).Analogously, analysis of variants associated withthe continuously varying trait of QRS duration re-vealed similarly specific enrichment within fetalheart DHSs (Fig. 5C). In all three cases, the resultswere obtained without any prior knowledge ofphysiological mechanisms. These data suggesta generally applicable approach and highlightthe value of extensive maps of regulatory DNAfor gaining insights into disease physiology andpathogenesis.
Discussion. Despite a long appreciation of theinvolvement of regulatory variants in human dis-ease (32–34), difficulty in delineating regulatoryDNA regions, particularly in a cell-specific context,has until now prevented comprehensive assess-ment of the relationship between gene regulationand common phenotypes. Our results indicatingwidespread and systematic localization of var-iants associated with a wide spectrum of commondiseases and traits in regulatory DNA markedby DHSs have many implications for interpret-ing diverse genotype-phenotype association studies.The connection of numerous DHSs harboringGWAS SNPs with promoters of distant genesexpands the genomic horizon of disease andtrait associations and provides a trove of plau-sible causal genes to explain those associations.The data also unify seemingly unconnected var-iants associated with related diseases by virtueof their convergent perturbation of common tran-scription factor networks. Tissue-selective enrich-ment of phenotype-associated variants raisesthe possibility of more focused genetic associa-tion studies that prioritize the regulatory DNAof a known or hypothesized target tissue type.Further, selective enrichment of many more weak-ly associated variants within regulatory DNA ofpathogenic cell types points to the quantitativecontribution of hundreds of variants of small ef-fect size that modulate transcription factor bindingcharacteristics, in contrast to Mendelian variantsin transcription factor genes that may perturb en-tire networks. The results thus highlight a con-tinuous quantitative spectrum of disordered generegulation between common disease and Men-delian traits and lend a new perspective on the
genetic architecture and heritability of commonhuman diseases and phenotypic traits (35).
References and Notes1. B. E. Stranger, E. A. Stahl, T. Raj, Genetics 187, 367 (2011).2. L. A. Hindorff et al., A Catalog of Published Genome-Wide
Association Studies; available at www.genome.gov/gwastudies.
3. W. Cookson, L. Liang, G. Abecasis, M. Moffatt, M. Lathrop,Nat. Rev. Genet. 10, 184 (2009).
4. M. M. Pomerantz et al., Nat. Genet. 41, 882 (2009).5. K. Musunuru et al., Nature 466, 714 (2010).6. O. Harismendy et al., Nature 470, 264 (2011).7. D. L. Nicolae et al., PLoS Genet. 6, e1000888 (2010).8. J. F. Degner et al., Nature 482, 390 (2012).9. D. S. Gross, W. T. Garrard, Annu. Rev. Biochem. 57, 159
(1988).10. R. E. Thurman et al., Nature 10.1038/nature11232 (2012).11. B. E. Bernstein et al., Nat. Biotechnol. 28, 1045 (2010).12. Detailed information on methods and analyses can
be found in the supplementary materials available onScience Online.
13. The 1000 Genomes Project Consortium, Nature 467,1061 (2010).
14. M. E. Symonds, S. P. Sebert, M. A. Hyatt, H. Budge,Nat. Rev. Endocrinol. 5, 604 (2009).
15. S. John et al., Nat. Genet. 43, 264 (2011).16. D. J. Barker et al., Lancet 341, 938 (1993).17. G. A. Maston, S. K. Evans, M. R. Green, Annu. Rev.
Genomics Hum. Genet. 7, 29 (2006).18. L. A. Lettice et al., Proc. Natl. Acad. Sci. U.S.A. 99, 7548
(2002).19. N. Soranzo et al., Nat. Genet. 41, 1182 (2009).20. J. C. Knight, B. J. Keating, K. A. Rockett,
D. P. Kwiatkowski, Nat. Genet. 33, 469 (2003).21. M. T. Maurano, H. Wang, T. Kutyavin, J. A. Stamatoyannopoulos,
PLoS Genet. 8, e1002599 (2012).22. S. S. Fajans, G. I. Bell, K. S. Polonsky, N. Engl. J. Med.
345, 971 (2001).23. T. Tamura, H. Yanai, D. Savitsky, T. Taniguchi,
Annu. Rev. Immunol. 26, 535 (2008).24. International Schizophrenia Consortium et al., Nature
460, 748 (2009).25. C. Cotsapas et al., PLoS Genet. 7, e1002254 (2011).26. A. Franke et al., Nat. Genet. 42, 1118 (2010).27. N. A. Patsopoulos, Ann. Neurol. 70, 897 (2011).28. N. Sotoodehnia et al., Nat. Genet. 42, 1068 (2010).29. S. Brand, Gut 58, 1152 (2009).30. H.-C. von Büdingen, A. Bar-Or, S. S. Zamvil, Curr. Opin.
Immunol. 23, 713 (2011).31. International Multiple Sclerosis Genetics Consortium
(IMSGC) et al.,Nat. Genet. 42, 469, author reply 470 (2010).32. M. C. King, A. C. Wilson, Science 188, 107 (1975).33. F. S. Collins et al., Nature 313, 325 (1985).34. M. V. Rockman, G. A. Wray, Mol. Biol. Evol. 19, 1991
(2002).35. G. Gibson, Nat. Rev. Genet. 13, 135 (2012).36. G. Li et al., Cell 148, 84 (2012).
Acknowledgments: We thank many colleagues for theirinsightful comments and critical readings of the manuscript. Wealso thank many colleagues who provided individual cell samplesfor DNase I analysis. This work was supported by NIH grantsU54HG004592 and U01ES01156 (J.A.S.), P30 DK056465 (S.H.),R01HL088456 (N.S.), and R24HD000836-47 (I.G.). We acknowledgethe generous sharing of results from the International MS Genetics,International IBD Genetics, and CHARGE QRS Consortia. DNase Idata have been deposited in Gene Expression Omnibus (GEO)under accession nos. GSE29692 and GSE18927 and can beviewed and downloaded at genome.ucsc.edu, www.uwencode.org/data, and www.epigenomebrowser.org.
Supplementary Materialswww.sciencemag.org/cgi/content/full/science.1222794/DC1Materials and MethodsFigs. S1 to S13Tables S1 to S12References (37–49)
3 April 2012; accepted 13 July 2012Published online 5 September 2012;10.1126/science.1222794
www.sciencemag.org SCIENCE VOL 337 7 SEPTEMBER 2012 1195
RESEARCH ARTICLE
on
Feb
ruar
y 7,
201
3w
ww
.sci
ence
mag
.org
Dow
nloa
ded
from