Systematic genetic and genomic analysis of cytochrome P450 enzyme activities in human liver
17
Research Systematic genetic and genomic analysis of cytochrome P450 enzyme activities in human liver Xia Yang, 1,9,10,13 Bin Zhang, 1,9,10 Cliona Molony, 1 Eugene Chudin, 1 Ke Hao, 1 Jun Zhu, 1,10 Andrea Gaedigk, 2 Christine Suver, 1,10 Hua Zhong, 1,10 J. Steven Leeder, 2 F. Peter Guengerich, 3 Stephen C. Strom, 4 Erin Schuetz, 5 Thomas H. Rushmore, 6 Roger G. Ulrich, 7 J. Greg Slatter, 8 Eric E. Schadt, 1,11 Andrew Kasarskis, 1,10,13 and Pek Yee Lum 1,12,13 1 Rosetta Inpharmatics, LLC, a wholly owned subsidiary of Merck & Co., Inc., Seattle, Washington 98109, USA; 2 Clinial Pharmacology and Medical Toxicology, Children’s Mercy Hospitals and Clinics, Kansas City, Missouri 64108, USA; 3 Department of Biochemistry and Center in Molecular Toxicology, Vanderbilt University School of Medicine, Nashville, Tennessee 37232, USA; 4 Department of Pathology, University of Pittsburgh, Pittsburgh, Pennsylvania 15219, USA; 5 Department of Pharmaceutical Sciences, Saint Jude Children’s Research Hospital, Memphis, Tennessee 38105, USA; 6 Drug Metabolism, Merck & Co., Inc., West Point, Pennsylvania 19486, USA; 7 Calistoga Pharmaceuticals, Inc., Seattle, Washington 98121, USA; 8 Pharmacokinetics and Drug Metabolism, Amgen, Inc., Seattle, Washington 98119, USA Liver cytochrome P450s (P450s) play critical roles in drug metabolism, toxicology, and metabolic processes. Despite rapid progress in the understanding of these enzymes, a systematic investigation of the full spectrum of functionality of in- dividual P450s, the interrelationship or networks connecting them, and the genetic control of each gene/enzyme is lacking. To this end, we genotyped, expression-profiled, and measured P450 activities of 466 human liver samples and applied a systems biology approach via the integration of genetics, gene expression, and enzyme activity measurements. We found that most P450s were positively correlated among themselves and were highly correlated with known regu- lators as well as thousands of other genes enriched for pathways relevant to the metabolism of drugs, fatty acids, amino acids, and steroids. Genome-wide association analyses between genetic polymorphisms and P450 expression or enzyme activities revealed sets of SNPs associated with P450 traits, and suggested the existence of both cis-regulation of P450 expression (especially for CYP2D6) and more complex trans-regulation of P450 activity. Several novel SNPs associated with CYP2D6 expression and enzyme activity were validated in an independent human cohort. By constructing a weighted coexpression network and a Bayesian regulatory network, we defined the human liver transcriptional network structure, uncovered subnetworks representative of the P450 regulatory system, and identified novel candidate regulatory genes, namely, EHHADH, SLC10A1, and AKR1D1. The P450 subnetworks were then validated using gene signatures responsive to ligands of known P450 regulators in mouse and rat. This systematic survey provides a comprehensive view of the func- tionality, genetic control, and interactions of P450s. [Supplemental material is available online at http://www.genome.org. Genotype data for 228 individuals who satisfy privacy policy have beensubmitted to the NCBI dbGaP (http://www.ncbi.nlm.nih.gov/gap/) under accession no. phs000253.v1.p1.] Cytochrome P450s (P450s) form a superfamily of monooxygenases critical for anabolic and catabolic metabolism in all organisms char- acterized so far (Nelson et al. 1996; Aguiar et al. 2005; Plant 2007). Specifically, P450 enzymes are involved in the metabolism of various endogenous and exogenous chemicals, including steroids, bile acids, fatty acids, eicosanoids, xenobiotics, environmental pollutants, and carcinogens (Ortiz De Montellano 2005). Mutations in P450 genes or deficiency in the enzymes result in a wide spectrum of human diseases such as glaucoma (CYP1B1) (Chavarria-Soley et al. 2008; Vasiliou and Gonzalez 2008), elevated cholesterol (CYP7A1) (Pullinger et al. 2002), congenital adrenal hyperplasia (CYP11B1) (Krone et al. 2006; Peters et al. 2007), and congenital hypoaldoste- ronism (CYP11B2) (Kuribayashi et al. 2003). In addition, modulation of P450s by environmental factors, for example, cigarette smoking and dietary flavonoids, can modify cancer susceptibility because some P450s are involved in carcinogen bioactivation by metabolism (Adonis et al. 2005; Moon et al. 2006; Huber et al. 2008). The diverse endogenous function and the essential role of P450s in drug me- tabolism and toxicology further underline the importance of these enzymes in human health (Ortiz De Montellano 2005). In humans, there exist 18 P450 families, 44 subfamilies, and 57 putative functional enzymes (Nelson et al. 1996). Functionality, 9 These authors contributed equally to this work. Present addresses: 10 Sage Bionetworks, Seattle, WA 98109, USA; 11 Pacific Biosciences, Menlo Park, CA 94025, USA; 12 iPierian, Inc., South San Francisco, CA 94080, USA. 13 Corresponding authors. E-mail [email protected]. E-mail [email protected]. E-mail [email protected]. Article published online before print. Article and publication date are at http://www.genome.org/cgi/doi/10.1101/gr.103341.109. Freely available online through the Genome Research Open Access option. 1020 Genome Research www.genome.org 20:1020–1036 Ó 2010 by Cold Spring Harbor Laboratory Press; ISSN 1088-9051/10; www.genome.org
Transcript of Systematic genetic and genomic analysis of cytochrome P450 enzyme activities in human liver
Research
Systematic genetic and genomic analysisof cytochrome P450 enzyme activitiesin human liverXia Yang,1,9,10,13 Bin Zhang,1,9,10 Cliona Molony,1 Eugene Chudin,1 Ke Hao,1
Jun Zhu,1,10 Andrea Gaedigk,2 Christine Suver,1,10 Hua Zhong,1,10 J. Steven Leeder,2
F. Peter Guengerich,3 Stephen C. Strom,4 Erin Schuetz,5 Thomas H. Rushmore,6
Roger G. Ulrich,7 J. Greg Slatter,8 Eric E. Schadt,1,11 Andrew Kasarskis,1,10,13
and Pek Yee Lum1,12,13
1Rosetta Inpharmatics, LLC, a wholly owned subsidiary of Merck & Co., Inc., Seattle, Washington 98109, USA; 2Clinial Pharmacology
and Medical Toxicology, Children’s Mercy Hospitals and Clinics, Kansas City, Missouri 64108, USA; 3Department of Biochemistry and
Center in Molecular Toxicology, Vanderbilt University School of Medicine, Nashville, Tennessee 37232, USA; 4Department of
Pathology, University of Pittsburgh, Pittsburgh, Pennsylvania 15219, USA; 5Department of Pharmaceutical Sciences, Saint Jude
Children’s Research Hospital, Memphis, Tennessee 38105, USA; 6Drug Metabolism, Merck & Co., Inc., West Point, Pennsylvania
19486, USA; 7Calistoga Pharmaceuticals, Inc., Seattle, Washington 98121, USA; 8Pharmacokinetics and Drug Metabolism, Amgen,
Inc., Seattle, Washington 98119, USA
Liver cytochrome P450s (P450s) play critical roles in drug metabolism, toxicology, and metabolic processes. Despite rapidprogress in the understanding of these enzymes, a systematic investigation of the full spectrum of functionality of in-dividual P450s, the interrelationship or networks connecting them, and the genetic control of each gene/enzyme islacking. To this end, we genotyped, expression-profiled, and measured P450 activities of 466 human liver samples andapplied a systems biology approach via the integration of genetics, gene expression, and enzyme activity measurements.We found that most P450s were positively correlated among themselves and were highly correlated with known regu-lators as well as thousands of other genes enriched for pathways relevant to the metabolism of drugs, fatty acids, aminoacids, and steroids. Genome-wide association analyses between genetic polymorphisms and P450 expression or enzymeactivities revealed sets of SNPs associated with P450 traits, and suggested the existence of both cis-regulation of P450expression (especially for CYP2D6) and more complex trans-regulation of P450 activity. Several novel SNPs associated withCYP2D6 expression and enzyme activity were validated in an independent human cohort. By constructing a weightedcoexpression network and a Bayesian regulatory network, we defined the human liver transcriptional network structure,uncovered subnetworks representative of the P450 regulatory system, and identified novel candidate regulatory genes,namely, EHHADH, SLC10A1, and AKR1D1. The P450 subnetworks were then validated using gene signatures responsive toligands of known P450 regulators in mouse and rat. This systematic survey provides a comprehensive view of the func-tionality, genetic control, and interactions of P450s.
[Supplemental material is available online at http://www.genome.org. Genotype data for 228 individuals who satisfy privacypolicy have been submitted to the NCBI dbGaP (http://www.ncbi.nlm.nih.gov/gap/) under accession no. phs000253.v1.p1.]
Cytochrome P450s (P450s) form a superfamily of monooxygenases
critical for anabolic and catabolic metabolism in all organisms char-
acterized so far (Nelson et al. 1996; Aguiar et al. 2005; Plant 2007).
Specifically, P450 enzymes are involved in the metabolism of various
endogenous and exogenous chemicals, including steroids, bile acids,
fatty acids, eicosanoids, xenobiotics, environmental pollutants,
and carcinogens (Ortiz De Montellano 2005). Mutations in P450
genes or deficiency in the enzymes result in a wide spectrum of
human diseases such as glaucoma (CYP1B1) (Chavarria-Soley et al.
2008; Vasiliou and Gonzalez 2008), elevated cholesterol (CYP7A1)
(Pullinger et al. 2002), congenital adrenal hyperplasia (CYP11B1)
(Krone et al. 2006; Peters et al. 2007), and congenital hypoaldoste-
ronism (CYP11B2) (Kuribayashi et al. 2003). In addition, modulation
of P450s by environmental factors, for example, cigarette smoking
and dietary flavonoids, can modify cancer susceptibility because
some P450s are involved in carcinogen bioactivation by metabolism
(Adonis et al. 2005; Moon et al. 2006; Huber et al. 2008). The diverse
endogenous function and the essential role of P450s in drug me-
tabolism and toxicology further underline the importance of these
enzymes in human health (Ortiz De Montellano 2005).
In humans, there exist 18 P450 families, 44 subfamilies, and
57 putative functional enzymes (Nelson et al. 1996). Functionality,
9These authors contributed equally to this work.Present addresses: 10Sage Bionetworks, Seattle, WA 98109, USA;11Pacific Biosciences, Menlo Park, CA 94025, USA; 12iPierian, Inc.,South San Francisco, CA 94080, USA.13Corresponding authors.E-mail [email protected] [email protected] [email protected] published online before print. Article and publication date are athttp://www.genome.org/cgi/doi/10.1101/gr.103341.109. Freely availableonline through the Genome Research Open Access option.
1020 Genome Researchwww.genome.org
20:1020–1036 � 2010 by Cold Spring Harbor Laboratory Press; ISSN 1088-9051/10; www.genome.org
substrate specificity, and tissue specificity vary among P450 en-
zymes. For example, members of families CYP1, CYP2, and CYP3
—especially CYP1A2, CYP2C9, CYP2C19, CYP2D6, and CYP3A4
in liver—metabolize about 95% of drugs in clinical use (Hodgson
2001; Williams et al. 2003); the CYP4 family members in liver are
involved in fatty acid and eicosanoid metabolism (Masters and
Marohnic 2006); members of the CYP11, CYP17, CYP19, and CYP21
families are steroidogenic enzymes in adrenal cortex, ovaries, and
testes (Lewis and Lee-Robichaud 1998).
Because of the importance of P450s in human physiology and
drug metabolism, the genetic variations and regulatory mechanisms
of these enzymes have been extensively explored. So far, genetic
polymorphisms have been identified in most P450 genes, and many
of these variations contribute to interindividual differences in gene
expression and/or enzyme activity and, consequently, underlie dis-
ease susceptibility or drug pharmacokinetics (Daly 2004; http://
www.cypalleles.ki.se/index.htm). In fact, genetic polymorphisms,
primarily single nucleotide polymorphisms (SNPs), of CYP1, CYP2,
and CYP3 family members, represent the top candidate genes in
pharmacogenetics, a field that investigates genetic factors that con-
tribute to drug efficacy or side effects. For instance, polymorphisms
in CYP2D6 and CYP2C19 have been linked to the response or ad-
verse effects of various drugs used in the treatment of cancer, psy-
chiatric disorders, and cardiovascular diseases (Anderson et al. 2003;
van Schaik 2005; Vandel et al. 2007; Mega et al. 2009; Simon et al.
2009).
In addition to genetic polymorphisms within P450 genes,
regulatory mechanisms at transcriptional, translational, and post-
translational levels also contribute to the variability in P450 activi-
ties across individuals (Aguiar et al. 2005; Lim and Huang 2008).
Nuclear receptors such as the constitutive androstane receptor
(NR1I3, commonly known as CAR), pregnane X receptor (NR1I2,
commonly known as PXR), peroxisome proliferator activated re-
ceptor alpha (PPARA), retinoid X receptor alpha (RXRA), liver X re-
ceptor alpha (NR1H3, commonly known as LXR), farnesol X
receptor (NR1H4, commonly known as FXR), aryl hydrocarbon
receptor (AHR), and glucocorticoid receptor (NR3C1) function
as key regulators of P450 expression upon binding of foreign
chemical inducers and endogenous hormones, growth factors,
and cytokines (Waxman 1999; Cai et al. 2002; Gerbal-Chaloin
et al. 2002; Plant 2007; Audet-Walsh and Anderson 2008; Gonzalez
2008; Lim and Huang 2008).
Despite the tremendous progress in the studies of P450s in the
past few decades, gaps remain in the understanding of the full
spectrum of functionality of individual P450 genes/enzymes, the
networks connecting them, and the genetic control of each gene/
enzyme. In this study, we focused on the liver since it represents
the primary location of activity for the majority of P450s, and
attempted to address these gaps via integration of genetics, gene
expression, and enzyme activity measurements in a human co-
hort. In addition, we employed a weighted gene coexpression
network approach that has been used extensively in yeast, mouse,
and human to uncover biologically meaningful gene modules and
explore novel P450 functions/pathways and coregulation structure
among P450s (Zhang and Horvath 2005; Gargalovic et al. 2006;
Ghazalpour et al. 2006; Horvath et al. 2006; Lum et al. 2006; Chen
et al. 2008; Emilsson et al. 2008; Schadt et al. 2008; Zhu et al.
2008a,b). Furthermore, networks constructed based on Bayesian
inference were used as an alternative approach to delineate poten-
tial regulatory mechanisms. In doing so, we aimed to gain a more
comprehensive understanding of the functionality, genetic control,
and interactions of P450s.
Results
The human liver cohort and overall data analysis scheme
The liver tissues of 466 Caucasian samples from a previously de-
scribed human liver cohort (HLC) were used in the current study
(Schadt et al. 2008). DNA, RNA, and microsomes were isolated
from liver tissue samples for genotyping, gene expression pro-
filing, and enzyme activity measurements, respectively. There were
213 females and 253 males, and the age ranged from 0–93, with an
average of 50 and a standard deviation of 18.
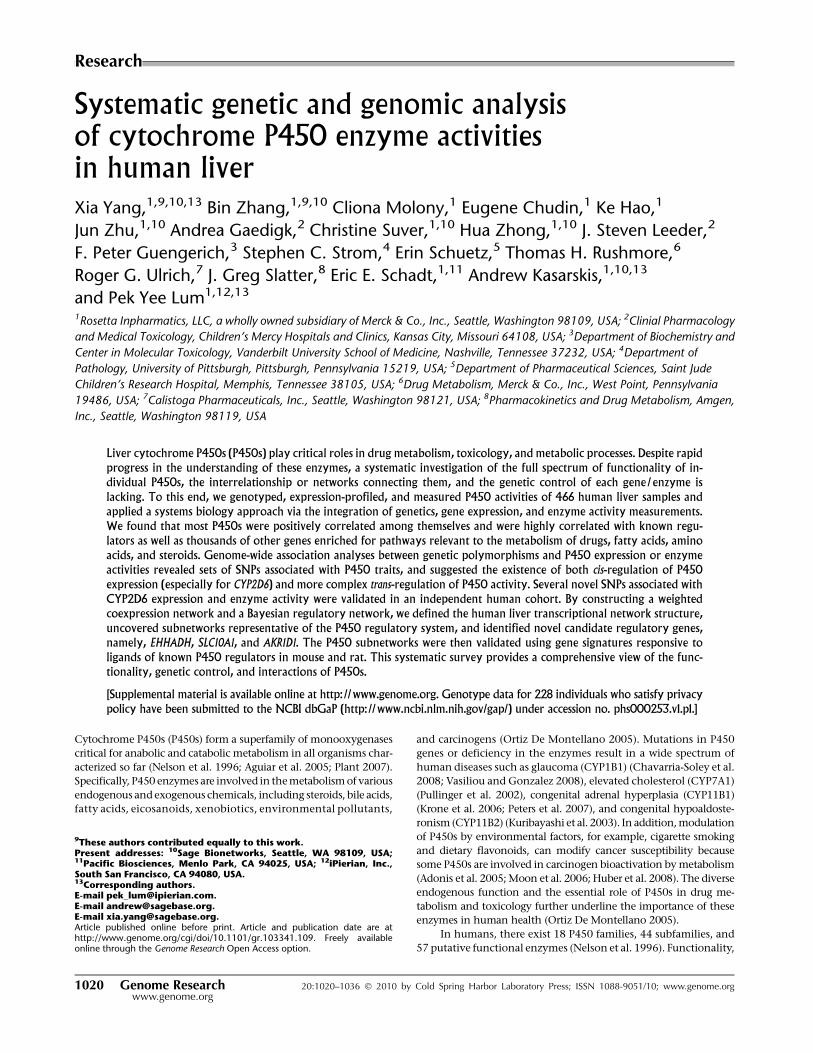
As shown in Figure 1, we used the multilevel information
collected from HLC and conducted (1) activity–activity correlation
analysis between enzymatic activity measurements and (2) gene–
gene correlation analysis between the expression levels to address
the interrelationship between various P450s; (3) gene–activity
correlation analysis between the genome-wide transcripts and ac-
tivity measures to investigate the potential regulatory and func-
tional relationships between genes and P450 enzymes; (4) gene
coexpression network analysis to uncover gene modules relevant
to P450 expression and activity as a means to explore novel P450
functions/pathways and coregulation structure among P450s; (5)
expression SNP (eSNP) analysis to identify genetic variants that
contribute to the interindividual variation in P450 expression; (6)
enzyme activity SNP (aSNP) analysis to identify polymorphisms
that may underlie the interindividual variation in P450 enzyme
activity; (7) usage of eSNPs and aSNPs to infer causal relationships
between the coexpression modules and P450s to identify potential
novel regulators; and (8) Bayesian network (BN) analysis to further
identify potential key regulators of the expression of P450s.
P450 enzyme activity measurements in HLC
The activities of nine P450 enzymes (CYP1A2, CYP2A6, CYP2B6,
CYP2C8, CYP2C9, CYP2C19, CYP2D6, CYP2E1, and CYP3A4) in
isolated microsomes from 398 HLC liver samples were measured
Figure 1. Data sets collected and analysis scheme of the current study.The three data sets (P450 activity traits, gene expression, SNP genotyping)are shown in rectangles. The data analyses conducted are labeled above,below, or between the data sets. These include (1) activity–activity correlationamong enzyme activity measures, (2) gene–gene correlation among geneexpression levels, (3) activity–gene correlation between genes and activitylevels, (4) coexpression network construction based on expression levels, (5)activity–module correlation between activity measurements and coex-pression modules, (6) SNP–gene association (expression SNP or eSNP) be-tween genotype and gene expression, (7) SNP–activity association (activitySNP or aSNP) between genotype and enzyme activity, and (8) Bayesiannetwork construction based on both expression and genotype data.
Genome Research 1021www.genome.org
Genetics and genomics of human liver P450s
using probe substrate metabolism assays expressed as nmol/min/
mg protein. Each enzyme was measured with a single substrate,
with the exception of CYP3A4 activity, which was measured using
two substrates, midazolam and testosterone, with the activity mea-
sures designated as CYP3A4M and CYP3A4T, respectively. The
general statistics of the enzyme activity values are listed in Table S1.
As each trait appeared to strongly deviate from normal distribution
based on the Shapiro-Wilk test of normality (Supplemental Table
S1) and QQ-plots (Supplemental Fig. S1A) with peak shifted toward
lower activity (histograms in Supplemental Fig. S1B), we chose to
use nonparametric methods to analyze these traits.
We assessed the effect of gender and age on P450 activities
using the Wilcoxon rank sum test and Spearman correlation, re-
spectively (Supplemental Table S1). CYP3A4T activity was signifi-
cantly influenced by gender at P = 3.85 3 10�3, and even after
Bonferroni correction for 10 assays, the association remained sig-
nificant. Specifically, females showed higher CYP3A4T activity
than did males. Age had a significant impact on the activities of
CYP2C9 in both genders (P = 2.64 3 10�5
for all samples, 1.74 3 10�3 for males, and
4.24 3 10�3 for females), CYP1A2 in fe-
males only (P = 6.52 3 10�3), CYP2C8 in
all samples (P = 9.12 3 10�3) and females
(6.67 3 10�2), CYP2A6 in all samples (P =
1.02 3 10�2) and females (6.51 3 10�3),
CYP3A4M and CYP3A4T in all samples
(P = 2.94 3 10�2 and 2.30 3 10�2, re-
spectively) and females (P = 4.18 3 10�3
and 1.05 3 10�2), and CYP2B6 in males
(4.64 3 10�2). As shown in Supplemental
Figure S2, the correlations observed are all
in a positive direction; namely, P450 ac-
tivities increase as age advances. After
Bonferroni correction for 30 tests (10 as-
says 3 three gender categories), only the
effect of age on CYP2C9 remained signif-
icant. We note that the positive correla-
tions were mainly driven by low activity
levels in very young (<20 yr) subjects. This
is consistent with the observation that
most P450s turn on after birth and mature
over the first years of life (Hakkola et al.
1998; Koukouritaki et al. 2004). In order to
address the relationship between age and
P450 activity in adults only (more than
20 yr), we performed additional analyses
and found that most of the correlations
observed in the all-subject analysis dis-
appeared, suggesting weaker age effect in
adults. However, in the case of CYP2C9, the
positive correlation remained in all adults
(P = 3.50 3 10�4), adult males (P = 4.45 3
10�3), and adult females (1.70 3 10�2).
Interestingly, when both age and gen-
der were considered simultaneously (Sup-
plemental Fig. S3), gender demonstrated
different effects at different age bands. For
example, at younger ages (e.g., <10 yr), fe-
males appeared to have lower activity than
males in most cases, whereas at older ages
females tended to have higher activities
than males. Similar trends were found for
P450 expression levels (data not shown). Although the effect of age
and gender was not very strong, our data suggest influence from
both factors on P450 activities. Hence, we adjusted for age and
gender for each P450 activity and expression trait in all subsequent
analyses.
Relationship between P450s
Pair-wise Spearman correlations were employed to determine the
relationships between the various enzyme activity measurements.
The significance P-values and correlation values are listed in Sup-
plemental Table S2. Without multiple-testing correction, the nine
P450 enzymes analyzed using 10 assays were highly positively
correlated with one another. After Bonferroni correction, most of
the correlations still remained significant at a new significance
threshold of P < 9.09 3 10�4, except for those between CYP2D6
and CYP2C19 and between CYP2D6 and CYP2A6.
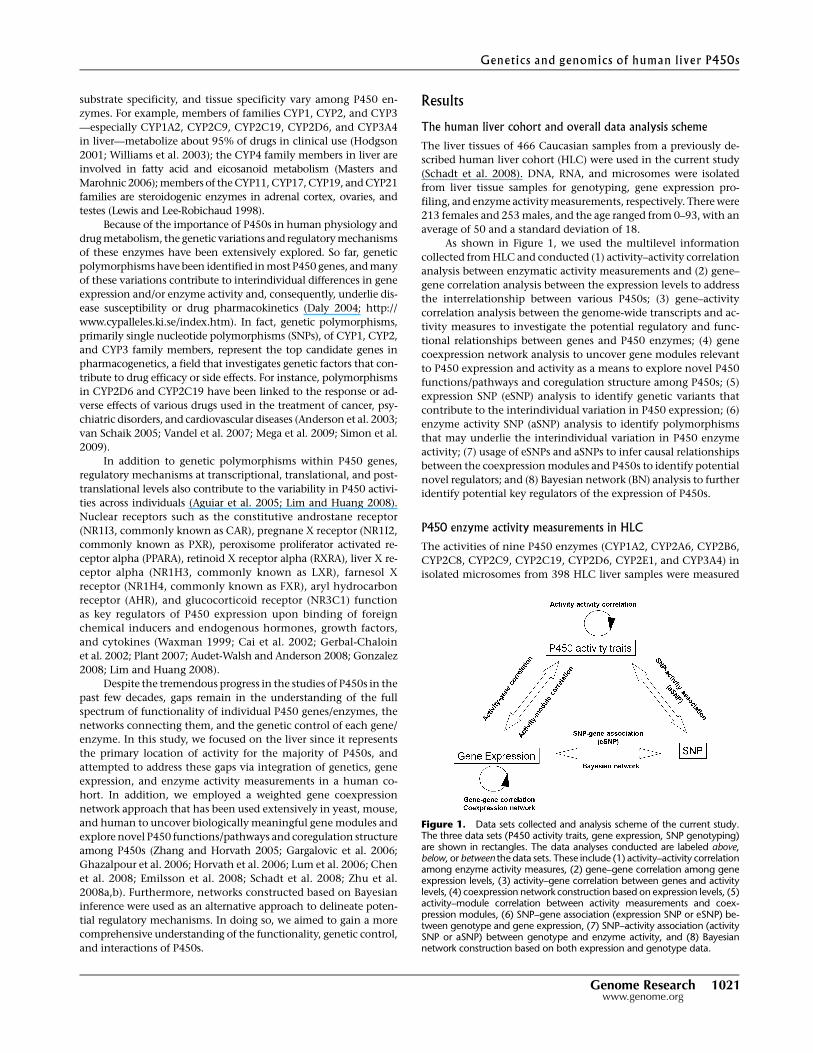
As shown in Figure 2A, a hierarchical clustering of the activity
traits provided a clearer view of the relationship among them: The
Figure 2. Dendrograms of the hierarchical clustering between P450s. (A) Dendrogram of the P450enzyme activity traits. (B) Dendrogram of the P450 gene expression traits. The coding genes for theP450 enzymes shown in A are highlighted in red rectangles in B.
Yang et al.
1022 Genome Researchwww.genome.org
two assays for CYP3A4 (3A4T and 3A4M) showed the highest simi-
larity as expected; adjacent to CYP3A4 is the subcluster containing
CYP1A2, CYP2C8, and CYP2C9; CYP2C19 and a clade comprised of
CYP2E1, CYP2B6, and CYP2A6 are at the next level. Finally, CYP2D6
shows a more distant relationship with the other eight P450s.
We applied similar analyses to the mRNA levels of the P450
genes and found that most of the P450 genes were highly corre-
lated with one another, supporting the close relationship between
the activities of the P450 enzymes described above. The signifi-
cance P-values and correlation values are listed in Supplemental
Table S3. A hierarchical clustering of the P450 gene expression
values (Fig. 2B) revealed that a majority of the P450s, including the
nine genes whose enzyme activities were measured as described
above, were under a main clade. A comparison between panels A
and B of Figure 2 indicated that there was a general agreement be-
tween the enzyme activity and the gene expression dendrograms.
For instance, CYP2B6 and CYP2A6 were clustered closer to each
other at both enzyme and expression levels. Similar kinship was
found for CYP2C8, CYP2C9, CYP1A2, and CYP3A4. However,
CYP2C19 and CYP2E1 were exceptions. They clustered more closely
together but well apart from the other genes at the gene expression
level, while they were more distant from each other at the activity
level. The discordance was not a result of probe cross-hybridization
at the mRNA level because the probes were reliable and specific.
Relationship between P450s and known regulators
In order to evaluate the role of known P450 regulators in modu-
lating the expression and enzyme activity levels of different P450s
in our cohort, we investigated the correlation of the expression of
48 key regulators reported in the literature with the P450 expres-
sion as well as the enzyme activity traits. These regulators in-
vestigated include NR1I2 (PXR), NR1I3 (CAR), RXRA, NR1H3
(LXR), NR1H4 (FXR), HNF4A, NR3C1 (GR), PGRMC1, PPARA,
VDR, and many others (Supplemental Table S4; Waxman 1999; Cai
et al. 2002; Gerbal-Chaloin et al. 2002; Tirona et al. 2003; Barbier
et al. 2004; Fan et al. 2004; Gnerre et al. 2004, 2005; Seree et al.
2004; Debose-Boyd 2007; Hughes et al. 2007; Plant 2007; Audet-
Walsh and Anderson 2008; Gonzalez 2008; Lee et al. 2008; Lim and
Huang 2008; Wang et al. 2008). At an uncorrected significance
threshold of P < 0.05, the expression levels of most of the known
regulators are correlated with the enzyme activities of two or more
P450s. In particular, expression of NR1I2, NR1I3, ARNT, CEBPG,
ESR1, HNF4A, NCOR1, NCOR2, NFE2L2, NR1H3, NR5A2, THRB,
and PGRMC1 was correlated with all measured P450 enzyme ac-
tivity levels. Even after Bonferroni correction (P < 6.2 3 10�5), most
of the correlations of HNF4A, ESR1, NR1I3, NCOR1, NCOR2, and
PGRMC1 to P450s remained significant. Among all 48 known
regulators tested, only the mRNA expression levels of NCOA1,
ONECUT1, and PPARG were not correlated with any of the P450
enzyme activity measures. Due to the lack of reliable probes for
FOXA3 and NR0B1 on the array, we were not able to determine
their correlation with P450 activities.
When we looked at the relationship between the expression
of the P450 genes and that of these key regulators, we also found
significant correlations that were consistent with the results from
the above analysis for the enzyme activities (Supplemental Table
S4). Moreover, when the mRNA level of a key regulator is correlated
to the activity of a P450, it is even more significantly correlated to
the expression of the same P450. This result is not surprising given
that many of these regulators are known to play regulatory roles at
the transcriptional level (Waxman 1999; Cai et al. 2002; Gerbal-
Chaloin et al. 2002; Tirona et al. 2003; Barbier et al. 2004; Fan et al.
2004; Gnerre et al. 2004, 2005; Seree et al. 2004; Debose-Boyd
2007; Hughes et al. 2007; Plant 2007; Audet-Walsh and Anderson
2008; Gonzalez 2008; Lee et al. 2008; Lim and Huang 2008; Wang
et al. 2008).
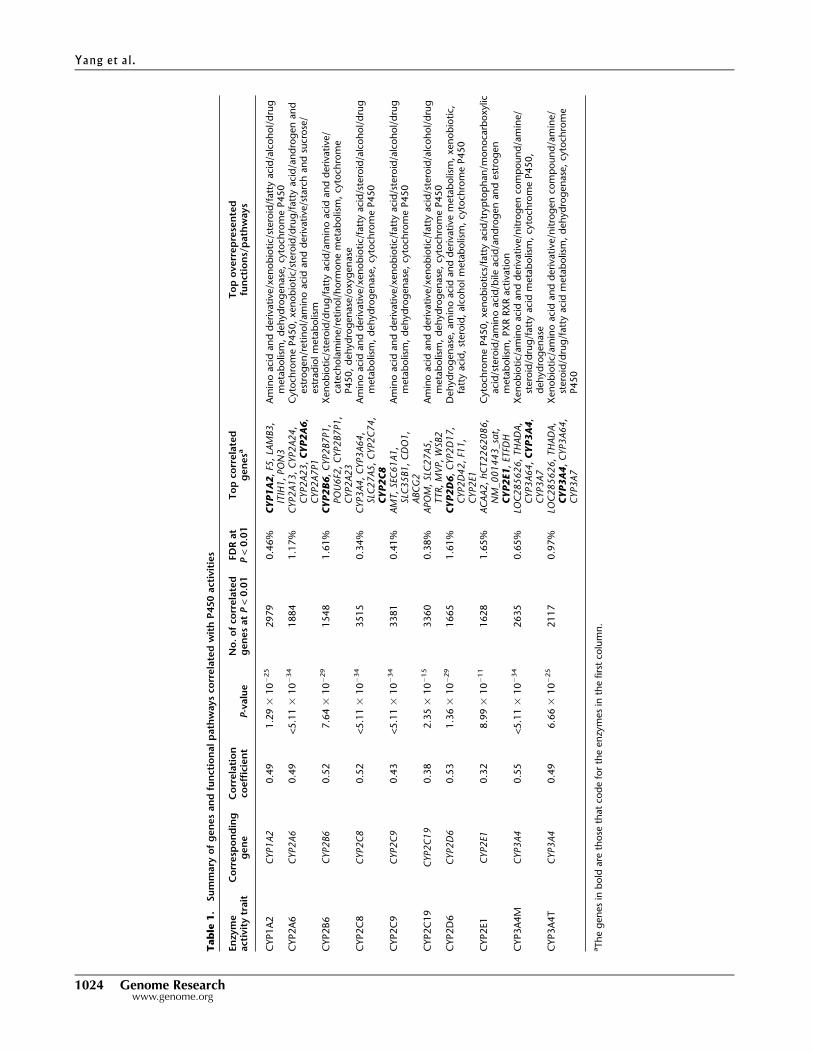
P450 enzyme activity levels are highly correlated with theircorresponding coding genes as well as many additional genes
In order to test whether the enzyme activity level is mainly regu-
lated at the gene expression level and whether each of the enzy-
matic measures capture information from genes other than the
corresponding P450 genes, we analyzed the correlation between
a selected set of 5811 transcriptionally active transcripts (for de-
tails, see Methods) and the activity measurements of each P450. As
summarized in Table 1 and detailed in Supplemental Table S5,
thousands of genes are correlated with each of the P450 activity
measurements at P < 0.01, with corresponding false discovery rates
(FDRs) ranging from 0.34%–1.65% at this significance level. Nota-
bly, the activity levels of all P450 enzymes were significantly posi-
tively correlated with the expression of their corresponding coding
genes (see representative plots for CYP1A2, CYP2C8, CYP2C9,
CYP2D6, and CYP3A4 in Supplemental Fig. S4). Furthermore, the
corresponding coding gene was among the top five correlated genes
for each of the enzyme measurements of CYP1A2, CYP2A6,
CYP2B6, CYP2C8, CYP2D6, CYP2E1, CYP3A4M, and CYP3A4T.
Across various P450s, the correlated genes were highly enriched for
similar functional pathways including drug and xenobiotic metab-
olism, amino acid and derivative metabolism, steroid metabolism,
fatty acid metabolism, dehydrogenase, and P450 activities. How-
ever, the rank order of the enriched pathways for each of the P450-
correlated gene sets was not the same, suggesting that each P450
enzyme has its own distinct functional footprint.
Gene coexpression network analysis
The fact that many genes were found to be correlated with each
enzyme activity measurement suggests these genes are coregulated,
and as such, the coexpression structure may provide insights into
the regulation of P450s. We therefore reconstructed the coex-
pression network for a set of 5012 most varying genes identified in
the HLC data using a previously described weighted coexpression
network algorithm (Zhang and Horvath 2005).
A number of studies have previously demonstrated that coex-
pression networks are both scale-free and modular (Ghazalpour et al.
2006; Lum et al. 2006), thus highlighting functional components of
the network that are often associated with specific biological pro-
cesses. Therefore, to identify modules composed of highly inter-
connected expression traits within the coexpression network, we
examined the topological overlap matrix (TOM) (Ravasz et al. 2002)
associated with this network. The topological overlap between two
genes not only reflects their more proximal interactions (e.g., two
genes physically interacting or having correlated expression values)
but also reflects the higher-order interactions that these two genes
may have with other genes in the network. Figure 3 depicts a hier-
archically clustered topological overlap map in which the most
highly interconnected modules in the network are readily identi-
fied. Previous studies have shown that topological overlap leads
to more cohesive and biologically meaningful modules (Ravasz
et al. 2002; Zhang and Horvath 2005). To identify gene modules
(subnetworks) formally from the topological overlap map, we em-
ployed a previously described dynamic cut-tree algorithm with near
Genetics and genomics of human liver P450s
Genome Research 1023www.genome.org
Tab
le1
.Su
mm
ary
of
gen
es
an
dfu
nct
ion
alp
ath
ways
corr
ela
ted
wit
hP
450
act
ivit
ies
En
zym
eact
ivit
ytr
ait
Co
rresp
on
din
gg
en
eC
orr
ela
tio
nco
eff
icie
nt
P-v
alu
eN
o.o
fco
rrela
ted
gen
es
at
P<
0.0
1FD
Rat
P<
0.0
1T
op
corr
ela
ted
gen
esa
To
po
verr
ep
rese
nte
dfu
nct
ion
s/p
ath
ways
CYP1A
2C
YP1
A2
0.4
91.2
93
10�
25
2979
0.4
6%
CY
P1
A2
,F5
,LA
MB3,
ITIH
1,
PO
N3
Am
ino
aci
dan
dd
eriva
tive
/xen
ob
iotic/s
tero
id/f
att
yaci
d/a
lcoh
ol/
dru
gm
eta
bolis
m,
deh
yd
rog
en
ase
,cy
toch
rom
eP450
CYP2A
6C
YP2
A6
0.4
9<5.1
13
10�
34
1884
1.1
7%
CYP2
A1
3,
CYP2
A2
4,
CYP2
A2
3,CY
P2
A6
,C
YP2
A7
P1
Cyto
chro
me
P450,
xen
ob
iotic/
stero
id/d
rug
/fatt
yaci
d/a
nd
rog
en
an
dest
rog
en
/retin
ol/
am
ino
aci
dan
dd
eriva
tive
/sta
rch
an
dsu
crose
/est
rad
iolm
eta
bolis
mC
YP2B6
CYP2
B6
0.5
27.6
43
10�
29
1548
1.6
1%
CY
P2
B6
,C
YP2
B7
P1,
PO
U6
F2,
CYP2
B7
P1,
CYP2
A2
3
Xen
ob
iotic/
stero
id/d
rug
/fatt
yaci
d/a
min
oaci
dan
dd
eriva
tive
/ca
tech
ola
min
e/r
etin
ol/
horm
on
em
eta
bolis
m,
cyto
chro
me
P450,
deh
yd
rog
en
ase
/oxyg
en
ase
CYP2C
8C
YP2
C8
0.5
2<5.1
13
10�
34
3515
0.3
4%
CYP3
A4,
CYP3
A6
4,
SLC
27
A5
,C
YP2
C7
4,
CY
P2
C8
Am
ino
aci
dan
dd
eriva
tive
/xen
ob
iotic/f
att
yaci
d/s
tero
id/a
lcoh
ol/
dru
gm
eta
bolis
m,
deh
yd
rog
en
ase
,cy
toch
rom
eP450
CYP2C
9C
YP2
C9
0.4
3<5.1
13
10�
34
3381
0.4
1%
AM
T,
SEC
61
A1,
SLC
35
B1
,C
DO
1,
ABC
G2
Am
ino
aci
dan
dd
eriva
tive
/xen
ob
iotic/f
att
yaci
d/s
tero
id/a
lcoh
ol/
dru
gm
eta
bolis
m,
deh
yd
rog
en
ase
,cy
toch
rom
eP450
CYP2C
19
CYP2
C1
90.3
82.3
53
10�
15
3360
0.3
8%
APO
M,
SLC
27
A5
,TTR,
MV
P,
WSB2
Am
ino
aci
dan
dd
eriva
tive
/xen
ob
iotic/f
att
yaci
d/s
tero
id/a
lcoh
ol/
dru
gm
eta
bolis
m,
deh
yd
rog
en
ase
,cy
toch
rom
eP450
CYP2D
6C
YP2
D6
0.5
31.3
63
10�
29
1665
1.6
1%
CY
P2
D6
,C
YP2
D1
7,
CYP2
D4
2,
F11,
CYP2
E1
Deh
yd
rog
en
ase
,am
ino
aci
dan
dd
eriva
tive
meta
bolis
m,
xen
ob
iotic,
fatt
yaci
d,
stero
id,
alc
oh
olm
eta
bolis
m,
cyto
chro
me
P450
CYP2E1
CYP2
E10.3
28.9
93
10�
11
1628
1.6
5%
AC
AA
2,
hC
T2
26
20
86
,N
M_0
01
44
3_sa
t,CY
P2
E1
,ET
FDH
Cyto
chro
me
P450,
xen
ob
ioti
cs/f
att
yaci
d/t
ryp
top
han
/mon
oca
rboxylic
aci
d/s
tero
id/a
min
oaci
d/b
ileaci
d/a
nd
rog
en
an
dest
rog
en
meta
bolis
m,
PX
RRX
Ract
ivati
on
CYP3A
4M
CYP3
A4
0.5
5<5.1
13
10�
34
2635
0.6
5%
LOC
28
56
26
,TH
AD
A,
CYP3
A6
4,CY
P3
A4
,C
YP3
A7
Xen
ob
iotic/
am
ino
aci
dan
dd
eriva
tive
/nitro
gen
com
poun
d/a
min
e/
stero
id/d
rug
/fatt
yaci
dm
eta
bolis
m,
cyto
chro
me
P450,
deh
yd
rog
en
ase
CYP3A
4T
CYP3
A4
0.4
96.6
63
10�
25
2117
0.9
7%
LOC
28
56
26
,TH
AD
A,
CY
P3
A4
,C
YP3
A6
4,
CYP3
A7
Xen
ob
iotic/
am
ino
aci
dan
dd
eriva
tive
/nitro
gen
com
poun
d/a
min
e/
stero
id/d
rug
/fatt
yaci
dm
eta
bolis
m,
deh
yd
rog
en
ase
,cy
toch
rom
eP450
aTh
eg
en
es
inb
old
are
those
that
cod
efo
rth
een
zym
es
inth
efirs
tco
lum
n.
Yang et al.
1024 Genome Researchwww.genome.org
optimal performance on complicated dendrograms (for details, see
Methods) (Langfelder et al. 2008).
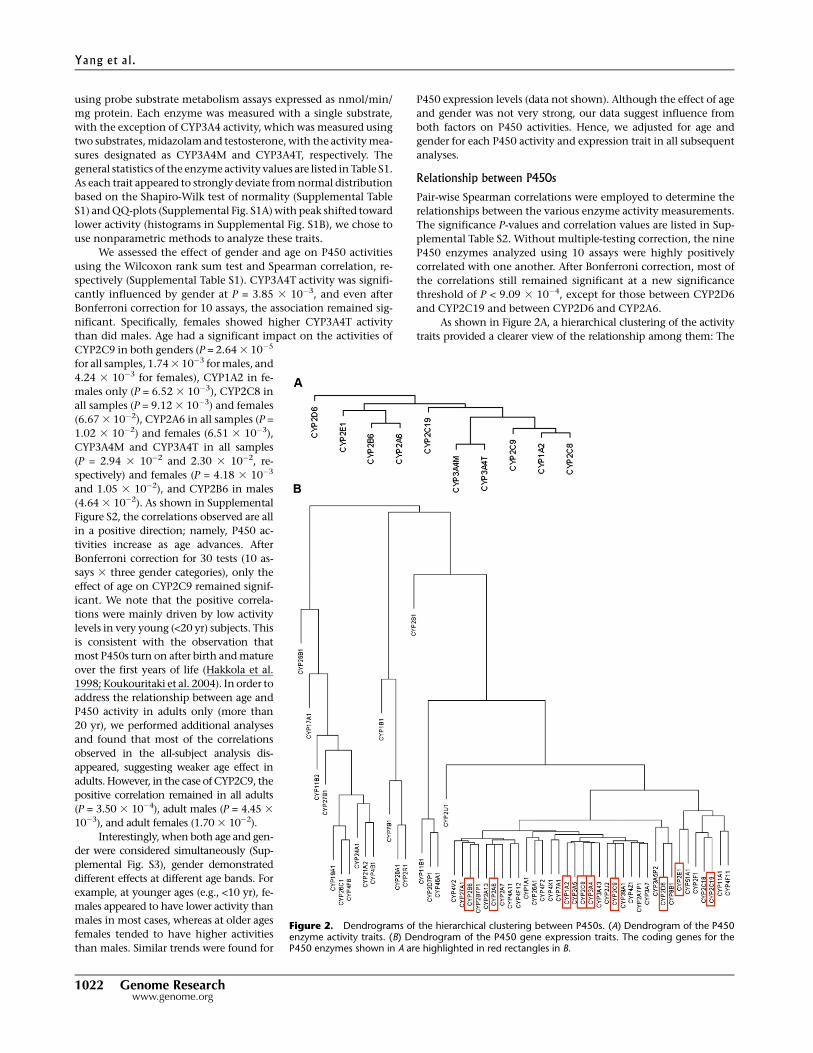
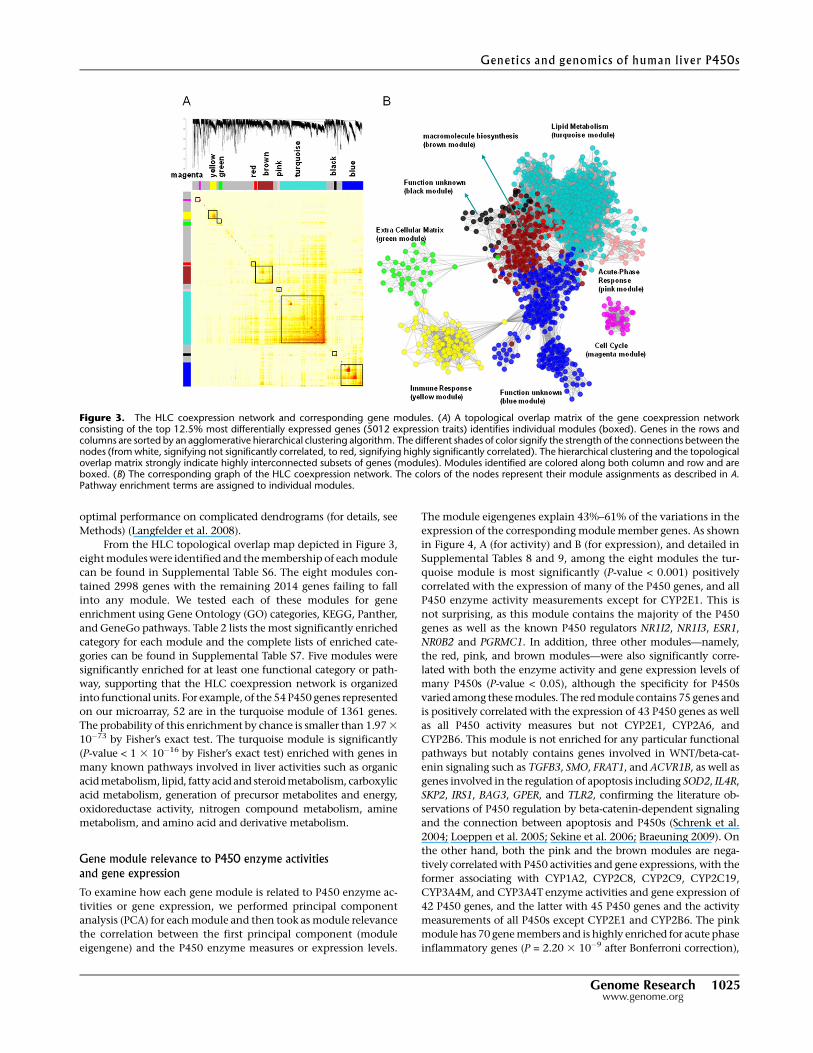
From the HLC topological overlap map depicted in Figure 3,
eight modules were identified and the membership of each module
can be found in Supplemental Table S6. The eight modules con-
tained 2998 genes with the remaining 2014 genes failing to fall
into any module. We tested each of these modules for gene
enrichment using Gene Ontology (GO) categories, KEGG, Panther,
and GeneGo pathways. Table 2 lists the most significantly enriched
category for each module and the complete lists of enriched cate-
gories can be found in Supplemental Table S7. Five modules were
significantly enriched for at least one functional category or path-
way, supporting that the HLC coexpression network is organized
into functional units. For example, of the 54 P450 genes represented
on our microarray, 52 are in the turquoise module of 1361 genes.
The probability of this enrichment by chance is smaller than 1.97 3
10�73 by Fisher’s exact test. The turquoise module is significantly
(P-value < 1 3 10�16 by Fisher’s exact test) enriched with genes in
many known pathways involved in liver activities such as organic
acid metabolism, lipid, fatty acid and steroid metabolism, carboxylic
acid metabolism, generation of precursor metabolites and energy,
oxidoreductase activity, nitrogen compound metabolism, amine
metabolism, and amino acid and derivative metabolism.
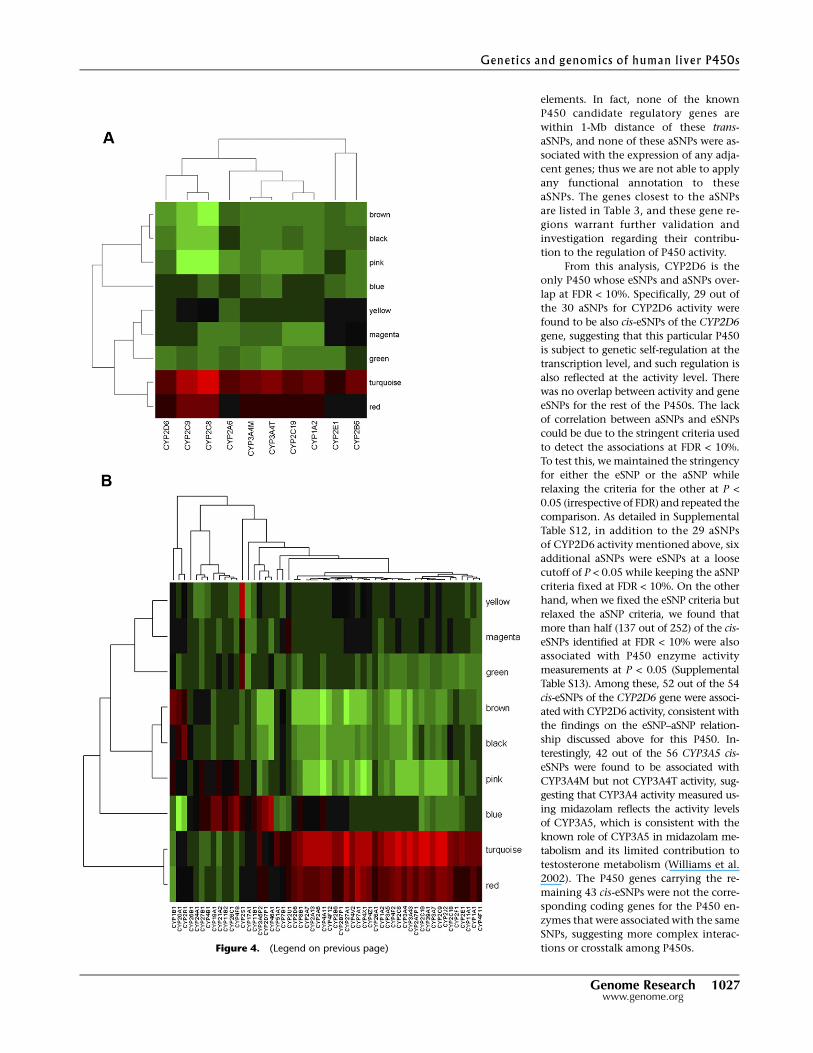
Gene module relevance to P450 enzyme activitiesand gene expression
To examine how each gene module is related to P450 enzyme ac-
tivities or gene expression, we performed principal component
analysis (PCA) for each module and then took as module relevance
the correlation between the first principal component (module
eigengene) and the P450 enzyme measures or expression levels.
The module eigengenes explain 43%–61% of the variations in the
expression of the corresponding module member genes. As shown
in Figure 4, A (for activity) and B (for expression), and detailed in
Supplemental Tables 8 and 9, among the eight modules the tur-
quoise module is most significantly (P-value < 0.001) positively
correlated with the expression of many of the P450 genes, and all
P450 enzyme activity measurements except for CYP2E1. This is
not surprising, as this module contains the majority of the P450
genes as well as the known P450 regulators NR1I2, NR1I3, ESR1,
NR0B2 and PGRMC1. In addition, three other modules—namely,
the red, pink, and brown modules—were also significantly corre-
lated with both the enzyme activity and gene expression levels of
many P450s (P-value < 0.05), although the specificity for P450s
varied among these modules. The red module contains 75 genes and
is positively correlated with the expression of 43 P450 genes as well
as all P450 activity measures but not CYP2E1, CYP2A6, and
CYP2B6. This module is not enriched for any particular functional
pathways but notably contains genes involved in WNT/beta-cat-
enin signaling such as TGFB3, SMO, FRAT1, and ACVR1B, as well as
genes involved in the regulation of apoptosis including SOD2, IL4R,
SKP2, IRS1, BAG3, GPER, and TLR2, confirming the literature ob-
servations of P450 regulation by beta-catenin-dependent signaling
and the connection between apoptosis and P450s (Schrenk et al.
2004; Loeppen et al. 2005; Sekine et al. 2006; Braeuning 2009). On
the other hand, both the pink and the brown modules are nega-
tively correlated with P450 activities and gene expressions, with the
former associating with CYP1A2, CYP2C8, CYP2C9, CYP2C19,
CYP3A4M, and CYP3A4T enzyme activities and gene expression of
42 P450 genes, and the latter with 45 P450 genes and the activity
measurements of all P450s except CYP2E1 and CYP2B6. The pink
module has 70 gene members and is highly enriched for acute phase
inflammatory genes (P = 2.20 3 10�9 after Bonferroni correction),
Figure 3. The HLC coexpression network and corresponding gene modules. (A) A topological overlap matrix of the gene coexpression networkconsisting of the top 12.5% most differentially expressed genes (5012 expression traits) identifies individual modules (boxed). Genes in the rows andcolumns are sorted by an agglomerative hierarchical clustering algorithm. The different shades of color signify the strength of the connections between thenodes (from white, signifying not significantly correlated, to red, signifying highly significantly correlated). The hierarchical clustering and the topologicaloverlap matrix strongly indicate highly interconnected subsets of genes (modules). Modules identified are colored along both column and row and areboxed. (B) The corresponding graph of the HLC coexpression network. The colors of the nodes represent their module assignments as described in A.Pathway enrichment terms are assigned to individual modules.
Genetics and genomics of human liver P450s
Genome Research 1025www.genome.org
supporting the link between inflammation and P450s (Aitken
et al. 2006; Xie and Tian 2006; Zhou et al. 2006). The brown
module contains 451 genes, of which 10 are involved in ribosome
biogenesis and assembly.
While it is interesting to uncover coexpression modules that
are relevant to P450s, it is also important to identify the most
critical genes within each module. A number of studies have
shown that the gene intramodule connectivity is an effective
metric for further identifying key genes in a module (Gargalovic
et al. 2006; Ghazalpour et al. 2006; Horvath et al. 2006; Chen et al.
2008; Emilsson et al. 2008). Key genes with high connectivity
measures are termed hub genes herein. For the HLC coexpression
network, as shown in Supplemental Figure S5 as an example, the
gene network connectivity measures such as within module con-
nectivity k.in (for details, see Methods) are highly predictive of the
relevance of a gene (the absolute value of correlation) to the trait
CYP2C8 enzyme activity. Similar conclusions can be reached for all
the other enzyme traits. The top hub genes for the P450-correlated
turquoise, red, pink, and brown modules are listed in Table 2. These
hubs include the antioxidative stress genes such as CAT and SOD2;
the oxidoreductases HAO1 and EHHADH that are involved in car-
boxylic acid metabolism; acute phase inflammatory genes such as
SAA1, SAA2, SAA3P, and CRP; as well as translation-related genes
DKC1, EEF1E1, and EIF2S2. Given the central role of these genes in
the P450-correlated modules, they may represent candidate regu-
latory factors for P450s.
Despite the usefulness of the coexpression network to iden-
tify modules, hub genes, and their relevance to P450s, this analysis
cannot address whether the correlations observed are of causal,
reactive, or independent nature. Because genetic variations can
serve as causal anchors as previously described (Schadt et al. 2005),
P450-correlated modules that are enriched for genes affected by
genetic variations may harbor upstream regulators of P450s. To
this end, we conducted the following analyses to systematically
explore the genetic regulation of P450s.
Identification of SNPs associatedwith P450 gene expression (eSNPs)
In order to survey the contribution of
genetic variations to P450 gene expres-
sion, we analyzed the association of the
transcripts of the 54 P450 genes repre-
sented on the human 44k array with
782,476 unique SNPs that were repre-
sented, successfully genotyped, and passed quality control (for
details, see Methods) in the HLC using both the Affymetrix 500K
and Illumina 650Y panels (Schadt et al. 2008). At an FDR < 10%
level, we identified 252 unique cis-eSNPs (defined by <1-Mb dis-
tance between SNP and gene location) that are associated with the
expression of 19 of the 54 P450 genes represented on the array
(summarized in Table 3, and fully listed in Supplemental Table
S10). No trans-eSNPs were found at the same FDR cutoff, reflecting
the weaker nature of trans-regulation. The P450 genes with cis-
eSNPs are CYP1B1, CYP26C1, CYP2C18, CYP2C19, CYP2C9,
CYP2D6, CYP2E1, CYP2F1, CYP2R1, CYP2S1, CYP2U1, CYP39A1,
CYP3A5, CYP46A1, CYP4A11, CYP4F11, CYP4F12, CYP4V2, and
CYP4X1. Among these, CYP3A5, CYP2D6, CYP4F12, and CYP2E1
each have more than 30 cis-eSNPs; thus, about one-third of the P450
genes appear to be under detectable cis-regulation.
SNPs associated with P450 enzyme activities (aSNPs)
The identification of polymorphisms that associate strongly with
P450 expression also leads us to investigate polymorphisms that
associate strongly with P450 enzyme activities. In this article, we
have named such SNPs as activity SNPs, or aSNPs. By analyzing the
association between the 10 P450 activity measurements and the
same set of 782,476 SNPs, as described above, we identified 54 aSNPs
for nine of the enzyme activity measurements of eight P450s,
namely, CYP1A2, CYP2A6, CYP2B6, CYP2C8, CYP2C9, CYP2C19,
CYP2D6, CYP3A4M, and CYP3A4T at FDR < 10% (summary in
Table 3, and full list in Supplemental Table S11). Of the 54 aSNPs
identified, 30 were associated with CYP2D6 activity, and they were
all within 200-kb distance of the physical location of the CYP2D6
gene, demonstrating mainly cis genetic regulation of CYP2D6 en-
zyme activity. However, none of the remaining 24 aSNPs are lo-
cated on the same chromosome as the genes encoding the corre-
sponding P450 enzymes, and hence, they represent trans-regulatory
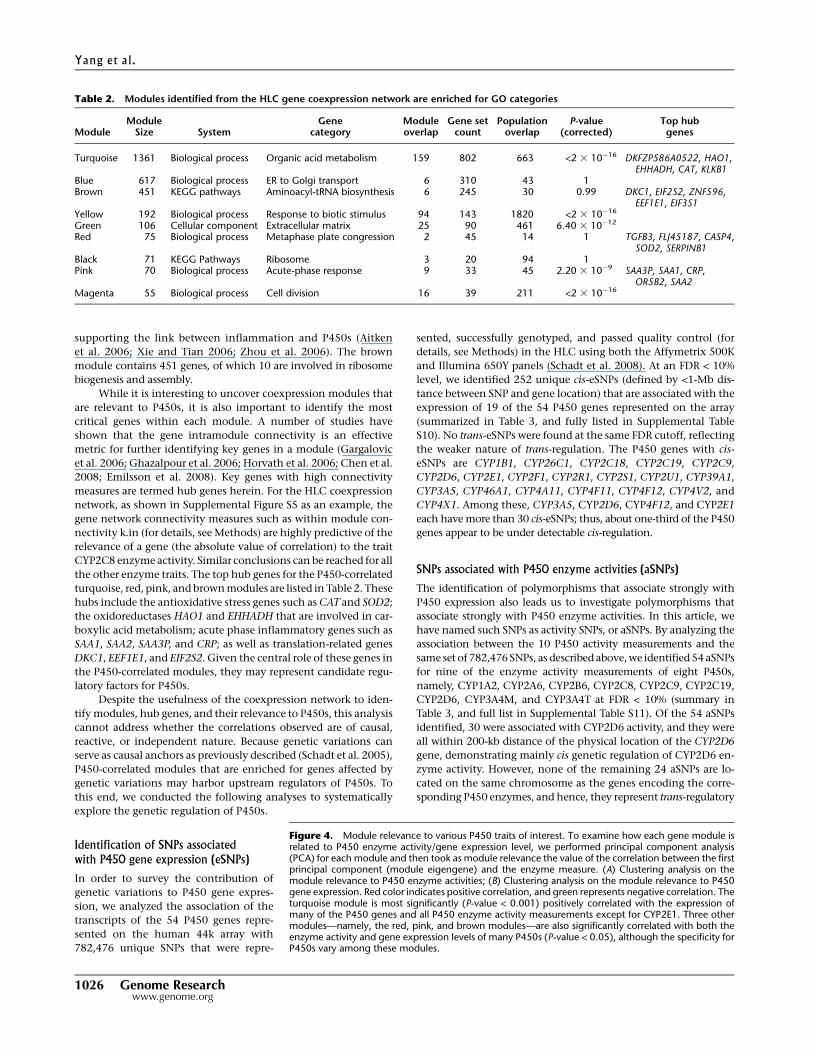
Table 2. Modules identified from the HLC gene coexpression network are enriched for GO categories
ModuleModule
Size SystemGene
categoryModuleoverlap
Gene setcount
Populationoverlap
P-value(corrected)
Top hubgenes
Turquoise 1361 Biological process Organic acid metabolism 159 802 663 <2 3 10�16 DKFZP586A0522, HAO1,EHHADH, CAT, KLKB1
Blue 617 Biological process ER to Golgi transport 6 310 43 1Brown 451 KEGG pathways Aminoacyl-tRNA biosynthesis 6 245 30 0.99 DKC1, EIF2S2, ZNF596,
EEF1E1, EIF3S1Yellow 192 Biological process Response to biotic stimulus 94 143 1820 <2 3 10�16
Green 106 Cellular component Extracellular matrix 25 90 461 6.40 3 10�12
Red 75 Biological process Metaphase plate congression 2 45 14 1 TGFB3, FLJ45187, CASP4,SOD2, SERPINB1
Black 71 KEGG Pathways Ribosome 3 20 94 1Pink 70 Biological process Acute-phase response 9 33 45 2.20 3 10�9 SAA3P, SAA1, CRP,
OR5B2, SAA2Magenta 55 Biological process Cell division 16 39 211 <2 3 10�16
Figure 4. Module relevance to various P450 traits of interest. To examine how each gene module isrelated to P450 enzyme activity/gene expression level, we performed principal component analysis(PCA) for each module and then took as module relevance the value of the correlation between the firstprincipal component (module eigengene) and the enzyme measure. (A) Clustering analysis on themodule relevance to P450 enzyme activities; (B) Clustering analysis on the module relevance to P450gene expression. Red color indicates positive correlation, and green represents negative correlation. Theturquoise module is most significantly (P-value < 0.001) positively correlated with the expression ofmany of the P450 genes and all P450 enzyme activity measurements except for CYP2E1. Three othermodules—namely, the red, pink, and brown modules—are also significantly correlated with both theenzyme activity and gene expression levels of many P450s (P-value < 0.05), although the specificity forP450s vary among these modules.
Yang et al.
1026 Genome Researchwww.genome.org
elements. In fact, none of the known
P450 candidate regulatory genes are
within 1-Mb distance of these trans-
aSNPs, and none of these aSNPs were as-
sociated with the expression of any adja-
cent genes; thus we are not able to apply
any functional annotation to these
aSNPs. The genes closest to the aSNPs
are listed in Table 3, and these gene re-
gions warrant further validation and
investigation regarding their contribu-
tion to the regulation of P450 activity.
From this analysis, CYP2D6 is the
only P450 whose eSNPs and aSNPs over-
lap at FDR < 10%. Specifically, 29 out of
the 30 aSNPs for CYP2D6 activity were
found to be also cis-eSNPs of the CYP2D6
gene, suggesting that this particular P450
is subject to genetic self-regulation at the
transcription level, and such regulation is
also reflected at the activity level. There
was no overlap between activity and gene
eSNPs for the rest of the P450s. The lack
of correlation between aSNPs and eSNPs
could be due to the stringent criteria used
to detect the associations at FDR < 10%.
To test this, we maintained the stringency
for either the eSNP or the aSNP while
relaxing the criteria for the other at P <
0.05 (irrespective of FDR) and repeated the
comparison. As detailed in Supplemental
Table S12, in addition to the 29 aSNPs
of CYP2D6 activity mentioned above, six
additional aSNPs were eSNPs at a loose
cutoff of P < 0.05 while keeping the aSNP
criteria fixed at FDR < 10%. On the other
hand, when we fixed the eSNP criteria but
relaxed the aSNP criteria, we found that
more than half (137 out of 252) of the cis-
eSNPs identified at FDR < 10% were also
associated with P450 enzyme activity
measurements at P < 0.05 (Supplemental
Table S13). Among these, 52 out of the 54
cis-eSNPs of the CYP2D6 gene were associ-
ated with CYP2D6 activity, consistent with
the findings on the eSNP–aSNP relation-
ship discussed above for this P450. In-
terestingly, 42 out of the 56 CYP3A5 cis-
eSNPs were found to be associated with
CYP3A4M but not CYP3A4T activity, sug-
gesting that CYP3A4 activity measured us-
ing midazolam reflects the activity levels
of CYP3A5, which is consistent with the
known role of CYP3A5 in midazolam me-
tabolism and its limited contribution to
testosterone metabolism (Williams et al.
2002). The P450 genes carrying the re-
maining 43 cis-eSNPs were not the corre-
sponding coding genes for the P450 en-
zymes that were associated with the same
SNPs, suggesting more complex interac-
tions or crosstalk among P450s.Figure 4. (Legend on previous page)
Genetics and genomics of human liver P450s
Genome Research 1027www.genome.org
Validation of aSNPs and eSNPs
To test the validity of the aSNPs and eSNPs
discovered above, we chose to genotype
three aSNP/eSNPs of CYP2D6, namely,
rs8138080, rs5751247, and rs17478227, in
a previously described independent cohort
that comprised 237 Caucasians (Gaedigk
et al. 2008). These SNPs were found to
be significantly correlated (P < 1 3 10�11)
with CYP2D6 activity measured in vivo
using the log10 urinary ratio of dextro-
methorphan (DM) to its metabolite dex-
trorphan (DX) (Supplemental Fig. S6).
Furthermore, these SNPs were found to
be in strong linkage disequilibrium (LD)
with two previously known functional
variants, CYP2D6*4 (1846G>A, 100C>T)
and CYP2D6*10 (100C>T) (Supplemental
Table S14). The 1846G>A polymorphism
inactivates splicing at the acceptor site of
exon 4 and activates a new cryptic site 1
nucleotide (nt) downstream of the natural
splice, resulting in a frameshift and com-
plete loss of functional activity. The non-
synonymous 100C>T results in a pro-
line-to-serine amino acid change and a
reduction of catalytic activity relative to
the reference CYP2D6.1 protein. Therefore,
the correlation of the three aSNP/eSNPs
with CYP2D6 activity is most probably conferred by the *4 and *10
variants. However, the functional relationship between the SNPs
defining the CYP2D6*4 and CYP2D6*10 alleles and variability in
CYP2D6 RNA expression is less clear.
eSNP and aSNP enrichment in coexpression modules
As noted earlier, DNA variations can serve as anchors to infer
causal relationship between genes or gene modules and traits.
We therefore tested whether the P450-correlated modules identi-
fied from the coexpression network analysis are enriched for any
genes whose expression or activity is associated with a SNP. For
the 40,638 probes on the human 44k array (not limited to P450
genes), 6463 eSNPs were previously identified at FDR < 10% and
4264 of them were cis-acting (Schadt et al. 2008). Among the four
gene modules that were correlated with P450 expression and ac-
tivities, the turquoise and brown modules were significantly en-
riched for genes with eSNPs (P = 3.00 3 10�26 and 4.37 3 10�5,
respectively) as well as for cis-eSNPs (P = 3.23 3 10�20 and 5.78 3
10�4, respectively). Moreover, the eSNPs and cis-eSNPs that were
associated with the turquoise module genes were found to be sig-
nificantly overrepresented among the aSNPs that were associated
with P450 activities at P < 0.01 (enrichment P = 1.44 3 10�3 and
8.92 3 10�3 for turquoise module eSNP and cis-eSNPs, respec-
tively). Similarly, among the P450 eSNPs at P < 0.01, we found
overrepresentations of eSNPs (P = 1.10 3 10�5) and cis-eSNPs (P =
2.48 3 10�2) that were associated with the turquoise module
genes, as well as enrichment of eSNPs associated with the brown
module genes (P = 1.23 3 10�3). Thus, these two modules might
harbor upstream regulators of P450s, as more member genes appear
to be affected by DNA variations that also show evidence of associ-
ation with P450 expression and activity levels. In fact, known P450
regulators such as NR0B2, PGRMC1, and NR1I3 had cis-eSNPs and
were in the turquoise module. In addition, another known P450
regulator, HNF4A, was in the brown module, again supporting the
importance of these two modules in the regulation of P450s.
Constructing a predictive BN from the HLC data
As an alternative approach to identifying the pathways and regu-
lators for P450s, we used a Bayesian gene regulatory network
reconstructed based on the HLC gene expression and genotyping
data (Schadt et al. 2008). Unlike coexpression networks, which
allow one to look at the overall gene–gene correlation structure at
a high level, BNs are sparser but allow a more granular look at the
relationships and directional predictions between genes (Zhu et al.
2004). Figure 5A (a high-resolution figure is available in Supple-
mental material) represents an overview of the P450 gene regula-
tory subnetwork composed of the P450 genes and the known P450
regulators, and the genes that are up to two edges away from them.
In order to test if the reconstructed network is predictive, we
turned to data in the public domain. We obtained consensus com-
pound signatures in mouse and rat livers that are responsive to 26
inducers of AHR, NR1I3 (CAR), and NR1I2 (PXR) (e.g., AHR ligand
flutamide, CAR ligand androstenol, and PXR ligand hyperforin)
(Slatter et al. 2006), and analyzed the overlap between these signa-
tures and our network. Indeed, our P450 subnetwork is significantly
enriched not only for mouse genes responsive to ligands of AHR,
CAR, PXR, and all three receptors with enrichment P-values of
1.66 3 10�12, 1.08 3 10�14, 9.74 3 10�13, and 6.19 3 10�7, respec-
tively, but also for rat genes responsive to ligands of AHR, CAR,
PXR, and all three receptors with enrichment P-values of 9.82 3
10�15, 7.43 3 10�12, 2.45 3 10�18, and 3.64 3 10�9, respectively
(Fisher’s exact test; overlapping genes are shown in Supplemental
Table S15 and highlighted in the subnetwork in Fig. 5B; high-reso-
lution figure is available in Supplemental material).
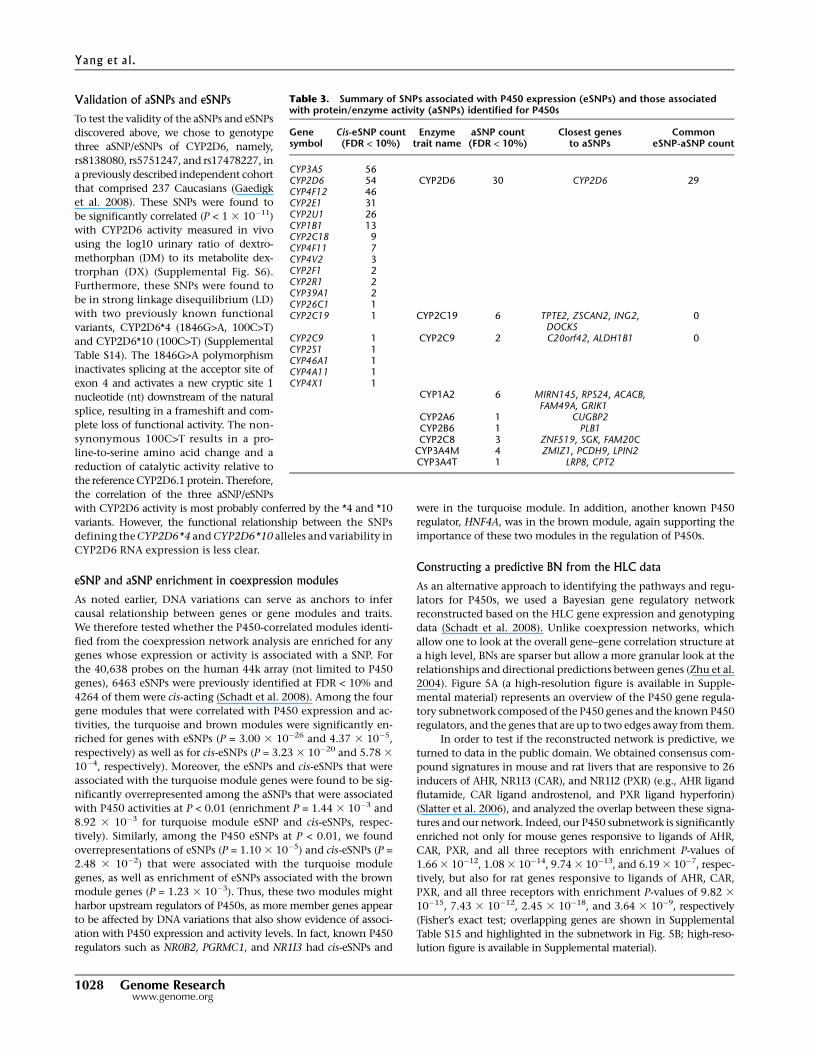
Table 3. Summary of SNPs associated with P450 expression (eSNPs) and those associatedwith protein/enzyme activity (aSNPs) identified for P450s
Genesymbol
Cis-eSNP count(FDR < 10%)
Enzymetrait name
aSNP count(FDR < 10%)
Closest genesto aSNPs
CommoneSNP-aSNP count
CYP3A5 56CYP2D6 54 CYP2D6 30 CYP2D6 29CYP4F12 46CYP2E1 31CYP2U1 26CYP1B1 13CYP2C18 9CYP4F11 7CYP4V2 3CYP2F1 2CYP2R1 2CYP39A1 2CYP26C1 1CYP2C19 1 CYP2C19 6 TPTE2, ZSCAN2, ING2,
DOCK50
CYP2C9 1 CYP2C9 2 C20orf42, ALDH1B1 0CYP2S1 1CYP46A1 1CYP4A11 1CYP4X1 1
CYP1A2 6 MIRN145, RPS24, ACACB,FAM49A, GRIK1
CYP2A6 1 CUGBP2CYP2B6 1 PLB1CYP2C8 3 ZNF519, SGK, FAM20C
CYP3A4M 4 ZMIZ1, PCDH9, LPIN2CYP3A4T 1 LRP8, CPT2
Yang et al.
1028 Genome Researchwww.genome.org
As the reconstructed P450 subnetwork appeared to be pre-
dictive, we proceeded to identify causal regulators for the P450
genes. We used a previously described procedure (Schadt et al. 2008;
Zhu et al. 2008b), which is briefly described here (see Methods). First
we defined the signature for each gene as the set of genes in the
subnetwork that could be reached by this gene following directed
links throughout the entire subnetwork. The signature for each gene
is composed of genes in the subnetwork that are predicted to be af-
fected when that particular gene is perturbed in silico. We then ask if
each of the 57 putative functional P450 genes as defined by Nelson
et al. (1996) is significantly enriched among the predicted responsive
signature by Fisher’s exact test. If one is, then that particular gene
perturbed in silico is inferred as a potential regulator of P450 genes.
All genes in the subnetwork were tested. Based on the criteria that (1)
Fisher’s exact test P-value < 0.05 and (2) there are at least two P450
genes in the signature, we found 19 genes (CYP2C19, ACSM3,
EHHADH, IL15RA, IPPK, FNDC3A, DMD, SEPP1, Corf114, AF147447,
SLC27A5, AKR1D1, SLC10A1, SLCO2B1, CMBL, SUN1, HGD, SIRT5,
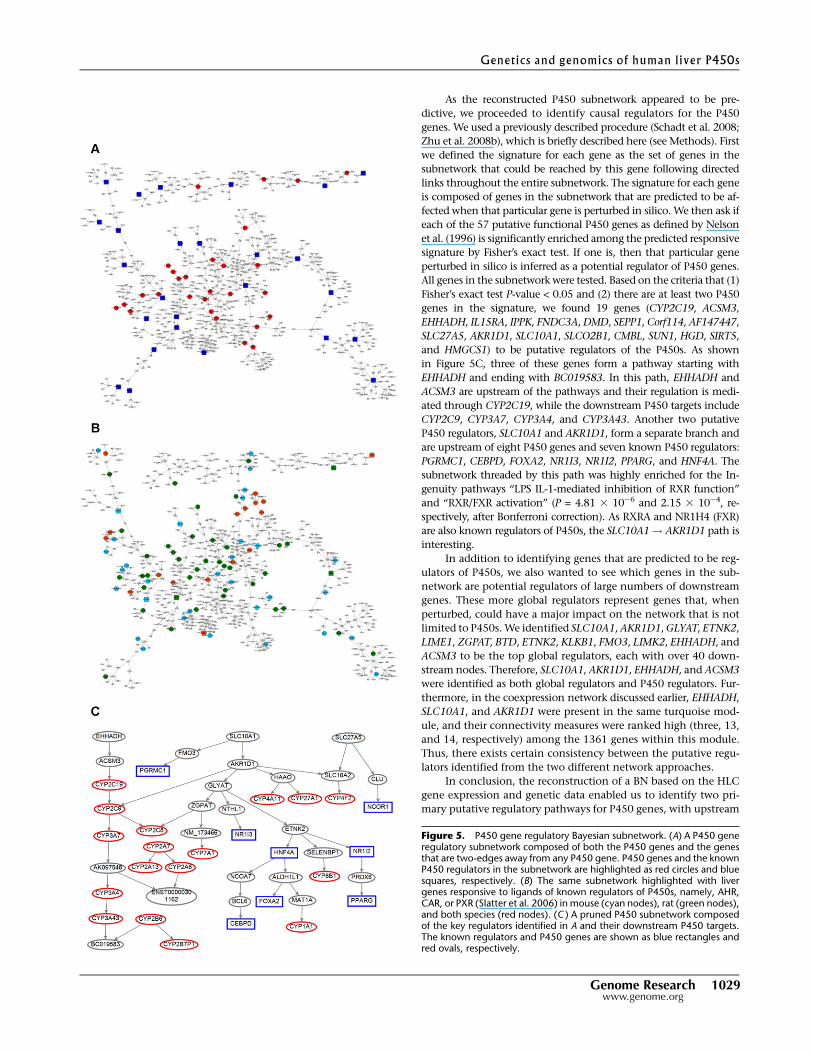
and HMGCS1) to be putative regulators of the P450s. As shown
in Figure 5C, three of these genes form a pathway starting with
EHHADH and ending with BC019583. In this path, EHHADH and
ACSM3 are upstream of the pathways and their regulation is medi-
ated through CYP2C19, while the downstream P450 targets include
CYP2C9, CYP3A7, CYP3A4, and CYP3A43. Another two putative
P450 regulators, SLC10A1 and AKR1D1, form a separate branch and
are upstream of eight P450 genes and seven known P450 regulators:
PGRMC1, CEBPD, FOXA2, NR1I3, NR1I2, PPARG, and HNF4A. The
subnetwork threaded by this path was highly enriched for the In-
genuity pathways ‘‘LPS IL-1-mediated inhibition of RXR function’’
and ‘‘RXR/FXR activation’’ (P = 4.81 3 10�6 and 2.15 3 10�4, re-
spectively, after Bonferroni correction). As RXRA and NR1H4 (FXR)
are also known regulators of P450s, the SLC10A1! AKR1D1 path is
interesting.
In addition to identifying genes that are predicted to be reg-
ulators of P450s, we also wanted to see which genes in the sub-
network are potential regulators of large numbers of downstream
genes. These more global regulators represent genes that, when
perturbed, could have a major impact on the network that is not
limited to P450s. We identified SLC10A1, AKR1D1, GLYAT, ETNK2,
LIME1, ZGPAT, BTD, ETNK2, KLKB1, FMO3, LIMK2, EHHADH, and
ACSM3 to be the top global regulators, each with over 40 down-
stream nodes. Therefore, SLC10A1, AKR1D1, EHHADH, and ACSM3
were identified as both global regulators and P450 regulators. Fur-
thermore, in the coexpression network discussed earlier, EHHADH,
SLC10A1, and AKR1D1 were present in the same turquoise mod-
ule, and their connectivity measures were ranked high (three, 13,
and 14, respectively) among the 1361 genes within this module.
Thus, there exists certain consistency between the putative regu-
lators identified from the two different network approaches.
In conclusion, the reconstruction of a BN based on the HLC
gene expression and genetic data enabled us to identify two pri-
mary putative regulatory pathways for P450 genes, with upstream
Figure 5. P450 gene regulatory Bayesian subnetwork. (A) A P450 generegulatory subnetwork composed of both the P450 genes and the genesthat are two-edges away from any P450 gene. P450 genes and the knownP450 regulators in the subnetwork are highlighted as red circles and bluesquares, respectively. (B) The same subnetwork highlighted with livergenes responsive to ligands of known regulators of P450s, namely, AHR,CAR, or PXR (Slatter et al. 2006) in mouse (cyan nodes), rat (green nodes),and both species (red nodes). (C ) A pruned P450 subnetwork composedof the key regulators identified in A and their downstream P450 targets.The known regulators and P450 genes are shown as blue rectangles andred ovals, respectively.
Genetics and genomics of human liver P450s
Genome Research 1029www.genome.org
paths SLC10A1!AKR1D1 and EHHADH!ACSM3. Three of these
genes—EHHADH, SLC10A1, and AKR1D1—were also found to be
top hub genes in the P450-correlated turquoise module from the
independent coexpression network. In the literature, EHHADH has
been found to be responsive to ligands of AHR, NR1I3 (CAR), and
NR1I2 (PXR); SLC10A1 is selectively responsive to AHR ligands;
AKR1D1 is selectively responsive to PXR ligands (Slatter et al.
2006). Thus, these three upstream genes represent novel putative
key regulators of P450 genes.
DiscussionIn this study, we conducted a systematic investigation of liver P450
functionality, interconnectivity, and regulatory mechanisms via an
integrated genetic and genomic approach. To our knowledge, this is
the first comprehensive, large-scale study of P450s that involves the
incorporation of genome-wide data from multiple dimensions, in-
cluding genetic, gene expression, enzyme activity, and demographic
factors, from a large HLC consisting of about 500 samples.
In an attempt to address the demographic confounding factors,
we studied the impact of gender and age on P450 enzyme activity
measurements. Previously it has been reported that CYP2E1, 3A4,
1A2, 2A6, and 2B6 are subject to gender influence in humans, but
conflicting results have been obtained (Dhir et al. 2006; Anderson
2008; Scandlyn et al. 2008). Our results support that the activity of
CYP3A4 (but not the others reported) is affected by gender, with
females having higher activity measurement than males. However,
the gender difference in CYP3A4 observed here was moderate and
only reached significance threshold for the activity measurement
using testosterone but not midazolam. One possible explanation for
the lack of consistent observations of sexual dimorphism in human
P450s compared with the extensive reports for rodents (Ahluwalia
et al. 2004; Rinn and Snyder 2005; Yang et al. 2006) could be due to
the genetic heterogeneity and more complex environmental in-
fluences present in human populations. Alternatively, signaling
pathways that magnify sexual dimorphism are generally recog-
nized to be overrepresented in rodents. An additional explanation
is that gender effect varies by age as shown in Supplemental Figure
S3. Thus, when different age groups are represented in different
study populations or when all age groups are considered together,
inconsistent conclusions could be reached. The role of gender in
modifying P450 activity needs to be further explored when there is
opportunity to obtain samples from more homogeneous pop-
ulations to minimize confounding factors.
The effect of age on enzyme activity has been reported for
several major P450s such as CYP2C19, CYP2D6, and CYP3A4 in
humans (Ishizawa et al. 2005; Stevens 2006; Wauthier et al. 2007;
Stevens et al. 2008). However, the lack of an age effect on these
enzymes has also been indicated (Simon et al. 2001; Gorski et al.
2003; Parkinson et al. 2004). Here, we show evidence supporting
the impact of age on CYP2C9 activity and a relatively weak gender-
specific age effect for CYP1A2, CYP2A6, CYP2B6, CYP2C8, and
CYP3A4. Considering a large cohort of about 500 individuals was
used for this study, our results might be representative of the age
influence on P450s in a general population. However, potential
confounding factors such as unequal representation of ages in the
cohort, gender, cause of death, and concomitant disease exist in
the population under investigation.
It is interesting to observe positive correlations between age
and various enzyme activity measurements in adults of age less
than 20, especially in the case of CYP2C9, a main metabolizing
enzyme for warfarin. Current warfarin dosing algorithms adjust
for patient age, with lower doses associated with increasing age,
which seemingly conflicts with the positive correlation between
CYP2C9 activity and age. However, drug metabolism is a complex
process that involves not only P450s but many other contributors.
The current study only addresses oxidative drug biotransforma-
tion by liver microsomes in vitro, whereas warfarin dosage require-
ments in patients are a function of several processes in addition
to oxidative biotransformation, such as absorption, distribution
(changes in plasma protein binding), phase II (conjugation) reac-
tions and excretion, as well as genetic variation in the target of
warfarin action, vitamin K oxidoreductase complex 1 (VKORC1). In
the elderly, this process can be further complicated by blood flow,
diet, poly-pharmacy, obesity, and other chronic disorders. Further-
more, as shown in Supplemental Figure S3, the increase in CYP2C9
activity across the different age bands in adults is subtle, with the
statistical significance mainly driven by the large population size in-
volved in the current study. Therefore, the age-dependent adjustment
for warfarin dose is likely due to factors other than CYP2C9 activity
level and hence does not necessarily conflict with our finding.
When the relationships between P450s were studied at both
the expression and activity levels, we found a general agreement
between the two analyses. That is, most of the P450s are signifi-
cantly correlated with one another. This is likely because P450s
have arisen from a common ancestor gene through gene duplica-
tion and other relevant sequence rearrangement events and hence
may be under similar regulatory control by a limited set of tran-
scription factors (Gibbs et al. 2004). We noticed that the relation-
ship among the P450s did not entirely concur with the sequence
similarity based on phylogeny data (Nelson et al. 2004). For ex-
ample, CYP2C8 and CYP2C9 clustered more closely with CYP2E1
and more remotely with CYP3A4 at the sequence level. However,
at both the expression and enzyme activity levels, CYP3A4 showed
greater similarity to CYP2C8 and CYP2C9 than CYP2E1 did. Thus,
although P450 genes in each family or subfamily have higher se-
quence similarity, their expression and enzymatic activity levels
are not necessarily more closely correlated.
We found that all of the P450 enzyme activity measurements
analyzed were highly correlated with the expression of their cor-
responding coding genes, suggesting strong transcriptional regula-
tion of P450s. We also observed significant correlations between
P450s and many known key regulators, thus validating findings from
the literature as well as the quality of our data. However, the presence
of thousands of genes that correlate with each individual P450 was
somewhat less expected. A possible explanation is that liver P450s
may lie at the center of many endocrine and xenobiotic metabolic
pathways that require crosstalk across numerous nuclear receptor
networks. This is supported by the finding that P450-correlated gene
sets are enriched for highly relevant metabolic pathways such as
lipid, fatty acid, steroid, and amino acid metabolism.
The correlation analyses conducted above mainly focus on
pair-wise relationships. In order to provide a comprehensive view
of how genes are connected as a whole, we also analyzed the con-
nectivity of the transcriptional networks of this cohort. This pro-
vided a basis for the identification of key functional modules within
the networks that contribute to variability of traits of interest. We
have previously described the characterization of transcriptional
coexpression networks based on brain, adipose, and liver tissues in
human and mouse (Gargalovic et al. 2006; Ghazalpour et al. 2006;
Horvath et al. 2006; Lum et al. 2006; Chen et al. 2008; Emilsson
et al. 2008). Building on this approach, we constructed a coex-
pression network based on the human liver tissue data to identify
gene modules. We identified multiple modules demonstrating
Yang et al.
1030 Genome Researchwww.genome.org
functional enrichment that correlated with both P450 expression
and enzyme activity. The turquoise module harbored a majority of
the P450 genes and showed the most significant positive correlation
with P450 traits. Interestingly, three other modules that were highly
correlated with P450s contained genes involved in oxidative stress
and apoptosis such as superoxide dismutase 2 (SOD2), catalase (CAT ),
and caspase 4 (CASP4); acute phase response such as serum amyloid
proteins SAA1, SAA2, and SAA3P and c-reactive protein (CRP); and
translation such as dyskeratosis congenita 1 dyskerin (DKC1),
eukaryotic translation initiation factor 2 subunit 2 (EIF2S2), and
eukaryotic translation elongation factor 1 epsilon 1 (EEF1E1). The
connections between oxidative stress genes as well as acute phase
inflammatory genes with P450s have been noted before (Strolin-
Benedetti et al. 1999; Saitoh et al. 2000; Barouki and Morel 2001),
and the correlation of genes acting in translation with protein levels,
and hence enzyme activity measurements, makes intuitive sense.
As the connectivity levels of the genes within these modules
were found to be positively correlated with their module-to-trait
relevance, we were also able to identify the hubs, or the key genes
in each module. Among the top hub genes in the turquoise mod-
ule, hydroxyacid oxidase 1 (HAO1) and enoyl coenzyme A hy-
dratase 3-hydroxyacyl coenzyme A dehydrogenase (EHHADH ) are
oxidoreductases involved in fatty acid oxidation (Hardwick 2008;
Tomaszewski et al. 2008), and catalase (CAT ) plays a role in free
radical scavenging and attenuates apoptosis. For the other mod-
ules that were correlated with P450 traits, the top hub genes were
mostly acute phase response genes and those involved in trans-
lation as mentioned above. Although these top hub genes may
represent novel regulators of P450s, coexpression modules cannot
differentiate modules that are causally linked to P450s from those
downstream of P450s. This can be partially resolved with the ge-
netic information collected in the same cohort, as discussed below.
Genome-wide association studies between DNA variations and
gene expression or enzyme activity can provide insights into the
genetic regulation of P450s, and genetic information is a useful an-
chor to infer causality (Schadt et al. 2005). In the present setting, the
term causality is used from the standpoint of statistical inference,
where statistical associations between changes in DNA, changes in
expression (or other molecular phenotypes), and changes in com-
plex phenotypes like disease are examined for patterns of statistical
dependency among these variables that support directionality
among them, where the directionality then provides the source of
causal information (highlighting putative regulatory control as
opposed to physical interaction) for further experimental testing.
We identified cis-eSNPs that were associated with the expres-
sion of one-third of the P450s, suggesting that many P450s are
regulated by cis-acting polymorphisms. We also identified aSNPs
that were associated with the enzyme activity measurements for
most of the P450s tested. These lines of evidence suggest that P450s
are under strong genetic control. However, only the cis-eSNPs of
the CYP2D6 gene were coincident with aSNPs of the correspond-
ing enzyme activity, indicating that for many of the other P450s,
the regulatory path from gene transcription to protein translation
to activity is more complicated.
A comparison of the eSNPs and aSNPs with the putative
functional polymorphisms previously reported in the literature
(http://www.cypalleles.ki.se/index.htm) revealed only limited
overlaps. For instance, only the known SNP rs776746 that affects
CYP3A5 activity and Saquinavir pharmacokinetics (Katz et al.
2008) was among our cis-eSNPs. However, when LD was taken into
consideration, 28 additional cis-eSNPs of CYP3A5 were in strong
LD (R2 > 0.6) with rs776746 and thus could be considered as
overlaps. There was no overlap between the aSNPs and the pub-
lished functional SNPs. The limited overlap could result from the
fact that the majority of the literature reports were based on single-
gene analysis, whereas a genome-wide approach was used in our
study, which involved aggressive multiple-testing correction. We
indeed found more overlaps, including CYP2C9*2 (rs1799653,
associated with lower enzyme activity and warfarin response) (Katz
et al. 2008) as an aSNP for CYP2C9 at P = 9.63 3 10�4, CYP3A5*3
(rs776746) as an aSNP for CYP3A4M at P = 8.96 3 10�5, and
CYP4F2*3 (rs2108622) as a cis-eSNP for CYP4F2 at P = 6.63 3 10�5
when a less stringent cutoff of P < 0.05 was considered. An addi-
tional explanation could be that many of the literature findings
were derived from in vitro systems, whereas human tissues were
used in our study (http://www.cypalleles.ki.se/index.htm). More-
over, the SNP coverage of the genotyping panels used in this study
was less than optimal, as these platforms were not designed spe-
cifically for P450 studies but more for genome-wide coverage. Such
design results in insufficient coverage of SNPs in the coding re-
gions of P450s. For example, none of the known SNPs within the
CYP2D6 gene boundary was represented in the Affymetrix and
Ilumina panels, although many of these SNPs within genes were the
focus of published literature studies. All these indicate that our study
covers biological space different from the previous studies, and
hence, any discoveries made in this study are potentially novel. The
fact that we are able to recapitulate the associations between three
CYP2D6 aSNPs and the enzyme activity levels in an independent
cohort supports their true discovery nature, and the identification
of the strong relationship between these aSNPs and known func-
tional variants further highlights their relevance. Validation of the
other newly identified aSNPs and eSNPs is necessary.
It is important to note that in the current manuscript, cis and
trans were used in a more liberal sense, namely, we defined any
aSNP/eSNPs that were within 1-Mb distance of P450 genes as cis-
SNPs, whereas any SNPs out of this range were called trans-SNPs.
These cis- and trans-calls are suggestive of cis- or trans-regulation
but by no means directly demonstrate true cis- or trans-regulation.
By mapping genes with cis-eSNPs and aSNPs to the coex-
pression modules, we were able to differentiate the turquoise and
brown modules as upstream causal modules from the red and pink
modules. The top hub genes from the turquoise and brown mod-
ules were thus candidate regulatory genes for P450s. We also used
a Bayesian inference-based approach and found a similar set of
regulatory genes that included EHHADH, SLC10A1, and AKR1D1.
The validity of the Bayesian P450 subnetwork was supported by (1)
significant enrichment for the previously reported drug response
genes to ligands of known P450 regulators AHR, NR1I3 (CAR), and
NR1I2 (PXR) in two rodent species; and (2) the presence of the
three putative regulators we identified among the drug signatures.
EHHADH is enoyl coenzyme A hydratase 3-hydroxyacyl coenzyme
A dehydrogenase and is known to be involved in fatty acid metab-
olism as well as PPAR signaling (Jia et al. 2003). SLC10A1 is solute
carrier family 10 member 1 and functions as a sodium-dependent
bile acid transporter. It is involved in pathways including LPS IL-1-
induced inhibition of RXR, hepatic cholestasis, and FXR RXR acti-
vation, and therefore plays an important role in the coordinated
regulation of bile acid homeostatis and drug metabolism (Eloranta
and Kullak-Ublick 2005). AKR1D1 is aldo-keto reductase family 1
member D1 and plays a role in bile acid synthesis and steroid hor-
mone metabolism (Lee et al. 2009). These genes are relevant to the
functions and regulatory pathways of P450s, and this study impli-
cates these genes as P450 regulators for the first time. Validation
studies involving perturbation of these genes are underway.
Genetics and genomics of human liver P450s
Genome Research 1031www.genome.org

Even though this study is the first comprehensive survey of
human P450s in a large cohort, there are some limitations to the
interpretation of the data. For example, medication information
was not available for a majority of the individuals in the cohort and
therefore not taken into consideration in the current study. Since
many drugs can be inducers or inhibitors of P450s, noise could
have been introduced to the analyses due to the inability to control
for medication status. We also acknowledge that one of the limi-
tations of BN approach is that feedback regulation cannot be ac-
commodated. In addition, although we have demonstrated the
utility of BNs in predicting how genetic and environmental per-
turbation signals propagate in biological systems in controlled
study populations (Zhu et al. 2004, 2008b; Schadt et al. 2005; Chen
et al. 2008; Yang et al. 2009), the accuracy to infer causal relation-
ships between genes in a random or uncontrolled study design like
the current liver cohort is lower (Wang et al. 2009). Furthermore, the
directionality of the outcome of any perturbation of genes in a
network such as whether the perturbation will raise or lower a phe-
notypic outcome depends on the genetic background and envi-
ronmental conditions due to complex network feedbacks (Davey
Smith and Ebrahim 2003; Chen et al. 2008). Last but not least,
confounding effects from pleiotropy and LD can complicate cau-
sality inference, and the interpretation of causality results can
be further complicated by factors such as morphogenic stability,
developmental adaptation, and canalization (Davey Smith and
Ebrahim 2003; Schadt et al. 2005; Fraser et al. 2010). Therefore,
some of the conclusions should be interpreted with care, and more
follow-up studies are needed to test the hypothesis put forward.
In summary, we conducted a genetic and genomic survey of
the P450 system in a large HLC. We found that P450s were highly
correlated among themselves, with known regulators, and with
thousands of functionally relevant genes. Genetic association anal-
ysis revealed SNPs that are associated with P450 expression and/or
activity measures, with evidence suggestive of both cis-regulation
and more complex trans-regulation. A coexpression module that
contained a majority of P450 genes and several known P450 regu-
lators was found to be most significantly correlated with P450 ex-
pression and activity measures. The same module was also highly
enriched for genes with regulatory SNPs and harbored several novel
candidate P450 regulators that were also identified using a BN ap-
proach. The Bayesian subnetwork identified was highly enriched for
gene signatures elicited by known ligands of P450 regulators.
This study provides broad insights into the regulation of P450
enzymes that underlie the interindividual pharmacokinetic and
pharmacodynamic variability of P450s as well as the disease sus-
ceptibility, drug response, drug–drug interactions, and toxicity as-
sociated with P450s in the general population. The interrelationship
between P450s, the regulatory mechanisms (e.g., novel regulators,
eSNPs, aSNPs), and the networks uncovered may help define ac-
cessible peripheral biomarkers of toxicity or metabolism that are
useful for pharmacokinetic and pharmacodynamic studies during
drug development and for pharmacogenetic studies during post
marketing to stratify populations, enhance drug efficacy, and reduce
adverse effects.
Methods
Human liver cohortAs described previously (Schadt et al. 2008), a total of 780 liversamples (1–2 g) were obtained from Caucasian individuals fromthree independent liver collections at tissue resource centers atVanderbilt University, the University of Pittsburgh, and Merck
Research Laboratories (Slatter et al. 2006). DNA and RNA wereisolated from all liver tissue samples. Of the 780 samples collected,high-quality RNA was successfully isolated and profiled on 466Caucasian subjects. These 466 subjects included the 427 sampleswith successful genotype data described in the previous study(Schadt et al. 2008), 398 samples with enzyme activity measure-ments (25 of these subjects were not genotyped), and 14 subjectswith gene expression data only. The sample size for each individualanalysis varied and was a function of the data intersected in theparticular analysis. For example, 466 samples were involved ingene–gene correlation analysis; 398 samples were used for trait–trait correlation and gene–trait correlation analyses; 427 sampleswere used for eSNP discovery. Age, gender, and ethnicity wereconfirmed or imputed in cases of missing data as described pre-viously (Schadt et al. 2008).
Human liver microsome preparation
Each of the liver samples was processed into cytosol and micro-somes at CellzDirect using a standard differential centrifugationmethod. Frozen liver tissues were thawed on ice in homogenizationbuffer (50 mM Tris at pH 7.4, 150 mM KCl, 2 mM EDTA), homog-enized with a Potter-Elvehjem type tissue grinder, and centrifugedat low speed (;13,000gmax) for 20 min at 4°C to remove plasmamembranes, mitochondria, nuclei, and lysosomes. The resultingsupernatant was centrifuged at high speed (;100,000gmax) for 60min at 4°C to yield a cytosolic fraction and microsomal pellet. Thepellet was resuspended in homogenization buffer, recentrifuged,and resuspended in 0.25 M sucrose with a Potter-Elvehjem tissuegrinder fitted with a Teflon pestle. A small aliquot of the microsomalpreparation was retained for protein determination, and the re-mainder was stored at �70°C. The concentration of microsomalprotein was determined with a bicinchoninic acid kit (BCA proteinassay, Pierce Chemical) based on instructions provided by themanufacturer. The concentration of microsomal protein per gram ofliver tissue was determined. Microsomes were diluted to an equiv-alent concentration before evaluation.
P450 enzyme activity measurements
The activities of CYP1A2, CYP2A6, CYP2B6, CYP2C8, CYP2C9,CYP2C19, CYP2D6, CYP2E1, and CYP3A4 were measured in hu-man liver microsomal preparations at CellzDirect. Two substrateswere used for the CYP3A4 activity measurement: testosterone andmidazolam, with the corresponding enzyme activity designated asCYP3A4T and CYP3A4M, respectively. Microsomal incubationswere performed in triplicate in a final incubation volume of150 mL. The substrate, in 0.1 M phosphate buffer (pH 7.4), wasprewarmed to 37°C with a total organic solvent content of #1%.Microsomal protein was added to a final concentration of ;0.1mg/mL (60.05 mg/mL). Reactions were initiated by addition ofNADPH (1 mM final concentration) and incubated for the in-dicated times with gentle agitation. The rate of substrate turnoverwas linear under these reaction conditions during method vali-dations. Control incubations included pooled human liver mi-crosomes (CellzDirect; pooled from 15 male and female in-dividuals) as positive control samples as well as samples withoutNADPH. The reactions were terminated by the addition of organicsolvent, and internal standards were added, mixed, and centri-fuged at ;3000 rpm for 5 min. The organic layer was transferred toa clean tube and evaporated to dryness at ;40°C under nitrogen.The sample was reconstituted and analyzed by LC-MS/MS.
Metabolite standard curves with eight concentrations wereincluded with each analytical run. In addition, bioanalytical me-tabolite quality control samples (QC) at three concentrations with
Yang et al.
1032 Genome Researchwww.genome.org
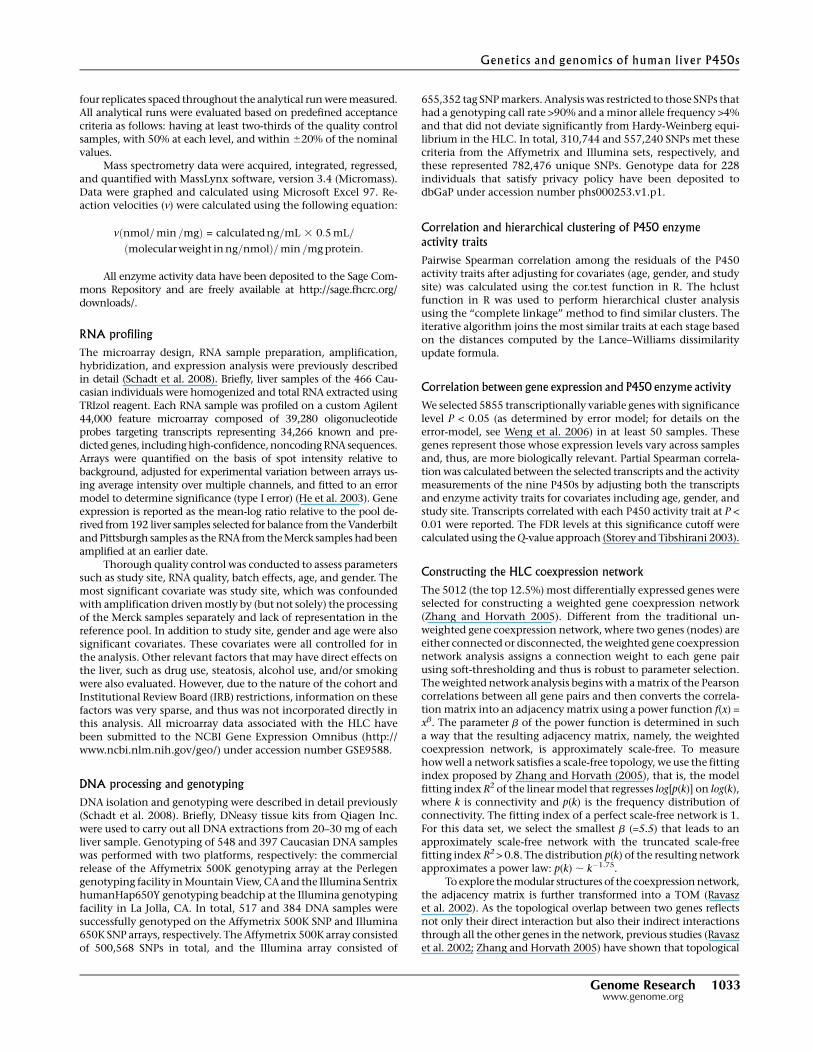
four replicates spaced throughout the analytical run were measured.All analytical runs were evaluated based on predefined acceptancecriteria as follows: having at least two-thirds of the quality controlsamples, with 50% at each level, and within 620% of the nominalvalues.
Mass spectrometry data were acquired, integrated, regressed,and quantified with MassLynx software, version 3.4 (Micromass).Data were graphed and calculated using Microsoft Excel 97. Re-action velocities (v) were calculated using the following equation:
v nmol=min =mgð Þ = calculated ng=mL 3 0:5 mL=
molecular weight in ng=nmolð Þ=min =mg protein:
All enzyme activity data have been deposited to the Sage Com-mons Repository and are freely available at http://sage.fhcrc.org/downloads/.
RNA profiling
The microarray design, RNA sample preparation, amplification,hybridization, and expression analysis were previously describedin detail (Schadt et al. 2008). Briefly, liver samples of the 466 Cau-casian individuals were homogenized and total RNA extracted usingTRIzol reagent. Each RNA sample was profiled on a custom Agilent44,000 feature microarray composed of 39,280 oligonucleotideprobes targeting transcripts representing 34,266 known and pre-dicted genes, including high-confidence, noncoding RNA sequences.Arrays were quantified on the basis of spot intensity relative tobackground, adjusted for experimental variation between arrays us-ing average intensity over multiple channels, and fitted to an errormodel to determine significance (type I error) (He et al. 2003). Geneexpression is reported as the mean-log ratio relative to the pool de-rived from 192 liver samples selected for balance from the Vanderbiltand Pittsburgh samples as the RNA from the Merck samples had beenamplified at an earlier date.
Thorough quality control was conducted to assess parameterssuch as study site, RNA quality, batch effects, age, and gender. Themost significant covariate was study site, which was confoundedwith amplification driven mostly by (but not solely) the processingof the Merck samples separately and lack of representation in thereference pool. In addition to study site, gender and age were alsosignificant covariates. These covariates were all controlled for inthe analysis. Other relevant factors that may have direct effects onthe liver, such as drug use, steatosis, alcohol use, and/or smokingwere also evaluated. However, due to the nature of the cohort andInstitutional Review Board (IRB) restrictions, information on thesefactors was very sparse, and thus was not incorporated directly inthis analysis. All microarray data associated with the HLC havebeen submitted to the NCBI Gene Expression Omnibus (http://www.ncbi.nlm.nih.gov/geo/) under accession number GSE9588.
DNA processing and genotyping
DNA isolation and genotyping were described in detail previously(Schadt et al. 2008). Briefly, DNeasy tissue kits from Qiagen Inc.were used to carry out all DNA extractions from 20–30 mg of eachliver sample. Genotyping of 548 and 397 Caucasian DNA sampleswas performed with two platforms, respectively: the commercialrelease of the Affymetrix 500K genotyping array at the Perlegengenotyping facility in Mountain View, CA and the Illumina SentrixhumanHap650Y genotyping beadchip at the Illumina genotypingfacility in La Jolla, CA. In total, 517 and 384 DNA samples weresuccessfully genotyped on the Affymetrix 500K SNP and Illumina650K SNP arrays, respectively. The Affymetrix 500K array consistedof 500,568 SNPs in total, and the Illumina array consisted of
655,352 tag SNP markers. Analysis was restricted to those SNPs thathad a genotyping call rate >90% and a minor allele frequency >4%and that did not deviate significantly from Hardy-Weinberg equi-librium in the HLC. In total, 310,744 and 557,240 SNPs met thesecriteria from the Affymetrix and Illumina sets, respectively, andthese represented 782,476 unique SNPs. Genotype data for 228individuals that satisfy privacy policy have been deposited todbGaP under accession number phs000253.v1.p1.
Correlation and hierarchical clustering of P450 enzymeactivity traits
Pairwise Spearman correlation among the residuals of the P450activity traits after adjusting for covariates (age, gender, and studysite) was calculated using the cor.test function in R. The hclustfunction in R was used to perform hierarchical cluster analysisusing the ‘‘complete linkage’’ method to find similar clusters. Theiterative algorithm joins the most similar traits at each stage basedon the distances computed by the Lance–Williams dissimilarityupdate formula.
Correlation between gene expression and P450 enzyme activity
We selected 5855 transcriptionally variable genes with significancelevel P < 0.05 (as determined by error model; for details on theerror-model, see Weng et al. 2006) in at least 50 samples. Thesegenes represent those whose expression levels vary across samplesand, thus, are more biologically relevant. Partial Spearman correla-tion was calculated between the selected transcripts and the activitymeasurements of the nine P450s by adjusting both the transcriptsand enzyme activity traits for covariates including age, gender, andstudy site. Transcripts correlated with each P450 activity trait at P <
0.01 were reported. The FDR levels at this significance cutoff werecalculated using the Q-value approach (Storey and Tibshirani 2003).
Constructing the HLC coexpression network
The 5012 (the top 12.5%) most differentially expressed genes wereselected for constructing a weighted gene coexpression network(Zhang and Horvath 2005). Different from the traditional un-weighted gene coexpression network, where two genes (nodes) areeither connected or disconnected, the weighted gene coexpressionnetwork analysis assigns a connection weight to each gene pairusing soft-thresholding and thus is robust to parameter selection.The weighted network analysis begins with a matrix of the Pearsoncorrelations between all gene pairs and then converts the correla-tion matrix into an adjacency matrix using a power function f(x) =
xb. The parameter b of the power function is determined in sucha way that the resulting adjacency matrix, namely, the weightedcoexpression network, is approximately scale-free. To measurehow well a network satisfies a scale-free topology, we use the fittingindex proposed by Zhang and Horvath (2005), that is, the modelfitting index R2 of the linear model that regresses log[p(k)] on log(k),where k is connectivity and p(k) is the frequency distribution ofconnectivity. The fitting index of a perfect scale-free network is 1.For this data set, we select the smallest b (=5.5) that leads to anapproximately scale-free network with the truncated scale-freefitting index R2 > 0.8. The distribution p(k) of the resulting networkapproximates a power law: p(k) ; k�1.75.
To explore the modular structures of the coexpression network,the adjacency matrix is further transformed into a TOM (Ravaszet al. 2002). As the topological overlap between two genes reflectsnot only their direct interaction but also their indirect interactionsthrough all the other genes in the network, previous studies (Ravaszet al. 2002; Zhang and Horvath 2005) have shown that topological
Genetics and genomics of human liver P450s
Genome Research 1033www.genome.org
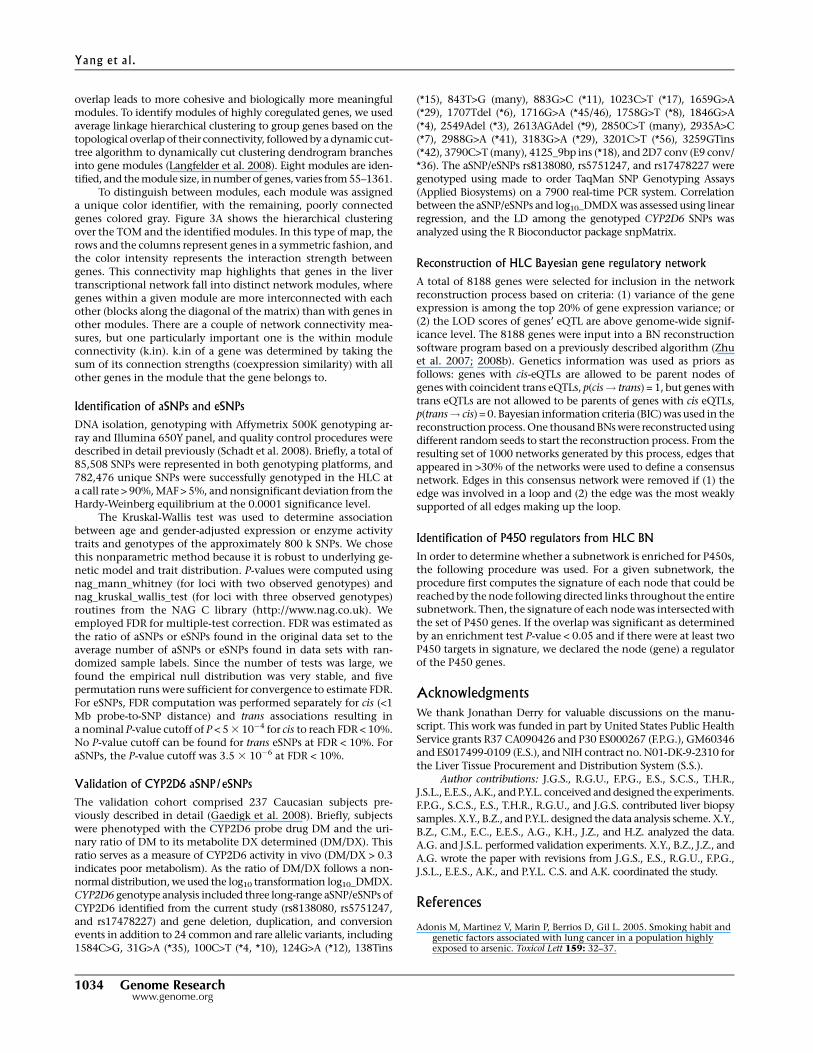
overlap leads to more cohesive and biologically more meaningfulmodules. To identify modules of highly coregulated genes, we usedaverage linkage hierarchical clustering to group genes based on thetopological overlap of their connectivity, followed by a dynamic cut-tree algorithm to dynamically cut clustering dendrogram branchesinto gene modules (Langfelder et al. 2008). Eight modules are iden-tified, and the module size, in number of genes, varies from 55–1361.
To distinguish between modules, each module was assigneda unique color identifier, with the remaining, poorly connectedgenes colored gray. Figure 3A shows the hierarchical clusteringover the TOM and the identified modules. In this type of map, therows and the columns represent genes in a symmetric fashion, andthe color intensity represents the interaction strength betweengenes. This connectivity map highlights that genes in the livertranscriptional network fall into distinct network modules, wheregenes within a given module are more interconnected with eachother (blocks along the diagonal of the matrix) than with genes inother modules. There are a couple of network connectivity mea-sures, but one particularly important one is the within moduleconnectivity (k.in). k.in of a gene was determined by taking thesum of its connection strengths (coexpression similarity) with allother genes in the module that the gene belongs to.
Identification of aSNPs and eSNPs
DNA isolation, genotyping with Affymetrix 500K genotyping ar-ray and Illumina 650Y panel, and quality control procedures weredescribed in detail previously (Schadt et al. 2008). Briefly, a total of85,508 SNPs were represented in both genotyping platforms, and782,476 unique SNPs were successfully genotyped in the HLC ata call rate > 90%, MAF > 5%, and nonsignificant deviation from theHardy-Weinberg equilibrium at the 0.0001 significance level.
The Kruskal-Wallis test was used to determine associationbetween age and gender-adjusted expression or enzyme activitytraits and genotypes of the approximately 800 k SNPs. We chosethis nonparametric method because it is robust to underlying ge-netic model and trait distribution. P-values were computed usingnag_mann_whitney (for loci with two observed genotypes) andnag_kruskal_wallis_test (for loci with three observed genotypes)routines from the NAG C library (http://www.nag.co.uk). Weemployed FDR for multiple-test correction. FDR was estimated asthe ratio of aSNPs or eSNPs found in the original data set to theaverage number of aSNPs or eSNPs found in data sets with ran-domized sample labels. Since the number of tests was large, wefound the empirical null distribution was very stable, and fivepermutation runs were sufficient for convergence to estimate FDR.For eSNPs, FDR computation was performed separately for cis (<1Mb probe-to-SNP distance) and trans associations resulting ina nominal P-value cutoff of P < 5 3 10�4 for cis to reach FDR < 10%.No P-value cutoff can be found for trans eSNPs at FDR < 10%. ForaSNPs, the P-value cutoff was 3.5 3 10�6 at FDR < 10%.
Validation of CYP2D6 aSNP/eSNPs
The validation cohort comprised 237 Caucasian subjects pre-viously described in detail (Gaedigk et al. 2008). Briefly, subjectswere phenotyped with the CYP2D6 probe drug DM and the uri-nary ratio of DM to its metabolite DX determined (DM/DX). Thisratio serves as a measure of CYP2D6 activity in vivo (DM/DX > 0.3indicates poor metabolism). As the ratio of DM/DX follows a non-normal distribution, we used the log10 transformation log10_DMDX.CYP2D6 genotype analysis included three long-range aSNP/eSNPs ofCYP2D6 identified from the current study (rs8138080, rs5751247,and rs17478227) and gene deletion, duplication, and conversionevents in addition to 24 common and rare allelic variants, including1584C>G, 31G>A (*35), 100C>T (*4, *10), 124G>A (*12), 138Tins
(*15), 843T>G (many), 883G>C (*11), 1023C>T (*17), 1659G>A(*29), 1707Tdel (*6), 1716G>A (*45/46), 1758G>T (*8), 1846G>A(*4), 2549Adel (*3), 2613AGAdel (*9), 2850C>T (many), 2935A>C(*7), 2988G>A (*41), 3183G>A (*29), 3201C>T (*56), 3259GTins(*42), 3790C>T (many), 4125_9bp ins (*18), and 2D7 conv (E9 conv/*36). The aSNP/eSNPs rs8138080, rs5751247, and rs17478227 weregenotyped using made to order TaqMan SNP Genotyping Assays(Applied Biosystems) on a 7900 real-time PCR system. Correlationbetween the aSNP/eSNPs and log10_DMDX was assessed using linearregression, and the LD among the genotyped CYP2D6 SNPs wasanalyzed using the R Bioconductor package snpMatrix.
Reconstruction of HLC Bayesian gene regulatory network
A total of 8188 genes were selected for inclusion in the networkreconstruction process based on criteria: (1) variance of the geneexpression is among the top 20% of gene expression variance; or(2) the LOD scores of genes’ eQTL are above genome-wide signif-icance level. The 8188 genes were input into a BN reconstructionsoftware program based on a previously described algorithm (Zhuet al. 2007; 2008b). Genetics information was used as priors asfollows: genes with cis-eQTLs are allowed to be parent nodes ofgenes with coincident trans eQTLs, p(cis! trans) = 1, but genes withtrans eQTLs are not allowed to be parents of genes with cis eQTLs,p(trans! cis) = 0. Bayesian information criteria (BIC) was used in thereconstruction process. One thousand BNs were reconstructed usingdifferent random seeds to start the reconstruction process. From theresulting set of 1000 networks generated by this process, edges thatappeared in >30% of the networks were used to define a consensusnetwork. Edges in this consensus network were removed if (1) theedge was involved in a loop and (2) the edge was the most weaklysupported of all edges making up the loop.
Identification of P450 regulators from HLC BN
In order to determine whether a subnetwork is enriched for P450s,the following procedure was used. For a given subnetwork, theprocedure first computes the signature of each node that could bereached by the node following directed links throughout the entiresubnetwork. Then, the signature of each node was intersected withthe set of P450 genes. If the overlap was significant as determinedby an enrichment test P-value < 0.05 and if there were at least twoP450 targets in signature, we declared the node (gene) a regulatorof the P450 genes.
AcknowledgmentsWe thank Jonathan Derry for valuable discussions on the manu-script. This work was funded in part by United States Public HealthService grants R37 CA090426 and P30 ES000267 (F.P.G.), GM60346and ES017499-0109 (E.S.), and NIH contract no. N01-DK-9-2310 forthe Liver Tissue Procurement and Distribution System (S.S.).
Author contributions: J.G.S., R.G.U., F.P.G., E.S., S.C.S., T.H.R.,J.S.L., E.E.S., A.K., and P.Y.L. conceived and designed the experiments.F.P.G., S.C.S., E.S., T.H.R., R.G.U., and J.G.S. contributed liver biopsysamples. X.Y., B.Z., and P.Y.L. designed the data analysis scheme. X.Y.,B.Z., C.M., E.C., E.E.S., A.G., K.H., J.Z., and H.Z. analyzed the data.A.G. and J.S.L. performed validation experiments. X.Y., B.Z., J.Z., andA.G. wrote the paper with revisions from J.G.S., E.S., R.G.U., F.P.G.,J.S.L., E.E.S., A.K., and P.Y.L. C.S. and A.K. coordinated the study.
References
Adonis M, Martinez V, Marin P, Berrios D, Gil L. 2005. Smoking habit andgenetic factors associated with lung cancer in a population highlyexposed to arsenic. Toxicol Lett 159: 32–37.
Yang et al.
1034 Genome Researchwww.genome.org
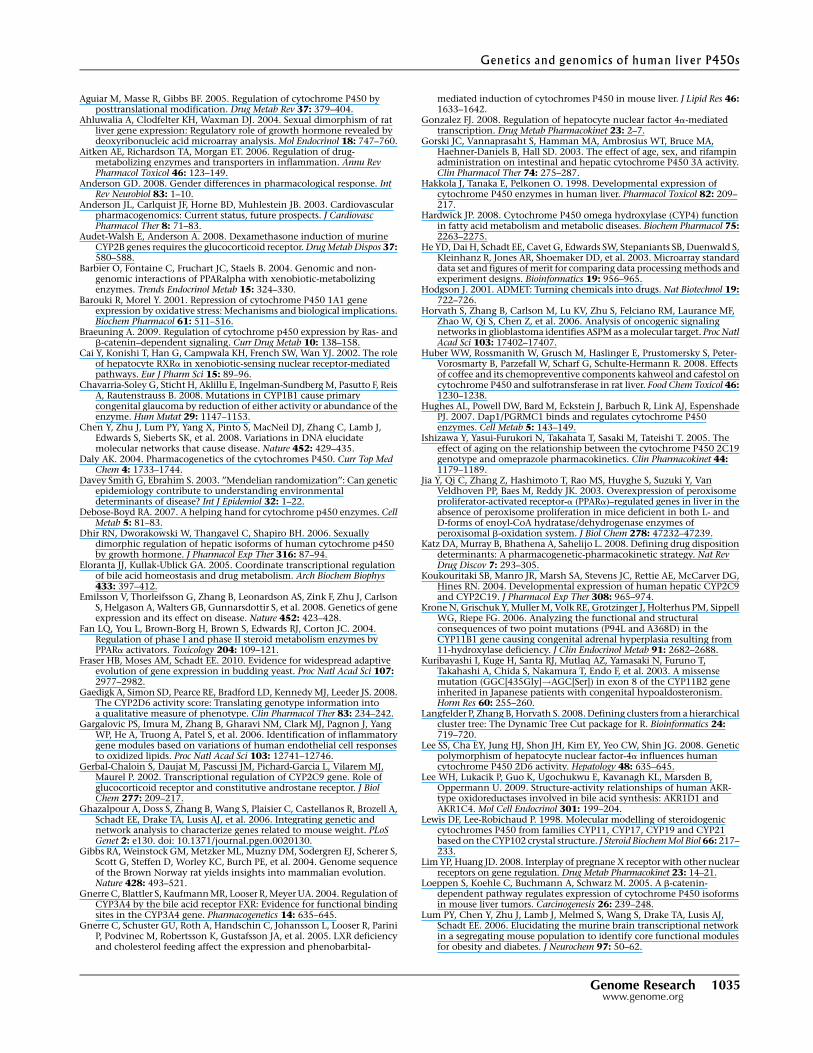
Aguiar M, Masse R, Gibbs BF. 2005. Regulation of cytochrome P450 byposttranslational modification. Drug Metab Rev 37: 379–404.
Ahluwalia A, Clodfelter KH, Waxman DJ. 2004. Sexual dimorphism of ratliver gene expression: Regulatory role of growth hormone revealed bydeoxyribonucleic acid microarray analysis. Mol Endocrinol 18: 747–760.
Aitken AE, Richardson TA, Morgan ET. 2006. Regulation of drug-metabolizing enzymes and transporters in inflammation. Annu RevPharmacol Toxicol 46: 123–149.
Anderson GD. 2008. Gender differences in pharmacological response. IntRev Neurobiol 83: 1–10.
Anderson JL, Carlquist JF, Horne BD, Muhlestein JB. 2003. Cardiovascularpharmacogenomics: Current status, future prospects. J CardiovascPharmacol Ther 8: 71–83.
Audet-Walsh E, Anderson A. 2008. Dexamethasone induction of murineCYP2B genes requires the glucocorticoid receptor. Drug Metab Dispos 37:580–588.
Barbier O, Fontaine C, Fruchart JC, Staels B. 2004. Genomic and non-genomic interactions of PPARalpha with xenobiotic-metabolizingenzymes. Trends Endocrinol Metab 15: 324–330.
Barouki R, Morel Y. 2001. Repression of cytochrome P450 1A1 geneexpression by oxidative stress: Mechanisms and biological implications.Biochem Pharmacol 61: 511–516.
Braeuning A. 2009. Regulation of cytochrome p450 expression by Ras- andb-catenin–dependent signaling. Curr Drug Metab 10: 138–158.
Cai Y, Konishi T, Han G, Campwala KH, French SW, Wan YJ. 2002. The roleof hepatocyte RXRa in xenobiotic-sensing nuclear receptor-mediatedpathways. Eur J Pharm Sci 15: 89–96.
Chavarria-Soley G, Sticht H, Aklillu E, Ingelman-Sundberg M, Pasutto F, ReisA, Rautenstrauss B. 2008. Mutations in CYP1B1 cause primarycongenital glaucoma by reduction of either activity or abundance of theenzyme. Hum Mutat 29: 1147–1153.
Chen Y, Zhu J, Lum PY, Yang X, Pinto S, MacNeil DJ, Zhang C, Lamb J,Edwards S, Sieberts SK, et al. 2008. Variations in DNA elucidatemolecular networks that cause disease. Nature 452: 429–435.
Daly AK. 2004. Pharmacogenetics of the cytochromes P450. Curr Top MedChem 4: 1733–1744.
Davey Smith G, Ebrahim S. 2003. ’’Mendelian randomization’’: Can geneticepidemiology contribute to understanding environmentaldeterminants of disease? Int J Epidemiol 32: 1–22.
Debose-Boyd RA. 2007. A helping hand for cytochrome p450 enzymes. CellMetab 5: 81–83.
Dhir RN, Dworakowski W, Thangavel C, Shapiro BH. 2006. Sexuallydimorphic regulation of hepatic isoforms of human cytochrome p450by growth hormone. J Pharmacol Exp Ther 316: 87–94.
Eloranta JJ, Kullak-Ublick GA. 2005. Coordinate transcriptional regulationof bile acid homeostasis and drug metabolism. Arch Biochem Biophys433: 397–412.
Emilsson V, Thorleifsson G, Zhang B, Leonardson AS, Zink F, Zhu J, CarlsonS, Helgason A, Walters GB, Gunnarsdottir S, et al. 2008. Genetics of geneexpression and its effect on disease. Nature 452: 423–428.
Fan LQ, You L, Brown-Borg H, Brown S, Edwards RJ, Corton JC. 2004.Regulation of phase I and phase II steroid metabolism enzymes byPPARa activators. Toxicology 204: 109–121.
Fraser HB, Moses AM, Schadt EE. 2010. Evidence for widespread adaptiveevolution of gene expression in budding yeast. Proc Natl Acad Sci 107:2977–2982.
Gaedigk A, Simon SD, Pearce RE, Bradford LD, Kennedy MJ, Leeder JS. 2008.The CYP2D6 activity score: Translating genotype information intoa qualitative measure of phenotype. Clin Pharmacol Ther 83: 234–242.
Gargalovic PS, Imura M, Zhang B, Gharavi NM, Clark MJ, Pagnon J, YangWP, He A, Truong A, Patel S, et al. 2006. Identification of inflammatorygene modules based on variations of human endothelial cell responsesto oxidized lipids. Proc Natl Acad Sci 103: 12741–12746.
Gerbal-Chaloin S, Daujat M, Pascussi JM, Pichard-Garcia L, Vilarem MJ,Maurel P. 2002. Transcriptional regulation of CYP2C9 gene. Role ofglucocorticoid receptor and constitutive androstane receptor. J BiolChem 277: 209–217.
Ghazalpour A, Doss S, Zhang B, Wang S, Plaisier C, Castellanos R, Brozell A,Schadt EE, Drake TA, Lusis AJ, et al. 2006. Integrating genetic andnetwork analysis to characterize genes related to mouse weight. PLoSGenet 2: e130. doi: 10.1371/journal.pgen.0020130.
Gibbs RA, Weinstock GM, Metzker ML, Muzny DM, Sodergren EJ, Scherer S,Scott G, Steffen D, Worley KC, Burch PE, et al. 2004. Genome sequenceof the Brown Norway rat yields insights into mammalian evolution.Nature 428: 493–521.
Gnerre C, Blattler S, Kaufmann MR, Looser R, Meyer UA. 2004. Regulation ofCYP3A4 by the bile acid receptor FXR: Evidence for functional bindingsites in the CYP3A4 gene. Pharmacogenetics 14: 635–645.
Gnerre C, Schuster GU, Roth A, Handschin C, Johansson L, Looser R, PariniP, Podvinec M, Robertsson K, Gustafsson JA, et al. 2005. LXR deficiencyand cholesterol feeding affect the expression and phenobarbital-
mediated induction of cytochromes P450 in mouse liver. J Lipid Res 46:1633–1642.
Gonzalez FJ. 2008. Regulation of hepatocyte nuclear factor 4a-mediatedtranscription. Drug Metab Pharmacokinet 23: 2–7.
Gorski JC, Vannaprasaht S, Hamman MA, Ambrosius WT, Bruce MA,Haehner-Daniels B, Hall SD. 2003. The effect of age, sex, and rifampinadministration on intestinal and hepatic cytochrome P450 3A activity.Clin Pharmacol Ther 74: 275–287.
Hakkola J, Tanaka E, Pelkonen O. 1998. Developmental expression ofcytochrome P450 enzymes in human liver. Pharmacol Toxicol 82: 209–217.
Hardwick JP. 2008. Cytochrome P450 omega hydroxylase (CYP4) functionin fatty acid metabolism and metabolic diseases. Biochem Pharmacol 75:2263–2275.
He YD, Dai H, Schadt EE, Cavet G, Edwards SW, Stepaniants SB, Duenwald S,Kleinhanz R, Jones AR, Shoemaker DD, et al. 2003. Microarray standarddata set and figures of merit for comparing data processing methods andexperiment designs. Bioinformatics 19: 956–965.
Hodgson J. 2001. ADMET: Turning chemicals into drugs. Nat Biotechnol 19:722–726.
Horvath S, Zhang B, Carlson M, Lu KV, Zhu S, Felciano RM, Laurance MF,Zhao W, Qi S, Chen Z, et al. 2006. Analysis of oncogenic signalingnetworks in glioblastoma identifies ASPM as a molecular target. Proc NatlAcad Sci 103: 17402–17407.
Huber WW, Rossmanith W, Grusch M, Haslinger E, Prustomersky S, Peter-Vorosmarty B, Parzefall W, Scharf G, Schulte-Hermann R. 2008. Effectsof coffee and its chemopreventive components kahweol and cafestol oncytochrome P450 and sulfotransferase in rat liver. Food Chem Toxicol 46:1230–1238.
Hughes AL, Powell DW, Bard M, Eckstein J, Barbuch R, Link AJ, EspenshadePJ. 2007. Dap1/PGRMC1 binds and regulates cytochrome P450enzymes. Cell Metab 5: 143–149.
Ishizawa Y, Yasui-Furukori N, Takahata T, Sasaki M, Tateishi T. 2005. Theeffect of aging on the relationship between the cytochrome P450 2C19genotype and omeprazole pharmacokinetics. Clin Pharmacokinet 44:1179–1189.
Jia Y, Qi C, Zhang Z, Hashimoto T, Rao MS, Huyghe S, Suzuki Y, VanVeldhoven PP, Baes M, Reddy JK. 2003. Overexpression of peroxisomeproliferator-activated receptor-a (PPARa)–regulated genes in liver in theabsence of peroxisome proliferation in mice deficient in both L- andD-forms of enoyl-CoA hydratase/dehydrogenase enzymes ofperoxisomal b-oxidation system. J Biol Chem 278: 47232–47239.
Katz DA, Murray B, Bhathena A, Sahelijo L. 2008. Defining drug dispositiondeterminants: A pharmacogenetic-pharmacokinetic strategy. Nat RevDrug Discov 7: 293–305.
Koukouritaki SB, Manro JR, Marsh SA, Stevens JC, Rettie AE, McCarver DG,Hines RN. 2004. Developmental expression of human hepatic CYP2C9and CYP2C19. J Pharmacol Exp Ther 308: 965–974.
Krone N, Grischuk Y, Muller M, Volk RE, Grotzinger J, Holterhus PM, SippellWG, Riepe FG. 2006. Analyzing the functional and structuralconsequences of two point mutations (P94L and A368D) in theCYP11B1 gene causing congenital adrenal hyperplasia resulting from11-hydroxylase deficiency. J Clin Endocrinol Metab 91: 2682–2688.
Kuribayashi I, Kuge H, Santa RJ, Mutlaq AZ, Yamasaki N, Furuno T,Takahashi A, Chida S, Nakamura T, Endo F, et al. 2003. A missensemutation (GGC[435Gly]!AGC[Ser]) in exon 8 of the CYP11B2 geneinherited in Japanese patients with congenital hypoaldosteronism.Horm Res 60: 255–260.
Langfelder P, Zhang B, Horvath S. 2008. Defining clusters from a hierarchicalcluster tree: The Dynamic Tree Cut package for R. Bioinformatics 24:719–720.
Lee SS, Cha EY, Jung HJ, Shon JH, Kim EY, Yeo CW, Shin JG. 2008. Geneticpolymorphism of hepatocyte nuclear factor-4a influences humancytochrome P450 2D6 activity. Hepatology 48: 635–645.
Lee WH, Lukacik P, Guo K, Ugochukwu E, Kavanagh KL, Marsden B,Oppermann U. 2009. Structure-activity relationships of human AKR-type oxidoreductases involved in bile acid synthesis: AKR1D1 andAKR1C4. Mol Cell Endocrinol 301: 199–204.
Lewis DF, Lee-Robichaud P. 1998. Molecular modelling of steroidogeniccytochromes P450 from families CYP11, CYP17, CYP19 and CYP21based on the CYP102 crystal structure. J Steroid Biochem Mol Biol 66: 217–233.
Lim YP, Huang JD. 2008. Interplay of pregnane X receptor with other nuclearreceptors on gene regulation. Drug Metab Pharmacokinet 23: 14–21.
Loeppen S, Koehle C, Buchmann A, Schwarz M. 2005. A b-catenin-dependent pathway regulates expression of cytochrome P450 isoformsin mouse liver tumors. Carcinogenesis 26: 239–248.
Lum PY, Chen Y, Zhu J, Lamb J, Melmed S, Wang S, Drake TA, Lusis AJ,Schadt EE. 2006. Elucidating the murine brain transcriptional networkin a segregating mouse population to identify core functional modulesfor obesity and diabetes. J Neurochem 97: 50–62.
Genetics and genomics of human liver P450s
Genome Research 1035www.genome.org
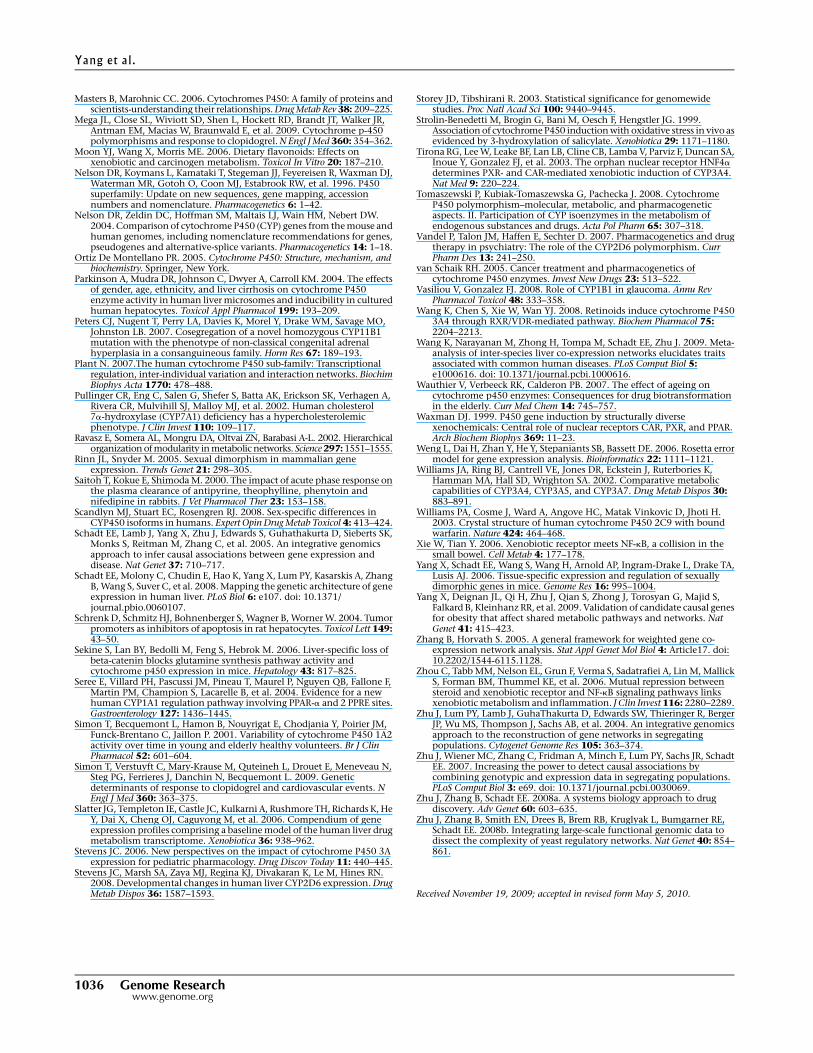
Masters B, Marohnic CC. 2006. Cytochromes P450: A family of proteins andscientists-understanding their relationships. Drug Metab Rev 38: 209–225.
Mega JL, Close SL, Wiviott SD, Shen L, Hockett RD, Brandt JT, Walker JR,Antman EM, Macias W, Braunwald E, et al. 2009. Cytochrome p-450polymorphisms and response to clopidogrel. N Engl J Med 360: 354–362.
Moon YJ, Wang X, Morris ME. 2006. Dietary flavonoids: Effects onxenobiotic and carcinogen metabolism. Toxicol In Vitro 20: 187–210.
Nelson DR, Koymans L, Kamataki T, Stegeman JJ, Feyereisen R, Waxman DJ,Waterman MR, Gotoh O, Coon MJ, Estabrook RW, et al. 1996. P450superfamily: Update on new sequences, gene mapping, accessionnumbers and nomenclature. Pharmacogenetics 6: 1–42.
Nelson DR, Zeldin DC, Hoffman SM, Maltais LJ, Wain HM, Nebert DW.2004. Comparison of cytochrome P450 (CYP) genes from the mouse andhuman genomes, including nomenclature recommendations for genes,pseudogenes and alternative-splice variants. Pharmacogenetics 14: 1–18.
Ortiz De Montellano PR. 2005. Cytochrome P450: Structure, mechanism, andbiochemistry. Springer, New York.
Parkinson A, Mudra DR, Johnson C, Dwyer A, Carroll KM. 2004. The effectsof gender, age, ethnicity, and liver cirrhosis on cytochrome P450enzyme activity in human liver microsomes and inducibility in culturedhuman hepatocytes. Toxicol Appl Pharmacol 199: 193–209.
Peters CJ, Nugent T, Perry LA, Davies K, Morel Y, Drake WM, Savage MO,Johnston LB. 2007. Cosegregation of a novel homozygous CYP11B1mutation with the phenotype of non-classical congenital adrenalhyperplasia in a consanguineous family. Horm Res 67: 189–193.
Plant N. 2007.The human cytochrome P450 sub-family: Transcriptionalregulation, inter-individual variation and interaction networks. BiochimBiophys Acta 1770: 478–488.
Pullinger CR, Eng C, Salen G, Shefer S, Batta AK, Erickson SK, Verhagen A,Rivera CR, Mulvihill SJ, Malloy MJ, et al. 2002. Human cholesterol7a-hydroxylase (CYP7A1) deficiency has a hypercholesterolemicphenotype. J Clin Invest 110: 109–117.
Ravasz E, Somera AL, Mongru DA, Oltvai ZN, Barabasi A-L. 2002. Hierarchicalorganization of modularity in metabolic networks. Science 297: 1551–1555.
Rinn JL, Snyder M. 2005. Sexual dimorphism in mammalian geneexpression. Trends Genet 21: 298–305.
Saitoh T, Kokue E, Shimoda M. 2000. The impact of acute phase response onthe plasma clearance of antipyrine, theophylline, phenytoin andnifedipine in rabbits. J Vet Pharmacol Ther 23: 153–158.
Scandlyn MJ, Stuart EC, Rosengren RJ. 2008. Sex-specific differences inCYP450 isoforms in humans. Expert Opin Drug Metab Toxicol 4: 413–424.
Schadt EE, Lamb J, Yang X, Zhu J, Edwards S, Guhathakurta D, Sieberts SK,Monks S, Reitman M, Zhang C, et al. 2005. An integrative genomicsapproach to infer causal associations between gene expression anddisease. Nat Genet 37: 710–717.
Schadt EE, Molony C, Chudin E, Hao K, Yang X, Lum PY, Kasarskis A, ZhangB, Wang S, Suver C, et al. 2008. Mapping the genetic architecture of geneexpression in human liver. PLoS Biol 6: e107. doi: 10.1371/journal.pbio.0060107.
Schrenk D, Schmitz HJ, Bohnenberger S, Wagner B, Worner W. 2004. Tumorpromoters as inhibitors of apoptosis in rat hepatocytes. Toxicol Lett 149:43–50.
Sekine S, Lan BY, Bedolli M, Feng S, Hebrok M. 2006. Liver-specific loss ofbeta-catenin blocks glutamine synthesis pathway activity andcytochrome p450 expression in mice. Hepatology 43: 817–825.
Seree E, Villard PH, Pascussi JM, Pineau T, Maurel P, Nguyen QB, Fallone F,Martin PM, Champion S, Lacarelle B, et al. 2004. Evidence for a newhuman CYP1A1 regulation pathway involving PPAR-a and 2 PPRE sites.Gastroenterology 127: 1436–1445.
Simon T, Becquemont L, Hamon B, Nouyrigat E, Chodjania Y, Poirier JM,Funck-Brentano C, Jaillon P. 2001. Variability of cytochrome P450 1A2activity over time in young and elderly healthy volunteers. Br J ClinPharmacol 52: 601–604.
Simon T, Verstuyft C, Mary-Krause M, Quteineh L, Drouet E, Meneveau N,Steg PG, Ferrieres J, Danchin N, Becquemont L. 2009. Geneticdeterminants of response to clopidogrel and cardiovascular events. NEngl J Med 360: 363–375.
Slatter JG, Templeton IE, Castle JC, Kulkarni A, Rushmore TH, Richards K, HeY, Dai X, Cheng OJ, Caguyong M, et al. 2006. Compendium of geneexpression profiles comprising a baseline model of the human liver drugmetabolism transcriptome. Xenobiotica 36: 938–962.
Stevens JC. 2006. New perspectives on the impact of cytochrome P450 3Aexpression for pediatric pharmacology. Drug Discov Today 11: 440–445.
Stevens JC, Marsh SA, Zaya MJ, Regina KJ, Divakaran K, Le M, Hines RN.2008. Developmental changes in human liver CYP2D6 expression. DrugMetab Dispos 36: 1587–1593.
Storey JD, Tibshirani R. 2003. Statistical significance for genomewidestudies. Proc Natl Acad Sci 100: 9440–9445.
Strolin-Benedetti M, Brogin G, Bani M, Oesch F, Hengstler JG. 1999.Association of cytochrome P450 induction with oxidative stress in vivo asevidenced by 3-hydroxylation of salicylate. Xenobiotica 29: 1171–1180.
Tirona RG, Lee W, Leake BF, Lan LB, Cline CB, Lamba V, Parviz F, Duncan SA,Inoue Y, Gonzalez FJ, et al. 2003. The orphan nuclear receptor HNF4a
determines PXR- and CAR-mediated xenobiotic induction of CYP3A4.Nat Med 9: 220–224.
Tomaszewski P, Kubiak-Tomaszewska G, Pachecka J. 2008. CytochromeP450 polymorphism–molecular, metabolic, and pharmacogeneticaspects. II. Participation of CYP isoenzymes in the metabolism ofendogenous substances and drugs. Acta Pol Pharm 65: 307–318.
Vandel P, Talon JM, Haffen E, Sechter D. 2007. Pharmacogenetics and drugtherapy in psychiatry: The role of the CYP2D6 polymorphism. CurrPharm Des 13: 241–250.
van Schaik RH. 2005. Cancer treatment and pharmacogenetics ofcytochrome P450 enzymes. Invest New Drugs 23: 513–522.
Vasiliou V, Gonzalez FJ. 2008. Role of CYP1B1 in glaucoma. Annu RevPharmacol Toxicol 48: 333–358.
Wang K, Chen S, Xie W, Wan YJ. 2008. Retinoids induce cytochrome P4503A4 through RXR/VDR-mediated pathway. Biochem Pharmacol 75:2204–2213.
Wang K, Narayanan M, Zhong H, Tompa M, Schadt EE, Zhu J. 2009. Meta-analysis of inter-species liver co-expression networks elucidates traitsassociated with common human diseases. PLoS Comput Biol 5:e1000616. doi: 10.1371/journal.pcbi.1000616.
Wauthier V, Verbeeck RK, Calderon PB. 2007. The effect of ageing oncytochrome p450 enzymes: Consequences for drug biotransformationin the elderly. Curr Med Chem 14: 745–757.
Waxman DJ. 1999. P450 gene induction by structurally diversexenochemicals: Central role of nuclear receptors CAR, PXR, and PPAR.Arch Biochem Biophys 369: 11–23.
Weng L, Dai H, Zhan Y, He Y, Stepaniants SB, Bassett DE. 2006. Rosetta errormodel for gene expression analysis. Bioinformatics 22: 1111–1121.
Williams JA, Ring BJ, Cantrell VE, Jones DR, Eckstein J, Ruterbories K,Hamman MA, Hall SD, Wrighton SA. 2002. Comparative metaboliccapabilities of CYP3A4, CYP3A5, and CYP3A7. Drug Metab Dispos 30:883–891.
Williams PA, Cosme J, Ward A, Angove HC, Matak Vinkovic D, Jhoti H.2003. Crystal structure of human cytochrome P450 2C9 with boundwarfarin. Nature 424: 464–468.
Xie W, Tian Y. 2006. Xenobiotic receptor meets NF-kB, a collision in thesmall bowel. Cell Metab 4: 177–178.
Yang X, Schadt EE, Wang S, Wang H, Arnold AP, Ingram-Drake L, Drake TA,Lusis AJ. 2006. Tissue-specific expression and regulation of sexuallydimorphic genes in mice. Genome Res 16: 995–1004.
Yang X, Deignan JL, Qi H, Zhu J, Qian S, Zhong J, Torosyan G, Majid S,Falkard B, Kleinhanz RR, et al. 2009. Validation of candidate causal genesfor obesity that affect shared metabolic pathways and networks. NatGenet 41: 415–423.
Zhang B, Horvath S. 2005. A general framework for weighted gene co-expression network analysis. Stat Appl Genet Mol Biol 4: Article17. doi:10.2202/1544-6115.1128.
Zhou C, Tabb MM, Nelson EL, Grun F, Verma S, Sadatrafiei A, Lin M, MallickS, Forman BM, Thummel KE, et al. 2006. Mutual repression betweensteroid and xenobiotic receptor and NF-kB signaling pathways linksxenobiotic metabolism and inflammation. J Clin Invest 116: 2280–2289.
Zhu J, Lum PY, Lamb J, GuhaThakurta D, Edwards SW, Thieringer R, BergerJP, Wu MS, Thompson J, Sachs AB, et al. 2004. An integrative genomicsapproach to the reconstruction of gene networks in segregatingpopulations. Cytogenet Genome Res 105: 363–374.
Zhu J, Wiener MC, Zhang C, Fridman A, Minch E, Lum PY, Sachs JR, SchadtEE. 2007. Increasing the power to detect causal associations bycombining genotypic and expression data in segregating populations.PLoS Comput Biol 3: e69. doi: 10.1371/journal.pcbi.0030069.
Zhu J, Zhang B, Schadt EE. 2008a. A systems biology approach to drugdiscovery. Adv Genet 60: 603–635.
Zhu J, Zhang B, Smith EN, Drees B, Brem RB, Kruglyak L, Bumgarner RE,Schadt EE. 2008b. Integrating large-scale functional genomic data todissect the complexity of yeast regulatory networks. Nat Genet 40: 854–861.
Received November 19, 2009; accepted in revised form May 5, 2010.
Yang et al.
1036 Genome Researchwww.genome.org


![Exposure to benzo[a]pyrene of Hepatic Cytochrome P450 Reductase Null (HRN) and P450 Reductase Conditional Null (RCN) mice: Detection of benzo[a]pyrene diol epoxide-DNA adducts by immunohistochemistry](https://static.fdokumen.com/doc/165x107/63259f17c9c7f5721c022d3b/exposure-to-benzoapyrene-of-hepatic-cytochrome-p450-reductase-null-hrn-and-p450.jpg)