Paradoxical Role of Cytochrome P450 3A in the Bioactivation and Clinical Effects of...
21
Clin Pharmacokinet 2005; 44 (7): 731-751 ORIGINAL RESEARCH ARTICLE 0312-5963/05/0007-0731/$34.95/0 2005 Adis Data Information BV. All rights reserved. Paradoxical Role of Cytochrome P450 3A in the Bioactivation and Clinical Effects of Levo-α-Acetylmethadol Importance of Clinical Investigations to Validate In Vitro Drug Metabolism Studies Evan D. Kharasch, 1,2,3 Dale Whittington, 1 Christine Hoffer, 1 Kevin Krudys, 4 Keith Craig, 4 Paolo Vicini, 4 Pam Sheffels 1 and Bojan Lalovic 5 1 Department of Anesthesiology, University of Washington, Seattle, Washington, USA 2 Department of Anesthesiology, Veterans Affairs Puget Sound Health Care System, Seattle, Washington, USA 3 Department of Medicinal Chemistry, University of Washington, Seattle, Washington, USA 4 Department of Bioengineering, University of Washington, Seattle, Washington, USA 5 Department of Pharmaceutics, University of Washington, Seattle, Washington, USA Objective: Levo-α-acetylmethadol (LAAM, levacetylmethadol) is a long-acting Abstract opioid agonist used for the prevention of opioid withdrawal. LAAM undergoes sequential N-demethylation to norLAAM and dinorLAAM, which are more potent and longer-acting than LAAM. Hepatic and intestinal microsomal N-demethylation in vitro is catalysed mainly by cytochrome P450 (CYP) 3A4; however, the role of CYP3A in LAAM disposition in humans in vivo is unknown. This investigation tested the hypothesis that CYP3A induction (or inhibition) would increase (or decrease) LAAM metabolism and bioactivation and, thus, clinical effects. It also related changes in LAAM disposition during enzyme inhibition or induction to any changes in pharmacological effect. Methods: Healthy volunteers (n = 13) completed the three-way, randomised, balanced crossover study. Subjects received oral LAAM (0.25 mg/kg) after CYP3A induction (rifampicin [rifampin]), inhibition (troleandomycin) or nothing (controls). Plasma and urine LAAM, norLAAM and dinorLAAM were deter- mined by electrospray high-performance liquid chromatography/mass spectrome- try (HPLC/MS). Dark-adapted pupil diameter change from baseline (miosis) was the LAAM effect measure. Results were analysed by noncompartmental methods and by a combined pharmacokinetic/pharmacodynamic model. Results: Compared with controls, CYP3A induction (or inhibition) decreased (or increased) plasma LAAM concentrations and mean area under the plasma concen- tration-time curve from time zero to infinity (AUC∞ 199 ± 91 [control] versus 11.3 ± 4.0 [rifampicin] and 731 ± 229 ng • h/mL [troleandomycin]; p < 0.05), and increased (or decreased) median formation clearances of norLAAM (1740 versus 14 100 and 302 mL/h/kg; p < 0.05) and dinorLAAM (636 versus 7840 and 173 mL/h/kg; p < 0.05). Surprisingly, however, CYP3A induction (or inhibition)
-
Upload
independent -
Category
Documents
-
view
0 -
download
0
Transcript of Paradoxical Role of Cytochrome P450 3A in the Bioactivation and Clinical Effects of...

Clin Pharmacokinet 2005; 44 (7): 731-751ORIGINAL RESEARCH ARTICLE 0312-5963/05/0007-0731/$34.95/0
2005 Adis Data Information BV. All rights reserved.
Paradoxical Role of Cytochrome P4503A in the Bioactivation and ClinicalEffects of Levo-α-AcetylmethadolImportance of Clinical Investigations to Validate In VitroDrug Metabolism Studies
Evan D. Kharasch,1,2,3 Dale Whittington,1 Christine Hoffer,1 Kevin Krudys,4Keith Craig,4 Paolo Vicini,4 Pam Sheffels1 and Bojan Lalovic5
1 Department of Anesthesiology, University of Washington, Seattle, Washington, USA2 Department of Anesthesiology, Veterans Affairs Puget Sound Health Care System, Seattle,
Washington, USA3 Department of Medicinal Chemistry, University of Washington, Seattle, Washington, USA4 Department of Bioengineering, University of Washington, Seattle, Washington, USA5 Department of Pharmaceutics, University of Washington, Seattle, Washington, USA
Objective: Levo-α-acetylmethadol (LAAM, levacetylmethadol) is a long-actingAbstractopioid agonist used for the prevention of opioid withdrawal. LAAM undergoessequential N-demethylation to norLAAM and dinorLAAM, which are morepotent and longer-acting than LAAM. Hepatic and intestinal microsomalN-demethylation in vitro is catalysed mainly by cytochrome P450 (CYP) 3A4;however, the role of CYP3A in LAAM disposition in humans in vivo is unknown.This investigation tested the hypothesis that CYP3A induction (or inhibition)would increase (or decrease) LAAM metabolism and bioactivation and, thus,clinical effects. It also related changes in LAAM disposition during enzymeinhibition or induction to any changes in pharmacological effect.Methods: Healthy volunteers (n = 13) completed the three-way, randomised,balanced crossover study. Subjects received oral LAAM (0.25 mg/kg) afterCYP3A induction (rifampicin [rifampin]), inhibition (troleandomycin) or nothing(controls). Plasma and urine LAAM, norLAAM and dinorLAAM were deter-mined by electrospray high-performance liquid chromatography/mass spectrome-try (HPLC/MS). Dark-adapted pupil diameter change from baseline (miosis) wasthe LAAM effect measure. Results were analysed by noncompartmental methodsand by a combined pharmacokinetic/pharmacodynamic model.Results: Compared with controls, CYP3A induction (or inhibition) decreased (orincreased) plasma LAAM concentrations and mean area under the plasma concen-tration-time curve from time zero to infinity (AUC∞ 199 ± 91 [control] versus11.3 ± 4.0 [rifampicin] and 731 ± 229 ng • h/mL [troleandomycin]; p < 0.05), andincreased (or decreased) median formation clearances of norLAAM (1740 versus14 100 and 302 mL/h/kg; p < 0.05) and dinorLAAM (636 versus 7840 and 173mL/h/kg; p < 0.05). Surprisingly, however, CYP3A induction (or inhibition)

732 Kharasch et al.
decreased (or increased) mean plasma metabolite AUC from 0 to 96 hours(AUC96) [norLAAM + dinorLAAM] (859 ± 241 versus 107 ± 48 and 1185 ± 179ng • h/mL; p < 0.05) and clinical effects (mean miosis AUC96 128 ± 40 versus22.5 ± 14.9 and 178 ± 81 mm • h; p < 0.05). Clinical effects were best correlatedwith plasma norLAAM concentrations.Conclusion: CYP3A mediates human LAAM N-demethylation and bioactivationto norLAAM and dinorLAAM in vivo. Paradoxically, however, CYP3A inductiondecreased and inhibition increased LAAM active metabolite concentrations andclinical effects. This suggests a CYP3A-mediated metabolic pathway leading toinactive metabolites, which predominates over CYP3A-dependent bioactivation.These results highlight the need for clinical investigations to validate in vitro drugmetabolism studies.
Levo-α-acetylmethadol (LAAM, levacetyl- bution of LAAM. Perhaps more important were anmethadol) is an analogue of methadone that was unclear potency compared with methadone, andapproved by the US FDA in 1993 for substitution pharmacokinetic issues such as optimal methods fortreatment of opioid dependence.[1] LAAM possesses induction of LAAM therapy, the role of LAAMseveral theoretical advantages compared with meth- metabolites in failed induction and significant drugadone, some of which were clinically verified. interactions.[1,9,10]
LAAM has a longer duration of effect compared The long duration of clinical effects of LAAMwith methadone, enabling less frequent dosage ad- clinical effects is primarily attributed to the forma-ministration (three times weekly rather than daily), tion of active metabolites via sequential N-demethy-and a reduced potential for withdrawal late in the lation to the primary metabolite norLAAM and theninter-dosing interval.[2] Preference studies showed to the secondary metabolite dinorLAAM (figure 1).that a significant proportion of patients preferred The elimination half-lives of LAAM, norLAAMLAAM rather than methadone, citing less withdraw- and dinorLAAM in humans are approximately 0.5,al, fewer adverse effects, less craving, less frequent 1–1.5 and 3–4 days, respectively.[11-13] In addition todosing and clinic visits, and feeling more ‘nor- slower elimination, both N-demethylated metabo-mal’.[2] Treatment outcomes ranged from marginally lites are more potent than LAAM. Based on in vitrobetter to slightly worse than methadone, depending binding assays, norLAAM and dinorLAAM are 15-on criteria such as treatment retention, opioid-posi- to 200-fold and approximately 10-fold more potenttive urine, self-reported illicit drug use and compli- than LAAM, respectively.[14-16] In dogs, in vivo,ance.[2-5] Like methadone, LAAM treatment of norLAAM and dinorLAAM are 6- to 12-fold andopioid abuse was a vital strategy for HIV preven- 1.5- to 3-fold more potent than LAAM, respective-tion.[6] ly.[17] For decades, LAAM was functionally consid-
ered a prodrug, requiring bioactivation via N-Despite these advantages, LAAM use was disap-demethylation. Accordingly, the gradual onset andpointingly low, perhaps due to regulatory and costprolonged action of oral LAAM correlated best withimpediments, initial lack of ‘take-home’ dosing, andthe time course of norLAAM concentrations.[11,18]concerns about ECG effects.[7,8] Specifically, subse-More recently, however, Walsh et al.[13] suggestedquent to the completion of this investigation,[8] thethat LAAM was pharmacologically active when ad-LAAM label was modified (April 2001) to include aministered intravenously and could contribute to‘black box’ warning about QT interval prolongationearly drug effects.and the potential for serious arrhythmias. LAAM
use declined and in August 2003 the manufacturer Sequential N-demethylation of LAAM to itsannounced the discontinuation of the sale and distri- more potent metabolites is catalysed in vitro pre-
2005 Adis Data Information BV. All rights reserved. Clin Pharmacokinet 2005; 44 (7)

CYP3A and LAAM Disposition 733
Methadol
LAAM
p-OH-LAAM
Normethadol
NorLAAM
p-OH-norLAAM
Dinormethadol
DinorLAAM
p-OH-dinorLAAM
†
* *
‡
* *
* *
† †
‡ ‡
Fig. 1. Routes of levo-α-acetylmethadol (LAAM) metabolism in humans and nonhuman primates.[11,19,20] * indicates N-demethylation;† indicates deacetylation; ‡ indicates hydroxylation.
dominantly by cytochrome P450 (CYP) 3A4. This ics, bioactivation and clinical effects. Indeed, micro-CYP3A isoform was the most active CYP in human somal studies predicted that in vivo CYP3A4 induc-liver microsomes, and CYP3A4 was substantially tion would increase metabolism of LAAM tomore active than CYP1A2, 2C9, 2D6 and 2E1.[21] norLAAM and dinorLAAM.[22] Since the intrinsicSubsequent investigations confirmed the predomi- clearances for LAAM and norLAAM were similar,nant role of human CYP3A4 in hepatic LAAM N- CYP3A induction was predicted to increase the con-demethylation at therapeutic concentrations re- centrations of both (more potent) N-demethylatedvealed the atypical pharmacokinetics of CYP3A4- metabolites and enhance LAAM effect. Usingcatalysed metabolism and showed that CYP3A5 microsomal pharmacokinetic parameters and appro-did not appreciably metabolise LAAM or priate scaling, the predicted formation clearance ofnorLAAM.[22,23] These experiments also showed norLAAM was 44, 133 and 15 mL/min/kg, and thatsignificant LAAM N-demethylation by expressed of dinorLAAM was 14, 42 and 5 mL/min/kg underCYP2B6;[22-24] however, there was little apparent control, CYP3A4-induced and CYP3A4-inhibitedCYP2B6 involvement in human hepatic microsomal conditions, respectively.[22]
LAAM metabolism.[22] Oral bioavailability of Nevertheless, the role of CYP3A4 in humanLAAM is 47–48%, indicating significant first-pass LAAM metabolism and disposition in vivo re-metabolism.[13] Human intestinal microsomes also mained unknown. The first aim of this investigationcatalysed LAAM and norLAAM N-demethylation, was to test the hypothesis that CYP3A4 is a majorCYP3A4 was the predominant intestinal CYP CYP isoform responsible for human LAAM metab-isoform and rates of microsomal metabolism were olism in vivo. The second aim was to test the hy-scaled to predict 20–30% intestinal LAAM extrac- pothesis that CYP3A4 is responsible for LAAMtion in vivo.[25] These results suggested that intesti- bioactivation in humans. Since N-demethylationnal metabolism might account for half of the first- bioactivates LAAM to norLAAM (and di-pass LAAM metabolism in humans. norLAAM), the specific hypothesis was that
CYP3A4 induction would increase LAAM bioac-Together, these in vitro results suggested a pre-tivation and clinical effects, while CYP3A4 inhibi-dominant role for intestinal and hepatic CYP3A4 intion would decrease LAAM bioactivation andthe metabolism, bioactivation, elimination andclinical effects. CYP3A induction and selectiveclinical effects of LAAM. Interindividual variabilityinhibition were accomplished with rifampicin (ri-in either intestinal or hepatic CYP3A4 activity andfampin) and troleandomycin, respectively.[26]CYP3A4 drug interactions could account for inter-LAAM effects were determined by the change inindividual variability in oral LAAM pharmacokinet-
2005 Adis Data Information BV. All rights reserved. Clin Pharmacokinet 2005; 44 (7)
734 Kharasch et al.
pupil diameter (miosis). Most information regarding preparations known to alter CYP3A activity. Bothhuman disposition and metabolism of LAAM and its smokers and nonsmokers were enrolled. Subjectsmetabolites derives from traditional noncompart- with a known history of addiction to drugs or alco-mental analyses.[13,19,27] These treat the metabolites hol (ethanol), or with direct physical access to andas independent of the parent compound and are thus routine handling of addicting drugs in the regularincapable of estimating the formation clearances of course of their duties were excluded. Subjects werenorLAAM and dinorLAAM. Furthermore, these instructed to consume no grapefruit-containingmethods have not been able to link the concentration foods or juices for 3 days before each study session,of LAAM or its metabolites to a physiological re- on the study day and the following day, and nosponse. Therefore, a third aim of this investigation alcohol or caffeine for 1 day before each studywas to formulate a combined pharmacokinetic/phar- session and on the study day. Subjects were instruct-macodynamic model to describe the pharmacokinet- ed to eat or drink nothing after midnight before eachics of oral LAAM under normal conditions, as well study session.as during enzyme inhibition or induction, and to The investigational design was a three-way,relate these pharmacokinetics to an observed biolog- randomised, balanced crossover study. Subjectsical effect. The relative opioid µ receptor potencies were studied on three occasions. They were instruct-of LAAM and its N-demethylated metabolites have ed to take rifampicin (600mg orally) in the eveningonly been studied in animals, specifically isolated for 5 consecutive days before the study session, onguinea pig ileum,[14] rat brain[15] and monkey amyg- the study day and for 3 days thereafter. On anotherdaloid tissue.[16] Relative potencies in humans were occasion subjects were instructed to take troleando-unknown; therefore a fourth aim of this investiga- mycin (500mg orally) approximately 3 hours beforetion was to determine the relative binding affinities LAAM administration and then every 12 hours for 4of LAAM, its N-demethylated metabolites and other days. Subjects received no pretreatment before aopioid ligands to human opioid µ receptors, in order third control session. The order of the sessions wasto use these affinities in the pharmacokinetic/phar- randomised and they were separated by at least 1macodynamic model. Finally, we sought to deter- (after control) or 2 (after rifampicin or troleando-mine the accuracy of in vitro metabolism studies of mycin) weeks. Compliance with premedication in-drugs undergoing bioactivation towards predicting structions was not assessed by plasma concentrationin vivo disposition, particularly as might be encoun- measurements.tered in the context of drug development. For each session, a catheter was placed in an arm
vein for blood sampling. Subjects (supine) wereMethods monitored with a pulse oximeter and supplemental
oxygen was ordered for a saturation <92%. Afterbaseline pupil measurements, subjects received in-Clinical Protocoltravenous ondansetron (4mg) and droperidol
This investigation was approved by the Universi- (0.625mg) for anti-nausea prophylaxis. Thirty min-ty of Washington Institutional Review Board and utes later, after baseline measurements (blood sam-carried out in accordance with the Declaration of ple and pupil diameter), subjects received oralHelsinki. Each subject provided written informed LAAM 0.25 mg/kg (0.227 mg/kg free base,consent. Subjects were in good health with no major Orlaam 1, Roxane Laboratories Inc., Columbus,medical problems, within 25% of ideal bodyweight, OH, USA). Blood samples were obtained 0.25, 0.5,had no history of hepatic or renal disease, were 0.75, 1, 2, 3, 4, 5, 6, 8, 10, 12, 24, 48, 72 and 96taking no prescription medications (including oral hours after LAAM administration. Plasma was sepa-contraceptives) and were taking no nonprescription rated and stored at –20°C for later analysis. Dark-
1 The use of trade names is for product identification purposes only and does not imply endorsement.
2005 Adis Data Information BV. All rights reserved. Clin Pharmacokinet 2005; 44 (7)

CYP3A and LAAM Disposition 735
adapted pupil diameter was measured coincident [1,1,1,2,2,3-2H6]-α-acetylmethadol HCl (d6-with blood sampling using a Pupilscan Model 2 LAAM), (–)-[1,1,1,2,2,3-2H6]-α-acetyl-N-infrared pupillometer (Fairville Medical Optics, normethadol HCl (d6-norLAAM), (–)-[1,1,1-2H3]-Inc., Newark, NJ, USA) as described previously.[28] α-acetyl-N,N-dinormethadol HCl (d3-dinorLAAM),The pupil diameter measurement obtained prior to (–)-α-methadol HCl, (–)-α-[1,1,1,2,2-2H5]-antiemetic administration was taken as the baseline methadol HCl (d5-methadol), (–)-α-N-normethadolvalue and was used to calculate pupil diameter perchlorate, (–)-[1,1,1,2,2-2H5]-α-N-normethadolchange at each timepoint. Subjects were fed a stan- perchlorate (d5-normethadol), (–)-α-N,N-di-dard breakfast 2 hours after LAAM administration normethadol maleate and (–)-[1,1,1,2,2-2H5]-α-and had free access to food and water thereafter. N,N-dinormethadol maleate (d5-dinormethadol)Continuous urine samples were collected at 24, 48, were obtained from the National Institute of Drug72 and 96 hours. Abuse (Rockville, MD, USA). High-performance
Sample size was determined using a simplified liquid chromatography (HPLC)-grade methyl alco-analysis (paired t-test) for comparing the primary hol (methanol) and acetonitrile were purchased fromoutcome variable, and LAAM metabolite plasma Fisher Scientific (Pittsburgh, PA, USA), ammoniumconcentrations between the control and rifampicin- hydroxide was obtained from J.T. Baker (Phillips-or troleandomycin-treated subjects. Although burg, NJ, USA), trifluoroacetic acid was obtainedintraindividual variability in LAAM metabolite con- from Fluka Chemical Corp. (Milwaukee, WI, USA),centrations and response to CYP3A induction/inhi- and Oasis MCX (1cc, 30mg) solid-phase extrac-bition was not known, differences in clearance for tion (SPE) cartridges were obtained from Watersthe CYP3A substrate and opioid alfentanil with and Corp. (Milford, MA, USA). All stock drug solu-without rifampicin were known.[29,30] The standard tions, buffers and HPLC mobile phase were pre-deviation of individuals’ changes was approximate- pared using Milli-Q grade water (Millipore Corp.,ly one-quarter the magnitude of the mean change Bedford, MA, USA).induced by rifampicin (approximately a 3-fold in-
Subject plasma, calibration or quality controlcrease over control). Assuming a similar relation-samples (0.5mL) were added to glass tubes, fol-ship between the mean and standard deviation oflowed by the internal standard mix (25µL, contain-changes observed for LAAM metabolite plasmaing 10ng d6-LAAM, 2ng d6-norLAAM and 2ng d3-concentrations, 12 subjects would provide >95%dinorLAAM), 10µL phosphoric acid and 400µLpower, at the α = 0.01 level, to detect a changewater. Samples were vortexed for 2 minutes theninduced by rifampicin. Troleandomycin was ex-loaded (0.5 mL/min) onto Oasis MCX SPE car-pected to produce similar changes. Given the largetridges, which were washed (with 1mL each 0.1Neffects expected, a smaller cohort might have suf-hydrochloric acid then methyl alcohol), dried underficed for the formal testing of the hypothesis ofvacuum for 2 minutes and then analytes eluted bytreatment effect; however, it was also of interest togravity (1mL 5% ammonium hydroxide in methylobtain reasonably precise estimates of the means inalcohol). Samples were evaporated to drynessthe control, induced and inhibited states. With 12(TurboVap LV, Zymark Corp., Hopkington, MA,observations, the standard error of the mean esti-USA) at 45°C under nitrogen, reconstituted withmate was expected to be 0.29-fold the sample stan-50µL methyl alcohol (0.05% trifluoroacetic ac-dard deviation.id) : water (0.05% trifluoroacetic acid) [30 : 70] andtransferred to autosampler vials for analysis. Cali-Analytical Methodsbration curves were obtained by analysing drug-freeplasma fortified with LAAM (0.5, 1, 2, 5, 15, 50,(–)-α-Acetylmethadol HCl (LAAM), (–)-α-ace-100 and 200 ng/mL), norLAAM and dinorLAAMtyl-N-normethadol HCl (norLAAM), (–)-α-acetyl-(0.2, 0.5, 1, 2, 5, 7.5, 10 and 15 ng/mL). QualityN,N-dinormethadol HCl (dinorLAAM), (–)-
2005 Adis Data Information BV. All rights reserved. Clin Pharmacokinet 2005; 44 (7)

736 Kharasch et al.
control samples (2, 15 and 100 ng/mL LAAM, and hol (0.05% trifluoroacetic acid) over 3 minutes,maintained at 90% for 2 minutes, returned to 55%1, 5 and 10 ng/mL norLAAM and dinorLAAM)and re-equilibrated for 4 minutes. Retention timeswere prepared from separate dilutions of stocks thanwere 4.7, 4.9 and 5.1 minutes for LAAM, norLAAMthose used for the calibration curves.and dinorLAAM, respectively. For urine (5µL injec-Subject urine, calibration or quality control sam-tions), the mobile phase was an acetonitrile (0.05%ples (0.1mL) were added to glass tubes, followed bytrifluoroacetic acid) : water (0.05% trifluoroaceticthe internal standard mix (25µL containing 5ng d6-acid) gradient (40 : 60) at 0.25 mL/min. The initialLAAM, 1ng d6-norLAAM and 1ng d3-di-composition was increased to 55% acetonitrile overnorLAAM), 10µL phosphoric acid and 900µL3 minutes, then to 90% over 0.5 minutes, held atwater, and analysed as described for plasma, except90% for 0.5 minutes, decreased back to 40% overthat an extra wash step using methyl alcohol (with0.5 minutes and re-equilibrated for 4 minutes. Re-5% ammonium hydroxide) : water (55 : 45) wastention times were 2.1, 2.4 and 2.7 minutes forused to remove more abundant interferences prior toLAAM, norLAAM and dinorLAAM, respectively.sample elution. Evaporated samples were reconsti-
LAAM, norLAAM and dinorLAAM were quan-tuted with 50µL of acetonitrile (0.05% trifluo-tified using standard curves of peak area ratios ver-roacetic acid) : water (0.05% trifluoroacetic acid)sus analyte concentration. For plasma, interday co-[20 : 80]. Calibration curves were obtained byefficients of variation were 5, 2 and 2% (2, 15 andanalysing drug-free urine fortified with LAAM (4,100 ng/mL LAAM, respectively); 9, 3 and 4% (1, 58, 12, 20, 40, 80, 100, 200, 300 and 500 ng/mL)and 10 ng/mL norLAAM, respectively); and 11, 7norLAAM and dinorLAAM (20, 40, 60, 100, 200,and 6% (1, 5 and 10 ng/mL dinorLAAM, respective-400, 600, 1000, 1500 and 2000 ng/mL). Qualityly). For urine, interday coefficients of variation were
control samples (8, 40 and 200 ng/mL LAAM; 40,6, 4 and 4% (8, 40 and 200 ng/mL LAAM, respec-
200 and 1000 ng/mL norLAAM and dinorLAAM)tively); 4, 4 and 4 (40, 200 and 1000 ng/mL
were prepared as described for plasma.norLAAM, respectively); and 9, 4 and 1% (40, 200
HPLC/mass spectrometry (MS) analysis was per- and 1000 ng/mL dinorLAAM, respectively). Extrac-formed with an Agilent (Palo Alto, CA, USA) 1100 tion recovery exceeded 57% for all analytes. Theseries instrument with a binary solvent delivery sys- samples of each subject (three sessions) weretem, autosampler, Zorbax Eclipse XDB-C18 HPLC analysed together.column (2.1 × 50mm; 5µm) and an Eclipse XDB-C8(2.1 × 12.5mm; 5µm) guard column. The HPLC/MS Opioid Binding to Recombinant Humanwas operated in positive electrospray ionisation Opioid µ Receptorsmode using the following parameters: nitrogen dry-ing gas at 325°C and 6 or 8 L/min (plasma and urine LAAM, LAAM metabolites and the metha-analysis, respectively), nebuliser pressure 20 psig, done metabolite 2-ethylidene-1,5-dimethyl-3,3-capillary voltage 5000V, fragmentor at 50V and diphenylpyrrolidine (EDDP) were obtained from theselected ion monitoring (SIM) resolution set to high. National Institute of Drug Abuse (Rockville, MD,Ions monitored were d0- and d6-LAAM (m/z 354.4 USA) and morphine and fentanyl were obtainedand 360.4, respectively), d0- and d6-norLAAM (m/z from Sigma Chemical Co., St Louis, MO, USA.340.4 and 346.4, respectively), and d0- and d3- Ligand binding of LAAM, LAAM metabolites anddinorLAAM (m/z 326.4 and 329.4, respectively). other opioids to Chinese hamster ovary cell mem-For plasma (15µL injections), the mobile phase was branes expressing recombinant human opioid µ re-a methyl alcohol (0.05% trifluoroacetic acid) : water ceptors (Perkin-Elmer Life Science, Boston, MA,(0.05% trifluoroacetic acid) gradient (55 : 45) at USA) was measured by [3H]-diprenorphine (Perkin-0.25 mL/min. Initial conditions (55 : 45) were main- Elmer Life Science) displacement. Competitive in-tained for 1 minute, increased to 90% methyl alco- hibition of 0.4 nmol/L [3H]-diprenorphine binding
2005 Adis Data Information BV. All rights reserved. Clin Pharmacokinet 2005; 44 (7)

CYP3A and LAAM Disposition 737
(dissociation constant [Kd] 0.1 nmol/L) to mem- in figure 2. Disposition of LAAM was characterisedbranes (20 µg/mL) by LAAM, norLAAM, di- by an open two-compartment model. NorLAAMnorLAAM, methadone, EDDP, morphine and and dinorLAAM also followed two-compartmentfentanyl (10–4 to 10–11 mol/L) was carried out in 50 pharmacokinetics, along with first-order formationmmol/L Tris buffer with 1 mmol/L ethylene glycol from LAAM and norLAAM, respectively. An intes-tetraacetic acid (EGTA) [pH 7.4] for 1 hour at 25°C tinal compartment including a delay was appendedin a 96-well plate (total volume 400µL). Nonspecif- to the model in order to reflect oral administration.ic binding was determined in the presence of nal- The absorption rate constant (Ka) is equal to twotrexone 10 µmol/L. Transfer of bound [3H]-dipre- divided by the lag time, where the number two refersnorphine onto 96-well glass-fibre GF/B filters was to the number of compartments comprising the de-achieved using a 96-well plate cell harvester (Pack- lay. For model simplicity, the volumes of distribu-ard FilterMate, Meriden, CT, USA) under reduced tion of norLAAM and dinorLAAM were assumed topressure and washed with 400µL incubation buffer. be identical. Model parameters were identified usingGF/B filters were presoaked with 0.1 mg/mL bovine the three datasets of each individual (control, trole-serum albumin and 0.2% polyethyleneimine in incu- andomycin and rifampicin) simultaneously. Inter-bation buffer. Bound radioactivity on filters was compartmental rate constants (K21, K12, K43, K34,determined by liquid scintillation counting (Packard K56 and K65) and the volumes of distribution ofNXT scintillation counter). Experiments were per- norLAAM and dinorLAAM were assumed to beformed in duplicate, at least twice for each ligand. unaffected by pretreatment with troleandomycin orBinding constants (inhibition constant [Ki]) were rifampicin and were therefore set to be equal on theobtained by nonlinear regression of fractional [3H]- three study occasions. We found a similar assump-diprenorphine displacement versus ligand concen- tion on the volume of distribution of LAAM to betration using the Gaddum equation (SAAM II, ver- inadequate in accurately predicting the plasma timesion 1.1, University of Washington, Seattle, WA, course of LAAM concentrations and therefore al-USA). lowed this parameter to change with troleandomycin
or rifampicin pretreatment. All other parameterswere similarly allowed to vary between the threePharmacokinetic Analysisstudy sessions. To ensure identifiability of the
Plasma LAAM and metabolite data were anal- model, urine data were used to specify the elimina-ysed using noncompartmental methods (WinNonlin tion rate constants (Ke) from the LAAM and4.01, Pharsight Corporation, Mountain View, CA, norLAAM compartments. Urinary clearances ofUSA). Apparent renal or formation clearance was LAAM or norLAAM (CLi) from these compart-calculated as the product of the fraction of the dose ments were determined by equation 1:recovered in urine and apparent oral clearance (CL/F). Pupil diameter data (miosis) were also analysed AUC96
X96CLi =
using noncompartmental methods, as previously de-(Eq. 1)scribed.[28]
Pharmacokinetic/pharmacodynamic model where X96 is the amount in urine from 0 to 96 hoursbuilding was performed using the SAAM II soft- and AUC96 is the area under the plasma concentra-ware,[31] fitting pharmacokinetic and pharmacody- tion-time curve from 0 to 96 hours. These clearancenamic data simultaneously for each individual. A values were used to fix the elimination rates fromsingle structural model was developed to describe the LAAM and norLAAM compartments (Ke,LAAMthe complex pharmacokinetics and metabolism of and Ke,norLAAM). The parameters estimated were,LAAM under normal conditions and also during therefore, the rate constants (K21, K12, K43, K34,CYP3A inhibition or induction. The pharmacokinet- K65 and K56, formation rate constant Kf,norLAAM,ic model of LAAM and its two metabolites is shown Kf,dinorLAAM, Ke,dinorLAAM), the two apparent
2005 Adis Data Information BV. All rights reserved. Clin Pharmacokinet 2005; 44 (7)

738 Kharasch et al.
Gut DelayKa
1LAAM
3norLAAM
2
4
6
K12
K21
K34
K43
K56
K655
dinorLAAM
Kf,norLAAM
Kf,dinorLAAM
Ke,LAAM
Ke,norLAAM
Ke,dinorLAAM
Fig. 2. Compartmental model describing the pharmacokinetics of orally administered levo-α-acetylmethadol (LAAM). Compartments 1, 3and 5 represent plasma concentrations of LAAM, norLAAM and dinorLAAM, respectively. Compartments 2, 4 and 6 represent theirrespective peripheral distribution compartments. Dose is administered into the intestinal compartment, experiencing a delay before reachingplasma. Rate constants are absorption rate (Ka), the LAAM absorption rate from the gut to the plasma, intercompartmental rate constantsK21, K12, K43, K34, K65 and K56, rate constants of formation for norLAAM (Kf,norLAAM) and dinorLAAM (Kf,dinorLAAM) and elimination rateconstants Ke,LAAM, Ke,norLAAM, and Ke,dinorLAAM
volumes of distribution (V/FLAAM and V/FnorLAAM) and the delay time (lag) between dosing )( 50
max
CEC
CEEE 0
+
´
-=
and appearance of LAAM in plasma. Model derived(Eq. 2)pharmacokinetic parameters were the formation
where E is the pupil diameter, E0 is the baselineclearances (CLf) of norLAAM and dinorLAAM,diameter, C is the plasma concentration, Emax is theelimination clearance (CLel) and the Ka of di-maximum effect attributable to the compound andnorLAAM. Clearances in the mamillary model wereEC50 is the concentration that produces 50% ofdefined as the pharmacokinetic rate constant formaximum effect. Adding an effect compartmentformation or elimination multiplied by the volumeremote from plasma resulted in a deterioration of theof distribution, which was different from that used infits and, in some cases, unreasonable parameter esti-the noncompartmental model.mates, thus plasma concentrations, were used. Since
An ordinary maximum effect (Emax) model was LAAM and its metabolites might all contribute toused to describe the pharmacodynamic data. The drug effects, a composite Emax model using multipleeffect, pupil diameter, was characterised by the fol- active compounds was considered, but was not iden-lowing equation (equation 2): tifiable from the data. Therefore, an ordinary Emax
2005 Adis Data Information BV. All rights reserved. Clin Pharmacokinet 2005; 44 (7)

CYP3A and LAAM Disposition 739
model was tested using LAAM, norLAAM or di- ANOVA, followed by the Student Newman-KeulsnorLAAM as the sole species responsible for mio- test was used to assess the significance of differ-sis, regardless of the experimental conditions (con- ences between groups (SigmaStat, Systat Corp.,trol, troleandomycin and rifampicin). The one that Point Richmond, CA, USA). Results are typicallyconsistently provided the best fit to the individual reported as the mean ± SD. AUC ratios with anddatasets, judged by visual inspection of residuals without the interacting drug (relative to control)plots and the Akaike Information Criterion (AIC) were also used to assess the differences betweenvalue, was accepted. An additive error was assumed groups using the geometric mean ratio and the 90%for the pupil diameter measurements. The parame- confidence interval, calculated with the statisticalters estimated were EC50, Emax and E0. These were functions in WinNonlin. Owing to high coefficientsfit assuming equivalence for all three study sessions, of variation and non-normally distributed results forand also individually. the compartmental analysis, results are shown as the
median (25th and 75th percentile). Statistical signif-Statistical Analysis icance was assigned at p < 0.05.
The primary outcome measure was plasma con-Resultscentrations of LAAM and the active metabolites
norLAAM and dinorLAAM. Secondary outcomemeasures were LAAM apparent oral clearance, half- Study Populationlife and volume of distribution; AUC of LAAM,norLAAM and dinorLAAM; plasma and urine Sixteen subjects were enrolled. Three subjectsAUCLAAM/AUCnorLAAM+dinorLAAM parent/metab- did not complete the study owing to intolerableolite ratios, pupil diameter, and area under the curve nausea. The 13 subjects (eight males, five females)of pupil diameter versus time. Repeated measures completing the study were 26 ± 4 years in age,
Log ligand concentration (mol/L)
Frac
tiona
l dis
plac
emen
t
0
0.2
0.4
0.6
0.8
1.0
−12 −11 −10 −9 −8 −7 −6 −5 −4
LAAMnorLAAMdinorLAAM
Fig. 3. Opioid binding to recombinant human opioid µ receptors. Ligand binding of levo-α-acetylmethadol (LAAM) and LAAM metabolites torecombinant human opioid µ receptors was measured by competitive [3H]-diprenorphine (0.4 nmol/L) displacement. Binding constants(table I) were obtained by nonlinear regression of fractional [3H]-diprenorphine displacement vs ligand concentration using the Gaddumequation. Results are mean ± SD of at least two duplicate experiments.
2005 Adis Data Information BV. All rights reserved. Clin Pharmacokinet 2005; 44 (7)

740 Kharasch et al.
bition. Despite induction of CYP3A and, presuma-bly, LAAM N-demethylation, rifampicin pretreat-ment markedly decreased both plasma norLAAMand dinorLAAM concentrations. The Cmax fornorLAAM and, to a lesser extent, dinorLAAM wasdiminished, while AUC96 was substantially de-creased (17- and 6-fold, respectively). Furthermore,despite inhibition of CYP3A and, presumably,LAAM N-demethylation, troleandomycin pretreat-ment actually increased norLAAM AUC (althoughCmax was decreased). The complex metabolism andpharmacokinetics caused by troleandomycin inhibi-
Table I. Binding of opioid receptor ligands to recombinant humanopioid µ receptorsa
Ligand Ki (nmol/L)b
LAAM 4.72 ± 0.30
norLAAM 0.15 ± 0.01
dinorLAAM 0.37 ± 0.02
Methadone 0.37 ± 0.03
EDDP 134 ± 9
Morphine 0.89 ± 0.08
Fentanyl 0.36 ± 0.10
a Values are mean ± SD.
b For displacement of [3H]-diprenorphine.
EDDP = 2-ethylidene-1,5-dimethyl-3,3-diphenylpyrrolidine; Ki =inhibition constant; LAAM = levo-α-acetylmethadol.
tion of CYP3A are evident from the time course ofdinorLAAM concentration, which accumulated dur-
weighed 77 ± 14kg and had a body mass index of 25 ing the post-administration period.± 4 kg/m2. They received 17.5 ± 3.3mg LAAM
Initial estimates of metabolite pharmacokinetics(base). Pupil data were not obtained for the controlwere based on noncompartmental analysis.[32,33]
session in one of the 13 subjects.NorLAAM concentrations were apparently forma-tion-rate limited under all conditions, while this wasOpioid Binding to Recombinant Humannot observed for dinorLAAM. Owing to the largeOpioid µ Receptorsportion of the AUC from time zero to infinity
LAAM, norLAAM and dinorLAAM were sat- (AUC∞) for dinorLAAM estimated by extrapola-urably bound to human opioid µ receptors, evi- tion, AUC96 was used to determine metabo-denced by [3H]-diprenorphine displacement (figure lite : parent AUC ratios (figure 5). Rifampicin3). Ki values for LAAM, norLAAM and di- significantly increased the dinorLAAM/LAAM,norLAAM were 4.72 ± 0.30, 0.15 ± 0.01 and 0.37 ± dinorLAAM/norLAAM and (norLAAM + di-0.02 nmol/L, respectively, indicating that the mono norLAAM)/LAAM AUC ratios, while troleando-and didemethylated metabolites were 31- and 13- mycin significantly decreased the norLAAM/fold more potent than LAAM, respectively (table I). LAAM, dinorLAAM/LAAM, dinorLAAM/Ki values for other opioids are also provided in norLAAM and (norLAAM + dinorLAAM)/LAAMtable I. AUC ratios.
Urinary excretion parallelled plasma concentra-Influence of Cytochrome P450 (CYP) 3Ations (table III). Total recovery averaged 16% inModulation on Levo-α-Acetylmethadolcontrols, consistent with previous observations.[19]
(LAAM) DispositionThis decreased to 2% in subjects treated withrifampicin and increased to 25% in subjects treatedPlasma concentrations of LAAM, norLAAM andwith troleandomycin. LAAM renal clearance wasdinorLAAM in subjects with normal, induced andunchanged by CYP3A modulation. Changes ininhibited CYP3A activity are shown in figure 4. AsnorLAAM formation clearance did not reach statis-expected, LAAM disposition was significantly al-tical significance. Formation clearance of di-tered by rifampicin and troleandomycin, with anorLAAM was significantly increased and de-7-fold decrease and 2- to 3-fold increase, respective-creased, respectively, by rifampicin and troleando-ly, in LAAM peak plasma concentrations (Cmax)mycin, as was the formation clearance of summed[table II]. Changes in AUC96 were even greater,N-demethylated metabolites (norLAAM + di-with a 19-fold decrease and a 3- to 4-fold increase,
respectively, following CYP3A induction and inhi- norLAAM).
2005 Adis Data Information BV. All rights reserved. Clin Pharmacokinet 2005; 44 (7)

CYP3A and LAAM Disposition 741
Influence of CYP3A Modulation on LAAM with troleandomycin. Miosis tmax (figure 6) oc-Pupillary Effects curred much later than the tmax for plasma LAAM
concentration (figure 4). Return to baseline pupildiameter occurred after 72, 24 and 96 hours in theThe time course of pupil diameter change fromcontrol, rifampicin- and troleandomycin-treatedbaseline (miosis) after oral LAAM administrationsubjects. Miosis AUC was significantly decreasedunder the three different regimens is shown in figureby CYP3A induction and significantly increased by6, and corresponding pseudopharmacokinetic pa-CYP3A inhibition. The terminal rate constants forrameters are provided in table IV. After rifampicinmiosis (table IV) and LAAM elimination (table II)induction, pupil diameters showed little change andwere similar.returned quickly to baseline. Although similar maxi-
mum effects were observed in control and trole- The experimental protocol was safely conductedandomycin-treated subjects, miosis was prolonged without serious adverse events. Significant respira-by CYP3A inhibition. Using time-specific mea- tory depression, defined as an oxygen saturationsures, subjects in all groups showed a similar time to <92% and need for supplemental oxygen, did notpeak effect (5–10 hours), although overall time to occur in any subject. Treatment of nausea and/orreach Cmax (tmax) differed for the subjects treated vomiting was required in 12, 5 and 10 subjects in the
LAA
M (
ng/m
L)
0
10
20
30
40
50
Time (h)
0 24 48 72 96
norL
AA
M (
ng/m
L)
0
5
10
15
20
25ControlRifampicinTroleandomycin
Time (h)
0 24 48 72 96
Time (h)
dino
rLA
AM
(ng
/mL)
0
2
4
6
8
10
967248240
a b
c
Fig. 4. Plasma concentrations of (a) levo-α-acetylmethadol (LAAM), (b) norLAAM and (c) dinorLAAM after administration of LAAM 0.25 mg/kg in subjects treated with rifampicin (rifampin) [cytochrome P450 (CYP) 3A induction], troleandomycin (CYP3A inhibition) or nothing(control). Results are mean ± SD (n = 13).
2005 Adis Data Information BV. All rights reserved. Clin Pharmacokinet 2005; 44 (7)

742 Kharasch et al.
control, rifampicin and troleandomycin groups, re-spectively. The investigators’ subjective assessmentof adverse effects was that vomiting was greatest infrequency and severity in subjects pretreated withtroleandomycin.
Pharmacokinetic/PharmacodynamicAnalysis
Noncompartmental AnalysisA pharmacokinetic/pharmacodynamic approach
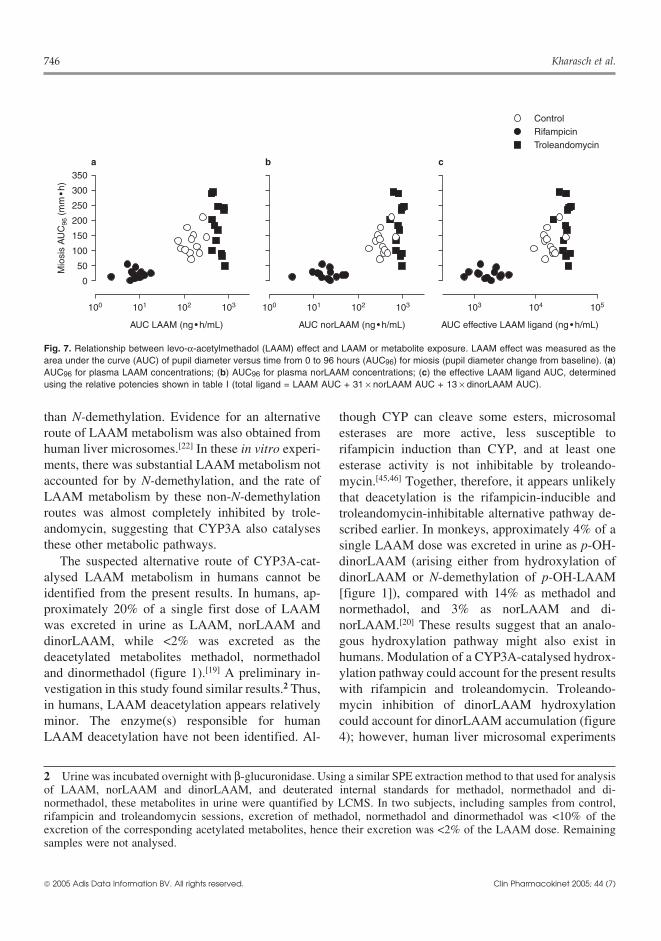
was used to evaluate LAAM pharmacodynamics(figure 7) as there is ambiguity as to whether LAAMmetabolites (mainly norLAAM) alone mediateLAAM effects, or whether there is also a con-tribution from LAAM.[11,13,18] The concentration-effect relationship for miosis was similar for LAAM(figure 7a) and norLAAM (figure 7b), which did notpermit identification of the predominant agonist.The total effective plasma agonist concentration wascalculated using LAAM, norLAAM and di-norLAAM plasma concentrations, together with therelative opioid µ receptor binding potencies deter-mined in vitro (table I). There was no improvementin the concentration-effect relationship for miosisusing the total LAAM ligand AUC (figure 7c). It isapparent, however, that the time course of miosis(figure 6) mostly resembled that of plasmanorLAAM concentration (figure 4), including a low-er peak concentration and effect, and prolongedduration in the subjects treated with troleandomycin.In addition, the correlation between miosis and plas-ma concentration at individual times (e.g. 8 hours)was better for norLAAM than for LAAM (data notshown).
Integrated Pharmacokinetic/PharmacodynamicModel AnalysisThe integrated pharmacokinetic/pharmacody-
namic model successfully fit all but one subject.This subject had well estimated pharmacokinetics,but owing to the noise level in the pharmacodynam-ic measurements, did not result in numerical modelconvergence. Therefore, we used the remaining sub-jects to construct an informative prior on the param-eter EC50, as done previously in a different con-text.[34] The availability of this Bayesian prior infor-
2005 Adis Data Information BV. All rights reserved. Clin Pharmacokinet 2005; 44 (7)
Tab
le I
I. L
evo-
α-ac
etyl
met
hado
l (LA
AM
) no
ncom
part
men
tal p
harm
acok
inet
ic p
aram
eter
sa
Par
amet
erLA
AM
norL
AA
Mdi
norL
AA
M
cont
rol
rifam
pici
ntr
olea
ndom
ycin
cont
rol
rifam
pici
ntr
olea
ndom
ycin
cont
rol
rifam
pici
ntr
olea
ndom
ycin
(rifa
mpi
n)
Cm
ax (
ng/m
L)14
.7±
6.6
2.0
± 1.
1*39
.1±
8.6*
18.7
± 4
.83.
6 ±
2.7*
14.5
±2.
5*8.
36±
1.42
7.10
± 2
.02*
5.26
± 1
.14*
t max
(h)
2.5
±0.
91.
7 ±
0.9*
2.7
±0.
53.
0 ±
0.8
2.6
± 0.
810
.9±
14.1
*11
.8±
13.4
3.0
± 0.
774
.4 ±
22.
6*
AU
C96
(ng
•h/
mL)
169
±73
8.9
± 3.
9*58
7±
150*
377
± 13
922
.2 ±
13.
7*82
4±
156*
482
±11
184
.8 ±
35.
2*36
1 ±
96*
0.05
(0.
04,
0.07
)b3.
7 (3
.3,
4.4)
b0.
05 (
0.04
, 0.
07)b
2.3
(2.1
, 2.
6)b
0.17
(0.
15,
0.20
)b0.
74 (
0.66
, 0.
88)b
AU
C∞
(ng
•h/
mL)
199
±91
11.3
± 4
.0*
731
±22
9*39
5 ±
154
21.5
± 1
2.7*
1210
±46
0*65
9±
189
85.6
± 3
6.0*
1100
± 3
10*
0.06
(0.
05,
0.07
)b3.
9 (3
.4,
4.9)
b0.
05 (
0.04
, 0.
06)b
3.1
(2.8
, 3.
6)b
0.12
(0.
11,
0.15
)b1.
8 (1
.3,
2.8)
b
t1 /2
(h)
16.6
±7.
32.
4 ±
0.7*
21.1
±5.
2*18
.5 ±
4.3
3.8
± 0.
8*50
.6±
28.0
*45
.8±
13.4
9.1
± 3.
211
4 ±
91*
CL/
F (
mL/
h/kg
)14
10±
740
2232
0 ±
8010
*33
9±
99*
Vz/
F (
L/kg
)55
.7±
24.8
108.
7 ±
44.5
*20
.5±
6.3*
aM
ean
± S
D,
unle
ss s
peci
fied
othe
rwis
e.
bG
eom
etric
mea
n A
UC
rat
io (
rifam
pici
n or
tro
lean
dom
ycin
/con
trol
) an
d 90
% C
I.
AU
C96
= a
rea
unde
r th
e pl
asm
a co
ncen
trat
ion-
time
curv
e fr
om 0
to
96 h
ours
; A
UC
∞ =
AU
C f
rom
tim
e ze
ro t
o in
finity
; C
L/F
= a
ppar
ent
oral
cle
aran
ce;
Cm
ax =
pea
k pl
asm
aco
ncen
trat
ion;
t1 /2
= h
alf-
life;
tm
ax =
tim
e to
rea
ch C
max
; V
z/F
= a
ppar
ent
volu
me
of d
istr
ibut
ion
durin
g te
rmin
al p
hase
; *
p <
0.0
5 vs
con
trol
.

CYP3A and LAAM Disposition 743
Pla
sma
met
abol
ite A
UC
96 r
atio
0
5
10
15
20
*
*
*
*
*
*
*
ControlRifampicin (rifampin)Troleandomycin
norL
AAM +
dino
rLAAM
dinor
LAAM
/nor
LAAM
dinor
LAAM
/LAAM
norL
AAM/L
AAM
Fig. 5. Plasma levo-α-acetylmethadol (LAAM) metabolite area under the plasma concentration-time curve from 0 to 96 hours (AUC96)ratios. Results are mean ± SD (n = 13). * p < 0.05 vs control.
mation enabled model identification in the centration was chosen for the final model owing to abetter fit to the data and a lower AIC value. The dataremaining subject. Pharmacokinetic parameter esti-were not able to support a composite pharmacody-mates for LAAM and LAAM metabolites are pro-namic model reflecting the collective effect of con-vided in table V and table VI. Formation clearancestributions from LAAM and metabolites.of norLAAM and dinorLAAM were significantly
enhanced by CYP3A induction with rifampicin, andDiscussionsignificantly decreased by troleandomycin inhibi-
tion of CYP3A activity. The increased clearanceduring rifampicin was accompanied by an increase CYP3A, LAAM Metabolism andin the volume of distribution for LAAM. The elimi- Clinical Effectsnation clearance of dinorLAAM followed a similarpattern, yet not to the same extent as the formation The first aim of this investigation was to test theclearances. The time course of miosis best reflected hypothesis that CYP3A4 is a major CYP isoformthe plasma concentration-time profile for responsible for human LAAM metabolism in vivo.norLAAM. Although the time course of LAAM Rifampicin is a highly effective inducer of CYP3A4concentrations also often gave an acceptable fit for (but apparently not CYP3A5), although it is pleio-the pharmacodynamic model, the norLAAM con- tropic and hence not specific to CYP3A (also induc-
2005 Adis Data Information BV. All rights reserved. Clin Pharmacokinet 2005; 44 (7)

744 Kharasch et al.
Table III. Levo-α-acetylmethadol (LAAM) urinary recovery and renal or formation clearance
Group Dose recovered 0–96h (%) Apparent renal or formation clearance (mL/h/kg)a
LAAM norLAAM dinorLAAM LAAM norLAAM dinorLAAM norLAAM +dinorLAAM
Control 1.01 ± 0.68 4.82 ± 2.58 10.9 ± 3.3 12.2 ± 6.0 63.0 ± 34.7 151 ± 84 214 ± 117
Rifampicin (rifampin) 0.07 ± 0.05 0.28 ± 0.34* 2.00 ± 1.03* 13.4 ± 9.7 54.9 ± 63.5 426 ± 209* 481 ± 257*
Troleandomycin 4.41 ± 2.23* 11.6 ± 3.7* 8.65 ± 1.68* 13.9 ± 6.5 37.9 ± 14.1 30.1 ± 12.3* 68.0 ± 24.4*
a Apparent renal or formation clearance was calculated as the product of the fraction of the dose recovered and apparent oralclearance.
* p < 0.05 vs control.
ing CYP2B6, 2C8, 2C9 and 2C19).[35,36] Troleando- oral clearance, increased plasma AUC ratios formycin is a selective, mechanism-based CYP3A in- dinorLAAM/LAAM, dinorLAAM/norLAAM andhibitor. Peak plasma concentrations of about 2 (norLAAM + dinorLAAM)/LAAM, and increasedµmol/L are attained 2 hours after a 500mg dose, the formation clearances of both norLAAM andwhich are well within the concentration range af- dinorLAAM. CYP3A inhibition significantly in-fording selectivity for CYP3A.[37,38] The paradigm creased plasma LAAM concentrations, decreasedof rifampicin induction and troleandomycin inhibi- LAAM apparent oral clearance, decreased plasmation has been used previously to identify the role of AUC ratios for norLAAM/LAAM, dinorLAAM/CYP3A in human opioid metabolism.[26,28,39-41] LAAM, dinorLAAM/norLAAM, and (norLAAM +CYP3A induction markedly decreased plasma dinorLAAM)/LAAM, and decreased the formationLAAM concentrations, increased LAAM apparent clearances of both norLAAM and dinorLAAM. For-
Time (h)
Pup
il di
amet
er c
hang
e (m
m)
0
1
2
3
4
*
*
*
*
*
*
*
*
* *
*
* *
*
*
**
96724824129630
Control
Rifampicin
Troleandomycin
Fig. 6. Effects of levo-α-acetylmethadol (LAAM) [0.25 mg/kg] on dark-adapted pupil diameter change from baseline. Subjects were treatedwith rifampicin (rifampin) [cytochrome P450 (CYP) 3A induction], troleandomycin (CYP3A inhibition) or nothing (control). Results are mean ±SD (n = 12 for controls, n = 13 for others). * p < 0.05 vs control.
2005 Adis Data Information BV. All rights reserved. Clin Pharmacokinet 2005; 44 (7)

CYP3A and LAAM Disposition 745
mation clearances of norLAAM and dinorLAAM with the hypothesis that CYP3A4 is a major isoformresponsible for human LAAM metabolism in vivo.were reasonably close to those predicted using in
vitro microsomal pharmacokinetic parameters and The second aim of this investigation was to testappropriate scaling.[22,25] Together these results the hypothesis that CYP3A induction and inhibition,strongly support the hypothesis that CYP3A4 is a respectively, of LAAM and norLAAM N-demethy-major CYP isoform responsible for human LAAM lation would increase and decrease, respectively,
LAAM bioactivation, the concentrations of activemetabolism in vivo. More specifically, CYP3A4 is ametabolites and hence clinical effects. This hypothe-major isoform catalysing both LAAM N-demethyla-sis was not substantiated. Indeed, and surprisingly,tion reactions, from LAAM to norLAAM and fromCYP3A induction actually decreased the magnitudenorLAAM to dinorLAAM.and duration of LAAM effects, while CYP3A inhi-Subsequent to the completion of the presentbition increased LAAM effects as measured by the
investigation, other clinical studies showing theduration of miosis and by the magnitude of subjec-
effect of CYP3A modulation on LAAM disposi- tive measures (including adverse effects). Thus, de-tion were published.[42,43] Nelfinavir moderately de- spite increased N-demethylation and norLAAM andcreased plasma LAAM AUC and Cmax, increased dinorLAAM formation clearances, CYP3A induc-plasma norLAAM AUC and decreased dinorLAAM tion actually decreased plasma concentrations ofAUC.[42] This is somewhat consistent with nelfi- LAAM and both N-demethylated metabolites. De-navir induction of hepatic but not intestinal CYP3A spite decreased N-demethylation and norLAAM andprotein expression in rats.[44] Clinical nelfinavir ef- dinorLAAM formation clearances, troleandomycinfects on LAAM and dinorLAAM AUC were quali- inhibition of CYP3A activity actually increasedtatively similar albeit quantitatively much less than plasma LAAM, norLAAM and dinorLAAM con-those of rifampicin, and opposite to the effects centrations.of rifampicin in norLAAM AUCs. Ketoconazole, These results suggest the existence of a hithertoan effective yet nonselective inhibitor of CYP3A unknown LAAM metabolic pathway(s) leading toin humans,[37,38] significantly increased plasma inactive metabolites. This pathway would appear toLAAM, norLAAM and dinorLAAM AUCs, and constitute a quantitatively significant (relative to N-LAAM miosis,[43] similar to the effects of troleando- demethylation) alternative route of LAAM metabo-mycin in the present investigation. The time course lism, induced and inhibited by rifampicin and trole-of plasma LAAM and LAAM metabolite concentra- andomycin, respectively, suggesting involvement oftions was similarly affected by ketoconazole and CYP3A. This as yet unidentified pathway appearedtroleandomycin. These findings are all consistent altered by CYP3A modulators to a greater extent
Table IV. Levo-α-acetylmethadol (LAAM) noncompartmental effect parametersa,b
Parameter Control Rifampicin (rifampin) Troleandomycin
Miosis maximum (mm) 3.9 ± 0.7 2.0 ± 0.7* 3.5 ± 0.9
tmax (h) 7.2 ± 2.6 4.1 ± 2.6 14.1 ± 12.6*
AUC96 (mm • h) 128 ± 40 22.5 ± 14.9* 178 ± 81*
0.13 (0.08, 0.29)c 1.4 (1.2, 2.0)c
AUC∞ (mm • h) 162 ± 65 22.8 ± 13.0* 342 ± 197*
0.11 (0.10, 0.18)c 2.0 (1.7, 3.4)c
Ke (h–1) 0.037 ± 0.017 0.232 ± 0.209* 0.018 ± 0.023
a Mean ± SD, unless specified otherwise.
b Parameters were determined using the data shown in figure 6.
c Geometric mean AUC ratio (rifampicin or troleandomycin/control) and 90% CI.
AUC96 = area under the curve of pupil diameter versus time from 0 to 96 hours; AUC∞ = AUC from time zero to infinity; Ke = elimination rateconstant; tmax = time to reach peak plasma concentration; * p < 0.05 vs control.
2005 Adis Data Information BV. All rights reserved. Clin Pharmacokinet 2005; 44 (7)
746 Kharasch et al.
AUC LAAM (ng • h/mL)
Mio
sis
AU
C96
(m
m •
h)
0
50
100
150
200
250
300
350
AUC norLAAM (ng • h/mL) AUC effective LAAM ligand (ng • h/mL)
ControlRifampicinTroleandomycin
100 101 102 103 100 101 102 103 103 104 105
a b c
Fig. 7. Relationship between levo-α-acetylmethadol (LAAM) effect and LAAM or metabolite exposure. LAAM effect was measured as thearea under the curve (AUC) of pupil diameter versus time from 0 to 96 hours (AUC96) for miosis (pupil diameter change from baseline). (a)AUC96 for plasma LAAM concentrations; (b) AUC96 for plasma norLAAM concentrations; (c) the effective LAAM ligand AUC, determinedusing the relative potencies shown in table I (total ligand = LAAM AUC + 31 × norLAAM AUC + 13 × dinorLAAM AUC).
than N-demethylation. Evidence for an alternative though CYP can cleave some esters, microsomalroute of LAAM metabolism was also obtained from esterases are more active, less susceptible tohuman liver microsomes.[22] In these in vitro experi- rifampicin induction than CYP, and at least onements, there was substantial LAAM metabolism not esterase activity is not inhibitable by troleando-accounted for by N-demethylation, and the rate of mycin.[45,46] Together, therefore, it appears unlikelyLAAM metabolism by these non-N-demethylation that deacetylation is the rifampicin-inducible androutes was almost completely inhibited by trole- troleandomycin-inhibitable alternative pathway de-andomycin, suggesting that CYP3A also catalyses scribed earlier. In monkeys, approximately 4% of athese other metabolic pathways. single LAAM dose was excreted in urine as p-OH-
The suspected alternative route of CYP3A-cat- dinorLAAM (arising either from hydroxylation ofalysed LAAM metabolism in humans cannot be dinorLAAM or N-demethylation of p-OH-LAAMidentified from the present results. In humans, ap- [figure 1]), compared with 14% as methadol andproximately 20% of a single first dose of LAAM normethadol, and 3% as norLAAM and di-was excreted in urine as LAAM, norLAAM and norLAAM.[20] These results suggest that an analo-dinorLAAM, while <2% was excreted as the gous hydroxylation pathway might also exist indeacetylated metabolites methadol, normethadol humans. Modulation of a CYP3A-catalysed hydrox-and dinormethadol (figure 1).[19] A preliminary in- ylation pathway could account for the present resultsvestigation in this study found similar results.2 Thus, with rifampicin and troleandomycin. Troleando-in humans, LAAM deacetylation appears relatively mycin inhibition of dinorLAAM hydroxylationminor. The enzyme(s) responsible for human could account for dinorLAAM accumulation (figureLAAM deacetylation have not been identified. Al- 4); however, human liver microsomal experiments
2 Urine was incubated overnight with β-glucuronidase. Using a similar SPE extraction method to that used for analysisof LAAM, norLAAM and dinorLAAM, and deuterated internal standards for methadol, normethadol and di-normethadol, these metabolites in urine were quantified by LCMS. In two subjects, including samples from control,rifampicin and troleandomycin sessions, excretion of methadol, normethadol and dinormethadol was <10% of theexcretion of the corresponding acetylated metabolites, hence their excretion was <2% of the LAAM dose. Remainingsamples were not analysed.
2005 Adis Data Information BV. All rights reserved. Clin Pharmacokinet 2005; 44 (7)
CYP3A and LAAM Disposition 747
did not suggest further dinorLAAM metabolism.[22] more prominent role for LAAM and/or norLAAMThe existence and importance of LAAM hydroxyla- than for dinorLAAM.tion in humans remain unknown. Additional support for the more prominent role
Previous animal studies have also suggested the of norLAAM was obtained from the pharmacokinet-existence of additional, non-N-demethylation path-
ic/pharmacodynamic model. NorLAAM gave theway(s) of LAAM metabolism. Phenobarbital (phe-
best fit to the data using the Emax pharmacodynamicnobarbitone) induction of hepatic and intestinal me-
model. This was consistent with the greater potencytabolism significantly decreased the analgesic activ-of norLAAM compared with LAAM and di-ity of LAAM after oral or parenteral administrationnorLAAM. LAAM concentrations also gave reason-in rats.[47] Phenobarbital induction also decreasedable fits to the pupil diameter data for some subjects,plasma LAAM, norLAAM, dinorLAAM, methadolalthough they were consistently inferior to thoseand normethadol concentrations, and decreasedusing norLAAM. There was, however, an overallurine excretion of LAAM, norLAAM, dinorLAAMcorrelation between plasma LAAM and di-and methadol (but not normethadol).[48] Contrary tonorLAAM concentrations (r = 0.63; p < 0.001, datathe expected increase in formation of analgesicallynot shown), which may explain why both speciesactive metabolites by phenobarbital induction, itprovided acceptable fits to the data. DinorLAAMwas suggested that decreased analgesia could bewas not found to be consistently predictive for allexplained by preferential induction of further me-subjects. Although parent drug and metabolite(s)tabolism of active LAAM metabolites or of alternate
pathways leading to analgesically inactive metabo-lites.[47]
Identification of Active Species
A third aim of this investigation was to identifythe molecular entity(ies) mediating LAAM effects.Binding experiments showed that norLAAM anddinorLAAM were 31- and 13-fold more potent thanLAAM as human opioid µ receptor agonists, similarto previous investigations.[14-16] Human studies sug-gested that the concentration of norLAAM best mir-rored the time course of parent drug effect.[11] In thepresent investigation, in controls, the median tmaxfor plasma LAAM, norLAAM and dinorLAAMconcentrations was 3, 3 and 5 hours, respectively,whereas the median tmax for miosis was 7 hours. Insubjects treated with rifampicin, the median tmax forplasma LAAM, norLAAM and dinorLAAM was 2,3 and 3 hours, respectively, and the median miosistmax was 8 hours. In subjects treated with troleando-mycin, the corresponding medians were 3, 5 and 73hours, respectively, compared with the miosis tmaxof 8 hours. Simply comparing tmax values for con-centration and effect does not permit identificationof the active LAAM species, but does suggest a
Table V. Treatment-independent parameter estimates derived fromsimultaneous pharmacokinetic/pharmacodynamic modelling oflevo-α-acetylmethadol (LAAM) and LAAM metabolites after oralLAAM administrationa
Parameter Estimateb
Pharmacokinetic model
K21 (h–1) 2.59 (1.21, 4.11)
K12 (h–1) 0.10 (0.08, 0.10)
K43 (h–1) 1.73 (1.41, 2.25)
K34 (h–1) 0.21 (0.18, 0.26)
K65 (h–1) 4.89 (3.19, 6.20)
K56 (h–1) 0.12 (0.09, 0.15)
V/FnorLAAM, V/FdinorLAAM (L) 22 (18, 29)
Pharmacodynamic modelc
E0 (mm) 6.1 (5.8, 6.2)
Emax (mm)d 4.3 (3.8, 4.6)
EC50 (ng/mL) 7.3 (4.6, 11)
a Pharmacokinetic and pharmacodynamic results are for n = 13and n = 12, respectively.
b Results are the median (25th, 75th percentile).
c Pharmacodynamic parameters were determined usingnorLAAM concentrations.
d Emax was based on a composite analysis for control,rifampicin (rifampin)- and troleandomycin-treated subjects.Individual analysis resulted in values of 4.9 (4.0, 6.8), 1.6(1.0, 2.0)* and 2.9 (2.6, 3.4)*, respectively.
E0 = baseline diameter; EC50 = concentration that produces 50% ofmaximum effect; Emax = maximum effect; Kx = intercompartmentalrate constant; V/F = apparent volume of distribution during terminalphase; * p < 0.05 vs control.
2005 Adis Data Information BV. All rights reserved. Clin Pharmacokinet 2005; 44 (7)

748 Kharasch et al.
Table VI. Treatment-dependent parameter estimates derived from simultaneous pharmacokinetic/pharmacodynamic modelling of levo-α-acetylmethadol (LAAM) and LAAM metabolites after oral LAAM administrationa
Parameter Controlb Rifampicin (rifampin)b Troleandomycinb
Pharmacokinetic model
Kf,norLAAM (h–1) 1.43 (0.80, 2.70) 1.53 (0.67, 3.19)* 0.48 (0.25, 1.06)*
Kf,dinorLAAM (h–1) 2.29 (1.48, 2.69) 31 (18, 41) 0.55 (0.32, 0.61)b
Ke,dinorLAAM (h–1) 1.11 (0.74, 1.42) 8.16 (6.40, 9.67) 0.62 (0.30, 0.85)*
Lag (h) 2.39 (2.07, 2.70) 2.56 (1.83, 2.84)* 2.24 (1.89, 2.54)
Vz/FLAAM (L) 72 (46, 256) 735 (296, 2247)* 37 (27, 112)
Model-derived parameters
CLf,norLAAM (mL/h/kg) 1740 (1130, 2390) 14 100 (12 500, 17 000)* 302 (200, 393)*
CLf,dinorLAAM (mL/h/kg) 636 (527, 792) 7840 (6080, 13300)* 173 (108, 206)*
CLel,dinorLAAM (mL/h/kg) 359 (254, 415) 2220 (1650, 3220)* 200 (140, 214)
Ka (h–1) 0.84 (0.74, 0.97) 0.78 (0.70, 1.09)* 0.89 (0.79, 1.06)
a Pharmacokinetic results are for n = 13.
b Results are the median (25th, 75th percentile).
CLel = elimination clearance; CLf = formation clearance; Ka = absorption rate constant; Ke = elimination rate constant; Kf = formation rateconstant; Vz/F = apparent volume of distribution during terminal phase; * p < 0.05 vs control.
might contribute to miosis, their individual contribu- Limitationstions were not discernible from the data.
One limitation of this investigation merits men-Interestingly, the delay in peak effect comparedtion. Owing to the emetogenic nature of LAAM (andwith LAAM and norLAAM concentrations indi-
cates complex CNS-effect pharmacokinetics. Anal- the expectation that rifampicin induction would in-ogous results were observed previously.[13] The rap- crease this effect), subjects were pretreated with theid onset of miosis after intravenous LAAM adminis- antiemetics droperidol and ondansetron. Droperidoltration, in the absence of significant plasma is an α-adrenoceptor antagonist in addition to beingnorLAAM concentrations, was used to support the
a dopamine D2 receptor antagonist.[49] Accordingly,argument that LAAM itself is pharmacologically
droperidol caused miosis (0.8 ± 0.7mm) prior toactive and to counter the accepted notion that it isLAAM administration, and the time course ofexclusively a prodrug.[1,13] However, peak miosisdroperidol miosis could not be subtracted from thatoccurred 6–9 hours after intravenous LAAM admin-
istration in these studies, far later than the peak in of LAAM. Data analysis using post-droperidol (pre-LAAM concentrations. The complex nature of LAAM) pupil diameters was not useful, since laterLAAM concentration-effect relationships remains post-LAAM pupil diameters were greater than thoseincompletely understood. of this post-droperidol baseline. Hence, maximum
The fourth aim of this investigation was to deter- miosis may have been overestimated. Althoughmine the relative binding affinities of LAAM, its N- ondansetron is a substrate for CYP3A4,[50] it doesdemethylated metabolites, and other opioid ligands not alter CYP3A activity in vivo, as shown by anto human opioid µ receptors, for use in the absent effect on the disposition of alfentanil, a high-pharmacokinetic/pharmacodynamic model. The 31-
ly sensitive CYP3A probe.[41,51] Thus, the presentand 13-fold greater potencies of norLAAM and di-
pharmacokinetic results are unlikely to be influ-norLAAM compared with LAAM are consistentenced by the use of antiemetics. The alternative, towith previous in vitro results.[15,16] In contrast toomit antiemetic prophylaxis, was deemed unaccept-LAAM, methadone metabolism reduces the potencyable from a human subjects’ protection perspective.of the N-demethylated metabolites.
2005 Adis Data Information BV. All rights reserved. Clin Pharmacokinet 2005; 44 (7)

CYP3A and LAAM Disposition 749
Clinical Implications tion of enzymes responsible for drug biotransforma-tion, the present results demonstrate that such results
The results of this investigation proffer two sig- cannot be automatically extrapolated to predict innificant clinical implications. First, patients receiv- vivo drug disposition when there are active metabo-ing long-term LAAM therapy who are treated with lites, and should be confirmed by clinical investiga-CYP3A inducers would be susceptible to enhanced tion.LAAM metabolism, lower effective plasma concen-trations and the risk of acute withdrawal. Converse- Acknowledgementsly, patients receiving long-term LAAM therapytreated with CYP3A inhibitors would be susceptible The authors thank Divakar Gupta for assistance with
pharmacokinetic modelling. This study was supported byto decreased LAAM metabolism, greater effectiveNIH grants R01-DA14211, K24-DA00417, 9P41EB-01975plasma concentrations and the risk of acute toxicity.and T32DE-07023, a grant from the Veterans Affairs MeritThese effects are, most importantly, counter-intui-Research Service and grant NIH M01-RR00037 to the Uni-
tive to the notion of bioactivation equating to versity of Washington General Clinical Research Center.CYP3A-mediated LAAM metabolism. These con- The authors have no conflicts of interest that are directlyclusions are derived from single-dose LAAM ad- relevant to the content of this study.ministration, and changes in LAAM and metabolitesduring long-term administration may also be affect- Referencesed by accumulation. Some differences between 1. Kreek MJ, Vocci FJ. History and current status of opioid main-
tenance treatments: blending conference session. J Substshort- and long-term administration in response toAbuse Treat 2002; 23: 93-105CYP3A modulation may occur.
2. White JM, Danz C, Kneebone J, et al. Relationship betweenSecond, this investigation highlights the impor- LAAM-methadone preference and treatment outcomes. Drug
Alcohol Depend 2002; 66: 295-301tance and necessity of clinical investigations to vali-3. Glanz M, Klawansky S, McAullife W, et al. Methadone vs l-α-date predictions based on in vitro drug metabolism acetylmethadol (LAAM) in the treatment of opiate addiction: a
meta-analysis of the randomized, controlled trials. Am J Ad-studies, particularly when there are active metabo-dict 1997; 6: 339-49lites. There is considerable interest in predicting
4. Johnson RE, Chutuape MA, Strain EC, et al. A comparison ofhuman drug clearance in vivo and the effects of drug levomethadyl acetate, buprenorphine, and methadone for
opioid dependence. N Engl J Med 2000; 343: 1290-7interactions, based on results with human (or rat)5. Clark N, Lintzeris N, Gijsbers A, et al. LAAM maintenance vsliver and intestinal microsomes.[52] Predictions and
methadone maintenance for heroin dependence (Cochrane Re-warnings may be extrapolated from in vitro findings view). Cochrane Database Syst Rev 2002; (2): CD002210
6. Sorensen JL, Copeland AL. Drug abuse treatment as an HIVor results from drugs within the same class. None-prevention strategy: a review. Drug Alcohol Depend 2000; 59:theless, the results of the present investigation cau-17-31
tion against this practice without clinical confirma- 7. Rawson RA, Hasson AL, Huber AM, et al. A 3-year progressreport on the implementation of LAAM in the United States.tion.Addiction 1998; 93: 533-40
8. Deamer RL, Wilson DR, Clark DS, et al. Torsades de pointesConclusion associated with high dose levomethadyl acetate (ORLAAM). J
Addict Dis 2001; 20: 7-14This investigation demonstrates that CYP3A4 is 9. Jones HE, Strain EC, Bigelow GE, et al. Induction with
levomethadyl acetate: safety and efficacy. Arch Gen Psychia-a major CYP isoform responsible for human LAAMtry 1998; 55: 729-36N-demethylation and bioactivation in humans, but
10. Eissenberg T, Stitzer ML, Bigelow GE, et al. Relative potencyalso reveals the existence of a previously unknown of levo-a-acetylmethadol and methadone in humans under
acute dosing conditions. J Pharmacol Exp Ther 1999; 289:CYP3A-mediated inactivation pathway that is quan-936-45titatively predominant over the N-demethylation 11. Kaiko RF, Inturrisi CE. Disposition of acetylmethadol in rela-
pathway. LAAM disposition is subject to CYP3A4 tion to pharmacologic action. Clin Pharmacol Ther 1975; 18:96-103drug interactions, which alter LAAM metabolism,
12. Henderson GL, Wilson BK, Lau DHM. Plasma l-α-acetyl-bioactivation and clinical effects. While human liver methadol (LAAM) after acute and chronic administration. ClinPharmacol Ther 1976; 21: 16-25microsomal studies are important in the identifica-
2005 Adis Data Information BV. All rights reserved. Clin Pharmacokinet 2005; 44 (7)
750 Kharasch et al.
13. Walsh SL, Johnson RE, Cone EJ, et al. Intravenous and oral l-α- 30. Kharasch ED, Russell M, Garton K, et al. Assessment of cyto-acetylmethadol: pharmacodynamics and pharmacokinetics in chrome P450 3A4 activity during the menstrual cycle usinghumans. J Pharmacol Exp Ther 1998; 285: 71-82 alfentanil as a noninvasive probe. Anesthesiology 1997; 87:
26-3514. Nickander R, Booher R, Miles H. α-l-Acetylmethadol and its N-demethylated metabolites have potent opiate action in the 31. Barrett PH, Bell BM, Cobelli C, et al. SAAM II: simulation,guinea pig isolated ileum. Life Sci 1974; 14: 2011-7 analysis, and modeling software for tracer and pharmacokinet-
15. Horng JS, Smits SE, Wong DT. The binding of the optical ic studies. Metabolism 1998; 47: 484-92isomers of methadone, α-methadol, α-acetylmethadol and 32. Houston JB. Drug metabolite kinetics. Pharmacol Ther 1982;their N-demethylated derivatives to the opiate receptors of rat 15: 521-52brain. Res Commun Chem Pathol Pharmacol 1976; 14: 621-9 33. St Pierre MV, Xu X, Pang KS. Primary, secondary, and tertiary
16. Walczak SA, Makman MH, Gardner EL. Acetylmethadol me- metabolite kinetics. J Pharmacokinet Biopharm 1988; 16: 493-tabolites influence opiate receptors and adenylate cyclase in 527amygdala. Eur J Pharmacol 1981; 72: 343-9 34. Sheiner LB, Rosenberg B, Melmon KL. Modelling of individual
17. Vaupel DB, Jasinski DR. l-α-Acetylmethadol, l-α-acetyl-N- pharmacokinetics for computer-aided drug dosage. Computnormethadol and l-α-acetyl-N,N-dinormethadol: comparisons Biomed Res 1972; 5: 411-59with morphine and methadone in suppression of the opioid 35. Schuetz EG, Schuetz JD, Strom SC, et al. Regulation of humanwithdrawal syndrome in the dog. J Pharmacol Exp Ther 1997; liver cytochromes P-450 in family 3A in primary and continu-283: 833-42 ous culture of human hepatocytes. Hepatology 1993; 18: 1254-
18. Holtzman SG. Discriminative stimulus properties of levo-α- 62acetylmethadol and its metabolites. Pharmacol Biochem 36. Madan A, Graham RA, Carroll KM, et al. Effects of prototypi-Behav 1979; 10: 565-8 cal microsomal enzyme inducers on cytochrome P450 expres-
19. Finkle BS, Jennison TA, Chinn DM, et al. Plasma and urine sion in cultured human hepatocytes. Drug Metab Dispos 2003;disposition of l-α-acetylmethadol and its principal metabolites 31: 421-31in man. J Anal Toxicol 1982; 6: 100-5 37. Ono S, Hatanaka T, Hotta H, et al. Specificity of substrate and
20. Misra AL, Mule SJ, Bloch R, et al. Physiological disposition inhibitor probes for cytochrome P450s: evaluation of in vitroand biotransformation of l-α-[2-3H]acetylmethadol (LAAM) metabolism using cDNA-expressed human P450s and humanin acutely and chronically treated monkeys. J Pharmacol Exp liver microsomes. Xenobiotica 1996; 26: 681-93Ther 1978; 206: 475-91
38. Sai Y, Dai R, Yang TJ, et al. Assessment of specificity of eight21. Moody DE, Alburges ME, Parker RJ, et al. The involvement of chemical inhibitors using cDNA- expressed cytochromes
cytochrome P450 3A4 in the N-demethylation of L-α-acetyl- P450. Xenobiotica 2000; 30: 327-43methadol (LAAM), norLAAM, and methadone. Drug Metab
39. Ibrahim AE, Feldman J, Karim A, et al. Simultaneous assess-Dispos 1997; 25: 1347-53ment of drug interactions with low- and high-extraction22. Oda Y, Kharasch ED. Metabolism of levo-α-acetylmethadolopioids: application to parecoxib effects on the pharmacoki-(LAAM) by human liver cytochrome P450: involvement ofnetics and pharmacodynamics of fentanyl and alfentanil. Anes-CYP3A4 characterized by atypical kinetics with two bindingthesiology 2003; 98: 853-61sites. J Pharmacol Exp Ther 2001; 297: 410-22
40. Kharasch ED, Hoffer C, Whittington D, et al. Role of hepatic23. Huang W, Bemis PA, Slawson MH, et al. Determination of l-α-and intestinal cytochrome CYP3A and CYP2B6 in the metabo-acetylmethadol (LAAM), norLAAM, and dinorLAAM inlism, disposition and miotic effects of methadone. Clinclinical and in vitro samples using liquid chromatography withPharmacol Ther 2004; 76: 250-69electrospray ionization and tandem mass spectrometry. J
41. Kharasch ED, Walker A, Hoffer C, et al. Intravenous and oralPharm Sci 2003; 92: 10-20alfentanil as in vivo probes for hepatic and first-pass CYP3A24. Neff JA, Moody DE. Differential N-demethylation of l-α-activity: noninvasive assessment using pupillary miosis. Clinacetylmethadol (LAAM) and norLAAM by cytochrome P450sPharmacol Ther 2004; 76: 452-662B6, 2C18, and 3A4. Biochem Biophys Res Commun 2001;
42. McCance-Katz EF, Rainey PM, Smith P, et al. Drug interactions284: 751-6between opioids and antiretroviral medications: interaction25. Oda Y, Kharasch ED. Metabolism of methadone and levo-α-between methadone, LAAM, and nelfinavir. Am J Addictacetylmethadol (LAAM) by human intestinal cytochrome2004; 13: 163-80P450 3A4 (CYP3A4): potential contribution of intestinal me-
43. Moody DE, Walsh SL, Rollins DE, et al. Ketoconazole, atabolism to presystemic clearance and bioactivation. J Pharma-cytochrome P450 3A4 inhibitor, markedly increases concen-col Exp Ther 2001; 298: 1021-32trations of levo-acetyl-α-methadol in opioid-naive individuals.26. Kharasch ED, Russell M, Mautz D, et al. The role of cyto-Clin Pharmacol Ther 2004; 76: 154-66chrome P450 3A4 in alfentanil clearance: implications for
44. Huang L, Wring SA, Woolley JL, et al. Induction of P-glycopro-interindividual variability in disposition and perioperative drugtein and cytochrome P450 3A by HIV protease inhibitors.interactions. Anesthesiology 1997; 87: 36-50Drug Metab Dispos 2001; 29: 754-6027. Billings RE, McMahon RE. L-acetylmethadol (LAM) treatment
45. Zhu W, Song L, Zhang H, et al. Dexamethasone differentiallyof opiate dependence: plasma and urine levels of two pharma-regulates expression of carboxylesterase genes in humans andcologically active metabolites. Life Sci 1974; 14: 1437-46rats. Drug Metab Dispos 2000; 28: 186-9128. Phimmasone S, Kharasch ED. A pilot evaluation of alfentanil-
46. Ebling WF, Szefler SJ, Jusko WJ. Analysis of cortisol, methyl-induced miosis as a noninvasive probe for hepatic cytochromeprednisolone, and methylprednisolone hemisuccinate: absenceP450 3A4 (CYP3A4) activity in humans. Clin Pharmacol Therof effects of troleandomycin on ester hydrolysis. J Chromatogr2001; 70: 505-17B 1984; 305: 271-8029. Kharasch ED, Jubert C, Senn T, et al. Intraindividual variability
in male hepatic CYP3A4 activity assessed by alfentanil and 47. Roerig DL, Hasegawa AT, Wang RIH. Effect of alteration ofmidazolam clearance. J Clin Pharmacol 1999; 39: 664-9 metabolism on the analgesic activity, toxicity, distribution and
2005 Adis Data Information BV. All rights reserved. Clin Pharmacokinet 2005; 44 (7)

CYP3A and LAAM Disposition 751
excretion of l-α-acetylmethadol in the rat. J Pharmacol Exp 52. Bjornsson TD, Callaghan JT, Einolf HJ, et al. The conduct of inTher 1977; 203: 377-87 vitro and in vivo drug-drug interaction studies: a Pharmaceuti-
48. Kuttab SH, Nowshad F, Shargel L. Effect of phenobarbitalcal Research and Manufacturers of America (PhRMA) per-pretreatment on the plasma and urinary levels of (–)-α-spective. Drug Metab Dispos 2003; 31: 815-32acetylmethadol and its metabolites. J Pharm Sci 1985; 74:
331-449. Kovac AL. Prevention and treatment of postoperative nausea
and vomiting. Drugs 2000; 59: 213-43 Correspondence and offprints: Dr Evan D. Kharasch, De-50. Dixon CM, Colthup PV, Serabjit-Singh CJ, et al. Multiple forms
partment of Anesthesiology, University of Washington,of cytochrome P450 are involved in the metabolism of ondan-setron in humans. Drug Metab Dispos 1995; 23: 1225-30 1959 NE Pacific St RR-442, Box 356540, Seattle, WA 98195,
51. Dershwitz M, DiBiase PM, Rosow CE, et al. Ondansetron does USA.not affect alfentanil-induced ventilatory depression or seda-tion. Anesthesiology 1992; 77: 447-52 E-mail: [email protected]
2005 Adis Data Information BV. All rights reserved. Clin Pharmacokinet 2005; 44 (7)