DEVELOPMENT OF ANDROGRAPHOLIDE ANALOGUE (3A.1)
222
DEVELOPMENT OF ANDROGRAPHOLIDE ANALOGUE (3A.1)-LOADED NANOCARRIERS AND 3A.1 NANOSUSPENSIONS FOR CANCER THERAPY By MR. Teeratas KANSOM A Thesis Submitted in Partial Fulfillment of the Requirements for Doctor of Philosophy (PHARMACEUTICAL TECHNOLOGY) Department of PHARMACEUTICAL TECHNOLOGY Graduate School, Silpakorn University Academic Year 2020 Copyright of Graduate School, Silpakorn University
-
Upload
khangminh22 -
Category
Documents
-
view
1 -
download
0
Transcript of DEVELOPMENT OF ANDROGRAPHOLIDE ANALOGUE (3A.1)

DEVELOPMENT OF ANDROGRAPHOLIDE ANALOGUE (3A.1)-LOADED
NANOCARRIERS AND 3A.1 NANOSUSPENSIONS FOR CANCER THERAPY
By
MR. Teeratas KANSOM
A Thesis Submitted in Partial Fulfillment of the Requirements
for Doctor of Philosophy (PHARMACEUTICAL TECHNOLOGY)
Department of PHARMACEUTICAL TECHNOLOGY
Graduate School, Silpakorn University
Academic Year 2020
Copyright of Graduate School, Silpakorn University

การพฒันาตวัพายาระดบันาโนบรรจุอนุพนัธ์แอนโดรกราโฟไลด ์(3A.1) และยาแขวนตะกอนระดบันาโนของ 3A.1 เพื่อการรักษาโรคมะเร็ง
โดย
นายธีรทศัน์ กนัโสม
วทิยานิพนธ์น้ีเป็นส่วนหน่ึงของการศึกษาตามหลกัสูตรปรัชญาดุษฎีบณัฑิต
สาขาวชิาเทคโนโลยเีภสัชกรรม แบบ 1.2 ปรัชญาดุษฎีบณัฑิต
ภาควชิาเทคโนโลยเีภสัชกรรม
บณัฑิตวทิยาลยั มหาวทิยาลยัศิลปากร ปีการศึกษา 2563
ลิขสิทธ์ิของบณัฑิตวทิยาลยั มหาวทิยาลยัศิลปากร

DEVELOPMENT OF ANDROGRAPHOLIDE ANALOGUE (3A.1)-
LOADED NANOCARRIERS AND 3A.1 NANOSUSPENSIONS FOR
CANCER THERAPY
By
MR. Teeratas KANSOM
A Thesis Submitted in Partial Fulfillment of the Requirements
for Doctor of Philosophy (PHARMACEUTICAL TECHNOLOGY)
Department of PHARMACEUTICAL TECHNOLOGY
Graduate School, Silpakorn University
Academic Year 2020
Copyright of Graduate School, Silpakorn University

Title Development of andrographolide analogue (3A.1)-loaded
nanocarriers and 3A.1 nanosuspensions for cancer therapy
By Teeratas KANSOM
Field of Study (PHARMACEUTICAL TECHNOLOGY)
Advisor Professor PRANEET OPANASOPIT , Ph.D.
Graduate School Silpakorn University in Partial Fulfillment of the
Requirements for the Doctor of Philosophy
(Associate Professor Jurairat Nunthanid, Ph.D.)
Dean of graduate school
Approved by
(Associate Professor TANASAIT NGAWHIRUNPAT ,
Ph.D.)
Chair person
(Professor PRANEET OPANASOPIT , Ph.D.)
Advisor
(Assistant Professor Prasopchai Patrojanasophon , Ph.D.)
Co advisor
(Associate Professor Arthit Chairoungdua , Ph.D.)
Co advisor
(Assistant Professor Rungnapha Saeeng , Ph.D.)
External Examiner

D
ABST RACT
58353802 : Major (PHARMACEUTICAL TECHNOLOGY)
Keyword : Andrographolide analogue, Nanocarriers, Nanosuspensions, Cancer
therapy
MR. TEERATAS KANSOM : DEVELOPMENT OF
ANDROGRAPHOLIDE ANALOGUE (3A.1)-LOADED NANOCARRIERS AND
3A.1 NANOSUSPENSIONS FOR CANCER THERAPY THESIS ADVISOR :
PROFESSOR PRANEET OPANASOPIT, Ph.D.
In this study, 19-tert-butylsilyldiphenyl-8,17-epoxy andrographolide (3A.1)-
loaded nanocarriers and 3A.1 nanosuspensions were developed for improving its
aqueous solubility and antitumor efficacy. First, the pH-sensitive amphiphilic chitosan
derivatives, i.e. N-naphthyl-N,O-succinyl chitosan (NSC), N-octyl-N,O-succinyl
chitosan (OSC), N-benzyl-N,O-succinyl chitosan (BSC) and folate-conjugated NSC
(Fol-NSC), were synthesized and were formulated polymeric micelles (PMs) for 3A.1
incorporation. The influence of entrapment methods, hydrophobic parts of copolymers,
and initial amount of drug on physicochemical characteristics were investigated.
Second, 3A.1 was entrapped into liposomes (LPs) including LPs and PEGylated LPs.
The effect of lipid components and initial amount of drug on physicochemical
properties was studies. Third, 3A.1 nanosuspensions (NSs) were fabricated by an anti-
solvent technique, using NSC, OSC, and BSC as surface stabilizers. The effect of drug
to polymer ratios and types of stabilizer on physicochemical properties was observed.
The 3A.1-loaded PMs based on CS derivatives at 40%wt to polymer, prepared by
dropping method provided the highest value of % entrapment efficiency (%EE) and
loading capacity (LC). These PMs were in nanometer scale (<200 nm) and had
spherical shape with highly negative charge. The release behaviors of 3A.1 from 3A.1-
loaded PMs displayed a delayed release. The 3A.1-loaded LPs and PEGylated LPs
showed the maximum values of %EE and LC at the initial drug content of 3.0 mmol.
These LPs had vesicle size in nanometer range (<150 nm) with spherical shape and
mildly negative charge. The release profile of PEGylated LPs was slower than that of
LPs and drug solution. The 3A.1-NSs at an optimal drug to polymer ratio of 1.5:1 w/w
had spherical shape with particle size in a nanoscale (<500 nm) with negative charge.
To keep physical and chemical stability at least 6 months, the 3A.1-loaded PMs, 3A.1-
loaded LPs, and 3A.1-NSs were stored at 4°C. The 3A.1-loaded PMs, LPs, and 3A.1-
NSs showed a significant increase in the anticancer activity against colorectal cancer
(CRC) cells with dose- and time-dependent manners, compared to free drug. In
addition, these nanocarriers induced CRC cell apoptosis. Interestingly, the Fol-NSC
PMs entrapped 3A.1 had greater suppression of cancer growth than the unconjugated
NSC PMs due to enhancing cellular uptake via receptor-mediated endocytosis. The in
vitro cell migration showed that free 3A.1 and both 3A.1-loaded PMs and LPs inhibited
cell motility in CRC and oral cancer cells, compared with untreated cells. Moreover,
the in vivo antitumor efficacy indicated that the effective 3A.1 dose of 40 mg/kg/day in
group of 3A.1-NSs yielded higher inhibition of tumor growth rate and lower toxicity
than that of free drug solution and blank NSs. Therefore, these nanocarriers and
nanosuspensions could be great potential as drug delivery of 3A.1 for cancer treatment.

E
ACKNOWLEDGEMENT S
ACKNOWLEDGEMENTS
It would not be possible to accomplish this thesis dissertation without the helpful
support from every people around me. First and foremost, I would like to express the
deepest appreciation to my supervisor, Prof. Dr. Praneet Opanasopit for her excellent
guidance, encouragement, motivation, patient, and providing me with warm atmosphere
for doing research. I also would like to express my gratitude to my co-advisors, Assoc.
Prof. Dr. Arthit Chairoungdua and Asst. Prof. Dr. Prasopchai Patrojanasophon for
valuable advice, support, and kindness throughout the course of this research.
I wish to acknowledge my thesis committees, Assoc. Prof. Dr. Tanasait
Ngawhirunpat and Asst. Prof. Dr. Rungnapha Saeeng for valuable time, insightful
comments and suggestions, but also for the hidden issues which inspired me to think from
various viewpoints.
My special appreciation goes to Dr. Waruyuth Sajomsang, National
Nanotechnology Center (NANOTEC), National Science and Technology Development
Agency (NSTDA) for kind giving me the amphiphilic chitosan derivatives used in this
research, Asst. Prof. Dr. Rungnapha Saeeng, Faculty of Science, Burapha University for
synthesis of 3A.1 analogue, and Dr. Somrudee Reabroi, Faculty of Science, Mahidol
University for training me throughout doing in vivo testing.
I would like to give special thanks to members of the Pharmaceutical
Development of Green Innovation Group (PDGIG) for good cooperation and course of
friendship, especially Mrs. Areerut Sripattanaporn, for good laboratory technique and
support. I would like to extend my special thanks to Assoc. Prof. Dr. Sunhapas Soodvilai
and Asst. Prof. Dr. Sirima Soodvilai for their laboratory support at Research Center of
Transport Protein for Medical Innovation, Faculty of Science, Mahidol University for
training me to achieve part of cell culture.
In addition, I would like to recognize the generous assistance throughout my
project provided by laboratory technician and staff at the Faculty of Pharmacy, Silpakorn
University. I also would like to thank Graduate Affairs, Faculty of Pharmacy, Silpakorn
University and Graduate School of Silpakorn University for all registration and
examination process during my Ph.D program.

F
In particular, I wish to express thankfulness to the Commission of Higher
Education (Thailand), the Thailand Research Sciences and Innovation (TSRI) through the
Royal Golden Jubilee Ph.D. program (Grant No. PHD/0077/2558) and the International
Research Network (IRN58W0004) as well as Faculty of Pharmacy, Silpakorn University
for facility support, scientifically instrumental support and partial financial support.
I would like to express my gratitude to Prof. Dr. Robert D. Arnold, for giving me
a great opportunity to conduct a research at Department of Drug Discovery and
Development, Harrison School of Pharmacy, Auburn University, Alabama, USA. He
gave the excellent ideas, precious suggestion and supported me everything in USA. I also
would like to express my sincere appreciation to Dr. Tarawsi Mitra Ghosh and Dr. Suman
Mazumder for excellent guidance and laboratory technique, Arnold’s lab members for
their helping and caring during my living in USA.
I cannot forget to thank my friends for all the unconditional support and
encouragement which push me to pass the tough situations.
Last but not the least, I would like to express the deepest gratefulness to my
parents, my family and my relatives for their spiritual support, beautiful smile,
understanding and believing in me.
For any mistake or inadequate information that may still in this dissertation,
certainly, I sincerely apologize for these points and the responsibility is entirely my own.
Teeratas KANSOM

TABLE OF CONTENTS
Page
ABSTRACT .................................................................................................................. D
ACKNOWLEDGEMENTS .......................................................................................... E
TABLE OF CONTENTS .............................................................................................. G
LIST OF TABLES ........................................................................................................ N
LIST OF FIGURES ....................................................................................................... P
LIST OF ABBREVIATIONS ........................................................................................ 1
CHAPTER 1 INTRODUCTION ................................................................................... 5
1.1 Statement and significance of the research problem ................................................ 5
1.2 Aims and objectives ................................................................................................. 9
1.3 The research hypothesis ......................................................................................... 10
CHAPTER 2 LITERATURE REVIEW ..................................................................... 11
2.1 Cancer disease ........................................................................................................ 11
2.1.1 Colorectal cancer (CRC) ................................................................................. 12
2.1.2 Treatment of CRC ........................................................................................... 13
2.2 Plant-based anticancer drugs .................................................................................. 14
2.2.1 Andrographolide ............................................................................................. 15
2.2.2 Semi-synthetic andrographolide (3A.1 analogue) ........................................... 16
2.3 Nanocarriers for cancer therapy ............................................................................. 18
2.4 Tumor targeting strategies ..................................................................................... 20
2.4.1 Passive targeting ............................................................................................. 20
2.4.2 Active targeting ............................................................................................... 21

H
2.5 Polymeric micelles (PMs) ...................................................................................... 24
2.5.1 Definition ........................................................................................................ 24
2.5.2 Types of polymer used .................................................................................... 27
2.5.3 Advantages and limitations ............................................................................. 28
2.5.4 Methods for micelle preparation ..................................................................... 29
2.5.5 Factor influencing the properties of PMs ........................................................ 31
2.5.6 Characterizations of micellar system .............................................................. 33
2.5.7 Application of PMs in cancer therapy ............................................................ 34
2.6 Liposomes (LPs)..................................................................................................... 35
2.6.1 Definition ........................................................................................................ 36
2.6.2 Basic components in liposomes ...................................................................... 36
2.6.3 Advantages and limitations ............................................................................. 39
2.6.4 Classification of liposomes ............................................................................. 39
I. Conventional liposomes (First generation) ..................................................... 40
II. Stealth liposomes or PEGylated liposomes (Second generation) ................. 41
III. Ligand targeted liposome ............................................................................ 42
IV. Stimuli-responsive liposomes ...................................................................... 43
2.6.5 Methods for liposome preparation .................................................................. 44
2.6.6 Characterization of liposomes ......................................................................... 47
2.6.7 Stability of liposomes ..................................................................................... 48
2.6.8 Application of LPs in cancer therapy .............................................................. 49

I
2.7 Nanosuspensions (NSs) .......................................................................................... 52
2.7.1 Definition ........................................................................................................ 54
2.7.2 Physicochemical properties of drug nanocrystals ........................................... 55
2.7.3 Advantages and limitations ............................................................................. 56
2.7.4 Methods for nanosuspension preparation ....................................................... 57
2.7.4.1 Top-down or disintegration method ....................................................... 57
2.7.4.2 Bottom-up or nanoprecipitation method ................................................ 60
2.7.4.3 Combination technologies ..................................................................... 61
2.7.5 Particle stabilization ........................................................................................ 62
2.7.6 Characterization of nanosuspensions .............................................................. 64
2.7.7 Stability of nanosuspensions ........................................................................... 67
2.7.8 Application of NSs in cancer therapy ............................................................. 69
2.8 Chitosan (CS) and chitosan derivatives .................................................................. 73
CHAPTER 3 MATERIALS AND METHODS .......................................................... 76
3.1 Materials ............................................................................................................ 76
3.1.1 Drugs and pharmaceutical excipients ............................................................. 76
3.1.2 Cell lines and culture reagents ........................................................................ 77
3.1.3 Animal experiment ......................................................................................... 78
3.2 Equipments ............................................................................................................ 79
3.3 Methods.................................................................................................................. 83
3.3.1 Preparation of 3A.1-loaded polymeric micelles (PMs) .................................. 83
3.3.1.1 Dialysis method ..................................................................................... 83
3.3.1.2 O/W emulsion method ........................................................................... 83
3.3.1.3 Dropping method ................................................................................... 83

J
3.3.1.4 Evaporation and sonication method ...................................................... 83
3.3.2 Preparation of 3A.1-loaded liposomes (LPs) .................................................. 84
3.3.3 Preparation of 3A.1 nanosuspensions (NSs) .................................................. 84
3.3.4 Entrapment efficiency and loading capacity of 3A.1-loaded PMs and LPs ... 85
3.3.5 Drug content of 3A.1 NSs .............................................................................. 86
3.3.6 HPLC analysis ................................................................................................ 86
3.3.7 Characterization of 3A.1-loaded PMs, 3A.1-loaded LPs and 3A.1 NSs ........ 87
3.3.7.1 pH .......................................................................................................... 87
3.3.7.2 Morphology ........................................................................................... 87
3.3.7.3 Particle size, size distribution, and zeta potential .................................. 87
3.3.7.4 Other physicochemical properties of 3A.1 NSs .................................... 88
3.3.7.4.1 Reconstitution test ..................................................................... 88
3.3.7.4.2 Differential scanning calorimetry (DSC) .................................. 88
3.3.7.4.3 Powder X-ray diffraction (PXRD) ............................................ 88
3.3.7.4.4 Fourier transform infrared spectrophotometry (FT-IR)............. 88
3.3.7.4.5 Saturation solubility ................................................................... 89
3.3.8 In vitro drug release study .............................................................................. 89
3.3.8.1 3A.1-loaded PMs ................................................................................... 89
3.3.8.2 3A.1-loaded LPs .................................................................................... 89
3.3.9 Stability study ................................................................................................. 90
3.3.10 In vitro anticancer activity ............................................................................ 90
3.3.11 Induction of cell apoptosis ............................................................................ 91
3.3.12 In vitro cell migration ................................................................................... 92
3.3.12.1 Scratch wound healing assay ............................................................... 92
3.3.12.2 Transwell migration assay (Boyden chamber) .................................... 92
3.3.13 In vitro cellular uptake .................................................................................. 93
3.3.14 In vivo antitumor efficacy ............................................................................. 94
3.3.14.1 Establishment of tumor xenograft models of CRC ............................. 94

K
3.3.14.2 Investigation of anticancer efficacy of the drug NSs compared
with free 3A.1 in CRC xenograft models ................................................. 96
3.3.15 Statistical analysis ......................................................................................... 98
CHAPTER 4 RESULTS AND DISCUSSION ........................................................... 99
4.1 Polymeric micelles with or without 3A.1 analogue ............................................... 99
4.1.1 Effects of physical entrapment methods ......................................................... 99
4.1.2 Effects of initial 3A.1 and hydrophobic cores .............................................. 103
4.1.2.1 Particle size and zeta potential ............................................................ 103
4.1.2.2 Micellar morphology ........................................................................... 104
4.1.2.3 Entrapment efficiency and loading capacity ....................................... 105
4.1.3 In vitro drug release ...................................................................................... 107
4.1.4 Short-term stability ....................................................................................... 108
4.1.5 In vitro anticancer activity ............................................................................ 110
4.1.6 Induction of cell apoptosis ............................................................................ 111
4.1.7 In vitro anti-migratory activity ..................................................................... 113
4.1.8 In vitro cellular uptake .................................................................................. 114
4.1.9 Folate-conjugated NSC polymeric micelles as a delivery system of 3A.1 for
active tumor targeting ...................................................................................... 115
4.1.9.1 Preparation and physicochemical properties of 3A.1-loaded micelles 115
4.1.9.2 In vitro drug release ............................................................................ 116
4.1.9.3 In vitro anticancer activity ................................................................... 117
4.1.9.4 Induction of cell apoptosis .................................................................. 118
4.2 Formulation screening of liposomes with or without 3A.1 analogue .................. 119
4.2.1 Effect of initial drug molar ratios ................................................................. 120
4.2.1.1 Particle size and zeta potential ............................................................ 120
4.2.1.2 Drug loading capacity ......................................................................... 123
4.2.1.3 Visual appearance ................................................................................ 123
4.2.1.4 Morphology ......................................................................................... 124
4.2.2 In vitro drug release ...................................................................................... 125
4.2.3 Short-term stability ....................................................................................... 126

L
4.2.4 In vitro anticancer activity ............................................................................ 128
4.2.5 Induction of cell apoptosis ............................................................................ 131
4.2.6 In vitro anti-migratory effect ........................................................................ 133
4.2.6.1 Wound-healing assay .......................................................................... 133
4.2.6.2 Transwell migration assay ................................................................... 134
4.3 Nanosuspensions with or without 3A.1 analogue ................................................ 135
4.3.1 Effect of drug to polymer ratios and the hydrophobic parts of their polymers
......................................................................................................................... 136
4.3.1.1 Particle size and zeta potential ............................................................ 136
4.3.1.2 Drug content ........................................................................................ 139
4.3.1.3 Visual appearance ................................................................................ 140
4.3.2 Comparison of the use of chitosan derivatives and surfactants .................... 140
4.3.3 Reconstitution test ........................................................................................ 141
4.3.4 Morphological analysis ................................................................................. 142
4.3.5 DSC ............................................................................................................... 143
4.3.6 PXRD ............................................................................................................ 145
4.3.7 FT-IR ............................................................................................................ 145
4.3.8 Solubility ....................................................................................................... 146
4.3.9 Short-term stability ....................................................................................... 147
4.3.10 In vitro anticancer activity .......................................................................... 149
4.3.11 In vivo anticancer efficacy .......................................................................... 151
4.3.11.1 Establishment of HCT116 tumor-bearing nude mice ........................ 151
4.3.11.2 In vivo antitumor efficacy of drug NSs ............................................. 152
CHAPTER 5 CONCLUSION.................................................................................... 155
5.1 Development of 3A.1-loaded polymeric micelles (PMs) .................................... 155
5.2 Development of 3A.1-loaded liposomes (LPs) .................................................... 155
5.3 Development of 3A.1 nanosuspensions (NSs)..................................................... 156
REFERENCES .......................................................................................................... 157
APPENDIX ................................................................................................................ 170

M
APPENDIX A ............................................................................................................ 171
APPENDIX B ............................................................................................................ 175
APPENDIX C ............................................................................................................ 182
APPENDIX D ............................................................................................................ 193
VITA .......................................................................................................................... 199

LIST OF TABLES
Page
Table 1 Various tumor molecules and specific ligands for active targeting [96] ....... 23
Table 2 Current clinical status of polymeric micelle formulations for intravenous
administration [24,104] ................................................................................................ 26
Table 3 Different methods for polymeric micelle characterization [105,106] ............ 33
Table 4 Different methods for liposome preparation [145,147] .................................. 46
Table 5 Different techniques for liposome characterization [145,147] ....................... 48
Table 6 List of marketed liposomal products used in cancer therapy [38,83] ............. 51
Table 7 Available marketed pharmaceutical nanosuspension products [170] ............. 72
Table 8 The physicochemical properties of 3A.1-loaded polymeric micelles with 20
wt% initial drug added (NSC, OSC, and BSC) prepared using four physical
entrapment methods. Each value represents the mean ± standard deviation from three
independent experiments. .......................................................................................... 100
Table 9 The particle size, PDI, and zeta potential of 3A.1-loaded polymeric micelles
prepared using the dropping method at the different drug to polymer weight ratios. All
data represent the mean ± standard deviation (n = 3). ............................................... 101
Table 10 The effect of different pH of dispersion vehicle on particle size and zeta
potential of 3A.1-loaded polymeric micelles with 40 wt% initial drug added prepared
using the dropping method. All data represent the mean ± standard deviation (n = 3).
.................................................................................................................................... 102
Table 11 The physicochemical properties of 3A.1-loaded polymeric micelles with and
without 40 wt% initial drug added (NSC vs. Folate-conjugated NSC) prepared using
the dropping method. All data represent the mean ± standard deviation (n = 3). ...... 102
Table 12 The influence of liposome formulations encapsulated different 3A.1 molar
ratios on vesicle size, PDI and zeta potential, %encapsulation efficiency (%EE), and
loading capacity (LC). All data represent the mean ± standard deviation (n=3). ...... 121
Table 13 The IC50 values of free 3A.1, 3A.1-loaded Con LP and 3A.1-loaded 0.25-
PEG LP against HCT116 and HT29 after 24- and 48-h treatment were determined
using GraphPad Prism 5.01 software. Each value was derived from three different
experiments in sextuplicate wells and reported as mean ± standard error of mean
(n=3). *, p<0.05 compared with free 3A.1 group; #, p<0.05 compared with 3A.1-
loaded Con LP group. ................................................................................................ 130

O
Table 14 The influence of drug to stabilizers ratios on the particle size, PDI, and zeta
potential of 3A.1 nanosuspensions prepared by a nanoprecipitation method. All data
represent the mean ± standard deviation (n=3). ......................................................... 138
Table 15 The properties of 3A.1 nanosuspensions with and without cryoprotectant
after the process of lyophilization. ............................................................................. 144
Table 16 The IC50 values of free 3A.1 and 3A.1 nanosuspensions against HCT116
after 24- and 48-h treatment were determined using GraphPad Prism 5.01 software.
Each value was derived from three different experiments in sextuplicate wells and
reported as mean ± standard error of mean (n=3). *, p<0.05 compared with free 3A.1
group. ......................................................................................................................... 150

LIST OF FIGURES
Page
Figure 1 Clinical stages of colorectal cancer growth according to the American
Cancer Society; See more details in ref. [52,56] ......................................................... 13
Figure 2 Chemical structure of (a) andrographolide and (b) semi-synthetic
andrographolide (3A.1). The illustration was written by ChemDraw Pro 12.0. .......... 15
Figure 3 Photograph of fresh herb of A. paniculata (Fah-Ta-Lai-Chon, Nakorn
Pathom, Thailand). ....................................................................................................... 16
Figure 4 Schematic representation of numerous nanocarriers used in targeted drug
delivery under preclinical and clinical development [83]. ........................................... 18
Figure 5 Schematic illustration of NC-mediated drug delivery through systemic
administration. After injecting nanocarriers into the body, these delivery systems
carrying anticancer drugs should target at cancer site without rapid clearance by the
immune system and then specific release drugs with sufficient concentration at the
target site [85]. ............................................................................................................. 20
Figure 6 Schematic illustration of tumor-targeting approaches. (a) Passive targeting:
transport drug NCs through defective and fenestrated blood vessels into the tumoral
interstitium surrounding the solid tumors by convection and passive diffusion. Small
molecules can freely move in and out of the tumor capillaries whereas drug-loaded
NCs can retain at interstitial fluid without diffusion back into blood circulation due to
their large size. (b) Active targeting: specific recognition process is involved with
ligands attached at the carrier’s surface selectively bind to receptor overexpressed at
the target site (tumor cells or endothelial cells) via sufficient affinity. Adapted from
ref. [91] ........................................................................................................................ 21
Figure 7 Structure of amphiphilic copolymer and polymeric micelles structure.
Generally, linear diblock copolymers of A-B type or linear triblock copolymers (2
types of polymer, AB; 3 types of polymer, ABC) or non-linear/grafted copolymers are
often used to design PMs. PMs are self-assembled by amphiphilic copolymers
consisting of hydrophilic and hydrophobic parts at/or above critical micelle
concentration (CMC) in aqueous solution. Adapted from ref. [24] ............................ 25
Figure 8 Different physical entrapment methods for the preparation of drug-loaded
polymeric micelle; (a) dialysis, (b) O/W emulsion followed by evaporation, (c)
solvent casting, and (d) freeze-drying. Adapted from ref. [105] ................................. 29
Q
Figure 9 Schematic presentation of the interaction among hydrophobic drugs,
copolymers, and water molecules: (a) stronger hydrophilicity polymer (b)
hydrophilic-hydrophobic balance (c) stronger hydrophobic polymer. Adapted from
ref. [110] ...................................................................................................................... 32
Figure 10 Basic structure and classification of liposomes: small unilamellar vesicles
(SUV), large unilamellar vesicles (LUV), and multilamellar vesicles (MLV). Adapted
from ref. [122] .............................................................................................................. 36
Figure 11 Chemical structure of common liposomal lipid constituents: (a)
phosphatidylcholine (b) cholesterol and (c) DSPE-PEG2000. The length and degree
of saturation in the carbon chain can vary in each class of phospholipids. [128] ........ 38
Figure 12 Type of liposomes based on components in the formulation: (a)
conventional liposomes are made of phospholipids, (b) PEGylated/stealth liposomes
are composed of coating of polyethylene glycol at liposome surface, (c) targeted
liposomes contain a specific targeting ligand to target cells at tumor environment, and
(d) multifunctional liposomes. Adapted from ref. [37]................................................ 40
Figure 13 Pictorial representation of liposome preparation by lipid thin-film
hydration followed by vortex or manual stirring. Adapted from ref. [145] ................. 46
Figure 14 Schematic illustration of top-down techniques: wet ball milling and high-
pressure homogenization. Adapted from ref. [170] ..................................................... 58
Figure 15 Schematic illustration of bottom-up techniques. Adapted from ref. [170]. 61
Figure 16 Chemical structure of chitin and chitosan. [193] ........................................ 73
Figure 17 Schematic diagram of synthesis of amphiphilic chitosan derivatives [28]. 75
Figure 18 Protocol for CRC implantation in athymic nude mice ............................... 95
Figure 19 Protocol for drug treatments in athymic nude mice ................................... 96
Figure 20 TEM images of polymeric micelles prepared by dropping method: (a) blank
NSC PMs, (b) 3A.1-loaded NSC PMs, (c) 3A.1-loaded OSC PMs, and (d) 3A.1-
loaded BSC PMs. The scale bars in all images are 100 μm....................................... 105
Figure 21 Effects of the initial amount of drug added (5-40 wt% to polymer) on (a)
the entrapment efficiency and (b) the loading capacity of 3A.1-loaded NSC PMs (),
3A.1-loaded OSC PMs (), and 3A.1-loaded BSC PMs () prepared by a dropping
method. Data are expressed as the mean ± standard deviation (n= 3). ...................... 106
Figure 22 In vitro release profiles of free 3A.1 () and 3A.1-loaded polymeric
micelles prepared by a dropping method; NSC (), OSC (), and BSC (), in
simulated gastric fluid (SGF; pH 1.2, 0–2 h), simulated intestinal fluid (SIF; pH 6.8,
2–8 h) followed by simulated colonic fluid (SCF; pH 7.4, 8–12 h). These data are

R
expressed as mean ± standard deviation (n = 3). *Statistically significant difference
compared with OSC PMs (p<0.05); **Statistically significant difference compared
with BSC PMs (p<0.05). ............................................................................................ 108
Figure 23 The short-term stability of 3A.1-loaded polymeric micelles stored under
long-term condition (left) compared with under accelerated condition (right) for 6
months; (a,d) particle size of NSC PMs (black bar), OSC PMs (dark gray bar), and
BSC PMs (light gray bar); (b,e) zeta potential of NSC PMs (black bar), OSC PMs
(dark gray bar), and BSC PMs (light gray bar); (c,f) the amount of 3A.1 remaining in
NSC PMs (), OSC PMs (), and BSC PMs (). All data are presented as the mean
± standard deviation (n = 3). ...................................................................................... 110
Figure 24 The percentage of cell viability (y-axis) of HT29 cells after being exposed
to various concentrations of 3A.1-loaded polymeric micelles or free 3A.1 (x-axis) for
36-h treatment, and the IC50 values (μg/mL) were included. ................................... 111
Figure 25 3A.1-loaded PMs induce HT29 cancer cell apoptosis examined by flow
cytometry: (a) HT29 cells treated with 3A.1-loaded PMs, free 3A.1 (at the equivalent
3A.1 concentration of 3.8 µg/mL), and Triton-X® for 24 h which are presented in four
quadrants (Q) with dot plot. The number of necrosis cells, late apoptosis cells, early
apoptosis cells, and living cells are displayed on Q1, Q2, Q4, and Q3, respectively. (b)
Percentage of cell apoptosis rate of the cells after being treated with 3A.1-loaded
PMs, free drug, and Triton-X®. *Statistically significant difference from free 3A.1
group (p<0.05). .......................................................................................................... 112
Figure 26 The anti-migratory effect of free 3A.1 and 3A.1-loaded PMs prepared by a
dropping method on head and neck (HN22) cancer cells presented as the (a) wound
images taken by a microscope (40× magnification) at 0 and 24 h, (b) cell migration
rate and (c) %wound closure after 24-h treatment exposure. *Statistically significant
difference from the untreated control group (p<0.05); NS, no significantly different
from free 3A.1 group (p>0.05). ................................................................................. 114
Figure 27 Fluorescent images of HT29 cells that were exposed to 40 wt% Dox-loaded
NSC PMs, compared with free Dox for 12-h and 24-h treatment. The scale bars in all
images are 200 μm. .................................................................................................... 115
Figure 28 Drug uptake from 40 wt% Dox-loaded NSC PMs and free Dox in HT29
cells determined by flow cytometry; (a) histogram of fluorescent events and (b) mean
fluorescent intensity of Dox. *Statistically significant difference compared with free
Dox (p<0.05). ............................................................................................................. 115
Figure 29 TEM images of (a) 3A.1-loaded NSC PMs and (b) 3A.1-loaded Fol-NSC
PMs prepared by a dropping method with drug loading of 40 %wt to polymer. The
scale bars in all images are 100 μm. .......................................................................... 116

S
Figure 30 In vitro release patterns of free 3A.1 () and 3A.1-loaded polymeric
micelles prepared by a dropping method; NSC (◆) vs. Fol-NSC (⚫), in simulated
gastrointestinal fluid. All data are expressed as mean ± standard deviation (n=3).
*Statistically significant difference compared with NSC PMs (p<0.05). .................. 117
Figure 31 Dose-response curve of the 3A.1-loaded NSC PMs and the 3A.1-loaded
Fol-NSC PMs against HT29 cancer cells for 36 h, compared with free 3A.1. Each bar
graph is presented as the mean ± standard deviation (n = 3). .................................... 118
Figure 32 Analysis of HT29 cell apoptosis by flow cytometry after treatment with
3A.1-loaded NSC PMs and Fol-NSC PMs at the equivalent 3A.1 concentration of 3.8
µg/mL for 24 h. (a) Fluorescent dot-plot and (b) rate of cell apoptosis. Data are
presented as mean ± standard deviation (n=3). *, p<0.05 vs. free 3A.1 group; NS, no
statistically significant difference vs. 3A.1-loaded NSC PMs. .................................. 119
Figure 33 The appearance of liposomal formulations prepared by a thin film hydration
and probe-sonication method: (a) blank Con LP, (b) 3A.1-loaded Con LP, (c) blank
PEG LP, and (d) 3A.1-loaded PEG LP ...................................................................... 124
Figure 34 TEM images of liposomal formulations prepared by a thin film hydration
and probe-sonication method: (a) blank Con LP, (b) 3A.1-loaded Con LP, (c) blank
PEG LP, and (d) 3A.1-loaded PEG LP. The scale bar in each image is equal to 100
nm. ............................................................................................................................. 125
Figure 35 In vitro release profiles of 3A.1 from 3A.1 solution (), 3A.1-loaded Con
LP (), and 3A.1-loaded 0.25-PEG LP () in PBS solution (pH 7.4) at 37°C for 24
h. *, p<0.05 compared to free drug; #, p<0.05 compared to Con LP. ...................... 126
Figure 36 The short-term stability of 3A.1-loaded liposomes stored under long-term
condition (left) compared to under accelerated condition (right) for 180 days: (a,d)
vesicle size; (b,e) zeta potential of the 3A.1-loaded Con LP (black bar) and the 3A.1-
loaded PEG LP (gray bar); (c,f) the relative drug remaining of the 3A.1-loaded Con
LP (black line) and the 3A.1-loaded PEG LP (red line). All data are represented as the
mean ± standard deviation (n=3). .............................................................................. 128
Figure 37 In vitro anticancer activity of 3A.1 solution (), 3A.1-loaded Con LP (),
and 3A.1-loaded PEG LP () against HCT116 cell line for (a) 24 h and (b) 48 h and
HT29 cell line for (c) 24 h and (d) 48 h. The data are shown as the mean ± standard
deviation of three independent replicates. ................................................................. 131
Figure 38 Apoptosis inductive effect of HCT116 cancer cells after treatment with free
3A.1 and 3A.1-loaded liposomes (at the equivalent 3A.1 concentration of 3.8 µg/mL)
in vitro. (a) Flow cytometry analysis of dot plot in groups of control, free 3A.1, and
3A.1- encapsulated liposomes. (b) Percentage of cell apoptosis rate of HCT116 cells
after being exposed to free 3A.1 and 3A.1-loaded liposomes for 24-h treatment. *,

T
p<0.05 compared to free drug; NS, no statistically significant difference compared to
free drug. .................................................................................................................... 132
Figure 39 Inhibition effect of free 3A.1 and 3A.1-loaded liposomes on cell migration
of HN22 cancer cells was measured by scratch assay. (a) Photographs of wound area
captured by an inverted microscope (40× magnification) at 0, 6, and 18 h. (b) Cell
migration rate and (c) %wound closure after 18-h treatment in each experimental
group. *, p<0.05 compared to free drug; #, p<0.05 compared to Con LP; NS, no
statistically significant difference, compared to Con LP. .......................................... 134
Figure 40 Anti-migratory effect of free 3A.1 and 3A.1-loaded liposomes on HCT116
cancer cells after 24-h incubation was investigated using a transwell migration assay.
(a) Photographs of migrated cancer cells stained with the purple color of crystal violet
in each treatment group under an inverted microscope. (b) The number of migrated
cancer cells was counted and reported as the percentage of control. *Statistically
significant difference (p<0.05) compared to free drug; NS, no statistically significant
difference compared to the Con LP. .......................................................................... 135
Figure 41 Effects of the drug to stabilizer weight ratios on (a) 3A.1 concentration and
(b) percentage yield of 3A.1 NSs stabilized by NSC (◆), OSC (◼), and BSC ().
Data are represented as the mean ± standard deviation (n=3). .................................. 139
Figure 42 The appearance of (a) 3A.1 coarse suspension without stabilizer and 3A.1
nanosuspensions stabilized by CS derivatives; (b) NSC, (c) OSC, and (d) BSC at a
drug to polymer ratio of 1.5:1 (w/w) ......................................................................... 140
Figure 43 TEM images of nanosuspensions with a drug to polymer ratio of 1.5:1
(w/w) prepared by a nanoprecipitation method: (a) 3A.1 NS-NSC, (b) 3A.1 NS-OSC
and (c) 3A.1 NS-BSC. SEM images of (d) 3A.1 coarse powder and (e) freeze-dried
3A.1 NS-NSC powder. .............................................................................................. 142
Figure 44 (a) Differential scanning calorimetry (DSC) patterns and (b) X-ray
diffraction (XRD) patterns of bulk 3A.1 powder, excipient of CS derivatives, physical
mixtures of 3A.1/CS derivatives, and lyophilized 3A.1 NSs (1.5:1, w/w) ................ 143
Figure 45 Fourier transform infrared spectra of bulk 3A.1 powder, excipient of CS
derivatives, physical mixtures of 3A.1/CS derivatives, and lyophilized 3A.1 NSs
(1.5:1, w/w) ................................................................................................................ 146
Figure 46 Solubility data of bulk 3A.1 (striped bar) and 3A.1 NSs stabilized by NSC
(black bar), OSC (dark gray bar), and BSC (light gray bar) in various types of solvent.
All bar graphs are presented as the mean ± standard deviation (n=3). UP, undetectable
peak of 3A.1 in HPLC chromatogram. ...................................................................... 147

U
Figure 47 The short-term stability of 3A.1 nanosuspensions stored under long-term
condition (left) compared to under-accelerated condition (right) for 6 months; (a,d)
particle size; (b,e) zeta potential of 3A.1 NS-NSC (black bar), NS-OSC (gray bar) and
NS-BSC (light gray bar); (c,f) the drug remaining of 3A.1 NS-NSC (◆), NS-OSC
(◼) and NS-BSC (). All data are expressed as the mean ± standard deviation (n=3).
.................................................................................................................................... 149
Figure 48 In vitro anticancer activity of 3A.1 solution (×) and 3A.1 NS-NSC (◆),
NS-OSC (◼), and NS-BSC () against HCT116 cell line for (a) 24 h and (b) 48 h.
The data are shown as the mean ± standard deviation of three independent replicates.
.................................................................................................................................... 151
Figure 49 Establishment of CRC xenograft nude mice. (a) Tumor growth curves of
the subcutaneous HCT116 tumor-bearing mice with initial cell density of 1 million
(black line), 5 million (red line), and 10 million (green line). (b) Body weight of mice
over observation time. The data are represented mean ± standard deviation (n = 2).152
Figure 50 In vivo antitumor efficacy of 3A.1 NSs compared to free 3A.1 solution
against HCT116 tumor xenograft-induced nude mice. (a) The tumor growth curves of
each group in tumor-bearing mice; (b) The body weight of mice in each group; (c)
Representative photographs of subcutaneous tumor mass in each group. ................. 154

1
LIST OF ABBREVIATIONS
3A.1 19-tert-butyldiphenylsilyl-8,17-epoxy andrographolide
5-FU 5-fluorouracil
AG andrographolide
ANOVA analysis of variance
BSC N-benzyl-N,O-succinyl chitosan
cm-1 wave number
CMC critical micelle concentration
CO2 carbon dioxide
conc. concentration
CRC colorectal cancer
CS chitosan
DCM dichloromethane
DDA degree of deacetylation
DDS drug delivery system
DLS dynamic light scattering
DMEM Dulbecco’s modified Eagle’s medium
DMF dimethylformamide
DMSO dimethyl sulfoxide
Dox doxorubicin
DSC differential scanning calorimetry
EE entrapment efficiency
e.g. exempi gratia (Latin); for example
Eq equation
et al. and others
etc. et cetera (Latin); and other things/ and so forth
FBS fetal bovine serum

2
Fol-NSC folic-conjugated N-naphthyl-N,O-succinyl chitosan
FITC fluorescein isothiocyanate
FT-IR fourier-transform infrared spectroscopy
g gram(s)
GI gastrointestinal
h hour(s)
HCl hydrochloride
HPLC high performance liquid chromatography
IC50 half-maximal inhibitory concentration
i.e. id est (Latin); that is
i.p. intraperitoneal injection
i.v. intravenous injection
kDa kilodalton
KH2PO4 potassium dihydrogen phosphate
LC loading capacity
LPs liposomes
M molarity
MEM Minimum essential media
meq milliequivalents
mg milligram(s)
min minute(s)
mL milliliter(s)
mm millimeter(s)
mm3 cubic millimeter(s)
mmol millimole
MTT 3-(4,5-Dimethylthiazol-2-yl)-2,5 diphenyltetrazolium
bromide, a tetrazole
mV millivolt(s)

3
MW molecular weight
NaBH4 sodium borohydride
NaOH sodium hydroxide
NCs nanocarriers
nm nanometer(s)
NMs nanomedicines
NSC N-naphthyl-N,O-succinyl chitosan
NSs nanosuspensions
OD optical density
OSC N-octyl-N,O-succinyl chitosan
O/W Oil in water
PBS phosphate buffered-saline solution
PC phosphatidylcholine
PDI polydispersity index
P-gp P-glycoprotein; MRP-1
pH potentia hydrogenii (Latin); potential for hydrogen
PI propidium iodide
pKa - log10Ka
PMs polymeric micelles
PS phosphatidylserine
PXRD powder X-ray diffraction
RH relative humidity
rpm revolutions per minute
s second(s)
SCF simulated colonic fluid
SD standard deviation
SDS sodium dodecyl sulfate
SEM scanning electron microscopy

4
SGF simulated gastric fluid
SIF simulated intestinal fluid
TEM transmission electron microscopy
vs versus
v/v volume by volume
w/v weight by volume
w/w weight by weight
µg microgram(s)
µL microliter(s)
µm micron; micrometer(s)
µM micromolar(s)
% percentage(s)
™ trademark
® registered trademark
ºC degree Celsius
> more than
< less than
~ approximately
π pi
θ theta

5
CHAPTER 1
INTRODUCTION
1.1 Statement and significance of the research problem
Cancer is the most common cause of death around the world. The global burden
is expected to rise to 21.7 million new cancer cases and 13 million cancer deaths in
2030 [1,2]. Among them, the cancer of the gastrointestinal tract is ranked as the top five
common cancer-related deaths in both men and women [3]. Colorectal cancer (CRC),
disease emanating from the epithelium cells lining the colon or rectum of the
gastrointestinal tract, is the most common malignant tumor with high mortality and
morbidity rates worldwide. The major risk factors for CRC include dietary or
environmental factors, inflammatory bowel disease, and genetics [4]. CRC is initially
developed as colorectal polyps before invading the surrounding muscular and lymph
nodes, then metastasize to distant organs. Signs and symptoms of CRC are not specific,
including weakness, weight loss, bloody stool, abdominal pain, and constipation;
therefore, most CRC patients are diagnosed in the advanced stages. The standard
treatment for stages I-IIC is surgical excision. Patients diagnosed in advanced stages
(IIIA-IV) will be treated with surgical excision combination with chemo-radiotherapy.
The prognostic is good only in the patient diagnosed with early-stage; however, the
survival rate is low in the advanced stages due to acquired drug resistance and
metastasis. Moreover, fluctuations in plasma drugs level can trigger the development
of drug resistance in the cancer cells. Therefore, the utilization of effective screening
devices and tumor-specific anticancer agents with reduced side effects for the screening
and treatment of cancer is recommended to achieve the best clinical outcomes. To date,
there are many strategies for CRC therapy that focus on cure or palliation, especially
chemotherapy is the major part of CRC treatment. Nevertheless, the use of conventional
anticancer agents is limited by their undesirable properties, such as poor solubility,
narrow therapeutic window, cytotoxicity to normal tissues, and nonspecific
biodistribution, which may be the cause of failure in cancer treatment [5]. To obtain
improved therapeutic efficacy, new strategies like nanotechnologies are required.
Developing a drug targeting system (DTS) is a current approach to overcome
the complicated regulating molecular mechanisms of cancer. DTS is designed to

6
administer pharmaceutical agents as an alternative form to increase safety and efficacy
while remained therapeutic potentials. There are varieties of the systems, including
beads, polymeric micelles, liposomes, nanosuspensions, and nanoparticulate systems
[6]. Nanocarriers, generally 10 to 1000 nm in size, have been designed with attracting
properties using specific materials in order to carry and transport particular drugs to
specific target cancer sites [7]. Numerous reports have shown that small nanocarriers
with the size ranging from 20-200 nm tended to accumulate in tumor cells because they
have a longer circulatory residence time and slower extravasation from normal
capillaries [8]. The drug-encapsulated nanocarriers can be accumulated in tumor tissue
through an enhanced permeation and retention effect (EPR) and avoiding clearance by
the reticuloendothelial system (RES) [9,10]. Hence, they are able to circulate in the
bloodstream for a longer period to achieve the desired therapeutic concentration
through the property of passive tumor targeting.
Moreover, drug delivery via nanocarriers is also able to solve the solubility
problems of poorly water-soluble drugs by incorporating the drug into the hydrophobic
core of the carriers and optimize the surface charge of the drug before entering into the
sites of the disease using adventitious-coating polymers. Generally, nanocarriers should
have a hydrophilic surface to increase solubility and excellent ability to escape from
macrophages in the mononuclear phagocyte system (MPS). Thus, coating the surface
of nanocarriers with a hydrophilic polymer, such as polyethylene glycol (PEG), creates
a steric side chain which can protect the nanocarriers from being opsonized by
macrophage [11]. Moreover, generating nanocarriers from block copolymers with
hydrophilic and hydrophobic components, such as the combination between poly (lactic
acid) (PLA), poly (lactic-co-glycolic acid) (PLGA), and PEG polymers, can provide
“stealth properties” to the nanocarriers leading to more remarkable ability to target
tumor sites [12]. Currently, several data have shown the applications of nanocarriers
for cancers targeting such as Doxil (liposomal doxorubicin), Abraxane (Nab-
paclitaxel), and Genexol-PM (polymeric micelle) [13-15].
Many approved anticancer drugs were derived from natural sources, especially
from plants. Plant-derived antitumor compounds have been developed to treat cancer
such as vinblastine, vincristine, etoposide, teniposide, paclitaxel, vinorelbine,

7
docetaxel, camptothecin, topotecan, and irinotecan [16]. Andrographis paniculata
(Berm. F.) Nees belongs to the Acanthaceae family. It has been used as a traditional
herbal medicine in many countries, including in India, China, and Southeast Asia
countries (Thailand, Malaysia, Indonesia, and Philippines). This herb is official in Thai
herbal pharmacopoeia. The isolated compounds from this plant have been reported to
have a wide spectrum of pharmacological effects including anti-diarrheal, anti-
inflammatory, anti-hyperglycemia, anti-microbial, anti-HIV, anti-hepatitis and
hepatoprotective effect [17]. Andrographolide (AG, C20H30O5) is a major ent-labdane
diterpenoid that demonstrates many pharmacological activities including cytotoxic
activity. It exhibited both direct and indirect effects on cancer cells by inhibiting cancer
cell proliferation, promoting cell-cycle arrest, and inducing apoptosis and necrosis cell
death [18]. However, AG lacks selectivity and potency toward several cancer cell lines.
To improve the cytotoxic activity and to be used as a potential anticancer drug, many
researchers have attempted to chemically modify AG based on its structure-activity
relationships (SAR). A series of novel analogues of AG were semi-synthesized and
evaluated for antitumor activity against different cancer cells [19]. Among them, 19-
tert-butyldiphenylsilyl-8,17-epoxy andrographolide (3A.1, C36H48O6Si) possesses high
cytotoxic activity against several cancer cells including hepatocellular carcinoma,
cervical carcinoma, and human breast carcinoma [20]. In addition, this analogue has
higher cytotoxic activity than the parent compound in the CRC cell line. Thus, this
analogue could be a potential semisynthetic anticancer drug in the future. However, the
administration of cytotoxic drugs remains far away from optimal. It is limited by poor
aqueous solubility (<1 μg/mL at 37°C) and high systemic toxicity to nonspecific organs.
Therefore, the development of a drug delivery system for improving therapeutic
efficacy and minimizing the side effect is necessary. Utilization of nanotechnology in
various biomedical applications, including drug delivery system has attracted
increasing interest. Therefore, the delivery of hydrophobic 3A.1 with nanocarrier
platforms including polymeric micelles, liposomes, and nanosuspensions will be
investigated in the current study [21,22].
Polymeric micelles (PMs) are nano-sized, spherical shape carriers, with a core-
shell architecture composed of hydrophobic segments as the internal core and
8
hydrophilic segments as the surrounding corona in the aqueous medium. Micelles can
enhance the aqueous solubility of an anticancer drug by incorporating the drug into the
core of the micelles. Simultaneously, the hydrophilic shell helps maintain colloidal
stability and protect the particles from being opsonized in the bloodstream, leading to
prolonged circulation time [23-25]. Most polymeric micelles are formed from various
synthetic copolymers. The structure of chitosan (CS) is usually modified to obtain
amphiphilic chitosan derivatives. The amphiphilic chitosan derivatives, N-naphthyl-
N,O-succinyl chitosan (NSC), N-octyl-N,O-succinyl chitosan (OSC) and N-benzyl-
N,O-succinyl chitosan (BSC) were synthesized by introducing hydrophobic (naphthyl,
octyl, benzyl group) and hydrophilic pH-sensitive moiety (succinyl group) into the
chitosan backbone. These derivatives demonstrate pH-sensitive properties that have
been employed for carrying various compounds such as curcumin [26], meloxicam
[27,28], and silymarin [29].
Liposomes (LPs) are naturally occurring phospholipid-based amphipathic
nanocarriers. They are self-assembled circular vesicles composed of a phospholipid
bilayer that can encapsulate both hydrophilic and hydrophobic drugs. Cholesterol is
commonly added to the structure of liposomes to increase stability [30-32]. However,
conventional liposomes have many problems, such as low drug loading, faster drug
release, and short half-life in the bloodstream. To overcome these problems,
PEGylation is used to help liposomes escape from RES, leading to an increase in blood
circulation time [33,34]. Moreover, novel liposomes are also developed to precisely
deliver an anticancer drug to the targeted sites by conjugating a specific ligand on the
surface of liposomes, which can bind to the overexpressed receptors of the cancer cells.
This approach leads to an increase in the anticancer efficacy and reduced toxicity [35-
37]. Nowadays, many commercial liposome products contain anticancer drugs such as
doxorubicin, paclitaxel, vincristine [38,39].
Nanosuspensions (NSs) are submicron colloidal dispersions composed of drug
nanocrystals (<1000 nm), stabilizing agents (e.g., surfactants and/or polymeric
stabilizers), and a liquid dispersion medium, especially water. The particle size of the
drug crystals can be reduced, which leads to an increase in the total surface area and an
eventual upsurge in the solubility, dissolution profile, and the bioavailability of the drug
9
[40-43]. To prevent the particle aggregation or crystal growth which is the principal
instability of the formulations, the appropriate stabilizers are usually added to stabilize
the nanocrystals via electrostatic and/or steric effect [44,45].
In this study, we aimed to develop three drug delivery nanosystems (polymeric
micelles, liposomes and nanosuspensions) containing an anticancer drug 3A.1 for
improving the solubility and anticancer activity against CRC cells. First, 3A.1-loaded
pH-sensitive amphiphilic chitosan polymeric micelles were formulated using different
physical preparation methods and chitosan derivatives (NSC, OSC, and BSC) and
various amount of drug. For active tumor targeting, the folate-conjugated N-naphthyl-
N,O-succinyl chitosan (Fol-NSC) was also synthesized and formulated 3A.1-loaded
Fol-NSC PMs. Second, 3A.1-loaded liposomes (conventional and PEGylated
liposomes) were produced to encapsulate drug using different lipid compositions and
various amount of drug. Third, 3A.1 nanosuspensions stabilized by stabilizers were
prepared through nanoprecipitation method with different amphiphilic chitosan
derivatives, stabilizers (sodium dodecyl sulfate (SDS), Tween® 80, and Poloxamer 188)
and various drug to stabilizer ratios. The physicochemical properties (i.e. particle size,
size distribution, zeta potential, morphology) and drug loading (or drug concentration)
of the two nanocarrier systems and the nanosuspensions were examined. Other
properties including solubility and degree of crystallinity of the nanosuspensions were
also investigated. In addition, the in vitro drug release of the two nanocarriers and short-
term stability of the nanosystems were evaluated along with the in vitro anticancer
activity, apoptosis induction and anti-migratory effect. Furthermore, in vivo antitumor
efficacy of the optimal nanosystems (nanosuspensions) were also evaluated in CRC
xenograft nude mice model.
1.2 Aims and objectives
1. To synthesize pH-responsive amphiphilic chitosan derivatives and folate-
conjugated chitosan derivatives
2. To formulate 3A.1-loaded polymeric micelles (PMs), 3A.1-loaded liposomes
(LPs), and 3A.1 nanosuspensions (NSs)

10
3. To evaluate the factors affecting the particle size, size distribution, zeta
potential, morphology, drug content, drug release, and physical stability of
3A.1-loaded PMs, 3A.1-loaded LPs, and 3A.1 NSs
4. To investigate the in vitro anticancer activity, apoptosis induction, and anti-
migratory activity of 3A.1-loaded PMs, 3A.1-loaded LPs, and 3A.1 NSs
5. To examine the in vivo antitumor efficacy of 3A.1 NSs
1.3 The research hypothesis
1. The amphiphilic chitosan derivatives can be successfully synthesized and can
be used to formulate 3A.1-loaded PMs and 3A.1 NSs.
2. Folate-conjugated chitosan derivatives can be synthesized and can be employed
for the formulation of PMs for active tumor targeting.
3. The entrapment methods, types of amphiphilic chitosan derivatives, and initial
amounts of drug influence the physicochemical properties, entrapment
efficiency, loading capacity, in vitro drug release, and physical stability of the
3A.1-loaded PMs.
4. The lipid compositions and initial amounts of the drug affect the
physicochemical characteristics, entrapment efficiency, and loading capacity, in
vitro drug release, and physical stability of the 3A.1-loaded LPs.
5. The drug to stabilizers ratios and type of amphiphilic chitosan derivatives affect
the physicochemical characteristics, solubility, and physical stability of the
3A.1 NSs.
6. The 3A.1-loaded PMs, 3A.1-loaded LPs and 3A.1 NSs can increase the
anticancer activity, apoptosis induction, and anti-migratory activity.

11
CHAPTER 2
LITERATURE REVIEW
2.1 Cancer disease
Cancer remains the second leading cause of mortality worldwide, accounting
for 9. 6 million cancer-related deaths in 2018. According to the updated cancer fact
sheet reported by World Health Organization (WHO), annual cancer cases are expected
to rise to 13 million within the next decade (2030) [1,2]. Generally, about 1 in 6 dead
people is due to cancer. The five most common types of cancer are lung, breast,
colorectal, prostate, and skin cancers. Cancer (malignant tumor or neoplasm) is a
pathologically heterogeneous group of diseases that rapidly progressive abnormal cells
to an uncontrollable stage after onset [46]. In daily lifestyle, humans are exposed to
several risk factors of cancer such as consumption of alcohol, tobacco, unhealthy
nutrition with low fiber intake, obesity, physical inactivity, ultraviolet radiation,
infections from viruses, bacteria or parasites, etc. These principle risk factors can induce
usual cells in the body to undergo genetic transformation and defection, leading to the
development of cancer cells. The genetic mutation often occurs in the upregulation of
oncogenes or downregulation of tumor- suppressor genes [47]. As is known to all,
cancer-related death dramatically increased in the past few decades, but due to
advanced early detection and sufficient management, cancer mortality can currently be
reduced and the annual economic cost of cancer is also saving. Different cancer types
and stages require specific management with single or combination approaches
including immune, photothermal, photodynamic, gene, and hormone therapy that have
the promising killing effect of cancer in preclinical studies. However, surgical
operation, radiotherapy, and chemotherapy continue to be the first option treatment for
most common cancers [48]. Although the efficiency of each cancer management varies
according to the tumor’ s type, stages, and different locations, the important goals of
cancer treatment are to cure cancer disease or to extend the patient’ s survival time and
improve the patient’s quality of life with supportive or palliative care and psychological
support [49]. However, these focused treatment strategies fail to manage “metastasis”
tumors that cancer cells have spread from the original site to distant organs. The
metastasis stages are very harmful to a cancer patient because of incurable clinical

12
outcomes and the major cause of death from cancer. Despite the advancement of
modern medicine in diagnostic and therapeutic tools, cancers remain a major health
concern and a leading cause of mortality and morbidity globally [50].
2.1.1 Colorectal cancer (CRC)
CRC, originating from the abnormal growth of the inner wall of the
epithelial cells lining at the colon or rectum of the GI tract, is the third- most-
common malignant tumor and is associated with high morbidity and mortality
worldwide, both in developed and developing countries [51]. In 2019, an
estimated 145,600 new cases were diagnosed with colon and rectum cancer with
an estimated 51,020 deaths, making colorectal cancer the third leading cause of
cancer- related deaths in the United States. Overall, colon and rectal cancers
make up approximately 8-9% of all cancer diagnoses in men and women in the
United States. The incidence rate of colorectal cancer in men is approximately
1.2 times greater than observed in women [52,53]. The cancer cases reported by
the National Cancer Institute ( NCI) of Thailand showed that CRC was ranked
to be the first ( n= 245) and the third ( n= 191) frequent new cases in men and
women population [54,55]. Age seems to be the major risk factor for the
development of colorectal cancer with 70% of cases diagnosed in adults older
than 65 years of age. In addition to age, dietary or environmental factors, life
habits, inflammatory bowel disease, and genetic susceptibility increase the risk
of CRC. As patient age, abnormal cells accumulate on the surface epithelium
and protrude into the stream of fecal matter, their contact with mutagens can
lead to further cell mutations and eventual adenoma formation [56]. The
development of a colorectal neoplasm is a multi-step process of several genetic
and phenotypic alterations of normal bowel epithelium leading to unregulated
cell growth, proliferation, and tumor development. Commonly, CRC first
develops as colorectal adenomatous polyps ( grape- like growth) , which are
abnormal growths in the inner lining of the bowel/ intestinal tract. Then,
carcinoma invades muscular and the nearby lymph nodes, and ultimately they
spread to other organs. The signs and symptoms include fatigue, blood in the
stool, constipation, tenesmus, rectal bleeding, abdominal pain, and weight loss.

13
The clinical presentation can be extremely varied and nonspecific. However,
CRC patients at an early stage mostly are asymptomatic clinical signs [4].
Figure 1 Clinical stages of colorectal cancer growth according to the American
Cancer Society; See more details in ref. [52,56]
Tumor recurrence and distant metastasis are critical survival-influencing
factors of CRC. CRC survival is primarily dependent on the stage of the disease.
The 5-year survival rate in patients with a localized stage was very high (∼90%),
in contrast, the survival rate was dropped to 65% in patients diagnosed for
distant metastasis. The relative survival rate is inversely related to stages of
tumor development at the time of detection. The prognosis is mainly predicted
by the stage of the disease and the prognosis of patients with an initial stage ( I
or II) is better at detection time [53]. The US Centers for Disease Control and
Prevention ( CDC) recommends that adults age 50 to 75 should start to be
screened for precancerous lesions of CRC using accurate and sensitive tools
such as sigmoidoscopy and colonoscopy [57].
2.1.2 Treatment of CRC
The treatment of CRC commonly depends on the tumor size, the local
microenvironment, and the range of cancer metastasis. The primary goal of the
CRC treatment approach is curative care for localized disease ( stage I, II, and
III) , while is palliative care for metastasis cancer (stage IV). In the early stage
of colon cancer, surgical resection is the primary option to remove tumors and

14
lymph nodes for curative effects in these patients. Other treatment options
available for CRC treatment include radiation therapy, chemotherapy, stem cell
transplant, and targeted immunotherapy [58].
Currently, chemotherapy as a pharmacological intervention is still the
most commonly used and effective strategy for the treatment of CRC, especially
in the metastatic phase. Chemotherapeutic drugs that are approved by the US
Food and Drug Administration (FDA) for CRC therapy include 5- fluorouracil
( 5- FU) , oxaliplatin, irinotecan, capecitabine, etc. The other drugs for CRC
therapy mostly consist of cytotoxic drugs, monoclonal antibodies, and their
combinations (see more details in ref. [59]). To achieve efficient chemotherapy,
drug concentration in plasma should be balanced between the minimum
therapeutic level and the maximum tolerable level for a prolonged time interval.
However, cancer treatment using conventional chemotherapy is highly non-
specific in targeting the drugs to the cancer cells causing undesirable side effects
to the healthy cells/tissues [60].
2.2 Plant-based anticancer drugs
Natural products are a great source of novel therapeutic agents for drug
discovery and development in the pharmaceutical industry and a number of new
chemical anticancer drugs originating from herbal plants are currently used in the clinic
for treatments of different types of cancer [16]. We believed that they are contemplated
to be safe and low risk to the human body’s normal cells as they have been used to treat
patients for over the centuries and it is hopeful that their natural compounds would be
extensively beneficial to remedy suffering symptoms and also improve physical and
mental quality of life. Recently, many semi-synthetic compounds from plant products
have been proved to strongly improve anticancer activities in vitro and in vivo
experimental tests [61,62]. Therefore, chemical modification of plant- based lead
candidates could be a better approach to receive a new class of chemotherapeutic drugs
with potential anticancer efficacy. Many approved plant- derived chemotherapeutic
agents have been developed to treat cancer such as vincristine, vinblastine, etoposide,
paclitaxel, docetaxel, topotecan, and irinotecan [63].

15
2.2.1 Andrographolide
Andrographolide ( AG, Figure 2a) is the major bioactive component
present in Andrographis paniculata ( Burm. f. ) Nees ( family Acanthaceae) , a
medicinal plant that has been widely used in complementary medicine,
especially in China, India, Southeast Asia countries including Thailand [64,65].
This herbal plant, commonly known as “king of bitters”, is traditionally used in
Ayurvedic medicine for a long time and is also preferred to treat a variety of
diseases including sore throat, flu, upper respiratory infections, fever, and
common cold. Therefore, these curative effects make it expressed as a “ natural
antibiotic” [ 1 7 ] . It is officially recorded in the Thai Herbal Pharmacopoeia
( THP) in the name of Fah- Ta- Lai- Chon for treatment of common cold,
laryngitis, and diarrhea [66]. Moreover, AG can be isolated in a large quantity
(∼2%) from the methanolic extract of dried whole plant but most concentrated
in the leaves (Figure 3) [67]. The natural compounds extracted from dried aerial
parts of A. paniculata are mainly diterpenoids, flavonoids, and sterols [68].
Various phytoconstituents are reported to have a broad range of
pharmacological effects, such as anti- inflammatory, anti- viral, anti- malarial,
anti- diabetic, anti- hypertensive, hepatoprotective, immunostimulatory, and
anti-cancer activity [69].
Figure 2 Chemical structure of ( a) andrographolide and ( b) semi- synthetic
andrographolide (3A.1). The illustration was written by ChemDraw Pro 12.0.

16
Figure 3 Photograph of fresh herb of A. paniculata (Fah-Ta-Lai-Chon, Nakorn
Pathom, Thailand).
In recent years, many researchers have revealed that AG and its
derivatives possess anticancer activity both in vitro and in vivo experiments. The
mechanism of antitumor actions against several solid tumors ( cervical, breast,
prostate, liver, colon cancer, etc. ) has been extensively studied and established
by a lot of research groups. The results reported that the molecular mechanisms
are mainly through induction of cell cycle arrest and promotion of apoptosis in
several cancer cells by attenuating various cell signaling pathways, induction of
intracellular reactive oxygen species ( ROS) , induction of tumor suppressor
proteins p53 and p21 leading to inhibition of cancer cell proliferation, survival,
invasion, metastasis, and angiogenesis [70,71].
2.2.2 Semi-synthetic andrographolide (3A.1 analogue)
Many previous studies suggested that AG is an interesting
pharmacophore with potent anticancer activity and hence has the potential to be
developed as a new anticancer entity. Nowadays, several semi- synthetic
compounds from medicinal herbs have been shown impressive anticancer
profiles in both efficacy and safety in various cancer cells [72]. Based on the
chemical structure of AG (C20H30O5, MW: 350.4 g/mol), it contains three major
moieties including (1) an 𝛼,𝛽-unsaturated 𝛾-butyrolactone ring, (2) two olefin
bonds (Δ8,17 and Δ12,13 ) and (3) three hydroxyl groups at C3 (secondary), C-14
(allylic) and C-19 (primary) [18,73,74]. Being a bipolar compound, with the
tendency to form hydrogen bonds, AG elicits biological responses by binding
to receptors via its hydroxyl group terminus [75]. However, the development of

17
AG formulations to treat cancer in the clinic is restricted by low water solubility,
lack of selectivity, and low potency leading to poor oral bioavailability [76].
Therefore, numerous AG analogues have been designed and synthesized by
modifying each important moieties of its structure to improve its potency and
selectivity. Many of these analogues exhibit superior anticancer activity over
the parent compound and the potential AG analogues would be approved to
become a novel class of anticancer agents for clinical use in the foreseeable
future [19]. The basic knowledge to modify AG structure through structure-
activity relationship (SAR) stated that (1) an intact 𝛾-butyrolactone ring, (2) the
C12=C13 and C8=C17 double bonds, and (3) C-14 hydroxyl group play a crucial
role in the cytotoxic activity [77]. In previous reports, it revealed that the
conversion of exocyclic C- 8 and C- 17 double bond to an epoxide through
epoxidation do not affect the cytotoxic activity [75,78]. Furthermore, the
introduction of high lipophilic groups such as aromatic derivatives on the
hydroxyl group provided a stronger cytotoxic activity than the parent
compound. This effect could be explained that these bulky functional groups
with lipophilic property allow AG analogues to pass the cell membrane by
passive diffusion and protect adjacent hydroxyl groups [79,80].
In our earlier studies, we have attempted to synthesize a lot of
derivatives and to evaluate their anticancer potential as well as modes of action
to find out a better lead. We found that one of the semi-synthetic AG analogue,
3A.1 (19-tert-butyldiphenylsilyl-8,17-epoxy andrographolide; C36H48O6Si,
MW: 604.8 g/mol) (Figure 2b), can suppress the growth of several cancer cell
lines including cholangiocarcinoma (CCA) and colorectal cancer (CRC) and
exhibits higher anticancer activity than the parent compound. This analogue was
chemically modified the AG molecule by coupling C-19 hydroxyl group with
aromatic silyl ether as a bulky lipophilic moiety through the silylation process
[20,81]. For CRC, this analogue has previously been reported to inhibit cell
proliferation and to induce apoptosis in HT29 and HCT116 cells through
inhibition of Wnt/𝛽-catenin signaling [82].

18
2.3 Nanocarriers for cancer therapy
The utilization of nanotechnology in various biomedical and pharmaceutical
fields is an emerging therapeutic platform that uses nanocarriers ( NCs) for the
detection, diagnosis, and treatment of cancer. The use of nanomedicines ( NMs) as a
targeted drug delivery system is regarded as one of the potential devices for cancer
therapy [6]. NCs ( also called as colloidal drug carriers) are utilized in cancer therapy
due to their unique size, i.e. in general 1-1000 nm, or preferably in the range of 20-200
nm suitable for drug delivery applications. The nano-ranged size, large surface area to
volume ratios, and the ability for surface modification/ functionalization play a crucial
role in its biodistribution and therapeutic efficacy in vivo [7]. Currently, NCs for
transporting anticancer drugs are divided into several types of formulations such as
polymer-based NCs (polymeric micelles, polymeric nanoparticles, dendrimers), lipid-
based NCs ( liposomes, lipid nanoparticles, microemulsions, nanoemulsions) , drug
conjugates, and inorganic nanoparticles (Figure 4) [83].
Figure 4 Schematic representation of numerous nanocarriers used in targeted drug
delivery under preclinical and clinical development [83].
NCs provide distinct advantages for cancer therapy beyond free drug
administration of conventional chemotherapy as follow;

19
1) Improve the therapeutic index of the loaded anticancer medication
compared to the drug delivered via conventional dosage forms.
2) Increase drug efficacy by achieving steady-state therapeutic levels of
drugs over an extended period or prolonged half- life in blood
circulation.
3) Lower drug toxicity due to controlled drug release and improve drug’s
pharmacokinetic by increasing the drug’s solubility (poorly soluble
compounds are solubilized/encapsulated in the hydrophobic
compartment) and stability as well as reducing premature drug release
[35,83].
The ideal drug delivery system should be able to carry chemotherapeutic drugs
and then precisely release the encapsulated drug at pathological tumor sites, control
drug level which is not too low to be inefficient therapy or is not too high to have serious
side effects and protect the drugs from the environment degradation during systemic
circulation and excretion. In addition, the drugs should selectively kill cancer cells,
increasing the therapeutic efficacy, and reducing harmful side effects simultaneously
(Figure 5) [84,85]. There are basic two strategies for tumor targeting: passive targeting
has arisen from the enhanced permeability and retention ( EPR) phenomenon in solid
tumors, while active targeting is related to specific binding between ligand grafted on
the carrier system and overexpressed receptors on the cell surface, like a guided missile.
Moreover, they can be applied by external or internal stimuli for selective drug release
at a target site only [86].
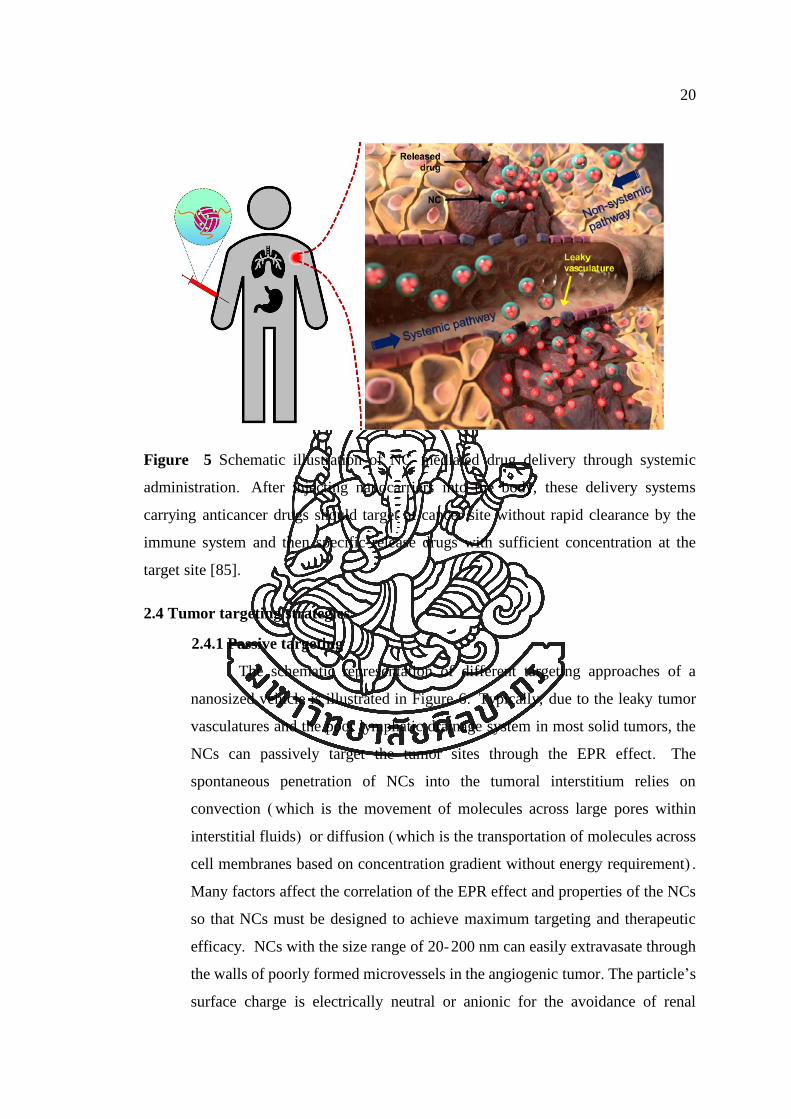
20
Figure 5 Schematic illustration of NC- mediated drug delivery through systemic
administration. After injecting nanocarriers into the body, these delivery systems
carrying anticancer drugs should target at cancer site without rapid clearance by the
immune system and then specific release drugs with sufficient concentration at the
target site [85].
2.4 Tumor targeting strategies
2.4.1 Passive targeting
The schematic representation of different targeting approaches of a
nanosized vehicle is illustrated in Figure 6. Typically, due to the leaky tumor
vasculatures and the poor lymphatic drainage system in most solid tumors, the
NCs can passively target the tumor sites through the EPR effect. The
spontaneous penetration of NCs into the tumoral interstitium relies on
convection ( which is the movement of molecules across large pores within
interstitial fluids) or diffusion ( which is the transportation of molecules across
cell membranes based on concentration gradient without energy requirement) .
Many factors affect the correlation of the EPR effect and properties of the NCs
so that NCs must be designed to achieve maximum targeting and therapeutic
efficacy. NCs with the size range of 20-200 nm can easily extravasate through
the walls of poorly formed microvessels in the angiogenic tumor. The particle’s
surface charge is electrically neutral or anionic for the avoidance of renal

21
elimination. Even though the EPR phenomenon can facilitate the extravasation
of NCs to the tumoral interstitium via passive retention mechanism, the main
challenge is the heterogeneity of EPR capability in each tumor mass and lower
accumulation of NCs in the central zone of the metastatic solid tumor.
Nowadays, there is more potential to improve the tumor targetability of NCs by
adopting active targeting strategies in various cancers [87-90].
Figure 6 Schematic illustration of tumor-targeting approaches. (a) Passive targeting:
transport drug NCs through defective and fenestrated blood vessels into the tumoral
interstitium surrounding the solid tumors by convection and passive diffusion. Small
molecules can freely move in and out of the tumor capillaries whereas drug-loaded NCs
can retain at interstitial fluid without diffusion back into blood circulation due to their
large size. (b) Active targeting: specific recognition process is involved with ligands
attached at the carrier’s surface selectively bind to receptor overexpressed at the target
site (tumor cells or endothelial cells) via sufficient affinity. Adapted from ref. [91]
2.4.2 Active targeting
The active targeting of NCs toward specific tumor tissues has been
developed to solve the weakness of passive targeting by conjugation/decoration

22
of ligand to the surface’s NCs (Figure 6). The active targeting aims to increase
the drug delivery to the pathological target and reduce off-target delivery by the
attachment of NCs with a wide range of targeting ligands including ( 1)
antibodies and their fragments ( 2) proteins and peptides- transferrin, RGD ( 3)
carbohydrates-sugar (4) vitamin-folic acid (5) other small molecules [92,93].
The ligands (single or multiple moieties) can be chemically and physically
decorated onto NCs due to the high surface area to volume ratio of NCs. These
targeting ligands can enhance biologically specific binding to the receptors
which are overexpressed on the “ tumor cell surface” or “ tumor
vasculature/ microenvironment” , as concluded in Table 1, improving the
retention and cellular uptake of NCs.
Fundamental selection of specific ligand to couples with NCs is based
on the overexpression of receptors on the target cell surface with a low level of
expression in normal tissues [94]. Generally, cellular internalization of NCs
occurs through receptor-mediated endocytosis [95]. Targeting the cancer cell is
the direct eradication of tumor cells in a specific type of cancer. It differs from
targeting the tumor vasculature that involves the inhibition of angiogenesis
surrounding tumor tissue, leading to blocking oxygen and nutrient supply and
consequent induction of indirect killing tumor cells. Compared to NCs without
ligand attachment or unconjugated form, this technique helps entry of the
nanocarrier system into the cells, enhances therapeutic efficacy, and minimizes
toxic effects to healthy tissues or organs by improving specific biodistribution
[96].

23
Table 1 Various tumor molecules and specific ligands for active targeting [96]
Target site Target molecule or receptor
(cell marker)
Ligand
Tumor vasculature/
microenvironment
Vascular endothelial growth
factor receptor (VEGFR)
Anti-VEGFR antibody,
Pegaptanib
Vascular cell adhesion molecule
(VCAM)
Anti-VCAM antibody
Matrix metalloproteinase (MMP) Anti-MMP antibody
Integrin (𝛼v𝛽3) receptor Cyclic arginine-glycine-
aspartic acid (cRGD)
Tumor cell Folate receptor (FR) Folic acid
Transferrin receptor (TfR) Transferrin
Epidermal growth factor receptor
(EGFR)
EGF antibody
Estrogen receptor (ER) Estrone
Asialoglyco-protein receptor Lectin
CD44 receptor Hyaluronic acid
To obtain optimal cancer-targeted NCs, several factors including ligand
biocompatibility, cell specificity, binding affinity, ligand surface density, and
arrangement must be carefully considered to receive optimal characteristics for
the achievement of sufficient internalization and avoidance of recognition by
the reticuloendothelial system (RES). The actively targeted NCs should deliver
chemotherapeutic drugs to specific tumor sites. The better properties of ligand-
conjugated NCs possess great therapeutic potential at both preclinical and
clinical development [97].

24
2.5 Polymeric micelles (PMs)
Currently, treatment of cancer using classic chemotherapeutic drugs still faces
major delivery drawbacks including lack of selective drug delivery, low therapeutic
activity, and serious side effect toward normal tissues. Due to these limitations, a large
number of nanocarriers have been designed and developed for the delivery of an
anticancer drug to specific tumor sites. Many pieces of research showed that these NCs
are able to improve therapeutic efficacy and potency along with reducing harmful
toxicity. PMs, which belong to polymer- based nanocarriers, have gained a lot of
attention in the area of anticancer drug delivery [98].
2.5.1 Definition
PMs are submicron colloidal particles (10-1000 nm in diameter) with a
spheroidal structure formed by the self- assembly process of amphiphilic
copolymers (di-block, tri-block, or grafted copolymer) as a building unit [99].
Amphiphilic molecules, composing of hydrophilic and hydrophobic segments,
possess the unique property of self- assembly when exposed to an aqueous
solvent at above critical micelle concentration ( CMC) or critical aggregation
concentration (CAC) [100] . The polar parts of the copolymer are attracted to
the solvent, while hydrophobic parts orient away from the solvent. In this way,
the hydrophobic parts form an inner core, whereas hydrophilic parts set up an
outer shell (corona) to build a direct or regular micelle, depicted in Figure 7. By
contrast, when amphiphilic molecules are exposed to an organic solvent, they
are conversely oriented to form a reverse micelle [101]. The core-shell structure
of PMs allows the entrapment of hydrophobic drug molecules inside the cavity
through interaction between hydrophobic core and drug molecules, while the
outer shell of PMs helps to stabilize the hydrophobic core, controls in vivo
pharmacokinetics, and is compatible with the aqueous environment [102].
Besides, the outer shell also protects the loaded drugs from interaction with the
blood components and recognition by the RES which results in prolonged
circulation of nanosized micelles in the blood followed by passive accumulation
in tumor area [24].
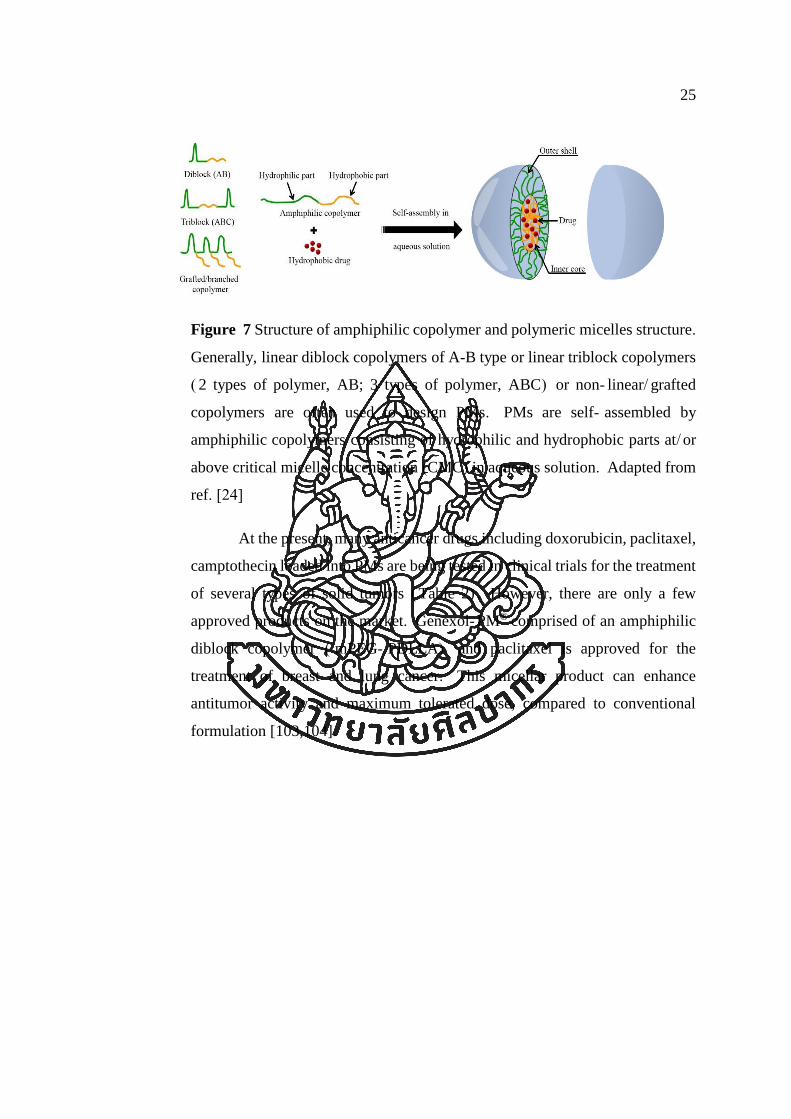
25
Figure 7 Structure of amphiphilic copolymer and polymeric micelles structure.
Generally, linear diblock copolymers of A-B type or linear triblock copolymers
( 2 types of polymer, AB; 3 types of polymer, ABC) or non- linear/ grafted
copolymers are often used to design PMs. PMs are self- assembled by
amphiphilic copolymers consisting of hydrophilic and hydrophobic parts at/ or
above critical micelle concentration (CMC) in aqueous solution. Adapted from
ref. [24]
At the present, many anticancer drugs including doxorubicin, paclitaxel,
camptothecin loaded into PMs are being tested in clinical trials for the treatment
of several types of solid tumors ( Table 2) . However, there are only a few
approved products on the market. Genexol- PM® comprised of an amphiphilic
diblock copolymer ( mPEG- PDLLA) and paclitaxel is approved for the
treatment of breast and lung cancer. This micellar product can enhance
antitumor activity and maximum tolerated dose, compared to conventional
formulation [103,104].

26
Tab
le 2
Curr
ent
clin
ical
sta
tus
of
poly
mer
ic m
icel
le f
orm
ula
tions
for
intr
aven
ous
adm
inis
trat
ion [
24,1
04]
1
Pro
du
ct
nam
e
Co
mp
osi
tion
of
cop
oly
mer
A
ctiv
e
com
pou
nd
Load
ing m
eth
od
P
urp
ose
T
her
ap
euti
c in
dic
ati
on
Gen
exol®
-PM
(ph
ase
IV)
mP
EG
-PD
LL
A
Pac
lita
xel
P
hysi
cal
entr
apm
ent
Solu
bil
izat
ion
Bre
ast
and l
un
g c
ance
r
NK
105
(ph
ase
III)
PE
G-b
-poly
(asp
arti
c ac
id)
Pac
lita
xel
P
hysi
cal
entr
apm
ent
Solu
bil
izat
ion
Bre
ast
and g
astr
ic c
ance
r
NK
911
(ph
ase
II)
PE
G-P
(Asp
)-D
ox
D
ox
oru
bic
in
Ph
ysi
cal
entr
apm
ent
Tar
get
ing
S
oli
d t
um
ors
SP
1049C
(ph
ase
III)
Plu
ronic
L61 a
nd F
127
D
ox
oru
bic
in
Ph
ysi
cal
entr
apm
ent
Anti
-MD
R
Aden
oca
rcin
om
a of
the
esophag
us
NC
-6300
(ph
ase
I)
PE
G-b
-poly
(asp
arta
te-
hydra
zone)
Epir
ubic
in
Chem
ical
conju
gat
ion
Tar
get
ing
B
reas
t an
d l
iver
can
cer
NC
-4016
(ph
ase
I)
PE
G-b
-poly
(L-g
luta
mic
acid
)
Ox
alip
lati
n
Coord
inat
e bondin
g
Tar
get
ing
S
oli
d t
um
ors
NC
-6004
(ph
ase
III)
PE
G-b
-poly
(L-g
luta
mic
acid
)
Cis
pla
tin
Coord
inat
e bondin
g
Tar
get
ing
P
ancr
eati
c ca
nce
r
2

27
2.5.2 Types of polymer used
Typically, amphiphilic copolymer molecules that are used to create PMs
should contain two basic sections, namely hydrophilic block, and hydrophobic
block.
1) Hydrophilic block: it is the very important exterior of the micelle surface
that can be designed to achieve the desired physicochemical properties.
Polyethylene glycol ( PEG) is one of the utilized hydrophilic polymers
for the development of various NCs because of its hydrophilic,
electrically neutral, less toxic, and flexibility. The hydrophilic property
at the particle surface through the PEGylation process facilitates stealth
nature in the bloodstream, circumvent uptake by RES, and prolongs their
circulation time. Due to the perfect properties of PEG, it has been used
to make the outer cloud shell of micelles for the prevention of protein
adsorption in plasma and recognition by MPS along with micellar
aggregation or precipitation via steric hindrance. Other hydrophilic
polymers that are used to form hydrophilic portions include chitosan,
poly ( ethylene oxide) ( PEO) , poly ( N- vinyl pyrrolidone) ( PVP) , and
pNIPAAm [23,105].
2) Hydrophobic block: it represents the major interior of the inner cavity
of the micelle’s core-shell structure that can entrap the hydrophobic drug
molecules via physical entrapment technique or conjugate with drugs
through chemical attachment. The inner core is normally made up of
polyesters, polyethers, and poly (amino acids) such as poly (propylene
oxide) ( PPO) , Pluronics, polycaprolactone ( PCL) , poly ( L- lactide)
( PLA) , poly ( D, L- lactide- co- glycolide) ( PLGA) , poly ( L- histidine)
(pHis), poly (L-aspartate) (pAsp), poly (L-glutamate) (pGlu). In addition
to these polymers, lipid derivatives such as stearic acid, distearoyl
phosphatidylethanolamine (DSPE) are selected to be a hydrophobic part
as well [23,106].

28
2.5.3 Advantages and limitations
PMs are widely made of biocompatible, biodegradable, low toxic, and
low immunogenicity copolymer. The nanosized particle ( 10- 200 nm) of
micelles provides high loading capacity and protects the entrapped drug from
exposure to the outer aqueous environment [107]. The useful advantages of
micelles are further explained below:
1) Enhance water solubility of poorly aqueous soluble and hydrophobic
drugs by entrapment/ solubilization of drugs within the hydrophobic core
of micelles in order to improve drug absorption and bioavailability
2) Increase blood circulation time by concealing from clearance of PMs by
recognition of macrophages in RES
3) Improve drug localization, targeting efficiency, biodistribution
( pharmacokinetic profile) , and therapeutic outcome of anticancer drugs
by surface modification such as specific ligand- conjugation onto micelle
surface for site-specific drug delivery
4) Control release of encapsulated drug at tumor sites
5) High thermodynamic stability because the CMC value of PMs can be
reduced up to the millimolar range ( 10-3 to 10-4 mM) , which lower than
low molecular weight surfactants ( 103 to 104 M) . They are durable to
dilute in a large volume of vehicles. [23,108]
Furthermore, the other advantages of micelles are their simple, easy, and
reproducible manufacturing procedure, ease of sterilization by simple filtration
for injectable preparation [109]. Although PMs possess many beneficial
properties over other NCs, the limitations of micelles remain. After systemic
administration, the micelles will be extremely diluted in biological fluid and
may be disrupted the equilibrium between micelle and blood. The premature
drug release or drug leakage and unstable structure of micelles limit the
capability of drug delivery to the target site causing ineffective cancer treatment
and toxicity to normal tissues. Another drawback of micelles is the incapacity
to load hydrophilic drugs or macromolecules. In some cases, improper
hydrophobic drug loading may cause precipitation of drug while micelles are

29
diluted with aqueous media, leading to drug aggregation-related embolism in
blood capillaries. The way to improve drug loading capacity is to match the
good compatibility between drug and copolymer and to optimize the strong
cohesive forces between hydrophobic drug and micelle’s core as well [110,111].
2.5.4 Methods for micelle preparation
The drugs can be either loaded into the PMs via physical entrapment
method or chemical conjugation method. The selection of methods for micelle
preparation depends on the physicochemical characteristics, especially
solubility of copolymer and drug [112,113]. In this context, only the physical
entrapment method (Figure 8) is briefly explained below:
Figure 8 Different physical entrapment methods for the preparation of drug-
loaded polymeric micelle; (a) dialysis, (b) O/W emulsion followed by evaporation,
(c) solvent casting, and (d) freeze-drying. Adapted from ref. [105]
1) Dialysis: this method is applicable for amphiphilic copolymers that
cannot readily dissolve in an aqueous medium. Both the copolymer and
hydrophobic drugs are separately soluble in a water- miscible organic
solvent such as dimethylsulfoxide ( DMSO) , N, N- dimethylformamide
( DMF) , acetone, acetonitrile, dimethylacetamide, and ethanol. The
mixture solution of drug and copolymer is filled into a dialysis

30
membrane tube and dialyzed against water for several days for removing
the organic solvent. During the solvent exchange, water goes inside the
tube but the organic solvent moves out from the tube, resulting in micelle
formation in the aqueous system.
2) Oil in water ( O/ W) emulsion: when copolymer cannot dissolve in
aqueous solution, this method is another option to produce micelles. The
drug is physically encapsulated through an O/W emulsification process.
Both the copolymer and hydrophobic drugs are dissolved in a water-
immiscible organic solvent such as dichloromethane (DCM) ,
tetrahydrofuran, ethyl acetate, chloroform. Then, the mixture solution
(organic phase) was gradually mixed in water (aqueous phase) to form
O/ W emulsion and the organic solvent is then removed by continuous
stirring. During the evaporation of the organic solvent, the drug-loaded
micelles are spontaneously formed in aqueous solution.
3) Solvent casting: initially, both polymer and drugs are dissolved in the
organic solvent to obtain a clear homogenous solution. The organic
solvent is evaporated to yield polymeric thin film at the bottom of the
container. The evaporation of organic solvent favors polymer- drug
interactions. The thin film is then hydrated with the aqueous solution
under heat and stirring to form drug-loaded micelles.
4) Freeze drying: this is a single-step method employed for the preparation
of drug-loaded micelles. Both the copolymer and hydrophobic drugs are
dissolved in the mixture of water/tert-butanol (TBA). Owing to the high
vapor pressure of TBA, it can accelerate the rate of sublimation during
the lyophilization process. TBA induces the formation of fine ice
crystals that quickly sublime during the freeze-drying step. The
reconstitution of freeze-dried cake with the vehicle spontaneously forms
drug-loaded micelles [102,109].
The encapsulation of hydrophobic drugs into the inner core of micelles
is related to cohesive interactions such as hydrophobic, 𝜋 - 𝜋 interactions, van
der Waals, hydrogen bonding, and electrostatic interaction, depending on the
31
nature of copolymers. Most hydrophobic anticancer drugs interact with the
hydrophobic core of copolymer via hydrophobic interaction as the main
attractive force and these drugs are loaded at sufficient loading capacity and
formed micelles having physical stability [105,114]. In addition to these non-
covalent interactions, the ionic copolymers with the opposite charge of the drug
can form micelles by electrostatic interaction, which is called polyion complex
(PIC) micelles. PIC micelles could be a potential polymer-based nanocarrier for
the delivery of charged macromolecules (proteins, nucleic acids) [115].
2.5.5 Factor influencing the properties of PMs
1) The ratio of hydrophilic/hydrophobic part
Both particle size, conformation, and drug loading of micelles are
affected by the hydrophilic- hydrophobic balance of copolymers. Copolymers
with different hydrophobic modifications show three types of patterns in the
aqueous system upon the addition of hydrophobic drugs as schematically
described in Figure 9. Copolymers with “ strong hydrophilicity” have better
compatibility with water molecules and tend to form micelles separated from
hydrophobic drugs. Although it can still entrap hydrophobic drugs, the loaded
drugs into micelles are very low with less structural stability. When a large
number of hydrophobic drugs are added in the formulation, the copolymers do
not possibly hold the whole drug in micelles and the system becomes
nanosuspensions. On the contrary, copolymers with “ strong hydrophobicity”
may occur aggregation or precipitation in the system due to good compatibility
of hydrophobic drug and polymer. Hence, copolymers with suitable
hydrophilic- hydrophobic ratio can be formed PMs with desirable properties
because of equilibrated interaction among drug, polymer, and water molecules.
The size of micelles is governed by both polymer chain length and hydrophilic-
hydrophobic block ratio. The increase in the hydrophobic region leads to higher
hydrophobic bonding and forms closely compacted, resulting in the
maintenance of a stable micellar system [106,110].
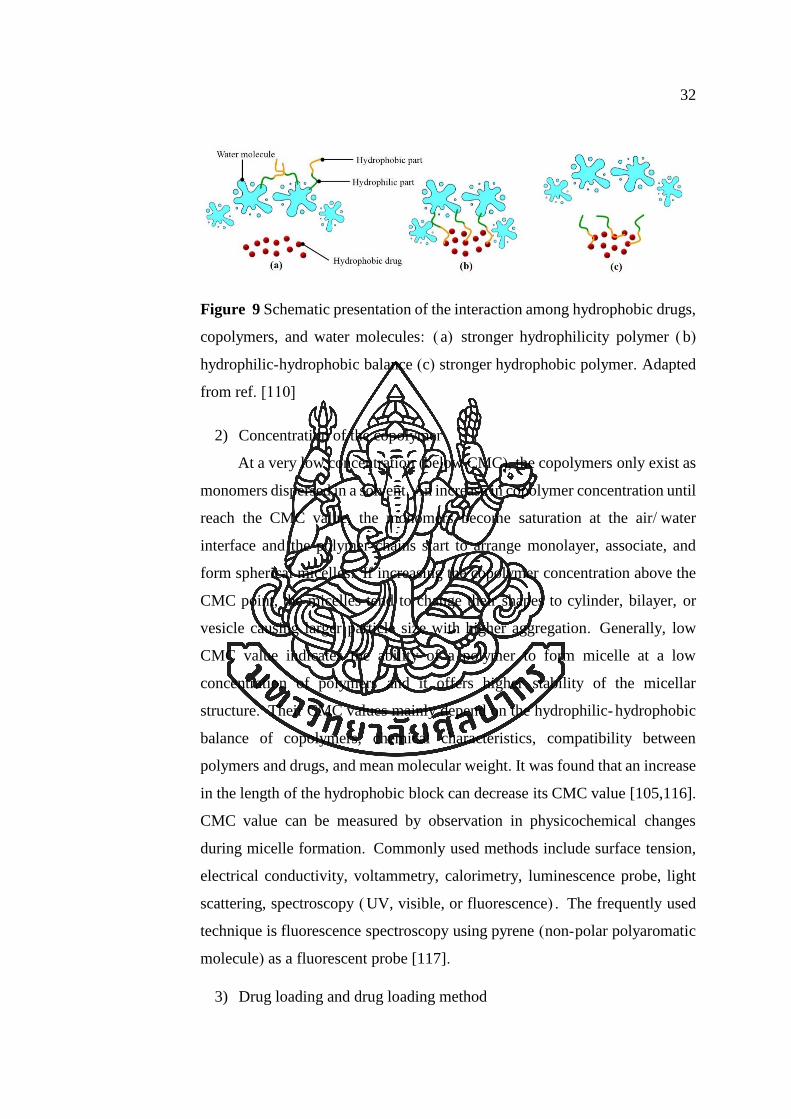
32
Figure 9 Schematic presentation of the interaction among hydrophobic drugs,
copolymers, and water molecules: ( a) stronger hydrophilicity polymer ( b)
hydrophilic-hydrophobic balance (c) stronger hydrophobic polymer. Adapted
from ref. [110]
2) Concentration of the copolymer
At a very low concentration (below CMC), the copolymers only exist as
monomers dispersed in a solvent. An increase in copolymer concentration until
reach the CMC value, the monomers become saturation at the air/ water
interface and the polymer chains start to arrange monolayer, associate, and
form spherical micelles. If increasing the copolymer concentration above the
CMC point, the micelles tend to change their shapes to cylinder, bilayer, or
vesicle causing larger particle size with higher aggregation. Generally, low
CMC value indicates the ability of a polymer to form micelle at a low
concentration of polymers and it offers higher stability of the micellar
structure. Their CMC values mainly depend on the hydrophilic- hydrophobic
balance of copolymers, chemical characteristics, compatibility between
polymers and drugs, and mean molecular weight. It was found that an increase
in the length of the hydrophobic block can decrease its CMC value [105,116].
CMC value can be measured by observation in physicochemical changes
during micelle formation. Commonly used methods include surface tension,
electrical conductivity, voltammetry, calorimetry, luminescence probe, light
scattering, spectroscopy ( UV, visible, or fluorescence) . The frequently used
technique is fluorescence spectroscopy using pyrene (non-polar polyaromatic
molecule) as a fluorescent probe [117].
3) Drug loading and drug loading method
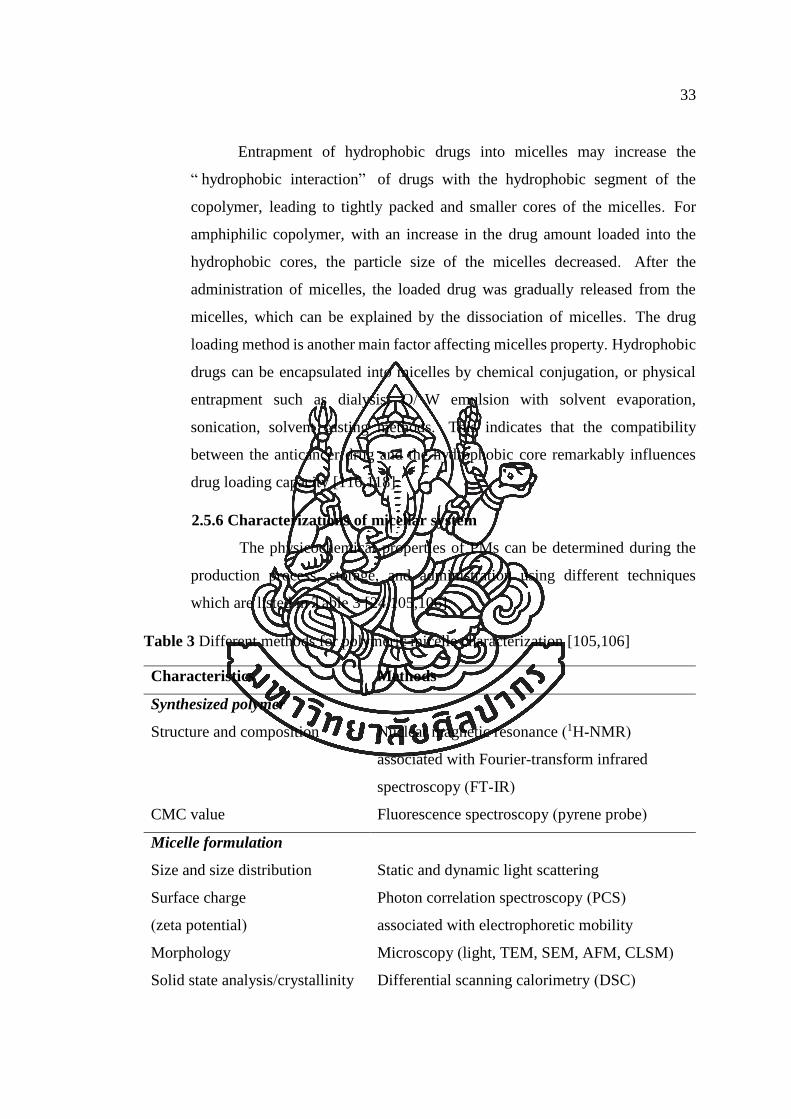
33
Entrapment of hydrophobic drugs into micelles may increase the
“ hydrophobic interaction” of drugs with the hydrophobic segment of the
copolymer, leading to tightly packed and smaller cores of the micelles. For
amphiphilic copolymer, with an increase in the drug amount loaded into the
hydrophobic cores, the particle size of the micelles decreased. After the
administration of micelles, the loaded drug was gradually released from the
micelles, which can be explained by the dissociation of micelles. The drug
loading method is another main factor affecting micelles property. Hydrophobic
drugs can be encapsulated into micelles by chemical conjugation, or physical
entrapment such as dialysis, O/ W emulsion with solvent evaporation,
sonication, solvent casting methods. This indicates that the compatibility
between the anticancer drug and the hydrophobic core remarkably influences
drug loading capacity [116,118].
2.5.6 Characterizations of micellar system
The physicochemical properties of PMs can be determined during the
production process, storage, and administration using different techniques
which are listed in Table 3 [24,105,106].
Table 3 Different methods for polymeric micelle characterization [105,106]
Characteristics Methods
Synthesized polymer
Structure and composition Nuclear magnetic resonance (1H-NMR)
associated with Fourier-transform infrared
spectroscopy (FT-IR)
CMC value Fluorescence spectroscopy (pyrene probe)
Micelle formulation
Size and size distribution Static and dynamic light scattering
Surface charge
(zeta potential)
Photon correlation spectroscopy (PCS)
associated with electrophoretic mobility
Morphology Microscopy (light, TEM, SEM, AFM, CLSM)
Solid state analysis/crystallinity Differential scanning calorimetry (DSC)

34
Drug encapsulation Spectrophotometry, florescence spectroscopy,
HPLC and electrochemical techniques
In vitro drug release Dialysis diffusion method in specified release
medium that mimic the physiological fluid
In vitro structural stability Size exclusion chromatography (SEC) and gel
permeation chromatography (GPC)
In vitro cytotoxicity Tetrazolium dye (MTT) assay, flow cytometry
analysis
CMC, critical micelle concentration; TEM, transmission electron microscope; SEM, scanning electron microscope; AFM, atomic
force microscopy; CLSM, confocal laser scanning microscope.
2.5.7 Application of PMs in cancer therapy
Advances in polymer modification and the versatility of PMs forming
copolymers make them an attractive carrier in cancer therapy. The leaky
endothelium of the tumor vasculature and poor function of the lymphatic
drainage system leads to the retention of the micelles with a smaller size
(between 10-200 nm) in the tumoral interstitium. The passive targeting through
the EPR effect can enhance drug accumulation with higher concentration at
certain tumor tissue, compared to healthy tissues. Ideally, the micelle size
should not smaller than 10 nm to avoid quick glomerular filtration and not
bigger than ∼200 nm to escape removal from the plasma by liver and spleen
after i. v. administration. The high surface charge ( zeta potential > - 30 mV)
helps to improve physical stability through electrostatic repulsion. Nevertheless,
the permeability of fenestrated tumor endothelium fluctuates depending on the
tumor’s type and stage, anatomical area of the tumor [119]. For actively targeted
cancer cells via active targeting, different types of ligands namely, folic acid,
peptides, carbohydrates, antibodies are decorated on the micelle surface for the
development of the site- specific drug nanoparticles. These ligands enable to
specifically bind overexpressed receptors/ antigens on targeted cells with high
biological affinity. The surface modification is proceeded by coupling the
targeting ligands at the distal end of the hydrophilic block. The actively targeted
micelles exhibit better drug delivery to the tumor area and cellular
internalization, compared with passively targeted micelles relying on the EPR

35
effect [23]. In addition, stimuli- sensitive micelles are constructed from a
modified polymer that is responsive to internal stimuli ( low pH at tumor
microenvironment, higher temperature due to inflammation process, redox
reaction, higher production of enzymes) or external stimuli (local hyperthermia,
light energy, ultrasound, magnetic field) . When stimuli- sensitive polymers in
micelles are locally exposed with a signal, the micellar structure suddenly
destabilizes or transforms to release the payload of anticancer drugs at the right
concentration at a specific diseased site [120]. The drug- loaded micelles with
the behavior of site- specific drug delivery improve therapeutic efficacy along
with decrease side effects [121].
2.6 Liposomes (LPs)
In the past few decades, liposomes were first published by Alec Bangham in
1964. Later, the word “liposomes” was denominated by Gerald Weissman (lipos = fat;
soma = body) [122]. This lipid-based nanocarrier has been used to carry various drugs
i.e. antibiotics, antifungals, and cytotoxic agents. It’s well known that chemotherapeutic
drugs can inhibit the growth of both cancer and normal cells, especially in fast-
proliferating healthy cells ( epithelial in oral, GI tract, a hair follicle) , thereby it needs
to be careful during treatment with these chemotherapeutic drugs to balance between
the anticancer efficacy and system toxicity in cancer patient [35,123]. Liposomes have
been utilized to improve current cancer treatment due to unique features including
increased solubility of low aqueous soluble anticancer drugs and encapsulation of both
hydrophobic and hydrophilic compounds. The development of optimal liposomal
formulations is intended to achieve sufficient therapeutic efficacy and the minimization
of side effects. The liposomes can be modified to decrease the carrier clearance by
mononuclear phagocyte system’ s ( MPS) uptake using long- circulating liposomes
which support a passive targeting toward the solid tumors and they have a potential to
be greater drug accumulation into targeted tumor site via active targeting strategies,
coupling specific ligands to the liposome surface. The combination of this lipid-based
nanocarrier and drug transport mechanisms facilitate to increase drug bioavailability,
improve therapeutic efficacy, and/or lessen system toxicity [36,37].

36
2.6.1 Definition
Liposome, belonging to a type of lipid-based nanocarriers, is a vesicular
structure entirely enclosed by one or more membranous lipid bilayers or
lamellae that encapsulate both hydrophilic and lipophilic compounds ( Figure
10). The concentric lipid bilayers are separated by aqueous compartments [124].
The basic molecular building block of a typical liposomal membrane is a
phospholipid which is similar to the phospholipid cell membrane. In an aqueous
environment, phospholipids orient to a thermodynamically stable structure
called a “bilayer”. This flat sheet of lipids then curves into a spherical liposomal
structure [39,125].
Figure 10 Basic structure and classification of liposomes: small unilamellar
vesicles ( SUV) , large unilamellar vesicles ( LUV) , and multilamellar vesicles
(MLV). Adapted from ref. [122]
2.6.2 Basic components in liposomes
The function of phospholipid in liposomes
Generally, the amphiphilicity of phospholipid molecules contains two
elemental parts: polar phosphate head groups ( water-soluble hydroxy)
connected with the hydrophobic ( non- polar) backbone, as presented in Figure
10 [126]. The spontaneous formation of liposomes can be explained that when
phospholipid is dispersed in an aqueous medium, the hydrophilic interaction of
the lipid head groups with aqueous environment conduces to organize

37
themselves for forming an aqueous cavity (hydrophilic compartment), whereas
the hydrocarbon tails ( saturated or unsaturated fatty acid) are repelled by the
water molecules and arrange in the opposite direction. The head groups of the
inner layer orient inside the intravesicular liposome and the outer layer point to
an aqueous medium. According to its structure, liposomes can encapsulate
“lipophilic drugs” within the lipid bilayer, at the same time, their aqueous cavity
is reserved for loading “hydrophilic drugs” [127].
Currently, many derivatives of phospholipids have been used to prepare
liposomes such as phosphatidylcholine (PhC, zwitterionic), phosphatidylserine
(PhS), phosphatidylglycerol (PhG), phosphatidylinositol (PhI, negative charge),
DOTAP, DOTMA (positive charge), and sphingomyelin (SM), etc. The suitable
properties of phospholipids should be biodegradability, biocompatibility, non-
toxicity, and low immunogenicity. The natural phospholipids consist of a
mixture of various lipid components while synthetic phospholipids are uniform
and pure fatty acyl chains. Among these lipids, phosphatidylcholine or lecithin
( Figure 11a) is the most frequently used because of its proper stability in the
biological environment. The surface charges of liposomes are neutral, positive
or negative charge, depending on the polar head charge of used phospholipids
[128].
The function of cholesterol in liposomes
Despite certain stability of liposomes formed by a single type of
phospholipid, the flip- flop movement ( rotational freedom) and imperfect
packing of phospholipid molecules remain and make the drug leakage from
liposomes [38]. The chemical structure of cholesterol ( Chol) is presented in
Figure 11b. Cholesterol, hydrophobic and water-insoluble steroid backbone, is
added into liposomal formulations as a function of co-lipid to (1) increase their
stability of bilayer membrane in the biological fluids, (2) enhance rigidity’s lipid
bilayer membrane, ( 3) improve packing capacity between the phospholipid
molecules, and (4) reduces the permeability of water-soluble molecules through
the membrane. Thus, most liposomes delivering various types of drugs
including chemotherapeutic agents need to be put into during liposomal

38
production [129]. The polar part of cholesterol is aligned with the polar head of
phospholipids in the lipid bilayer. Due to hydrophobic chains of cholesterol, it
resides in the interior portion of lipid bilayers and serves to fill the gap between
phospholipids, leading to the prevention of flip- flop movement of lipid
membrane [130]. The percentage of cholesterol used in liposomal formulations
affects the phase transition temperature of the lipid bilayer. Furthermore, the
effect of cholesterol on size is found that an increase in cholesterol concentration
leads to an increase in liposomal size and shape transition. The molar percentage
of cholesterol varying from 30-45% of total lipid components serves the balance
of lipid membrane fluidity and rigidity while the molar percentage of
phospholipids varying from 55- 100% of total lipid constituents is the main
lipidic membrane of a liposome. In some cases, the inclusion of cholesterol can
decrease drug loading into the liposomal structure because it hinders drug
penetration in the bilayer. By contrast, liposomes without cholesterol tend to
react with blood proteins such as albumin, transferrin, and macroglobulin,
resulting in the destabilization and reduced utility of liposomes as a drug
delivery system [122,131].
Figure 11 Chemical structure of common liposomal lipid constituents: ( a)
phosphatidylcholine (b) cholesterol and (c) DSPE-PEG2000. The length and
degree of saturation in the carbon chain can vary in each class of phospholipids.
[128]

39
2.6.3 Advantages and limitations
Nowadays, the liposomal formulations have a lot of unique
characteristics over the conventional dosage form, as described hereafter:
1) Deliver various types of active compounds: hydrophilic compounds
( proteins, peptides, carbohydrates, nucleic acids) are entrapped within
the aqueous core, lipophilic compounds are inserted inside the lipid
bilayer and amphiphilic molecules are located in both the aqueous cavity
and lipid bilayer.
2) Improve water solubility and bioavailability of poorly water- soluble
drugs
3) Protect the payload drug from the loss and degradation such as an acidic
level in the GI tract, chemical degradation ( hydrolysis or photolysis)
during preparation, storage and drug transport, and the biological barrier
such as MPS uptake in the liver and spleen
4) Improve pharmacokinetic and pharmacodynamic profiles of a
therapeutic drug by surface modification/functionalization
5) Promote the controlled and sustained release of drug from liposomal
vesicles and reduce drug leakage before reaching to target tumors
6) Biocompatibility, biodegradability, low toxicity, lack of immune system
activation in the human body due to the cell-like structure of liposome
7) Lower systemic toxicity and side effects, compared to traditional
chemotherapeutic regimen [21,35-37]
2.6.4 Classification of liposomes
Liposomes are mainly categorized based on size (small, intermediate, or
large) , the number of lipid bilayers ( uni- and multi- lamellar) , phospholipid
charges ( neutral, anionic, and cationic) , lipid composition, and mechanism of
drug delivery. Liposomal vesicles vary in size between 0. 025 µm to 2. 5 µm
[39]. Unilamellar vesicles consisting of a single phospholipid bilayer are
subdivided into small unilamellar vesicles (SUV) with a mean diameter vesicle
ranging from 25 to 100 nm and large unilamellar vesicles ( LUV) with size
ranging from 100 to 1000 nm [126]. Multilamellar vesicles (MLV) are made of

40
multiple lipid bilayers ( ⩾2) that are separated by the layers of aqueous, with
size in the micron range (1-5µm). Their lamellae mimic an onion-like structure
( Figure 10) . Both the size and number of lamellae in the liposomes are
considered to be the most crucial factors influencing the vesicle half- life in
plasma. As considered the composition and purpose of drug delivery, the
liposomes are classified into conventional liposomes, stealth liposomes, ligand-
conjugated liposomes, and triggered release liposomes ( pH- sensitive, thermo-
sensitive), as shown in Figure 12 [132].
Figure 12 Type of liposomes based on components in the formulation: ( a)
conventional liposomes are made of phospholipids, ( b) PEGylated/ stealth
liposomes are composed of coating of polyethylene glycol at liposome surface,
(c) targeted liposomes contain a specific targeting ligand to target cells at tumor
environment, and (d) multifunctional liposomes. Adapted from ref. [37]
I. Conventional liposomes (First generation)
The basic components of conventional liposomes are phospholipids and
cholesterol. Despite the valuable advantages of liposomes, one of the major
hindrances of conventional liposomes is their instability in the biological fluid.

41
They have a short half- life in the bloodstream after i. v. injection due to quick
phagocytosis and rapid clearance by macrophage cells in MPS. To overcome
this weakness, the surface coating of liposome with inert hydrophilic materials
have been developed to achieve long-circulating liposomes. The introduction of
a 5-10% (molar ratio) of PEG lipid-derivatives prevents opsonization because
the PEG layer at the surface of liposomes provides high hydrophilicity and steric
hindrance between liposomes and blood proteins (serum opsonin, complements)
leading to the reduction in protein adsorption. Owing to the leaky property of
tumor neovascular, nanocarriers including liposomes can penetrate across the
gap between endothelium and enter the interstitial space [133]. In addition, solid
tumors have impairment of the lymphatic drainage system lead to the retention
of nanocarriers in tumor sites for a longer period. This phenomenon has been
well- known as the EPR effect. In other words, passive targeting of liposomes
takes place by moving them from capillaries into the tumoral interstitium. The
nanocarriers of not more than 200 nm have been reported for effective
extravasation into tumors. The composition and charge on the liposome surface
affect the passive targeting. The anionic or neutral liposomes can escape from
renal clearance while the cationic liposomes seem to interact with anionic
species in the blood, leading to rapid clearance by the RES [21].
II. Stealth liposomes or PEGylated liposomes (Second generation)
The insertion of polyethylene glycol ( PEG) molecules in the bilayer
membrane via PEGylation can significantly enhance longevity in the blood of
liposomes, compared to traditional liposomes. PEG polymer can improve
stealth property in liposomes due to desirable properties such as high solubility
in an aqueous medium, inert, flexible, nonionic, biocompatibility, and it is
approved by US FDA as a safe material [134]. The 1,2-diastearoyl-sn-glycero-
3- phosphoethanolamine ( DSPE) ( Figure 11c) is often used to covalently
conjugated other hydrophilic polymers like PEG. The grafting of PEG to the
liposome surface mimics the glycoprotein on the cell surface in the human body.
The long-circulation property is directly related to the amount and length of the
grafted PEG chain ( molecular weight) . The long-chain PEG has better

42
pharmacokinetic behaviors than a short-chain. The DSPE- PEG2000 has been
proven to provide extended blood circulation and ligand binding in vivo [135].
Normally, the addition of PEG lipid derivatives during mixing lipid components
can prevent opsonization from RES due to an increase in surface hydrophilicity,
promoting repulsive interactions between polymer-coated liposomes and blood
components. Moreover, PEG can form a protective hydrophilic layer on the
liposome surface and prevent vesicle aggregation through the steric stabilization
effect. However, the hydrophilic layers on the surface of stealth liposomes may
hinder the fusion of liposomal lipid membrane into the tumor cell membrane,
leading to a decrease in drug cellular uptake. Moreover, some side effects are
still caused by the non- specific drug distribution in the body of PEGylated
liposomes [33]. Furthermore, Lee et al. reported that the sterically- stabilized
liposomes with a slightly negative zeta potential had longer blood circulation
times and higher tumor accumulation than stealth liposomes with highly
negative zeta potentials [136]. Some reports revealed that the PEG- lipid
derivatives in liposome can induce an antibody response ( anti- PEG IgG and
IgM) against the PEG chain, leading to accelerated clearance of liposomes by
macrophages in the liver and spleen. This phenomenon is called accelerated
blood clearance (ABC) [36,137,138].
III. Ligand targeted liposome
This liposomal system brings the improvement of tumor accumulation
and therapeutic efficacy and reducing the adverse effects, arisen from the non-
specific distribution of drug carriers in the human body. Liposomes can be
functionalized with specific targeting ligands such as monoclonal antibodies,
aptamers, proteins ( transferrin) , peptides ( RGD) , carbohydrates ( sugar) , or
small molecules ( folic acid) using different surface engineering strategies.
These ligands can recognize and bind on specific macromolecules or receptors
on the cell surface ( cancer cells or tumoral endothelium) with high biological
affinity. It may be called as active targeting liposomes or targeted liposomes or
decorated liposomes [37]. This liposome is capable of direct delivery to the
region of solid tumors and enhances the internalization of liposomes in tumor

43
cells, via mainly receptor- mediated endocytosis, in a process called active
targeting. The liposome surface can be modified by attachment to these ligands
via a covalent bond, electrostatic, and hydrophobic interaction. The ligands can
be linked to the distal ends of PEG chains or grafted on the liposome surface.
Furthermore, the liposomes that are conjugated with antibodies on the surface
can be named as immunoliposomes ( ILPs) [ 3 6 ] . It can selectively bind with
targeting receptors that overexpressed on the surface of tumor cells ( epidermal
growth factor receptor, EGFR; folate receptor, FR; transferrin receptor, TfR;
etc. ) or endothelial cells and other cells in tumor vasculature ( vascular
endothelial growth factor, VEGF; vascular cell- adhesive molecule, VCAM;
𝛼v𝛽3 integrin; matrix metalloproteases, MMPs; etc.). Many studies reported that
it could have greater targeting efficiency if the antibody is attached to a spacer
arm rather than directly linked to the liposome surface [35,127].
Multifunctional liposomes are the delivery systems that combine the
surface modification with a variety of functional groups such as two ligands-
grafted liposomes (dual-functional liposomes) or two compounds-encapsulated
liposomes (theranostic liposomes that contain an imaging and therapeutic agent,
etc) [ 3 6 ] . Another type of liposomes is cationic liposomes that are made of
positive charge lipids such as DOTAP, DOTMA. It can encapsulate DNA and
RNA in the aqueous core for delivery into targeted cells. The positively charged
lipid can bind negatively charged nucleic acid through electrostatic interactions.
These are called lipoplexes [139].
IV. Stimuli-responsive liposomes
Liposomes can be modified to be a triggered release of therapeutic
payloads utilizing pathophysiological differences in the tumor’ s
microenvironment. Moreover, many liposomal systems containing appropriate
lipid components can be responded by various internal or external stimulation
such as pH, redox reaction, a proteolytic enzyme, ultrasound, heat, or light
offering controlled drug release at a diseased site [140,141]. A pH- responsive
liposome maintains a stable structure at physiological pH ( pH 7. 4) but can
dissociate and release the loaded drugs under mildly acidic conditions in tumor

44
tissues [142]. A thermal- sensitive liposome is made of thermo- sensitive
phospholipids that are stable at body temperature (37°C). When it is stimulated
by local heating at a temperature above the lipid phase transition temperature,
the entrapped drugs are readily released from the liposome and accumulated at
the tumor sites. For instance, Thermodox® ( commercially liposomal
doxorubicin formulation) contains DPPC ( dipalmitoylphosphatidylcholine) ,
MSPC (myristoystearoyl phosphatidylcholine), and DSPE-PEG2000. After i.v.
injection followed by the hyperthermia process ( temperature range of 37°C to
42°C) , the entrapped drug is released from liposomes with higher drug
concentration at target tumors [143,144].
2.6.5 Methods for liposome preparation
The types of preparation methods influence the properties of liposomes,
including their shape, size, stability, and drug loading efficiency. Liposomes are
mainly prepared by the passive- or active-loading procedure. The passive-
loading method is performed by mixing the drug before or during the liposome
formation, whereas the active- or remote-loading method is accomplished by
loading the drug into premade liposomes. There are several passive loading
methods for the preparation of liposomes such as mechanical dispersion ( thin-
film hydration or membrane extrusion), solvent dispersion (solvent injection, or
reverse-phase evaporation) , detergent removal, and emulsion removal [145].
Liposomes are spontaneously self- assembled colloidal vesicles formed by
hydration of phospholipids with aqueous buffer solution under shaking or
stirring. The organization of phospholipids is driven by the entropy of water
molecules and by hydrophobic interactions between the fatty acyl chains.
Generally, each liposome preparation involves three steps: vesicle formation,
vesicle size reduction, and purification, as summarized in Table 4. The
lipophilic drugs are co- dissolved with other lipids in an organic solvent and
added in the first step, whereas the hydrophilic drugs are dissolved in an aqueous
medium and added in the step of film hydration [102,146].
The lipid film-hydration method is the first described and most
commonly used method for liposome preparation. Lipid hydration followed by

45
vortex or stirring, also known as “Bangham’s method” (Figure 13). Briefly, the
lipid components are dissolved in a suitable organic solvent such as chloroform
and/or methanol mixture. The concentration of lipids is typically in the range of
10-20 mg/mL depending on the solubility of lipids in the organic solvent. The
lipid solvent is subsequently removed by a rotary evaporator under low pressure
or flow of nitrogen gas ( N2) to produce a thin film of the lipids. Next, the dry
lipid film is hydrated with an aqueous buffer medium, which has a similar
osmolarity to the physiological medium, under the temperature above the phase
transition temperature (Tc) of the lipids. After that, vortex or shaking is applied
to produce multiple bilayers ( MLV) liposomes. Despite the simple method to
form a vesicle, the drug loading is not sufficient to encapsulate the hydrophobic
drugs because of the small captured volume in MLV liposomes. For reducing
the vesicle size of MLV to form SUV, sonication using a probe or bath sonicator
is generally introduced into liposomal dispersion. The temperature of the water
is maintained above the Tc of lipids. To avoid degradation of the drugs and
lipids, it needs to keep the lipid dispersion in an ice bath during the sonication
with high energy. Sonic wave can disrupt the outer layers of giant liposomes
and reorganize the lamellae into uniform SUV, thereby the hydrophobic drugs
can easily translocate across the lipid bilayer to obtain higher drug encapsulation
efficiency. The final size of liposomes not only depends upon the sonication
time, energy input, and the number of cycling but also upon other factors,
including lipid composition, concentration, and dispersion volume.
Alternatively, the liposomes are also pass through the extrusion process using a
polycarbonate membrane of actual size under high pressure and at a temperature
above Tc of lipids. This process which is done in several cycling can provide
only nanometer vesicle size and takes the larger one out. Hence, the size of the
extruded liposomes tends to be close to the filter pore size with unimodal size
distribution. After the formation of SUV vesicles, the excess lipid components,
unentrapped drugs, and traces of titanium from the probe sonicator have to be
removed through a purification process [146-148].

46
Figure 13 Pictorial representation of liposome preparation by lipid thin- film
hydration followed by vortex or manual stirring. Adapted from ref. [145]
Table 4 Different methods for liposome preparation [145,147]
Step 1: vesicle formation Type of final liposomes
Lipid hydration and shaking MLV
Reverse-phase evaporation MLV, LUV
Organic solvent injection MLV, LUV, SUV
Freeze-thawing MLV, SUV
pH gradient LUV, SUV
Dehydration-rehydration MLV
Detergent analysis MLV, LUV
Step 2: vesicle size reduction
Sonication SUV
Microfluidization SUV
Extrusion through membranes LUV, SUV
High-pressure homogenization LUV, SUV
Step 3: purification
Centrifugation, dialysis, column chromatography separation, ultrafiltration
Selection of phospholipids
47
The type, molar percentage, surface charge, and packing orientation of
phospholipids determine the physicochemical properties of liposomes. The Tc
of phospholipids is also an important criterion to select phospholipids for
liposome preparation. The Tc is defined as the temperature required to prompt
a change in the lipid physical state from an ordered gel phase where the fatty
acyl chains are tightly packed, to a disorganized liquid crystalline phase, where
the hydrocarbon chains are loosely oriented and fluid- like [149]. The Tc of
phospholipids depends on hydrocarbon chain length, unsaturation, charge, and
head group series. As the hydrocarbon length is increased, van der Waals
interactions become stronger requiring more energy to destroy the well-ordered
packing, thus the phase transition temperature increases. Likewise, introducing
a cis double bond into the acyl group puts a kink in the hydrocarbon chain which
requires much lower temperatures to receive an ordered packing arrangement.
The formation of liposome using phospholipids with higher Tc provides more
stability and reduces the risk of premature drug release. As the satisfactory
release behavior, the drug molecules will be released from liposomes once they
reach the tumor sites. On the contrary, when liposomes are formed from too
high Tc of phospholipids, the entrapped drug may be denatured during the
loading step. Therefore, the optimum Tc of phospholipids in a liposomal
formulation is preferred for minimizing drug leakage and releasing the drug at
the right diseased sites [150]. Moreover, the vesicle size, lipid composition,
surface coating, surface charge, and interaction of liposome and plasma protein
affect drug plasma concentration and clearance process of liposomes in the
whole body [151].
2.6.6 Characterization of liposomes
The different techniques employed for the characterization of liposomes
are listed in Table 5. Physicochemical characterization comprises of
measurement of size, surface charge, morphology, and lamellarity of liposomes.
The drug release profile is also studied in different media. Chemical
characterization is measured for percentage encapsulation, which is the ratio
between the actual quantity of drugs inside the liposomes and the quantity of

48
initial drug added to the liposomal formulation. Another term is loading
capacity, which is the ratio between the loaded drug within the liposomes and
the total lipids of the liposomal formulation [120,152].
Table 5 Different techniques for liposome characterization [145,147]
Characteristics Methods
Phospholipid quantification Lipid phosphorus content (Bartlett method)
Vesicle size and size
distribution
Static and dynamic light scattering, size-exclusion
chromatography
Surface charge Photon correlation spectroscopy associated with
electrophoretic mobility
Morphology Microscopy techniques (light, electronic and
atomic force)
Drug encapsulation Spectrophotometry, florescence spectroscopy,
HPLC and electrochemical techniques
Lamellarity Nuclear magnetic resonance (31P-NMR), electron
microscopy, small angle X-ray scattering
Lipid phase-transition
temperature
Differential scanning calorimetry and nuclear
magnetic resonance (1H-NMR)
2.6.7 Stability of liposomes
The physical and chemical stability of the liposomes is the main
restriction for the development of an effective delivery system. Physical
instabilities of liquid dispersions of liposomes such as aggregation, flocculation,
fusion, and coalescence are usually found during storage. These events can
change vesicle size and size distribution and lose the encapsulated drugs from
the phospholipid bilayers. Accordingly, it is more preferable to keep liposomal
preparations in solid form. Several techniques are available for conversion of
the colloidal dispersions of liposomes to dry powders, such as freeze-drying,
spray drying, and supercritical fluid [30,37]. The liposomal aggregation can be
prevented by electrostatic repulsion between the vesicles arisen from the use of
the ionic polar head group’ s phospholipids. The higher electrostatic repulsive

49
forces may be optimized by an increase in surface charge density and a decrease
in ionic strength stability. Other repulsive interactions, van der Waals is the
minimum requirement for helping to reduce aggregation as well. Chemical
degradation of liposomes often occurs at the phospholipid bilayer membranes;
( 1) hydrolysis of the ester bonds between fatty acids and glycerol backbone in
the presence of water. The chemical reaction generates lysophospholipids,
which reduce rigidity’ s lipid membrane, enhance permeability, and destabilize
the liposomal structure ( 2) lipid peroxidation of unsaturated fatty acyl chain’ s
phospholipid tends to produce free radical species. From these instabilities, the
saturated, short/ medium- chain lipids are developed to form a better stable
liposome [38,39]. Several factors that affect liposomal stability include
liposomal composition, fatty acid side- chains, polar head, chain length, and
degree of saturation. Additionally, “phospholipid to cholesterol molar ratio” is
also essential for stoutness’ bilayers and control of drug release [153]. To
maintain the stability of liposomes, it is recommended that liposomes should be
stored in a refrigerator [132].
2.6.8 Application of LPs in cancer therapy
The chemotherapeutic drugs are used in single or combination treatment
for standard interventions in cancer patients. Most of them are restricted in
clinical application because of several issues including narrow therapeutic
index, off- target systemic toxicity arisen from poor specific drug distribution,
development of multidrug resistance. These problems can lead to failure in
cancer therapy. Several anticancer drugs loaded in liposomal formulations have
been developed to solve the limitations of conventional chemotherapies to
achieve effective therapeutic outcomes with less toxicity toward normal cells by
specific delivery of drugs at targeted tumor sites. More importantly, good lipid
carriers having desirable properties should not only enhance high cytotoxicity
against malignant tumors but also improve patients’ quality of life and extend
survival time. Liposomes are the first nanocarrier systems to be approved for
use in humans in 1995, in the tradename of Doxil®. Some liposomal
formulations of anticancer drugs approved by US FDA/ other regulatory

50
authorities were commercially launched in the market and plenty of liposomes
are being tested in clinical trials, as listed in Table 6. Most of all products are
administered via i. v. route. When anticancer drugs are encapsulated in
liposomal structures, they help to reduce the risk of drug exposure with normal
tissues, resulting in reducing side effects as well as improving their therapeutic
index [122,154,155].
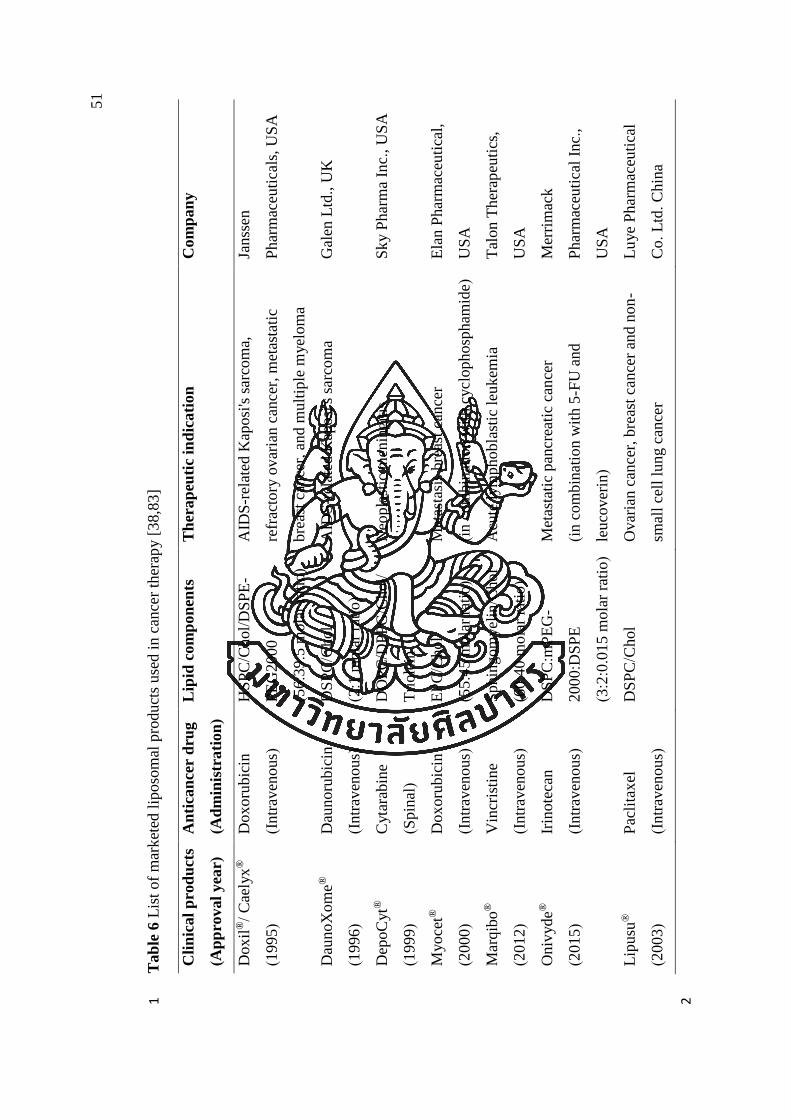
51
Tab
le 6
Lis
t of
mar
ket
ed l
iposo
mal
pro
duct
s use
d i
n c
ance
r th
erap
y [
38,8
3]
1
Cli
nic
al
pro
du
cts
(Ap
pro
val
yea
r)
An
tica
nce
r d
rug
(Ad
min
istr
ati
on
)
Lip
id c
om
pon
ents
T
her
ap
euti
c in
dic
ati
on
C
om
pan
y
Dox
il®/
Cae
lyx
®
(19
95)
Dox
oru
bic
in
(Intr
aven
ous)
HS
PC
/Chol/
DS
PE
-
PE
G2000
(56:3
9:5
mola
r ra
tio
)
AID
S-r
elat
ed K
aposi
's s
arco
ma,
refr
acto
ry o
var
ian c
ance
r, m
etas
tati
c
bre
ast
cance
r, a
nd m
ult
iple
myel
om
a
Janss
en
Phar
mac
euti
cals
, U
SA
Dau
noX
om
e®
(19
96)
Dau
noru
bic
in
(Intr
aven
ous)
DS
PC
/Chol
(2:1
mola
r ra
tio
)
AID
S-r
elat
ed K
aposi
's s
arco
ma
Gal
en L
td., U
K
Dep
oC
yt®
(19
99)
Cyta
rabin
e
(Spin
al)
DO
PC
/DP
PG
/Chol/
Tri
ole
in
Neo
pla
stic
men
ingit
is
Sk
y P
har
ma
Inc.
, U
SA
Myoce
t®
(20
00)
Dox
oru
bic
in
(Intr
aven
ous)
EP
C/C
hol
(55:4
5 m
ola
r ra
tio
)
Met
asta
sis
bre
ast
cance
r
(in c
om
bin
atio
n w
ith c
yclo
phosp
ham
ide)
Ela
n P
har
mac
euti
cal,
US
A
Mar
qib
o®
(20
12)
Vin
cris
tin
e
(Intr
aven
ous)
Sphin
gom
yel
in/C
hol
(60:4
0 m
ola
r ra
tio
)
Acu
te l
ym
phobla
stic
leu
kem
ia
Tal
on T
her
apeu
tics
,
US
A
Oniv
yde®
(20
15)
Irin
ote
can
(Intr
aven
ous)
DS
PC
:mP
EG
-
2000:D
SP
E
(3:2
:0.0
15 m
ola
r ra
tio
)
Met
asta
tic
pan
crea
tic
can
cer
(in c
om
bin
atio
n w
ith 5
-FU
and
leuco
ver
in)
Mer
rim
ack
Phar
mac
euti
cal
Inc.
,
US
A
Lip
usu
®
(20
03)
Pac
lita
xel
(Intr
aven
ous)
DS
PC
/Chol
Ovar
ian c
ance
r, b
reas
t ca
nce
r an
d n
on
-
smal
l ce
ll l
ung c
ance
r
Lu
ye
Phar
mac
euti
cal
Co
. L
td. C
hin
a
2

52
2.7 Nanosuspensions (NSs)
The drug discovery process based on up- to- date technologies such as
combinatorial chemistry, computer- aided drug design, and high throughput screening
have boosted an increase in a vast [156]number of drug candidates possessing
satisfiable efficacy profile over the decades but it is estimated that ∼ 40% of new
chemical entities ( NCEs) are poorly soluble in water. The huge challenge for
pharmaceutical development is to formulate special formulations and drug delivery
systems to overcome the issue of practically insoluble ( < 0. 1 mg/ mL) of these drugs
which are also related to poor bioavailability, especially when the drug is administered
through the oral route [157]. The dissolution rate and intestinal permeability are
important factors for prediction of the bioavailability, particularly for oral
administration. Thus, the two main parameters are chosen to classify chemical drugs
into 4 classes, based on the biopharmaceutical classification system ( BCS) . Poorly
soluble drugs belong to either class II ( low aqueous solubility with high intestinal
permeability) or class IV ( low aqueous solubility with low intestinal permeability) .
Despite high permeability, the poor solubility of drugs with a low concentration
gradient between the gut lumen and blood vessels may result in the restriction of drug
absorption. The term “ solubilization techniques” refers to a tool that enhances the
dissolution velocity ( dc/ dt) and ideally also the saturation solubility ( Cs) , which may
improve the bioavailability of drugs [158]. There are many conventional approaches
for the solubilization of poorly water- soluble drugs. Excipients including organic
solvents, surfactants, and macromolecules are used in different methods. Overall, they
may be called as a solubilizer or solubilizing agent [159].
Co-solvency: co-solvents such as ethanol, isopropanol, propylene glycol (PG),
polyethylene glycol ( PEG) are wildly used in liquid dosage form, especially for
parenteral products. Systemic adverse effects resulting from these co- solvents should
be considered in the selection of co-solvents [160].
Salt formation: if a drug molecule ( weak base or weak acid) can dissociate to
form an ionized molecule, it can be coupled with appropriate salt of its acid or base
( counterion) via ionic interaction. The ionizable form of the drug in aqueous has a
higher water solubility compared to the neutral one [161].
53
Micellar solubilization: use of low molecular weight surfactants is to reduce
surface tension and solubilize drugs by an increase in wetting of hydrophobic
compound and assembly of micelle structure that reserves hydrophobic molecule within
micelles [162].
Complexation: cyclodextrins (cyclic oligosaccharides) as a complexing agent,
can form a reversible, non- covalent bonding with poorly soluble drugs to solubilize
them. It can be described that the hydrophobic drug molecules (known as a guest) are
inserted into the cavity of cyclodextrin ( known as a host) at a suitable ratio of drug to
cyclodextrin. Another drawback of this technique is the high excipient level of the
resulting product [163].
Unfortunately, the use of some solubilizing agents/ excipients or residual
organic solvent can cause toxicities and side effects, for example, allergic reactions,
hypersensitivity reactions, nephrotoxicity, neurotoxicity, and neutropenia. Therefore, it
is essential to intensively develop special formulations that can deliver poorly water-
soluble drugs, including chemotherapeutic drugs [164].
Attempting reach to target tumors, anticancer drugs are commonly designed and
formulated into several NCs including liposomes, micelles, solid lipid nanoparticles,
polymeric nanoparticles, and dendrimers. Most of all, hydrophobic drug molecules are
solubilized, dispersed, and/ or entrapped by carrier materials [35]. The US FDA
approved a few nanocarrier products of anticancer drugs, for example, liposomal
formulations, Doxil® (doxorubicin), and Daunosome® (daunorubicin); albumin-bound
nanoparticles, Abraxane® ( paclitaxel) [165]. There are many factors that restrict the
potential use of NCs in the clinical setting including physical instability, structure
deformation, drug leakage during storage and/ or in vivo performance, resulting in less
efficacy, complexation in preparation and synthesis, high manufacturing cost, and
difficulty in scaling- up [83]. The NCs with an optimal size range of 100 to 300 nm
could fully take advantage of the EPR effect (tumor’s leaky vasculature and ineffective
lymphatic drainage system) when these delivery systems have to be stable in a
physiological environment, high drug loading, capable of sustained release of drug
molecules at tumor sites [84]. Among various solubility enhancement strategies,
nanocrystal formulations have been considerably interested in the delivery of poorly

54
aqueous soluble drugs. Marketed nanocrystal- based products are mainly for the oral
delivery route, formulated mostly by the top- down approach. Nanocrystals have been
used for other routes as well, including parenteral, transdermal, mucosal, ocular, and
pulmonary since it can reduce the use of chemical solubilizers, employ simple
preparation techniques, and is possible of industrial scale-up [166].
The micronization of drugs is processed to increase the surface area. Increasing
the surface area will directly increase the dissolution rate and diffusion rate ( drug
absorption) . Micronization means the transformation of coarse drug powder to
micrometer particles under mechanical forces. The mean diameter of micronized drug
particles is in the range of approximately 2 to 5 µm. Size reduction of a particle using
micronization fails to improve the saturation solubility of the drug compound and is not
sufficient to enhance bioavailability. For this reason, nanonization of drugs which
makes particle size in the nanometer range is developed to apply instead of the previous
method. It further increases the surface area, leading to an increase in aqueous solubility
and dissolution rate [42]. Nanocrystals were firstly invented in the 1990s and the first
marketed products were quickly launched in the year 2000. This strategy is a rather
simple, effective, and universal method that is applied to all poorly water-soluble drugs
because these drugs can be cracked into the nanometer range [43].
2.7.1 Definition
Drug nanocrystals are pure solid drug particles with a mean diameter
below 1000 nm. Drug nanosuspensions are defined as very finely colloid,
biphasic, dispersed drug nanocrystals that are stabilized by stabilizers
( surfactants and/ or polymers) in a liquid dispersion medium ( water, aqueous
solution, or nonaqueous medium) . This is prepared by suitable methods and
used for pharmaceutical drug delivery via various routes of administration.
Furthermore, the term “drug nanocrystals” represents a crystalline form of drug
particles. In fact, the polymorphism of drug depends on the production method,
they can be partially or fully amorphous form [167]. The obvious difference
between nanocarriers and nanocrystals can be explained that the main
component of nanocrystals is drug powder that is stabilized by few quantities of
stabilizers, whereas the nanocarriers contain a small amount of drug that is

55
dispersed, entrapped, or incorporated by a higher amount of carrier materials
[158].
Crystalline vs. Amorphous
Although an active substance has the same chemical formula, there are
two polymorphic states of drug solid particles that characterized by three-
dimensional arrangement (molecules or atoms): crystalline form is well-defined
edges and surfaces, regularly ordered arrangements of components with
characteristic X-ray diffraction patterns, and specific melting point, density, and
saturation solubility, whereas amorphous form is irregular or curved surfaces,
randomly packed arrangements and wide range of melting temperature. The
crystalline state is more stable but is lower water solubility and dissolution rate.
Moreover, it readily becomes a spontaneous phase transition and
recrystallization, resulting in a change in physicochemical properties. In other
words, the drug nanocrystals in the amorphous form possess higher saturation
solubility compared to drug nanocrystals in crystalline form. To obtain the
maximum saturation solubility, dual properties of a nanometer size range and
amorphous state are preferable to prepare nanosized drug particles. However,
the use of amorphous form in pharmaceutical formulations should be aware that
the amorphous form can be maintained throughout the shelf life [40,167].
2.7.2 Physicochemical properties of drug nanocrystals
Drug nanocrystals possess outstanding properties that address the
solubility problems including an increase in saturation solubility, an increase in
dissolution rate, and an increase in mucoadhesion to the cells. Particle size
reduction down to the nanometer range can increase the solubility by increased
surface area.
1) Increase in saturation solubility (Cs)
Saturation solubility depends on the physicochemical properties of the
compound, dissolution medium, and temperature. This meaning is only valid
for drug particles in the micrometer size range. Surprisingly, the saturation

56
solubility of the particle would increase when particle size is decreased to below
1000 nm due to an extreme increase in surface area.
2) Increase in dissolution velocity
The increased dissolution velocity of nanocrystals can be described by
the “Noyes-Whitney equation”.
dc/dt = (DA/h) (Cs-Ct) Eq.1
where dc/ dt is the dissolution velocity, D is the diffusion coefficient, A is the
surface area of drug particle, h is the diffusional distance, Cs is the saturation
solubility of the drug, Ct is the concentration surrounding the drug particles.
The increase in dissolution velocity ( dc/ dt) of drug nanocrystal arises
from the greater surface area ( A) and the increase in saturation solubility ( Cs)
of the compound (see equation 1). Moreover, the nanometer size range of drug
nanocrystals can promote permeation and absorption by passive diffusion
because an increase in saturation solubility leads to an increase in concentration
gradient between the gut lumen and blood circulation.
3) Augmentation of biological mucoadhesion
The nanometer dimension of drug nanocrystals that have very high
contact surface areas helps to enhance adhesiveness to surface/ cell membranes/
tissues, leading to the enhancement of oral bioavailability of poorly soluble
drugs [41,168,169].
2.7.3 Advantages and limitations
As above described in the previous section, the drug NSs also have other
advantages over other drug delivery systems. When lipophilic drugs are
produced in NSs, the resultant formulations with smaller particle sizes in the
nanometer range can enhance drug dissolution, diffusion, and absorption rate,
enhance the bioavailability, reduce variability, and reduce fed/fasted effect. Due
to very small particle size with high surface area, NSs can be easily applied and
penetrated for topical drug formulations. There is research reported that they
can be applied for reasons of task- masking in oral formulations. NSs are easy

57
to manufacture and more cost-effective than other nano-drug delivery platforms
[42,167]. Despite the many benefits, the technology for producing drug NSs still
has some limitations. First, the smaller size of drug nanoparticles can enter any
cells of the human body via pinocytosis and lead to further nanotoxicity. Next
is the advanced new technique needs an expensive instrument, increasing the
cost for the final pharmaceutical products. Moreover, this technique still cannot
be considered as a universal approach for all drugs. Finally, the preparation and
stability of different drug NSs vary based on the molecular structure of drugs
and stabilizers. There are several marketed nanosuspension products for oral
drug delivery but none of the FDA- approved nanosuspension containing
anticancer drugs has been launched to the market [158].
2.7.4 Methods for nanosuspension preparation
Nowadays, there are two basic techniques for the production of drug
nanocrystals including ( 1) top- down process which is the diminution of large
particles into smaller pieces while ( 2) bottom- up process which is the
precipitation of drug solution to form nanoparticles dispersed in a liquid vehicle.
2.7.4.1 Top-down or disintegration method
Typically, the top-down method is involved with size reduction through
different technologies (Figure 14) . There are two major particle size reduction
techniques related to the top-down process; media milling (MM) that is divided
into wet milling ( NanoCrystals®) and dry co-grinding while high- pressure
homogenization ( HPH) that is categorized into microfluidizer ( IDD- P®) and
piston gap homogenizer using aqueous media (DissoCubes®) and non-aqueous
media ( Nanopure®) . These methods can generate high thermal energy during
the running of the process. Thus, cooling jacket systems are required to control
proper temperature without exceeding heating and prevent degradation of heat-
labile drugs and alteration of polymorphism [41,170].
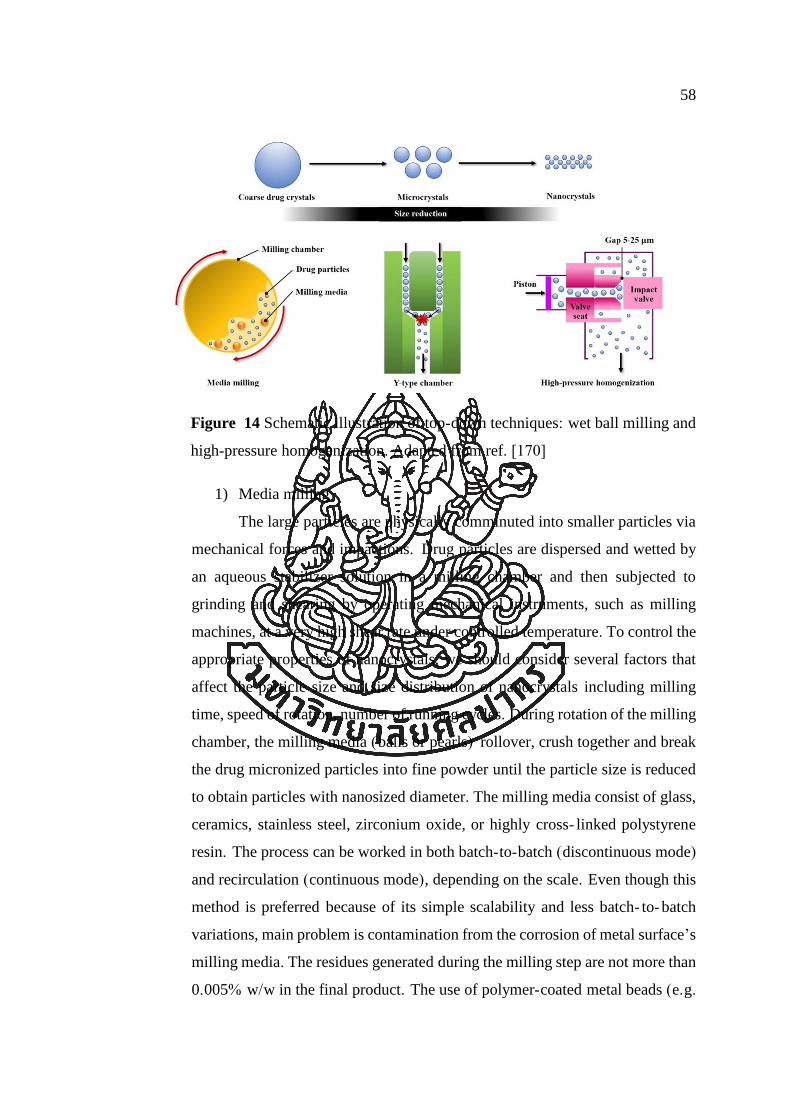
58
Figure 14 Schematic illustration of top-down techniques: wet ball milling and
high-pressure homogenization. Adapted from ref. [170]
1) Media milling
The large particles are physically comminuted into smaller particles via
mechanical forces and impactions. Drug particles are dispersed and wetted by
an aqueous stabilizer solution in a milling chamber and then subjected to
grinding and shearing by operating mechanical instruments, such as milling
machines, at a very high shear rate under controlled temperature. To control the
appropriate properties of nanocrystals, we should consider several factors that
affect the particle size and size distribution of nanocrystals including milling
time, speed of rotation, number of running cycles. During rotation of the milling
chamber, the milling media (balls or pearls) rollover, crush together and break
the drug micronized particles into fine powder until the particle size is reduced
to obtain particles with nanosized diameter. The milling media consist of glass,
ceramics, stainless steel, zirconium oxide, or highly cross- linked polystyrene
resin. The process can be worked in both batch-to-batch (discontinuous mode)
and recirculation (continuous mode), depending on the scale. Even though this
method is preferred because of its simple scalability and less batch- to- batch
variations, main problem is contamination from the corrosion of metal surface’s
milling media. The residues generated during the milling step are not more than
0.005% w/w in the final product. The use of polymer-coated metal beads (e.g.

59
polystyrene resin derivatives) may minimize the erosion in order to reduce the
unexpected side effects caused by their impurities. The disadvantages of this
technique include high energy requirement, time consumption ( varies from
hours to days), and expensive cost of the machine. This technique is an effective
particle size reduction process that has been applied to produce several marketed
products such as Rapamune®, Emend®, Tricor®, and Megace ES® (see Table 7).
These products on the market prove that the media milling is the acceptance and
applicability [171]. Another type of media filling is dry cogrinding or dry
milling. This method is used to produce NSs by mixing poorly soluble drugs
with surface-active agents such as sodium lauryl sulfate ( SLS) ,
polyvinylpyrrolidone (PVP), polyvinyl alcohol (PVA) in a liquid medium. Dry
milling can reduce particles to the submicron levels without any use of organic
solvents [167,170].
2) High-pressure homogenization (HPH)
It is another attrition technique which based on jet- stream
microfluidization. Two fluid streams of drug suspension vigorously attack in a
Y- shaped or a Z- shaped chamber, leading to particle collision and consequent
particle fracture under high pressure up to 1700 bar. An example of a marketed
product produced by this technique is Triglide® ( see Table 7) . Piston- gap
homogenizers are also used to manufacture nanosized drug particles by forcing
the drug suspension with a piston through a small orifice under high pressure.
The cavitation forces, high shear forces, and turbulent flow help to fracture the
drug particles. The capacity of size reduction, in terms of particle size and size
distribution, depends on many factors, including the power of homogenization,
pressure level, and numbers of the cycles. The process is generally composed
of three steps: (1) drug powders are dispersed in stabilizer solution (2) particle
size is reduced using high-speed homogenization under low pressure ( 3) high-
pressure homogenization is applied to obtain the desirable particle size and size
distribution [41].

60
2.7.4.2 Bottom-up or nanoprecipitation method
Drug particles in nanometer size can be formed by a bottom-up process
which is related to two important steps, nucleation and crystal growth ( Figure
15). This method may be called the “classical precipitation method” (known as
via humida paratum) . In brief, a poorly water- soluble drug is dissolved in an
organic medium that is water- miscible ( e. g. ethanol, methanol, acetone,
dimethyl sulfoxide). When this drug solution (molecular level) is poured into a
nonsolvent/ an anti-solvent, such as water/ buffer solution, the drug molecules
are precipitated to form finely dispersed drug NSs because of the
supersaturation of the drug solution. The mixing of the drug solution and anti-
solvent can be performed in batch-to-batch or continuous mode [41]. The main
drawback of this technique is that the fine particles tend to grow up, driven by
a phenomenon called “Oswald ripening” and become an aggregation of particle
clusters [172]. The major limitation of this method is that the drug can be
dissolved/ solubilized in at least one solvent and the solvent needs to be miscible
with a nonsolvent. Other bottom- up methods include sonocrystallization,
supercritical fluid technology ( SCF) , high gravity controlled precipitation
( HGCP) technology, confined impinging liquid jet ( CLIJ) technology, and
multi- inlet vortex mixing. Before using the final nanosuspension products, the
organic solvent has to be carefully removed, leading to the high cost of
production. Therefore, the bottom- up techniques have not been used for the
manufacturing of commercial products. NSs produced by the bottom- up
technique are more suitable for i.v. injection of anticancer drugs, owing to low
generating energy and contamination of fewer impurities. Nonetheless, no
approved parenteral commercial products using this technique has reached the
market [41,173].

61
Figure 15 Schematic illustration of bottom- up techniques. Adapted from ref.
[170]
2.7.4.3 Combination technologies
Currently, there is a combination of previously mentioned techniques to
significantly improve the capacity of particle size reduction and other benefits
such as faster manufacturing, improved physical stability. The NanoEdgeTM
owned by Baxter shows that nanocrystals can be produced by two steps:
nanoprecipitation technique followed by high- pressure homogenization.
Starting from a uniform suspension is created by mixing hydrophobic drug
solution in an organic solvent into an aqueous solution containing a stabilizer
under vigorous stirring. The drug compounds become drug microparticles
dispersed in an aqueous medium. For additional size reduction, they are
homogenized under high- energy input using a high- pressure homogenizer to
yield the drug particles with nanometer range, usually found to be 400 nm to 2
µm. Next technologies, SmartCrystal® technology is a useful tool for various
multiple processes e. g. H42 ( spray- drying with HPH) , H69 ( parallel flow
precipitation with HPH) , H96 ( lyophilization with HPH) , PLH ( precipitation-
lyophilization-homogenization) [41,174].

62
2.7.5 Particle stabilization
Nanocrystals and nanosuspensions often require stabilizers ( surfactants
and polymers) to be physically adsorbed onto the surface of each particle,
provide sufficient interaction between drug molecules and stabilizers to prevent
the particle aggregation or agglomeration during production, storage, and
administration [172]. Particle aggregation arises from Ostwald ripening and
eventually does not return to normal system ( irreversible process) , resulting in
larger particles and precipitate formation. Ostwald ripening is a phenomenon
that coarse particles grow at the expense of fine particle re-dissolving. The small
sizes which are more soluble than bigger ones, occur mass transferring from the
fine to the coarse particles, leading to the formation of microparticles. It needs
to add surfactant into nanocrystal formulations if the surface of nanocrystals is
uncharged and neutral particles. Normally, polymers are widely used to provide
a steric barrier between each particle; in the case of using ionic surfactants or
polymers, electrostatic repulsion also inhibits particle aggregation. Povidones,
polysorbates, Pluronics or Poloxamers, and cellulose derivatives are the most
frequently used stabilizers. Some stabilizing molecules originated from natural
sources such as lecithin, chitosan are utilized as well. For instance,
hydroxypropyl methylcellulose ( HPMC) , methylcellulose ( MC) , sodium
carboxymethylcellulose ( NaCMC) , sodium alginate ( NaAlg) produce terrible
stabilizing performance because of their high viscosity. Stabilizer with lower
viscosity including linear synthetic polymers (PVP K30 and K90) and synthetic
copolymers ( Poloxamer 188) show better stabilizing capabilities, especially at
higher concentrations. Tween® 80 and TPGS ( D- 𝛼 - tocopheryl polyethylene
glycol succinate) containing hydrophobic tail and hydrophilic head in the same
molecular structure gave more stabilizing performance [175]. Lecithin is
considered the stabilizer of choice when NSs are intended for the parenteral
products as their sterilization can be achieved with heat. Interestingly, TPGS is
a very good stabilizer that provides dual properties; stabilizing effect, and P-gp
inhibition effect, so it can be used to solve multidrug resistance ( MDR) of
anticancer drugs [176]. The novel stabilizers with appropriate functions have
been studied for stabilizing the dispersion system of nanocrystals or

63
nanosuspensions. The good stabilizers should have sufficient adsorption on the
particle surface and introduce proper repulsive force (electrostatic and/or steric
hindrance) between each particle. The other properties of stabilizers are
expected to be compatible, safe, and low toxicity [44].
The selection of stabilizers is considered in the types and concentration
of the stabilizers. Excess amounts of surfactants do not always lead to better
prevention of particle aggregation because the surfactant molecules tend to form
micelles in an aqueous medium when their concentration above the critical
micelle concentration (CMC). The drug to stabilizer ratio, generally vary from
1: 20 to 20: 1, needs to be optimized to archive the desired nanosuspension
formulation [ 4 1 ] . In general, stabilizers are commonly mixed along with the
microparticle materials before the process of particle size reduction to maintain
the original form of drugs. Nowadays, no systematic guidelines for using proper
stabilizers is well-published, so the way to find out one of suitable stabilizer for
stabilizing each hydrophobic drug is usually proven by trial and error.
Alternatively, nanocrystal products may be transformed to dry state via
solidification (freeze-drying, spray drying, electrospraying, or pelletization), in
case the stabilizers cannot maintain the stability of nanocrystals in liquid form
for long- term storage. Additionally, the dry powder of drug NSs can be
formulated with pharmaceutical excipients to obtain finished products such as
tablets, capsules, pellets, etc [44]. NSs for the parenteral route are often
sterilized by moist heat sterilization using autoclave, membrane filtration as
well as gamma radiation. NSs can be stored as liquid suspension or lyophilized
solid form [45]. Some nanosuspension products are also added with some other
additives such as salts, buffering agent, osmotic agent, antioxidant. These
additives should be considered in the issues of compatibility with drug and route
of administration [177,178].
Role of stabilizer
During nanosuspension production, when drug particles are reduced in
diameter, leading to increased surface area with a significant increase in Gibb’s
free energy of the system. From Gibb’s free energy equations as shown below,

64
the high interfacial tension becomes a thermodynamically unstable system.
Thus, the system tends to reduce total free energy by undergoing particle
aggregation/agglomeration.
𝛥G = 𝛶𝛥A – T𝛥S Eq.2
where 𝛥A is the change in surface area, 𝛶 is the interfacial tension, T is the
absolute temperature (Kelvin), and 𝛥S is the change in entropy.
Adding the stabilizers into NSs causes a reduction in the interfacial
tension between the particles and dispersion medium leading to free energy
minimization ( see equation 2) . Stabilizers also act as a wetting agent by
reducing the contact angle. It is suggested that stabilizers should be mixed at the
initial stage of the production process to fully maintain stability. The
mechanisms of preventing physical instability of NSs involve electrostatic
repulsion from the electrical charge of the particles and steric hindrance due to
the bulky moieties of the stabilizers. Many reviews reported that a combination
utilization of electrostatic and steric stabilizers usually exhibited a better
effective stabilizing effect in drug NSs [44,177].
2.7.6 Characterization of nanosuspensions
There are many parameters of NSs that affect their stability, saturation
solubility, dissolution profile, safety, as well as their in vivo performance. These
characteristic topics including particle size and size distribution; surface charge;
crystallinity; dissolution rate, are described below.
1) Particle size
Photon correlation spectroscopy ( PCS) is mostly used for particles
ranging from 3 nm to 3 µm. The particle size from this technique is light
intensity weighted. PCS is a good, accurate, and fast technique for measurement
of particle size and size distribution. For particle size > 3 µm, laser
diffractometry ( LD) is mostly utilized to determine the diameter of drug
microparticles. This method gives particle size data based on volume. Both
methods operate well for spherical- like particles. In the case of non- spherical
particles, the size may significantly deviate from actual size. Another method

65
that can be used to measure actual morphology, surface feature and diameter
size is electron microscopy (scanning electron microscope; SEM and
transmission electron microscope; TEM) . The size distribution is indicated by
the “ polydispersity index” ( PDI) , which indicates the breadth of particle size
distribution. A PDI value of 0.1-2.5 represents a narrow size distribution while
a PDI > 0.5 indicates a broad size distribution. To maintain long-term physical
stability, it is necessary to monitor the PDI value as low as possible. The change
of the mean particle size of drugs leads to variation in saturation solubility and
dissolution rate. Bear in mind, when nanocrystal formulation is administered
via i.v. route, it is essential to assure that the particle size is not bigger than the
cavity of capillaries (∼5 µm) to circumvent the capillary blockade or embolism
[179,180].
2) Surface charge
Charging on the electrical surface’s particle is important for considering
the physical stability of nanocrystals in liquid form. According to the DLVO
theory, the stability of the colloidal system depends on the balance between two
basic forces; attractive ( van der Waals) and repulsive ( electron double layer) .
The electrical double layer enclosing a particle has an inner region (Stern layer,
counterions are strongly attached to the particle) and an outer region ( diffuse
layer, counterions are attached with low affinity) . Within the diffuse layer, the
“ slipping plane” separates counterions that move along with the particle. The
electrokinetic potential difference at the slipping plane versus a point in the bulk
medium is defined as the “zeta potential (ζ)”. In other words, it is a function of
electrolyte concentration or ionization of stabilizer molecules that are adsorbed
onto the particle surfaces. This parameter can be determined by light scattering
to monitor the “electrophoretic mobility” when the colloidal dispersion system
is subjected to an electric field. Moreover, the pH of the medium, conductivity
of the liquid, and its composition can affect the distributions of counterions
surrounding the interface and thereby the zeta potential [180]. Generally, at least
±30 mV is the appropriate value of zeta potential that can stabilize the
nanosuspension system without aggregation via electrostatic repulsion. For
66
particles with low zeta potentials, stabilizers may be needed to provide further
steric repulsions. A minimum zeta potential of 20 mV is desirable for a
combined electrostatic and steric stabilization. The positively charged
nanoparticles caused higher hemolytic activity due to strong electrostatic
interactions between the particles and the anionic cell membrane and they
accumulated in the liver proportionally to the positive charge density; in
contrast, negatively charged nanoparticles were not hemolytic. Highly charged
nanoparticles had a much higher uptake than neutral or slightly charged
nanoparticles of the same size, by opsonization of RES, largely in the liver and
spleen [41,181].
3) Crystallinity
Crystallinity is often assessed by X- ray diffraction ( XRD) , augmented
by differential scanning calorimetry ( DSC) . The drugs pseudopolymorphs in
form of hydrates or solvates are evaluated by thermogravimetric analysis (TGA)
to know any weight loss during heating. These instruments can indicate the
polymorphic form of nanocrystal formulation; crystalline or amorphous
materials. These data help to understand polymorphic changes of drug particles
when they are subjected to the step of nanosizing [180].
4) In vitro dissolution study
The dissolution rate for NSs can be defined as drug quantity in solution
per time under standard conditions of liquid/ solid interface, temperature, and
type of media ( e. g. simulated gastric fluid, simulated intestinal fluid, or
physiological media) . Normally, their dissolution profiles can be examined by
USP dissolution apparatus 2 ( paddle) or modified similar methods. Before
quantitative analysis of the dissolved drug, the insoluble drug particles should
be removed by membrane filtration or ultracentrifugation. With the presence of
high concentration stabilizers, the solubility of a drug may be increased, likely
due to micellar solubilization of the drug. It must be noted that although the
dissolution rate of nanocrystal formulation is improved due to the increase in
surface area, the increasing level of saturation solubility seems less. For a poorly
soluble drug, the absolute increase in the dissolution rate of its nanocrystal

67
formulation is still marginal. Similarly, saturation solubility can predict the
change in biological performances such as plasma drug concentration and
bioavailability. NSs are supposed to improve the saturation solubility of the
insoluble compound. The determination of saturation solubility of NSs is
simultaneously performed in accordance with specified procedures in a solvent
at a specified temperature [182].
5) Resuspendability
Prior to the administration of nanosuspension products, the colloidal
heterogenous liquid should be easily resuspended by hand- shaking to obtain
uniform distribution of dispersed drug particles. It makes sure that each
delivered volume of NSs contains precise and constant concentration of drug.
When the gravity of drug particles becomes larger their buoyancy force
provided by colloidal dispersion system, the sedimentation occurs. For long-
term physical stability testing, the coarse suspension or nanosuspensions of
poorly water- soluble drug are monitored in sedimentation phenomenon. The
NSs will be good stability when sedimentation rate is very low [183].
6) Others
NSs are expected to have a specific appearance such as color, turbidity,
viscosity. In addition, pH is also an important factor that influences the physical
stability and solubility of the drug [180].
2.7.7 Stability of nanosuspensions
Even though an increase in the surface area of drug particles bring their
unique characteristic and biopharmaceutical behavior, it remains
thermodynamically unstable and promotes agglomeration and crystal growth.
The high surface energy of a nanosized particle is reduced by decreasing the
surface area by forming a bigger particle size ( known as Ostwald ripening
phenomenon) . Similarly, the process of flocculation or crystal growth during
the preparation or shelf life of NSs directly influences the dissolution and in vivo
performance. These obstacles might retard formulation development and their
applications in the pharmaceutical industries [184].

68
1) Aggregation
The use of inappropriate stabilizers causes lasting instability in NSs and
eventually aggregation during the storage, preparation, or solidification process.
Therefore, prevention of the particle aggregation is a principal parameter for the
development of a stable and effective drug NSs. Amphiphilic polymers can be
used to be adsorbed onto particle surfaces. The adsorbed chain molecules on
surfaces help to prevent coalescence by repulsive entropic forces. The stabilizer
having high viscosity in the aqueous phase, like a suspending agent, can reduce
the particle growth and sedimentation rate. It also forms stereospecific blockade
between the nanosuspension particles and inhibits the particle contacting [185].
2) Sedimentation and flocculation
NSs are colloidal dispersion having a particle size between true solutions
(<1 nm) and coarse dispersions (>1000 nm). Sedimentation takes place in NSs
like a coarse suspension when the gravity of the drug particle is greater than the
buoyant force of the dispersion system. Flocculation, a type of sedimentation,
is a disequilibrium condition of colloidal nanosuspensions, which is caused by
an attractive force that is stronger than the repulsive force between drug
particles. Multiple mechanisms are involved in polymer chain bridging,
polymer surface complex formation, charge neutralization. When NSs are much
diluted in a medium, floccules will be fractal structure. This instability in NSs
can be prevented by optimizing the preparation process parameters, using the
proper stabilizer, and also transforming NSs into dry powder [186].
3) Polymorphism and crystallinity
The full or partial amorphous state of the solid drugs is the potential to
improve their dissolution velocity and is thermodynamically unstable,
compared to their crystalline states. However, the amorphous form of drugs in
NSs can transform into some specific crystalline form. This is an unrequired
drawback being found during storage that directly affects solubility and
dissolution rate. Thus, the conversion of liquid nanosuspensions to dry powder
is an effective way to avoid the polymorphic transformation and keep the
original form of drugs [44,180].

69
Solidification process
Some drugs NSs cannot be stored in an aqueous medium because the
active compounds are degraded by hydrolysis or other chemical reactions.
Hence, the post-production procedure of NSs needs to be done for the extension
of storable time and prevention of particle aggregation. Even though various
techniques are used to produce a dry powder such as spray drying and
pelletization, freeze-drying is recommended and frequently used as it is a
friendly method for heat- sensitive products. Freeze drying process ( known as
lyophilization) mainly consists of three steps: first, freezing is to transform the
liquid nanosuspensions to solid form ( ice crystals) in the freezer, followed by
primary drying is to sublimate the solvent using a freeze dryer at low
temperature and vacuum. Finally, secondary drying is to completely remove an
unfrozen aqueous until obtaining resultant highly porous and dry powder of
drug particles [187]. Cryoprotectants or protective agents are added into liquid
nanosuspensions to avoid particle aggregation or caking during the
lyophilization process. The mostly used cryoprotectants include sugar (sucrose,
glucose, lactose, trehalose) ; sugar alcohol ( sorbitol, mannitol) ; dextran; etc.
Mannitol has been more widely used than other sugars. These protective
materials should not affect the biological performance of the drug and the
lyophilized products can provide original nanosuspensions when dry powders
are re-dispersed/ reconstituted in an aqueous vehicle. To reserve the biological
activities of the drug, the content of nanocrystal products should be collected in
the right packaging that protects the drug from chemical hazards, photolysis,
and oxidation [188].
2.7.8 Application of NSs in cancer therapy
To date, the number of studies reported that the use of nanocrystals for
cancer therapy is limited. In general, free drug molecules dissolved from
nanocrystals enter cells through passive diffusion. Additionally, nanocrystals
can be taken up cells via active transport process, including the clathrin- and
caveolae-mediated endocytosis. The particle size of ⩽ 200 nm is preferentially
taken up by clathrin- coated pits, while particles between 200 and 500 nm are
70
taken up by the caveolae-mediated pathway. The maximum size of particles that
can be internalized through the cell membrane is 500 nm [189].
NSs are a suitable therapeutic platform for targeted drug delivery
systems. They attract lots of interest in site- specific drug delivery due to the
ease in modification/ functionalization of surface properties, and scale- up.
Optimized physicochemical properties of NSs containing anticancer agents are
supposed to express a better antitumor efficacy against malignant tissues with
lower toxicity toward normal tissues. However, nanocrystals with size in the
submicron range in blood circulation will be recognized as exogenous elements
by macrophage cells in MPS, which are found abundantly in the liver and
spleen, conducting to passive accumulation in these cells but occurring low
plasma concentration. It has been reported that more than 90% of the i. v.
injected dose is transported to the liver and ∼5% to the spleen within 5 min after
injection [44]. To solve this problem, surface coating with biocompatible and
hydrophilic materials such as polyethylene glycol (PEG) or Poloxamer helps to
reduce the opsonization process resulting in prolong shelf life in blood
circulation and promoting the accumulation of drug nanocrystals via the EPR
effect. Generally, the EPR effect is not enough to specifically deliver to the
tumor sites because the non- specific distribution of drugs throughout the body
results in side effects, further limiting their clinical use [11,33].
An effective strategy for tumor targeting through ligand- conjugated
nanocrystals may be used to selectively enhance drug accumulation in order to
achieve good antitumor efficiency with low toxicity. Not only surface treatment
using stabilizers can stabilize nanocrystals, but also surface attachment with
further functional ligands can design nanocrystals with the purpose of active
targeting or inhibition of MDR [190].
Although orally administered nanoformulations are more accepted, i. v.
injection is still the preferable route for cancer therapy. This can be explained
that some anticancer drugs have poor oral absorption and bioavailability, mainly
due to their poor water solubility. Intravenously administered drug nanocrystals
are expected to reach solid tumors via the EPR effect due to the nanoscale

71
dimension. Nanocrystals are not expected to dissolve rapidly in the plasma upon
i.v. administration, leading to improved biodistribution, compared with the oral
route [45]. The in vivo distribution of drug nanocrystals is affected by main
factors including particle size, particle morphology, and surface properties as
discussed below.
1) The smaller particles can dissolve quickly in the blood, escape from
phagocytosis in MPS, whereas larger particles are more being
phagocytosed than the small one, leading to reduced drug accumulation
in the solid tumors.
2) Particle morphology also affects the biodistribution of nanocrystals.
3) Surface modification of nanocrystals can alter their biodistribution
profiles. As mentioned already, the PEGylation of surface particles
acting stealth property reduces the RES uptake. Moreover, ligand
modification can improve the targeting efficiency for specific delivery
of anticancer drugs nanocrystals as well. The attached ligands at the
surface’ s particles specifically bind target receptors on tumor cells,
leading to the induction of internalization to the cancer cell via receptor-
mediated endocytosis [45,191].
However, ligand modification might not usually enhance the in vivo
distribution behavior of drug nanocrystals. This situation can be explained that
the specific ligands that are physically adsorbed onto nanocrystals surface
cannot bind via adequate interaction, resulting in detachment of ligands from
the surface ( loss of balance between adsorption and desorption) in aqueous
stabilizer solution. This instability can occur when the nanocrystals coupled
with ligands are much diluted in biological fluid [192].

72
Tab
le 7
Avai
lable
mar
ket
ed p
har
mac
euti
cal
nan
osu
spen
sion
pro
duct
s [1
70]
1
Tra
de
nam
e/
Ap
pro
val
yea
r
Gen
eri
c d
rug
/
Ind
icati
on
Nan
osu
spen
sion
met
ho
d
Dosa
ge
form
C
om
pan
y
Rap
amune®
(20
00)
Sir
oli
mus
(Im
munosu
ppre
ssan
t)
Top-d
ow
n
(Nan
oC
ryst
al® E
lan s
yst
em)
Ora
l ta
ble
t W
yet
h
Em
end
®
(20
03)
Apre
pit
ant
(Anti
-em
etic
)
Top-d
ow
n
(Nan
oC
ryst
al® E
lan s
yst
em)
Ora
l ca
psu
le
Mer
ck
Tri
cor®
(20
04)
Fen
ofi
bra
te
(Hyper
chole
ster
ole
mia
)
Top-d
ow
n
(Nan
oC
ryst
al® E
lan s
yst
em)
Ora
l ta
ble
t A
bbott
Meg
ace
ES
®
(20
05)
Meg
este
rol
acet
ate
(Appet
ite
stim
ula
nt)
Top-d
ow
n
(Nan
oC
ryst
al® E
lan s
yst
em)
Ora
l su
spen
sion
P
ar P
har
mac
euti
cal
Rit
alin
®
(20
02)
Met
hyph
enid
ate
HC
l
(Anti
psy
choti
c)
Top-d
ow
n
(Nan
oC
ryst
al® E
lan s
yst
em)
Ora
l ta
ble
t N
ovar
tis
Tri
gli
de®
(20
05)
Fen
ofi
bra
te
(Hyper
chole
ster
ole
mia
)
Top-d
ow
n
(ID
D-P
® S
kyep
har
ma)
Ora
l ta
ble
t F
irst
Hori
zon P
har
ma
Inv
ega
Sust
ena
(20
09)
Pal
iper
idon
e pal
mit
ate
(Anti
dep
ress
ant)
Top-d
ow
n
(Hig
h-p
ress
ure
hom
ogen
izat
ion
)
Par
ente
ral
susp
ensi
on
Jo
hnso
n &
Johnso
n
Ces
amet
®
(20
05)
Nab
ilone
(Anti
-em
etic
)
Bott
om
-up,
Co-p
reci
pit
atio
n
Ora
l ca
psu
le
Lil
ly
2

73
2.8 Chitosan (CS) and chitosan derivatives
Figure 16 Chemical structure of chitin and chitosan. [193]
Chitosan, a linear cationic amino polysaccharide derivative, consists of N-
acetyl-D-glucosamine (acetylated unit) and D-glucosamine (deacetylated unit) linked
in a 𝛽 (14) manner (Figure 16). This biopolymer originated from a natural source is
generally produced by alkaline deacetylation of chitin which is a component found in
the exoskeleton of crustaceans such as crabs and shrimps [193]. The USP officially
indicated that its degree of deacetylation is in the range of 70.0% to 95.0% [194]. It has
several useful properties including biocompatibility, biodegradability, bioadhesivity,
non-toxicity, low immunogenicity, and low cost [195,196]. However, it cannot dissolve
in neutral or alkaline solution and physiological fluid but solubilize in an acidic
environment (pH<6.5); consequently, it could be used to carry drugs through the body
until reaching acidic tissue environments, such as in solid tumors [197,198]. Due to its
attractive properties involved in pharmaceutical and biomedical applications, many
researchers have been interested in the development of novel drug delivery systems
based on chitosan and chitosan derivatives with a favorable profile. According to the
structure of chitin- chitosan, it cannot form micelle itself because of a lack of
amphipathicity in its molecule [199].
Currently, many researchers have designed and synthesized by connecting the
hydrophobic parts on the chitosan backbone to generate plenty of amphiphilic chitosan
derivatives with improved solubility and other demanded properties. Normally, the
74
chemical modification used for the synthesis of chitosan derivatives is based on the
reductive amination of amino ( - NH2) groups at the C- 2 position and esterification or
etherification of hydroxyl (-OH) group at C-3 (secondary hydroxyl) or C-6 (primary
hydroxyl) position [200]. The chitosan derivatives such as N- lauryl- carboxyl methyl
chitosan [201], N- octyl- O- sulfate chitosan [202], PEG conjugated N- octyl- O- sulfate
chitosan [203], N-octyl-O-glycol chitosan [204], stearyl chitosan oligosaccharide [205],
cis- acotinyl chitosan oligosaccharide [206], carboxymethyl chitosan- graft-
polycaprolactone [207] have been successfully synthesized to form self- assembled
polymeric micelles loaded with anticancer drugs.
In this research, various amphiphilic chitosan derivatives including N-naphthyl-
N,O-succinyl chitosan (NSC), N-octyl-N,O-succinyl chitosan (OSC) and N-benzyl-
N,O-succinyl chitosan (BSC) were synthesized by introducing hydrophobic (naphthyl,
octyl, benzyl group) onto the primary amino groups on the CS backbone through N-
amination, and grafting hydrophilic pH-sensitive moiety (succinyl group) onto primary
amino and hydroxyl groups of CS backbone through N,O-succinylation (Figure 17).
The critical micelle concentration (CMC) of NSC, OSC, and BSC was 0.0678, 0.0855,
and 0.0575 mg/mL, respectively, as measured by fluorescence spectroscopy
(hydrophobic pyrene probe). These CMC values of CS derivatives were lower than low
MW surfactants. Moreover, the degree of N-hydrophobic substitution (DS) and degree
of N,O-succinylation (DSS) calculated from the H-NMR and FT-IR spectra indicated
that hydrophobic and succinyl group were successfully grafted onto CS backbone
[27,28].

75
Figure 17 Schematic diagram of synthesis of amphiphilic chitosan derivatives [28].

76
CHAPTER 3
MATERIALS AND METHODS
3.1 Materials
3.1.1 Drugs and pharmaceutical excipients
- Acetone (QReC, Malaysia)
- Andrographolide analogue 3A.1 (19-tert-butyldiphenylsilyl-8,17-epoxy
andrographolide) was gifted from Faculty of Science, Burapha University
(Chonburi, Thailand)
- Annexin V-FITC apoptosis detection kit (BD Biosciences, NJ, USA)
- Benzaldehyde (Sigma Aldrich®, St. Louis, MO, USA)
- CD3COOD and DMSO-d6 (Cambridge Isotope Laboratories, Inc., MA, USA)
- Chitosan (DDA 96%, MW 10-13 kDa) (OilZac Technologies Co., Ltd.,
Bangkok, Thailand)
- Chloroform (V.S. Chem House, Bangkok, Thailand)
- Cholesterol (Carlo Erba Reagenti, Ronado, Italy; purity 95%)
- Crystal violet (Microscopy grade, Loba Chemie Pvt. Ltd., Mumbai, India)
- Deionized water
- Deuterium oxide (D2O) (MagniSolvTM, Merck, Switzerland)
- Dichloromethane (Merck, Germany; purity ≥ 99.8%)
- Dimethyl sulfoxide (DMSO) (Fisher Scientific, UK Limited, UK)
- Doxorubicin (Sigma Aldrich®, St. Louis, MO, USA; purity ≥ 98%)
- Ethanol (Merck, Germany; purity ≥ 99.9%)
- Fluorouracil (5-FU) solution (Effcil®, Boryung Pharmaceutical Co., Ltd.,
Seoul, Republic of Korea; 500 mg/10 mL)
- Folate-conjugated NSC (NANOTEC, Thailand)
- Formaldehyde solution (The Government Pharmaceutical Organization (GPO),
Bangkok, Thailand; 34.5-38.0% w/w of CH2O)
- Glacial acetic acid (Merck, Germany; purity ≥ 99.8%)
- Hydrochloric acid (Scharlau Chemie S.A., Spain; purity ≥ 99.8%)
- Mannitol (Chemipan Co., Ltd., Bangkok, Thailand)
- Methanol (Merck, Germany; purity ≥ 99.9%)

77
- 2-Naphthaldehyde (Sigma Aldrich®, St. Louis, MO, USA)
- Na-salt of N-(carbonyl-methoxypolyethylene glycol-2000)-1,2-distearoyl-sn-
glycero-3-phosphoethanolamine (PEG2000-DSPE) (Lipoid GmbH,
Ludwigshafen, Germany)
- N-benzyl-N,O-succinyl chitosan (BSC) (NANOTEC, Thailand)
- N-naphthyl-N,O-succinyl chitosan (NSC) (NANOTEC, Thailand)
- N-octyl-N,O-succinyl chitosan (OSC) (NANOTEC, Thailand)
- Nitrogen gas (Masser Specialty Gas Co., Ltd., Nakorn Pathom, Thailand)
- N,N-dimethylformamide (DMF) (Brightchem Sdn Bhd, Malaysia; purity ≥
99.8%)
- Octaldehyde (Sigma Aldrich®, St. Louis, MO, USA)
- Phosphatidylcholine (PC) (Phopholipon® 90G, Lipoid GmbH,
Ludwigshafen, Germany)
- Poloxamer 188 (Lutrol F68) (VITA Co., Ltd., Thailand)
- Polyoxyethylene 20 sorbitan monooleate (Tween 80) (OmmiPur®, USA)
- Potassium bromide (KBr) (IR grade, Merck®, Germany)
- Potassium chloride (KCl) (Ajax Finechem Australia, New Zealand)
- Potassium dihydrogen phosphate (KH2PO4) (Ajax Finechem Australia, New
Zealand)
- Sodium borohydride (Sigma Aldrich®, St. Louis, MO, USA)
- Sodium chloride (NaCl) (Sigma Aldrich®, St. Louis, MO, USA)
- Sodium dihydrogen phosphate (Ajax Finechem Australia, New Zealand)
- Sodium dodecyl sulfate (SDS) (Fisher Scientific, UK Limited, UK)
- Sodium hydroxide (Ajax Finechem Australia, New Zealand)
- Succinic anhydride (Sigma Aldrich®, St. Louis, MO, USA)
- Triton® X-100 (Amresco®, Solon, Ohio, USA)
- The other reagents and chemicals were commercially available and used
without further purification.
3.1.2 Cell lines and culture reagents
- Accutase enzyme solution (AccutaseTM, Merck, Tenecula, CA, USA)

78
- 3-(4,5-dimethylthiazol-2-yl)-2,5-diphenyltetrazolium bromide (MTT) (Sigma
Aldrich®, St. Louis, MO, USA)
- Dulbecco’s modified Eagle’s medium (DMEM) (GIBCO®, Grand Island, NY,
USA)
- Fetal bovine serum (FBS) (GIBCO®, Grand Island, NY, USA)
- Glutamax (GIBCO®, Grand Island, NY, USA)
- Human colon adenocarcinoma (Caco-2) cell line (ATCC® HTB-37TM,
Rockville, MD, USA)
- Human colorectal adenocarcinoma (HT29) cell line (ATCC® HTB-38TM,
Rockville, MD, USA)
- Human colorectal carcinoma (HCT116) cell line (ATCC® CCL-247TM,
Rockville, MD, USA)
- Human head and neck squamous cancer (HN22) cell line was provided from
Faculty of Dentistry, Naresuan University (Phisanulok, Thailand)
- L-glutamine (GIBCOTM, NY, USA)
- Minimum essential media (MEM) (GIBCOTM, NY, USA)
- Non-essential amino acids (100X) (GIBCOTM, NY, USA)
- Penicillin-streptomycin antibiotics (GIBCO®, Grand Island, NY, USA)
- Phosphate-buffered saline (PBS, pH 7.4)
- Sterile water for irrigation (Thai Otsuka Pharmaceutical Co., Ltd., Bangkok,
Thailand)
- Trypan blue (0.4%) staining solution (GIBCO®, Grand Island, NY, USA)
- Trypsin–EDTA (0.25 %) solution (GIBCO®, Grand Island, NY, USA)
3.1.3 Animal experiment
- Nude mice (male, BALB/cAJcl-nu, 18±2 g, 5 weeks old) (Nomura Siam
International Co., Ltd., Bangkok, Thailand)
- Adhesive tape
- Digital Vernier caliper (Syntex®, Syntex Electronic Technology Co., Ltd.,
China)
- 70% Ethanol solution
- Fine forceps

79
- Hypodermic needle 23G × 0.5-inch, 26G × 0.5-inch (Nipro Co., Ltd.,
Bangkok, Thailand)
- Hypodermic needle 27G × 0.5-inch (Terumo Co., Tokyo, Japan)
- Medical scissor and scalpels
- Normal saline solution (A.N.B. Laboratories Co., Ltd., Bangkok, Thailand)
- Sterile gauze (United Medical Instruments Co., Ltd., Bangkok, Thailand)
- Sterile syringe 1 mL, 3 mL (Nipro Co., Ltd., Bangkok, Thailand)
- Surgical blade stainless steel (Feather Safety Razor Co., Ltd., Osaka, Japan)
- Xylinvet® injection (xylazine)
- Zoletil® injection (tiletamine/zolazepam)
3.2 Equipments
- 1.5, 2.0 mL microcentrifuge tube (Eppendorf®, Corning Incorporated, NY,
USA)
- 15, 50 mL centrifuge tubes-sterile (Biologix Research Company, KS, USA)
- Aluminum foil (Diamond®, China)
- Analytical balance (Sartorious CP224S; Scientific Promotion Co., Ltd.,
Bangkok, Thailand)
- Automatic autoclave (Model: LS-2D; Scientific promotion Co., Ltd.)
- Automatic cell counting machine (TC10TM, Bio-Rad laboratories Inc., CA,
USA)
- Bath sonicator (Transonic series 890/H, Elma Hans Schmidbauer GmbH,
Germany)
- Beaker (Pyrex, USA)
- Cell culture flask 25 cm3, 75 cm3 (Corning®, Corning Incorporated, NY, USA)
- Clock timer
- CO2 Incubator (Heraeus HERA Cell 240, Heraeus Holding GmbH., Germany)
- Cylinder (Pyrex, USA)
- Desiccator
- Dialysis tube (Cellusep® T1 6000-8000 MWCO, Membrane Filtration Products,
Seguin, TX, USA)
- Differential scanning calorimeter (DSC) (Model: 8000, Perkin Elmer Inc.,
Germany)

80
- Duran glass bottle 250, 500, 1000, 2000 mL
- Filter paper (WhatmanTM, GE Healthcare, UK)
- Flow cytometer (BD FACSCantoTM, BD Bioscience, CA, USA)
- FlowJo software (BD Bioscience, FlowJo LLC, Ashland, Oregon, USA)
- Fluorescence spectrophotometer (RF 1501; Shimadzu, Kyoto, Japan)
- Fluorescence microscope (Olympus Co., Ltd., Tokyo, Japan)
- Fourier transform infrared spectrometer (FTIR) (Model: Nicolet 4700, Nicolet,
USA)
- Freeze-dryer (Model: Freezone 2.5, LABCONCO, Kansas city, MO, USA)
- Freezer/Refrigarator -20 ºC, -80 ºC, 4 ºC
- Fume hood (Wiwatsan Lab, Nonthaburi, Thailand)
- Glass bottom container
- Glass slide microscope and cover slip (Sail Brand, China)
- Gloves
- GraphPad Prism version 5.01 (GraphPad Inc., San Diego, CA USA)
- High performance liquid chromatography (HPLC) instrument (Agilent 1100
series, Agilent Technologies, USA)
- Hot air oven (WTB Binder, Germany)
- HPLC column (Phenomenex® C-18 column; 5 µm particle size; 250 × 4.6 mm)
- HPLC vial and septum
- Ice bath
- Incubated shaker (Model: KBLee 1001, Daiki sciences, Bio-Active, Bangkok,
Thailand)
- Inverted microscope (Nikon® T-DH, Japan)
- ImageJ software (National Institute of Health, MD, USA)
- J MicroVision version 1.2.7
- Laminar air flow (BIO-II-A, Telstar Life Science Solutions, Spain)
- Magnetic stirrer (Framo, Germany) and magnetic bar
- Micropipette 0.1-2.5 µL, 2-20 µL, 20-200 µL, 100-1000 µL, 1-5 mL
(Eppendorf® AG, Hamburg, Germany)
- Micropipette tips (Corning®, Corning Incorporated, NY, USA)

81
- Microcentrifuge (Microfuge 16®, Model: A46473, Beckham Coulter Inc.,
Germany)
- Microplate reader (Multimode plate reader, Model: Victor NivoTM,
PerkinElmer, Hamburg, Germany)
- Multipoint pipettor with 8 channels aspiration manifold 30-300 μL (Eppendorf®
AG, Hamburg, Germany)
- Multispeed centrifuge (ALC®, Model: PK121R, New Jersey, USA)
- Nylon membrane filter (diameter 13 mm, 47 mm, pore size 0.45 µm, Filtrex®)
- Parafilm (BEMIS®, WI, USA)
- pH meter (Horiba compact pH meter B-212, Japan)
- pH meter (Mettler Toledo; Switzerland)
- Pipette aid (Powerpette Plus; Bio-Active Co., Ltd.)
- Powder X-ray diffractometer (Miniflex II, Rigaku, Japan)
- Probe-type sonicator (Model: CV 244, Sonics VibraCellTM, Newtown, CT,
USA)
- Scanning electron microscope (SEM) (JSM-6400, JEOL Co., Ltd., Japan)
- Shaking incubator (Orbital shaking incubator Model: Sl4)
- Sterile measuring pipette 5 mL, 10 mL (Falcon®, Corning Incorporated, NC,
USA)
- Syringe 1 mL, 10 mL, 50 mL (Nipro Co., Ltd., Bangkok, Thailand)
- Test tube 10 mL (Pyrex, USA)
- Transmission electron microscope (TEM) (JEM-2100, JEOL Co., Ltd., Japan)
- Transwell plate with insert and polycarbonate membrane (8 µm pore size, 6.5
mm diameter) (Costar®, Corning Incorporated, ME, USA)
- Ultracentrifuge (Kendro®, Multifuge 1S/1S-R, Germany)
- Vacuum pump connected suction line (Model: WP6211560 Millipore, Billerica,
MA, USA)
- Vertical mixer (Intelli-mixer RM-22, Germany)
- Volumetric flask (Pyrex, USA)
- Vortex mixer (Model: VM-10, DAIHAN Scientific Co., Ltd., Republic of
Korea)

82
- Water bath (HETOFRIG CB60; Heto High Technology of Scandinevia,
Brikerod, Denmark)
- Well-plate (6-, 24-, 96-well plate; flat clear bottom) (Corning®, Corning
Incorporated, NY, USA)
- Zetasizer Nano ZS (Malvern Instruments Ltd., Malvern, UK)

83
3.3 Methods
3.3.1 Preparation of 3A.1-loaded polymeric micelles (PMs)
The blank and drug-loaded PMs were prepared using four different physical
entrapment methods as follows:
3.3.1.1 Dialysis method
Overall, 5 mg of the amphiphilic copolymers (NSC, OSC, and
BSC) and the drug (0-40 wt% to polymer) were dissolved in 2 mL of
dimethyl sulfoxide (DMSO) in a glass bottom container. Then, the mixture
was stirred at room temperature until completely dissolved before being
transferred to a dialysis bag (6000-8000 MWCO). The solution was
dialyzed against distilled water to remove the solvent. The distilled water
was replaced every 4 h for 24 h. The solution was centrifuged at 1500 rpm
for 2 min before the supernatant was collected for further studies.
3.3.1.2 O/W emulsion method
The copolymers (NSC, OSC, and BSC) were prepared as mentioned
in dialysis method without adding the drug in order to obtain the blank
polymeric micelles. Drug solution (0-40 wt% to polymer) which was
dissolved in dichloromethane (DCM) was then injected into 2 mL of the
blank micelle solution under regular stirring. After that, DCM was
evaporated overnight by stirring at room temperature. The micelle solution
was then centrifuged and collected for further studies.
3.3.1.3 Dropping method
Briefly, 5 mg of the copolymers and the drug (0-40 wt% to polymer)
were dissolved in 0.5 mL of DMSO. The solution was gradually dropped
into stirred water, and the mixed solution was stirred overnight. The final
volume ratio of DMSO:water was 1:5. The mixture was then placed into a
dialysis bag and dialyzed against distilled water overnight. The micelle
solution was then centrifuged and collected for further studies.
3.3.1.4 Evaporation and sonication method
In brief, 5 mg of the copolymers and the drug (0-40 wt% to polymer)
were dissolved in dimethylformamide (DMF) contained in a glass test tube.

84
The solution was mixed with acetone (1/3 volume of DMF) and stirred at
room temperature under nitrogen gas flow in a laminar hood until the
solvent was completely evaporated to form a thin-film. Afterward, 3 mL of
distilled water was added, and the solution was sonicated using a probe-
type sonicator (CV 244, Sonics VibraCellTM, Newtown, CT, USA) in cycle
with a sonication time of 5 min and a standby time of 5 min for 20 min
under cold temperature (in an ice bath). The micelle solution was then
centrifuged and collected for further studies.
3.3.2 Preparation of 3A.1-loaded liposomes (LPs)
The liposome formulations including conventional liposomes (LP) and
PEGylated liposomes (PEG LP) were prepared using various amounts of
phosphatidylcholine (PC), cholesterol (Chol) and 1,2-distearoyl-sn-glycero-3-
phosphoethanolamine-N-(carbonyl-methoxypolyethylene glycol-2000) (DSPE-
PEG2000) at the molar ratio of 10:2:0, 10:2:0.125, 10:2:0.25 and 10:2:0.50 mM.
The amount of 3A.1 in the formulation was varied ranging from 0.5-4.0 mM. All
liposomes were produced using a thin-film hydration and probe-sonication method.
Briefly, PC, Chol, and DSPE-PEG2000 were dissolved in a mixture of chloroform
and methanol (2:1, v/v) and mixed them in a glass test tube before 3A.1 solution
was added. The solvent was then evaporated by nitrogen gas flow and the obtained
thin-film was placed in a desiccator for 6 h to remove the residual organic solvent.
The dry thin film of lipid was subsequently hydrated with PBS solution (pH 7.4).
After that, the liposomes were properly vortexed and subsequently probe-sonicated
by a probe-type sonicator (CV 244, Sonics VibraCellTM, Newtown, CT, USA) in
an ice bath for 30 min to reduce the vesicle size of the liposomes. The liquid
liposome was centrifuged at 15000 rpm at 4°C for 15 min to remove the excess
lipid compositions and traces of titanium from the probe sonicator. The supernatant
was collected in glass bottle containers and kept at 4°C for further evaluations.
3.3.3 Preparation of 3A.1 nanosuspensions (NSs)
The 3A.1 nanosuspensions (3A.1 NSs) were prepared via a
nanoprecipitation (bottom-up) method, using DMSO as a solvent and distilled
water as an anti-solvent. The final volume ratio of DMSO:water was 1:5. Briefly,

85
the drug and copolymers (NSC, OSC, and BSC) (3.5 mg) were co-dissolved in
DMSO in a 1.5 mL centrifuge tube at the different ratios of the drug to polymer
(0.8:1 to 2:1, w/w). Next, the solution was slowly dropped with p200 into 3.5 mL
of distilled water under magnetic stirring for 24 h, and then the suspension was
transferred to a dialysis tube (6000-8000 MWCO) and dialyzed against distilled
water to remove the organic solvent. The drug NSs was then centrifuged and the
supernatant was collected for further studies. Moreover, three stabilizers i.e.
sodium dodecyl sulfate (SDS), Tween® 80, and Poloxamer 188 (Lutrol F68) were
selected to prepare drug NSs by the similar process. To obtain the formulation
containing stabilizers, the drug solution was gradually dropped into 3.5 mL
aqueous solution containing the stabilizers.
In order to improve the physical stability of the liquid NSs, 5%w/v mannitol
was added as a lyoprotectant to reduce the expansion of the particles during freeze-
drying process. The liquid samples were pre-frozen at 20ºC for 72 h before being
vacuumized using a freeze dryer instrument (FreeZone2.5, Labconco Co., Kansas
City, MO, USA) at -48ºC for 72 h to obtain NS powder.
3.3.4 Entrapment efficiency and loading capacity of 3A.1-loaded PMs and
LPs
The quantitative determination of 3A.1 in the 3A.1-loaded PMs prepared
using different methods were determined by dissolving the samples in a mixture of
DMSO:water (9:1, v/v) while the 3A.1 contained in the 3A.1-loaded LPs were
determined by dissolving the samples in 0.1% Triton® X-100 solution in PBS (pH
7.4), followed by centrifugation at 10000 rpm at 4ºC for 10 min. The sample of
micelle mixture and the supernatant of the liposome mixture were filtered through
a syringe filter (0.45 µm pore size). The average amount of the drug loaded in the
polymeric micelles or liposomes was determined in triplicate using a high
performance liquid chromatography (HPLC). The entrapment efficiency (%EE)
and loading capacity (LC) were calculated according to Eq.3 and Eq.4,
respectively.
%EE = The amount of entrapped drug in PMs or LPs
Initial amount of the drug added during preparation × 100 Eq.3

86
LC (μg/mg) = The amount of entrapped drug in PMs or LPs
Amount of the polymer or lipid used during preparation Eq.4
For 3A.1-loaded PMs, the optimal preparation method showing the highest
drug entrapment efficiency and loading capacity was selected for the preparation
of the PMs using 3 different graft copolymers (NSC, OSC, and BSC).
For 3A.1-loaded PEG LP, the optimal initial drug amount and molar ratio
of lipid compositions showing the highest drug entrapment efficiency and loading
capacity was selected for further experiments and evaluations.
3.3.5 Drug content of 3A.1 NSs
The average content of 3A.1 in the 3A.1 NS formulations was determined
by dissolving the samples in a mixture of DMSO:water (9:1, v/v), then the sample
was filtered through a 0.45-μm filter prior to an HPLC analysis. The drug
concentration (μg/mL) was calculated from the calibration curve while percentage
yield was calculated as follows:
Yield (%) = The amount of drug in the NS formulation
Initial amount of the drug added during preparation × 100 Eq.5
3.3.6 HPLC analysis
The amount of 3A.1 in the 3A.1-loaded PMs, 3A.1-loaded LPs and 3A.1
NSs was determined using a high performance liquid chromatography (HPLC,
Agilent 1100 series, Agilent technologies, USA) connected with Phenomenex® C-
18 column (5-µm particle size, 250 × 4.6 mm) and diode array detector (DAD) set
at 219 nm. The isocratic elution was performed with the mobile phase composed of
methanol and ultrapure water at the volume ratio of 80:20 with the flow rate of 1.0
mL/min. The injection volume was set at 20 µL. The column temperature was set
constantly at 25ºC. Standard solution with different drug concentrations (10-200
µg/mL) in methanol was used to generate the calibrate curve (see Appendix A).

87
3.3.7 Characterization of 3A.1-loaded PMs, 3A.1-loaded LPs and 3A.1 NSs
3.3.7.1 pH
The pH of the freshly prepared 3A.1-loaded PMs, 3A.1-loaded LPs
and 3A.1 NSs was measured in triplicate at 25ºC using a pH electrical meter
(HORIBA compact pH meter B-212, Japan).
3.3.7.2 Morphology
Surface morphologies of the blank and 3A.1-loaded PMs, 3A.1-
loaded LPs and 3A.1 NSs were observed using a transmission electron
microscope (TEM). The formulations were diluted with distilled water and
dropped onto a formvar-coated copper grid. They were then negatively
stained with 1% uranyl acetate solution and air dried at room temperature.
Finally, the samples were scanned under TEM (Philips® Model TECNAI
20, Japan) at an accelerating voltage of 80 kV. Furthermore, a scanning
electron microscope (SEM, JSM-6400, JEOL Co., Ltd., Japan) was also
utilized to observe coarse 3A.1 powder and the freeze-dried 3A.1 NSs. In
brief, the specimens of the freeze-dried powder were mounted onto an
aluminum stub with conductive double-sided adhesive tape and then
sputtered with a thin gold layer under vacuum. Finally, the morphological
features of each sample were viewed at an accelerating voltage of 15 kV.
3.3.7.3 Particle size, size distribution, and zeta potential
Dynamic light scattering (DLS) (Zetasizer Nano ZS, Malvern
Instruments, Malvern, UK) was employed to measure the mean particle
size, polydispersity index (PDI), and zeta potential of blank nanocarriers,
3A.1-loaded PMs, 3A.1-loaded LPs and 3A.1 NSs. The samples were
properly diluted with distilled water before the measurements. All
measurements were determined in triplicate at 25ºC. As pH-responsive
polymers (NSC, OSC, and BSC) were used in the polymeric micelles, a
dispersed vehicle with different pH values (pH 1.2, 6.8, and 7.4) was used
to dilute the micelle formulations containing a drug to polymer ratio of 40
%wt to determine the effect of pH on the particle size and zeta potential of
the 3A.1-loaded PMs.
88
3.3.7.4 Other physicochemical properties of 3A.1 NSs
3.3.7.4.1 Reconstitution test
A small amount of the freeze-dried NS powder with and without
mannitol was added in a glass bottle container and re-dispersed greatly
with 1 mL of distilled water. The mean particle size, PDI, and zeta
potential of the dispersed 3A.1 NS was determined as described earlier.
3.3.7.4.2 Differential scanning calorimetry (DSC)
DSC thermogram was recorded using a differential scanning
calorimeter (DSC8000, PerkinElmer Inc., Germany). The samples
including 3A.1 coarse powder, all stabilizers, a physical mixture, and the
freeze-dried sample of 3A.1 NS, were accurately weighed in a standard
aluminum pan fitted with a perforated lid for thermal analysis. A heating
rate of 10ºC/min was used for the analysis in the range of 30-300ºC, and
an empty pan was used as the reference. The measurements were carried
out under nitrogen gas flow, at a rate of 20 mL/min.
3.3.7.4.3 Powder X-ray diffraction (PXRD)
The PXRD analysis was performed to detect any change in
physical properties and crystallinity of the 3A.1 coarse powder, all
stabilizers, a physical mixture, and the freeze-dried 3A.1 NS by a powder
X-ray diffractometer (Miniflex II, Rigaku, Japan) with a Cu radiation
source. Samples were packed into a flat-type glass holder. The PXRD
patterns were obtained at 40 kV and 25 mA. The scanning angle was set
from 5º < 2θ < 50º, and the scanning rate is 2º/min.
3.3.7.4.4 Fourier transform infrared spectrophotometry (FT-IR)
FTIR spectra were recorded to investigate whether there is any
degradation of the drug in the NS or any interaction between drug and
auxiliary materials. The samples, including the bulk 3A.1, blank
excipients, their physical mixture, and the freeze-dried 3A.1 NS, were
grounded with KBr powder and pressed into round disc with a diameter

89
of 13 mm. The spectra were recorded at a wavenumber ranging from 400-
4000 cm-1 using an FT-IR spectrometer (Nicolet 4700, USA).
3.3.7.4.5 Saturation solubility
The saturation solubility of the bulk 3A.1 and the 3A.1 NSs
stabilized by NSC, OSC, and BSC was determined using a shaken flask
method. An excess amount of all samples was added to a plastic
microcentrifuge tube containing various solvents including distilled
water, buffer medium pH 1.2, 6.8 and 7.4, and continuously shaken at
150 rpm using a shaking incubator for 48 h at 37 ± 0.5ºC to ensure
saturation. After equilibration, the samples were centrifuged at 10000
rpm for 30 min, and the supernatant was filtered through a 0.45-μm
membrane filter, before being analyzed for the actual drug concentration
using an HPLC. This experiment was carried out in triplicate.
3.3.8 In vitro drug release study
3.3.8.1 3A.1-loaded PMs
In brief, 100 µL of 3A.1-loaded PMs and 3A.1 coarse suspension
(the drug powder dispersed in distilled water containing equivalent
concentration of the drug to the 3A.1-loaded PMs) were added to 900 µL of
release medium contained in a 1.5-mL microcentrifuge tube. A simulated
gastric fluid (SGF) pH 1.2 was used as the medium for the first 2 h, followed
by a simulated intestinal fluid (SIF) pH 6.8 for 6 h and a simulated colonic
fluid (SCF) pH 7.4 for the further 4 h. The release study was conducted at
37 ± 0.5ºC in a shaking incubator at a shaking speed of 150 rpm. The
samples were collected at predetermined time points and filtered through a
0.45-µm membrane filter before the content determination via HPLC
analysis. The release study was carried out in triplicate.
3.3.8.2 3A.1-loaded LPs
The in vitro release of the drug loaded in the liposome or free drug
was investigated at 37 ± 0.5ºC in a shaking incubator shaken at 150 rpm.
The drug solution was prepared by dissolving the drug in DMSO. The
liposome sample was diluted to 1 mL in a microcentrifuge tube containing

90
PBS buffer (pH 7.4) as the release medium, to obtain the equivalent drug
concentration to the drug solution. At the predetermined time intervals up
to 24 h, the amount of the drug released was determined by HPLC. The
release experiment was performed in triplicate.
3.3.9 Stability study
The stability of 3A.1-loaded PMs, 3A.1-loaded LPs, and 3A.1 NSs was
determined according to the ICH guideline section Q1A R2 [208]. The samples
contained in a glass bottle clogged with a plastic cap were stored at 5 ± 3ºC, 60 ±
5%RH (long-term condition) and at 25 ± 2ºC, 60 ± 5%RH (accelerated condition)
for 6 months. The particle size, zeta potential, and drug content remaining of the
samples were evaluated after storage for 0, 30, 60, 120, and 180 days. All data were
measured in triplicate.
3.3.10 In vitro anticancer activity
The anticancer activity of free 3A.1, 3A.1-loaded PMs, 3A.1-loaded LPs,
and 3A.1 NSs against human colorectal cancer (CRC) cells was assessed by an
MTT assay. Briefly, CRC cells (1×10⁴ cells/well) were seeded into 96-well plates
with Dulbecco’s modified Eagle’s medium (DMEM) supplemented with 10%FBS
at pH 7.4 and cultured at 37ºC in a humidified 5% CO2 incubator. After 24-h
incubation (60-70% confluence), various concentrations of the free drug and the
selected drug nanocarriers were added to each well and further incubated for 24,
36, and 48 h. After treatment, the medium was removed and the cells were
incubated with the fresh medium containing 1 mg/mL of MTT for 4 h. After that,
the medium was removed again, and the formazan crystals formed in the living
cells were dissolved by the addition of DMSO (100 µL). Afterward, the optical
density (OD) of each well was analyzed using an automated microplate reader
(Multimode plate reader, Model Victor NivoTM, PerkinElmer, Hamburg, Germany)
operated at 550 nm. The percentage of cell viability was calculated following the
equation:
Cell viability (%) = ODtreated - ODDMSO
ODuntreated - ODDMSO
× 100 Eq.6

91
Moreover, half-maximal inhibitory concentration (IC50) values were
estimated using GraphPad Prism version 5.01 (GraphPad Inc., USA). The
cytotoxicity of the blank nanocarriers was also evaluated using the similar
procedure.
3.3.11 Induction of cell apoptosis
An apoptosis and necrosis assay was performed using a flow cytometer
(BD, FACSC Canto, Becton Dickinson, CA, USA) with FITC-conjugated Annexin
V/propidium iodide (PI) double-staining (BD Bioscience, USA). Briefly, CRC
cells were seeded in 6-well plates and incubated until 60-70% confluence at 37ºC
in a humidified 5% CO2 incubator. The cells were treated with 3A.1-loaded PMs,
3A.1-loaded LPs, and free 3A.1 in the fresh DMEM medium (the final drug
concentration was fixed at the IC50 value of 3.8 µg/mL) at 37ºC for 24 h. The
detergent 1% (v/v) Triton® X-100 solution in culture medium, which is reported to
damage cell membrane, was used as positive control for cell apoptosis and necrosis
[209,210]. After the treatment, the cells were gently detached using Accutase
enzyme solution (AccutaseTM, Merck, Temecula, CA, USA) and carefully washed
with the fresh medium. After that, the cells were centrifuged at 1400 rpm for 5 min,
and the cell pellets were re-suspended in a cold PBS buffer (pH 7.4). The cell pellets
were then re-suspended in 1x annexin V binding buffer. The cells were stained with
Annexin V-FITC (5 µL) and PI (5 µL) for 15 min at room temperature in the dark,
400 µL of 1x annexin V binding buffer was subsequently added before being
analyzed immediately using a flow cytometry with green fluorescence (FITC)
measured at 530 nm, and red (PI) fluorescence at 575 nm. Concurrently, the
untreated cells were considered as control. The data were evaluated using FACS
diva software (BD Bioscience, USA). Both early apoptotic (Annexin V+/PI-) and
late apoptotic (Annexin V+ /PI+ ) cells were included in the cell apoptosis
determination. Before data acquisition, the staining color compensation in flow
cytometry was conducted to ensure accurate interpretation of data.

92
3.3.12 In vitro cell migration
3.3.12.1 Scratch wound healing assay
The effect of free 3A.1, 3A.1- loaded PMs, and 3A.1-loaded LPs
on HN22 (human oral squamous cancer) cell motility was performed using
a scratch wound healing assay. Briefly, HN22 cells were cultured in 6-well
culture plates with DMEM containing 10% FBS at pH 7.4 to achieve
confluent monolayer. A monolayer of the cell in each well was gently
scratched with a sterile 200-µL pipette tip to create three straight lines/well
and rectangular cell-free spaces. Then, the culture medium was discarded
and gently washed twice with PBS (pH 7.4) to remove debris and scratched
cells. After that, the free drug and selected drug nanocarriers in fresh
medium at a final 3A.1 concentration lower than IC50 value (3.0 µg/mL)
were added into each well and cultured at 37ºC in an incubator with
humidified 5% CO2 for 24 h. Culture medium without drug and DMSO was
used as control. After scraping at 0, 6, 12, 18, and 24 h, the images (5
images/well) of the wound were captured at 40× magnification using an
inverted microscope (Nikon® T-DH, Japan). The anti-migratory activity
was assessed in triplicate. The wound gap and wound area were quantified
using JMicroVision version 1.2.7 and calculated to determine the cell
migration rate and percentage of wound closure using Eq.7 and Eq.8,
respectively.
Rate of cell migration (µm/h) = Initial wound gap - Final wound gap
Observed time × 100 Eq.7
Wound closure (%) =
Wound area at the starting time point - Wound area at the ending time point
Wound area at the starting time point × 100 Eq.8
3.3.12.2 Transwell migration assay (Boyden chamber)
Transwell migration assay was also performed to determine the
effect of the free 3A.1 and 3A.1-loaded LPs on HCT116 cell motility in
vertical direction. In brief, HCT116 cells (5 × 10⁴ cells/well) dispersed in a
medium containing low level of FBS (1% v/v), were seeded in the upper

93
chamber of a transwell system in a 24-well plate clear flat bottom (Costar®,
Corning Incorporated, USA). The experimental study was carried out
according to the manufacturer’s procedures. Each drug treatment at a final
3A.1 concentration of 2.0 µg/mL, which was diluted in culture medium
supplemented with high level of FBS (10%) as a chemotactic reagent, was
added to the lower chamber and incubated in a humidified 5% CO2
incubator at 37ºC for 24 h. Subsequently, the culture medium in the upper
insert was discarded, washed twice with PBS (pH 7.4), and cold 95%
methanol was then added to fix the cells for 30 min. Then, the cells were
washed with PBS (pH 7.4), and the non-migrated cells were wiped out
using a cotton swab. The cells migrated through the pore of membrane from
the upper side to the lower side were stained overnight with 2% crystal
violet in methanol solution. After that, the part of insert was washed with
PBS (pH 7.4), and the membrane was dried at room temperature. The
images of the migrated cells in each treatment were captured under an
inverted microscope at 4× and 10× magnification. The migrated cells that
penetrated to the lower membrane were counted and then calculated to
relative percentage of cell migration compared with control group under the
same filed at the endpoint. Both assays of anti-migratory activity of the drug
nanocarriers were conducted at least three replicates.
No. of cell migration (%) = The no. of migrated cells in the treatment group
The no. of migrated cells in the control group × 100 Eq.9
3.3.13 In vitro cellular uptake
In this part, doxorubicin (Dox) which is a red fluorescent agent was selected
to be incorporated into the polymeric micelles to generate drug-loaded micelles.
The cellular uptake of Dox into HT29 cells was examined by a flow cytometric
analysis. Briefly, HT29 cells at a density of 1 × 10⁵ cells/well were grown in a 6-
well plate and incubated overnight at 37ºC. Later, the cells were treated with free
Dox or the 40 wt% Dox-loaded NSC micelles (equivalent Dox concentration to 2.0
μM) in the fresh culture medium for 12 and 24 h. Afterward, the cells were rinsed
twice with PBS (pH 7.4), to discard any free Dox or micelles, and were then

94
visualized by a fluorescence imaging system (Nikon DS-Ri2 camera connected
with NIS element D4.60 software; Nikon, Japan) using 4× objective lens.
Moreover, to confirm the extent of Dox in the cells, the cell suspensions in PBS
(pH 7.4) of each treatment were analyzed by flow cytometer (BD Bioscience,
USA). An excitation and emission wavelength at 488 nm and 575 nm were applied
to detect the fluorescent intensity and fluorescent histogram of Dox. Typically,
30000 events were counted for each sample. Finally, the mean fluorescent intensity
(MFI) of Dox from individual three detections were computed and reported as mean
± SD.
3.3.14 In vivo antitumor efficacy
3.3.14.1 Establishment of tumor xenograft models of CRC
The tumor xenograft nude mouse model of colorectal cancer
(CRC) should be established before the investigation of anticancer effect of
the compound. Nude mice (male, BALB/cAJcl-nu/nu, 18 ± 2 g, 5 weeks
old) were supplied from Nomura Siam International Co., Ltd., Thailand.
The nude mice were immunodeficient characteristic as they lack of thymus
gland (athymic) and T-cell function. All animal experiments and animal
care were performed according to the Guidelines for Ethical and Regulatory
for Animal Experiments as issued by Central Animal Facility, Faculty of
Science, Mahidol University (MUSC-CAF), Thailand [211]. This in vivo
experimental protocol was officially approved by MUSC-CAF with
protocol number MUSC61-015-417. The mice were quarantined on a 12-h
dark/light cycle, in an air-controlled room temperature at 25 ± 1°C and 55
± 5%RH, under specific pathogen-free conditions at least 7 days before
tumor implantation in the individual ventilated cages (IVC). The mice were
provided with sterile RO water and diet ad libitum. HCT116 (human
colorectal cancer) cells in the logarithmic growth curve were collected
aseptically by trypsinization. The cells were washed twice and re-suspended
with sterile PBS (pH 7.4). The cell viability and number were counted after
staining with 0.4% trypan blue. For cancer cell implantation, the nude mice
were randomly divided into 3 groups (2 mice/ group), disinfected skin at

95
injected position with 70% ethanol and then injected subcutaneously with
the cell densities of 1 × 10⁶ cells/200 μL, 5 × 10⁶ cells/200 μL and 10 × 106
cells/200 μL at the right lower flank with 1-mL syringes and 26G × 0.5-
inch long needle under sterile conditions (Figure 18). The tumor nodules
became palpable at day 7 after cell inoculation (with cell density of 10 ×
106 cells). The tumor size was determined twice a week using a digital
Vernier caliper (Syntex®, Syntex Electronic Technology Co., Ltd., China).
Only HCT116 cell density that displayed the desirable tumor growth rate
was chosen for investigation of in vivo antitumor efficacy of the free 3A.1
and the 3A.1 NSs.
Tumor growth was investigated for 4-6 weeks or until the size of
tumor reached ~2000 mm3. The tumor size (mm) in two dimensions (length
and width) and body weight (g) were recorded twice a week using a digital
Vernier caliper, and the tumor volume (TV) was calculated according to the
following formula:
TV (mm3) = L × W2 / 2 Eq.10
where L and W refer to the length (range of major-axis) and width (range of
minor-axis) of spherical tumors, respectively. If the tumor volumes reached
over 2000 mm3 or the animals show any tumor necrosis, they were also
sacrificed.
Figure 18 Protocol for CRC implantation in athymic nude mice
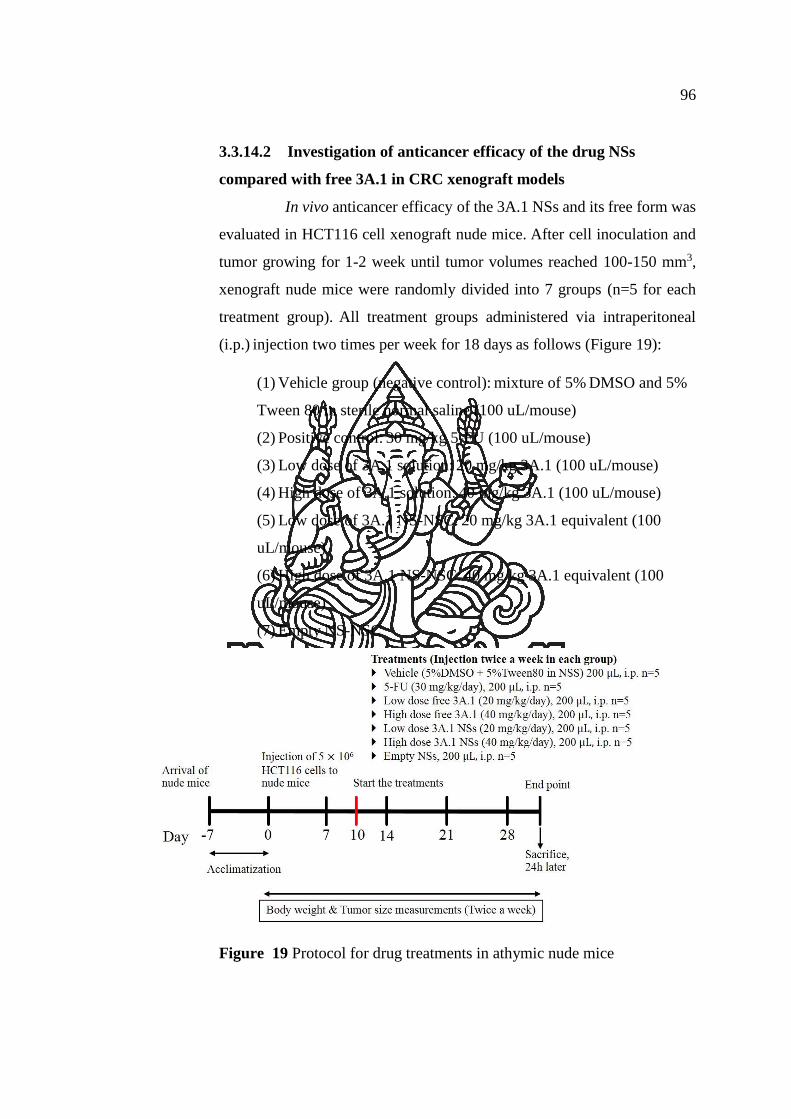
96
3.3.14.2 Investigation of anticancer efficacy of the drug NSs
compared with free 3A.1 in CRC xenograft models
In vivo anticancer efficacy of the 3A.1 NSs and its free form was
evaluated in HCT116 cell xenograft nude mice. After cell inoculation and
tumor growing for 1-2 week until tumor volumes reached 100-150 mm3,
xenograft nude mice were randomly divided into 7 groups (n=5 for each
treatment group). All treatment groups administered via intraperitoneal
(i.p.) injection two times per week for 18 days as follows (Figure 19):
(1) Vehicle group (negative control): mixture of 5% DMSO and 5%
Tween 80 in sterile normal saline (100 uL/mouse)
(2) Positive control: 30 mg/kg 5-FU (100 uL/mouse)
(3) Low dose of 3A.1 solution: 20 mg/kg 3A.1 (100 uL/mouse)
(4) High dose of 3A.1 solution: 40 mg/kg 3A.1 (100 uL/mouse)
(5) Low dose of 3A.1 NS-NSC: 20 mg/kg 3A.1 equivalent (100
uL/mouse)
(6) High dose of 3A.1 NS-NSC: 40 mg/kg 3A.1 equivalent (100
uL/mouse)
(7) Empty NS-NSC
Figure 19 Protocol for drug treatments in athymic nude mice

97
Free 3A.1 was dissolved in a solvent mixture consisting of
DMSO/Tween 80/PBS (5/5/90, v/w/v) achieving the final concentration for
in vivo administration. The free 3A.1 was then sonicated for 30 min in a
bath sonicator prior to i.p. injection. During the entire injectable period
(with total of 6 doses), the body weight of each mouse was recorded, and
the tumor size was measured two times per week using a digital Vernier
caliper, and the tumor volume was then calculated using the Eq.10. All
procedures related to drug administration were performed in a laminar
airflow hood using aseptic techniques. TV was measured to evaluate the
therapeutic effects of each treatment group. Tumor growth curves and body
weight profiles were drawn to compare these results among treatments. The
tumor volumes from the total number of survival mice in the control and
treated groups that observed since the beginning to the end of the study
were used to calculate the percentages of tumor growth inhibition (%TGI)
following the Eq.11:
%TGI = [1 − (Tt - T0
Ct - C0)] × 100 Eq.11
which Tt is the median TV (mm3) of the treated mice at time t
T0 is the median TV (mm3) of the treated mice at time 0
Ct is the median TV (mm3) of the vehicle control–treated mice at time t.
C0 is the median TV (mm3) of the vehicle control–treated mice at time 0.
Tumor volume doubling time was measured over the linear growth
range of the tumor. TGI of 50% over one tumor volume doubling time are
considered an active anti-tumor response.
Furthermore, the common toxicities of free 3A.1 and the 3A.1 NSs
were observed by monitoring the relative body weight loss throughout the
experiments. At the end of treatments (18 days of post-treatment), the
surviving mice were sacrificed by anesthesia via an i.p. injection of 5 mg/kg
xylazine plus 50 mg/kg Zoletil using 26G × 0.5-inch long needle with 1-
mL syringe, followed by an aortic arch cutting. The fresh tumor masses
were excised from the back of mice using scissors and scalpels, weighed
98
and photographed. The visceral organs including lung, liver, spleen, and
kidney were also removed from each mouse to assess the adverse effect of
the compound. The tumor tissues and visceral organs were cut for
histopathological examination by staining with hematoxylin and eosin. Half
section of tumor was fixed in 10% buffered formalin and embedded in
paraffin wax in tissue cassettes for routine histopathology. These tissue
paraffin samples (4 μm in thickness) were stained with haematoxylin and
eosin (H&E) reagent for histopathological examination.
3.3.15 Statistical analysis
All experimental measurements were collected in triplicate. Data are
presented as mean ± standard deviation (SD). The statistical significance of
differences was examined using one-way analysis of variance (ANOVA) followed
by an LSD post-hoc test (GraphPad Prism version 5.01, GraphPad Inc., USA).
Statistical significance of differences was considered when p-value < 0.05 for all
statistical tests.

99
CHAPTER 4
RESULTS AND DISCUSSION
4.1 Polymeric micelles with or without 3A.1 analogue
The blank polymeric micelles and hydrophobic 3A.1-loaded polymeric micelles
based on the three types of amphiphilic chitosan graft copolymers (NSC, OSC, and
BSC) were prepared using different physical encapsulation techniques including
dialysis, O/W emulsion, dropping, and evaporation followed by sonication method.
These chitosan graft copolymers could generate core-shell structural nanomicelles
which encapsulated the 3A.1 in the hydrophobic inner core by a self-assembly process.
Overall, the pH of these micelles was in the ranges of 5.5-6.7, representing mildly acidic
solution.
4.1.1 Effects of physical entrapment methods
The effects of different physical entrapment methods on the physicochemical
properties of the 3A.1-loaded micelles were investigated at a fixed initial ratio of
20 wt% drug to polymer. The parameters considered when selecting the optimal
drug-loading method were particle size, zeta potential, entrapment efficiency
(%EE), and drug loading capacity (LC). All data are listed in Table 8. Among the
four drug-loading methods with different grafted hydrophobic moieties, the
micelles formed by the dropping method exhibited the smallest particle size with
the diameter ranging from 90.33 to 165.63 nm, while the zeta potential values
showed a highly negative surface charge (− 24.97 to − 28.40 mV) due to
dissociation of carboxyl groups in hydrophilic moieties resulting in the diminished
aggregation. On the other hand, the 3A.1-loaded micelles prepared by O/W
emulsion method were found to be the biggest, with the lowest values of drug
loading content. The %EE and LC of 3A.1-loaded micelles prepared by dropping
method were 72.59 ± 8.61 to 80.13 ± 5.01% and 145.17 ± 17.21 to 160.27 ± 10.03
μg/mg, respectively. These high values of drug content indicated that this method
could efficiently entrap the hydrophobic 3A.1 anticancer drug within the cores of
the micellar particles. Therefore, dropping method was selected to formulate 3A.1-
loaded micelles for further studies.

100
Tab
le 8
The
physi
coch
emic
al p
roper
ties
of
3A
.1-l
oad
ed p
oly
mer
ic m
icel
les
wit
h 2
0 w
t% in
itia
l dru
g a
dded
(N
SC
, OS
C, a
nd B
SC
) pre
par
ed
1
usi
ng f
our
physi
cal
entr
apm
ent
met
hods.
Eac
h v
alue
repre
sents
the
mea
n ±
sta
ndar
d d
evia
tion f
rom
thre
e in
dep
enden
t ex
per
imen
ts.
2
3
T
yp
e of
CS
der
ivati
ves
M
eth
od
P
arti
cle
size
(nm
) Z
eta p
ote
nti
al
(mV
) E
ntr
ap
men
t
effi
cien
cy (
%)
Load
ing c
ap
aci
ty
(µg/m
g)
NS
C
Dia
lysi
s 136.0
7 ±
1.4
3
(-)
25.1
0 ±
0.2
2
66.7
0 ±
2.5
7
133.3
9 ±
5.1
3
O
/W e
muls
ion
105.0
3 ±
1.2
8
(-)
24.9
0 ±
1.3
4
7.8
6 ±
1.8
9
15.7
2 ±
3.7
8
D
roppin
g
90.3
3 ±
2.2
8
(-)
24.9
7 ±
1.1
1
72.5
9 ±
8.6
1
145.1
7 ±
17.2
1
E
vap
ora
tion
348.5
0 ±
9.4
8
(-)
21.9
7 ±
0.4
9
5.3
4 ±
1.1
2
10.6
8 ±
2.2
4
OS
C
Dia
lysi
s 287.0
0 ±
3.8
1
(-)
29.6
0 ±
0.3
3
62.8
8 ±
1.5
8
125.7
7 ±
3.1
7
O
/W e
muls
ion
249.5
0 ±
8.7
8
(-)
25.8
0 ±
0.2
9
14.3
4 ±
1.2
9
28.6
7 ±
2.5
9
D
roppin
g
165.6
3 ±
9.8
0
(-)
26.6
7 ±
0.8
2
80.1
3 ±
5.0
1
160.2
7 ±
10
.03
E
vap
ora
tion
251.1
7 ±
2.9
5
(-)
28.7
3 ±
0.0
9
3.2
6 ±
1.3
3
6.5
2 ±
2.6
6
BS
C
Dia
lysi
s 242.6
7 ±
2.2
3
(-)
26.7
7 ±
0.4
6
65.3
1 ±
1.8
9
130.6
2 ±
3.7
7
O
/W e
muls
ion
160.6
0 ±
0.5
0
(-)
32.3
7 ±
1.5
4
12.3
4 ±
1.9
7
24.6
8 ±
3.9
5
D
roppin
g
131.6
3 ±
1.0
5
(-)
28.4
0 ±
0.6
8
73.0
6 ±
2.3
8
146.1
3 ±
4.7
6
E
vap
ora
tion
441.2
0 ±
8.7
8
(-)
24.6
7 ±
0.1
2
4.2
7 ±
1.4
5
8.5
4 ±
2.9
0

101
Tab
le 9
The
par
ticl
e si
ze,
PD
I, a
nd z
eta
pote
nti
al o
f 3A
.1-l
oad
ed p
oly
mer
ic m
icel
les
pre
par
ed u
sing t
he
dro
ppin
g m
ethod a
t th
e dif
fere
nt
1
dru
g t
o p
oly
mer
wei
ght
rati
os.
All
dat
a re
pre
sent
the
mea
n ±
sta
ndar
d d
evia
tion (
n =
3).
2
3A
.1 t
o
poly
mer
(%)
NS
C
OS
C
BS
C
Siz
e (n
m)
PD
I ζ
(mV
) S
ize
(nm
) P
DI
ζ (m
V)
Siz
e (n
m)
PD
I ζ
(mV
)
0
66.2
6 ±
1.2
1
0.3
00
(-
) 30.5
0 ±
1.9
3
132.3
3 ±
6.6
1
0.1
31
(-)
17
.67 ±
1.5
7
111.1
1 ±
1.0
5
0.1
60
(-)
29.3
3 ±
0.3
4
5
75.2
3 ±
1.3
5
0.1
64
(-
) 26.7
7 ±
0.9
7
150.4
3 ±
6.7
0
0.1
81
(-)
29
.24 ±
3.4
2
112.2
7 ±
0.6
7
0.1
38
(-)
26.2
3 ±
0.6
1
10
82.1
2 ±
3.5
5
0.1
85
(-
) 28.8
0 ±
2.3
2
161.8
1 ±
5.2
7
0.1
94
(-)
27
.02 ±
0.2
2
127.0
6 ±
2.3
2
0.1
85
(-)
27.3
5 ±
1.5
1
20
90.3
3 ±
2.2
8
0.2
55
(-
) 24.9
7 ±
1.1
1
165.6
3 ±
9.8
0
0.1
85
(-)
26
.67 ±
0.8
2
131.6
3 ±
1.0
5
0.2
08
(-)
28.4
0 ±
0.6
8
40
102.5
3 ±
0.6
0
0.1
62
(-
) 22.2
3 ±
5.2
7
170.6
7 ±
1.7
2
0.1
92
(-)
32
.07 ±
3.0
7
153.9
7 ±
1.2
0
0.1
95
(-)
26.0
7 ±
0.4
2
3
4
5
6
7
8
9

102
Tab
le 1
0 T
he
effe
ct o
f dif
fere
nt
pH
of
dis
per
sion v
ehic
le o
n p
arti
cle
size
and z
eta
pote
nti
al o
f 3A
.1-l
oad
ed p
oly
mer
ic m
icel
les
wit
h 4
0
1
wt%
init
ial
dru
g a
dded
pre
par
ed u
sing t
he
dro
ppin
g m
ethod.
All
dat
a re
pre
sent
the
mea
n ±
sta
ndar
d d
evia
tion (
n =
3).
2
Tab
le 1
1 T
he
physi
coch
emic
al p
roper
ties
of
3A
.1-l
oad
ed p
oly
mer
ic m
icel
les
wit
h a
nd w
ithout
40 w
t% i
nit
ial dru
g a
dded
(N
SC
vs.
Fola
te-
3
conju
gat
ed N
SC
) pre
par
ed u
sing t
he
dro
ppin
g m
ethod.
All
dat
a re
pre
sent
the
mea
n ±
sta
ndar
d d
evia
tion (
n =
3).
4
5
6
Form
ula
tion
s B
uff
er p
H 1
.2
B
uff
er p
H 6
.8
B
uff
er p
H 7
.4
size
(n
m)
ζ (m
V)
size
(n
m)
ζ (m
V)
size
(n
m)
ζ (m
V)
3A
.1 N
SC
PM
s 2595.2
± 1
90
.34
(+)
4.6
1±
0.3
7
122.2
7 ±
1.9
1
(-)
24.2
3±
1.2
7
121.4
3±
0.4
9
(-)
21.3
3±
0.4
9
3A
.1 O
SC
PM
s 1407.6
7 ±
93
.20
(+)
1.9
0±
0.5
4
132.8
0 ±
3.9
2
(-)
26.6
0±
0.5
1
129.8
0±
0.5
7
(-)
19.4
3±
0.2
1
3A
.1 B
SC
PM
s 1360.3
3 ±
141
.06
(+)
5.0
8±
0.5
1
136.3
0 ±
0.9
2
(-)
17.4
7±
1.6
0
133.6
7±
0.9
6
(-)
19.7
1±
1.3
2
Form
ula
tion
s P
arti
cle
size
(nm
) P
DI
ζ (m
V)
En
trap
men
t
effi
cien
cy (
%)
Load
ing c
ap
aci
ty
(μg/m
g)
Bla
nk N
SC
PM
s 85.2
6 ±
1.2
1
0.2
83
(-)
23.0
3 ±
1.1
1
- -
Bla
nk F
ol-
NS
C P
Ms
343.8
0 ±
43
.73
0.4
94
(-)
28.5
0 ±
1.1
5
- -
3A
.1-l
oad
ed N
SC
PM
s 110.1
7 ±
1.1
3
0.1
70
(-)
26.1
7 ±
1.4
4
90.8
4 ±
7.4
3
363.3
5 ±
29
.74
3A
.1-l
oad
ed F
ol-
NS
C P
Ms
189.4
7 ±
2.9
0
0.1
74
(-)
31.6
7 ±
0.3
9
68.4
4 ±
3.7
2
273.7
5 ±
14
.91

103
4.1.2 Effects of initial 3A.1 and hydrophobic cores
The effects of the initial amount of drug added (5-40 wt% drug to polymer)
and hydrophobic functionalities (naphthyl, octyl, or benzyl groups) on the
physicochemical properties of the amphiphilic nanomicelles were studied. All
3A.1-loaded micelles were prepared by the dropping method. The particle size,
size distribution, and surface charge of the micelles were determined by dynamic
light scattering (DLS), and the results are shown in Table 9.
4.1.2.1 Particle size and zeta potential
It was found that an increase in the initial amounts of drug added
resulted in an increase in the mean particle sizes (75.23 ± 1.35 to 170.67 ±
1.72 nm), which were bigger than those of the blank micelles (66.26 ± 1.21
to 132.33 ± 6.61 nm). This might be due to the high amount of the drug
molecule entrapped inside the micelles. However, it should be noted that
some aggregations occurred as the initial amounts of drug added (wt% to
polymer ratio) was increased to 80%. At the initially added drug to polymer
ratio of 40 wt%, the mean particle sizes of the 3A.1-loaded micelles were
ranked as follows: NSC (102.53 ± 0.60 nm) < BSC (153.97 ± 1.20 nm) <
OSC (170.67 ± 1.72 nm). The 3A.1-loaded NSC micelles exhibited the
smallest particle size compared with the other micelles. In addition, the
polydispersity indices (PDI) of all micelles were lower than 0.3, indicating
that the particle size distribution of these micelles was narrow. The surface
charges were also presented to be negative (− 22.23 ± 5.27 to − 32.07 ±
3.07 mV) which may be resulted from the appearance of negatively charged
succinyl moieties on the micelles that reduce micelles aggregation, stabilize
the micelles in an aqueous medium, and display pH-sensitive feature.
According to the pH-sensitive polymers of amphiphilic CS
derivatives used in the 3A.1-loaded micelles, the 3A.1-loaded micelles
(NSC, OSC, and BSC) with 40 wt% initial drug added were dispersed in
various pH of the dispersion medium. The results showed that the different
pH of dispersion vehicles affected both particle size and zeta potential of
3A.1-loaded micelles, as presented in Table 10. When the micelles were

104
surrounded by the dispersed vehicle pH 1.2, which the pH is lower than the
pKa of succinic acid (pKa = 4.21) at 25°C [212], the particle size of these
micelles aggregated to form bigger particles with the size ranging from
1360.33 ± 141.06 to 2595.2 ± 190.34 nm since carboxyl groups of the
succinic acid cannot ionize in this solution and remain in an unionized form.
The PDI values of nearly 1 indicated a very broad size distribution of the
3A.1-loaded micelles that were dispersed in acidic solution. The zeta
potential of the 3A.-loaded micelles had a slightly positive charge ranging
from (+) 1.90 ± 0.54 to (+) 5.08 ± 0.51 mV. These low values of electrical
repulsion caused particle aggregation of the micelles. The particle size of
the micelles was in the range of 122.27 ± 1.91 to 136.30 ± 0.92 nm in the
dispersed vehicle pH 6.8 and 121.43 ± 0.49 to 133.67 ± 0.96 nm in the
dispersed vehicle pH 7.4. The particles with nanosized diameter were
obtained due to the ionization of carboxyl groups of the succinic acid in the
vehicle pH 6.8 or 7.4, which was higher than the pKa value of succinic acid,
along with the swelling as a result of deprotonation. The zeta potential of
the 3A.1-loaded micelles dispersed in the vehicle pH 6.8 and 7.4 was (-)
17.47 ± 1.60 to (-) 26.60 ± 0.51 mV and (-) 19.43 ± 0.21 to (-) 21.33 ± 0.49
mV, respectively. The higher values of negative surface charge facilitated
lessen particle aggregation of micelles with the narrow size distribution.
Thus, the insightful results help to understand the function of pH-sensitive
polymeric micelles.
4.1.2.2 Micellar morphology
The morphology of the blank and the drug-loaded micelles was
examined using a transmission electron microscopy (TEM), and the
representative images are illustrated in Figure 20. In comparison with the
blank micelles, the TEM images of the 3A.1-loaded micelles (NSC, OSC,
and BSC) with 40 wt% initial drug added were spherical, with a smooth
surface and uniform size. Their mean sizes were in the nanometer range
(approximately 40 to 90 nm in diameter). Notably, the mean particle sizes
of the micelles shown in the TEM images were smaller than those from the

105
DLS technique. This is because the micelles analyzed using TEM were
performed in a dry state. On the other hand, those analyzed by DLS were
carried out in an aqueous solution [213]. These micelles with a uniform size
of not more than 200 nm could penetrate through the leaky vasculature of
tumors and accumulate in tumor tissues via passive tumor targeting
[91,214].
Figure 20 TEM images of polymeric micelles prepared by dropping method: (a)
blank NSC PMs, (b) 3A.1-loaded NSC PMs, (c) 3A.1-loaded OSC PMs, and (d)
3A.1-loaded BSC PMs. The scale bars in all images are 100 μm.
4.1.2.3 Entrapment efficiency and loading capacity
A quantitative analysis of the drug content in the hydrophobic core
of the micelles was performed using an HPLC. The effects of the initial
amount of drug added (5–40 wt% to polymer weight ratio) and the different
grafted hydrophobic moieties (naphthyl, octyl, and benzyl groups) on the
%EE and LC are presented in Figure 21. The x-axis represents the initial
amount of drug added to the micelle formulations, and the y-axis represents
the encapsulated drug content in the micelles in terms of %EE (Figure 21a)
and LC (Figure 21b). The results revealed that the initial amount of drug
added directly correlated with the drug loading content. An increase in the
initial amount of drug added resulted in an increase in LC due to the
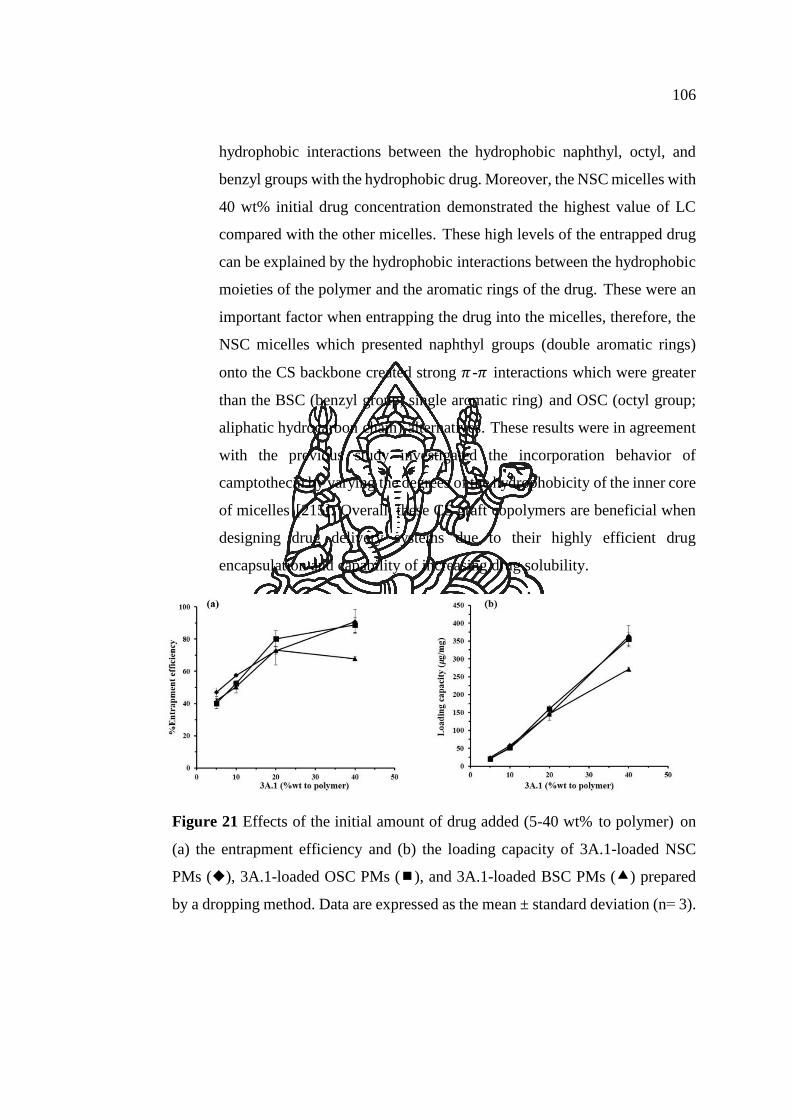
106
hydrophobic interactions between the hydrophobic naphthyl, octyl, and
benzyl groups with the hydrophobic drug. Moreover, the NSC micelles with
40 wt% initial drug concentration demonstrated the highest value of LC
compared with the other micelles. These high levels of the entrapped drug
can be explained by the hydrophobic interactions between the hydrophobic
moieties of the polymer and the aromatic rings of the drug. These were an
important factor when entrapping the drug into the micelles, therefore, the
NSC micelles which presented naphthyl groups (double aromatic rings)
onto the CS backbone created strong 𝜋 -𝜋 interactions which were greater
than the BSC (benzyl group; single aromatic ring) and OSC (octyl group;
aliphatic hydrocarbon chain) alternatives. These results were in agreement
with the previous study investigated the incorporation behavior of
camptothecin by varying the degrees of the hydrophobicity of the inner core
of micelles [215]. Overall, these CS graft copolymers are beneficial when
designing drug delivery systems due to their highly efficient drug
encapsulation and capability of increasing drug solubility.
Figure 21 Effects of the initial amount of drug added (5-40 wt% to polymer) on
(a) the entrapment efficiency and (b) the loading capacity of 3A.1-loaded NSC
PMs (), 3A.1-loaded OSC PMs (), and 3A.1-loaded BSC PMs () prepared
by a dropping method. Data are expressed as the mean ± standard deviation (n= 3).
107
4.1.3 In vitro drug release
The in vitro release behaviors of the 3A.1 from the 3A.1-loaded micelles
(NSC, OSC, and BSC) with 40 wt% initial drug added were examined at 37°C in
three stages with different pH imitated the condition in the GI tract. A plot of the
cumulative drug release from free 3A.1 and the 3A.1-loaded micelles as a function
of time is shown in Figure 22. In SGF (pH 1.2), there was no apparent amount of
drug released from any 3A.1-loaded micelles. However, when the release medium
was changed to SIF (pH 6.8) for 6 h, the 3A.1 was considerably released from the
3A.1-loaded micelles, which significant difference in the released amounts was
observed from the micelles prepared from different CS derivatives, indicating that
the release rate depended on the hydrophobic functionalities of the polymer. The
percentages of drug release from these micelles after 4 h were as follows: NSC
(82.10 ± 2.43%) > BSC (63.41 ± 2.03%) > OSC (52.03 ± 3.33%). On the other
hand, 3A.1 free drug could not be released through the simulated GI tract (SGF,
SIF, and SCF). This might be due to the poor aqueous solubility of 3A.1 in all types
and pH values of release medium (<1 μg/mL at 37°C).
Generally, the pKa value of succinic acid is approximately 4.21 at 25°C
[212]. In the gastric fluid (pH 1.2), the succinyl groups grafted onto the CS polymer
were unionized, resulting in a tight arrangement of the polymer core-shell structure
and protection of 3A.1 from the acidic environment. When the micelles were
exposed to the alkaline environment in SIF (pH 6.8) and SCF (pH 7.4), the succinyl
groups grafted onto the CS polymer showed high ionization and created a negative
surface charge, leading to losing compaction of the core-shell structures and
promotion of the release of 3A.1 from the inner cores of the micelles. In addition,
the different hydrophobic moieties influenced the drug release in SIF and SCF. The
extent of drug release was reduced as follows: NSC micelles > BSC micelles >
OSC micelles (p<0.05). These results suggested that not only the π–π interactions
restrict water penetration but also other factors such as hydrophobicity,
mobility/rigidity, hydrogen bonding, and steric factors, influencing the difference
in drug release [111]. Hence, many drug release studies inferred that these pH-
sensitive micelles could enhance the solubility of 3A.1 in SIF and SCF media, and
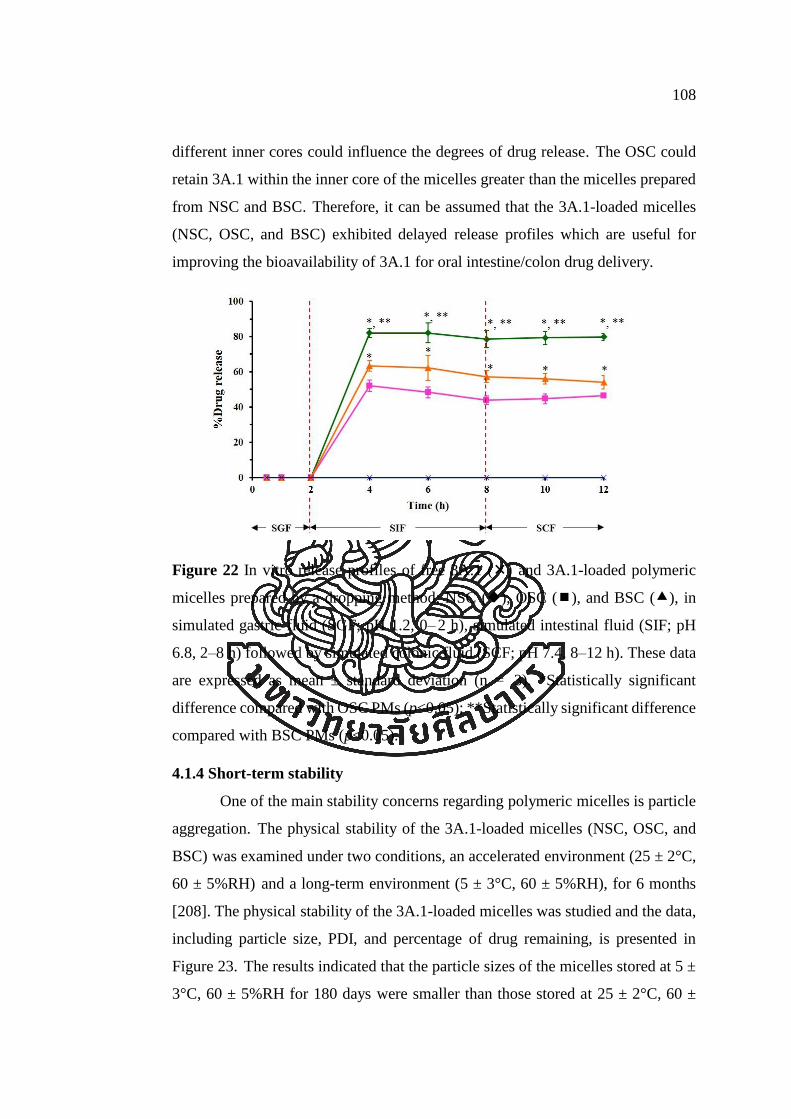
108
different inner cores could influence the degrees of drug release. The OSC could
retain 3A.1 within the inner core of the micelles greater than the micelles prepared
from NSC and BSC. Therefore, it can be assumed that the 3A.1-loaded micelles
(NSC, OSC, and BSC) exhibited delayed release profiles which are useful for
improving the bioavailability of 3A.1 for oral intestine/colon drug delivery.
Figure 22 In vitro release profiles of free 3A.1 () and 3A.1-loaded polymeric
micelles prepared by a dropping method; NSC (), OSC (), and BSC (), in
simulated gastric fluid (SGF; pH 1.2, 0– 2 h), simulated intestinal fluid (SIF; pH
6.8, 2–8 h) followed by simulated colonic fluid (SCF; pH 7.4, 8–12 h). These data
are expressed as mean ± standard deviation (n = 3). *Statistically significant
difference compared with OSC PMs (p<0.05); **Statistically significant difference
compared with BSC PMs (p<0.05).
4.1.4 Short-term stability
One of the main stability concerns regarding polymeric micelles is particle
aggregation. The physical stability of the 3A.1-loaded micelles (NSC, OSC, and
BSC) was examined under two conditions, an accelerated environment (25 ± 2°C,
60 ± 5%RH) and a long-term environment (5 ± 3°C, 60 ± 5%RH), for 6 months
[208]. The physical stability of the 3A.1-loaded micelles was studied and the data,
including particle size, PDI, and percentage of drug remaining, is presented in
Figure 23. The results indicated that the particle sizes of the micelles stored at 5 ±
3°C, 60 ± 5%RH for 180 days were smaller than those stored at 25 ± 2°C, 60 ±
109
5%RH, the surface charges of the micelles were not altered which had a highly
negative zeta potential value of approximately − 30 mV. Interestingly, the mean
particle size of these micelles in both conditions remained lower than 200 nm
without nanoparticle aggregation. These results might suggest that the high
negative charge of these micelles helped to stabilize the micelles in the aqueous
solution through electrostatic repulsion. After storage at the long-term condition
for 6 months, the total contents of 3A.1 in the NSC, OSC, and BSC micelles were
93.65 ± 2.69, 87.22 ± 2.85, and 85.67 ± 3.15%, respectively. However, under the
accelerated condition the drug content was found to be 81.64 ± 2.87, 68.27 ± 3.26,
and 53.62 ± 3.36%, respectively. The 3A.1-loaded micelles kept under an
accelerated condition exhibited faster degradation than those stored under a long-
term condition. The 3A.1- loaded BSC micelles demonstrated poor stability,
whereas the NSC micelles showed better stability with the high values of %drug
remaining after 6 months when stored under a long-term condition. These results
explained that naphthyl groups had stronger hydrophobic interaction between the
hydrophobic groups of the polymer and the hydrophobic drug than the benzyl
groups, resulting in higher drug protection capability and a decrease in drug
leakage from the NSC micelles [216]. Our data suggested that the micelles should
be stored in a refrigerator to maintain the particle size, zeta potential, and the
amount of drug remaining in the micelles.

110
Figure 23 The short-term stability of 3A.1-loaded polymeric micelles stored under
long-term condition (left) compared with under accelerated condition (right) for 6
months; (a,d) particle size of NSC PMs (black bar), OSC PMs (dark gray bar), and
BSC PMs (light gray bar); (b,e) zeta potential of NSC PMs (black bar), OSC PMs
(dark gray bar), and BSC PMs (light gray bar); (c,f) the amount of 3A.1 remaining
in NSC PMs (), OSC PMs (), and BSC PMs (). All data are presented as the
mean ± standard deviation (n = 3).
4.1.5 In vitro anticancer activity
The anticancer activity of free 3A.1 and the 3A.1- loaded NSC, OSC, and
BSC micelles against human colorectal cancer (HT29) cells was assessed using an
MTT colorimetric assay. The finding indicated that the %cell viability was dose-
dependent. The half-maximal inhibitory concentration (IC50) was determined from

111
the %cell viability-drug concentration relationship. The IC50 values of the 3A.1-
loaded NSC, OSC, and BSC micelles for 36 h-treatment were 1.024 ± 0.071, 0.693
± 0.099, and 0.538 ± 0.025 μg/mL, respectively, which were significantly lower
than that of the free drug (3.816 ± 0.376 μg/mL; p<0.05) (Figure 24). Cell viability
of the blank micelles remained more than 80% even at high polymer concentrations
up to 500 μg/mL. No significant differences in the cytotoxicity were noticed among
the blank micelles prepared from different CS derivatives. These results indicated
that all blank micelles demonstrated minimal cytotoxicity in HT29 cells, and the
cytotoxicity was due to the presence of 3A.1 in the free form and the micelles.
Figure 24 The percentage of cell viability (y-axis) of HT29 cells after being
exposed to various concentrations of 3A.1-loaded polymeric micelles or free 3A.1
(x-axis) for 36-h treatment, and the IC50 values (μg/mL) were included.
4.1.6 Induction of cell apoptosis
To confirm whether this drug can induce apoptosis in HT29 colorectal
cancer cells, a co-staining assay (annexin V-FITC and PI) was used to
quantitatively analyze the degree of cell death, especially cell apoptosis, by flow
cytometry analysis (Figure 25a). In this part, the cell apoptosis rate was calculated
by the inclusion of the percentage of early apoptosis (Q4; annexin V-FITC+/PI−)
and the percentage of late apoptosis (Q2; annexin V-FITC+/PI+) (Figure 25b). After
incubation with the free drug and different formulations of 3A.1-loaded micelles

112
containing equivalent drug concentrations (at IC50 of the free drug; 3.8 µg/mL) for
24 h, the cell apoptosis rates of the drug-loaded NSC, OSC, and BSC micelles were
45.20 ± 3.27, 41.60 ± 2.45, and 40.50 ± 2.04%, respectively, which were
significantly greater than those of the free drug (33.10 ± 2.45%) and Triton® X-
100 (9.50 ± 1.63%). These degrees of cell apoptosis were in concordance with the
results of the in vitro anticancer activity. In addition, the percentage of cell necrosis
of the cells treated with the drug-loaded micelles were lower than that treated with
free drug at this stage. This might be a beneficial property of the micelles for the
growth suppression of cancer cells. Thus, 3A.1-loaded NSC, OSC, and BSC
micelles induced intense apoptosis in HT29 colorectal cancer cells [20,82].
Figure 25 3A.1-loaded PMs induce HT29 cancer cell apoptosis examined by flow
cytometry: (a) HT29 cells treated with 3A.1-loaded PMs, free 3A.1 (at the
equivalent 3A.1 concentration of 3.8 µg/mL), and Triton-X® for 24 h which are
presented in four quadrants (Q) with dot plot. The number of necrosis cells, late
apoptosis cells, early apoptosis cells, and living cells are displayed on Q1, Q2, Q4,
and Q3, respectively. (b) Percentage of cell apoptosis rate of the cells after being
treated with 3A.1-loaded PMs, free drug, and Triton-X®. *Statistically significant
difference from free 3A.1 group (p<0.05).

113
4.1.7 In vitro anti-migratory activity
The scratch wound migration assay was selected to assess the anti-
migratory effect of free 3A.1 and 3A.1-loaded micelles on human oral cancer
(HN22) cells because of the simple and cost-effective procedure. The wound gap
images of cells treated with the 3A.1-loaded micelles and free drug are shown in
Figure 26a. After 24-h treatment, the scratch areas of the untreated cell monolayer
were almost fully closed, whereas both free 3A.1 and 3A.1-loaded micelles tended
to reduce the cell motility. In addition, the cell migration rate and %wound closure
are illustrated in Figure 26b and c. respectively. The results showed that free 3A.1
had a significantly slower cell migration rate than that of the untreated cells, and it
also decreased %wound closure compared with the untreated cell, indicating that
3A.1 could suppress cell motility. Moreover, both cell migration rate and %wound
closure of 3A.1-loaded micelles were not significantly different from the free drug
at the same concentration. From these results, it could be concluded that free 3A.1
might be one of the antimigration compounds, and loading of 3A.1 into the micelles
did not affect its anti-migratory activity. Therefore, 3A.1- loaded micelles could be
a potential carrier to reduce metastasis of oral cancer.

114
Figure 26 The anti-migratory effect of free 3A.1 and 3A.1-loaded PMs prepared
by a dropping method on head and neck (HN22) cancer cells presented as the (a) wound images taken by a microscope (40× magnification) at 0 and 24 h, (b) cell
migration rate and (c) %wound closure after 24-h treatment exposure. *Statistically
significant difference from the untreated control group (p<0.05); NS, no
significantly different from free 3A.1 group (p>0.05).
4.1.8 In vitro cellular uptake
In this experiment, Dox as an anticancer compound with fluorescence
property was selected to formulate polymeric micelle using the NSC copolymer.
The cellular uptake of free Dox and the 40 wt% Dox-loaded NSC micelles was
examined qualitatively using a fluorescence microscopy, as displayed in Figure 27.
HT29 cells were exposed to Dox solution and the Dox-loaded micelles for two
different periods (12 and 24 h). The results showed that cells incubated with the
Dox-loaded micelles emitted higher fluorescent intensity than those incubated with
the free drug at both incubation times. To verify this result, the cells were analyzed
by flow cytometry for quantitative cellular uptake. From the fluorescent histograms
displayed in Figure 28a, the cells incubated with the Dox-loaded micelles emitted
a stronger fluorescent intensity than those of the free drug. This result was
consistent with the fluorescent image study. As shown in Figure 28b, the MFI of
the cells treated with Dox-loaded micelles was significantly higher than (p<0.05)
those treated with the free drug after 24-h treatment, representing that the Dox-
encapsulated micelles were effectively taken up by the cancer cells. The MFI of
the cells treated with empty micelles was not different from the control group.
Thus, it can be concluded that the Dox-loaded micelles could enhance drug
internalization and accumulation into the cancer cells.
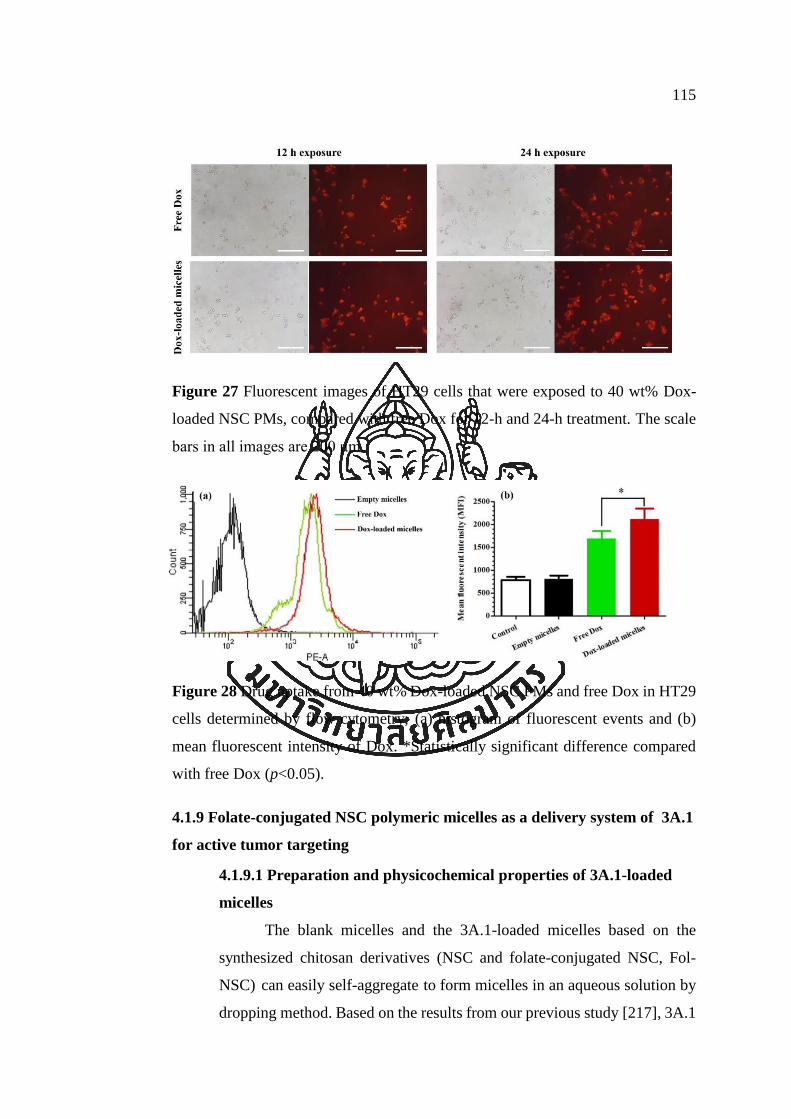
115
Figure 27 Fluorescent images of HT29 cells that were exposed to 40 wt% Dox-
loaded NSC PMs, compared with free Dox for 12-h and 24-h treatment. The scale
bars in all images are 200 μm.
Figure 28 Drug uptake from 40 wt% Dox-loaded NSC PMs and free Dox in HT29
cells determined by flow cytometry; (a) histogram of fluorescent events and (b) mean fluorescent intensity of Dox. *Statistically significant difference compared
with free Dox (p<0.05).
4.1.9 Folate-conjugated NSC polymeric micelles as a delivery system of 3A.1
for active tumor targeting
4.1.9.1 Preparation and physicochemical properties of 3A.1-loaded
micelles
The blank micelles and the 3A.1-loaded micelles based on the
synthesized chitosan derivatives (NSC and folate-conjugated NSC, Fol-
NSC) can easily self-aggregate to form micelles in an aqueous solution by
dropping method. Based on the results from our previous study [217], 3A.1

116
(40 %wt to the polymer) was selected to be loaded into both micelles. The
morphology of the micelles was determined by TEM, as illustrated in
Figure 29. The 3A.1-loaded NSC and Fol-NSC micelles had a spherical
shape. Data from the physicochemical evaluation are shown in Table 11.
The particle sizes of the 3A.1-loaded NSC and Fol-NSC micelles were less
than 200 nm, and the PDI values were less than 0.3. The zeta potential of
both 3A.1-loaded micelles was negative due to the dissociation of the
succinic groups presented on the micelles. This optimal negative charge
could help to prevent particle aggregation. The content of 3A.1 in the
micelle formulations is represented in the terms of %EE and LC. The %EE
and LC of Fol-NSC micelles were lower than those of NSC micelles,
probably because the Fol-NSC might reduce hydrophobic interaction
between the hydrophobic compound and hydrophobic cores of micelles.
Figure 29 TEM images of (a) 3A.1-loaded NSC PMs and (b) 3A.1-loaded Fol-
NSC PMs prepared by a dropping method with drug loading of 40 %wt to polymer. The scale bars in all images are 100 μm.
4.1.9.2 In vitro drug release
The release of 3A.1 from the NSC micelles and the Fol-NSC
micelles in the sequential medium pH 1.2, 6.8, and 7.4 at 37ºC was studied.
The release patterns of the 3A.1 from the 3A.1-loaded micelles compared
with that from the 3A.1 suspension are presented in Figure 30. The pH value
of the medium was found to affect the release rate of 3A.1, and these
micelles also had a pH-sensitive feature. In the SGF (pH 1.2), the 3A.1 was
not released from the NSC and the Fol-NSC micelles. After changing the

117
medium to SIF (pH 6.8), the 3A.1 was extremely released which ~80% and
~50% of the 3A.1 was released from the NSC micelles and the Fol-NSC
micelles, respectively, at 8 h. After that, the release remained constant in
the SCF (pH 7.4) for 12 h. Overall, the released 3A.1 from the Fol-NSC
micelles decreased compared with the NSC micelles because of steric
hindrance at the micellar surface. These results indicated that these micelles
could be used as a carrier for colon-specific delivery system.
Figure 30 In vitro release patterns of free 3A.1 () and 3A.1-loaded polymeric
micelles prepared by a dropping method; NSC (◆) vs. Fol-NSC (⚫), in simulated
gastrointestinal fluid. All data are expressed as mean ± standard deviation (n= 3).
*Statistically significant difference compared with NSC PMs (p<0.05).
4.1.9.3 In vitro anticancer activity
The cytotoxicity after 36-h exposure of the 3A.1-loaded NSC and
Fol-NSC micelles against the HT29 cells was assessed using an MTT assay
(Figure 31). The results revealed that the growth inhibition of the micelles
against the HT29 cells was dose-dependent, and the Fol-NSC micelles had
the lowest IC50 value (0.412 ± 0.056 μg/mL) which was significantly lower
than that of NSC micelles (1.024 ± 0.071 μg/mL) and free 3A.1 (3.816 ±
0.376 μg/mL). The superior anticancer activity of the 3A.1-loaded Fol-NSC
micelles was due to the specific binding of folate molecules on micelle
surface to the folate receptors overexpressed on HT29 cells together with

118
the higher amount of 3A.1 taken up into the cancer cells via folate receptor-
mediated endocytosis [95,218,219]. In addition, the blank NSC and the Fol-
NSC micelles were tested with the same procedure. The results indicated
that the amphiphilic copolymers including NSC and Fol-NSC used in this
study were less cytotoxicity and they might be used as safe nanomaterials.
Figure 31 Dose-response curve of the 3A.1-loaded NSC PMs and the 3A.1-loaded
Fol-NSC PMs against HT29 cancer cells for 36 h, compared with free 3A.1. Each
bar graph is presented as the mean ± standard deviation (n = 3).
4.1.9.4 Induction of cell apoptosis
To confirm the anticancer activity of the 3A.1-loaded micelles, the
cell apoptosis of HT29 cells was determined by double staining assay using
flow cytometry analysis, and the results are presented in Figure 32. After
24-h incubation with equivalent 3A.1 concentration of 3.8 µg/mL, the cell
apoptosis rate of the 3A.1-loaded Fol-NSC micelles (51.47 ± 1.76%) was
higher than that of the NSC micelles (45.20 ± 3.27%) and both 3A.1-loaded
micelles significantly enhanced the levels of cell apoptosis in HT29 cells
compared with free 3A.1 (33.10 ± 2.45%). This result was in agreement
with the results from in vitro cytotoxicity test. It was clear that the
anticancer activity of 3A.1 could be improved when it was encapsulated
into micelles, especially Fol-NSC micelles as a targeted nanocarrier.

119
Figure 32 Analysis of HT29 cell apoptosis by flow cytometry after treatment with
3A.1-loaded NSC PMs and Fol-NSC PMs at the equivalent 3A.1 concentration of
3.8 µg/mL for 24 h. (a) Fluorescent dot-plot and (b) rate of cell apoptosis. Data are
presented as mean ± standard deviation (n=3). *, p<0.05 vs. free 3A.1 group; NS,
no statistically significant difference vs. 3A.1-loaded NSC PMs.
4.2 Formulation screening of liposomes with or without 3A.1 analogue
In our screening experiment, hydrophobic 3A.1 was passively encapsulated into
liposomal formulations prepared by a thin-layer hydration followed by probe-type
sonication. This method was employed as it provided convenience and a great
capability for the encapsulation of various hydrophobic drugs into lipid bilayer [220].
The conventional liposomes (Con LP) were prepared from lipid components including
PC and Chol at a fixed molar ratio of 2: 1 while the PEGylated liposomes (PEG LP)
were formulated as the same lipid ingredients and added DSPE-PEG2000 by varying
three different molar ratios (0.125, 0.25, and 0.50). The main reason to use a constant
molar ratio of PC: Chol at 2: 1 is that this ratio provided appropriate physicochemical
properties, as reported in a previous study [221] . We have proposed that the insertion
of Chol between the concentric lipid bilayer helps improve the bilayer’ s rigidity to
achieve better physical stability and reduced quick drug release. Both Con LP and PEG
LP contained different initial 3A.1 amounts (0-4.0 molar ratio). This experimental

120
design was to optimize the appropriate 3A.1-loaded Con LP and PEG LP that expressed
the highest drug entrapment with desirable physicochemical properties. The
physicochemical properties of 3A.1-loaded Con LP and PEG LP are summarized in
Table 12. Overall, thin lipid layer hydration was applied to produce multilamellar
vesicles (MLVs) having a size of ⩾ 500 nm, and vesicle size reduction via probe-
ultrasonication method was used to generate unilamellar vesicles (ULVs) having a size
of ⩽ 100 nm for small ULVs and size of > 100 nm for large ULVs [126].
4.2.1 Effect of initial drug molar ratios
4.2.1.1 Particle size and zeta potential
Concerning the 3A.1-loaded Con LP, the results demonstrated that
the initial drug content affected its physicochemical properties. When the
molar ratio of drug content was increased from 0.5 to 3.0, the vesicle size
was seen to increase from 110.57 ± 0.90 nm to 143.77 ± 4.35 nm while the
zeta potential of Con LP was not altered, with only a slightly negative
charge of (-) 7.79 ± 0.61 to (-) 11.10 ± 0.67mV. The negative charge of Con
LP arose from the dissociation of the phosphate group in the PC molecule
when the pH of the dispersed vehicle was superior to the isoelectric point
of PC [222]. As different levels of DSPE-PEG200 were added, the
physicochemical characteristics of PEGylated liposomes were altered. An
increase in the initial drug molar ratio from 0.5 to 3.0 resulted in an increase
in the vesicle size. The insertion of DSPE-PEG2000 tended to slightly
increase the negative charge at the liposome’ s surface since this lipid
presented anionic charge at pH 7.4 [223]. At the similar drug molar ratio of
3.0, the vesicle size of PEGylated liposomes was ranked as follows: 0.125
PEG LP (111.77 ± 4.40 nm) < 0.50 PEG LP (113.73 ± 2.91 nm) < 0.25 PEG
LP (115.33 ± 3.08 nm). The vesicle size of PEG LP was smaller than that
of the Con LP at each drug molar ratio, which is probably due to higher
structural condensation between lipids and hydrophobic drugs. Almost all
liposome formulations had a PDI value of less than 0.3, indicating that the
distribution of vesicle size was narrow.

121
Tab
le 1
2 T
he
infl
uen
ce o
f li
poso
me
form
ula
tions
enca
psu
late
d d
iffe
rent
3A
.1 m
ola
r ra
tios
on v
esic
le s
ize,
PD
I an
d z
eta
pote
nti
al,
1
%en
capsu
lati
on e
ffic
iency
(%
EE
), a
nd l
oad
ing c
apac
ity (
LC
). A
ll d
ata
repre
sent
the
mea
n ±
sta
ndar
d d
evia
tion (
n=
3).
2
Form
ula
tion
s P
C
(mM
)
Ch
ol
(mM
)
DS
PE
-PE
G2
000
(mM
)
3A
.1
(mM
)
Ves
icle
siz
e
(nm
) P
DI
ζ (m
V)
%E
E
LC
(µ
g/m
g o
f
lip
ids)
Conven
tional
liposo
mes
(Con L
P)
10
2
0
0
107.9
0 ±
2.2
5
0.2
67
(-)
8.8
6 ±
0.6
7
- -
10
2
0
0.0
5
110.5
7 ±
0.9
0
0.2
58
(-)
8.7
2 ±
1.9
7
57.6
2 ±
1.1
9
20.5
6 ±
0.2
1
10
2
0
1
108.9
7 ±
1.6
8
0.2
80
(-)
11.1
0 ±
0.6
7
57.7
1 ±
1.8
3
41.1
9 ±
0.2
8
10
2
0
2
123.2
7 ±
4.4
1
0.3
01
(-)
7.7
9 ±
0.6
1
62.2
8 ±
0.7
2
88.9
1 ±
2.1
5
10
2
0
3
143.7
7 ±
4.3
5
0.1
93
(-)
8.3
5 ±
0.7
6
48.0
6 ±
0.8
5
102.9
2 ±
1.9
2
10
2
0
4
133.7
0 ±
1.9
8
0.2
53
(-)
9.1
1 ±
0.5
5
35.6
2 ±
0.4
2
100.6
3 ±
2.0
5
PE
Gyla
ted
liposo
mes
(0.1
25 P
EG
LP
)
10
2
0.1
25
0
109.4
0 ±
1.6
1
0.3
19
(-)
12.8
3 ±
0.6
6
- -
10
2
0.1
25
0.0
5
86.4
7 ±
0.1
8
0.2
41
(-)
12.2
3 ±
1.1
4
73.2
0 ±
2.2
2
26.7
5 ±
1.0
3
10
2
0.1
25
1
91.5
6 ±
3.3
3
0.2
78
(-)
15.3
3 ±
0.4
1
76.0
3 ±
1.7
2
52.1
1 ±
1.6
1
10
2
0.1
25
2
100.9
7 ±
1.4
2
0.2
53
(-)
11.9
7 ±
0.3
8
69.2
1 ±
1.4
2
94.8
8 ±
1.9
8
10
2
0.1
25
3
111.7
7 ±
4.4
0
0.2
16
(-)
11.6
0 ±
0.3
7
57.4
8 ±
0.6
6
118.2
1 ±
2.2
3
10
2
0.1
25
4
99.5
5 ±
0.6
4
0.1
52
(-)
12.8
0 ±
0.9
1
41.1
8 ±
0.4
3
112.9
0 ±
2.3
6
PE
Gyla
ted
liposo
mes
10
2
0.2
5
0
84.2
2 ±
0.8
2
0.2
30
(-)
15.0
7 ±
0.8
8
- -
10
2
0.2
5
0.0
5
88.4
5 ±
0.2
6
0.2
27
(-)
15.1
0 ±
0.7
1
78.5
6 ±
2.3
3
25.8
9 ±
1.0
3

122
(0.2
5 P
EG
LP
)
10
2
0.2
5
1
90.2
3 ±
0.6
7
0.2
25
(-)
15.3
3 ±
0.4
1
77.7
3 ±
2.8
8
51.2
3 ±
2.8
4
10
2
0.2
5
2
94.9
5 ±
0.9
0
0.2
09
(-)
14.0
7 ±
1.4
1
71.8
0 ±
0.9
8
94.6
5 ±
3.2
8
10
2
0.2
5
3
115.3
3 ±
3.0
8
0.2
33
(-)
14.4
3 ±
0.7
4
60.2
4 ±
1.1
3
119.1
2 ±
1.6
8
10
2
0.2
5
4
104.8
0 ±
2.4
1
0.2
59
(-)
18.2
0 ±
0.2
9
45.5
2 ±
0.5
5
118.0
0 ±
1.1
2
PE
Gyla
ted
liposo
mes
(0.5
0 P
EG
LP
)
10
2
0.5
0
0
106.8
0 ±
5.7
7
0.3
01
(-)
16.5
7 ±
1.5
0
- -
10
2
0.5
0
0.0
5
98.3
1 ±
4.2
2
0.3
71
(-)
15.5
0 ±
0.4
2
71.9
4 ±
0.9
0
22.0
2 ±
1.1
1
10
2
0.5
0
1
102.8
0 ±
1.6
3
0.3
03
(-)
16.5
3 ±
0.9
0
70.4
3 ±
1.4
8
43.7
3 ±
2.0
4
10
2
0.5
0
2
104.8
7 ±
1.2
0
0.2
7
(-)
16.6
3 ±
1.0
6
68.1
6 ±
1.1
0
83.4
5 ±
2.0
6
10
2
0.5
0
3
113.7
3 ±
2.9
1
0.2
05
(-)
16.0
3 ±
0.7
5
61.2
0 ±
2.1
8
112.4
1 ±
2.8
1
10
2
0.5
0
4
101.0
3 ±
0.9
7
0.2
34
(-)
16.0
0 ±
0.6
5
44.3
1 ±
2.4
9
115.8
5 ±
2.9
8
1

123
4.2.1.2 Drug loading capacity
To determine the drug loading capacity, the effect of initial drug
molar ratio on drug encapsulation was analyzed and these values are listed
in Table 12. The %encapsulation efficiency (%EE) was calculated by
dividing the encapsulated drug amount by the theoretical drug amount. This
value implies whether each step of liposome preparation influences drug
content. The loading capacity (LC) was computed by dividing the
encapsulated drug amount by the total mass lipids. This value provides the
capacity of lipids used to reserve an active compound. The LC of the 3A.1-
loaded Con LP was directly correlated with the initial drug molar ratio,
whereas the %EE was inversely related to the initial drug molar ratio. We
found that the Con LP conveying drug molar ratio of 3.0 showed the highest
LC (102.92 ± 1.92 µg/mg of lipid), so this formulation was selected as a
representative Con LP for further experimental studies. Likewise, the LC
of the 3A. l-loaded PEG LP prepared with the DSPE-PEG2000 molar ratios
of 0.125, 0.25, and 0.50 was directly proportional to the initial drug molar
ratio. The LC of the PEG LP prepared with the three levels of DSPE-
PEG2000 embedded in liposome exhibited the highest LC (118.21 ± 2.23,
119.12 ± 1.68, and 112.41 ± 2.81 µg/mg of lipid with the DSPE-PEG2000
molar ratios of 0.125, 0.25, and 0.50, respectively) at a drug molar ratio of
3.0. In comparison with the Con LP, the higher amount of drug
encapsulation into the PEG LP may be explained by the fact that the DSPE-
PEG2000 can interact with the hydrophobic 3A.1 molecule via
hydrophobic interaction within the lipid bilayer. Despite having similar LC
values, PEG LP containing a drug molar ratio of 3.0 was found to have the
optimal density of PEG chain at a DSPE-PEG2000 molar ratio of 0.25 and
was therefore chosen as typical PEG LP for additional evaluations.
4.2.1.3 Visual appearance
As shown in Figure 33, the visual appearance of liquid liposomes
revealed that the empty Con LP (Figure 33a) and the empty PEG LP (Figure
33c) were transparent liquids with white-opalescent, whereas 3A.1-loaded

124
Con LP (Figure 33b) and 3A.1-loaded PEG LP (Figure 33d) looked more
turbid than that of blank liposomes. Moreover, the presence of drug
precipitation at the bottom of the container was not found. The liposome
formulation is intended for i.v. injection in cancer therapy. We found that
the mean pH values of all 3A.1-loaded LP was a mildly acidic solution (pH
∼6.0-6.8), which was within an acceptable pH range [224].
Figure 33 The appearance of liposomal formulations prepared by a thin
film hydration and probe-sonication method: (a) blank Con LP, (b) 3A.1-
loaded Con LP, (c) blank PEG LP, and (d) 3A.1-loaded PEG LP
4.2.1.4 Morphology
The morphological feature of the liposomes is illustrated in Figure
34. TEM analysis established that closed vesicles in these liposomal
formulations had an almost spherical or spherical shape with a regular and
smooth surface. The TEM images (Figure 34d) revealed that the particle
size of the 3A.1-loaded Con LP (Figure 34b) and the 3A.1-loaded PEG LP
was slightly bigger than that of the blank liposomes. Furthermore, the
diameter size of the liposomes were measured to be approximately 65 nm
to 160 nm, which was smaller than that measured by dynamic light
scattering (DLS) techniques. This effect can be explained by the fact that
the particle size determined by the DLS method was involved in the
analysis of the hydrodynamic diameter, whereas TEM was performed on
samples in a dry state [213].
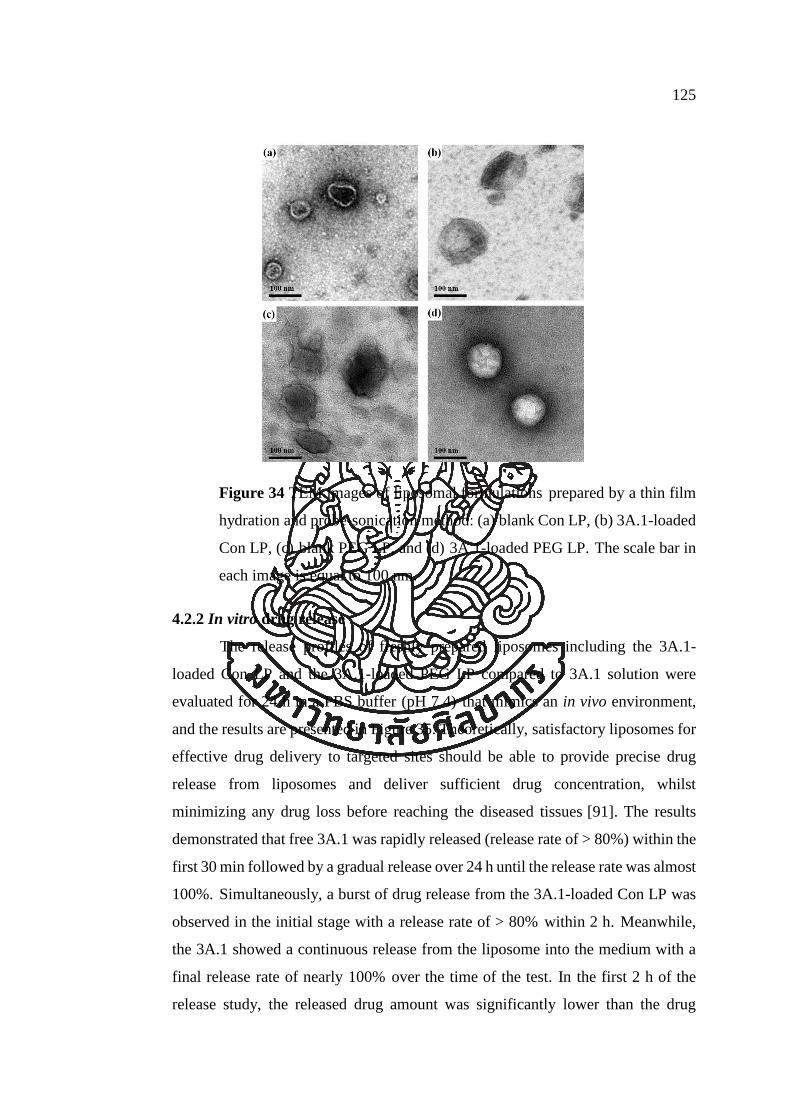
125
Figure 34 TEM images of liposomal formulations prepared by a thin film
hydration and probe-sonication method: (a) blank Con LP, (b) 3A.1-loaded
Con LP, (c) blank PEG LP, and (d) 3A.1-loaded PEG LP. The scale bar in
each image is equal to 100 nm.
4.2.2 In vitro drug release
The release profiles of freshly prepared liposomes including the 3A.1-
loaded Con LP and the 3A.1-loaded PEG LP compared to 3A.1 solution were
evaluated for 24 h in a PBS buffer (pH 7.4) that mimics an in vivo environment,
and the results are presented in Figure 35. Theoretically, satisfactory liposomes for
effective drug delivery to targeted sites should be able to provide precise drug
release from liposomes and deliver sufficient drug concentration, whilst
minimizing any drug loss before reaching the diseased tissues [91]. The results
demonstrated that free 3A.1 was rapidly released (release rate of > 80%) within the
first 30 min followed by a gradual release over 24 h until the release rate was almost
100%. Simultaneously, a burst of drug release from the 3A.1-loaded Con LP was
observed in the initial stage with a release rate of > 80% within 2 h. Meanwhile,
the 3A.1 showed a continuous release from the liposome into the medium with a
final release rate of nearly 100% over the time of the test. In the first 2 h of the
release study, the released drug amount was significantly lower than the drug

126
solution (p<0.05), indicating that the release of drug embedded in the liposome was
slightly retarded. However, 3A.1-loaded Con LP released the drug at a relatively
similar level in comparison to the drug solution during a period of up to 24 h
following the test. Furthermore, the release behavior of the 3A.1-loaded PEG LP
showed two-phase release; during the first phase, 3A.1 was immediately released
from lipid vesicles whilst in the second phase, liposomes showed a sustained drug
release with a release rate of around 67% after 24-h testing. The slow-release
pattern was probably due to the diffusion of 3A.1 through the lipid bilayer and
shielding of the lipid membrane by steric hindrance of PEG coating at liposome’ s
surface [225].
Figure 35 In vitro release profiles of 3A.1 from 3A.1 solution (), 3A.1-loaded
Con LP (), and 3A.1-loaded 0.25-PEG LP () in PBS solution (pH 7.4) at 37°C
for 24 h. *, p<0.05 compared to free drug; #, p<0.05 compared to Con LP.
4.2.3 Short-term stability
The stability of liposomal formulations is important for the development of
lipid-based nanocarriers. The aggregation or agglomeration between nanoparticles
usually occurs when liposomes are stored for a long period, especially under very
high temperatures. According to the ICH Q1A R2 “Stability study of drug product”
contributed by the International Conference on Harmonisation organization [208],
the liposomal products in this research were intended to be a group of refrigerated

127
pharmaceutical products. Parameters including vesicle size, surface charge, and
relative drug remaining of 3A.1-encapsulated liposomes were monitored under two
different storage conditions to find the optimal storage condition, and the findings
are presented in Figure 36. After storage at 4°C for 6 months, there was no
irreversible aggregation in either the 3A.1-loaded Con LP or the PEG LP. The
vesicle size of the 3A.1-loaded Con LP and PEG LP did not grow significantly
(p<0.05) compared to their size on the first day, while the 3A.1-loaded Con LP and
PEG LP had a slightly negative zeta potential of approximately -6 to -12 mV which
was not different from the original values of -8 to -14 mV. Despite the low zeta
potential of these liposomes representing weak electrostatic repulsion, it could
confirm that they exhibited good particle dispersibility without particle growth,
through dual repulsion of electrical force and steric hindrance of the PEG layer.
Furthermore, the total drug remaining of the 3A.1-loaded Con LP and PEG LP was
found to be 84.27 ± 2.77% and 89.13 ± 1.53%, respectively, after 6-month storage.
In contrast, white particle aggregation in both liposomes was seen after the
liposomes were kept at 25°C for 6 months. The abnormal appearance may be
caused by higher temperatures that may lead to the rapid movement of vesicles
followed by vesicle’ s attraction and fusion [226,227]. The change of vesicle size
was remarkable, which the size increased from 143.77 nm to 323.54 nm in the
3A.1-loaded Con LP and from 115.33 nm to 179.96 nm in the 3A.1-loaded PEG
LP. The zeta potential of both liposomes was still a negative charge (-6 mV to -11
mV), which did not diverge from the first day after storage for 6 months.
Unfortunately, the obvious decrease in the remaining drug of both selected
liposomes was observed, which probably arose from drug degradation and drug
leakage during this period at room temperature. Our findings suggested that storage
of the 3A.1-loaded Con LP and PEG LP at a cold temperature could preserve the
vesicle size, zeta potential, and amount of drug remaining for at least 6 months.
This storage temperature below Tc of phospholipids helps maintain the rigidity of
the lipid’ s bilayer (gel state) which results in a reduction of drug loss and
degradation from external environments [149,150].

128
Figure 36 The short-term stability of 3A.1-loaded liposomes stored under long-
term condition (left) compared to under accelerated condition (right) for 180 days:
(a,d) vesicle size; (b,e) zeta potential of the 3A.1-loaded Con LP (black bar) and
the 3A.1-loaded PEG LP (gray bar); (c,f) the relative drug remaining of the 3A.1-
loaded Con LP (black line) and the 3A.1-loaded PEG LP (red line). All data are
represented as the mean ± standard deviation (n=3).
4.2.4 In vitro anticancer activity
The antitumor effect of the 3A.1-encapsulated liposomes on cell viability
of HCT116 and HT29 was assessed using an MTT proliferation assay. The survival
curves of cancer cells are represented in Figure 37 and half-maximal inhibitory
concentration (IC50) values are listed in Table 13. All treatment groups of varying
drug concentrations showed a decrease in cell viability of both CRC cells in a dose-

129
dependent manner. Meanwhile, the cytotoxicity toward cancer cells was studied at
two different times (24- and 48-h treatment). Additionally, the time-dependent
manner of these treatments was also identified in this experiment. In other words,
when cancer cells were exposed to the drug for a longer period, cell proliferation
had a lower %cell viability. In detail, the cytotoxicity profiles indicated that both
the 3A.1-loaded Con LP and PEG LP provided a stronger suppression of cancer
cell growth than the free drug. As seen in Figure 37a and b, the maximum
anticancer activity was found in the 3A.1-loaded PEG LP with the IC50 values of
1.599 ± 0.076 µg/mL and 1.333 ± 0.169 µg/mL after 24- and 48-h treatment, which
was significantly lower than (p<0.05) those of free drug (the IC50 values were 3.845
± 0.233 µg/mL and 2.439 ± 0.134 µg/mL after 24- and 48-h incubation). The 3A.1-
loaded Con LP had the IC50 values of 3.005 ± 0.434 µg/mL and 1.548 ± 0.231
µg/mL, which were significantly lower than (p<0.05) those of the free drug as well,
but these values were significantly higher than (p<0.05) that of PEG LP. We
observed that the IC50 values of the 3A.1-loaded PEG LP after 24- and 48-h
treatment were significantly lower than (p<0.05) that of 3A.1-loaded Con LP and
free drug (Figure 37c and d), implying that the 3A.1-loaded PEG LP had greater
anticancer activity against HT29 cells. Concurrently, the blank Con LP and PEG
LP exhibited no apparent sign of cytotoxicity, indicating that lipid content was not
harmful to cells. Therefore, the anticancer activity of 3A.1 was well improved after
being loaded into the liposomes.

130
Tab
le 1
3 T
he
IC5
0 v
alues
of
free
3A
.1, 3A
.1-l
oad
ed C
on L
P a
nd 3
A.1
-load
ed 0
.25
-PE
G L
P a
gai
nst
HC
T116 a
nd H
T29 a
fter
24
- an
d 4
8-h
1
trea
tmen
t w
ere
det
erm
ined
usi
ng G
raphP
ad P
rism
5.0
1 s
oft
war
e. E
ach v
alue
was
der
ived
fro
m t
hre
e dif
fere
nt
exper
imen
ts i
n s
extu
pli
cate
2
wel
ls a
nd r
eport
ed a
s m
ean ±
sta
ndar
d e
rror
of
mea
n (
n=
3).
*,
p<
0.0
5 c
om
par
ed w
ith f
ree
3A
.1 g
roup;
#,
p<
0.0
5 c
om
par
ed w
ith 3
A.1
-3
load
ed C
on L
P g
roup.
4
5
6
7
Gro
up
s of
trea
tmen
t IC
50 (
µg/m
L)
in H
CT
116 c
ell
IC
50 (
µg
/mL
) in
HT
29 c
ell
24-h
tre
atm
ent
48-h
tre
atm
ent
24
-h t
reatm
ent
48-h
tre
atm
ent
Fre
e 3A
.1
3.8
45 ±
0.2
33
2.4
39 ±
0.1
34
4
.201 ±
0.1
85
2.2
07 ±
0.1
46
3A
.1-l
oad
ed C
on L
P
3.0
05 ±
0.4
34
*
1.5
48 ±
0.2
31 *
4.1
84 ±
0.4
74
2.0
96 ±
0.1
00
3A
.1-l
oad
ed P
EG
LP
1.5
99 ±
0.0
76
*,#
1.3
33 ±
0.1
69 *
1.6
10 ±
0.2
82
*,#
1.3
62 ±
0.0
62 *
,#
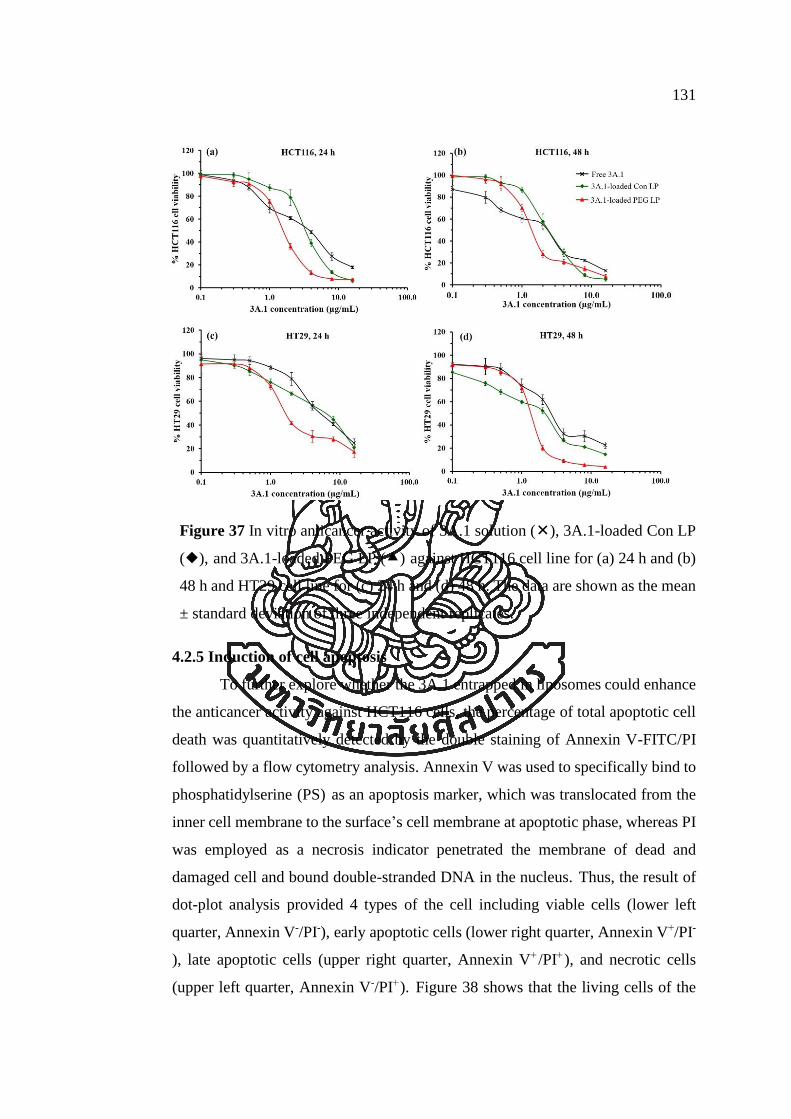
131
Figure 37 In vitro anticancer activity of 3A.1 solution (), 3A.1-loaded Con LP
(), and 3A.1-loaded PEG LP () against HCT116 cell line for (a) 24 h and (b)
48 h and HT29 cell line for (c) 24 h and (d) 48 h. The data are shown as the mean
± standard deviation of three independent replicates.
4.2.5 Induction of cell apoptosis
To further explore whether the 3A.1 entrapped in liposomes could enhance
the anticancer activity against HCT116 cells, the percentage of total apoptotic cell
death was quantitatively detected by the double staining of Annexin V-FITC/PI
followed by a flow cytometry analysis. Annexin V was used to specifically bind to
phosphatidylserine (PS) as an apoptosis marker, which was translocated from the
inner cell membrane to the surface’s cell membrane at apoptotic phase, whereas PI
was employed as a necrosis indicator penetrated the membrane of dead and
damaged cell and bound double-stranded DNA in the nucleus. Thus, the result of
dot-plot analysis provided 4 types of the cell including viable cells (lower left
quarter, Annexin V-/PI-), early apoptotic cells (lower right quarter, Annexin V+/PI-
), late apoptotic cells (upper right quarter, Annexin V+ /PI+ ), and necrotic cells
(upper left quarter, Annexin V-/PI+). Figure 38 shows that the living cells of the

132
control group accounted for at least 96%. Overall, the exposure of HCT116 cell to
3A.1 solution and the 3A.1-loaded liposomal formulations intensively induced cell
death by both early and late apoptosis. The necrotic cell death found in each
treatment was observed at a very low value (<2%), indicating that 3A.1 killed
cancer cells without inflammable effect. The 3A.1-loaded Con LP displayed a
higher level of cell apoptosis rate than the free 3A.1 (11.61 ± 1.92%) (p>0.05).
Moreover, 3A.1-loaded PEG LP exhibited the highest percentage of cell apoptosis
(20.95 ± 1.85%), especially late apoptosis, in HCT116 cell, which was significantly
greater than that of the free 3A.1 as well (p<0.05). The possible explanation of this
result was related to the artificial lipid membranes of liposomes having more
biocompatibility, and easy to penetrate and uptake into cancer cells [21,228]. These
results were consistent with the results of the in vitro cytotoxicity tests in section
4.2.4.
Figure 38 Apoptosis inductive effect of HCT116 cancer cells after treatment with
free 3A.1 and 3A.1-loaded liposomes (at the equivalent 3A.1 concentration of 3.8
µg/mL) in vitro. (a) Flow cytometry analysis of dot plot in groups of control, free
3A.1, and 3A.1- encapsulated liposomes. (b) Percentage of cell apoptosis rate of

133
HCT116 cells after being exposed to free 3A.1 and 3A.1-loaded liposomes for
24-h treatment. *, p<0.05 compared to free drug; NS, no statistically significant
difference compared to free drug.
4.2.6 In vitro anti-migratory effect
4.2.6.1 Wound-healing assay
The anti-migratory activity of 3A.1 against HN22 as model cancer
cells was examined using a wound-healing assay because of simple and
convenient method without complicated instruments [229]. After 18-h
observation, the cell-free zones of the HN22 monolayer were nearly fully
closed (Figure 39a). As seen in the photographs of the wound gap, we
observed that the wound areas of free drug and both 3A.1-loaded Con LP
and PEG LP seemed to be larger than that of the control group after 18-h
incubation, implying that this compound was inclined to reduce the cell
motility. In this experiment, two parameters, cell migration rate and
%wound closure, were quantitatively analyzed and reported in Figure 39b
and c, respectively. The cells exposed to drug solution in 0.1%DMSO had
a migration rate of 22.49 ± 0.33 µm/h and a %wound closure of 83.37 ±
2.15%, which did not augment the suppression of cell motility, compared
to the control group showing a migration rate of 23.74 ± 0.19 µm/h and a
%wound closure of 85.52 ± 0.92% (p>0.05). In comparison to free 3A.1,
both 3A.1-entrapped liposomes significantly reduced the cell migration rate
of HN22 cells and also decreased %wound closure (p<0.05). Although free
3A.1 showed a mild capability in slowing down of cell motility, loading
3A.1 into the Con LP and PEG LP enhanced inhibition of cell movement
in a horizontal direction, indicating that these 3A.1-loaded liposomes could
be potentially used to reduce metastasis of oral cancer cells.

134
Figure 39 Inhibition effect of free 3A.1 and 3A.1-loaded liposomes on cell
migration of HN22 cancer cells was measured by scratch assay. (a) Photographs of
wound area captured by an inverted microscope (40× magnification) at 0, 6, and
18 h. (b) Cell migration rate and (c) %wound closure after 18-h treatment in each
experimental group. *, p<0.05 compared to free drug; #, p<0.05 compared to Con
LP; NS, no statistically significant difference, compared to Con LP.
4.2.6.2 Transwell migration assay
The cell migration of colorectal cancer (HCT116) in a vertical
direction was further assessed using a transwell chamber migration [230].
The effect of 3A.1 in each treatment on the cell movement is illustrated in
Figure 40. As seen in representative photographs of migrated cells under an
inverted microscope (Figure 40a), it can be observed that the number of
cancer cells penetrated through the membrane in the group of 3A.1
treatment (free drug and drug-loaded LP) was lower than that of the control
which had more cell density. 0.1%w/v DMSO as a vehicle control showed

135
96.26 ± 3.36% of cell migration, compared with 100% of cell migration in
the untreated group; thus, the use of this solvent to solubilize the drug did
not affect the migration capacity. After quantitative data analysis (Figure
40b), the results demonstrated that relative %cell migration of the cell
treated with the 3A.1-loaded Con LP and PEG LP was calculated to be
53.12 ± 1.22%, and 51.62 ± 1.62%, respectively, in which both liposome
formulations could significantly suppress HCT116 cell motility greater than
that suppressed by free 3A.1 (p<0.05). Despite the inhibition of cell motility
detected in different cancer cell lines, the results of transwell migration
assay were in accordance with those of scratch assay, as mentioned above.
These findings revealed that 3A.1 inhibited the migration capacity of cancer
cells and this compound might be a potential anti-metastatic agent.
Figure 40 Anti-migratory effect of free 3A.1 and 3A.1-loaded liposomes on
HCT116 cancer cells after 24-h incubation was investigated using a transwell
migration assay. (a) Photographs of migrated cancer cells stained with the purple
color of crystal violet in each treatment group under an inverted microscope. (b) The number of migrated cancer cells was counted and reported as the percentage
of control. *Statistically significant difference (p<0.05) compared to free drug; NS,
no statistically significant difference compared to the Con LP.
4.3 Nanosuspensions with or without 3A.1 analogue
In this work, 3A.1 NS was successfully prepared by an anti-solvent precipitation
method. When the drug solution in DMSO as a miscible organic solvent was dropped

136
into distilled water as an anti-solvent, the state of the drug changed from molecules to
nanoparticles dispersed in an aqueous medium with the formation of drug nucleation.
In the first trial test, we used amphiphilic chitosan (CS) derivatives - NSC, OSC, and
BSC, as stabilizers to prepare drug NSs, compared with three stabilizers i.e. SDS,
Tween® 80, and Poloxamer 188.
4.3.1 Effect of drug to polymer ratios and the hydrophobic parts of their
polymers
The ratio of the drug to polymer needs to be optimized to find the
appropriate NS formulations so that the specific drug molecule can be physically
compatible with its stabilizer. The major problem of liquid NS is flocculation or
crystal growth. This issue is relevant due to insufficient amounts or inappropriate
types of stabilizers. It cannot completely cover the surface of drug nanoparticles,
which is required to maintain repulsion between the particles in NSs. To prevent
this undesirable problem, the stabilizers, which have a principal role, are divided
into 2 main groups (polymers and surfactants). The addition of non-ionic stabilizers
creates a steric barrier while the addition of ionic stabilizers into NSs causes an
electrostatic repulsion. These barriers are responsible for the protection of particle
aggregation and maintaining low PDI in formulations [41,175,184]. Our research
investigated the effect of different stabilizers, based on amphiphilic chitosan
derivatives and their stabilizer concentrations, relevant to the drug quantity on the
physicochemical properties, including particle size, zeta potential, and drug
content, with results shown in Table 14.
4.3.1.1 Particle size and zeta potential
The results revealed that the 3A.1 coarse suspension, without any stabilizers
prepared by an anti-solvent precipitation method, had a mean particle size
larger than 1 μm and a PDI value of approximately 1.0, whereas three 3A.1
NS stabilized by NSC, OSC, and BSC, at a various drug to polymer ratios,
presented a mean particle size smaller than 500 nm, indicating that these
CS copolymers had an important role in reducing drug particles into a
nanometer-scale during the formulation process. Among these copolymers,
it was found that NSC, which was used as a stabilizer in 3A.1 NS, provided

137
the smallest particle size (153.37 ± 1.11 to 188.23 ± 1.47 nm) and the
narrowest size distribution (0.085-0.173) when compared with other
copolymers at the same drug to polymer ratio. Meanwhile, the particle size
and PDI values of 3A.1 NS-BSC and NS-OSC were found to be 221.77 ±
3.31 to 289.10 ± 4.10 nm, 0.187 to 0.232, and 226.37 ± 3.63 to 400.80 ±
50.23 nm, 0.221 to 0.520, respectively. Generally, NSs with suitable
electric stability should have a minimum zeta potential of |30| mV
[231,232]. In this experiment, the zeta potentials of all 3A.1 NS were found
to be a negative surface charge of at least -30 mV. The negative charge of
nanoparticles has arisen from CS derivatives grafted with succinic acid
adsorbed on the 3A.1, leading to repulsion between each other and creating
an electrostatic force. When succinic moieties, which have a pKa value of
approximately 4.21 and 5.64 at 25°C [212], were ionized in the aqueous
solvent that has a pH value of 6-7, this resulted in numerous anions from –
COOH being adsorbed on surface nanoparticles. Moreover, amphiphilic CS
polymers provided a steric effect from different grafted hydrophobic groups
on the CS polymer as follows: naphthyl (double aromatic ring) in NSC,
octyl group (linear chain) in OSC, and benzyl (single aromatic ring) in BSC.
The dual stabilizer action, including the electrostatic and steric repelling
force, resulted in the reduction and prevention of particle aggregation. It
should be noted that not only the type of amphiphilic CS derivatives but
also the drug to polymer ratio could affect the formulation’ s
physicochemical properties. Therefore, we have preferred NS formulations
with the drug to polymer ratio at 1.5:1 (w/w) and optimal physicochemical
properties for additional tests.

138
Tab
le 1
4 T
he
infl
uen
ce o
f dru
g t
o s
tabil
izer
s ra
tios
on t
he
par
ticl
e si
ze,
PD
I, a
nd z
eta
pote
nti
al o
f 3A
.1 n
anosu
spen
sions
pre
par
ed b
y a
1
nan
opre
cipit
atio
n m
ethod.
All
dat
a re
pre
sent
the
mea
n ±
sta
ndar
d d
evia
tion (
n=
3).
2
3
4
3A
.1 t
o
stab
iliz
er
NS
C
OS
C
BS
C
Siz
e (n
m)
PD
I ζ
(mV
) S
ize
(nm
) P
DI
ζ (m
V)
Siz
e (n
m)
PD
I ζ
(mV
)
0.8
: 1
153.3
7 ±
1.1
1
0.0
91
(-)
30.7
7 ±
0.9
8
400.8
0 ±
50.2
3
0.5
20
(-)
25.1
3 ±
0.6
9
221.7
7 ±
3.3
1
0.2
20
(-)
32.2
7 ±
1.1
8
1 :
1
177.3
3 ±
1.3
5
0.1
73
(-)
32.8
3 ±
0.5
4
226.3
7 ±
3.6
3
0.3
20
(-)
39.4
0 ±
0.3
3
289.1
0 ±
4.1
0
0.2
32
(-)
33.2
3 ±
0.3
7
1.5
: 1
185.8
0 ±
1.1
4
0.0
98
(-)
32.0
0 ±
0.0
8
232.7
7 ±
2.8
3
0.2
21
(-)
38.7
7 ±
1.0
1
278.3
7 ±
2.1
3
0.1
87
(-)
33.4
3 ±
0.5
2
2 :
1
188.2
3 ±
1.4
7
0.0
85
(-)
32.1
7 ±
0.9
0
342.7
7 ±
31.3
7
0.4
71
(-)
32.1
7 ±
0.7
5
266.8
0 ±
4.9
3
0.2
05
(-)
31.7
0 ±
0.5
0
No p
oly
mer
~
2000 n
m
0.9
80
(-)
21.6
0 ±
2.5
2

139
4.3.1.2 Drug content
Furthermore, we studied the effect of the drug to polymer ratios and
hydrophobic parts of polymer (naphthyl, octyl, and benzyl groups) on drug
content in terms of the 3A.1 concentration and percentage of the 3A.1 yield
as presented in Figure 41a and b. The results displayed that the drug to
polymer ratio seemed to be directly correlated to the drug content. An
increase in the drug to polymer ratio led to an increase in the 3A.1
concentration and %yield, except in 3A.1 NS-OSC that had a lower drug
content at the maximum ratio. This result can be explained that the
hydrophobic naphthyl, benzyl, and octyl groups that were adsorbed on the
drug's surface could interact with the hydrophobic drug through the
hydrophobic interaction at different force levels. Overall, the rank of the
drug content was 3A.1 NS-NSC > NS-BSC > NS-OSC. The 3A.1 NS-NSC
prepared at the drug to polymer ratio of 1.5: 1 expressed the highest value
of %yield (82.21 ± 5.87%), compared to other NS formulations. This
finding suggested that the NSC polymer containing the double aromatic
ring of naphthyl groups was the appropriate stabilizer for the production of
3A.1 NS at the ratio of 1.5:1 (w/w).
Figure 41 Effects of the drug to stabilizer weight ratios on (a) 3A.1 concentration
and (b) percentage yield of 3A.1 NSs stabilized by NSC (◆), OSC (◼), and BSC
(). Data are represented as the mean ± standard deviation (n=3).

140
4.3.1.3 Visual appearance
During a visual inspection, it was found that the 3A.1 NS with a
slightly turbid liquid was homogenously suspended into the water without
any drug crystals formation (Figure 42b-d). Meanwhile, the coarse 3A.1
suspension containing an equivalent drug amount was completely insoluble
in water and precipitated at the bottom of the bottle (Figure 42a). Overall,
the pH of these 3A.1 NS was in the ranges of 5.3-5.6, representing slightly
acidic solution.
Figure 42 The appearance of (a) 3A.1 coarse suspension without stabilizer and
3A.1 nanosuspensions stabilized by CS derivatives; (b) NSC, (c) OSC, and (d) BSC
at a drug to polymer ratio of 1.5:1 (w/w)
4.3.2 Comparison of the use of chitosan derivatives and surfactants
In this study, three surfactants, including SDS (anionic surfactant), Tween®
80 (non-ionic surfactant), and Poloxamer 188 (amphiphilic surfactant), were
chosen to prepare NS formulations because of their low cost and widespread use
in marketed nanosuspension products, compared with new CS derivative
stabilizers with the same drug to stabilizer ratio of 1.5:1 (w/w). In comparison with
the 3A.1 NS stabilized by CS derivatives, the particle size of 3A.1 NS stabilized
by SDS, Tween® 80, and Poloxamer 188 was found to be 227.23 ± 2.24, 1059.73
± 152.36, and 510.10 ± 152.52 nm with PDI values of 0.512, 0.902, and 0.527,
respectively. Although the particle size of 3A.1 NS stabilized by SDS and
Poloxamer 188 seemed to be in the nanometer scale, their sizes were quite broad
distribution. The zeta potential of the 3A.1 NS stabilized by surfactants was ranked
as the 3A.1 NS-Poloxamer 188 (−3.0 ± 0.87 mV) > 3A.1 NS-SDS (−23.33 ± 0.99

141
mV) > 3A.1 NS-Tween® 80 (− 24.57 ± 0.70 mV). These surface charge values
would not be enough to protect particle growth. In addition, the drug content, in
terms of %yield of 3A.1 NS stabilized by SDS, Tween® 80, and Poloxamer 188
was 43.63 ± 2.71%, 46.15 ± 1.49%, and 5.43 ± 0.33%, respectively. The low drug
content revealed that the three surfactants were not good stabilizers for the
preparation of the 3A.1 NS. In other words, the CS derivative stabilizers, especially
NSC copolymer, could make the 3A.1 NS to produce suitable physicochemical
properties.
4.3.3 Reconstitution test
Lyophilization is a well-known process that does not depend on high
temperatures to transform a liquid sample into a dried solid sample. The main
reason for the addition of cryoprotectant, especially a polyalcohol sugar, into the
freshly prepared NS is to shield the particle agglomeration or crystal growth and
provide the particle size in nanoscale during the drying process . Mannitol with the
concentration at 5% w/v was selected as a cryoprotectant for drug NSs . The
characteristics of the lyophilized 3A.1 NS with and without mannitol are
summarized in Table 15. Overall, the feature of all the 3A.1 NS was completely
dried powder and the 3A.1 NS with mannitol was fine and white powder, which is
similar to mannitol, while the 3A.1 NS without mannitol was bulky and yellow-
brown. After redispersion in aqueous to make the original liquid form, it was found
that all lyophilized powder could be reconstituted within a few minutes. The mean
particle size of the lyophilized 3A.1 NS with mannitol was smaller than and a PDI
value of 3A.1 NS with mannitol was also lower than those without mannitol. This
indicated that the mannitol had an important function in maintaining the particle
size in the nanometer scale with narrow size distribution and kept the original size,
compared to that of freshly prepared NSs. The zeta potential of the redispersed
3A.1 NS with mannitol was a negative surface charge with a range of (-) 30.17 ±
1.24 to (-) 32.40 ± 1.40 mV. Meanwhile, the zeta potential of the redispersed 3A.1
NS without mannitol was not different from formulations that added mannitol. This
result revealed that this value provided an optimal electrostatic force for the
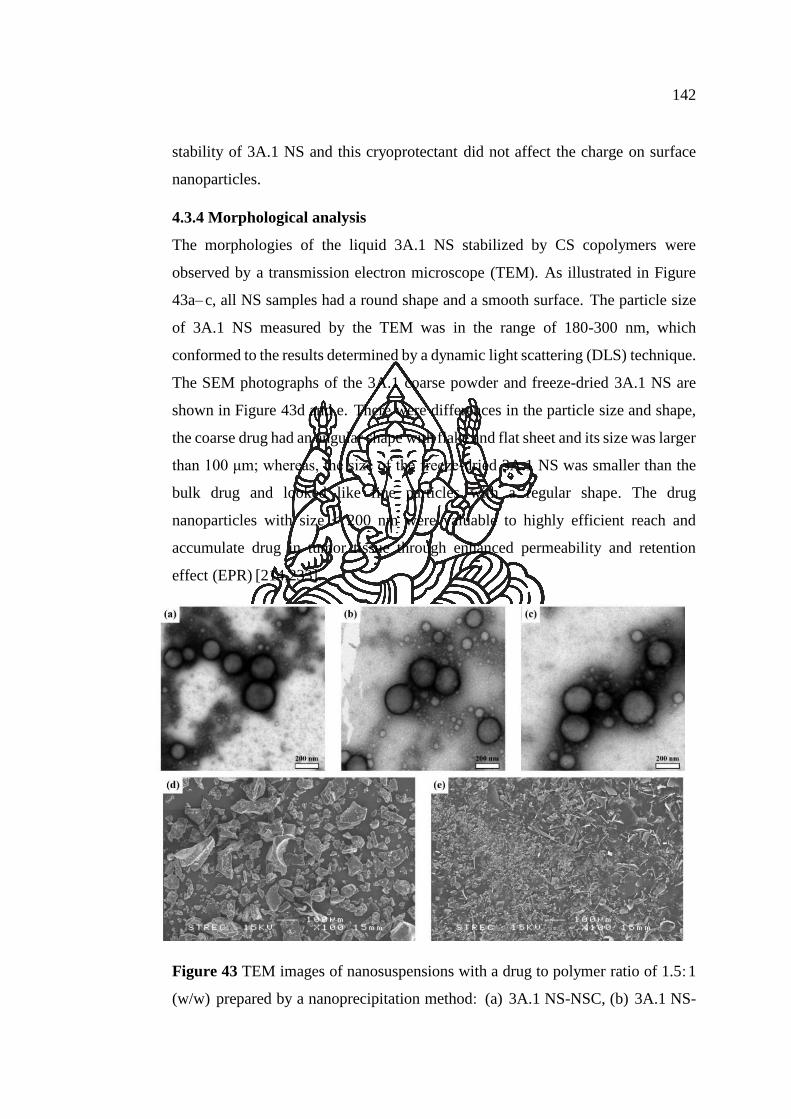
142
stability of 3A.1 NS and this cryoprotectant did not affect the charge on surface
nanoparticles.
4.3.4 Morphological analysis
The morphologies of the liquid 3A.1 NS stabilized by CS copolymers were
observed by a transmission electron microscope (TEM). As illustrated in Figure
43a– c, all NS samples had a round shape and a smooth surface. The particle size
of 3A.1 NS measured by the TEM was in the range of 180-300 nm, which
conformed to the results determined by a dynamic light scattering (DLS) technique.
The SEM photographs of the 3A.1 coarse powder and freeze-dried 3A.1 NS are
shown in Figure 43d and e. There were differences in the particle size and shape,
the coarse drug had an angular shape with flake and flat sheet and its size was larger
than 100 μm; whereas, the size of the freeze-dried 3A.1 NS was smaller than the
bulk drug and looked like fine particles with a regular shape. The drug
nanoparticles with size < 200 nm were valuable to highly efficient reach and
accumulate drug in tumor tissue through enhanced permeability and retention
effect (EPR) [214,233].
Figure 43 TEM images of nanosuspensions with a drug to polymer ratio of 1.5:1
(w/w) prepared by a nanoprecipitation method: (a) 3A.1 NS-NSC, (b) 3A.1 NS-

143
OSC and (c) 3A.1 NS-BSC. SEM images of (d) 3A.1 coarse powder and (e) freeze-
dried 3A.1 NS-NSC powder.
4.3.5 DSC
DSC was performed to analyze any changes in the physical state of solid
samples. According to the DSC thermograms in Figure 44a, surprisingly, the 3A.1
coarse powder presented no sharp endothermic peak throughout the observed
temperature, indicating that this drug had a naturally arranged structure in the
amorphous state. In the pure CS copolymers, their thermograms did not appear at
any peak. The lack of endothermic drug peaks in the physical mixture and the
freeze-dried 3A.1 NS revealed that there were not any drug crystals or materials.
These patterns of thermograms could not determine the endothermic melting point
of the drug powder and the drug NSs.
Figure 44 (a) Differential scanning calorimetry (DSC) patterns and (b) X-ray
diffraction (XRD) patterns of bulk 3A.1 powder, excipient of CS derivatives,
physical mixtures of 3A.1/CS derivatives, and lyophilized 3A.1 NSs (1.5:1, w/w)
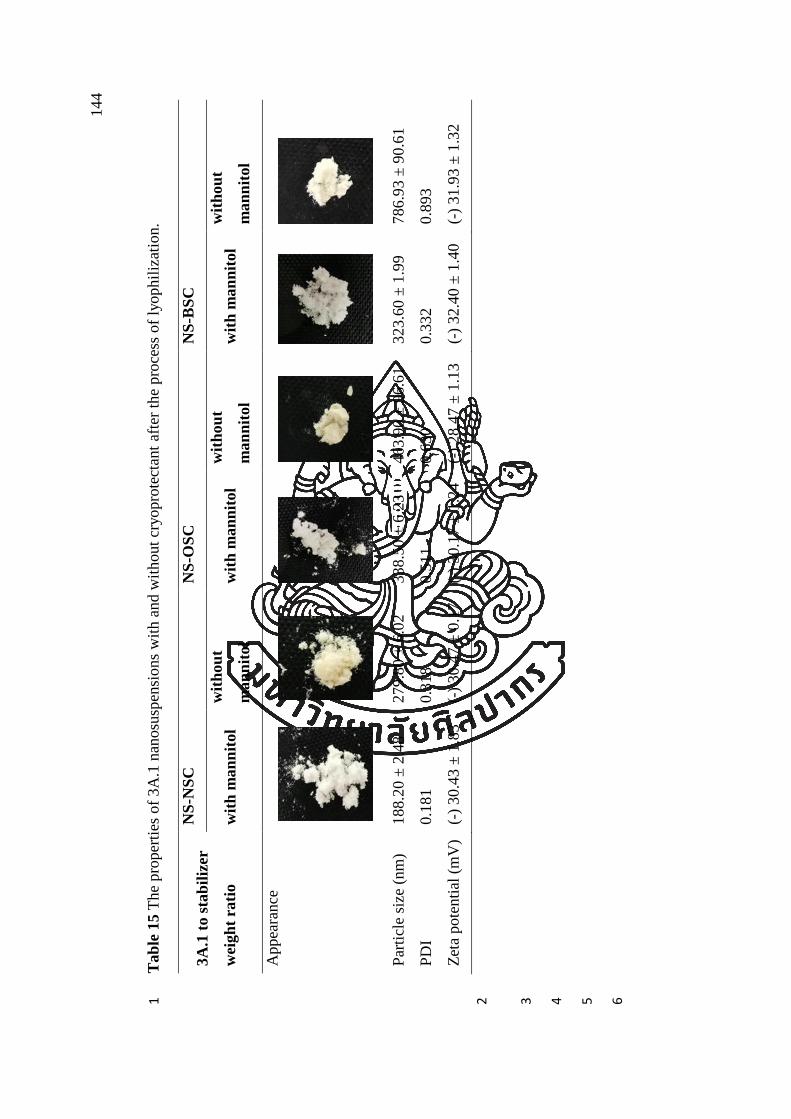
144
Tab
le 1
5 T
he
pro
per
ties
of
3A
.1 n
anosu
spen
sions
wit
h a
nd w
ithout
cryopro
tect
ant
afte
r th
e pro
cess
of
lyophil
izat
ion.
1
3A
.1 t
o s
tab
iliz
er
wei
gh
t ra
tio
NS
-NS
C
NS
-OS
C
NS
-BS
C
wit
h m
an
nit
ol
wit
hou
t
man
nit
ol
wit
h m
an
nit
ol
wit
hou
t
man
nit
ol
wit
h m
an
nit
ol
wit
hou
t
man
nit
ol
Appea
rance
Par
ticl
e si
ze (
nm
) 188.2
0 ±
2.4
8
279.8
0 ±
6.0
2
338.5
0 ±
6.2
3
463.9
0 ±
96
.61
323.6
0 ±
1.9
9
786.9
3 ±
90
.61
PD
I 0.1
81
0.3
18
0.5
11
0.6
30
0.3
32
0.8
93
Zet
a pote
nti
al (
mV
) (-
) 30.4
3 ±
1.8
3
(-)
30.4
7 ±
0.1
7
(-)
30.1
7 ±
1.2
4
(-)
28.4
7 ±
1.1
3
(-)
32.4
0 ±
1.4
0
(-)
31.9
3 ±
1.3
2
2
3
4
5
6

145
4.3.6 PXRD
To confirm the crystallinity of the 3A.1 coarse powder and the freeze-dried
3A.1 NS, XRD spectra are shown in Figure 44b. The XRD curve of the 3A.1
powder did not have the characteristic, high-intensity peaks, which implied that
this drug was molecularly organized in an amorphous structure. In comparison to
drug powder's XRD spectrum, the CS copolymers, physical mixtures, and freeze-
dried 3A.1 NS showed the same pattern without high-intensity peaks, indicating
that they were all of a non-crystal substance. Therefore, the DSC and XRD results
confirmed that the freeze-dried 3A.1 NS presented an inner structure in an
amorphous status. This might be suitable to enhance aqueous stability [234].
4.3.7 FT-IR
As shown in Figure 45, the FTIR spectra of the coarse 3A.1 and the 3A.1 NS
were analyzed as to the interaction between drug and excipients. As per comparable
literature, the main structure of andrographolide had characteristic absorption
peaks at 3423 cm−1 (O-H stretching), 2932 & 2857 cm−1 (C-H stretching), 1757
cm−1 (C=O stretching of lactone ring), 1472 & 1428 cm−1 (C=C stretching), 1185
cm−1 (C-O-C of lactone ring), and 1049 cm−1 (C-O stretching of alcohol) [235]. In
addition, diphenylsilyl that was attached to the 3A.1 structure showed
corresponding peaks of its chemical group at 742 & 703 cm−1 [236]. The FTIR
spectra of the physical mixtures and the 3A.1 NS still presented absorption peaks
similar to the 3A.1, indicating that the chemical structure of the drug compound
did not change. Moreover, there was not any new peak presenting in the FTIR
spectrum of the 3A.1 NS; therefore, the 3A.1 was compatible with these stabilizers.
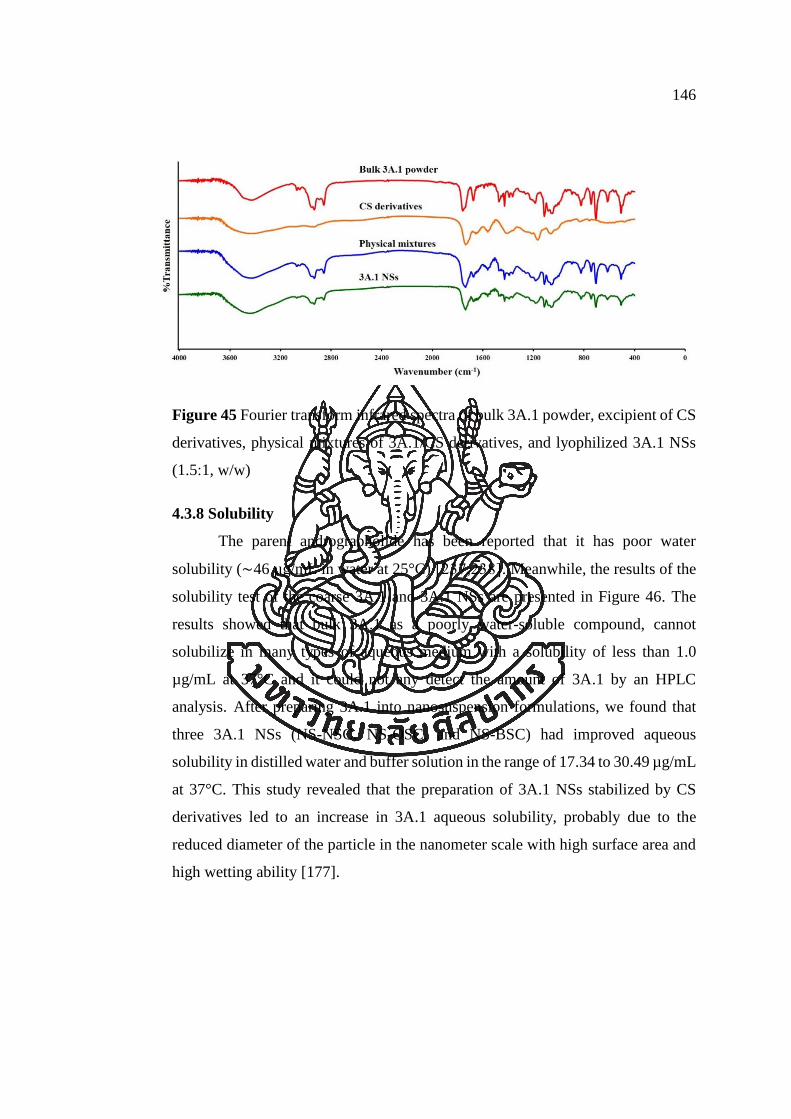
146
Figure 45 Fourier transform infrared spectra of bulk 3A.1 powder, excipient of CS
derivatives, physical mixtures of 3A.1/CS derivatives, and lyophilized 3A.1 NSs
(1.5:1, w/w)
4.3.8 Solubility
The parent andrographolide has been reported that it has poor water
solubility (∼46 µg/mL in water at 25°C) [237,238]. Meanwhile, the results of the
solubility test of the coarse 3A.1 and 3A.1 NSs are presented in Figure 46. The
results showed that bulk 3A.1 as a poorly water-soluble compound, cannot
solubilize in many types of aqueous medium with a solubility of less than 1.0
µg/mL at 37°C and it could not any detect the amount of 3A.1 by an HPLC
analysis. After preparing 3A.1 into nanosuspension formulations, we found that
three 3A.1 NSs (NS-NSC, NS-OSC, and NS-BSC) had improved aqueous
solubility in distilled water and buffer solution in the range of 17.34 to 30.49 µg/mL
at 37°C. This study revealed that the preparation of 3A.1 NSs stabilized by CS
derivatives led to an increase in 3A.1 aqueous solubility, probably due to the
reduced diameter of the particle in the nanometer scale with high surface area and
high wetting ability [177].

147
Figure 46 Solubility data of bulk 3A.1 (striped bar) and 3A.1 NSs stabilized by
NSC (black bar), OSC (dark gray bar), and BSC (light gray bar) in various types
of solvent. All bar graphs are presented as the mean ± standard deviation (n= 3).
UP, undetectable peak of 3A.1 in HPLC chromatogram.
4.3.9 Short-term stability
It is well-known that the main instability issue of NS formulations is
associated with particle growth and flocculation [184-186]. The particle size, PDI,
and zeta potential of the 3A.1 NS (NSC, OSC, and BSC) were used as optimal
indicators to evaluate the physical stability of liquid NS (Figure 47). The stability
of the 3A.1 NS was detected under two conditions as described in the ICH
guideline Q1A R2, an accelerated storage testing at 25 ± 2°C/ 60 ± 5%RH and a
long-term storage testing at 5 ± 3°C/ 60 ± 5%RH, for 6 months [208]. During the
storage period, the appearance of liquid 3A.1 NS did not change and was not tightly
aggregated. The drug nanoparticles were well suspended in the aqueous medium
in each formulation. Overall, the particle size of three 3A.1 NS formulations was
not higher than 1 μm after 6 months of being stored in a refrigerator and room
temperature. The particle size of the 3A.1 NS, which was kept in the refrigerator,
did not change from the original value for 6 months, suggesting that the three 3A.1
NS were physically stable for at least 6 months. In contrast, the particle size of the
3A.1 NS, which was stored at room temperature, significantly increased compared
with its starting date. The highest change in particle size was the 3A.1 NS-OSC
formulation which increased from 232.77 ± 2.83 to 544.23 ± 55.50 nm with wider

148
size distribution. The zeta potential of the 3A.1 NS, which was kept in the
refrigerator, slightly decreased and its negative charge values were approximately
− 30 mV, which was adequate to stabilize each nanoparticle in the formulation.
However, the zeta potential of the 3A.1 NS, which was stored at room temperature,
decreased when values were lower than −30 mV; especially, in the 3A.1 NS-OSC
which had the lowest zeta potential at −26 mV. As previously stated, the different
storage temperatures for NS greatly affected the particle size and surface charge of
NS formulations. This particle growth phenomenon was mainly caused by Oswald
ripening, which explains that NS are thermodynamically unstable colloidal
systems, and high surface area of nanoparticles with high surface energy would try
to aggregate for reducing the Gibbs free energy during storage. The higher
temperature of the NS system increased the rate of particle aggregation [239,240].
After 6 months of storage, the remaining content of 3A.1 in NS-NSC, NS-OSC,
and NS-BSC kept at refrigerator was 75.29 ± 0.77, 62.84 ± 6.20, and 54.34 ±
6.95%, respectively; whereas, these NS formulations stored at room temperature
were 69.92 ± 1.46, 59.56 ± 4.49, and 51.68 ± 4.22%, respectively. This result
showed that storage 3A.1 NS in the refrigerator resulted in higher chemical stability
than those at room temperature. The 3A.1 NS-NSC had the highest percentage of
remaining content most likely because the naphthyl groups could be adsorbed on
drug surfaces through hydrophobic interaction, resulting in the stabilization of drug
nanoparticles in NS. Therefore, 3A.1 NS should be stored in the refrigerator to
keep physical properties and drug content. In this experiment, the 3A.1 NS-NSC
had the best formulation that provided physical and chemical stability with a shelf-
life of at least 6 months in the refrigerator.

149
Figure 47 The short-term stability of 3A.1 nanosuspensions stored under long-
term condition (left) compared to under-accelerated condition (right) for 6 months;
(a,d) particle size; (b,e) zeta potential of 3A.1 NS-NSC (black bar), NS-OSC (gray
bar) and NS-BSC (light gray bar); (c,f) the drug remaining of 3A.1 NS-NSC (◆),
NS-OSC (◼) and NS-BSC (). All data are expressed as the mean ± standard
deviation (n=3).
4.3.10 In vitro anticancer activity
The cytotoxicity of the 3A.1 NS was compared to the drug solution and
evaluated using an MTT colorimetric method. HCT116 (human colorectal cancer
cells) were exposed with various 3A.1 concentrations and the results of the cell
viability curves are presented in Figure 48. The 3A.1 solution and three
formulations of 3A.1 NS were found to efficiently inhibit the growth of tumor cells
in a dose-dependent pattern. According to the IC50 values for 24-h treatment, the

150
IC50 value of the 3A.1 NS-NSC, NS-OSC, and NS-BSC were 0.676 ± 0.022, 1.013
± 0.020, and 1.143 ± 0.011 μg/mL, respectively. It was found that the 3A.1 NS-
NSC had the strongest anticancer effect, compared to the 3A.1 solution (3.845 ±
0.233 μg/mL; p<0.05). When the incubation time of both free 3A.1 and 3A.1 NS
was extended from 24 h to 48 h, the IC50 values had lower, indicating the time-
dependent manner of these treatments (Table 16). The much higher cytotoxicity of
the 3A.1 NS might be attributed to the presence of the small diameter and the large
surface area of the nanoparticles that were nonspecifically adsorbed on the cell
surface and highly internalized into tumor cells via endocytosis pathway [241].
Meanwhile, the cytotoxicity of polymers alone (NSC, OSC, and BSC; negative
control) was also tested with the same procedure. It was shown that all of the cells
had cell viability of over 95% after 24-h incubation period with an equal
concentration of polymer used in NS formulations. This meant that these chitosan
derivatives, acting as a stabilizer and used in formulation, had little influence on
cell growth inhibition. Therefore, they can be safe and compatible excipient.
Table 16 The IC50 values of free 3A.1 and 3A.1 nanosuspensions against HCT116 after
24- and 48-h treatment were determined using GraphPad Prism 5.01 software. Each
value was derived from three different experiments in sextuplicate wells and reported
as mean ± standard error of mean (n=3). *, p<0.05 compared with free 3A.1 group.
Groups of treatment IC50 (µg/mL) in HCT116 cell
24-h treatment 48-h treatment
Free 3A.1 3.845 ± 0.233 2.439 ± 0.134
3A.1 NS-NSC 0.676 ± 0.022 * 0.567 ± 0.013 *
3A.1 NS-OSC 1.013 ± 0.020 * 0.653 ± 0.010 *
3A.1 NS-BSC 1.143 ± 0.011 * 0.615 ± 0.009 *
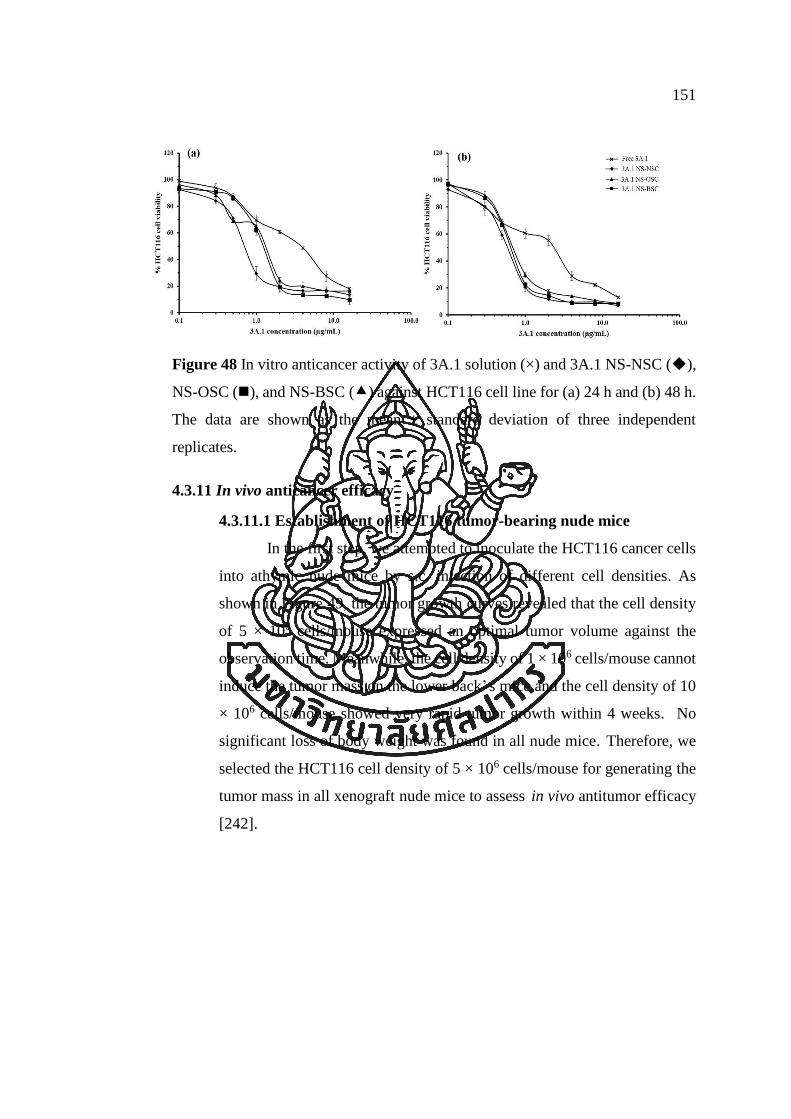
151
Figure 48 In vitro anticancer activity of 3A.1 solution (×) and 3A.1 NS-NSC (◆),
NS-OSC (◼), and NS-BSC () against HCT116 cell line for (a) 24 h and (b) 48 h. The data are shown as the mean ± standard deviation of three independent
replicates.
4.3.11 In vivo anticancer efficacy
4.3.11.1 Establishment of HCT116 tumor-bearing nude mice
In the first step, we attempted to inoculate the HCT116 cancer cells
into athymic nude mice by s.c. injection of different cell densities. As
shown in Figure 49, the tumor growth curves revealed that the cell density
of 5 × 10⁶ cells/mouse expressed an optimal tumor volume against the
observation time. Meanwhile, the cell density of 1 × 10⁶ cells/mouse cannot
induce the tumor mass on the lower back’ s mice and the cell density of 10
× 106 cells/mouse showed very rapid tumor growth within 4 weeks. No
significant loss of body weight was found in all nude mice. Therefore, we
selected the HCT116 cell density of 5 × 10⁶ cells/mouse for generating the
tumor mass in all xenograft nude mice to assess in vivo antitumor efficacy
[242].

152
Figure 49 Establishment of CRC xenograft nude mice. (a) Tumor growth curves
of the subcutaneous HCT116 tumor-bearing mice with initial cell density of 1
million (black line), 5 million (red line), and 10 million (green line). (b) Body
weight of mice over observation time. The data are represented mean ± standard
deviation (n = 2).
4.3.11.2 In vivo antitumor efficacy of drug NSs
After verifying in vitro antitumor activity of the free 3A.1 and 3A.1
NS, we consecutively investigated whether the anticancer activity of this
compound could inhibit tumor growth in vivo. The in vivo antitumor
efficacy of the 3A.1 solution and 3A.1 NS was tested on an animal model.
Xenograft nude mice were subcutaneously inoculated on the right flank of
mice by injection of HCT116 cancer cells. After the tumor volume reached
100-150 mm3, all groups of HCT116 tumor-bearing mice were
administered via i.p. with 3A.1 solution and 3A.1 NS for almost 3 weeks
with a total of six doses (Figure 19). The positive control group received 30
mg/kg of 5-FU solution intraperitoneally as standard chemotherapy [243].
The tumor growth profiles and body mice weight in each treatment are
displayed in Figure 50. The tumor volume in the groups of vehicle and
blank NS were similar, rapidly grew to ∼2000 mm3 within 28 days post-
tumor cell inoculation. This implied that the used polymer as a stabilizer in
nanosuspension formulation did not affect the tumor growth rate of
HCT116 in mice throughout the observation time. In this study, dosing of
3A.1 was performed at 2 levels (low dose at 20 mg/kg and high dose at 40

153
mg/kg of body weight). It was observed that the low dose of 3A.1 solution
cannot inhibit tumor growth of HCT116 in nude mice. Although the 3A.1
was prepared into 3A.1 NS, it still had no effect on tumor growth
suppression. In comparison to the low dose of 3A.1 solution, the high dose
of 3A.1 solution tends to inhibit tumor growth of HCT116 in nude mice.
When the 3A.1 was transformed into 3A.1 NS, it showed higher anticancer
efficacy with lower mean tumor volume. This indicated that the high dose
of 3A.1 at 40 mg/kg could provide the effective inhibition of tumor growth
in HCT116 xenograft nude mice. The mean tumor volume on the end of
treatment of 3A.1 solution at the high dose and 5-FU solution were 1219.34
± 107.85 mm3 and 1367.28 ± 100.04 mm3, respectively, which were
significantly smaller (p<0.05) as compared to the vehicle group (2045.24 ±
151.66 mm3) and blank NS (2021.38 ± 153.01 mm3). There is no significant
difference in mean tumor volume between a high dose of 3A.1 solution and
3A.1 NS, indicating that the 3A.1 NS remains its anticancer efficacy against
the growth of HCT116 tumor. Based on the percentage of tumor growth
inhibition (%TGI), the high dose of 3A.1 NS had the highest growth
inhibitory capacity (46.64%), followed by high dose of 3A.1 solution
(40.38%) and 5-FU solution (33.15%). On the other hand, the %TGI of low
dose of 3A.1 solution and low dose of 3A.1 NS was less than 15%, which
slightly higher than the vehicle group. The representative tumor mass in
each group is presented in Figure 50c. We can observe that the tumor size
in the group treated with the high dose of 3A.1 NS was the smallest but did
not differ from high dose of 3A.1 solution and 5-FU solution. The tumor
mass of both low doses of 3A.1 solution and 3A.1 NS was as big as the
group of the vehicle and blank NS. Overall, the high dose of 3A.1 NS can
inhibit tumor growth rate slightly better than high dose of 3A.1 solution.
Furthermore, there was no significant body weight loss observed in the
group of 3A.1 NS and 3A.1 solution, indicating that i.p injection of 3A.1
formulation might not be harmful in nude mice. The in vivo study indicated
that the i.p injection of 3A.1 NS at high dose inhibited CRC tumor growth
in HCT116 xenograft nude mice.

154
Figure 50 In vivo antitumor efficacy of 3A.1 NSs compared to free 3A.1 solution
against HCT116 tumor xenograft-induced nude mice. (a) The tumor growth curves
of each group in tumor-bearing mice; (b) The body weight of mice in each group;
(c) Representative photographs of subcutaneous tumor mass in each group.

155
CHAPTER 5
CONCLUSION
In this study, semi-synthetic andrographolide (3A.1) was developed and
prepared in the three DDSs including 3A.1-loaded PMs, 3A.1-loaded LPs, and 3A.1-
NSs for delivery of 3A.1 into cancer cells and improving anticancer efficacy. The
amphiphilic chitosan derivatives (NSC, OSC, and BSC) was used to formulate 3A.1-
loaded PMs and as stabilizer for 3A.1-NSs. The results could be summarized as follows:
5.1 Development of 3A.1-loaded polymeric micelles (PMs)
The PMs were formed by self-assembly in an aqueous solution and their
hydrophobic moieties that grafted onto CS backbone facilitated to solubilize the
hydrophobic compound within the micelle’s core. The 3A.1-loaded NSC PMs with
40%wt drug to polymer prepared by a dropping method showed the highest drug
loading capacity, desirable properties (spherical shape, size in nanometer-range,
negative surface charge), and good stability in a refrigerator at 4°C for at least 6 months.
The release patterns of the 3A.1 from micelles depended on the pH of medium and high
amounts of drug were specifically released at intestinal/colon sites. The 3A.1-loaded
PMs clearly showed better anticancer activity against HT29 cell and promotion of cell
apoptosis, compared with free 3A.1. In addition, the 3A.1-loaded PMs also inhibited
cell migration of HN22 cell. The in vitro cellular uptake was found that the fluorescent
intensity of doxorubicin-loaded NSC PMs was higher than that of free Dox,
representing the augmented drug accumulation in cancer cells. In comparison with
unconjugated PMs, the Fol-NSC PMs loaded 3A.1 at 40%wt drug to polymer had
greater cytotoxic activity against HT29 due to enhancing cellular uptake via receptor-
mediated endocytosis.
5.2 Development of 3A.1-loaded liposomes (LPs)
The two types of liposome including conventional LPs and PEGylated LPs were
prepared through a thin-film hydration and probe-sonication method. Overall, the initial
drug molar ratio and lipid components affected the physicochemical properties of these
LPs. The screening of liposomal formulation revealed that conventional LPs containing
PC:Chol at 10:2 molar ratio and PEGylated LPs containing PC:Chol:DSPE-PEG2000

156
at 10:2:0.25 molar ratio had the maximum values of %EE and LC at the initial drug
content of 3.0 mmol. Both conventional LPs and PEGylated LPs had nanometer size,
mildly negative surface charge, and spherical shape. The PEGylated LPs exhibited a
prolonged release profile and these formulations were stable at 4°C for at least 6
months. In addition, the delivery of 3A.1 using PEGylated LPs improved anticancer
activity against HCT116 and HT29 cells caused by induction of cell apoptosis.
Moreover, the 3A.1-loaded LPs were also stronger inhibition of cancer cell migration
than that of free 3A.1.
5.3 Development of 3A.1 nanosuspensions (NSs)
The 3A.1-NSs were produced by an anti-solvent method and these 3A.1-NSs
were stabilized by amphiphilic chitosan copolymers (NSC, OSC, and BSC). The 3A.1-
NSs with drug to polymer ratio of 1.5:1 (w/w) represented favourable properties such
as nanometer range size, narrow size distribution, negative surface charge, spherical
morphology and maximum drug content. Subsequently, the 3A.1-NSs were freeze-
dried using 5%w/v mannitol as a cryoprotectant to transform into powder and well
dispersed in aqueous medium. The reconstitution of freeze-dried powder of 3A.1-NS
with mannitol in water showed no significant change of particle size and zeta potential,
compared to freshly prepared liquid NSs. The 3A.1 and chitosan copolymers were good
compatible without any degradation of substances. The 3A.1-NSs were physical and
chemical stability in refrigerator for at least 6 months. Furthermore, the 3A.1-NSs had
better anticancer activity against HCT116 than free 3A.1. For in vivo antitumor study,
the intraperitoneal injection of 3A.1-NSs at high dose of 40 mg/kg/day had greater
suppression of CRC tumor growth and smaller tumor mass than free drug solution and
blank NS. No significant body weight loss was observed in group of 3A.1-NSs at high
dose.
Based on all of data, the 3A.1 compound possesses potential anticancer activity
and anti-migratory effect. By using nanotechnology, our study suggested that these
nanocarriers (pH-sensitive micelles, PEGylated liposomes) and nanosuspensions could
be a great promising drug delivery of 3A.1 for cancer treatment.
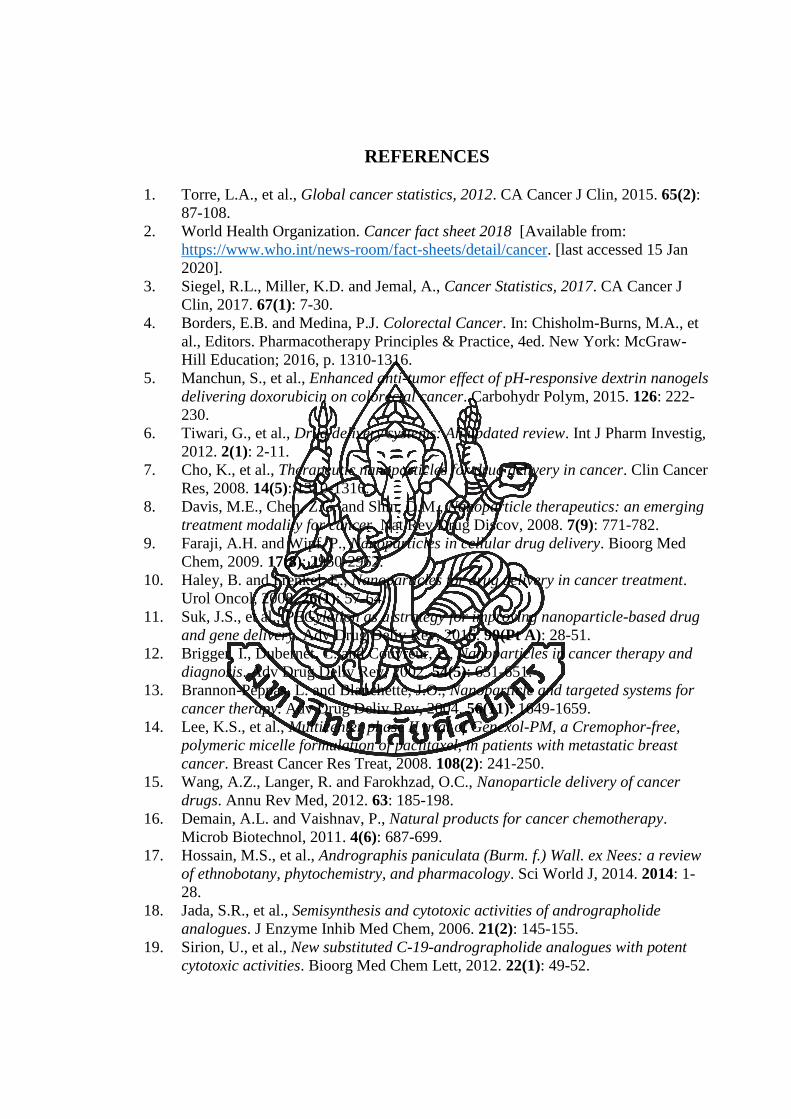
REFE REN CES
REFERENCES
1. Torre, L.A., et al., Global cancer statistics, 2012. CA Cancer J Clin, 2015. 65(2):
87-108.
2. World Health Organization. Cancer fact sheet 2018 [Available from:
https://www.who.int/news-room/fact-sheets/detail/cancer. [last accessed 15 Jan
2020].
3. Siegel, R.L., Miller, K.D. and Jemal, A., Cancer Statistics, 2017. CA Cancer J
Clin, 2017. 67(1): 7-30.
4. Borders, E.B. and Medina, P.J. Colorectal Cancer. In: Chisholm-Burns, M.A., et
al., Editors. Pharmacotherapy Principles & Practice, 4ed. New York: McGraw-
Hill Education; 2016, p. 1310-1316.
5. Manchun, S., et al., Enhanced anti-tumor effect of pH-responsive dextrin nanogels
delivering doxorubicin on colorectal cancer. Carbohydr Polym, 2015. 126: 222-
230.
6. Tiwari, G., et al., Drug delivery systems: An updated review. Int J Pharm Investig,
2012. 2(1): 2-11.
7. Cho, K., et al., Therapeutic nanoparticles for drug delivery in cancer. Clin Cancer
Res, 2008. 14(5): 1310-1316.
8. Davis, M.E., Chen, Z.G. and Shin, D.M., Nanoparticle therapeutics: an emerging
treatment modality for cancer. Nat Rev Drug Discov, 2008. 7(9): 771-782.
9. Faraji, A.H. and Wipf, P., Nanoparticles in cellular drug delivery. Bioorg Med
Chem, 2009. 17(8): 2950-2962.
10. Haley, B. and Frenkel, E., Nanoparticles for drug delivery in cancer treatment.
Urol Oncol, 2008. 26(1): 57-64.
11. Suk, J.S., et al., PEGylation as a strategy for improving nanoparticle-based drug
and gene delivery. Adv Drug Deliv Rev, 2016. 99(Pt A): 28-51.
12. Brigger, I., Dubernet, C. and Couvreur, P., Nanoparticles in cancer therapy and
diagnosis. Adv Drug Deliv Rev, 2002. 54(5): 631-651.
13. Brannon-Peppas, L. and Blanchette, J.O., Nanoparticle and targeted systems for
cancer therapy. Adv Drug Deliv Rev, 2004. 56(11): 1649-1659.
14. Lee, K.S., et al., Multicenter phase II trial of Genexol-PM, a Cremophor-free,
polymeric micelle formulation of paclitaxel, in patients with metastatic breast
cancer. Breast Cancer Res Treat, 2008. 108(2): 241-250.
15. Wang, A.Z., Langer, R. and Farokhzad, O.C., Nanoparticle delivery of cancer
drugs. Annu Rev Med, 2012. 63: 185-198.
16. Demain, A.L. and Vaishnav, P., Natural products for cancer chemotherapy.
Microb Biotechnol, 2011. 4(6): 687-699.
17. Hossain, M.S., et al., Andrographis paniculata (Burm. f.) Wall. ex Nees: a review
of ethnobotany, phytochemistry, and pharmacology. Sci World J, 2014. 2014: 1-
28.
18. Jada, S.R., et al., Semisynthesis and cytotoxic activities of andrographolide
analogues. J Enzyme Inhib Med Chem, 2006. 21(2): 145-155.
19. Sirion, U., et al., New substituted C-19-andrographolide analogues with potent
cytotoxic activities. Bioorg Med Chem Lett, 2012. 22(1): 49-52.

158
20. Nateewattana, J., et al., Inhibition of topoisomerase II alpha activity and induction
of apoptosis in mammalian cells by semi-synthetic andrographolide analogues.
Invest New Drugs, 2013. 31(2): 320-332.
21. Deshpande, P.P., Biswas, S. and Torchilin, V.P., Current trends in the use of
liposomes for tumor targeting. Nanomedicine (Lond), 2013. 8(9): 1509-1528.
22. Lee, S.E., et al., Paclitaxel nanosuspensions for targeted chemotherapy -
nanosuspension preparation, characterization, and use. Pharm Dev Technol,
2014. 19(4): 438-453.
23. Biswas, S., et al., Recent advances in polymeric micelles for anti-cancer drug
delivery. Eur J Pharm Sci, 2016. 83: 184-202.
24. Deshmukh, A.S., et al., Polymeric micelles: Basic research to clinical practice.
Int J Pharm, 2017. 532(1): 249-268.
25. Xin, Y., et al., Nanoscale drug delivery for targeted chemotherapy. Cancer Lett,
2016. 379(1): 24-31.
26. Sajomsang, W., et al., Synthesis and anticervical cancer activity of novel pH
responsive micelles for oral curcumin delivery. Int J Pharm, 2014. 477(1-2): 261-
272.
27. Woraphatphadung, T., et al., Synthesis and characterization of pH-responsive N-
naphthyl-N,O-succinyl chitosan micelles for oral meloxicam delivery. Carbohydr
Polym, 2015. 121(5): 99-106.
28. Woraphatphadung, T., et al., pH-responsive polymeric micelles based on
amphiphilic chitosan derivatives: Effect of hydrophobic cores on oral meloxicam
delivery. Int J Pharm, 2016. 497(1-2): 150-160.
29. Soodvilai, S., et al., Effects of silymarin-loaded amphiphilic chitosan polymeric
micelles on the renal toxicity and anticancer activity of cisplatin. Pharm Dev
Technol, 2019. 24(8): 927-934.
30. Allen, T.M. and Cullis, P.R., Liposomal drug delivery systems: from concept to
clinical applications. Adv Drug Deliv Rev, 2013. 65(1): 36-48.
31. Patil, Y.P. and Jadhav, S., Novel methods for liposome preparation. Chem Phys
Lipids, 2014. 177: 8-18.
32. Rangsimawong, W., et al., Skin transport of hydrophilic compound-loaded
PEGylated lipid nanocarriers: Comparative study of liposomes, niosomes, and
solid lipid nanoparticles. Biol Pharm Bull, 2016. 39(8): 1254-1262.
33. Mishra, P., Nayak, B. and Dey, R.K., PEGylation in anti-cancer therapy: An
overview. Asian J Pharm Sci, 2016. 11(3): 337-348.
34. Verhoef, J.J. and Anchordoquy, T.J., Questioning the Use of PEGylation for Drug
Delivery. Drug Deliv Transl Res, 2013. 3(6): 499-503.
35. Hossen, S., et al., Smart nanocarrier-based drug delivery systems for cancer
therapy and toxicity studies: A review. J Adv Res, 2019. 15: 1-18.
36. Perche, F. and Torchilin, V.P., Recent trends in multifunctional liposomal
nanocarriers for enhanced tumor targeting. J Drug Deliv, 2013. 2013: 705265.
37. Riaz, M.K., et al., Surface functionalization and targeting strategies of liposomes
in solid tumor therapy: A review. Int J Mol Sci, 2018. 19(1): 195.
38. Bulbake, U., et al., Liposomal formulations in clinical use: An updated review.
Pharmaceutics, 2017. 9(2): 1-33.
39. Olusanya, T.O.B., et al., Liposomal drug delivery systems and anticancer drugs.
Molecules, 2018. 23(4): 1-27.
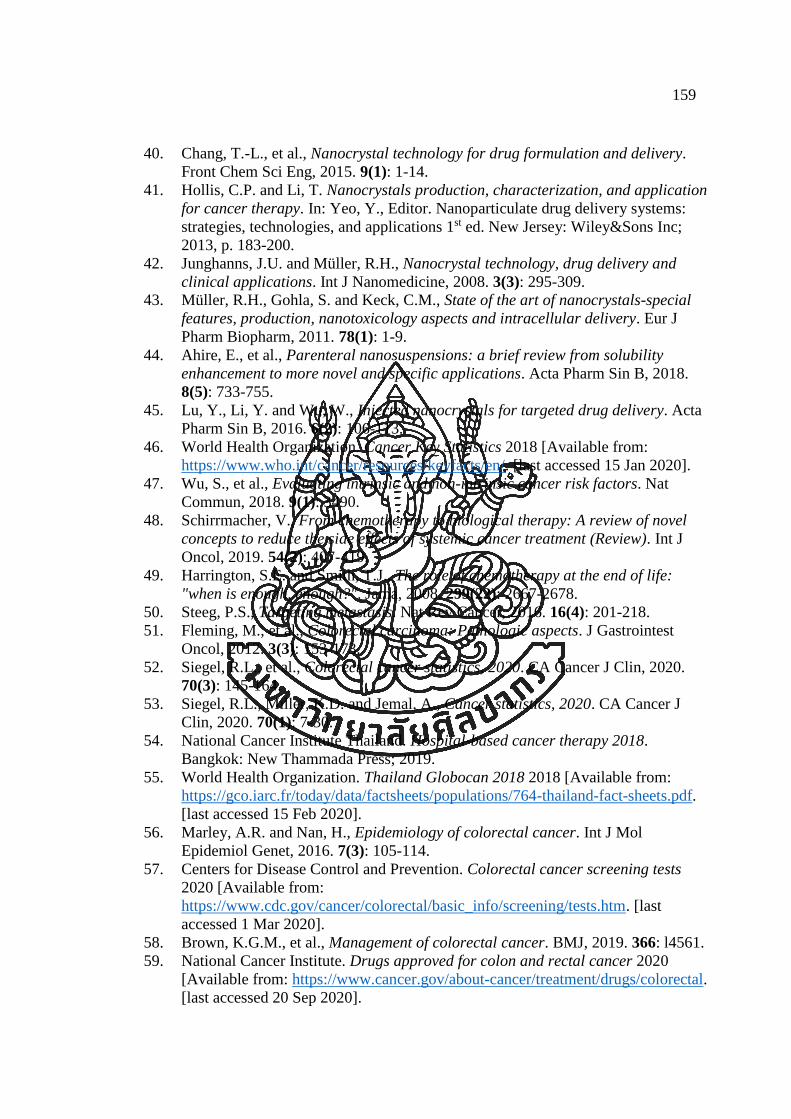
159
40. Chang, T.-L., et al., Nanocrystal technology for drug formulation and delivery.
Front Chem Sci Eng, 2015. 9(1): 1-14.
41. Hollis, C.P. and Li, T. Nanocrystals production, characterization, and application
for cancer therapy. In: Yeo, Y., Editor. Nanoparticulate drug delivery systems:
strategies, technologies, and applications 1st ed. New Jersey: Wiley&Sons Inc;
2013, p. 183-200.
42. Junghanns, J.U. and Müller, R.H., Nanocrystal technology, drug delivery and
clinical applications. Int J Nanomedicine, 2008. 3(3): 295-309.
43. Müller, R.H., Gohla, S. and Keck, C.M., State of the art of nanocrystals-special
features, production, nanotoxicology aspects and intracellular delivery. Eur J
Pharm Biopharm, 2011. 78(1): 1-9.
44. Ahire, E., et al., Parenteral nanosuspensions: a brief review from solubility
enhancement to more novel and specific applications. Acta Pharm Sin B, 2018.
8(5): 733-755.
45. Lu, Y., Li, Y. and Wu, W., Injected nanocrystals for targeted drug delivery. Acta
Pharm Sin B, 2016. 6(2): 106-113.
46. World Health Organization. Cancer Key Statistics 2018 [Available from:
https://www.who.int/cancer/resources/keyfacts/en/. [last accessed 15 Jan 2020].
47. Wu, S., et al., Evaluating intrinsic and non-intrinsic cancer risk factors. Nat
Commun, 2018. 9(1): 3490.
48. Schirrmacher, V., From chemotherapy to biological therapy: A review of novel
concepts to reduce the side effects of systemic cancer treatment (Review). Int J
Oncol, 2019. 54(2): 407-419.
49. Harrington, S.E. and Smith, T.J., The role of chemotherapy at the end of life:
"when is enough, enough?". Jama, 2008. 299(22): 2667-2678.
50. Steeg, P.S., Targeting metastasis. Nat Rev Cancer, 2016. 16(4): 201-218.
51. Fleming, M., et al., Colorectal carcinoma: Pathologic aspects. J Gastrointest
Oncol, 2012. 3(3): 153-173.
52. Siegel, R.L., et al., Colorectal cancer statistics, 2020. CA Cancer J Clin, 2020.
70(3): 145-164.
53. Siegel, R.L., Miller, K.D. and Jemal, A., Cancer statistics, 2020. CA Cancer J
Clin, 2020. 70(1): 7-30.
54. National Cancer Institute Thailand. Hospital-based cancer therapy 2018.
Bangkok: New Thammada Press; 2019.
55. World Health Organization. Thailand Globocan 2018 2018 [Available from:
https://gco.iarc.fr/today/data/factsheets/populations/764-thailand-fact-sheets.pdf.
[last accessed 15 Feb 2020].
56. Marley, A.R. and Nan, H., Epidemiology of colorectal cancer. Int J Mol
Epidemiol Genet, 2016. 7(3): 105-114.
57. Centers for Disease Control and Prevention. Colorectal cancer screening tests
2020 [Available from:
https://www.cdc.gov/cancer/colorectal/basic_info/screening/tests.htm. [last
accessed 1 Mar 2020].
58. Brown, K.G.M., et al., Management of colorectal cancer. BMJ, 2019. 366: l4561.
59. National Cancer Institute. Drugs approved for colon and rectal cancer 2020
[Available from: https://www.cancer.gov/about-cancer/treatment/drugs/colorectal.
[last accessed 20 Sep 2020].

160
60. Gustavsson, B., et al., A review of the evolution of systemic chemotherapy in the
management of colorectal cancer. Clin Colorectal Cancer, 2015. 14(1): 1-10.
61. Lichota, A. and Gwozdzinski, K., Anticancer Activity of Natural Compounds from
Plant and Marine Environment. Int J Mol Sci, 2018. 19(11): 3533.
62. Xiao, Z., Morris-Natschke, S.L. and Lee, K.H., Strategies for the optimization of
natural leads to anticancer drugs or drug candidates. Med Res Rev, 2016. 36(1):
32-91.
63. Seca, A.M.L. and Pinto, D., Plant secondary metabolites as anticancer agents:
Successes in clinical trials and therapeutic application. Int J Mol Sci, 2018. 19(1):
263.
64. Pawar, A., et al., Strategies for formulation development of andrographolide. RSC
Adv, 2016. 6(73): 69282-69300.
65. Varma, A., Padh, H. and Shrivastava, N., Andrographolide: a new plant-derived
antineoplastic entity on horizon. Evid Based Complement Alternat Med, 2011.
2011: 815390.
66. Department of Medical Sciences, Ministry of Public Health. Thai herbal
pharmacopoeia 2019. Nonthaburi: Department of Medical Sciences; 2019.
67. Mishra, S.K., et al., Andrographolide and analogues in cancer prevention. Front
Biosci (Elite Ed), 2015. 7: 255-266.
68. Jayakumar, T., et al., Experimental and clinical pharmacology of Andrographis
paniculata and its major bioactive phytoconstituent andrographolide. Evid Based
Complement Alternat Med, 2013. 2013: 846740.
69. Dai, Y., et al., Overview of pharmacological activities of Andrographis paniculata
and its major compound andrographolide. Crit Rev Food Sci Nutr, 2019.
59(sup1): S17-S29.
70. Banerjee, M., et al., Cytotoxicity and cell cycle arrest induced by andrographolide
lead to programmed cell death of MDA-MB-231 breast cancer cell line. J Biomed
Sci, 2016. 23(1): 40.
71. Islam, M.T., et al., Andrographolide, a diterpene lactone from Andrographis
paniculata and its therapeutic promises in cancer. Cancer Lett, 2018. 420: 129-
145.
72. Choudhari, A.S., et al., Phytochemicals in cancer treatment: From preclinical
studies to clinical practice. Front Pharmacol, 2019. 10: 1614.
73. Jada, S.R., et al., Semisynthesis and in vitro anticancer activities of
andrographolide analogues. Phytochemistry, 2007. 68(6): 904-912.
74. Nanduri, S., et al., Synthesis and structure-activity relationships of
andrographolide analogues as novel cytotoxic agents. Bioorg Med Chem Lett,
2004. 14(18): 4711-4717.
75. Aromdee, C., Modifications of andrographolide to increase some biological
activities: a patent review (2006 - 2011). Expert Opin Ther Pat, 2012. 22(2): 169-
180.
76. Das, B., et al., Synthesis, cytotoxicity, and structure-activity relationship (SAR)
studies of andrographolide analogues as anti-cancer agent. Bioorg Med Chem
Lett, 2010. 20(23): 6947-6950.
77. Lim, J.C., et al., Andrographolide and its analogues: versatile bioactive molecules
for combating inflammation and cancer. Clin Exp Pharmacol Physiol, 2012.
39(3): 300-310.

161
78. Preet, R., et al., Synthesis and biological evaluation of andrographolide analogues
as anti-cancer agents. Eur J Med Chem, 2014. 85: 95-106.
79. Jada, S.R., et al., Benzylidene derivatives of andrographolide inhibit growth of
breast and colon cancer cells in vitro by inducing G(1) arrest and apoptosis. Br J
Pharmacol, 2008. 155(5): 641-654.
80. Peng, Y., et al., SAR studies of 3,14,19-derivatives of andrographolide on anti-
proliferative activity to cancer cells and toxicity to zebrafish: an in vitro and in
vivo study. RSC Adv, 2015. 5(29): 22510-22526.
81. Nateewattana, J., et al., Induction of apoptosis in cholangiocarcinoma by an
andrographolide analogue is mediated through topoisomerase II alpha inhibition.
Eur J Pharmacol, 2014. 723: 148-155.
82. Reabroi, S., et al., A silyl andrographolide analogue suppresses Wnt/beta-catenin
signaling pathway in colon cancer. Biomed Pharmacother, 2018. 101: 414-421.
83. Wicki, A., et al., Nanomedicine in cancer therapy: challenges, opportunities, and
clinical applications. J Control Release, 2015. 200: 138-157.
84. Din, F.U., et al., Effective use of nanocarriers as drug delivery systems for the
treatment of selected tumors. Int J Nanomedicine, 2017. 12: 7291-7309.
85. Jeong, K., et al., Development of highly efficient nanocarrier-mediated delivery
approaches for cancer therapy. Cancer Lett, 2016. 374(1): 31-43.
86. Ali, I., et al., Advances in nanocarriers for anticancer drugs delivery. Curr Med
Chem, 2016. 23(20): 2159-2187.
87. Akhter, M.H., et al., Nanocarriers in advanced drug targeting: setting novel
paradigm in cancer therapeutics. Artif Cells Nanomed Biotechnol, 2018. 46(5):
873-884.
88. Attia, M.F., et al., An overview of active and passive targeting strategies to
improve the nanocarriers efficiency to tumour sites. J Pharm Pharmacol, 2019.
71(8): 1185-1198.
89. Miao, L. and Huang, L., Exploring the tumor microenvironment with
nanoparticles. Cancer Treat Res, 2015. 166: 193-226.
90. National Cancer Institute. Benefits of nanotechnology for cancer 2017 [Available
from: https://www.cancer.gov/nano/cancer-nanotechnology/benefits. [last
accessed 1 Aug 2020].
91. Kumari, P., Ghosh, B. and Biswas, S., Nanocarriers for cancer-targeted drug
delivery. J Drug Target, 2016. 24(3): 179-191.
92. Jani, R.K. and Krupa, G., Active targeting of nanoparticles: An innovative
technology for drug delivery in cancer therapeutics. J Drug Deliv Ther, 2019. 9(1-
s): 408-415.
93. Salahpour Anarjan, F., Active targeting drug delivery nanocarriers: Ligands.
Nano-Struct Nano-Objects, 2019. 19: 100370.
94. Kutova, O.M., et al., Targeted delivery to tumors: Multidirectional strategies to
improve treatment efficiency. Cancers (Basel), 2019. 11(1): 68.
95. Xu, S., et al., Targeting receptor-mediated endocytotic pathways with
nanoparticles: rationale and advances. Adv Drug Deliv Rev, 2013. 65(1): 121-
138.
96. Danhier, F., Feron, O. and Préat, V., To exploit the tumor microenvironment:
Passive and active tumor targeting of nanocarriers for anti-cancer drug delivery.
J Control Release, 2010. 148(2): 135-146.

162
97. Yoo, J., et al., Active targeting strategies using biological ligands for nanoparticle
drug delivery systems. Cancers (Basel), 2019. 11(5): 640.
98. Qiao, W., et al., Cancer therapy based on nanomaterials and nanocarrier systems.
J Nanometer, 2010. 2010: 796303.
99. Croy, S.R. and Kwon, G.S., Polymeric micelles for drug delivery. Curr Pharm
Des, 2006. 12(36): 4669-4684.
100. Ahmad, Z., et al., Polymeric micelles as drug delivery vehicles. RSC Adv, 2014.
4(33): 17028-17038.
101. Xu, W., Ling, P. and Zhang, T., Polymeric micelles, a promising drug delivery
system to enhance bioavailability of poorly water-soluble drugs. J Drug Deliv,
2013. 2013: 340315.
102. Tai, W. and Cheng, K. Advanced drug delivery in cancer therapy. In: Mitra, A.k.,
Editor. New Jersey: John Wiley&Sons Inc; 2014, p. 323-326.
103. Ma, P. and Mumper, R.J., Paclitaxel nano-delivery systems: A comprehensive
review. J Nanomed Nanotechnol, 2013. 4(2): 1000164.
104. Oerlemans, C., et al., Polymeric micelles in anticancer therapy: Targeting,
imaging and triggered release. Pharm Res, 2010. 27(12): 2569-2589.
105. Kedar, U., et al., Advances in polymeric micelles for drug delivery and tumor
targeting. Nanomedicine, 2010. 6(6): 714-729.
106. Hussein, Y.H.A. and Youssry, M., Polymeric micelles of biodegradable diblock
copolymers: Enhanced encapsulation of hydrophobic drugs. Materials (Basel),
2018. 11(5): 688.
107. Gothwal, A., Khan, I. and Gupta, U., Polymeric micelles: Recent advancements in
the delivery of anticancer drugs. Pharm Res, 2016. 33(1): 18-39.
108. Lu, Y. and Park, K., Polymeric micelles and alternative nanonized delivery
vehicles for poorly soluble drugs. Int J Pharm, 2013. 453(1): 198-214.
109. Kulthe, S.S., et al., Polymeric micelles: authoritative aspects for drug delivery.
Des Monomers Polym, 2012. 15(5): 465-521.
110. Tian, Y. and Mao, S., Amphiphilic polymeric micelles as the nanocarrier for
peroral delivery of poorly soluble anticancer drugs. Expert Opin Drug Deliv,
2012. 9(6): 687-700.
111. Yokoyama, M., Polymeric micelles as drug carriers: their lights and shadows. J
Drug Target, 2014. 22(7): 576-583.
112. Nagaich, D.U., et al., Polymeric micelles: potential drug delivery devices.
Indonesian J Pharm, 2013. 24(4): 223-238.
113. Yokoyama, M., et al., Characterization of physical entrapment and chemical
conjugation of adriamycin in polymeric micelles and their design for in vivo
delivery to a solid tumor. J Control Release, 1998. 50(1-3): 79-92.
114. Ding, J., et al., Noncovalent interaction-assisted polymeric micelles for controlled
drug delivery. Chem Commun, 2014. 50(77): 11274-11290.
115. Ohno, S., Ishihara, K. and Yusa, S., Formation of polyion complex (PIC) micelles
and vesicles with anionic pH-responsive unimer micelles and cationic diblock
copolymers in water. Langmuir, 2016. 32(16): 3945-3953.
116. Zhou, W., et al., Factors affecting the stability of drug-loaded polymeric micelles
and strategies for improvement. J Nanopart Res, 2016. 18(9): 275.

163
117. Chakraborty, T., Chakraborty, I. and Ghosh, S., The methods of determination of
critical micellar concentrations of the amphiphilic systems in aqueous medium.
Arab J Chem, 2011. 4(3): 265-270.
118. Owen, S.C., Chan, D.P.Y. and Shoichet, M.S., Polymeric micelle stability. Nano
Today, 2012. 7(1): 53-65.
119. Zhang, Y., Huang, Y. and Li, S., Polymeric micelles: nanocarriers for cancer-
targeted drug delivery. AAPS PharmSciTech, 2014. 15(4): 862-871.
120. Zhou, Q., et al., Stimuli-responsive polymeric micelles for drug delivery and
cancer therapy. Int J Nanomedicine, 2018. 13: 2921-2942.
121. Wang, C., et al., Bicomponent polymeric micelles for pH-controlled delivery of
doxorubicin. Drug Deliv, 2020. 27(1): 344-357.
122. Pandey, H., Rani, R. and Agarwal, V., Liposome and their applications in cancer
therapy. Braz Arch Biol Technol, 2016. 59: e16150477.
123. García-Pinel, B., et al., Lipid-based nanoparticles: Application and recent
advances in cancer treatment. Nanomaterials (Basel), 2019. 9(4): 638.
124. Samad, A., Sultana, Y. and Aqil, M., Liposomal drug delivery systems: an update
review. Curr Drug Deliv, 2007. 4(4): 297-305.
125. Alavi, M., Karimi, N. and Safaei, M., Application of various types of liposomes in
drug delivery systems. Adv Pharm Bull, 2017. 7(1): 3-9.
126. Akbarzadeh, A., et al., Liposome: classification, preparation, and applications.
Nanoscale Res Lett, 2013. 8(1): 102.
127. Malam, Y., Loizidou, M. and Seifalian, A.M., Liposomes and nanoparticles:
nanosized vehicles for drug delivery in cancer. Trends Pharmacol Sci, 2009.
30(11): 592-599.
128. Li, J., et al., A review on phospholipids and their main applications in drug
delivery systems. Asian J Pharm Sci, 2015. 10(2): 81-98.
129. Briuglia, M.L., et al., Influence of cholesterol on liposome stability and on in vitro
drug release. Drug Deliv Transl Res, 2015. 5(3): 231-242.
130. Lee, S.-C., et al., The effect of cholesterol in the liposome bilayer on the
stabilization of incorporated retinol. J Liposome Res, 2005. 15(3-4): 157-166.
131. Wu, H., et al., Cholesterol-tuned liposomal membrane rigidity directs tumor
penetration and anti-tumor effect. Acta Pharm Sin B, 2019. 9(4): 858-870.
132. Cagdas, M., Sezer, A.D. and Bucak, S. Liposomes as potential drug carrier
systems for drug delivery. In: Sezer, A.D., Editor. Application of nanotechnology
in drug delivery. London: IntechOpen; 2014.
133. Zhang, J., et al., The influence of different long-circulating materials on the
pharmacokinetics of liposomal vincristine sulfate. Int J Nanomedicine, 2016. 11:
4187-4197.
134. Immordino, M.L., Dosio, F. and Cattel, L., Stealth liposomes: Review of the basic
science, rationale, and clinical applications, existing and potential. Int J
Nanomedicine, 2006. 1(3): 297-315.
135. Wang, R., et al., Application of poly(ethylene glycol)-
distearoylphosphatidylethanolamine (PEG-DSPE) block copolymers and their
derivatives as nanomaterials in drug delivery. Int J Nanomedicine, 2012. 7: 4185-
4198.

164
136. Lee, J.S., et al., Circulation kinetics and biodistribution of dual-labeled
polymersomes with modulated surface charge in tumor-bearing mice:
Comparison with stealth liposomes. J Control Release, 2011. 155(2): 282-288.
137. McSweeney, M.D., et al., Overcoming anti-PEG antibody mediated accelerated
blood clearance of PEGylated liposomes by pre-infusion with high molecular
weight free PEG. J Control Release, 2019. 311-312: 138-146.
138. Suzuki, T., et al., Accelerated blood clearance of PEGylated liposomes containing
doxorubicin upon repeated administration to dogs. Int J Pharm, 2012. 436(1-2):
636-643.
139. Balazs, D.A. and Godbey, W., Liposomes for use in gene delivery. J Drug Deliv,
2011. 2011: 326497.
140. An, X. and Gui, R. Stimuli-responsive liposome and control release drug. In:
Andronescu, E. and, Grumezescu, A., Editors. Nanostructures for drug delivery.
Amsterdam: Elsevier; 2017, p. 887-917.
141. Ganta, S., et al., A review of stimuli-responsive nanocarriers for drug and gene
delivery. J Control Release, 2008. 126(3): 187-204.
142. Lee, Y. and Thompson, D.H., Stimuli-responsive liposomes for drug delivery.
Wiley Interdiscip Rev Nanomed Nanobiotechnol, 2017. 9(5): 1-40.
143. Heidarli, E., Dadashzadeh, S. and Haeri, A., State of the art of stimuli-responsive
liposomes for cancer therapy. Iran J Pharm Res, 2017. 16(4): 1273-1304.
144. Jain, A. and Jain, S.K., Stimuli-responsive smart liposomes in cancer targeting.
Curr Drug Targets, 2018. 19(3): 259-270.
145. Lopes, S.C.d.A., et al. Liposomes as carriers of anticancer drugs. In: Rangel, L.,
Editor. Cancer treatment-conventional and innovative approaches. Rijeka:
IntechOpen; 2013, p. 85-124.
146. Zhang, H., Thin-film hydration followed by extrusion method for liposome
preparation. Methods Mol Biol, 2017. 1522: 17-22.
147. Huang, Z., et al., Progress involving new techniques for liposome preparation.
Asian J Pharm Sci, 2014. 9(4): 176-182.
148. Rahman, A., Uahengo, V. and Likius, D., Mini review on emerging methods of
preparation of liposome and its application as liposome drug delivery systems.
Open J Pharmacol Pharmacother, 2018. 3(1): 5-21.
149. Koynova, R. and Tenchov, B., Lipids: Phase transitions. Wiley Encycl Chem
Biol, 2008. 1-15.
150. Lee, K.-E., et al., Effect of phase transition temperature of phospholipid on the
stability of retinol incorporated into liposomes. Prev Nutr Food Sci, 2003. 8(3):
235-238.
151. Zylberberg, C. and Matosevic, S., Pharmaceutical liposomal drug delivery: a
review of new delivery systems and a look at the regulatory landscape. Drug
Deliv, 2016. 23(9): 3319-3329.
152. Ahmed, K.S., et al., Liposome: composition, characterisation, preparation, and
recent innovation in clinical applications. J Drug Target, 2019. 27(7): 742-761.
153. Simão, A.M.S., et al., Liposomal systems as carriers for bioactive compounds.
Biophys Rev, 2015. 7(4): 391-397.
154. Abu Lila, A.S. and Ishida, T., Liposomal delivery systems: Design optimization
and current applications. Biol Pharm Bull, 2017. 40(1): 1-10.
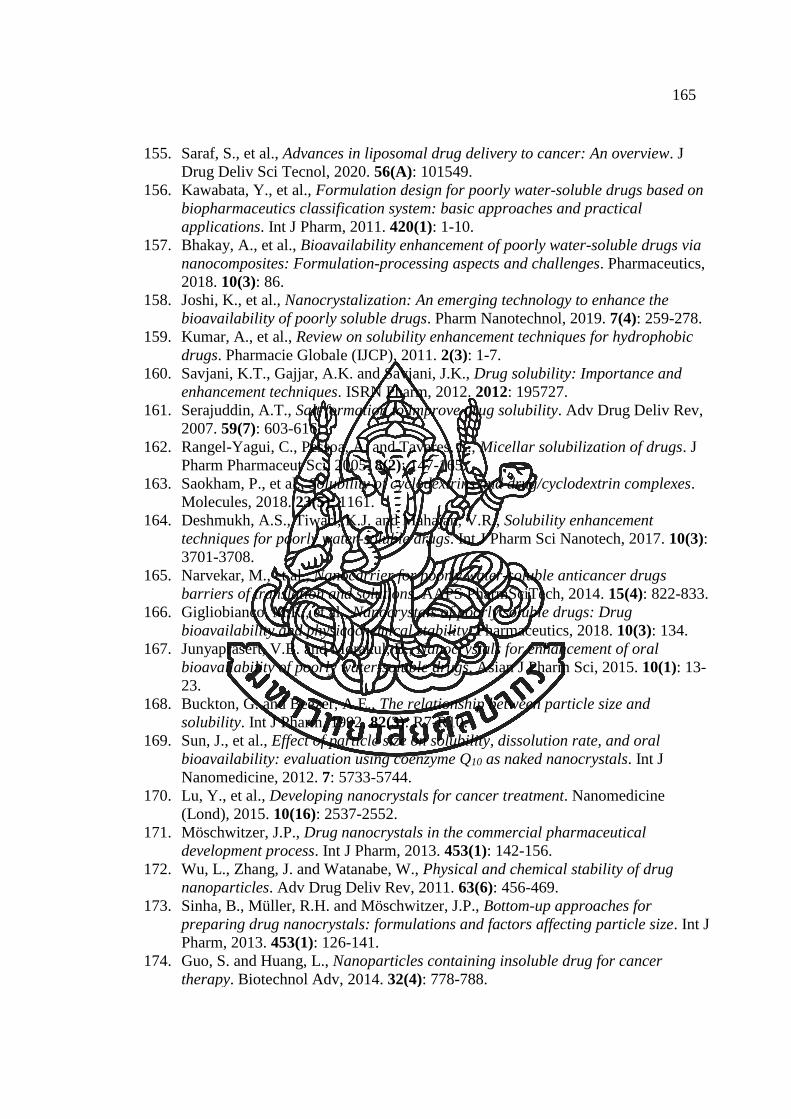
165
155. Saraf, S., et al., Advances in liposomal drug delivery to cancer: An overview. J
Drug Deliv Sci Tecnol, 2020. 56(A): 101549.
156. Kawabata, Y., et al., Formulation design for poorly water-soluble drugs based on
biopharmaceutics classification system: basic approaches and practical
applications. Int J Pharm, 2011. 420(1): 1-10.
157. Bhakay, A., et al., Bioavailability enhancement of poorly water-soluble drugs via
nanocomposites: Formulation-processing aspects and challenges. Pharmaceutics,
2018. 10(3): 86.
158. Joshi, K., et al., Nanocrystalization: An emerging technology to enhance the
bioavailability of poorly soluble drugs. Pharm Nanotechnol, 2019. 7(4): 259-278.
159. Kumar, A., et al., Review on solubility enhancement techniques for hydrophobic
drugs. Pharmacie Globale (IJCP), 2011. 2(3): 1-7.
160. Savjani, K.T., Gajjar, A.K. and Savjani, J.K., Drug solubility: Importance and
enhancement techniques. ISRN Pharm, 2012. 2012: 195727.
161. Serajuddin, A.T., Salt formation to improve drug solubility. Adv Drug Deliv Rev,
2007. 59(7): 603-616.
162. Rangel-Yagui, C., Pessoa, A. and Tavares, L., Micellar solubilization of drugs. J
Pharm Pharmaceut Sci, 2005. 8(2): 147-165.
163. Saokham, P., et al., Solubility of cyclodextrins and drug/cyclodextrin complexes.
Molecules, 2018. 23(5): 1161.
164. Deshmukh, A.S., Tiwari, K.J. and Mahajan, V.R., Solubility enhancement
techniques for poorly water-soluble drugs. Int J Pharm Sci Nanotech, 2017. 10(3):
3701-3708.
165. Narvekar, M., et al., Nanocarrier for poorly water-soluble anticancer drugs
barriers of translation and solutions. AAPS PharmSciTech, 2014. 15(4): 822-833.
166. Gigliobianco, M.R., et al., Nanocrystals of poorly soluble drugs: Drug
bioavailability and physicochemical stability. Pharmaceutics, 2018. 10(3): 134.
167. Junyaprasert, V.B. and Morakul, B., Nanocrystals for enhancement of oral
bioavailability of poorly water-soluble drugs. Asian J Pharm Sci, 2015. 10(1): 13-
23.
168. Buckton, G. and Beezer, A.E., The relationship between particle size and
solubility. Int J Pharm, 1992. 82(3): R7-R10.
169. Sun, J., et al., Effect of particle size on solubility, dissolution rate, and oral
bioavailability: evaluation using coenzyme Q10 as naked nanocrystals. Int J
Nanomedicine, 2012. 7: 5733-5744.
170. Lu, Y., et al., Developing nanocrystals for cancer treatment. Nanomedicine
(Lond), 2015. 10(16): 2537-2552.
171. Möschwitzer, J.P., Drug nanocrystals in the commercial pharmaceutical
development process. Int J Pharm, 2013. 453(1): 142-156.
172. Wu, L., Zhang, J. and Watanabe, W., Physical and chemical stability of drug
nanoparticles. Adv Drug Deliv Rev, 2011. 63(6): 456-469.
173. Sinha, B., Müller, R.H. and Möschwitzer, J.P., Bottom-up approaches for
preparing drug nanocrystals: formulations and factors affecting particle size. Int J
Pharm, 2013. 453(1): 126-141.
174. Guo, S. and Huang, L., Nanoparticles containing insoluble drug for cancer
therapy. Biotechnol Adv, 2014. 32(4): 778-788.
166
175. Tuomela, A., Hirvonen, J. and Peltonen, L., Stabilizing agents for drug
nanocrystals: Effect on bioavailability. Pharmaceutics, 2016. 8(2): 16.
176. Yang, C., et al., Recent advances in the application of vitamin E TPGS for drug
delivery. Theranostics, 2018. 8(2): 464-485.
177. Jacob, S., Nair, A.B. and Shah, J., Emerging role of nanosuspensions in drug
delivery systems. Biomater Res, 2020. 24: 3.
178. Sun, B. and Yeo, Y., Nanocrystals for the parenteral delivery of poorly water-
soluble drugs. Curr Opin Solid State Mater Sci, 2012. 16(6): 295-301.
179. Danaei, M., et al., Impact of particle size and polydispersity index on the clinical
applications of lipidic nanocarrier systems. Pharmaceutics, 2018. 10(2): 57.
180. Shah, M.R., Imran, M. and Ullah, S. Nanosuspensions. In: Shah, M.R., Editor.
Lipid-based nanocarriers for drug delivery and diagnosis 1st ed. Oxford: Elsevier
Science; 2017, p. 139-172.
181. Patel, V.R. and Agrawal, Y.K., Nanosuspension: An approach to enhance
solubility of drugs. J Adv Pharm Technol Res, 2011. 2(2): 81-87.
182. Liu, P., et al., Dissolution studies of poorly soluble drug nanosuspensions in non-
sink conditions. AAPS PharmSciTech, 2013. 14(2): 748-756.
183. Rabinow, B.E., Nanosuspensions in drug delivery. Nat Rev Drug Discov, 2004.
3(9): 785-796.
184. Wang, Y., et al., Stability of nanosuspensions in drug delivery. J Control Release,
2013. 172(3): 1126-1141.
185. Verma, S., et al., Physical stability of nanosuspensions: Investigation of the role of
stabilizers on Ostwald ripening. Int J Pharm, 2011. 406(1-2): 145-152.
186. Agarwal, V. and Bajpai, M., Stability issues related to nanosuspensions: A review.
Pharm Nanotechol, 2013. 1: 85-92.
187. Yadollahi, R., Vasilev, K. and Simovic, S., Nanosuspension technologies for
delivery of poorly soluble drugs. J Nanometer, 2015. 2015: 216375.
188. Wang, L., et al., Cryoprotectant choice and analyses of freeze-drying drug
suspension of nanoparticles with functional stabilisers. J Microencapsul, 2018.
35(3): 241-248.
189. Behzadi, S., et al., Cellular uptake of nanoparticles: Journey inside the cell. Chem
Soc Rev, 2017. 46(14): 4218-4244.
190. Miao, X., et al., Drug nanocrystals for cancer therapy. Wiley Interdiscip Rev
Nanomed Nanobiotechnol, 2018. 10(3): e1499.
191. Gao, L., et al., Drug nanocrystals: In vivo performances. J Control Release, 2012.
160(3): 418-430.
192. Pawar, V.K., et al., Engineered nanocrystal technology: in-vivo fate, targeting and
applications in drug delivery. J Control Release, 2014. 183: 51-66.
193. Dutta, P.K., Dutta, J. and Tripathi, V.S., Chitin and chitosan: Chemistry,
properties and applications. J Sci Indus Res, 2003. 63(1): 20-31.
194. United States Pharmacopeia and National Formulary (USP 43-NF 38). Rockville,
MD: United States Pharmacopeial Convention 2020. Available from:
https://online.uspnf.com/uspnf/document/1_GUID-30832BBE-AFC1-463B-9695-
AB4EF0A14413_6_en-US.
195. Kumar, R. and Majeti, N.V., A review of chitin and chitosan applications. React
Funct Polym, 2000. 46(1): 1-27.

167
196. Kumirska, J., et al., Biomedical activity of chitin/chitosan based materials-
Influence of physicochemical properties apart from molecular weight and degree
of N-acetylation. Polymers, 2011. 3(4): 1875-1901.
197. Shariatinia, Z., Carboxymethyl chitosan: Properties and biomedical applications.
Int J Biol Macromol, 2018. 120(B): 1406-1419.
198. Zargar, V., Asghari, M. and Dashti, A., A review on chitin and chitosan polymers:
Structure, chemistry, solubility, derivatives, and applications. Chem Bio Eng
Reviews, 2015. 2(3): 204-226.
199. Prabaharan, M., Chitosan-based nanoparticles for tumor-targeted drug delivery.
Int J Biol Macromol, 2015. 72: 1313-1322.
200. Mateescu, M.A., Ispas-Szabo, P. and Assaad, E. Chitosan and its derivatives as
self-assembled systems for drug delivery. In: Mateescu, M.A., Ispas-Szabo, P. and,
Assaad, E., Editors. Controlled drug delivery. Kidlington: Woodhead Publishing;
2015, p. 85-125.
201. Miwa, A., et al., Development of novel chitosan derivatives as micellar carriers of
taxol. Pharm Res, 1998. 15(12): 1844-1850.
202. Jin, X., et al., Paclitaxel-loaded N-octyl-O-sulfate chitosan micelles for superior
cancer therapeutic efficacy and overcoming drug resistance. Mol Pharm, 2014.
11(1): 145-157.
203. Qu, G., et al., PEG conjugated N-octyl-O-sulfate chitosan micelles for delivery of
paclitaxel: in vitro characterization and in vivo evaluation. Eur J Pharm Sci,
2009. 37(2): 98-105.
204. Huo, M., et al., Synthesis and characterization of low-toxic amphiphilic chitosan
derivatives and their application as micelle carrier for antitumor drug. Int J
Pharm, 2010. 394(1-2): 162-173.
205. Yuan, H., et al., Stearic acid-g-chitosan polymeric micelle for oral drug delivery:
in vitro transport and in vivo absorption. Mol Pharm, 2011. 8(1): 225-238.
206. Tahvilian, R., et al., Preparation and characterization of pH-sensitive
camptothecin-cis-aconityl grafted chitosan oligosaccharide nanomicelles. Int J
Biol Macromol, 2016. 92: 795-802.
207. Dai, Y., et al., pH-responsive carboxymethyl chitosan-derived micelles as apatinib
carriers for effective anti-angiogenesis activity: Preparation and in vitro
evaluation. Carbohydr Polym, 2017. 176: 107-116.
208. International Conference on Harmonisation (ICH). Stability testing of new drug
substances and products, ICH Q1A (R2)2003.
209. Borner, M.M., et al., The detergent Triton X-100 induces a death pattern in human
carcinoma cell lines that resembles cytotoxic lymphocyte-induced apoptosis.
FEBS Letters, 1994. 353(2): 129-132.
210. Cummings, B.S., Wills, L.P. and Schnellmann, R.G., Measurement of cell death
in mammalian cells. Curr Protoc Pharmacol, 2004. Chapter 12: Unit 12.18.
211. Central Animal Facility (CAF), Faculty of Science Mahidol University. Policies
and guidelines in animal care 2020 [Available from:
https://science.mahidol.ac.th/caf/policies-and-guidelines/. [last accessed 1 Sep
2020].
212. Nghiem, N., Kleff, S. and Schwegmann, S., Succinic acid: Technology
development and commercialization. Fermentation, 2017. 3(2): 26.

168
213. Jain, A.K. and Thareja, S., In vitro and in vivo characterization of pharmaceutical
nanocarriers used for drug delivery. Artif Cells Nanomed Biotechnol, 2019.
47(1): 524-539.
214. You, X., et al., Polymeric nanoparticles for colon cancer therapy: Overview and
perspectives. J Mater Chem B, 2016. 4(48): 7779-7792.
215. Opanasopit, P., et al., Block copolymer design for camptothecin incorporation into
polymeric micelles for passive tumor targeting. Pharm Res, 2004. 21(11): 2001-
2008.
216. Lu, Y., et al., Strategies to improve micelle stability for drug delivery. Nano Res,
2018. 11(10): 4985-4998.
217. Kansom, T., et al., Apoptosis induction and antimigratory activity of
andrographolide analog (3A.1)-incorporated self-assembled nanoparticles in
cancer cells. AAPS PharmSciTech, 2018. 19(7): 3123-3133.
218. Wang, Y., et al., Targeted delivery of 5-fluorouracil to HT-29 cells using high
efficient folic acid-conjugated nanoparticles. Drug Deliv, 2015. 22(2): 191-198.
219. Wei, L., et al., Folate-conjugated pH-responsive nanocarrier designed for active
tumor targeting and controlled release of doxorubicin. Font Mater Sci, 2017.
11(4): 328-343.
220. Karami, N., Moghimipour, E. and Salimi, A., Liposomes as a novel drug delivery
system: Fundamental and pharmaceutical application. Asian J Pharm, 2018. 12:
S31.
221. Rangsimawong, W., et al., Terpene-containing PEGylated liposomes as
transdermal carriers of a hydrophilic compound. Biol Pharm Bull, 2014. 37(12):
1936-1943.
222. Chain, E. and Kemp, I., The isoelectric points of lecithin and sphingomyelin.
Biochem J, 1934. 28(6): 2052-2055.
223. Mare, R., et al., Anchoring property of a novel hydrophilic lipopolymer, HDAS-
SHP, post-inserted in preformed liposomes. Nanomaterials (Basel), 2019. 9(9):
1185.
224. Turner, P.V., et al., Administration of substances to laboratory animals:
equipment considerations, vehicle selection, and solute preparation. J Am Assoc
Lab Anim Sci, 2011. 50(5): 614-627.
225. Fam, S.Y., et al., Stealth coating of nanoparticles in drug delivery systems.
Nanomaterials (Basel), 2020. 10(4): 787.
226. Maurya, S., Effects of pH, salt, temperature on conventional liposomes size
enlargement analyzed by optical microscope. Int J Drug Regul Aff, 2018. 1(1):
10-15.
227. Yadav, A.V., et al., Stability aspects of liposome. Indian J Pharm Educ, 2011. 45:
402-413.
228. Siontorou, C.G., et al., Artificial lipid membranes: Past, present, and future.
Membranes (Basel), 2017. 7(3): 38.
229. Liang, C.-C., Park, A.Y. and Guan, J.-L., In vitro scratch assay: a convenient and
inexpensive method for analysis of cell migration in vitro. Nat Protoc, 2007. 2(2):
329-333.
230. Justus, C.R., et al., In vitro cell migration and invasion assays. J Vis Exp, 2014.
(88): e51046.

169
231. Wang, L., et al., Safety of nanosuspensions in drug delivery. Nanomedicine, 2017.
13(2): 455-469.
232. Yang, H., et al., Pharmaceutical strategies for stabilizing drug nanocrystals. Curr
Pharm Des, 2018. 24(21): 2362-2374.
233. Wang, Y., et al., In vitro and in vivo anticancer activity of a novel puerarin
nanosuspension against colon cancer, with high efficacy and low toxicity. Int J
Pharm, 2013. 441(1-2): 728-735.
234. Sari, R., et al., Development of andrographolide-chitosan solid dispersion system:
Physical characterization, solubility, and dissolution testing. Asian J Pharm,
2019. 13(1): 5-9.
235. Guo, L., et al., A novel nanosuspension of andrographolide: Preparation,
characterization and passive liver target evaluation in rats. Eur J Pharm Sci,
2017. 104: 13-22.
236. Launer, P.J. and Arkles, B. Infrared analysis of organosilicon compounds. In:
Arkles, B. and, Larson, G.L., Editors. Silicon compounds: Silanes & silicones, 3rd
ed. Pennsylvania: Gelest Inc; 2013, p. 175-178.
237. Chen, M., Xie, C. and Liu, L., Solubility of andrographolide in various solvents
from (288.2 to 323.2) K. J Chem Eng Data, 2010. 55(11): 5297-5298.
238. Yan, Y., Fang, L.-H. and Du, G.-H. Andrographolide. In: Du, G.-H., Editor.
Natural small molecule drugs from plants. Shanghai: Springer; 2018, p. 357-362.
239. Teeranachaideekul, V., et al., Development of ascorbyl palmitate nanocrystals
applying the nanosuspension technology. Int J Pharm, 2008. 354(1-2): 227-234.
240. Westen, T.V. and Groot, R.D., Effect of temperature cycling on Ostwald ripening.
Cryst Growth Des, 2018. 18(9): 4952-4962.
241. Hong, J., et al., High drug payload curcumin nanosuspensions stabilized by
mPEG-DSPE and SPC: in vitro and in vivo evaluation. Drug Deliv, 2017. 24(1):
109-120.
242. Kim, H.Y., et al., Paclitaxel-incorporated nanoparticles using block copolymers
composed of poly(ethylene glycol)/poly(3-hydroxyoctanoate). Nanoscale Res Lett,
2014. 9(1): 525.
243. Wang, J., et al., Bufalin inhibits HCT116 colon cancer cells and its orthotopic
xenograft tumor in mice model through genes related to apoptotic and PTEN/AKT
pathways. Gastroenterol Res Pract, 2015. 2015: 457193.

APPENDIX

171
APPENDIX A
1. Standard curve for determination of 3A.1 concentration
Method : HPLC analysis
Analytical column : Phenomenex® C18 column; 5 µm particle size; 250 4.6 mm
Mobile phase : Methanol:water (80:20, v/v)
Flow rate : 1.0 mL/min
UV-Visible detector : 219 nm
Table A.1 Peak area and retention of 3A.1
3A.1 concentration (µg/mL) Retention time (min) Peak area (mAu)
10 25.4370 472.8529
50 25.2940 2295.1702
100 25.1160 4678.8403
150 25.1860 7112.4546
200 25.0090 9444.8203
Figure A.1 Standard curve of 3A.1 analogue, when X and Y refer to 3A.1
concentration and peak area, respectively.

172
Figure A.2 HPLC chromatogram of 3A.1. Its retention time was around 25-26 min.
2. Standard curve for determination of doxorubicin concentration
Method : Fluorescence spectrophotometry
Excitation/emission wavelength : 470/550 nm
Table A.2 Fluorescent intensity of 3A.1
DOX concentration (µg/mL) Fluorescent intensity
0.50 201.11
1.00 376.52
1.50 556.03
2.00 731.87
2.50 931.64

173
Figure A.3 Standard curve of doxorubicin, when X and Y refer to doxorubicin
concentration and fluorescent intensity, respectively.
3. Preparation of solutions
Phosphate-buffered saline (1x PBS, pH 7.4)
For preparation of 1000 mL of PBS (1x), add these chemicals into
approximately 800 mL of ultra-purified water under vigorous stirring;
Ingredient Final concentration (mM) Amount (g/L)
NaCl (58.44 g/mol) 137.00 8.00
KCl (74.55 g/mol) 2.68 0.20
Na2HPO4 (141.96 g/mol) 10.14 1.44
KH2PO4 (136.09 g/mol) 1.47 0.24
The pH of buffer solution was adjusted to 7.4 with diluted HCl or NaOH. Then,
added water to a total volume of 1000 mL in a beaker, dispensed the solution into a
glass bottle and was sterilized by autoclaving (20 min, 121°C, 15 pound per square inch
on liquid cycle). The PBS (pH 7.4) is stored at room temperature.
174
10% Neutral buffered formalin (NBF)
The NBF as a histological fixation solution, was used to fix the animal tissues.
First, the formalin was poured into a beaker to mix with 800 mL of ultra-purified water,
then dissolved salts to obtain clear solution and made the total volume of buffer to 1000
mL with water. The NBF solution is stored at room temperature.
Ingredient Amount (unit/L)
Formalin (38 %w/w CH2O in water) 100.0 mL
NaH2PO4 (monobasic) 6.5 g
KH2PO4 (dibasic) 4.0 g
Preparation of cell culture media
DMEM medium powder and 2.2 g of NaHCO3 was dissolved in 1000 mL of
sterile water for irrigation in a 1000 mL glass beaker and was then adjusted pH solution
to pH 7.4 by NaOH or HCl solution. The solution was filtered through 0.22 µm
membrane filter set. The medium was supplemented with fetal bovine serum (FBS) and
penicillin-streptomycin antibiotics.
Preparation of MTT solution
For preparation of 50 mL of 5 mg/mL of MTT solution, weighed 250 mg (0.25
g) of MTT powder into a plastic tube, added PBS pH 7.4 solution until the final volume
reach 50 mL, mixed by vortexing or sonication until completely dissolved and obtained
yellow solution. Finally, the solution was filtered through 0.22 µm membrane filter into
an amber glass container. Once prepared, the MTT solution can be stored for 4 weeks
at 4°C protected from light while the MTT solution will be stable at -20°C for at least
6 months.

175
APPENDIX B
Table B.1 Entrapment efficiency of 3A.1 into polymeric micelles based on different
amphiphilic chitosan derivatives with initial drug to polymer (5-40%) prepared by a
dropping method.
Amphiphilic CS
derivatives 3A.1 to polymer (%)
%Entrapment efficiency Average SD
n1 n2 n3
NSC
0 - - - - -
5 50.24 46.76 43.84 46.95 2.62
10 56.45 57.60 58.41 57.49 0.80
20 60.84 75.70 81.22 72.59 8.61
40 97.34 80.43 94.74 90.84 7.43
OSC
0 - - - - -
5 43.45 36.20 40.56 40.07 2.98
10 53.32 50.65 53.32 52.43 1.26
20 86.58 79.47 74.35 80.13 5.01
40 93.01 90.96 82.43 88.80 4.58
BSC
0 - - - - -
5 45.36 40.85 38.65 41.62 2.79
10 55.67 46.76 48.90 50.44 3.80
20 76.33 72.14 70.72 73.06 2.38
40 68.76 68.82 65.80 67.79 1.41
Table B.2 Loading capacity of 3A.1 into polymeric micelles based on different
amphiphilic chitosan derivatives with initial drug to polymer (5-40%) prepared by a
dropping method.
Amphiphilic CS
derivatives
3A.1 to
polymer (%)
Loading capacity (µg/mg) Average SD
n1 n2 n3
NSC
0 - - - - -
5 25.12 23.38 21.92 23.47 1.31
10 56.45 57.60 58.41 57.49 0.80
20 121.68 151.40 162.44 145.17 17.21
40 389.36 321.72 378.96 363.35 29.74
OSC
0 - - - - -
5 21.73 18.10 20.28 20.04 1.49
10 53.32 50.65 53.32 52.43 1.26
20 173.16 158.94 148.70 160.27 10.03
40 372.04 363.84 329.72 355.20 18.33
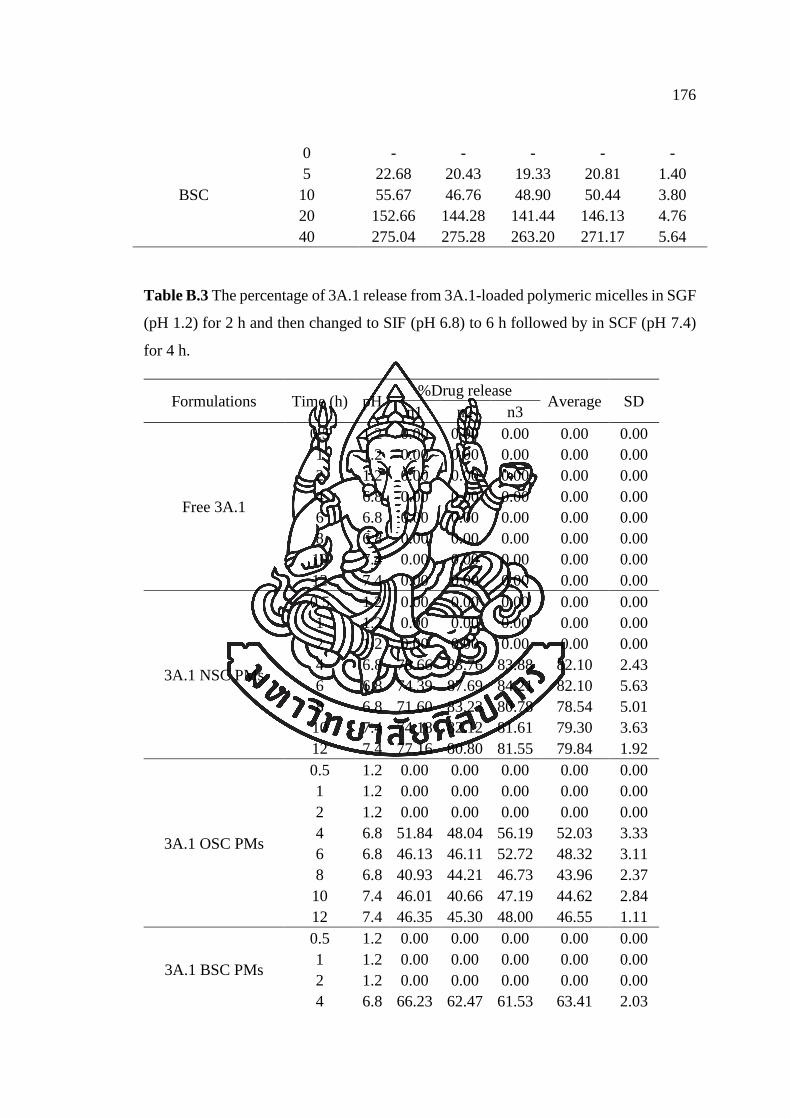
176
BSC
0 - - - - -
5 22.68 20.43 19.33 20.81 1.40
10 55.67 46.76 48.90 50.44 3.80
20 152.66 144.28 141.44 146.13 4.76
40 275.04 275.28 263.20 271.17 5.64
Table B.3 The percentage of 3A.1 release from 3A.1-loaded polymeric micelles in SGF
(pH 1.2) for 2 h and then changed to SIF (pH 6.8) to 6 h followed by in SCF (pH 7.4)
for 4 h.
Formulations Time (h) pH %Drug release
Average SD n1 n2 n3
Free 3A.1
0.5 1.2 0.00 0.00 0.00 0.00 0.00
1 1.2 0.00 0.00 0.00 0.00 0.00
2 1.2 0.00 0.00 0.00 0.00 0.00
4 6.8 0.00 0.00 0.00 0.00 0.00
6 6.8 0.00 0.00 0.00 0.00 0.00
8 6.8 0.00 0.00 0.00 0.00 0.00
10 7.4 0.00 0.00 0.00 0.00 0.00
12 7.4 0.00 0.00 0.00 0.00 0.00
3A.1 NSC PMs
0.5 1.2 0.00 0.00 0.00 0.00 0.00
1 1.2 0.00 0.00 0.00 0.00 0.00
2 1.2 0.00 0.00 0.00 0.00 0.00
4 6.8 78.66 83.76 83.88 82.10 2.43
6 6.8 74.39 87.69 84.21 82.10 5.63
8 6.8 71.60 83.23 80.78 78.54 5.01
10 7.4 74.18 82.12 81.61 79.30 3.63
12 7.4 77.16 80.80 81.55 79.84 1.92
3A.1 OSC PMs
0.5 1.2 0.00 0.00 0.00 0.00 0.00
1 1.2 0.00 0.00 0.00 0.00 0.00
2 1.2 0.00 0.00 0.00 0.00 0.00
4 6.8 51.84 48.04 56.19 52.03 3.33
6 6.8 46.13 46.11 52.72 48.32 3.11
8 6.8 40.93 44.21 46.73 43.96 2.37
10 7.4 46.01 40.66 47.19 44.62 2.84
12 7.4 46.35 45.30 48.00 46.55 1.11
3A.1 BSC PMs
0.5 1.2 0.00 0.00 0.00 0.00 0.00
1 1.2 0.00 0.00 0.00 0.00 0.00
2 1.2 0.00 0.00 0.00 0.00 0.00
4 6.8 66.23 62.47 61.53 63.41 2.03

177
6 6.8 67.82 60.02 59.15 62.33 3.90
8 6.8 64.19 57.26 55.39 58.95 3.79
10 7.4 63.51 55.72 51.07 56.77 5.13
12 7.4 60.60 53.38 49.81 54.60 4.49
3A.1 Fol-NSC PMs
0.5 1.2 0.00 0.00 0.00 0.00 0.00
1 1.2 0.00 0.00 0.00 0.00 0.00
2 1.2 0.00 0.00 0.00 0.00 0.00
4 6.8 78.15 51.70 35.51 55.12 17.57
6 6.8 66.47 43.46 41.12 50.35 11.44
8 6.8 65.83 44.88 41.83 50.85 10.67
10 7.4 64.07 40.41 43.22 49.23 10.55
12 7.4 63.75 46.99 46.89 52.55 7.92
Table B.4 The particle size, zeta potential, and relative %drug remaining of 3A.1-
loaded polymeric micelles stored at a 5 ± 3ºC, 60 ± 5%RH (long-term condition) for 6
months.
Formulations Period time
(month)
Particle size
(nm)
Zeta potential
(mV)
%Drug
remaining
3A.1 NSC
PMs
0 167.77 ± 11.29 (-) 30.43 ± 0.76 100.00 ± 1.20
1 154.00 ± 2.36 (-) 31.13 ± 0.42 102.25 ± 1.45
2 144.10 ± 3.72 (-) 33.93 ± 1.73 100.81 ± 1.56
4 146.67 ± 3.38 (-) 31.60 ± 0.38 100.91 ± 2.30
6 144.30 ± 4.50 (-) 34.73 ± 1.17 93.65 ± 2.69
3A.1 OSC
PMs
0 184.50 ± 2.91 (-) 32.13 ± 0.41 100.00 ± 1.60
1 182.33 ± 8.83 (-) 29.80 ± 0.37 96.91 ± 2.12
2 172.50 ± 1.23 (-) 30.40 ± 0.71 92.84 ± 1.76
4 174.30 ± 1.65 (-) 28.60 ± 1.65 89.12 ± 2.65
6 178.23 ± 3.22 (-) 26.90 ± 1.06 87.22 ± 2.85
3A.1 BSC
PMs
0 143.73 ± 2.26 (-) 32.80 ± 2.41 100.00 ± 1.80
1 154.80 ± 1.61 (-) 33.00 ± 0.22 101.73 ± 3.09
2 141.60 ± 1.00 (-) 34.13 ± 1.14 92.95 ± 2.89
4 140.47 ± 0.58 (-) 33.07 ± 0.58 91.52 ± 2.88
6 140.60 ± 1.18 (-) 33.57 ± 0.83 85.67 ± 3.15

178
Table B.5 The particle size, zeta potential, and relative %drug remaining of 3A.1-
loaded polymeric micelles stored at 25 ± 2ºC, 60 ± 5%RH (accelerated condition) for 6
months.
Formulations Period time
(month)
Particle size
(nm)
Zeta potential
(mV)
%Drug
remaining
3A.1 NSC
PMs
0 165.77 ± 11.29 (-) 30.43 ± 0.76 100.00 ± 1.30
1 151.93 ± 1.73 (-) 33.63 ± 1.64 95.58 ± 2.30
2 150.50 ± 4.69 (-) 31.70 ± 2.71 88.70 ± 2.56
4 144.00 ± 1.59 (-) 27.97 ± 2.19 89.53 ± 2.64
6 157.17 ± 5.03 (-) 32.10 ± 2.07 81.64 ± 2.87
3A.1 OSC
PMs
0 184.50 ± 2.91 (-) 32.13 ± 0.41 100.00 ± 1.50
1 162.77 ± 1.99 (-) 26.00 ± 2.19 92.15 ± 2.50
2 160.50 ± 1.63 (-) 29.40 ± 0.36 76.47 ± 2.87
4 167.17 ± 4.11 (-) 28.53 ± 1.91 75.02 ± 3.02
6 182.20 ± 1.69 (-) 32.93 ± 4.72 68.27 ± 3.26
3A.1 BSC
PMs
0 143.73 ± 2.26 (-) 32.80 ± 2.41 100.00 ± 1.75
1 154.30 ± 5.95 (-) 30.60 ± 0.59 85.67 ± 2.80
2 159.13 ± 0.47 (-) 33.73 ± 0.38 71.61 ± 3.10
4 153.40 ± 2.65 (-) 28.97 ± 0.52 61.17 ± 3.22
6 184.60 ± 0.53 (-) 27.47 ± 0.94 53.62 ± 3.36
In vitro cytotoxicity of 3A.1-loaded polymeric micelles
Table B.6 The %cell viability of HT29 exposed by free 3A.1 for 36 h.
Concentration
(µg/mL)
%Cell viability Average SD
n1 n2 n3 n4 n5
Control 103.5
4 96.02 97.86 97.80 104.78 100.00 3.48
0.1 95.12 94.28 96.21 93.29 92.64 94.31 1.27
0.3 91.41 84.37 86.03 85.73 77.45 85.00 4.47
0.5 85.79 85.49 85.97 76.20 74.90 81.67 5.01
1 66.50 74.19 72.12 71.06 67.03 70.18 2.97
2 63.78 55.91 58.93 64.84 64.25 61.54 3.52
4 25.14 26.03 26.33 25.44 25.68 25.72 0.42
8 21.89 23.49 22.54 22.54 23.96 22.88 0.74
16 20.89 22.01 21.12 21.71 23.96 21.94 1.09

179
Table B.7 The %cell viability of HT29 exposed by 3A.1 NSC PMs for 36 h.
Conc.
(µg/mL)
%Cell viability Average SD
n1 n2 n3 n4 n5
Control 95.61 105.05 95.85 103.31 100.18 100.00 3.82
0.1 96.75 89.48 79.98 87.49 106.86 92.11 9.10
0.3 92.96 87.91 81.42 99.04 102.16 92.70 7.48
0.5 85.09 89.06 84.13 93.27 83.76 87.06 3.63
1 56.64 58.03 45.76 73.54 54.72 57.74 8.98
2 27.24 27.60 24.41 25.32 26.88 26.29 1.22
4 21.47 21.41 20.20 21.35 21.05 21.09 0.47
8 17.62 20.08 20.32 18.76 20.26 19.41 1.06
16 18.28 18.94 17.20 17.44 18.94 18.16 0.73
Table B.8 The %cell viability of HT29 exposed by 3A.1 OSC PMs for 36 h.
Conc.
(µg/mL)
%Cell viability Average SD
n1 n2 n3 n4 n5
Control 106.00 100.31 95.35 98.41 99.94 100.00 3.47
0.1 100.98 93.82 95.65 100.24 121.79 102.50 10.02
0.3 98.04 91.25 85.37 99.63 96.57 94.17 5.23
0.5 100.55 87.39 85.19 82.25 91.49 89.38 6.35
1 50.06 51.04 46.45 47.80 54.65 50.00 2.83
2 47.43 33.72 31.64 33.48 34.94 36.24 5.69
4 30.91 28.03 26.38 30.17 27.42 28.58 1.70
8 24.30 25.95 23.87 23.99 26.07 24.83 0.97
16 24.48 22.89 24.85 25.09 23.26 24.11 0.88
Table B.9 The %cell viability of HT29 exposed by 3A.1 BSC PMs for 36 h.
Conc.
(µg/mL)
%Cell viability Average SD
n1 n2 n3 n4 n5
Control 104.70 93.31 105.64 99.78 96.57 100.00 4.70
0.1 103.93 97.57 103.26 97.40 111.17 102.67 5.06
0.3 81.80 86.62 76.77 87.83 96.63 85.93 6.62
0.5 76.33 70.96 73.56 78.48 80.42 75.95 3.38
1 49.45 35.34 55.25 47.35 53.82 48.24 7.06
2 40.60 27.65 32.74 24.06 27.10 30.43 5.80
4 40.60 20.30 19.75 19.03 18.75 23.68 8.47
8 21.85 21.96 20.80 19.75 21.46 21.16 0.82

180
16 20.74 22.01 20.80 20.35 21.18 21.02 0.56
Table B.10 The %cell viability of HT29 exposed by 3A.1 Fol-NSC PMs for 36 h.
Conc.
(µg/mL)
%Cell viability Average SD
n1 n2 n3 n4 n5
Control 108.59 105.48 101.98 88.38 95.57 100.00 7.24
0.1 99.54 97.29 99.21 93.46 86.99 95.30 4.68
0.3 79.11 88.90 83.75 79.99 96.17 85.59 6.32
0.5 51.25 53.63 53.17 44.58 63.47 53.22 6.06
1 38.90 48.22 44.85 40.95 52.77 45.14 4.99
2 37.85 36.39 34.87 39.96 40.49 37.91 2.12
4 29.59 25.23 25.56 22.79 25.17 25.67 2.20
8 25.43 24.24 23.18 21.14 21.40 23.08 1.64
16 24.17 22.13 21.07 21.73 20.74 21.97 1.21
Table B.11 The half-maximal inhibitory drug concentration (IC50) of free 3A.1 and
3A.1-loaded polymeric micelles against HT29 for 36 h.
Treatments IC50 value (µg/mL)
Average SD n1 n2 n3
Free 3A.1 4.253 3.336 3.860 3.816 0.376
3A.1 NSC PMs 0.986 0.963 1.123 1.024 0.071
3A.1 OSC PMs 0.568 0.700 0.811 0.693 0.099
3A.1 BSC PMs 0.539 0.507 0.568 0.538 0.025
3A.1 Fol-NSC PMs 0.490 0.369 0.376 0.412 0.056
Inhibition of cell migration of 3A.1-loaded polymeric micelles
Table B.12 The rate of HN22 cell migration calculated from scratch assay.
Treatments Cell migration rate (µm/h)
Average SD n1 n2 n3
Control 38.21 36.28 41.64 38.71 2.22
0.1% DMSO 38.31 35.03 41.08 38.14 2.47
Free 3A.1 17.71 13.68 19.82 17.07 2.55
3A.1 NSC PMs 12.07 8.75 12.60 11.14 1.70
3A.1 OSC PMs 12.16 10.36 14.41 12.31 1.66
3A.1 BSC PMs 13.42 10.89 16.46 13.59 2.28

181
Table B.13 The percentage of wound closure in HN22 cell calculated from scratch
assay.
Treatments %Wound closure
Average SD n1 n2 n3
Control 76.56 74.83 82.43 77.94 3.25
0.1% DMSO 76.81 72.76 84.16 77.91 4.72
Free 3A.1 30.25 30.06 33.56 31.29 1.61
3A.1 NSC PMs 20.28 20.07 24.24 21.53 1.92
3A.1 OSC PMs 21.62 20.33 26.75 22.90 2.77
3A.1 BSC PMs 23.74 21.24 28.31 24.43 2.93
Table B.14 The mean fluorescent intensity (MFI) of free Dox and Dox-loaded
polymeric micelles in HT29 for 24 h. These values were detected by flow cytometry
analysis.
Treatments Mean fluorescent intensity
Average SD n1 n2 n3
Control 835 819 705 786.33 57.88
Empty NSC PMs 821 877 733 810.33 59.27
Free Dox 1797 1502 1782 1693.67 135.67
Dox-loaded NSC PMs 1923 2043 2375 2113.67 191.17

182
APPENDIX C
Table C.1 The percentage of encapsulation efficiency of 3A.1 into liposomes with
initial drug molar ratios (0-4.0) prepared by thin-film hydration and sonication method.
Formulations 3A.1
(mM)
% EE Average SD
n1 n2 n3
Con LPs
(PC : Chol : DSPE-
PEG2000, 10:2:0)
0 - - - - -
0.05 57.05 59.28 56.53 57.62 1.19
1 57.56 60.02 55.55 57.71 1.83
2 63.24 62.11 61.49 62.28 0.72
3 48.68 46.86 48.64 48.06 0.85
4 36.20 35.21 35.45 35.62 0.42
0.125-PEG LPs
(PC : Chol : DSPE-
PEG2000, 10:2:0.125)
0 - - - - -
0.05 71.35 76.32 71.93 73.20 2.22
1 74.86 78.46 74.77 76.03 1.72
2 71.17 68.63 67.83 69.21 1.42
3 57.61 58.21 56.62 57.48 0.66
4 41.77 41.02 40.75 41.18 0.43
0.25 PEG LPs
(PC : Chol : DSPE-
PEG2000, 10:2:0.25)
0 - - - - -
0.05 80.87 75.37 79.44 78.56 2.33
1 80.58 73.78 78.83 77.73 2.88
2 72.56 70.42 72.42 71.80 0.98
3 61.03 58.64 61.05 60.24 1.13
4 44.75 45.80 46.01 45.52 0.55
0.50 PEG LPs
(PC : Chol : DSPE-
PEG2000, 10:2:0.50)
0 - - - - -
0.05 70.67 72.65 72.50 71.94 0.90
1 68.42 71.96 70.91 70.43 1.48
2 66.64 68.62 69.22 68.16 1.10
3 59.04 60.37 64.19 61.20 2.18
4 45.83 46.30 40.80 44.31 2.49

183
Table C.2 The loading capacity of 3A.1 into liposomes with initial drug molar ratios
(0-4.0) prepared by thin-film hydration and sonication method.
Formulations 3A.1
(mM)
% EE Average SD
n1 n2 n3
Con LPs
(PC : Chol : DSPE-
PEG2000, 10:2:0)
0 - - - - -
0.05 20.36 20.85 20.47 20.56 0.21
1 41.08 41.57 40.92 41.19 0.28
2 90.29 90.56 85.88 88.91 2.15
3 104.24 104.31 100.21 102.92 1.92
4 103.37 100.07 98.45 100.63 2.05
0.125-PEG LPs
(PC : Chol : DSPE-
PEG2000, 10:2:0.125)
0 - - - - -
0.05 26.07 28.21 25.97 26.75 1.03
1 51.31 54.35 50.67 52.11 1.61
2 97.56 94.23 92.85 94.88 1.98
3 120.80 115.36 118.47 118.21 2.23
4 114.51 109.57 114.62 112.90 2.36
0.25 PEG LPs
(PC : Chol : DSPE-
PEG2000, 10:2:0.25)
0 - - - - -
0.05 26.65 24.43 26.59 25.89 1.03
1 53.11 47.21 53.37 51.23 2.84
2 95.65 90.23 98.07 94.65 3.28
3 120.68 116.79 119.89 119.12 1.68
4 117.99 119.38 116.63 118.00 1.12
0.50 PEG LPs
(PC : Chol : DSPE-
PEG2000, 10:2 0.50)
0 - - - - -
0.05 21.63 23.53 20.90 22.02 1.11
1 41.88 46.58 42.73 43.73 2.04
2 81.59 86.32 82.44 83.45 2.06
3 108.45 114.64 114.14 112.41 2.81
4 112.22 119.53 115.80 115.85 2.98
Table C.3 The percentage of 3A.1 release from 3A.1-loaded liposomes in PBS (pH
7.4) for 24 h.
Formulations Time (h) %Drug release
Average SD n1 n2 n3
Free 3A.1
0.5 84.31 85.56 89.39 86.42 2.16
1 90.00 92.33 95.32 92.55 2.18
2 90.05 94.58 96.51 93.71 2.71
4 92.98 96.62 97.26 95.62 1.88

184
8 96.12 97.25 100.37 97.91 1.80
12 97.26 98.24 100.50 98.67 1.36
24 99.59 99.01 100.90 99.83 0.79
3A.1-Con LPs
0.5 37.04 33.32 36.26 35.54 1.60
1 54.21 47.53 53.24 51.66 2.95
2 84.76 79.85 84.63 83.08 2.28
4 86.84 95.17 88.65 90.22 3.58
8 91.38 96.74 95.01 94.38 2.23
12 94.40 98.43 97.85 96.89 1.78
24 100.42 98.05 100.05 99.51 1.04
3A.1-0.125 PEG
LPs
0.5 31.24 33.21 27.68 30.71 2.29
1 41.56 44.13 38.05 41.25 2.49
2 55.47 60.02 52.19 55.89 3.21
4 65.72 72.12 62.13 66.66 4.13
8 71.01 74.41 67.19 70.87 2.95
12 74.41 77.11 69.21 73.58 3.28
24 76.18 80.91 72.52 76.54 3.43
3A.1-0.25 PEG
LPs
0.5 24.21 18.42 19.18 20.60 2.57
1 36.54 31.35 32.14 33.34 2.28
2 54.55 47.53 49.67 50.58 2.94
4 60.85 56.25 58.44 58.51 1.88
8 67.72 61.67 64.04 64.48 2.49
12 69.22 64.51 65.91 66.55 1.97
24 71.53 65.04 66.42 67.66 2.79
3A.1-0.50 PEG
LPs
0.5 28.21 26.18 22.21 25.53 2.49
1 41.54 38.71 36.35 38.87 2.12
2 55.33 53.22 50.12 52.89 2.14
4 63.52 61.91 57.25 60.89 2.66
8 70.62 68.21 66.38 68.40 1.74
12 73.57 71.76 67.25 70.86 2.66
24 75.68 73.28 70.35 73.10 2.18

185
Table C.4 The vesicle size, zeta potential, and relative %drug remaining of 3A.1-
loaded liposomes stored at a 5 ± 3ºC, 60 ± 5%RH (long-term condition) for 6 months.
Formulations Period time
(month)
Vesicle size
(nm)
Zeta potential
(mV)
%Drug
remaining
3A.1-Con
LPs
0 143.77 ± 4.35 (-) 8.35 ± 0.76 100.00 ± 5.71
1 140.97 ± 1.38 (-) 8.08 ± 0.49 94.62 ± 1.81
2 146.10 ± 2.65 (-) 7.96 ± 0.58 91.88 ± 1.45
4 157.40 ± 5.35 (-) 7.23 ± 0.98 88.62 ± 2.74
6 167.87 ± 6.75 (-) 6.74 ± 0.72 84.27 ± 2.77
3A.1-
0.25PEG LPs
0 115.33 ± 3.08 (-) 14.43 ± 0.74 100.00 ± 3.43
1 117.65 ± 3.83 (-) 14.73 ± 0.80 96.43 ± 1.32
2 121.53 ± 2.71 (-) 14.57 ± 1.08 94.36 ± 1.46
4 127.79 ± 4.12 (-) 13.22 ± 0.98 90.42 ± 1.42
6 134.45 ± 4.53 (-) 12.83 ± 1.21 89.13 ± 1.53
Table C.5 The vesicle size, zeta potential, and relative %drug remaining of 3A.1-
loaded liposomes stored at 25 ± 2ºC, 60 ± 5%RH (accelerated condition) for 6 months.
Formulations Period time
(month)
Vesicle size
(nm)
Zeta potential
(mV)
%Drug
remaining
3A.1-Con
LPs
0 143.77 ± 4.35 (-) 8.35 ± 0.76 100.00 ± 5.71
1 174.86 ± 4.86 (-) 7.44 ± 0.56 70.24 ± 4.33
2 198.53 ± 5.73 (-) 7.65 ± 1.67 62.63 ± 4.62
4 267.73 ± 5.84 (-) 7.04 ± 0.85 58.04 ± 5.41
6 323.54 ± 7.57 (-) 6.73 ± 1.80 54.37 ± 5.27
3A.1-
0.25PEG LPs
0 115.33 ± 3.08 (-) 14.43 ± 0.74 100.00 ± 3.43
1 125.46 ± 4.05 (-) 13.51 ± 0.85 75.38 ± 3.72
2 136.58 ± 4.39 (-) 13.10 ± 0.94 70.53 ± 3.64
4 151.83 ± 4.91 (-) 12.68 ± 0.83 65.85 ± 4.11
6 179.96 ± 5.12 (-) 11.72 ± 1.11 60.38 ± 4.28

186
In vitro cytotoxicity of 3A.1-loaded liposomes against HCT116
Table C.6 The %cell viability of HCT116 exposed by free 3A.1 for 24 h.
Conc.
(µg/mL)
%Cell viability Average SD
n1 n2 n3 n4 n5
Control 95.10 99.88 103.61 104.78 96.62 100.00 3.78
0.1 98.48 104.55 93.12 100.47 97.90 98.90 3.71
0.3 97.09 95.22 87.18 92.89 96.04 93.68 3.53
0.5 88.00 90.09 83.80 88.34 87.06 87.46 2.08
1 63.87 73.19 69.00 74.83 66.67 69.51 4.05
2 58.62 61.31 60.37 62.24 61.66 60.84 1.26
4 48.48 49.18 49.30 50.35 46.04 48.67 1.45
8 34.73 24.24 25.17 26.69 26.46 27.46 3.74
16 16.90 18.76 19.58 17.37 16.55 17.83 1.15
Table C.7 The %cell viability of HCT116 exposed by 3A.1-Con LPs for 24 h.
Conc.
(µg/mL)
%Cell viability Average SD
n1 n2 n3 n4 n5
Control 101.80 95.79 102.78 99.83 99.80 100.00 2.40
0.1 104.11 105.80 95.01 90.23 100.31 99.09 5.78
0.3 97.59 101.73 93.25 101.36 99.56 98.70 3.10
0.5 93.89 95.79 95.18 94.57 95.08 94.90 0.64
1 87.85 87.82 84.90 93.82 82.83 87.44 3.71
2 74.41 76.45 78.55 84.63 80.32 78.87 3.49
4 36.21 38.62 42.35 39.12 38.95 39.05 1.96
8 18.60 13.91 13.13 12.01 10.35 13.60 2.77
16 5.87 6.18 6.04 6.18 6.24 6.10 0.13
Table C.8 The %cell viability of HCT116 exposed by 3A.1-0.25 PEG LPs for 24 h.
Conc.
(µg/mL)
%Cell viability Average SD
n1 n2 n3 n4 n5
Control 100.38 97.84 101.17 103.08 97.53 100.00 2.09
0.1 98.40 101.89 93.48 97.45 96.89 97.62 2.70
0.3 91.98 95.39 97.84 92.06 85.95 92.64 4.00
0.5 91.18 96.89 91.34 92.53 83.33 91.06 4.38
1 74.45 76.20 78.81 73.26 74.61 75.47 1.92
2 31.80 35.68 39.25 36.08 38.46 36.25 2.61
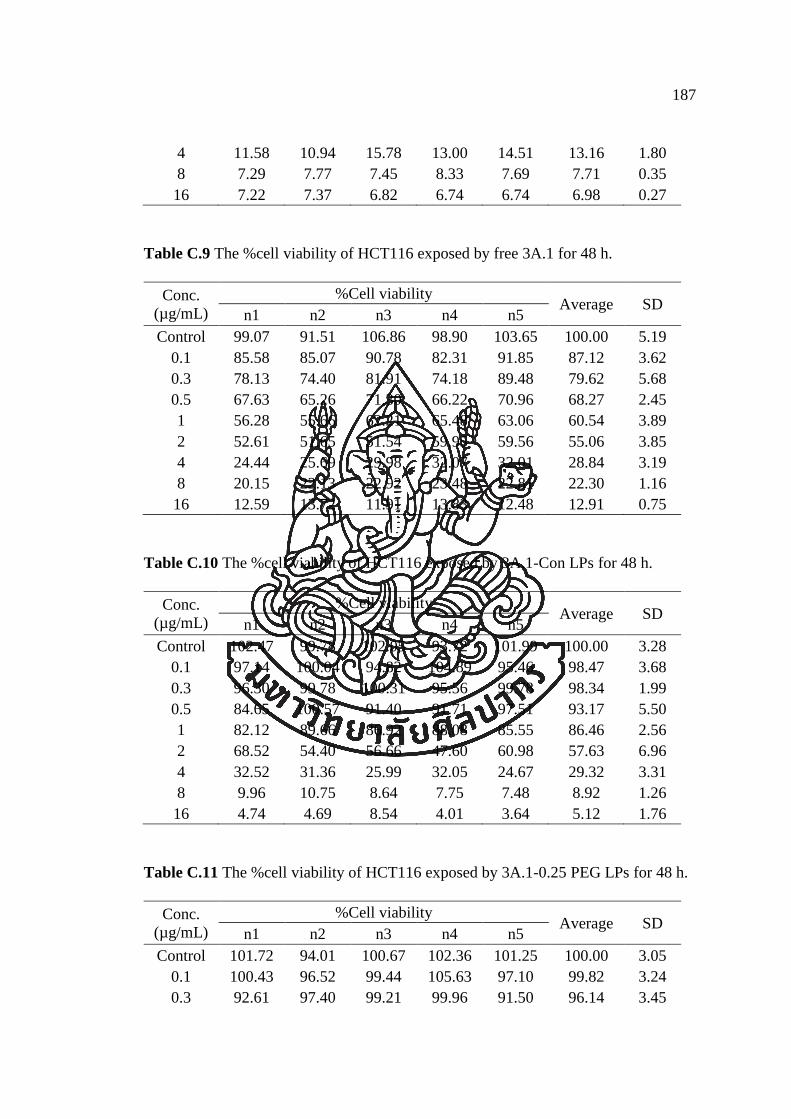
187
4 11.58 10.94 15.78 13.00 14.51 13.16 1.80
8 7.29 7.77 7.45 8.33 7.69 7.71 0.35
16 7.22 7.37 6.82 6.74 6.74 6.98 0.27
Table C.9 The %cell viability of HCT116 exposed by free 3A.1 for 48 h.
Conc.
(µg/mL)
%Cell viability Average SD
n1 n2 n3 n4 n5
Control 99.07 91.51 106.86 98.90 103.65 100.00 5.19
0.1 85.58 85.07 90.78 82.31 91.85 87.12 3.62
0.3 78.13 74.40 81.91 74.18 89.48 79.62 5.68
0.5 67.63 65.26 71.30 66.22 70.96 68.27 2.45
1 56.28 55.66 62.21 65.48 63.06 60.54 3.89
2 52.61 51.65 51.54 59.95 59.56 55.06 3.85
4 24.44 25.69 29.98 32.07 32.01 28.84 3.19
8 20.15 22.13 22.92 23.48 22.81 22.30 1.16
16 12.59 13.72 11.91 13.83 12.48 12.91 0.75
Table C.10 The %cell viability of HCT116 exposed by 3A.1-Con LPs for 48 h.
Conc.
(µg/mL)
%Cell viability Average SD
n1 n2 n3 n4 n5
Control 102.47 99.78 102.05 93.72 101.99 100.00 3.28
0.1 97.14 100.04 94.82 104.89 95.46 98.47 3.68
0.3 96.30 99.78 100.31 95.56 99.78 98.34 1.99
0.5 84.65 100.57 91.40 91.71 97.51 93.17 5.50
1 82.12 89.66 86.92 88.08 85.55 86.46 2.56
2 68.52 54.40 56.66 47.60 60.98 57.63 6.96
4 32.52 31.36 25.99 32.05 24.67 29.32 3.31
8 9.96 10.75 8.64 7.75 7.48 8.92 1.26
16 4.74 4.69 8.54 4.01 3.64 5.12 1.76
Table C.11 The %cell viability of HCT116 exposed by 3A.1-0.25 PEG LPs for 48 h.
Conc.
(µg/mL)
%Cell viability Average SD
n1 n2 n3 n4 n5
Control 101.72 94.01 100.67 102.36 101.25 100.00 3.05
0.1 100.43 96.52 99.44 105.63 97.10 99.82 3.24
0.3 92.61 97.40 99.21 99.96 91.50 96.14 3.45

188
0.5 84.02 89.98 98.39 98.04 89.10 91.91 5.54
1 68.78 68.20 76.08 66.86 71.59 70.30 3.27
2 27.39 28.90 33.40 28.26 23.65 28.32 3.12
4 20.32 20.09 24.41 21.72 17.98 20.90 2.12
8 13.90 17.05 17.23 12.03 12.79 14.60 2.16
16 6.54 5.61 8.64 7.12 10.28 7.64 1.65
Table C.12 The half-maximal inhibitory drug concentration (IC50) of free 3A.1 and
3A.1-loaded liposomes against HCT116 for 24 h.
Treatments IC50 value (µg/mL)
Average SD n1 n2 n3
Free 3A.1 3.539 3.894 4.103 3.845 0.233
3A.1-Con LPs 2.391 3.325 3.298 3.005 0.434
3A.1-0.25 PEG LPs 1.538 1.553 1.706 1.599 0.076
Table C.13 The half-maximal inhibitory drug concentration (IC50) of free 3A.1 and
3A.1-loaded liposomes against HCT116 for 48 h.
Treatments IC50 value (µg/mL)
Average SD n1 n2 n3
Free 3A.1 2.468 2.262 2.587 2.439 0.134
3A.1-Con LPs 1.256 1.820 1.567 1.548 0.231
3A.1-0.25PEG LPs 1.572 1.221 1.207 1.333 0.169
In vitro cytotoxicity of 3A.1-loaded liposomes against HT29
Table C.14 The %cell viability of HCT116 exposed by free 3A.1 for 24 h.
Conc.
(µg/mL)
%Cell viability Average SD
n1 n2 n3 n4 n5
Control 97.53 107.45 98.05 100.31 96.66 100.00 3.92
0.1 97.53 98.75 89.86 95.26 92.82 94.85 3.21
0.3 90.34 92.46 89.35 88.84 90.23 90.24 1.24
0.5 85.39 86.43 83.19 86.34 84.95 85.26 1.18
1 75.93 78.89 79.43 72.10 73.84 76.04 2.83
2 65.43 68.73 65.43 65.43 67.90 66.58 1.44
4 56.32 59.87 54.57 60.34 52.57 56.73 3.00
8 45.11 46.67 42.84 40.58 47.89 44.62 2.63

189
16 21.94 20.72 20.90 21.94 18.81 20.86 1.15
Table C.15 The %cell viability of HCT116 exposed by 3A.1-Con LPs for 24 h.
Conc.
(µg/mL)
%Cell viability Average SD
n1 n2 n3 n4 n5
Control 94.83 107.20 95.46 100.31 102.19 100.00 4.56
0.1 95.61 92.40 100.00 89.82 102.74 96.12 4.75
0.3 87.24 99.77 94.13 96.08 97.26 94.89 4.24
0.5 91.93 95.22 95.14 89.66 99.14 94.22 3.23
1 90.84 87.47 89.98 85.43 88.96 88.54 1.91
2 77.37 82.93 86.69 76.27 71.18 78.89 5.40
4 51.29 57.40 52.39 58.89 60.38 56.07 3.60
8 40.02 40.41 39.15 41.19 42.52 40.66 1.14
16 19.81 21.06 26.78 30.23 24.90 24.56 3.79
Table C.16 The %cell viability of HCT116 exposed by 3A.1-0.25 PEG LPs for 24 h.
Conc.
(µg/mL)
%Cell viability Average SD
n1 n2 n3 n4 n5
Control 105.22 103.58 86.34 111.95 92.91 100.00 9.16
0.1 86.18 90.77 103.82 79.94 96.77 91.50 8.27
0.3 86.67 96.77 93.65 92.17 88.31 91.51 3.64
0.5 88.72 93.40 96.27 80.19 82.24 88.16 6.20
1 75.76 67.22 75.43 70.83 74.61 72.77 3.28
2 43.42 40.13 42.84 42.02 39.72 41.63 1.46
4 39.40 25.11 29.63 31.93 26.67 30.55 5.01
8 29.30 30.94 28.07 25.11 26.02 27.89 2.12
16 14.53 21.26 11.49 15.59 24.54 17.48 4.74
Table C.17 The %cell viability of HCT116 exposed by free 3A.1 for 48 h.
Conc.
(µg/mL)
%Cell viability Average SD
n1 n2 n3 n4 n5
Control 95.27 101.30 97.44 99.60 106.39 100.00 3.78
0.1 86.32 84.72 85.38 86.02 84.22 85.33 0.78
0.3 75.20 79.52 74.23 75.51 74.27 75.75 1.95
0.5 66.86 69.80 67.33 65.47 72.42 68.38 2.46
1 59.34 62.80 59.35 58.34 59.25 59.82 1.54
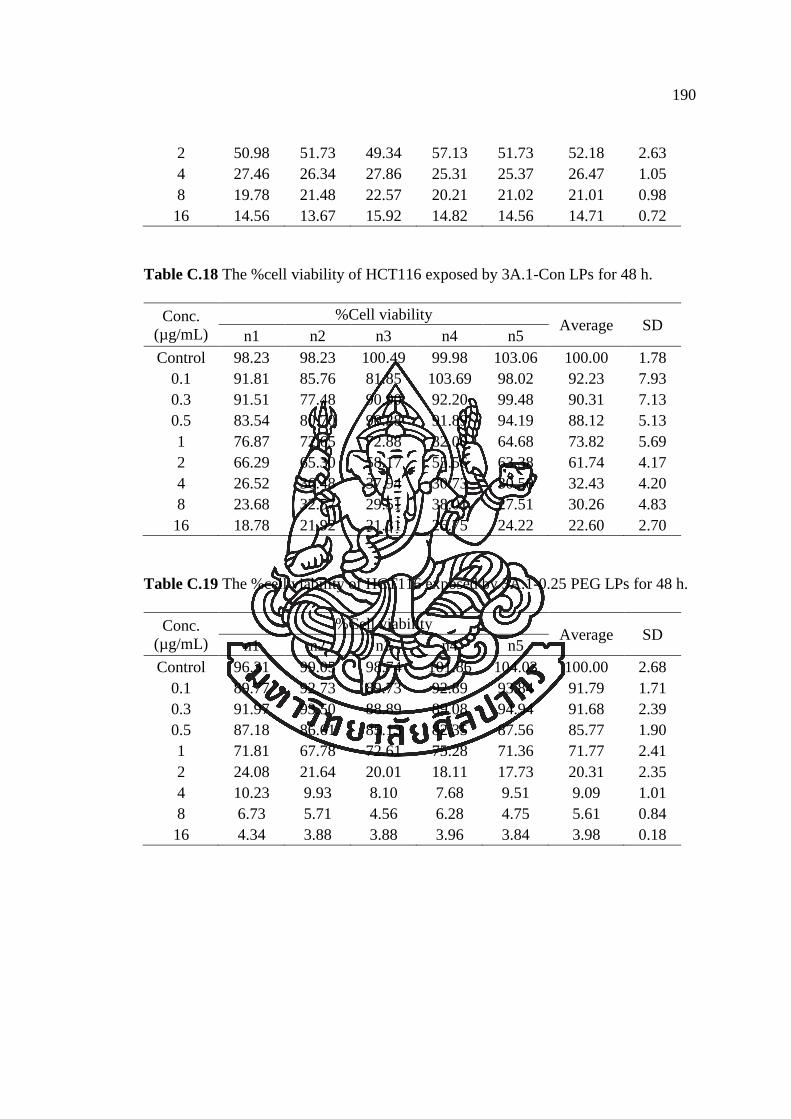
190
2 50.98 51.73 49.34 57.13 51.73 52.18 2.63
4 27.46 26.34 27.86 25.31 25.37 26.47 1.05
8 19.78 21.48 22.57 20.21 21.02 21.01 0.98
16 14.56 13.67 15.92 14.82 14.56 14.71 0.72
Table C.18 The %cell viability of HCT116 exposed by 3A.1-Con LPs for 48 h.
Conc.
(µg/mL)
%Cell viability Average SD
n1 n2 n3 n4 n5
Control 98.23 98.23 100.49 99.98 103.06 100.00 1.78
0.1 91.81 85.76 81.85 103.69 98.02 92.23 7.93
0.3 91.51 77.48 90.90 92.20 99.48 90.31 7.13
0.5 83.54 80.70 90.28 91.89 94.19 88.12 5.13
1 76.87 72.65 72.88 82.00 64.68 73.82 5.69
2 66.29 65.30 58.17 55.56 63.38 61.74 4.17
4 26.52 36.48 37.94 30.73 30.50 32.43 4.20
8 23.68 32.57 29.51 38.01 27.51 30.26 4.83
16 18.78 21.92 21.31 26.75 24.22 22.60 2.70
Table C.19 The %cell viability of HCT116 exposed by 3A.1-0.25 PEG LPs for 48 h.
Conc.
(µg/mL)
%Cell viability Average SD
n1 n2 n3 n4 n5
Control 96.31 99.05 98.74 101.86 104.03 100.00 2.68
0.1 89.77 92.73 89.73 92.89 93.84 91.79 1.71
0.3 91.97 93.50 88.89 89.08 94.94 91.68 2.39
0.5 87.18 86.61 85.13 82.35 87.56 85.77 1.90
1 71.81 67.78 72.61 75.28 71.36 71.77 2.41
2 24.08 21.64 20.01 18.11 17.73 20.31 2.35
4 10.23 9.93 8.10 7.68 9.51 9.09 1.01
8 6.73 5.71 4.56 6.28 4.75 5.61 0.84
16 4.34 3.88 3.88 3.96 3.84 3.98 0.18

191
Table C.20 The half-maximal inhibitory drug concentration (IC50) of free 3A.1 and
3A.1-loaded liposomes against HT29 for 24 h.
Treatments IC50 value (µg/mL)
Average SD n1 n2 n3
Free 3A.1 3.967 4.217 4.419 4.201 0.185
3A.1-Con LPs 4.322 4.684 3.547 4.184 0.474
3A.1-0.25PEG LPs 1.419 2.009 1.402 1.610 0.282
Table C.21 The half-maximal inhibitory drug concentration (IC50) of free 3A.1 and
3A.1-loaded liposomes against HT29 for 48 h.
Treatments IC50 value (µg/mL)
Average SD n1 n2 n3
Free 3A.1 2.015 2.368 2.238 2.207 0.146
3A.1-Con LPs 1.994 2.231 2.062 2.096 0.100
3A.1-0.25PEG LPs 1.386 1.423 1.277 1.362 0.062
Inhibition of cell migration of 3A.1-loaded liposomes
Table C.22 The rate of HN22 cell migration calculated from scratch assay.
Treatments Cell migration rate (µm/h)
Average SD n1 n2 n3
Control 23.80 23.94 23.49 23.74 0.19
0.1% DMSO 22.60 22.05 22.83 22.49 0.33
Free 3A.1 18.21 19.21 17.00 18.14 0.90
3A.1-Con LPs 13.21 14.00 11.55 12.92 1.02
3A.1-0.25PEG LPs 11.07 10.95 11.39 11.14 0.19

192
Table C.23 The percentage of wound closure in HN22 cell calculated from scratch
assay.
Treatments %Wound closure
Average SD n1 n2 n3
Control 85.98 86.35 84.24 85.52 0.92
0.1% DMSO 84.31 85.41 80.40 83.37 2.15
Free 3A.1 69.89 67.55 72.74 70.06 2.12
3A.1-Con LPs 46.88 47.62 44.62 46.37 1.28
3A.1-0.25PEG LPs 39.57 38.13 40.65 39.45 1.03
Table C.24 The percentage of cell migration in HCT116 calculated from transwell
migration assay.
Treatments No. of cell migration (% of control)
Average SD n1 n2 n3
Control 104.74 93.52 101.75 100.00 4.74
0.1% DMSO 100.25 96.51 92.02 96.26 3.36
Free 3A.1 65.84 67.33 59.85 64.34 3.23
3A.1-Con LPs 53.12 54.61 51.62 53.12 1.22
3A.1-0.25PEG LPs 50.12 53.87 50.87 51.62 1.62

193
APPENDIX D
Table D.1 Concentration of 3A.1 into nanosuspensions stabilized by different
amphiphilic chitosan derivatives and three surfactants with drug to polymer ratios
prepared by a nanoprecipitation method.
CS
derivatives
3A.1 to
polymer
Drug concentration (µg/mL) Average SD
n1 n2 n3
NSC
0 - - - - -
0.8 : 1 439.96 380.09 428.51 416.19 25.95
1 : 1 545.59 497.01 559.70 534.10 26.85
1.5 : 1 753.55 728.79 864.11 782.15 58.83
2 : 1 1018.43 1072.69 1103.46 1064.86 35.15
OSC
0 - - - - -
0.8 : 1 184.65 163.83 171.27 173.25 8.61
1 : 1 289.68 201.79 225.77 239.08 37.09
1.5 : 1 706.77 812.43 768.93 762.71 43.36
2 : 1 363.91 285.48 298.64 316.01 34.29
BSC
0 - - - - -
0.8 : 1 364.17 194.70 312.10 290.33 70.88
1 : 1 447.50 432.37 332.98 404.28 50.80
1.5 : 1 581.00 658.66 621.35 620.33 31.71
2 : 1 931.58 913.82 951.71 932.37 15.48
Surfactants
SDS 1.5 : 1 470.99 430.27 501.09 467.45 29.02
Tween® 80 1.5 : 1 516.95 485.13 481.27 494.45 15.99
Poloxamer
188 1.5 : 1 55.93 63.11 55.50 58.18 3.49
Table D.2 The percentage of 3A.1 yield into nanosuspensions stabilized by different
amphiphilic chitosan derivatives and three surfactants with drug to polymer ratios
prepared by a nanoprecipitation method.
CS
derivatives
3A.1 to
polymer
Drug concentration (µg/mL) Average SD
n1 n2 n3
NSC
0 - - - - -
0.8 : 1 79.32 76.45 77.92 77.89 1.17
1 : 1 76.95 76.90 82.45 78.76 2.60
1.5 : 1 79.43 76.83 90.37 82.21 5.87

194
2 : 1 81.07 73.94 83.00 79.33 3.90
OSC
0 - - - - -
0.8 : 1 30.02 36.57 33.97 33.52 2.69
1 : 1 30.68 42.37 34.11 35.72 4.91
1.5 : 1 65.36 80.53 77.19 74.36 6.51
2 : 1 20.64 28.23 22.29 23.72 3.26
BSC
0 - - - - -
0.8 : 1 67.95 35.17 57.67 53.60 13.69
1 : 1 65.99 60.49 49.92 58.80 6.67
1.5 : 1 58.04 64.39 57.47 59.97 3.14
2 : 1 72.15 64.17 66.84 67.72 3.31
Surfactants
SDS 1.5 : 1 43.96 40.16 46.77 43.63 2.71
Tween® 80 1.5 : 1 48.25 45.28 44.92 46.15 1.49
Poloxamer
188 1.5 : 1 5.22 5.89 5.18 5.43 0.33
Table D.3 The solubility of free 3A.1 and 3A.1 nanosuspensions in buffer solution (pH
1.2, 6.8, and 7.4) and distilled water. UP; undetectable peak in HPLC chromatogram
Formulations Solubility (µg/mL) in buffer pH 1.2
Average SD n1 n2 n3
Bulk 3A.1 UP UP UP - -
3A.1 NS-NSC 20.12 25.32 27.51 24.32 3.10
3A.1 NS-OSC 16.26 17.35 18.42 17.34 0.88
3A.1 NS-BSC 17.73 17.65 18.22 17.87 0.25
Solubility (µg/mL) in buffer pH 6.8
Bulk 3A.1 UP UP UP - -
3A.1 NS-NSC 27.32 28.82 29.31 28.48 0.85
3A.1 NS-OSC 20.21 21.42 21.47 21.03 0.58
3A.1 NS-BSC 21.56 22.30 24.37 22.74 1.19
Solubility (µg/mL) in buffer pH 7.4
Bulk 3A.1 UP UP UP - -
3A.1 NS-NSC 29.35 31.32 30.81 30.49 0.83
3A.1 NS-OSC 22.27 21.45 22.98 22.23 0.63
3A.1 NS-BSC 23.79 25.01 23.75 24.18 0.58
Solubility (µg/mL) in distilled water
Bulk 3A.1 UP UP UP - -
3A.1 NS-NSC 30.13 29.43 29.04 29.53 0.45
3A.1 NS-OSC 21.37 22.17 23.60 22.38 0.92
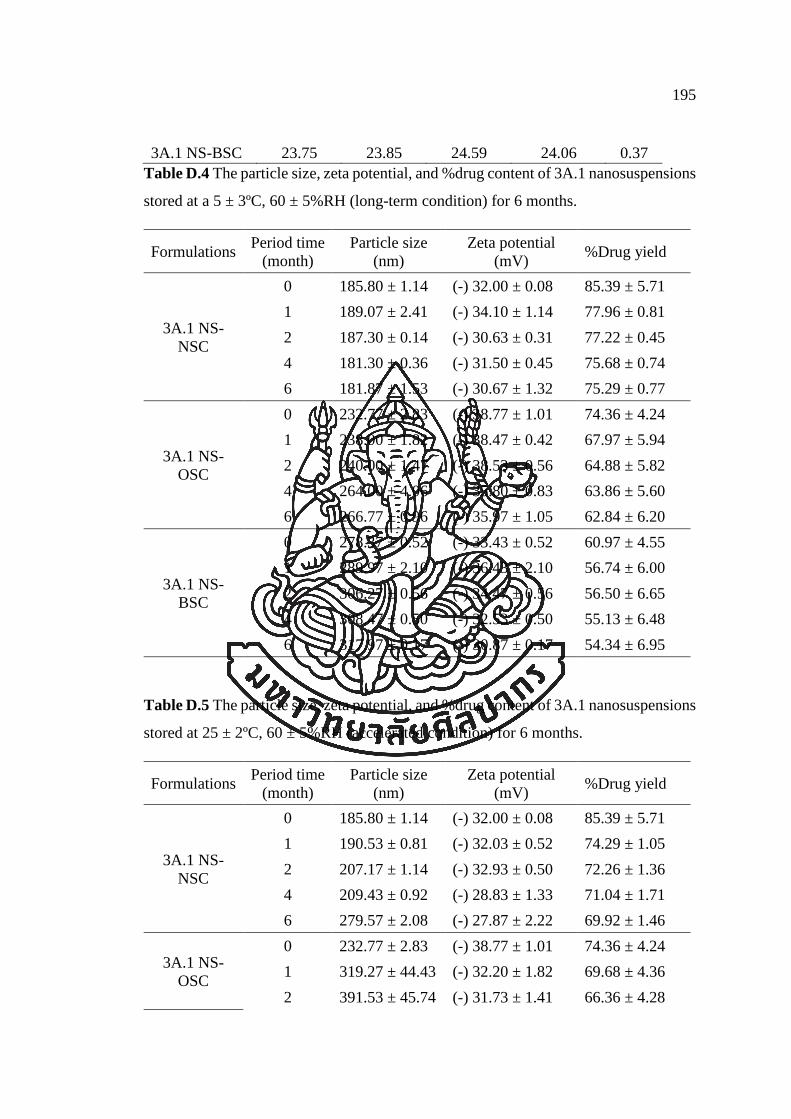
195
3A.1 NS-BSC 23.75 23.85 24.59 24.06 0.37
Table D.4 The particle size, zeta potential, and %drug content of 3A.1 nanosuspensions
stored at a 5 ± 3ºC, 60 ± 5%RH (long-term condition) for 6 months.
Formulations Period time
(month)
Particle size
(nm)
Zeta potential
(mV) %Drug yield
3A.1 NS-
NSC
0 185.80 ± 1.14 (-) 32.00 ± 0.08 85.39 ± 5.71
1 189.07 ± 2.41 (-) 34.10 ± 1.14 77.96 ± 0.81
2 187.30 ± 0.14 (-) 30.63 ± 0.31 77.22 ± 0.45
4 181.30 ± 0.36 (-) 31.50 ± 0.45 75.68 ± 0.74
6 181.87 ± 1.53 (-) 30.67 ± 1.32 75.29 ± 0.77
3A.1 NS-
OSC
0 232.77 ± 2.83 (-) 38.77 ± 1.01 74.36 ± 4.24
1 238.00 ± 1.82 (-) 38.47 ± 0.42 67.97 ± 5.94
2 240.00 ± 1.47 (-) 38.53 ± 0.56 64.88 ± 5.82
4 264.00 ± 4.06 (-) 35.80 ± 0.83 63.86 ± 5.60
6 266.77 ± 0.96 (-) 35.97 ± 1.05 62.84 ± 6.20
3A.1 NS-
BSC
0 278.37 ± 0.52 (-) 33.43 ± 0.52 60.97 ± 4.55
1 289.97 ± 2.10 (-) 36.43 ± 2.10 56.74 ± 6.00
2 306.27 ± 0.56 (-) 34.47 ± 0.56 56.50 ± 6.65
4 308.47 ± 0.50 (-) 32.53 ± 0.50 55.13 ± 6.48
6 317.97 ± 0.17 (-) 30.87 ± 0.17 54.34 ± 6.95
Table D.5 The particle size, zeta potential, and %drug content of 3A.1 nanosuspensions
stored at 25 ± 2ºC, 60 ± 5%RH (accelerated condition) for 6 months.
Formulations Period time
(month)
Particle size
(nm)
Zeta potential
(mV) %Drug yield
3A.1 NS-
NSC
0 185.80 ± 1.14 (-) 32.00 ± 0.08 85.39 ± 5.71
1 190.53 ± 0.81 (-) 32.03 ± 0.52 74.29 ± 1.05
2 207.17 ± 1.14 (-) 32.93 ± 0.50 72.26 ± 1.36
4 209.43 ± 0.92 (-) 28.83 ± 1.33 71.04 ± 1.71
6 279.57 ± 2.08 (-) 27.87 ± 2.22 69.92 ± 1.46
3A.1 NS-
OSC
0 232.77 ± 2.83 (-) 38.77 ± 1.01 74.36 ± 4.24
1 319.27 ± 44.43 (-) 32.20 ± 1.82 69.68 ± 4.36
2 391.53 ± 45.74 (-) 31.73 ± 1.41 66.36 ± 4.28

196
4 436.17 ± 63.90 (-) 28.50 ± 1.16 62.35 ± 4.08
6 544.23 ± 55.50 (-) 25.93 ± 1.19 59.56 ± 4.49
3A.1 NS-
BSC
0 278.37 ± 0.52 (-) 33.43 ± 0.52 60.97 ± 4.55
1 299.37 ± 4.33 (-) 34.03 ± 0.42 55.67 ± 5.80
2 311.60 ± 3.90 (-) 30.40 ± 1.27 54.07 ± 4.97
4 325.47 ± 6.04 (-) 30.07 ± 0.40 53.13 ± 4.77
6 479.27 ± 12.51 (-) 28.30 ± 1.57 51.68 ± 4.22
In vitro cytotoxicity of 3A.1 nanosuspensions
Table D.6 The %cell viability of HCT116 exposed by 3A.1 NS-NSC for 24 h.
Conc.
(µg/mL)
%Cell viability Average SD
n1 n2 n3 n4 n5
Control 105.87 103.04 95.00 101.08 95.00 100.00 4.36
0.1 95.58 97.61 82.46 96.85 90.61 92.62 5.64
0.3 85.06 81.18 87.78 82.28 83.50 83.96 2.30
0.5 68.29 73.49 74.48 69.97 68.75 71.00 2.52
1 24.63 29.09 23.42 30.47 38.97 29.32 5.50
2 14.40 22.03 19.37 24.98 15.96 19.35 3.87
4 14.98 17.64 14.92 16.48 17.98 16.40 1.29
8 13.82 15.50 15.03 21.51 17.52 16.68 2.70
16 13.59 14.22 14.80 10.87 14.22 13.54 1.39
Table D.7 The %cell viability of HCT116 exposed by 3A.1 NS-OSC for 24 h.
Conc.
(µg/mL)
%Cell viability Average SD
n1 n2 n3 n4 n5
Control 99.24 101.31 100.54 98.96 99.95 100.00 0.86
0.1 98.69 93.68 91.99 102.62 94.06 96.21 3.90
0.3 90.63 90.57 90.84 85.18 84.63 88.37 2.84
0.5 65.83 67.52 70.52 69.05 71.72 68.93 2.09
1 63.32 57.55 69.26 70.19 64.25 64.92 4.56
2 24.74 28.01 23.05 22.23 24.63 24.53 1.98
4 19.51 25.78 16.84 18.31 19.40 19.97 3.06
8 18.15 14.88 15.48 16.68 17.93 16.62 1.30
16 13.51 13.84 18.80 19.40 16.78 16.47 2.44
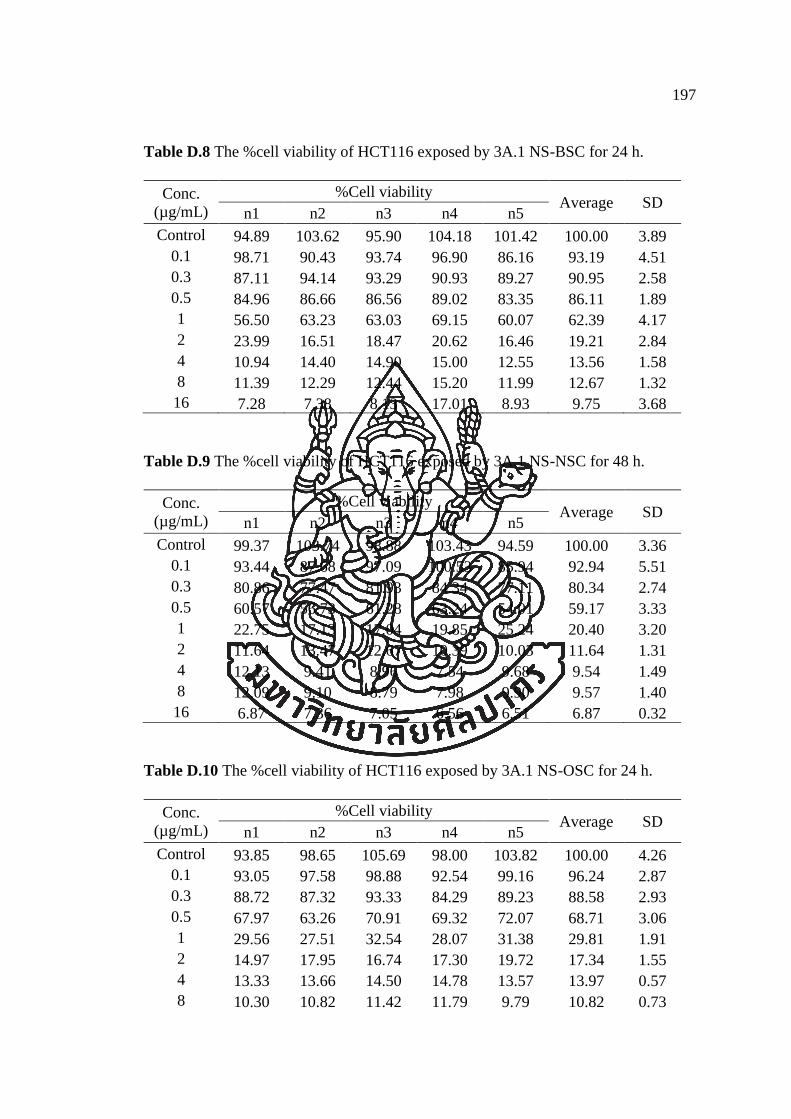
197
Table D.8 The %cell viability of HCT116 exposed by 3A.1 NS-BSC for 24 h.
Conc.
(µg/mL)
%Cell viability Average SD
n1 n2 n3 n4 n5
Control 94.89 103.62 95.90 104.18 101.42 100.00 3.89
0.1 98.71 90.43 93.74 96.90 86.16 93.19 4.51
0.3 87.11 94.14 93.29 90.93 89.27 90.95 2.58
0.5 84.96 86.66 86.56 89.02 83.35 86.11 1.89
1 56.50 63.23 63.03 69.15 60.07 62.39 4.17
2 23.99 16.51 18.47 20.62 16.46 19.21 2.84
4 10.94 14.40 14.90 15.00 12.55 13.56 1.58
8 11.39 12.29 12.44 15.20 11.99 12.67 1.32
16 7.28 7.38 8.13 17.01 8.93 9.75 3.68
Table D.9 The %cell viability of HCT116 exposed by 3A.1 NS-NSC for 48 h.
Conc.
(µg/mL)
%Cell viability Average SD
n1 n2 n3 n4 n5
Control 99.37 103.74 98.88 103.43 94.59 100.00 3.36
0.1 93.44 87.68 97.09 100.53 85.94 92.94 5.51
0.3 80.86 77.47 81.93 84.34 77.11 80.34 2.74
0.5 60.57 56.73 61.28 63.24 54.01 59.17 3.33
1 22.75 17.13 17.04 19.85 25.24 20.40 3.20
2 11.64 13.47 12.67 10.39 10.03 11.64 1.31
4 12.13 9.41 8.96 7.54 9.68 9.54 1.49
8 12.09 9.10 8.79 7.98 9.90 9.57 1.40
16 6.87 7.36 7.05 6.56 6.51 6.87 0.32
Table D.10 The %cell viability of HCT116 exposed by 3A.1 NS-OSC for 24 h.
Conc.
(µg/mL)
%Cell viability Average SD
n1 n2 n3 n4 n5
Control 93.85 98.65 105.69 98.00 103.82 100.00 4.26
0.1 93.05 97.58 98.88 92.54 99.16 96.24 2.87
0.3 88.72 87.32 93.33 84.29 89.23 88.58 2.93
0.5 67.97 63.26 70.91 69.32 72.07 68.71 3.06
1 29.56 27.51 32.54 28.07 31.38 29.81 1.91
2 14.97 17.95 16.74 17.30 19.72 17.34 1.55
4 13.33 13.66 14.50 14.78 13.57 13.97 0.57
8 10.30 10.82 11.42 11.79 9.79 10.82 0.73

198
16 7.51 8.21 9.28 8.48 9.23 8.54 0.66
Table D.11 The %cell viability of HCT116 exposed by 3A.1 NS-BSC for 48 h.
Conc.
(µg/mL)
%Cell viability Average SD
n1 n2 n3 n4 n5
Control 101.93 102.42 106.19 94.35 95.11 100.00 4.56
0.1 96.97 98.39 93.02 102.69 94.84 97.18 3.30
0.3 80.74 91.38 86.95 85.79 88.32 86.64 3.49
0.5 66.73 64.96 65.00 76.48 60.08 66.65 5.39
1 22.97 25.45 19.82 24.78 20.79 22.76 2.19
2 14.41 13.83 14.23 16.18 12.55 14.24 1.17
4 9.89 10.06 8.51 8.29 8.20 8.99 0.81
8 9.58 8.38 7.67 8.11 7.80 8.31 0.68
16 4.70 12.77 6.16 12.64 5.59 8.37 3.57
Table D.12 The half-maximal inhibitory drug concentration (IC50) of free 3A.1 and
3A.1-nanosuspensions against HCT116 for 24 h.
Treatments IC50 value (µg/mL)
Average SD n1 n2 n3
Free 3A.1 3.539 3.894 4.103 3.845 0.233
3A.1 NS-NSC 0.654 0.668 0.707 0.676 0.022
3A.1 NS-OSC 0.998 1.000 1.041 1.013 0.020
3A.1 NS-BSC 1.153 1.148 1.128 1.143 0.011
Table D.13 The half-maximal inhibitory drug concentration (IC50) of free 3A.1 and
3A.1-nanosuspensions against HCT116 for 48 h.
Treatments IC50 value (µg/mL)
Average SD n1 n2 n3
Free 3A.1 2.468 2.262 2.587 2.439 0.134
3A.1 NS-NSC 0.563 0.585 0.554 0.567 0.013
3A.1 NS-OSC 0.642 0.666 0.650 0.653 0.010
3A.1 NS-BSC 0.604 0.624 0.619 0.615 0.009

VITA
VITA
NAME MR. TEERATAS KANSOM
DATE OF BIRTH 14 October 1990
PLACE OF BIRTH Nakorn Pathom, Thailand
INSTITUTIONS
ATTENDED
2015-Present: Doctor of Philosophy, Ph.D. in
Pharmaceutical Technology, Faculty of Pharmacy,
Silpakorn University, Thailand
2019: Visiting exchange student, Department of Drug
Discovery and Development, Harrison School of
Pharmacy, Auburn University, Alabama, United States of
America.
2009-2014: Bachelor Degree, Doctor of Pharmacy (1st
class honors), Pharmaceutical Technology, Faculty of
Pharmacy, Silpakorn University, Thailand.
HOME ADDRESS 17 Moo. 8, Huaymonthong, Kampaengsean, Nakorn
Pathom, Thailand, 73140
PUBLICATION 1. Teeratas Kansom, Warayuth Sajomsang, Rungnapha
Saeeng, Purin Charoensuksai, Praneet Opanasopit,
Prasopchai Tonglairoum. Apoptosis induction and
antimigratory activity of andrographolide analog (3A.1)-
incorporated self-assembled nanoparticles in cancer cells.
AAPS PharmSciTech. 2018; 19(7): 3123-3133.
2. Teeratas Kannsom, Rungnapha Saeeng, Tanasait
Ngawhirunpat, Theerasak Rojanatara, Prasopchai
Tonglairoum, Praneet Opanasopit, Purin Charoensuksai.
Effect of semi-synthetic andrographolide analogue-loaded
polymeric micelles on HN22 cell migration. Walailak
Journal of Science and Technology (WJST). 2018; 17(2),
88-95.
3. Teeratas Kansom, Warayuth Sajomsang, Rungnapha
Saeeng, Theerasak Rojanarata, Tanasait Ngawhirunpat,
Prasopchai Patrojanasophon, Praneet Opanasopit.
Fabrication and characterization of andrographolide
analogue (3A.1) nanosuspensions stabilized by
amphiphilic chitosan derivatives for colorectal cancer
therapy. J Drug Deliv Sci Tech. 2019; 54: 101287.
4. Teeratas Kansom, Ekachai Dumkliang, Prasopchai
Patrojanasophon, Warayuth Sajomsang, Rungnapha
Saeeng, Wei Ming Zhu, Praneet Opanasopit. Folate-
functionalized amphiphilic chitosan polymeric micelles
containing andrographolide analogue (3A.1) for colorectal
cancer. Key Engineering Materials. 2019; 819: 15-20.
5. Teeratas Kansom, Warayuth Sajomsang, Arthit
200
Chairoungdua, Nudchanart Kitcharoen, Prasopchai
Patrojanasophon, Praneet Opanasopit. Doxorubicin-loaded
N-naphthyl-N,O-succinyl chitosan micelles for colon
cancer treatment. Science, Engineering and Health Studies.
(In press)
6. Teeratas Kansom and Praneet Opanasopit. Polymeric
micelles for tumor targeting, Thai Bulletin of
Pharmaceutical Sciences (TBPS), 2019: 14(1), 13-25.
7. Teeratas Kansom and Praneet Opanasopit. Metronomic
chemotherapy, Thai Bulletin of Pharmaceutical Sciences
(TBPS), 2020: 15(1), 17-30.
AWARD RECEIVED - The Royal Golden Jubilee (RGJ) Ph.D. Program
Scholarship (Grant No. PHD/0077/2558)
- Best poster presentation awards. 9th Thailand Pharmacy
Congress : Smart Aging Life & Digital Pharmacy 4.0, 16-
17 November 2017, BITEC, Bangkok, Thailand