
SUB-PRECINCT 3A(1) SOUTHERN RIVER LOCAL WATER ...
192
SUB-PRECINCT 3A(1) SOUTHERN RIVER LOCAL WATER MANAGEMENT STRATEGY Prepared for: WRF PROPERTY LTD Revised version with Second Revised Addendum – July 2009 Job No: 06.024 Report No: RP001
-
Upload
khangminh22 -
Category
Documents
-
view
1 -
download
0
Transcript of SUB-PRECINCT 3A(1) SOUTHERN RIVER LOCAL WATER ...

SUB-PRECINCT 3A(1) SOUTHERN RIVER LOCAL WATER MANAGEMENT STRATEGY Prepared for:
WRF PROPERTY LTD
Revised version with Second Revised Addendum – July 2009
Job No: 06.024
Report No: RP001
WRF PROPERTY LTD –Sub-precinct 3A (1), Southern River: Local Water Management Strategy –Second Revised Version with
Addendum, July 2009
06.024 RP001 LWMS Final Revised July 09
SUB-PRECINCT 3A(1) SOUTHERN RIVER LOCAL WATER MANAGEMENT STRATEGY Second revised version with revised Addendum – July 2009
Prepared for: WRF PROPERTY LTD
Prepared by:
ENV Australia Pty Ltd Level 7, 182 St George’s Terrace PERTH WA 6000 Phone: (08) 9289 8360 Fax: (08) 9322 4251 Email: [email protected]
Prepared by: Margaret Dunlop
Status: Final Revised with Addendum- also Revised
QA Review: Karen Lane
Technical Review: Karen Lane
Content Review: Margaret Dunlop
Date: 1 July 2009-


WRF PROPERTY LTD –Sub-precinct 3A (1), Southern River: Local Water Management Strategy –Second Revised Version
with Addendum, July 2009
06.024 RP001 LWMS Final Revised July 09
TABLE OF CONTENTS
EXECUTIVE SUMMARY ....................................................................................... III
1 INTRODUCTION ..........................................................................................1
1.1 TOTAL WATER MANAGEMENT STRATEGY..................................................................................... 1
1.2 PLANNING BACKGROUND ................................................................................................................ 3
1.2.1 Metropolitan Region Scheme ............................................................................................................... 3
1.2.2 City of Gosnells Town Planning Scheme No.6..................................................................................... 3
1.2.3 Southern River/Forrestdale/Brookdale/Wungong District Structure Plan ............................................. 3
1.3 PREVIOUS STUDIES .......................................................................................................................... 4
1.4 REPORT HISTORY ............................................................................................................................. 4
2 PROPOSED DEVELOPMENT .....................................................................5
2.1 DETAILS OF PROPOSED DEVELOPMENT....................................................................................... 5
2.2 ENVIRONMENTAL ISSUES TO BE ADDRESSED ............................................................................. 5
2.2.1 Management of Works ......................................................................................................................... 6
2.2.2 Other Environmental Issues ................................................................................................................. 7
3 PRE DEVELOPMENT ENVIRONMENT.......................................................8
3.1 GEOLOGY AND SOILS ....................................................................................................................... 8
3.1.1 Geology................................................................................................................................................ 8
3.1.2 Soils ..................................................................................................................................................... 8
3.1.3 Soil Contamination ............................................................................................................................... 8
3.1.4 Acid Sulphate Soils Assessment.......................................................................................................... 9
3.2 GROUNDWATER .............................................................................................................................. 11
3.2.1 Groundwater Work by Others............................................................................................................. 11
3.2.2 Site Hydrology.................................................................................................................................... 11

WRF PROPERTY LTD –Sub-precinct 3A (1), Southern River: Local Water Management Strategy –Second Revised Version
with Addendum, July 2009
06.024 RP001 LWMS Final Revised July 09
3.2.3 On Site Groundwater Levels .............................................................................................................. 11
3.2.4 Average Annual Lowest Groundwater Levels .................................................................................... 12
3.2.5 Average Annual Maximum Groundwater Levels ................................................................................ 13
3.2.6 Superficial Groundwater Quality......................................................................................................... 13
3.3 SURFACE WATER HYDROLOGY .................................................................................................... 16
3.3.1 Surface Water Quantity ...................................................................................................................... 17
3.3.2 Surface Water Quality ........................................................................................................................ 18
3.4 ENVIRONMENTAL ASSETS AND WATER DEPENDANT ECOSYSTEMS ...................................... 20
3.4.1 Wetlands ............................................................................................................................................ 20
3.4.2 Vegetation .......................................................................................................................................... 20
4 DESIGN CRITERIA ....................................................................................21
4.1 WATER CONSERVATION................................................................................................................. 21
4.2 STORMWATER QUANTITY .............................................................................................................. 21
4.3 STORMWATER NUTRIENT MANAGEMENT.................................................................................... 22
4.4 GROUNDWATER QUANTITY ........................................................................................................... 23
4.5 GROUNDWATER QUALITY .............................................................................................................. 24
4.5.1 Where Development is Associated with a Waterway or Open Drain that Intersects the Shallow
Water Table........................................................................................................................................ 24
4.5.2 Where the Development is Associated an Ecosystem that is Dependent Upon a Particular
Hydrological Regime for Survival ....................................................................................................... 25
4.6 COMMITMENT TO BEST MANAGEMENT PRACTICE..................................................................... 25
5 WATER CONSERVATION STRATEGY.....................................................27
5.1 OPTIONS UNDER CONSIDERATION............................................................................................... 27
5.1.1 Areas for Potential Domestic Potable Water Use Reduction.............................................................. 28
5.1.2 Residential Garden Watering ............................................................................................................. 30

WRF PROPERTY LTD –Sub-precinct 3A (1), Southern River: Local Water Management Strategy –Second Revised Version
with Addendum, July 2009
06.024 RP001 LWMS Final Revised July 09
5.1.3 Waterwise Fittings.............................................................................................................................. 32
5.1.4 In-house Water Substitution ............................................................................................................... 32
5.1.5 Water Use in Public Open Space....................................................................................................... 33
5.2 WATER BALANCE MODELLING ...................................................................................................... 33
5.2.1 Pre-development Water Balance ....................................................................................................... 34
5.2.2 Post-development Water Balances .................................................................................................... 34
5.2.3 Discussion.......................................................................................................................................... 36
5.3 FIT FOR PURPOSE WATER CONSERVATION STRATEGY ........................................................... 36
5.4 WATER INFRASTRUCTURE ............................................................................................................ 37
5.4.1 Potable Water Infrastructure .............................................................................................................. 37
5.4.2 Wastewater Infrastructure .................................................................................................................. 38
5.5 WORK REQUIRED ............................................................................................................................ 38
6 STORMWATER MANAGEMENT STRATEGY...........................................39
6.1 FLOW AND FLOOD MANAGEMENT ................................................................................................ 39
6.1.1 Post Development Flow Management................................................................................................ 39
6.1.2 Response to Regulator Comments on Drainage Design.................................................................... 43
6.1.3 Post Development Water Quality Management ................................................................................. 45
6.2 IMPACT ON WATER DEPENDANT ECOSYSTEMS......................................................................... 48
7 GROUNDWATER MANAGEMENT STRATEGY........................................50
7.1 CONTROLLED GROUNDWATER LEVELS AND FILL...................................................................... 50
7.1.1 Groundwater Impact on Water Dependent Ecosystems..................................................................... 50
7.2 GROUNDWATER QUALITY .............................................................................................................. 51
7.2.1 Former Poultry Farms ........................................................................................................................ 51
7.2.2 Best Management Practices for Groundwater Quality........................................................................ 51

WRF PROPERTY LTD –Sub-precinct 3A (1), Southern River: Local Water Management Strategy –Second Revised Version
with Addendum, July 2009
06.024 RP001 LWMS Final Revised July 09
8 WETLANDS AND ENVIRONMENTAL WATER REQUIREMENTS............53
8.1 DETERMINATION OF ENVIRONMENTAL WATER REQUIREMENTS ............................................ 53
8.2 ECOLOGICAL HEALTH MONITORING............................................................................................. 53
8.3 REGIONAL WATER MANAGEMENT STRATEGY............................................................................ 54
8.4 BUFFERS .......................................................................................................................................... 54
9 MATTERS TO BE ADDRESSED IN THE UWMP ......................................56
10 FUTURE MONITORING AND MODELLING REQUIREMENTS ................57
10.1 SURFACE WATER MONITORING AND MODELLING ..................................................................... 57
10.2 GROUNDWATER MONITORING AND MODELLING........................................................................ 57
10.3 WETLAND MONITORING ................................................................................................................. 57
11 IMPLEMENTATION....................................................................................58
12 SUMMARY .................................................................................................59
13 REFERENCES ...........................................................................................61
FIGURES
FIGURE 1 SITE LOCATION
FIGURE 2 SUBDIVISION CONCEPT PLAN
FIGURE 3 GEOLOGY
FIGURE 4 MONITORING BORE LOCATIONS
FIGURE 5 ACID SULPHATE SOILS MAPPING
FIGURE 6 JDA AVERAGE ANNUAL MAXIMUM GROUNDWATER LEVELS
FIGURE 7 AVERAGE ANNUAL LOWEST GROUNDWATER LEVELS
FIGURE 8 AVERAGE ANNUAL MAXIMUM GROUNDWATER LEVELS
FIGURE 9 DRAINS AND SAMPLING LOCATIONS
FIGURE 10 GEOMORPHIC WETLANDS AND 1 IN 100 YEAR FLOOD LEVELS
FIGURE 11 CURRENT CATCHMENT BOUNDARIES
FIGURE 12 VEGETATION MAPPING

WRF PROPERTY LTD –Sub-precinct 3A (1), Southern River: Local Water Management Strategy –Second Revised Version
with Addendum, July 2009
06.024 RP001 LWMS Final Revised July 09
FIGURE 13 POTABLE WATER USE (IN TEXT)
FIGURE 14 DRAINAGE PLAN
FIGURE 15 CROSS SECTION OF STREET WITH SWALE
FIGURE 16 CROSS SECTION OF WATER GARDEN
FIGURE 17 LUMPED MUSIC MODEL (IN TEXT)
TABLES
TABLE 1 SWAN RIVER TRUST WATER QUALITY GUIDELINES
TABLE 2 GROUNDWATER TOTAL NITROGEN RESULTS
TABLE 3 GROUNDWATER TOTAL PHOSPHORUS RESULTS
TABLE 4 SURFACE WATER DEPTHS
TABLE 5 PEAK FLOWS
TABLE 6 SURFACE WATER QUALITY
TABLE 7 EASE OF IMPLEMENTING NON-DRINKING WATER SOURCES
TABLE 8 REQUIRED FLOOD VOLUMES
TABLE 9 VOLUMES OF STORAGE IN PRELIMINARY PLAN
TABLE 10 MUSIC RESULTS
TABLE 11 TABLE OF RESPONSIBILITIES
APPENDICES
APPENDIX A CHANGES TO REPORT BETWEEN MARCH 2007 AND APRIL 2008 VERSION
APPENDIX B MONITORING BORE LOGS
APPENDIX C RECORDED GROUNDWATER LEVELS
APPENDIX D AVERAGE ANNUAL MAXIMUM AND LOWEST GROUNDWATER LEVEL
CALCULATIONS
APPENDIX E GROUNDWATER SAMPLING RESULTS
APPENDIX F RAINWATER TO TOILET FLUSHING CALCULATIONS
APPENDIX G SITE WATER BALANCES
APPENDIX H DETAILS OF DRAINAGE PIPE SIZING AND FLOW RATES
APPENDIX I DRAINAGE DESIGN
APPENDIX J INDICATIVE LAYOUTS OF ROAD RESERVES WITH SWALES
APPENDIX K DETAILS OF MUSIC MODEL
WRF PROPERTY LTD –Sub-precinct 3A (1), Southern River: Local Water Management Strategy –Second Revised Version
with Addendum, July 2009
Page i 06.024 RP001 LWMS Final Revised July 09
STATEMENT OF LIMITATIONS Scope of Services
This environmental site assessment report (“the report”) has been prepared in accordance with the scope of services set out in the contract, or as otherwise agreed, between the Client and ENV.Australia Pty Ltd (ENV) (“scope of services”). In some circumstances the scope of services may have been limited by a range of factors such as time, budget, access and/or site disturbance constraints.
Reliance on Data
In preparing the report, ENV has relied upon data, surveys, analyses, designs, plans and other information provided by the Client and other individuals and organisations, most of which are referred to in the report (“the data”). Except as otherwise stated in the report, ENV has not verified the accuracy or completeness of the data. To the extent that the statements, opinions, facts, information, conclusions and/or recommendations in the report (“conclusions”) are based in whole or part on the data, those conclusions are contingent upon the accuracy and completeness of the data. ENV will not be liable in relation to incorrect conclusions should any data, information or condition be incorrect or have been concealed, withheld, misrepresented or otherwise not fully disclosed to ENV.
Environmental Conclusions
In accordance with the scope of services, ENV has relied upon the data and has conducted environmental field monitoring and/or testing in the preparation of the report. The nature and extent of monitoring and/or testing conducted is described in the report.
On all sites, varying degrees of non-uniformity of the vertical and horizontal soil or groundwater conditions are encountered. Hence no monitoring, common testing or sampling technique can eliminate the possibility that monitoring or testing results/samples are not totally representative of soil and/or groundwater conditions encountered. The conclusions are based upon the data and the environmental field monitoring and/or testing and are therefore merely indicative of the environmental condition of the site at the time of preparing the report, including the presence or otherwise of contaminants or emissions. Also it should be recognised that site conditions, including the extent and concentration of contaminants, can change with time.
Within the limitations imposed by the scope of services, the monitoring, testing, sampling and preparation of this report have been undertaken and performed in a professional manner, in accordance with generally accepted practices and using a degree of skill and care ordinarily exercised by reputable environmental consultants under similar circumstances. No other warranty, expressed or implied, is made.

WRF PROPERTY LTD –Sub-precinct 3A (1), Southern River: Local Water Management Strategy –Second Revised Version
with Addendum, July 2009
Page ii 06.024 RP001 LWMS Final Revised July 09
Report for Benefit of Client
The report has been prepared for the benefit of the Client and no other party. ENV assumes no responsibility and will not be liable to any other person or organisation for or in relation to any matter dealt with or conclusions expressed in the report, or for any loss or damage suffered by any other person or organisation arising from matters dealt with or conclusions expressed in the report (including without limitation matters arising from any negligent act or omission of ENV or for any loss or damage suffered by any other party relying upon the matters dealt with or conclusions expressed in the report). Other parties should not rely upon the report or the accuracy or completeness of any conclusions and should make their own enquiries and obtain independent advice in relation to such matters.
Other Limitations
ENV will not be liable to update or revise the report to take into account any events or emergent circumstances or facts occurring or becoming apparent after the date of the report.
The scope of services did not include any assessment of the title to or ownership of the properties, buildings and structures referred to in the report nor the application or interpretation of laws in the jurisdiction in which those properties, buildings and structures are located.

WRF PROPERTY LTD –Sub-precinct 3A (1), Southern River: Local Water Management Strategy –Second Revised Version
with Addendum, July 2009
Page iii 06.024 RP001 LWMS Final Revised July 09
EXECUTIVE SUMMARY
This report has been prepared to support the submission of an Outline Development Plan for the land located between Southern River Road, Leslie Street, Matison Street and the proposed realignment of Holmes Road/Garden Street in Southern River (Sub-precinct 3A(1)).
Under the Southern River Interim Integrated Land and Water Management Plan (the IILWMP) (Water Corporation, 2007), a Local Water Management Strategy (LWMS) is required to support the Local Structure Plan developed to support the application for amendment of the Local Planning Scheme to rezone the land as Urban. The IILWMP sets out the requirements for a LWMS within the Integrated Land and Water Management Plan (ILWMP) area, which must be reviewed by the Memorandum of Understanding (MoU) group, including the City of Gosnells, Department of Water, Department of Environment and Conservation and Water Corporation prior to development proceeding.
The objective of this LWMS is to design a development that manages the total water cycle in a sustainable manner. This includes water conservation, stormwater management, groundwater management and wetland management. Sub-precinct 3A(1) aims to manage these issues through the following initiatives.
Water Conservation
• Providing householders with rainwater tanks for toilet flushing and/or washing machines;
• Mandating the use of Waterwise fittings at construction;
• Providing Waterwise landscaping packages that include low water use gardens and soil amendments to minimise water and nutrient loss; and
• Minimising water use in Public Open Space through the use of low water use landscaping treatments and water efficient irrigation systems that are linked to soil moisture characteristics.
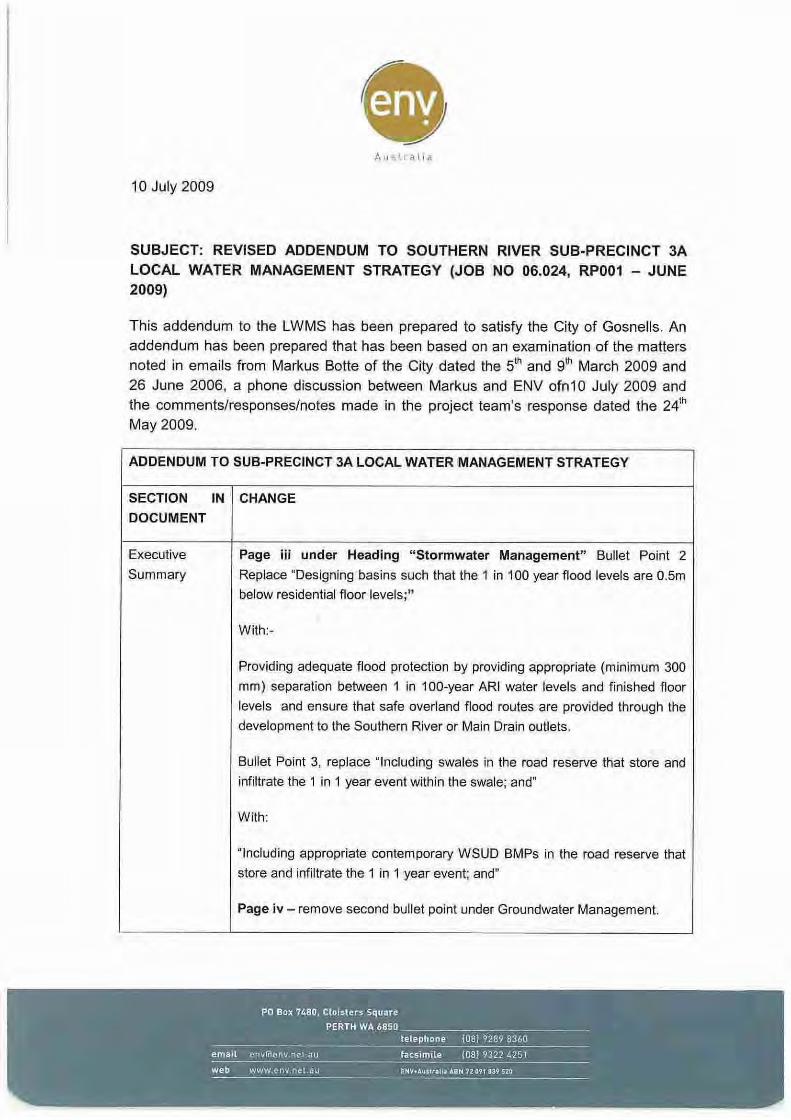
Stormwater Management
• Implementing a drainage design that limits the peak outflow from the development to pre-development levels through storage and infiltration on site;
• Providing adequate flood protection by providing appropriate (minimum 300 mm) separation between 1 in 100-year ARI water levels and finished floor levels and ensure that safe overland flood routes are provided through the development to the Southern River or Main Drain outlets.
WRF PROPERTY LTD –Sub-precinct 3A (1), Southern River: Local Water Management Strategy –Second Revised Version
with Addendum, July 2009
Page iv 06.024 RP001 LWMS Final Revised July 09
• Including appropriate contemporary WSUD BMPs in the road reserve that store and infiltrate the 1 in 1 year event; and
• Implementing a stormwater system that the model indicates will meet the ILWMP targets for nitrogen and phosphorus reduction through the use of swales, living streams and bioretention systems.
Groundwater Management
• Allowing the use of controlled groundwater levels only where it can be demonstrated that these will not affect the Conservation Category Wetland to the south of the site; and
• A commitment to further monitoring of groundwater quality on the site to determine whether historical practices have impacted on groundwater quality.
Wetland Management
• Maintaining pre-development levels of flow into the wetland in a 1 in 100 year storm event.
WRF PROPERTY LTD –Sub-precinct 3A (1), Southern River: Local Water Management Strategy –Second Revised Version
with Addendum, July 2009
Page 1 06.024 RP001 LWMS Final Revised July 09
1 INTRODUCTION
This report has been prepared to support the submission of an Outline Development Plan by the contracted purchaser of the below-mentioned lots (WRF Property Ltd) for their lots and the remainder of the land located between Southern River Road, Leslie Street, Matison Street and the proposed realignment of Holmes Road/Garden Street in Southern River (Sub-precinct 3A(1)).
Lots owned by or contracted to WRF Property Ltd:
• Lot 1 Southern River Road;
• Lots 1744, 1745, 1751 Bradley Street;
• Lots 1508, 1509, 1510, 1511, 1512, 1513 and 1514 Leslie Street; and
• Lot 22 and 23 Matison Street.
The location of Sub-precinct 3A(1) is shown in Figure 1.
Under the Southern River Interim Integrated Land and Water Management Plan (the IILWMP) (Water Corporation, 2007), a Local Water Management Strategy (LWMS) is required to support the Local Structure Plan developed to support the application for amendment of the Local Planning Scheme to rezone the land as Urban. The IILWMP sets out the requirements for a LWMS within the Integrated Land and Water Management Planning (ILWMP) area, which must be reviewed by the Memorandum of Understanding (MoU) group, including the City of Gosnells, Department of Water, Department of Environment and Conservation and Water Corporation prior to development proceeding.
1.1 TOTAL WATER MANAGEMENT STRATEGY
The objective of this LWMS is to design a development that manages the total water cycle in a sustainable manner. The objectives of total water cycle management, as described by the Draft Water Resources State Planning Policy (WAPC, 2004) are to:
• Take into account total water cycle management and water-sensitive urban design principles and ensure that development is consistent with current best management practices and best planning practices for the sustainable use of water resources, particularly stormwater.
• Seek to achieve no net difference in water quality and quantity, such that post-development water quality and quantity conditions are equal to or better than pre-development conditions.

WRF PROPERTY LTD –Sub-precinct 3A (1), Southern River: Local Water Management Strategy –Second Revised Version
with Addendum, July 2009
Page 2 06.024 RP001 LWMS Final Revised July 09
• Promote management of the urban water cycle as a single system in which all urban water flows are recognised as a potential resource and where the interconnectedness of water supply, stormwater, wastewater, flooding, water quality, waterways, estuaries and coastal waters is recognised.
• Maximise the opportunities for compliance with best practice stormwater management including retention of stormwater on site/at the source.
• Promote use of water conservation mechanisms that increase the efficiency of the use of water, including stormwater.
• Incorporate the re-use and recycling of water, particularly stormwater and grey water, consistent with state water strategy recycling objectives. Alternative water sources should be considered where appropriate.
• Promote the retention and use of local native vegetation in developments to minimise water use and maximise filtration, particularly where landscaping is proposed.
This is to be done by maintaining the principles of Water Sensitive Urban Design (WSUD), which are:
• Protect natural systems - protect and enhance natural water systems within urban developments;
• Integrate stormwater treatment into the landscape - use stormwater in the landscape by incorporating multiple use corridors that maximise the visual and recreational amenity of developments;
• Protect water quality - protect the water quality draining from urban development;
• Reduce run-off and peak flows - reduce peak flows from urban developments by local detention measures and minimising impervious areas; and
• Add value while minimising development costs - minimise the drainage infrastructure cost of development. (CSIRO, 1999, As reprinted in WAPC, 2004).
WRF PROPERTY LTD –Sub-precinct 3A (1), Southern River: Local Water Management Strategy –Second Revised Version
with Addendum, July 2009
Page 3 06.024 RP001 LWMS Final Revised July 09
1.2 PLANNING BACKGROUND
1.2.1 Metropolitan Region Scheme
The subject site is currently zoned ‘Urban’ under the Metropolitan Region Scheme (MRS), as shown in Figure 2. The lifting of urban deferment was achieved in July 2006.
The subject site, Sub-precinct 3A(1), is bordered to the south by the existing MRS ‘Other Regional Road’ reservation for the future extension of Garden Street (Figure 2). It is understood that the DPI will initiate an amendment to the MRS to realign this reservation to generally reflect the existing Holmes Street reservation, so as to avoid dissecting Bush Forever Site 464 (immediate south of subject site). It is anticipated that upon completion of this realignment planning will be progressed for the balance portion of Sub-Precinct 3A. A LWMS will be required for the balance of the Sub-Precinct in due course. To assist in this, the water balances and MUSIC modelling in this report has been undertaken for the whole Sub-precinct.
The subject site is located on the current development front and the progression of adjoining sites demonstrates this. The land to the north west of Southern River Road (Bletchley Park Estate) is zoned for urban development under both the MRS and Council’s Town Planning Scheme, with detailed planning being well progressed for its development. The land north east of the Southern River water course is currently zoned and in the construction phase of subdivision (Chamberlain Street development), highlighting the fact that the study area is situated on the edge of the existing urban area.
1.2.2 City of Gosnells Town Planning Scheme No.6
The subject site is part of Southern River Precinct 3. The site is zoned ‘General Rural’ but Amendment 70, rezoning the land to ‘Residential Development’, has been approved by the Minister and is expected to be gazetted in the coming weeks.
1.2.3 Southern River/Forrestdale/Brookdale/Wungong District Structure Plan
This site falls within the area of The Southern River/Forrestdale/Brookdale/ Wungong District Structure Plan (DSP). The DSP was first published for draft comment in October 1999 with the final report being published in January 2001. Final Government endorsement of the DSP has been delayed, however, pending completion of an Urban Water Management Strategy for the district.
An Urban Water Management Strategy was prepared by consultants for the Department of Environment, however, it has never been formally endorsed. More recently, the Water Corporation has completed an Interim Integrated Land and Water Management Plan (the IILWMP) (Water Corporation, 2007 a). The document Interim Integrated Land Urban Water Management with Land Use Planning within
WRF PROPERTY LTD –Sub-precinct 3A (1), Southern River: Local Water Management Strategy –Second Revised Version
with Addendum, July 2009
Page 4 06.024 RP001 LWMS Final Revised July 09
the Southern River Area (EES, 2006) was used to manage development in the area prior to the completion of the IILWMP and has very similar goals and objectives for the area. All three documents recognise water and drainage as one of the key issues for development in the Southern River area. These documents have been used to develop this Local Water Management Strategy.
This enables the DSP to be effectively utilised by Government Planning and Infrastructure agencies as a basis for considering planning proposals at a more detailed level. The DSP is broadly considered to be the most current and relevant strategic planning instrument to guide ongoing development in the district.
1.3 PREVIOUS STUDIES
Previous studies into land and water management in the area include:
• Southern River/ Forrestdale/Brookdale/Wungong Structure Plan: Urban Water Management Strategy (JDA, 2002)
• Southern River Area: Groundwater modelling to assess effects of climate variation, and proposed development (Rockwater, 2005)
• Southern River Sub-precinct 3A (1): Request for Urban Zoning (Taylor Burrell Barnett, The Civil Group and ENV Australia (2005))
• Water Corporation (2007 b) Forrestdale Main Drain Arterial Drainage Strategy (ADS) (Interim)
• Precinct 3 Environmental Review undertaken by ENV for City of Gosnells (not yet available pending Environmental Protection Authority (EPA) review).
1.4 REPORT HISTORY
A previous version of this report was submitted to support the Town Planning Scheme rezoning in 2006. During this process, comments were made on the report by various agencies including the Department of Water, City of Gosnells, Water Corporation and Swan River Trust. Revisions have been made to the report based on these comments and improvements in the understanding of the site. A summary of these revisions can be found in Appendix A.

WRF PROPERTY LTD –Sub-precinct 3A (1), Southern River: Local Water Management Strategy –Second Revised Version
with Addendum, July 2009
Page 5 06.024 RP001 LWMS Final Revised July 09
2 PROPOSED DEVELOPMENT
2.1 DETAILS OF PROPOSED DEVELOPMENT
The development proposal is for a residential development with a range of housing lot sizes. The base residential density will be R20, with medium density developments from R25 to R40 located in areas close to POS, commercial areas and public transport routes (Figure 2).
Two commercial areas are also proposed for the development. An area of 7,600m2 will be set aside on the corner of Holmes Road and Southern River Road. A further 3,600m2 of retail area is proposed on the corner of Southern River Road and Leslie Street. In accordance with the City’s Draft Commercial Strategy, it proposed that this centre will ultimately accommodate 900m2 of retail floor space.
Local open space areas have been strategically located to provide for local active and passive recreational facilities, the retention of quality vegetation, and opportunities for natural drainage passage and filtration. Regard has also been given to the site’s proximity to Sutherlands Park (opposite on Southern River Road) and the requirements of Council to maximise cash-in-lieu payment to accommodate the compensation requirements for the Wetlands and Buffers within the broader Precinct 3.
A substantial area has been set aside in the north-eastern sector, extending from Matison Street, near Leslie Street; this area is aimed at protecting the main area of relatively undisturbed remnant bushland within the sub-precinct which is associated with an area of classified as a Multiple Use Wetland. This area also incorporates a natural drainage feature.
Other open space has been proposed along Matison Street in the general vicinity of an area mapped as Conservation Category Wetland. This area will be provided as a buffer to the wetland.
2.2 ENVIRONMENTAL ISSUES TO BE ADDRESSED
Environmental issues that have been identified on the site include:
• Acid Sulphate Soils;
• Management of works, including dust and sediment management;
• Potential soil and groundwater contamination, including elevated nutrients, from two former poultry operations;
• High groundwater tables;
WRF PROPERTY LTD –Sub-precinct 3A (1), Southern River: Local Water Management Strategy –Second Revised Version
with Addendum, July 2009
Page 6 06.024 RP001 LWMS Final Revised July 09
• Wetland management issues; and
• The Conservation Category Wetland to the south of the site, part of which is included in Bush Forever Site 464.
These issues are described and addressed by this document to a level that is considered to meet the requirement of the IILWMP at this stage in the planning process. For the majority of identified issues, more detailed assessment and management will be required in subsequent planning phases in accordance with the IILWMP and Department of Environment and Conservation (DEC) policy. However, it is recognised that more detailed work is likely to be required at a later stage to address these issues to the satisfaction of the regulators.
2.2.1 Management of Works
Dust
Dust is generated when there is sufficient wind velocity and frequency to lift fine particles from a surface. The susceptibility of the particles to lift is a function of the size and weight of the particles, the presence of any ground cover, compaction and the moisture content of the ground. The dust management strategy for earthworks on a site should give regard to the surrounding land uses, the closest sensitive receptors and the prevailing wind and climatic condition for the season in which the works are to be conducted.
Dust is considered unlikely to be an issue for the first stages of construction. There are currently no dust sensitive receptors in the area surrounding Sub-precinct 3A(1). When houses are built in the area, the residents of these houses may be affected by the dust from nearby construction. Regardless of this, contractors engaging in civil works should assess their site and develop dust management practices consistent with the guidelines set out on the Department of Environmental Protection (now Department of Environmental and Conservation, DEC) document, Land development sites and impacts on air quality: A guideline for the prevention of dust and smoke pollution from land development sites in Western Australia (DEP,1996). Measures that may be considered during the development phase include the use of shade cloth or hessian wind fencing and wetting down of areas when dust is of concern.
Sediment
Sediment movement is considered unlikely to be an issue during construction. The slopes in the development area are gentle, with the majority of slopes being less than 5%. The sandy soils of the area are considered a low risk of erosion. The steeper areas generally represent ancient sand dunes with high infiltration rates and larger particle sizes. No evidence of erosion has been noted on the site and the risk of significant erosion during works is considered to be low. It is recognised,

WRF PROPERTY LTD –Sub-precinct 3A (1), Southern River: Local Water Management Strategy –Second Revised Version
with Addendum, July 2009
Page 7 06.024 RP001 LWMS Final Revised July 09
however, that the stripping of vegetation and movement of soil during works increases the risk of erosion.
The primary concern for sediment management is the risk of sediment entering waterways, such as Southern River. To avoid this, inspection for erosion should be undertaken on a regular basis (at least weekly during winter) during the works, particularly after rain. This inspection should include inspection of stockpiled soils around the site. If erosion is noted on the site, then steps should be undertaken to minimise it through the use of straw bales or temporary sediment fencing.
As specified by the City of Gosnells, street sweeping will be undertaken during housing construction to avoid sand entering the swales and reducing their effectiveness. Street sweeping will be undertaken every two weeks during the winter wet period.
2.2.2 Other Environmental Issues
The other environmental issues identified under Section 2.2 are discussed in greater detail throughout the document and are therefore not addressed in this section.

WRF PROPERTY LTD –Sub-precinct 3A (1), Southern River: Local Water Management Strategy –Second Revised Version
with Addendum, July 2009
Page 8 06.024 RP001 LWMS Final Revised July 09
3 PRE DEVELOPMENT ENVIRONMENT
3.1 GEOLOGY AND SOILS
3.1.1 Geology
The Geological Survey of Western Australia 1:50 000 Environmental Geological Series Armadale Map Sheets 2033 I and 2133 IV describe the geology at the site as being three units:
SP1 – PEATY SAND – grey to black, fine-medium grained, moderately sorted quartz sand, slightly peaty of lacustrine origin.
S8 – SAND – white to pale grey at surface, yellow at depth, fine-medium grained, moderately sorted, subangular and subrounded, minor heavy minerals of Aeolian origin. (Bassendean Sand)
S10 – SAND – as S8 over sandy clay to clayey sand of the Guildford Formation of Aeolian origin, (Bassendean Sand over Guildford Formation) (Figure 3).
Bores drilled on the site indicate that the site is generally S10 - Bassendean Sand over Guildford Formation. Some iron cementation and material with a higher organic content was found in the Leslie Street Wetland area (MW4), while coffee rock has also been found in some areas (Appendix B).
3.1.2 Soils
The soils of the Southern River site are generally expressed as a grey or white Bassendean sand that grades to Guildford Formation material at a depth of less than 6m BGL (generally about 3-5m BGL) (Appendix B). The Guildford Formation material ranges from silty sand material through to sandy clays. Coffee rock has been found on the edge of the CCW to the South of the site (MW6) and also in one bore near the Egg Farm on Southern River Road (MWA). This indicates that patches of coffee rock may be present in other lower lying areas of the site (Figure 4).
3.1.3 Soil Contamination
A preliminary assessment of the potential for soil contamination was undertaken through a review of historical aerial photographs and a site walkover to identify areas of concern. A desk top study conducted as part of this investigation identified several areas with a low risk of potential contamination. These include general farming activities and the presence of two poultry farms. The potential contaminants identified from these land uses are mainly hydrocarbons, metals and

WRF PROPERTY LTD –Sub-precinct 3A (1), Southern River: Local Water Management Strategy –Second Revised Version
with Addendum, July 2009
Page 9 06.024 RP001 LWMS Final Revised July 09
pesticides associated with farming activities and concentrated nutrients from poultry farming activities.
ENV is currently undertaking Preliminary Site Investigations (PSIs) on the two poultry farms in expectation of a condition of subdivision requiring the investigation and potentially remediation of the sites to the satisfaction of the DEC. The work will be undertaken in line with the Contaminated Sites Act (2005) and DEC’s standards.
3.1.4 Acid Sulphate Soils Assessment
Desktop Investigation
A desktop study conducted for the site identified one area as high risk for PASS and ASS at depths <3.0m located in the north eastern area of the site (WAPC, 2004). The rest of the site is classified as moderate to low risk of PASS and ASS at depth >3.0m. Figure 5 provides the mapped areas of ASS risk.
Field Testing for Acid Sulphate Soils
Four holes, MW2 to MW5, were drilled at various locations across the site to an approximate depth of 6.0m in 2005 (Appendix B). MW4 and MW5 targeted the high risk area. Soil sampling occurred approximately every 250mm. Field testing conducted on the samples indicates the presence of Potential Actual Acid Sulphate (PASS) soils in MW3, MW4 and MW5. Positive acid sulphate soils tests were generally found at depths of greater than 2.5m below ground level however PASS was detected at 1.5m in MW5 (Appendix B).
Testing for Actual Acid Sulphate Soils (AASS) was also conducted on samples and did not indicate the presence of AASS in any of the samples. Laboratory testing was conducted on the samples to confirm the presence of PASS, indicated in the field testing.
Based on the likely presence of acid sulphate soils in three of the four locations drilled, further acid sulphate testing will be conducted at the site, including additional drilling, sampling and analytical work. This additional work will also better delineate the vertical extent of the presence of PASS.
ASS Results
Field testing for ASS has indicated the presence of Potential Actual Acid Sulphate (PASS) soils in MW3, MW4 and MW5 at depth. Positive ASS soils were generally found at depths of 1.5 – 6.0m below ground level. Field tests indicate that no Actual Acid Sulphate Soils (AASS) is present on site. Laboratory testing was conducted on the samples to confirm the presence of PASS, as indicated in the field testing. Soil logs for the holes are shown in Appendix B.
WRF PROPERTY LTD –Sub-precinct 3A (1), Southern River: Local Water Management Strategy –Second Revised Version
with Addendum, July 2009
Page 10 06.024 RP001 LWMS Final Revised July 09
Initial investigations have indicated that Acid Sulphate Soils on site are of most concern in areas that will be dewatered due to drainage or for installation of services such as sewers.
Although the site is surrounded by a number of sensitive receptors, the potential sources identified in this investigation are not considered to be of high risk. It is therefore considered that effective management of the potential risks and any identified contamination will be possible.
Management Strategy
The current mapping and preliminary field work indicates that ASS is a concern on the site for sewer construction only. Therefore further assessment is required prior to the submission of a dewatering licence so sewer construction can take place. Acid Sulphate Soils are best assessed at a subdivision stage, when the depths of excavation and dewatering required for sewers are known. Undertaking ASS assessment before sewer design is undertaken often results in sampling being undertaken over insufficient depths or in the wrong location. The work must then be redone when the sewer layout is known.
Acid Sulphate Soils Investigation will therefore be carried out as required by the sewer and other servicing requirements of the individual developments. Investigation will be carried out to the DEC guidelines on the advice of the Land and Water Quality Branch.
If the investigations reveal that ASS are present, then an ASS Management Plan will be developed that addresses the specific constraints and issues raised. This management plan will address the issues of the temporary lowering of groundwater to install sewers and the disposal of dewatering management. It is not clear at this stage whether lowering of groundwater will be required for sewer installation. If this is the case, it is expected that the dewatering water will be able to be disposed of by infiltration on site. If ASS is considered to be a significant issue based on DEC/DoW advice, the pH of the dewatering water will be monitored and the water limed to increase the pH if required.
The ASS Management Plan will be reviewed by the DEC and DoW prior to implementation during the construction phase. Without the approval of these agencies, dewatering and sewer installation cannot commence. The regulator approved monitoring will then be carried out during the construction phase and a post-construction monitoring report, including at least six months’ groundwater monitoring, will be prepared for the DEC/DoW’s approval. The process will conform to the DoE’s ASS guideline: Draft Identification and Investigation of Acid Sulphate Soils (May 2006) and/or other guidelines that are relevant at the time.

WRF PROPERTY LTD –Sub-precinct 3A (1), Southern River: Local Water Management Strategy –Second Revised Version
with Addendum, July 2009
Page 11 06.024 RP001 LWMS Final Revised July 09
3.2 GROUNDWATER
3.2.1 Groundwater Work by Others
Groundwater monitoring and contouring for the Southern River area was initially undertaken by JDA (2002) and then updated by Rockwater (2005). The Rockwater report only provides 5m contours for the area, which makes it difficult to interpolate the results at a site level. Requests were made to the relevant authorities for more detailed contouring but advice was given that the JDA contours should be used instead (J. Wegner, personal communication). The JDA contours indicate that groundwater flow on the site is in a generally east to north-easterly direction, towards Southern River (Figure 6) with Average Annual Maximum Groundwater Levels (AAMGLs) varying between 20.0m AHD in the west and 17.5m AHD in the east. The JDA study did not include any bores on this site. These contours are considered more accurate than the Perth Groundwater Atlas (DoE, 2005) in this area.
3.2.2 Site Hydrology
The surface and groundwater conditions of Sub-precinct 3A(1) are governed by the relatively low permeability of the underlying clayey soils and flat nature of the site. When rain falls on the site, it may pond at the surface and move towards low points on the site, such as the Leslie Street wetland and the corner of Southern River Road and Leslie Street. These points may also represent places where groundwater comes to the surface of the site. The clayey layers close to the surface maintain an effectively perched groundwater system over much of the site. The groundwater levels on the site are controlled by the Matison Street Drain on the site, Southern River to the east and the Forrestdale Main Drain to the south.
Results of bore pumping records indicate that the unconfined aquifer is perched in places. In August 2005, (a wet period), of four bores placed on the site, only two, one at the Leslie Street wetland and one at the Chicken Farm, were able to produce the 20 L volume required for a full purge. The other three bores became dry before this volume could be produced indicating shallow perched lenses of groundwater or a tight aquifer with low porosity, or possibly elements of both.
3.2.3 On Site Groundwater Levels
Groundwater levels were measured between August 2005 and November 2007 (Appendix C). Groundwater levels on the site were initially monitored at four locations on three successive occasions:
• MW2: Adjacent to a former broiler farm in the south-west of the site (near Matison Street). The area is currently used for horse agistment;
• MW3: The current poultry egg farm on Southern River Road;
WRF PROPERTY LTD –Sub-precinct 3A (1), Southern River: Local Water Management Strategy –Second Revised Version
with Addendum, July 2009
Page 12 06.024 RP001 LWMS Final Revised July 09
• MW4: Paddock adjacent to the Leslie Street wetland; and
• MW5: Paddock in the north-east corner of the site.
These locations are shown on Figure 4.
In May and June 2006, four further bores were constructed to investigate groundwater levels and quality near the CCW and potential impacts from the former broiler hen farm and current poultry egg farm on the site. These bores were:
• MW6: Adjacent to the CCW on Matison Street;
• MWA: Down gradient of the of the former poultry egg farm;
• MWB: Up gradient of the current poultry egg farm on the corner of Southern River Road and Bradley Street.
• MWC: Down hydraulic gradient of the former broiler farm.
These locations are shown on Figure 4. The first of these, MW6, was constructed and monitored in May 2006 along with MW4 to MW6. All eight bores were monitored between July 2006 and November 2007. Results of the monitoring are given in Appendix C.
Groundwater levels were lowest in March 2007 and highest in October 2007. Water levels in two local Department of Water bores, known as T75 and 8285 were also measured. The groundwater levels on the site varied between 13.3 m AHD (MB5 in March 2007) and 19.5 m AHD (MBB in October 2007). In all cases, groundwater flows were in a generally easterly direction, towards Southern River. This is line with the groundwater work undertaken by JDA (2002).
3.2.4 Average Annual Lowest Groundwater Levels
July 2006 groundwater levels varied from 18.76m AHD at MW2 in the south-west of the site to 14.97m AHD at MW5 in the north-eastern corner. This area represents a low point where the Guildford Formation is close to the ground surface. Groundwater levels were also measured at the nearest DoE monitoring bore, T751 to obtain an Average Annual Lowest Groundwater Level (AALGL) (Figure 7). This date was chosen because the new bores had been installed and groundwater levels in the area were still very low due to the lack of rain in the previous months. The AALGL calculations and a graph of the bore record for T75 are shown in Appendix B. AALGLs for the site varied between 14.06m AHD in the north-eastern corner of the site and 17.85m AHD in the south-western corner. Average Annual Maximum Groundwater calculations will be undertaken following peak groundwater
1 The location of T75 is shown in Figure 6.

WRF PROPERTY LTD –Sub-precinct 3A (1), Southern River: Local Water Management Strategy –Second Revised Version
with Addendum, July 2009
Page 13 06.024 RP001 LWMS Final Revised July 09
levels this spring. The four extra bores developed in 2006 will allow for more accurate determination of groundwater levels than would be possible with the previous data.
3.2.5 Average Annual Maximum Groundwater Levels
The first version of the LWMS did not include a calculation of Average Annual Maximum Groundwater Levels (AAMGLs) because the very low rainfall in winter 2006 meant that water levels in that year were not considered representative of an average winter. While the 2007 Perth total rainfall of 703mm was lower than the average 855mm, it was significantly greater than the 2006 total of 467mm. The total rainfall in 2005 was 875mm. In Sub-precinct 3A(1), this meant that surface water that was observed in Spring 2005 and 2007 was not observed in 2006. Therefore, the groundwater levels encountered in 2005 and 2007 could be considered more representative of an average winter than the groundwater levels in 2006 and were therefore used to calculate the AAMGL (Figure 8).
The Department of Water Bore T75 (WIN ID 4880) was used to calculate the AAMGL. This bore is located approximately 1km north-east of the site (Figure 6). Readings from 11 October 2007 and 28 August 2005 were used, depending on which represented the peak water level at that particular monitoring bore.
The Average Annual Maximum Groundwater Levels for the site varied between 20.2 and 17.3m AHD, as shown in Figure 9. Depth to AAMGL varied from greater than 3m in the west of the site to approximately zero along the 18m contour in the south-east of the site, which represents a drain (Figure 8). The AAMGL calculated for the site is similar to the groundwater levels calculated for the area under an average rainfall scenario (Rockwater, 2005) and slightly higher than the levels calculated by JDA (2002). The Rockwater report indicates an 18m contour near Leslie Street, rising to greater than 20m AHD near Holmes Street. Under this scenario, only a small area near the Leslie Street Drain was expected to be inundated (Rockwater, 2005). This is consistent with observations on the site.
3.2.6 Superficial Groundwater Quality
Guidelines
No formal guidelines exist for nutrient levels in groundwater in the Swan Coastal Plain and therefore the Swan Canning Catchment Clean Up Criteria developed by the Swan River Trust have been used as a guide (Table 1). Guidelines exist where water is proposed to be used for irrigation or drinking water or for near pristine wetland systems (ANZECC, 2000) but these are not considered appropriate in this case. The SRT levels have been used as indicator levels for groundwater quality.

WRF PROPERTY LTD –Sub-precinct 3A (1), Southern River: Local Water Management Strategy –Second Revised Version
with Addendum, July 2009
Page 14 06.024 RP001 LWMS Final Revised July 09
Table 1: Swan-Canning Cleanup Program targets for median total nitrogen and total phosphorus concentration in tributaries of the Swan-Canning Rivers (SRT, 1999) and median concentrations from Southern River (SRT, not dated)
Nitrogen (mg/L) Phosphorus (mg/L)
SRT Short-Term Target 2.0 0.2
SRT Long-Term Target 1.0 0.1
Southern River Median Concentration (2001)
0.87 0.15
Sampling
Tables 2 and 3: Total Nitrogen and total phosphorus results
Total NitrogenDate MB2 MB3 MB4 MB5 MB6 MBA MBB MBC
16/08/2005 5.6 7.8 22.4 14.9 # # # #7/03/2006 3.0 dry 14.0 17.0 # # # #4/07/2006 1.1 dry 3.0 1.9 5.0 2.4 10.4 5.6
10/08/2006 2.4 3.3 2.6 2.1 4.9 4.9 7.5 4.813/09/2006 2.9 3.9 3.6 8.2 3.5 8.0 2.8 9.121/03/2007 dry dry 2.2 5.9 3.6 2.9 dry dry
Total Phosphorus Date MB2 MB3 MB4 MB5 MB6 MBA MBB MBC
16/08/2005 1.72 8.56 2.71 1.14 # # # #7/03/2006 0.6 dry 0.35 1.2 # # # #4/07/2006 0.19 dry 0.08 0.2 0.09 0.12 0.44 11.2
10/08/2006 0.25 5.7 <0.05 <0.05 <0.05 0.1 0.25 <0.0513/09/2006 0.14 5.9 <0.01 0.29 0.06 0.05 0.14 1521/03/2007 dry dry 0.05 1.1 0.14 0.11 dry dry
All values in mg/L. (a) Sampling was attempted on 24/5/06 but all wells purged dry before sample could be taken.# bores constructed in 2006
Meets long term SRT guideline (1 mg/L TN and 0.1 mg/L TP)Meets short term SRT guideline (2 mg/L TN and 0.2 mg/L TP)Does not meet either guideline

WRF PROPERTY LTD –Sub-precinct 3A (1), Southern River: Local Water Management Strategy –Second Revised Version
with Addendum, July 2009
Page 15 06.024 RP001 LWMS Final Revised July 09
Groundwater sampling was undertaken on:
• 16 August 2005;
• 7 March, 4 April, 10 August and 9 September 2006; and
• 21 March 2007.
Groundwater sampling was also attempted on 25 May 2006. On this date, the wells purged dry almost immediately. This is considered to be due to the water table having retreated into the clay layer, which has a very low hydraulic conductivity. Because the wells purged dry so rapidly, no water sampling was undertaken. It was therefore proposed to change to methods that were more suitable for low volumes. Using these methods, groundwater sampling was successfully undertaken on 4 July 2006. All groundwater sampling results are shown in Appendix E.
Nitrogen
The total nitrogen levels on site varied from 1.1 to 22.4mg/L, with an average of 8.2mg/L and a median of 5.6mg/L (Table 2). Groundwater nitrogen levels appeared to decrease over the study period. These results are similar to those recorded at Bletchley Park, to the east of the site (GHD, 2005a). Bletchley Park has historically been used as pasture and is not considered to have been subject to any contaminating land uses (GHD, 2005a).
The elevated nitrogen levels appear to be across the entire area with no distinct high or low points. The bores located downstream of the poultry farms (MB3 and MBC) did not appear to have significantly different nitrogen levels from the rest of the bores. Only two of the samples met the SRT short term guideline of 2mg/L total nitrogen. None met the SRT long term guidelines. Where a break down of nitrogen into different chemical forms was taken, this is shown in Appendix E. Kjeldahl nitrogen (nitrogen in organic forms) was the dominant form of nitrogen in most bores.
Phosphorus
The total phosphorus levels varied between less than 0.05mg/L to 15mg/L (Table 3). The total phosphorus results from August 2006 are significantly lower than the rest of the results. These results are questionable and the difference may be due to laboratory error. As no triplicate samples were taken, it is not possible to determine if this is the cause.
Total phosphorus levels were generally above the Swan River Trust Long Term guideline of 0.1mg/L. The total phosphorus concentrations at the bores down hydraulic gradient of the former poultry farms, MBC and MB3 were higher than the

WRF PROPERTY LTD –Sub-precinct 3A (1), Southern River: Local Water Management Strategy –Second Revised Version
with Addendum, July 2009
Page 16 06.024 RP001 LWMS Final Revised July 09
results for the other bores. Ignoring the August 2006 round, total phosphorus levels for MBC and MB3 ranged between 5.7 and 15mg/L, which is higher than the less than 0.05mg/L to 2.7mg/L recorded at the other bores. It is therefore likely that the use of these sites as poultry farms has impacted upon the groundwater phosphorus concentrations in the area.
3.3 SURFACE WATER HYDROLOGY
Drainage
The site has two ephemeral surface water drains (Figure 9). The longest of these drains transects the site in a roughly south-easterly direction from Southern River Road to Matison Street and will be referred to as the Matison Street Drain. The drain both receives surface water intercepts seasonal groundwater and forms a seasonally inundated area in the north-eastern corner of the site (Figure 9). Surface water levels at this location have been recorded at 0.5m deep after winter rains (Table 4). On leaving the site, the Matison Street Drain heads south-east along Leslie Street and into Southern River.
Table 4: Recorded Surface Water Levels Date Date 16/08/2005Rain * Rain * 21.8 / 29
Recorded LevelSW1 - 0.68SW2 - 0.57Dm - -
Level (AHD)SW1 - 18.07SW2 - 20.80Dm - -
Water DepthSW1 - 0.31SW2 - 0.49Dm - -
The second drain starts near the corner of Southern River Road and Leslie Street and heads from the site in a north-easterly direction towards Southern River. This corner is waterlogged after rain but does not flood due to the flat nature of the site. This area feeds the ephemeral drain, known as the Southern River Rd Drain.
Based on information from the Department of Water, the site is not affected by the 1 in 100 year flood plain of Southern River or the Forrestdale Main Drain (Figure 10).
WRF PROPERTY LTD –Sub-precinct 3A (1), Southern River: Local Water Management Strategy –Second Revised Version
with Addendum, July 2009
Page 17 06.024 RP001 LWMS Final Revised July 09
Catchment Boundaries
Five catchments have been identified within Sub-precinct 3A (Figure 11). As the boundaries of these catchments lie outside Sub-precinct 3A(1) and the drainage design has been undertaken for the whole of Sub-precinct 3A, the catchments are described for the whole of Sub-precinct 3(A).
The first catchment is located on the corner of Southern River Road and Leslie Street and forms the start of the Southern River Road Drain. Catchment 1 drains in a north-easterly direction towards a drain on the corner of these roads. The estimated area of this catchment is 3ha. This catchment forms part of the JDA catchment SR14. The remainder of this catchment lies to the east of Leslie Street.
The second catchment is the largest and runs between Southern River Road and Matison Street. This catchment slopes in an easterly direction. Catchment 2 accepts a very small volume of drainage from the road junction to the north, which drains onto the site at the poultry egg farm. This road drainage may include some runoff from the Sutherland Park ovals. The water then drains into the Leslie Street wetland and out to Matison Street via a drain. This is the main catchment of the site, with an approximate area of 24ha. This catchment and Catchment 3 forms the JDA catchment SR12.
Catchment 3 runs parallel to Catchment 2, although it is bounded by a small ridge to the north. This catchment does not appear to have any wetland characteristics or a defined drain. This catchment is in general slightly higher than Catchment 2 and has an approximate area of 8ha. Much of the catchment will be redirected to be included in Catchment 2, with the balance to Catchment 4 following proposed earthworks.
Catchment 4 also runs parallel to Catchment 2. It is bounded by the ridge to the north and the sand quarry to the south. The area of this catchment is approximately 11ha, including the sand quarry. This catchment and Catchment 5 forms the JDA catchment SR14.
Catchment 5 is a small catchment that currently drains in a westerly direction, under Holmes Road and through Precinct 2. In the Forrestdale Arterial Drainage Strategy (Interim) (Water Corporation, 2007 b), the Water Corporation advises that the drainage connection through Precinct 2 will be closed. Under this scenario Catchment 5 will be required to drain south through Catchment 3. Catchment 5 has a total area of 7ha.
3.3.1 Surface Water Quantity
Surface water flows can be quantified either through stream flow monitoring or by undertaking of streamflow calculations as prescribed by Australian Rainfall and Runoff (Institution of Engineers Australia, 1986). Because of the small size of the

WRF PROPERTY LTD –Sub-precinct 3A (1), Southern River: Local Water Management Strategy –Second Revised Version
with Addendum, July 2009
Page 18 06.024 RP001 LWMS Final Revised July 09
streams on site and the difficulties associated with installing and maintaining pluviometers, it was considered that calculations were the best way to determine flows from the site. This approach was supported by the regulatory authorities for this site. Based on the methods of described in Australian Rainfall and Runoff and the base assumptions of JDA (2002) for the Southern River area, the following peak flows were determined for each catchment:
Table 5: Modelled Peak Outflows for Each Drain Under Storm Events With Different Average Return Intervals (Aris) for the Whole of Sub-precinct 3A. All values are in m3/s. (a) figures supplied from JDA (2002)
1 in 10 year ARI 1 in 100 year ARIWestern Catchment (SR9) 0.043 a 0.134 a
Matison Street Drain (SR12) 0.083 a 0.134 a Southern River Road Drain (part SR14) 0.01 0.026
As discussed in Section 3.3, a section of paddock around the Matison Street Drain becomes inundated in winter. This area is generally referred to as the Leslie Street Wetland. This area is shown in Figure 9.
3.3.2 Surface Water Quality
Preliminary surface water quality sampling was undertaken on 16 and 23 August, 2005. Sampling was also attempted on 7 March, 25 May and 4 July 2006 and 21 March 2007 but no surface water was present on the property at this stage. Samples were taken from the drain entering the site on Southern River Road (Dc) upstream of the former poultry farm, in the Leslie Street wetland (SW2) and where the drain exits the site near the corner of Leslie Street and Matison Street (Dm) (Figure 9). On the 23 of August, a sample was also taken immediately downstream of the poultry egg farm (Dds). The results of this sampling are shown in Table 3. One filtered and one unfiltered sample were taken at each location.

WRF PROPERTY LTD –Sub-precinct 3A (1), Southern River: Local Water Management Strategy –Second Revised Version
with Addendum, July 2009
Page 19 06.024 RP001 LWMS Final Revised July 09
Table 6: Surface Water Quality
16 August 2005 Dc Dm SW2
Suspended Solids (SS) mg/L 7 6 4Dissolved NutrientsTotal Nitrogen as N mg/L 2.6 4.5 1.4Total Phosphorus as P mg/L 0.35 0.76 0.04Total NutrientsTotal Nitrogen as N mg/L 2.9 4.7 1.6Total Phosphorus as P mg/L 0.4 0.88 0.07
23 August 2005 Dc Dds Dm SW2
Suspended Solids (SS) mg/L 7 <5 <5 8Dissolved NutrientsTotal Nitrogen as N mg/L 4.8 6.3 5.2 4.8Total Phosphorus as P mg/L 0.5 0.3 0.55 0.2Total NutrientsTotal Nitrogen as N mg/L 4.3 5.9 4.8 4.8Total Phosphorus as P mg/L 0.2 0.3 0.55 0.25
Note: No surface water observed during 2006.
Meets long term SRT guideline (1 mg/L TN and 0.1 mg/L TP)Meets short term SRT guideline (2 mg/L TN and 0.2 mg/L TP)Does not meet either guideline
The surface water flows currently present on the site have low total suspended solids and most of the nutrients are present in a dissolved, rather than particulate, form. The nitrogen levels on the site are above the long-term guidelines for tributaries to the Swan and Canning Rivers and are well above the 2001 median concentrations for Southern River (Table 3). The sample from the wetland (SW2) met the short-term guidelines for nitrogen.
Only one of the samples meets the short-term guidelines for phosphorus on the Swan Coastal Plain of 0.2mg/L (Table 6). The results are all above the 2001 median concentration for phosphorus in Southern River of 0.18mg/L (Table 6). These elevated levels of nitrogen and phosphorus indicate that nutrient issues are already a concern on the site.
The results from sampling of the Matison Street Drain immediately downstream of the poultry egg farm are not different from those of other sampling locations and are comparable to water quality as it enters the site to the north of the poultry egg farm. The poultry egg farm initially appears to have no or little effect on the surface water quality of the site. However, further surface water monitoring is proposed to
WRF PROPERTY LTD –Sub-precinct 3A (1), Southern River: Local Water Management Strategy –Second Revised Version
with Addendum, July 2009
Page 20 06.024 RP001 LWMS Final Revised July 09
refine the water quality data. This monitoring will include early winter, mid-winter and end of winter events.
3.4 ENVIRONMENTAL ASSETS AND WATER DEPENDANT ECOSYSTEMS
3.4.1 Wetlands
The Southern River site contains three Multiple Use Category wetlands (Figure 10). A Conservation Category Wetland is located to the south of the site, across Matison Street.
The status and condition of the wetlands on site was assessed in 2005 as part of a Vegetation Survey undertaken by the City of Gosnells. This report has recently been released by City of Gosnells (ENV, 2006). This report indicated that based on vegetation quality, ecological and human value, the Multiple Use wetlands present in the area are of insufficient conservation significance and should therefore be considered available for development purposes.
3.4.2 Vegetation
The site has been largely cleared and limited vegetation is present on the site. The vegetation on the site was assessed in 2005 as part of a Vegetation Survey undertaken by the City of Gosnells. The study identified that most of the vegetation in Sub-precinct 3A(1) was completely degraded, with small areas of vegetation in a degraded or good condition (Figure 12), (ENV, 2006).
The vegetation identified in good to degraded condition in the eastern part of the site is a Low Open Woodland of Banksia menziesii, Melaleuca preissiana, Corymbia calophylla and Eucalyptus todtiana over Kunzea glabrescens, Regelia ciliata ,Xanthorrhoea preissii , Phlebocarya ciliata and Dasypogon bromeliifolius (ENV, 2006). The vegetation in good condition in the western part of the site is a Low Open Woodland of Eucalyptus todtiana, Banksia ilicifolia, Banksia attenuata, Banksia menziesii and Nuytsia floribunda over Adenanthos cygnorum, Eremaea pauciflora var. pauciflora, Hibbertia hypericoides, Allocasuarina humilis, Xanthorrhoea preissii and Lyginia imberbis (ENV, 2006). Neither of these communities are considered to be Threatened Ecological Communities (ENV, 2006).
WRF PROPERTY LTD –Sub-precinct 3A (1), Southern River: Local Water Management Strategy –Second Revised Version
with Addendum, July 2009
Page 21 06.024 RP001 LWMS Final Revised July 09
4 DESIGN CRITERIA
4.1 WATER CONSERVATION
Principle
The use of potable water should be minimised where drinking water quality is not essential, particularly outside the house
Design Objectives
A consumption target for potable water of 40-60kL/person/year for the residential sector has been set for the Southern River area (Water Corporation, 2007 a). This is well below the 155kL/person/year water use targeted by the State Water Strategy (Government of Western Australia, 2003). This target is therefore ambitious.
Assuming an occupancy rate of 2.4 residents per house (based on the 2001 census (Australian Bureau of Statistics website, accessed 17/10/2006)), the target set for Southern River gives a potable water goal of 96 – 144kL/house per year. Rockwater (2004) indicates that the total annual water use expected for a Waterwise house is 149kL/house/yr internally and a further 155kL/house/yr externally, giving a total of 304kL/house/yr annual water use without water restrictions. This compares to the current potable water use average of 274kL/house/yr (J. Brennan, Water Corporation, personal communication). These total water uses are well above the Southern River target and hence significant effort is required to meet this goal. This issue is discussed further in Section 5.
Site Proposal
The main opportunities for reducing potable water use involve reducing water use in the garden and encouraging residents to be water wise. Alternative water sources in the area include groundwater, rainwater collected from rooves and greywater. These options are further discussed in Section 5.
4.2 STORMWATER QUANTITY
Principle
Post development peak flows and event discharge volume be maintained relative to pre-development conditions, unless otherwise established through determination of Ecological Water Requirements for sensitive environments (Water Corporation, 2007 a).

WRF PROPERTY LTD –Sub-precinct 3A (1), Southern River: Local Water Management Strategy –Second Revised Version
with Addendum, July 2009
Page 22 06.024 RP001 LWMS Final Revised July 09
Design Objectives
For Ecological Protection: For the critical 1 year Average Recurrence Interval (ARI) event, the post development discharge volume and peak flow rates shall be maintained relative to pre-development conditions in all parts of the catchment. Where there are identified impacts on significant ecosystems, maintain or restore desirable environmental flows and/or hydrological cycles as specified by the Department of Water.
For Flood Management: Manage the catchment runoff for up to the 1 in 100 year ARI event within the development area to predevelopment peak flows.
Site Proposal
Stormwater peak flows will be maintained through the use of compensation and retention structures such as swales and basins. These structures will be designed to maintain the discharge peaks of events up to the 1 in 10 yr ARI. Retention and peak flow mitigation for events greater than this may be limited due to area constraints on the site.
Flows in the 1 in 100 year events will be discharged generally through their current flow lines. For catchments where the 1 in 100 year flow line goes through the Conservation Category Wetland to the south of the site, this flow line will be maintained, as shown in the Water Corporation’s Forrestdale Arterial Drainage Strategy (2007b).
4.3 STORMWATER NUTRIENT MANAGEMENT
Principle
Reduction in the average annual loads of stormwater pollutants discharged by the development into the surface water and groundwater systems if it used traditional, directly connected stormwater drainage design (Water Corporation, 2007a).
Design Objectives
As compared to a development that does not actively manage water quality:
• At least 80% reduction in the average annual load of total suspended solids.
• At least 60% reduction in the average annual load of total phosphorus.
• At least 45% reduction in the average annual load of total nitrogen.
• At least 70% reduction in the average annual load of gross pollutants.
Site Proposal

WRF PROPERTY LTD –Sub-precinct 3A (1), Southern River: Local Water Management Strategy –Second Revised Version
with Addendum, July 2009
Page 23 06.024 RP001 LWMS Final Revised July 09
Stormwater will be treated through a system of swales and vegetated retention basins to reduce nutrient loads leaving the site. This system has been modelled with MUSIC. MUSIC modelling results show the development meeting the design objectives. Results of this modelling are given in Section 6.
4.4 GROUNDWATER QUANTITY
Principle
Minimise change in peak winter levels at groundwater dependent wetlands due to change in groundwater flux associated with urbanisation (Water Corporation, 2007a).
Design Objectives
Post development end of winter operating levels at wetlands to be maintained at pre-development levels, unless otherwise established through determination of Ecological Water Requirements for sensitive environments.
Site Proposal
The current development is associated with a drain that intercepts the winter water table in the form of the Matison Street Drain. This drain will be heavily altered during development to become a swale with a base at or above AAMGL. Where the drain intercepts shallow groundwater, the proponent will minimise the discharge of pollutants from the shallow groundwater to the intersecting waterway or drain.
The current development has a limited hydrological association with the Conservation Category Wetland to the south of the site. As groundwater flow on the site is in a generally easterly direction, only water from the extreme south-west corner is likely to impact on the wetland. The main groundwater impact of development could be due to potential changes in the water balance in this area.
It is proposed that in the 1 in 100 year storm, some stormwater from the development would also enter the wetland via overland flow. The volume of this inflow would be limited. This is further discussed in Section 8.

WRF PROPERTY LTD –Sub-precinct 3A (1), Southern River: Local Water Management Strategy –Second Revised Version
with Addendum, July 2009
Page 24 06.024 RP001 LWMS Final Revised July 09
4.5 GROUNDWATER QUALITY
4.5.1 Where Development is Associated with a Waterway or Open Drain that Intersects the Shallow Water Table
Principle
Minimise the discharge of pollutants from the shallow groundwater to the intersecting waterway or drain.
Design Objectives
Where drains intercept the groundwater, compared to a development that does not actively manage water quality, the development will show an:
• at least 60% reduction in the average annual load of total phosphorus; and
• at least 45% reduction in the average annual load of total nitrogen.
Site Proposal
Nutrient inputs to groundwater may occur directly from water infiltrated on site or indirectly through stormwater runoff being infiltrated on site. Quantifying nutrient inputs to groundwater is difficult and ENV is not aware of a model that can do this with any degree of reliability. It is therefore proposed to use best management practice to reduce nutrient inputs from the development.
The site is associated with an existing drain which intercepts shallow groundwater during the winter months. The reduction of the nutrient loads from this drain will occur through the use of vegetation to uptake nutrients swales and other drainage related infrastructure as described in Section 6.
The former poultry farms are being assessed as contaminated sites in line with the DEC guidelines. Management practices to prevent groundwater contamination from these sites include remediation in line with the Contaminated Sites Act (2003) and the removal of the top 300 mm of soil, which is considered to contain most of the nutrients.
Best management practices such as high PRI soil amendments and not fertilising POS will be incorporated during landscaping to reduce nutrient movement into groundwater.

WRF PROPERTY LTD –Sub-precinct 3A (1), Southern River: Local Water Management Strategy –Second Revised Version
with Addendum, July 2009
Page 25 06.024 RP001 LWMS Final Revised July 09
4.5.2 Where the Development is Associated an Ecosystem that is Dependent Upon a Particular Hydrological Regime for Survival
Principle
a Minimise the discharge of pollutants from the development into the shallow groundwater.
b Minimise the discharge of pollutant from the groundwater to the receiving water.
c Maintain or restore desirable environmental flows and/or hydro-periods, water quality and habitat in specified water sensitive environments.
d Develop alternative habitats if feasible and desirable.
Site Proposal
The relationship between the development and the Conservation Category Wetland to the south is limited, as described in Section 4.4. Groundwater flow on the site is in an easterly direction and it is therefore considered that the hydrological links between the areas are limited. However, the potential impact will be minimised by limiting the use of subsoil drainage in the area. Any proposal for subsoil drainage within 100m of the CCW will be required to demonstrate that the impact on the wetland is not unacceptable.
The wetland will only receive surface water from the site during extreme events (1 in 100 year storm or greater) in line with the Water Corporation’s Forrestdale Main Drain Arterial Drainage Scheme (2007 b). Complete water quality management in such extreme events is not feasible due to the size of the retaining structures involved and the rarity with which the structures would be fully utilised.
The impact of the development on the wetland will therefore be limited to changes in groundwater level due to alternative uses of groundwater and inputs from storms.
4.6 COMMITMENT TO BEST MANAGEMENT PRACTICE
The developer is committed to:
• decreasing potable water use on the site in ways that are environmentally sensitive and economically feasible for a development of this size.
• maintaining the stormwater outflows to pre-development levels for events up to and including the 1 in 100 year ARI storm event.
• Implementing best management practice for stormwater nutrient management within the normal percentages of land set aside for road reserve, drainage and

WRF PROPERTY LTD –Sub-precinct 3A (1), Southern River: Local Water Management Strategy –Second Revised Version
with Addendum, July 2009
Page 26 06.024 RP001 LWMS Final Revised July 09
Public Open Space. The systems will also be designed to manage nutrients in groundwater where this is intercepted by the drains.
• Managing the hydrological impacts of development on the Conservation Category Wetland to the south of the site.
WRF PROPERTY LTD –Sub-precinct 3A (1), Southern River: Local Water Management Strategy –Second Revised Version
with Addendum, July 2009
Page 27 06.024 RP001 LWMS Final Revised July 09
5 WATER CONSERVATION STRATEGY
5.1 OPTIONS UNDER CONSIDERATION
The small scale of the Sub-precinct 3A(1) development means that large scale water conservation strategies such as large scale aquifer storage and recovery (ASR) or wastewater recycling projects of a third pipe nature are constrained by infrastructure costs and the associated impact on the ultimate affordability of the housing.
These options were considered, however, the systems involved are complex and must be operated by a Licensed Service Provider (LSP) that has been licensed by the Economic Regulation Authority. The only LSP currently operating in the Metropolitan area is Water Corporation. Water Corporation has indicated that they are only interested in becoming involved in a small number of trial projects for alternative water supplies in the Metropolitan region that are economically viable in their own right or could lead to larger, economically viable schemes (Water Corporation, 2006).
An alternative option would involve another body (such as the City of Gosnells) becoming a LSP to operate such a scheme. Becoming a LSP is an intensive and expensive process and has limited benefits for isolated LSP providers, particularly if the long-term economic benefits of the associated scheme are limited.
The options considered feasible for this development are therefore limited to:
• domestic use of rainwater tanks for gardens, toilets and washing machine cold water inlets;
• use of greywater, roof water or groundwater for residential gardens;
• use of shallow groundwater for residential gardens as well as Public Open Space; and
• Waterwise practices in the house, garden and within the development.
Large scale projects are considered unlikely to be feasible in this area. Lot based options, where householders reduce their water use through the use of rainwater tanks, and other options are therefore preferred in Sub-precinct 3A(1). The four options listed above are described in detail below.
Previous versions of the LWMS discussed the potential for a shared bore scheme. The shared bore proposal was discussed with Landgate, who indicated that the management of such a strata scheme would not be feasible. If the equipment broke down, there would be no legal way of ensuring that the individual householders paid their share of the electricity and repair costs. If the system
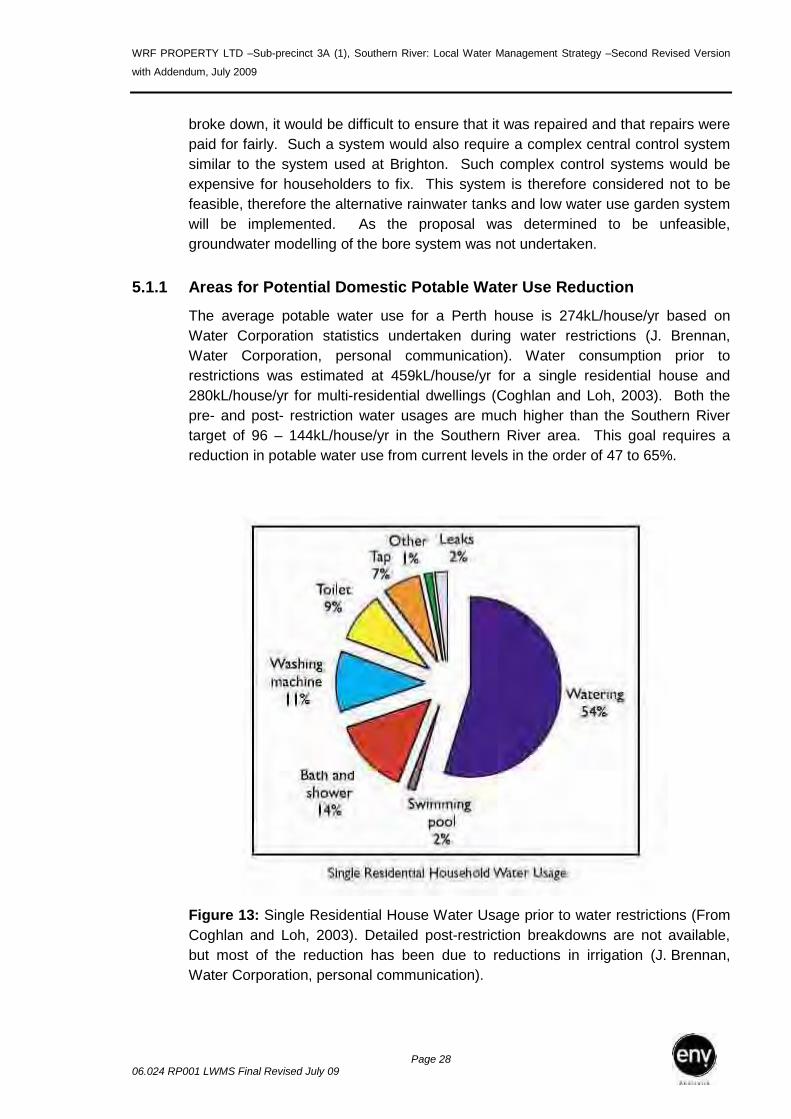
WRF PROPERTY LTD –Sub-precinct 3A (1), Southern River: Local Water Management Strategy –Second Revised Version
with Addendum, July 2009
Page 28 06.024 RP001 LWMS Final Revised July 09
broke down, it would be difficult to ensure that it was repaired and that repairs were paid for fairly. Such a system would also require a complex central control system similar to the system used at Brighton. Such complex control systems would be expensive for householders to fix. This system is therefore considered not to be feasible, therefore the alternative rainwater tanks and low water use garden system will be implemented. As the proposal was determined to be unfeasible, groundwater modelling of the bore system was not undertaken.
5.1.1 Areas for Potential Domestic Potable Water Use Reduction
The average potable water use for a Perth house is 274kL/house/yr based on Water Corporation statistics undertaken during water restrictions (J. Brennan, Water Corporation, personal communication). Water consumption prior to restrictions was estimated at 459kL/house/yr for a single residential house and 280kL/house/yr for multi-residential dwellings (Coghlan and Loh, 2003). Both the pre- and post- restriction water usages are much higher than the Southern River target of 96 – 144kL/house/yr in the Southern River area. This goal requires a reduction in potable water use from current levels in the order of 47 to 65%.
Figure 13: Single Residential House Water Usage prior to water restrictions (From Coghlan and Loh, 2003). Detailed post-restriction breakdowns are not available, but most of the reduction has been due to reductions in irrigation (J. Brennan, Water Corporation, personal communication).
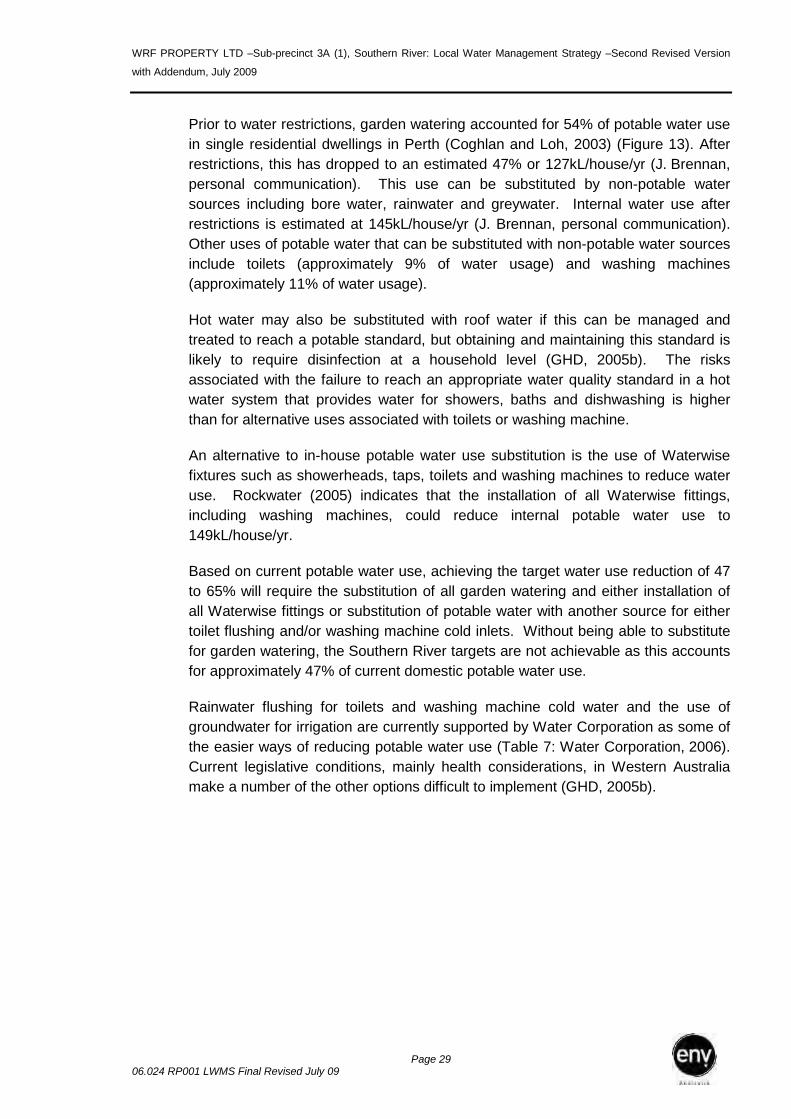
WRF PROPERTY LTD –Sub-precinct 3A (1), Southern River: Local Water Management Strategy –Second Revised Version
with Addendum, July 2009
Page 29 06.024 RP001 LWMS Final Revised July 09
Prior to water restrictions, garden watering accounted for 54% of potable water use in single residential dwellings in Perth (Coghlan and Loh, 2003) (Figure 13). After restrictions, this has dropped to an estimated 47% or 127kL/house/yr (J. Brennan, personal communication). This use can be substituted by non-potable water sources including bore water, rainwater and greywater. Internal water use after restrictions is estimated at 145kL/house/yr (J. Brennan, personal communication). Other uses of potable water that can be substituted with non-potable water sources include toilets (approximately 9% of water usage) and washing machines (approximately 11% of water usage).
Hot water may also be substituted with roof water if this can be managed and treated to reach a potable standard, but obtaining and maintaining this standard is likely to require disinfection at a household level (GHD, 2005b). The risks associated with the failure to reach an appropriate water quality standard in a hot water system that provides water for showers, baths and dishwashing is higher than for alternative uses associated with toilets or washing machine.
An alternative to in-house potable water use substitution is the use of Waterwise fixtures such as showerheads, taps, toilets and washing machines to reduce water use. Rockwater (2005) indicates that the installation of all Waterwise fittings, including washing machines, could reduce internal potable water use to 149kL/house/yr.
Based on current potable water use, achieving the target water use reduction of 47 to 65% will require the substitution of all garden watering and either installation of all Waterwise fittings or substitution of potable water with another source for either toilet flushing and/or washing machine cold inlets. Without being able to substitute for garden watering, the Southern River targets are not achievable as this accounts for approximately 47% of current domestic potable water use.
Rainwater flushing for toilets and washing machine cold water and the use of groundwater for irrigation are currently supported by Water Corporation as some of the easier ways of reducing potable water use (Table 7: Water Corporation, 2006). Current legislative conditions, mainly health considerations, in Western Australia make a number of the other options difficult to implement (GHD, 2005b).
WRF PROPERTY LTD –Sub-precinct 3A (1), Southern River: Local Water Management Strategy –Second Revised Version
with Addendum, July 2009
Page 30 06.024 RP001 LWMS Final Revised July 09
Table 7: Ease of implementing non-drinking water sources based on current legislation (Water Corporation, 2006)
5.1.2 Residential Garden Watering
Residential garden watering may be reduced through the use of Waterwise gardening but separating gardens completely from potable water use will require substitution by another source such as roof water, domestic greywater or shallow groundwater.
Roof Water
Rainfall in Perth is concentrated over the winter months with most irrigation occurring over the hot, dry summer months. Because of this, roof water is not available for irrigation over summer without very large storages (i.e. one or more 100m3 tanks per house2). This would effectively involve building rain water tanks under part or the whole of the house. This is not considered feasible (GHD, 2005b).
Domestic Greywater
Domestic greywater reuse can be undertaken on a lot scale with householders being responsible for their own greywater treatment systems. Greywater systems require maintenance and householder education on how to use the system. There is currently no regulation for the use and maintenance of greywater systems by householders. Such systems may be suitable for responsible householders who
2 1m3 is equivalent to 1 kL or 1,000 L.
WRF PROPERTY LTD –Sub-precinct 3A (1), Southern River: Local Water Management Strategy –Second Revised Version
with Addendum, July 2009
Page 31 06.024 RP001 LWMS Final Revised July 09
wish to have them but the irresponsible use of greywater may lead to health and environmental harm.
Greywater reuse requires householders to use special detergents, not irrigate edible plants and meet requirements for setbacks from fences, footpaths and buildings (Department of Health, 2005). Reuse is also not allowed less than 100m from wetlands where the PRI of the soil is less than 5 (Department of Health, 2005). These constraints mean that greywater reuse is not likely to be feasible on parts of the development close to the Conservation Category Wetland and on small lots where use will be constrained by setback distances.
In conclusion, while greywater reuse may be feasible for some householders in some areas of the development, it is not a broad scale solution to water use in the area.
Shallow Groundwater
Shallow groundwater bores are commonly used in Perth for domestic watering, with approximately one third of households having a bore (Coghlan and Loh, 2003). It is possible for developers to require households to have a bore or to provide shared bores for domestic use. Household bores are currently subsidised under the State Government’s Waterwise rebate program.
While domestic bores do not have to be licensed where the lot is less than 2,000m2, bores for larger properties, Public Open Space (POS), commercial and industrial uses must be licensed by DoW. The Department of Water considers the City of Gosnells to be fully allocated with respect to these larger bores. The use of domestic bores will add pressure to the limited water resources available in the area.
Urbanisation of rural areas increases the percentage of the area covered by hard surfaces. This increases the amount of stormwater runoff because less water is intercepted by vegetation and surface losses. This additional runoff generated by urbanisation will be infiltrated on site where possible and become part of the groundwater system. The groundwater may stay in the site or move into local wetlands and waterways. Where the groundwater stays in site, it can then become available for use by bores. This difference can be calculated by undertaking a water balance for the site, which calculates the amount of water entering and leaving the site.
Waterwise Landscaping
Waterwise landscaping involves reducing the amount of water used for irrigation through the use of low water use plants, soil amendments, reduced areas of lawn and water efficient irrigation systems. Waterwise landscaping will require some irrigation, particularly if lawns are included. Native vegetation may require irrigation
WRF PROPERTY LTD –Sub-precinct 3A (1), Southern River: Local Water Management Strategy –Second Revised Version
with Addendum, July 2009
Page 32 06.024 RP001 LWMS Final Revised July 09
for establishment and then possibly limited irrigation during the hotter months. The level of water use reduction will depend on the householder and how they manage and water their garden. Any landscaping packages provided to householders within Sub-precinct 3A(1) should be Waterwise in order to minimise water use.
5.1.3 Waterwise Fittings
An alternative to in-house potable water use substitution is the use of Waterwise fixtures such as showerheads, taps, toilets and washing machines to reduce water use. Rockwater (2005) indicates that the installation of all Waterwise fittings, including washing machines, could reduce internal potable water use by 12% compared to a house with conventional fittings. Rockwater projected the internal water use for such a house was 167kL/yr, which is above the current estimated internal water use of 145kL/yr. The drop in internal water use following water restrictions is thought to be mainly due to improved efficiencies in showers, with the remainder due to the rebates on water efficient fixtures and appliances. However, as not all houses in Perth have water efficient fixtures and appliances, there is clearly room for reductions in in-house water use.
While it is possible for developers to set conditions requiring the use of Waterwise fitted fixtures such as toilets and taps in a house, the mandating of washing machine type would be difficult as these are not fixed to the house. Water efficient washing machines are covered by the Waterwise Rebate scheme, which subsidises these items.
Assuming that all fixed items in the house are Waterwise and that a conventional washing machine is used, average in-house water use would be less than 145kL/yr, which is within the Southern River guidelines. Clearly, garden water use would still pose a challenge.
5.1.4 In-house Water Substitution
In-house water substitution involves the substitution of potable water with either rain water or grey water. The options considered most feasible by Water Corporation are the use of roof water for toilet flushing and washing machine cold water. This is preferable to the use of roof water for garden watering because these uses occur during winter as well as summer and hence require significantly smaller storages (in the order of 3m3 as compared to 200m3). Through the use of a 3.5m3
tank, an average house with a 210m2 roof can supply 36kL or approximately 87% of the water required for toilet flushing each year and provide additional water for a washing machine over winter (Appendix F). Tanks of this size can be provided in designs that fit under the eaves or between the house and side fence of even small lots.

WRF PROPERTY LTD –Sub-precinct 3A (1), Southern River: Local Water Management Strategy –Second Revised Version
with Addendum, July 2009
Page 33 06.024 RP001 LWMS Final Revised July 09
The use of roof water for substitution could affect the local water balance by reducing groundwater recharge. This option will therefore be investigated through the use of a water balance. This water balance is shown in Section 5.2 below.
A State Government Rebate of $600 or up to 50% of the cost of the rainwater tank is available for rainwater tanks greater than 2kL in size connected to toilets and washing machines. These systems may require special plumbing in the form of reflux valves to stop backflow of roof water into the potable water supply system and associated potential water quality problems. Before systems are mandated by the developer, the developer will require that any systems installed comply to Department of Health (DoH) guidelines. It is understood that guidelines for such systems are currently being developed by the DoH (N. McGuiness, Department of Health, personal communication).
5.1.5 Water Use in Public Open Space
Water use in Public Open Space (POS) is a separate issue from household water use but requires discussion.
Water efficient irrigation systems will be installed in POS. This will include irrigation systems that are controlled by soil moisture meters and only provide plants with the amount of water required for growth. Where landscaping is to be undertaken, Waterwise (preferably local) species will be used and irrigated in a way that minimises water use. The area of lawn should also be minimised to reduce water requirements. Non-invasive species will be used in areas adjacent to native bushland. Given that the final location of POS is not determined yet, a species list will be developed to support the Subdivision stage which is the point at which species can be matched to the areas of interest. Details of landscaping and groundwater allocations for Public Open Space should be provided at the Urban Water Management Plan.
The groundwater allocation for Gosnells has recently been fully allocated. The Department of Water has recently reassessed the groundwater allocation for Gosnells is being reassessed and will increase the allocation (J. Connolly, personal communication). WRF is therefore lodging an application for a groundwater license for the whole Sub-precinct 3A(1) area to ensure that water is made available for the Public Open Space.
5.2 WATER BALANCE MODELLING
Water balance modelling is one way to investigate the hydraulic impact of development upon the catchment. Water balance modelling determines the net flows of water from potable, rainwater and groundwater sources to systems such as surface water and groundwater. This allows the investigation of fluxes of water between these systems and comparison to pre-development situations. Changes
WRF PROPERTY LTD –Sub-precinct 3A (1), Southern River: Local Water Management Strategy –Second Revised Version
with Addendum, July 2009
Page 34 06.024 RP001 LWMS Final Revised July 09
in the systems due to urbanisation can therefore be determined. The modelling allows investigation of the potential changes associated with the use of shallow groundwater and collection of rain falling on rooves as alternative water sources for gardens and in-house use.
The aim of water balance modelling should be to ensure that the post development water balance is similar to the pre-development water balance with respect to the discharge of groundwater to surface and groundwater. This represents an environmentally sustainable solution.
In no circumstances should the post-development water balance for the site result in a negative discharge to these systems. A negative discharge implies that the amount of water taken up from the site in groundwater is greater than the discharge to surface water and groundwater. This situation implies mining of groundwater sources and leads to falling water tables and drying out of wetland areas.
5.2.1 Pre-development Water Balance
Originally, the Southern River site would have been bushland. It is estimated that evapotranspiration in the area would have accounted for 75% of the rainfall on the site (Rockwater, 2005). Assuming interception losses are minimal, approximately 25% of the rainfall on the site would have recharged the surface and groundwater systems. Assuming an annual rainfall of 730mm/yr 3 and a total site area of 55ha, the total annual rainfall volume for the site would be 401ML/yr. The total volume recharging the surface and groundwater systems would be in the order of 100ML/yr.
5.2.2 Post-development Water Balances
The post-development water balance for the site will depend on how the water is used on the site. This water balance is more complex than the pre-development case as it must take into account the importation of potable water from off-site, the interception and runoff characteristics from man-made surfaces including roads and rooves.
Assumptions for the water balances are given in Appendix G. These assumptions are based on information from the Perth Domestic Water Use Study (Coghlan and Loh, 2003), conversations with members of Water Corporation’s Water Cycle Project team (J. Brennan and M. Loh, personal communications), Rockwater (2001), Bureau of Meteorology rainfall and evaporation data and the proposed subdivision design provided by Taylor Burrell Barnett.
3 Rainfall based on the average annual rainfall for Perth Airport over the period 1995 to 2005
WRF PROPERTY LTD –Sub-precinct 3A (1), Southern River: Local Water Management Strategy –Second Revised Version
with Addendum, July 2009
Page 35 06.024 RP001 LWMS Final Revised July 09
The assumptions used here are based on post-water restriction potable water use statistics with an average ex-house water use of 424.7L/house/day (J. Brennan, Water Corporation, personal communication). These statistics were used because it appears unlikely that the restrictions will be lifted in the short to medium term (i.e. next five years), during which time the development will take place. Ex-house water use in the development is also likely to be relatively low because of the small average lot size (404m2), which will lead to smaller gardens and the expectation that all landscaping packages provided will be of a low water use variety.
Scenario 1 – Conventional Development
The first scenario run was a conventional scenario, which represents a typical development on the site. This scenario assumes that development on the site is not Waterwise. A third of the households are considered to use bore water for irrigation (based on P. Coghlan, Water Corporation, pers. Comm.) and all the public open space is irrigated using bore water. Under this scenario, 260ML/yr of water is discharged to groundwater and surface water systems. 55ML/yr of groundwater is abstracted for irrigation. This gives net recharge to ground and surface water systems of 206ML/yr, which is 206% of the pre-development recharge rate. This increase in recharge rate is due to increased areas of hard surfaces that have high runoff coefficients and the addition of potable water to gardens.
Scenario 2 – Waterwise Development with Rainwater for Toilet Flushing
The use of rainwater for the flushing of toilets has been suggested as a relatively easy way to reduce potable water use (GHD, 2005 b). In the average single residential dwelling, an average of 43kL/yr of potable water is used for toilet flushing.
By taking up this rainwater for toilet use in addition to shared bores, recharge to groundwater and surface water is reduced by 29ML/yr over the estate, and potable use decreased by the same amount. This is a reduction in potable water use of approximately 36kL/house/yr. Assuming that only a third of the households have bores, this results in a net recharge of approximately 122ML/yr, 122% of the pre-development recharge of groundwater and surface water. This indicates that there is the potential to use rainwater for toilet use on the site.
The model is a simple spreadsheet model and as such cannot distinguish between infiltration to groundwater and runoff that leaves the catchment. Results from the MUSIC model indicate that the average volume of surface water leaving the site is in the order of 5.5 to 8.5ML/yr, or less than 5% of rainfall. However, this does not take into account groundwater removed from the site through subsurface drainage, if this is chosen as a management option.
WRF PROPERTY LTD –Sub-precinct 3A (1), Southern River: Local Water Management Strategy –Second Revised Version
with Addendum, July 2009
Page 36 06.024 RP001 LWMS Final Revised July 09
5.2.3 Discussion
Results of the surveys undertaken indicate that the additional volume of recharge due to hard surfaces and infiltration on site is more than adequate to allow bores to be used on site. The geology of the site encourages caution in the use of bores in the area.
The geology of the site indicates that there is generally less than 6m of sand present on the site above a clayey sand to sandy clay layer that forms the top of the Guildford formation and considerably less in many places. The Guildford Formation consists of lenses of material varying between sands and clays. Extraction bores in the Southern River area are generally drilled into sandy lenses within the Guildford Formation that can support adequate flow rates.
The potable water targets required for the ILWMP area can only be achieved through substituting ex-house potable water use with non-potable water and the use of either all Waterwise fittings in the house or plumbing rainwater tanks into toilets and possibly washing machines. The ex-house potable water use target can be achieved by either greywater systems or bores. Greywater systems are not feasible in areas of the site close to wetlands. The additional nitrogen and phosphorus added to the groundwater through greywater reuse may also make meeting groundwater quality targets in the area difficult.
An economic and legislative assessment of the shared bore option will also be undertaken. The shared bore proposal was discussed with Landgate, who indicated that the management of such a strata scheme would not be feasible. If the equipment broke down, there would be no legal way of ensuring that the individual householders paid their share of the electricity and repair costs. If the system broke down, it would be difficult to ensure that it was repaired and that repairs were paid for fairly. Such a system would also require a complex central control system similar to the system used at Brighton. Such complex control systems would be expensive for householders to fix. This system is therefore considered not to be feasible, therefore the alternative rainwater tanks and low water use garden system will be implemented. As the proposal was determined to be unfeasible, groundwater modelling of the bore system was not undertaken.
5.3 FIT FOR PURPOSE WATER CONSERVATION STRATEGY
Water management in the Southern River area requires the development of a “fit for purpose” water strategy that minimises the use of potable water and production wastewater within the subdivision. Based on the work discussed above, the fit for purpose water strategy for Sub-precinct 3A(1) will be based on a core platform of:
• mandatory Waterwise fittings for all houses;
WRF PROPERTY LTD –Sub-precinct 3A (1), Southern River: Local Water Management Strategy –Second Revised Version
with Addendum, July 2009
Page 37 06.024 RP001 LWMS Final Revised July 09
• houses to be provided with landscaping packages that include a limited amount of lawn to be underlain by soil amendments to retain moisture and nutrients. All landscaping packages provided will be of a low water use variety; and
• Public Open Space treatments will be low water use. Irrigation of the POS will be controlled by moisture sensors to minimise water use. A minimal turf approach including areas of local native plantings will be developed in consultation with the City of Gosnells when the POS is designed (Figure 15).
• provision of free rainwater tanks to households, with design covenants requiring them to be plumbed into toilets and/or laundries.
The second stage of the Department of Housing and Works’ Five Star Plus scheme is expected to be mandated in late 2008. This will require that all new houses are plumbed in a manner that makes it easy for householders to install rainwater tanks and other alternative water supplies. The basic implementation of the rainwater tank scheme is therefore expected to be:
• Households will be provided with a top-up rebate to cover the cost of a rainwater tank, up to a maximum of 5kL, by the developer. This rebate will top up the current government rebate for rainwater tanks. The top-up rebate plus the government rebate will cover 100% of the cost of the rainwater tank.
• Plumbing the tank into the toilet and/or laundries will be mandated through the use of design covenants on the housing. Information will be provided on how to plumb the tanks into household toilets and/or laundries. The standards for this will be based on the guidelines alternative water supplies provided by the Department of Health.
5.4 WATER INFRASTRUCTURE
5.4.1 Potable Water Infrastructure
A standard condition of subdivision will require all lots to be serviced by a water reticulation system to be taken over and operated by the Water Corporation.
The Water Corporation has advised that the site can be serviced for water reticulation by an extension from the existing 400mm diameter water distribution main at Chamberlain Street, along Southern River Rd to the entry of the proposed development. The extension of the DN400 distribution main is to be prefunded by the developer and these costs are refunded by the Water Corporation as per a Prefunding Agreement.
The Civil Group advise that standard water reticulation mains are to be extended from the distribution main.

WRF PROPERTY LTD –Sub-precinct 3A (1), Southern River: Local Water Management Strategy –Second Revised Version
with Addendum, July 2009
Page 38 06.024 RP001 LWMS Final Revised July 09
5.4.2 Wastewater Infrastructure
A standard condition of subdivision will require all lots to be serviced by a sewer reticulation system to be taken over and operated by the Water Corporation.
The Water Corporation advises that the sewer planning for this sewer catchment has been completed. This development is to be served by a reticulated gravity system draining to a permanent sewer pump station called Ballanup Wastewater Pump Station C. This is proposed to pump to a number of proposed permanent pump stations which eventually pump to the major wastewater transfer station at Waterworks Road, Brookdale.
5.5 WORK REQUIRED
Further work required at the Urban Water Management Plan (UWMP) stage will demonstrate how the chosen water conservation strategy will be implemented.

WRF PROPERTY LTD –Sub-precinct 3A (1), Southern River: Local Water Management Strategy –Second Revised Version
with Addendum, July 2009
Page 39 06.024 RP001 LWMS Final Revised July 09
6 STORMWATER MANAGEMENT STRATEGY
6.1 FLOW AND FLOOD MANAGEMENT
Stormwater flow and flood management in Sub-precinct 3A has been undertaken through a series of swales and living streams that eventually discharge into Southern River. The site is separate from the Forrestdale Main Drain. The current 1 in 100 year flood plain for the Forrestdale MD does not enter the site but lies directly to the south of the site, along the southern boundary of Matison Street (Figure 10). The Forrestdale MD is currently being investigated by Water Corporation and GHD as part of the Southern River Arterial Drainage Scheme (ADS) (Water Corporation, 2007b). Water Corporation advises that the Scheme does not propose to upgrade the Forrestdale MD downstream of Holmes Street and therefore the existing floodplain and hydrologic regime of the area should remain unchanged (Water Corporation, 2007b). Based on this advice, surface water flows into the wetland to the south of Matison Street will be maintained at pre-development levels.
Drainage design has been undertaken for the whole of Sub-Precinct 3A, as the flow paths for the catchment areas outside Sub-Precinct 3A(1) will flow through the 3A(1) area, in line with the Interim Forrestdale Main Drain Arterial Drainage Scheme (Water Corporation, 2007b).
Flows in Sub-precinct 3A will be managed to the pre-development flow rate for events up to and including the 1 in 100 year ARI event through the use of swales, water garden bioretention systems and detention storages.
6.1.1 Post Development Flow Management
Storage Volumes
The 100-year peak flow volumes calculated by The Civil Group represent the estimated pre-development 1 in 100 year flow rates. By limiting post-development 1 in 100 year flood outflows to less than these flow rates, the development will meet the requirements of Water Corporation and Department of Water with respect to post-development flow rates. To cope with this, the Actual Storage Volumes provided within the preliminary plan are provided in Table 8:

WRF PROPERTY LTD –Sub-precinct 3A (1), Southern River: Local Water Management Strategy –Second Revised Version
with Addendum, July 2009
Page 40 06.024 RP001 LWMS Final Revised July 09
Table 8: Required Flood Volumes for the Catchments in the Site
C1 C2
C3 & C5 (joined
catchment) C4Rural 100 year Peak Flow 0.557 2.283 1.626 1.203 Urban 100 year Peak Flow Out 1.564 0.289 0.184 0.176Stored Volume 300 11883 8884 4919Rural 5 year Peak Flow 0.143 0.786 0.563 0.42 Urban 5 year Peak Flow In 0.276 1.357 0.872 0.686Peak Flow Out 0.054 0.086 0.084 0.069Stored Volume 237 2379 1233 922
The drainage system on the site proposes to manage the drainage through a mixture of swales, bioretention systems and drainage basins in the Public Open Space. A combination of the swales and roadways are to be used to convey major stormwater events to the POS areas. Storage will be provided in both the POS and swales within the road reserves. As per standard design we have also allowed for some additional minor storage of the 1 in 100 year event in the low points of the local streets to provide additional storage. Where this occurs the habitable floor levels are to be 0.5m above the ponding level. The total storage volumes and swales are shown in Table 9.
Table 9: Volumes of Storage Provided in the Plan
C1 C2 C3 C4 C5
Length of swale (m) 220 1600 320 460 360
Swale storage (m3) 184 1344 269 386 302Water garden storage (m3) 0 63 63
6363
POS storage (m3) 0 10071 1891 5000 5000Additional Storage in the Road Reserves Surrounding the POS -100Year 1812 1200
0
793Total Storage (m3) 184 11478 2223 5449 5365
These volumes conform to the above requirements, except for Catchment C1. In the case of this catchment, only a very small area of the total natural catchment is located on site. This area has been identified in planning as a future commercial area. The commercial area is proposed to be located on the corner of Southern
WRF PROPERTY LTD –Sub-precinct 3A (1), Southern River: Local Water Management Strategy –Second Revised Version
with Addendum, July 2009
Page 41 06.024 RP001 LWMS Final Revised July 09
River Road and Leslie Street, which is the lowest part of the catchment on site and therefore the best location for on-site storage. Locating storage in this area would involve moving the commercial area back from the corner. Moving the commercial area back from the corner would reduce its’ functionality and appeal.
Where possible, for Catchment C1 the 1 in 1 year, 1 hour event is provided within the site but compensation for the 1 in 100 year event is likely to be located off site where it cannot be included further up in the catchment. Some storage is expected to be available within the road reserve of Southern River Road. Southern River Road is currently a two lane road that will be upgraded to four lanes by the council in future. An alignment for the road is yet to be determined in this area. When the alignment is determined, the potential for additional compensation in the road reserve will be reviewed. Discussions with the City of Gosnells indicate that they are amenable to this approach.
Further details of pipe, swale and basin sizes and flow rates are provided in Appendix H. The drainage design is shown in Figure 14.
Drainage Philosophy
The road, lot and POS levels are to be designed to allow a safe flood route and maintain a minimum clearance of 500mm between flood surface water levels and the habitable floor levels and important infrastructure. As part of the JDA UWMS report for this district (JDA, 2002) storage volumes have been modelled for each sub-catchment. The storage in the network of basins is designed so that discharge from the development does not exceed the capacity of the downstream drainage systems. Flows are compensated back to the pre-development rates at each point of outflow where possible. This is difficult in some locations because City of Gosnells’ regulations require a minimum 300mm diameter pipe for drainage pipes leaving the site. The minimum flow rate for a 300mm pipe at a 1 in 300 grade is 55L/s, which is well above the predevelopment flow in some catchments. City of Gosnells has indicated that they are willing to consider a mixture of smaller inlet orifices combined with overflow baffles to control flows. The smaller orifices will control of flows to less than 55L/s, while the baffles allow for overflow to occur, preventing flooding should the orifice become blocked.
Street drainage is proposed to be directed to swales within the verge and water gardens within the POS for the storage and soakage of the 1 in 1 year event. It is proposed, via a planned grid pattern of streets, to allow road stormwater to flow down street gutters for up to 100m distance and discharge at the end of a street grid to a grassed swale that runs alongside the side verge of a connecting street. To avoid problems of crossovers over the swale, the street and lot pattern has been arranged so that side boundary fences, rather than front fences, abut the swales, except where blocks are rear loaded. On rear loaded blocks, swales will be
WRF PROPERTY LTD –Sub-precinct 3A (1), Southern River: Local Water Management Strategy –Second Revised Version
with Addendum, July 2009
Page 42 06.024 RP001 LWMS Final Revised July 09
allowed on the front of the house blocks provided that pedestrian access is provided to the front of the houses.
Swales will be constructed on roads with a minimum of 18m width except where one side of the road is Public Open Space and the swale forms part of the POS. If developers wish to use swales in narrower roads where POS is not present, consultation with the City of Gosnells will be required and Detailed Area Plans will be necessary. Indicative swale concept drawings are shown in Appendix J.
The only piped drainage proposed in the swale system is possible subsoil drainage beneath the swales, Side Entry Pits at the street corners with connecting pipes to the swales and pipes to cross over intersections for the swales. This system meets the criterion that all stormwater from the roads is to pass over a vegetated surface (ref. Decision Process for Stormwater Management in WA, Dept of Environment, 2005).
In roads with swales, non-drainage services will generally be laid on the side of the road opposite the swale. In the existing, 20m wide road reserves, services may be laid on both sides of the street. In the case of rear-loaded lots abutting the swale, the services may be placed in the laneway rather than the road containing the swale.
Lots are generally planned to front the opposite side of the street to the swales. By rotating the grid pattern to suit existing roads and features the streetscape can be planned to provide traffic calming, a pleasant outlook and reduce the length of streetscape with the swales and side boundary fences on one side. The swales’ length and capacity are to be sized to allow storage and soakage of a 1 in 1 year event with overflow into the POS areas once the 1 in 1 year recurrence interval design has been exceeded. The catchment for each swale and the size of the swales are sized to suit the 1 in 1 year event for soakage (i.e. contained locally) within the swale. Where the layout means that volumes cannot be stored in the swale, storage has been provided through water garden bioretention systems in the POS.
The swales in the road reserve will generally have a nominal 600mm between the base or invert of the swale and the AAMGL. There are some situations where it will be greater than this. Swales are proposed to be 500mm to 600mm deep below the edge of road level with 1 in 4 to1 in 6 side slopes.
Dry detention basins will be used in the public open space. These will be effectively grassed or vegetated structures that will remain dry except following significant rainfall events (generally greater than 1 in 6 month ARI storms). . The basins will have their base above the AAMGL while maximising the capacity to accommodate extreme events within the space available. This design will allow the basins to dry out before summer to prevent midge and mosquito breeding. 1 in 5

WRF PROPERTY LTD –Sub-precinct 3A (1), Southern River: Local Water Management Strategy –Second Revised Version
with Addendum, July 2009
Page 43 06.024 RP001 LWMS Final Revised July 09
year inundation levels for the basins are shown as hatched areas in the drainage design (Appendix J).
6.1.2 Response to Regulator Comments on Drainage Design
The drainage philosophy and infrastructure locations were discussed with of Department of Water and Water Corporation on 11 July 2006 and City of Gosnells on 14 July 2006. The Swan River Trust also commented on the Local Water Management Strategy and these comments were included in the minutes of the City of Gosnells meeting of 28 August 2007. There was general agreement on the drainage philosophy. The following issues were raised:
• Questions were raised about the impacts of overflow of the 1 in 100 year event from Catchments 4 and 5 into the Conservation Category Wetland and Forrestdale Main Drain (Water Corporation and Department of Water). This would be the current flow path for water from these catchments in extreme events. As the Water Corporation has indicated that flows in the Forrestdale Main Drain during extreme events will not change following development, it will be required that the flows into the wetland from Sub-precinct 3A are also unchanged. The Forrestdale Arterial Drainage Strategy (Interim) (Water Corporation, 2007b) also shows an overflow path from the western section of Sub-precinct 3A into the wetland in both options. The currently proposed flow lines for the 1 in 100 year event reflect this and are shown in the drainage design (Appendix J).
• Issues were raised by the City of Gosnells regarding with houses with side boundaries facing roads and road swales. The Council raised issues regarding the safety and aesthetics of this approach, where one side of the road will effectively be fenced. Proposed strategies to enhance security and aesthetics, such as requiring lots to overlook the swales, will be addressed by a Detailed Area Plan in the Urban Water Management Plan and Subdivision Application Stage.
• Both the City of Gosnells and Department of Water raised the question of whether the off-site section of drain along Leslie Street between Matison Street and Southern River should be piped or remain as a drain. This section of drain receives water from Catchment 2. The section is currently a narrow, steep-sided farm drain and would present a safety hazard in an urban environment. Making the drain safe would involve either piping the drain or purchasing land from landowners outside this sub-precinct to turn the drain into a living stream. Modelling has indicated that the water in the drain from Sub-precinct 3A will meet the required water quality standard and therefore it is considered that a living stream is not required in this area for this development. It is therefore proposed at this stage that this drain should ultimately be piped, but this may require negotiation between the council and DoW because the land is outside

WRF PROPERTY LTD –Sub-precinct 3A (1), Southern River: Local Water Management Strategy –Second Revised Version
with Addendum, July 2009
Page 44 06.024 RP001 LWMS Final Revised July 09
the area of influence of this development. The developers of Sub-precinct 3A(1) will contribute to the redevelopment of the drain whether it is changed to a pipe or living stream.
• Comments from the Swan River Trust include comments on the use of MUSIC and nutrients in groundwater. These comments are addressed in Sections 6.1.2 and 7.2.
A letter summarising the response to these issues can be found in Appendix A.
Drainage Structure Design and Maintenance
The design and maintenance of drainage structures was discussed in a meeting with City of Gosnells (CoG) on 26 February 2008. The following points were agreed on in that meeting:
• Road swales would be grassed and irrigated and managed by the City of Gosnells to avoid landowners fertilising and/or filling in the swales. The City prefers grass to mulched vegetation because of concerns regarding mulch and silt building up in the swales and blocking swales and drains.
• A Special Area Rate should be considered for be Sub-precinct 3A(1) for the maintenance of swales.
• Swales are not expected to need as much irrigation as the parks as they will concentrate rainfall from the roads. The swale irrigation should therefore be on a separate irrigation program.
• Path access shall be provided for lots fronting onto swales.
• Areas of POS that will be inundated in the 1 in 1 year event shall be planted with reeds and rushes. Subsoil drainage shall be provided in these areas to avoid water lying in parks.
• CoG has a preference for useable Public Open Space. Areas that will be inundated in events between the 1 in 1 and 1 in 10 year ARI should be grassed with trees to minimise maintenance issues and ensure that active POS is provided. Verges and areas that are not subject to inundation may be mulched with natives, grassed or paved as appropriate. Paving should be where appropriate (eg near playgrounds, picnic tables gazebos) and not used indiscriminately.
• CoG indicated that vehicles accessing swales and parks is an issue where ‘kerbless’ roads are used. CoG’s preference is to avoid bollards as they are seen as causing mowing and other maintenance issues. Instead, it was agreed that kerbed roads with flush points every 5 meters to allow water into the parks would be used on the edges of POS.

WRF PROPERTY LTD –Sub-precinct 3A (1), Southern River: Local Water Management Strategy –Second Revised Version
with Addendum, July 2009
Page 45 06.024 RP001 LWMS Final Revised July 09
• Consideration should be given to providing measures to prevent sand entering the swales during the construction period.
6.1.3 Post Development Water Quality Management
Proposed Best Management Practices (BMPs)
Best management practices proposed for the site include swales, bioretention systems and dry detention basins. These are some of the commonly used BMPs in the Metropolitan Area and are detailed in Chapter 9 of the DoW’s Stormwater Manual for Western Australia. Gross pollutant traps may also be used in areas that are expected to have high gross pollutant loads, such as car parks. While the area is not proposed for heavy industry, specific systems such as grease arrestors may be required for petrol stations or other land uses with high pollutant loads.
Grassed swales will be used for road verges throughout the estate. Swales will be placed in verges to the side boundary of lots where they will not be interrupted by driveways. Roads will either be designed to be angled towards the swale (Figure 15). Due to the width of the swale, road reserves containing swales will be a minimum of 18m wide. Where possible, road verges with swales should be managed and irrigated by the council to prevent householders considering them as part of their land and filling in or applying fertiliser to the swales.
Water gardens are a form of bioretention system and will be used in the POS to retain the 1 in 1 year flow where swales are unsuitable due to road design constraints. Bioretention systems consist of a swale like structure with a trench filled with high permeability, sandy soil located underneath. This sandy layer contains a geofabric coated porous underdrain (Figure 16). This structure allows rainwater to filter through the sand and gravel layer into the underdrain. This process removes nutrients and sediments from stormwater. There is the potential for enhanced infiltration of water from the bioretention system into the soil, or for the underdrain to act as the subsurface drain to control groundwater levels. Bioretention systems can be used with a range of vegetation, including trees, grass and native vegetation. It is proposed to use native sedges and rushes in the rain gardens. Water gardens have been used successfully in Brookland Grove and Ascot.
The swales and bioretention systems in the road reserve will generally have nominally 500mm between the base or invert of the swale and the AAMGL, although this is likely to be greater where depths to groundwater are greater. There are some situations where it will be greater than this. Swales are proposed to be approximately 300mm deep below the edge of road level, 1m base width and 1 in 4 to 1 in 6 side slopes. The vegetated detention basins in the POS are expected to have bases on or in the AAMGL.
WRF PROPERTY LTD –Sub-precinct 3A (1), Southern River: Local Water Management Strategy –Second Revised Version
with Addendum, July 2009
Page 46 06.024 RP001 LWMS Final Revised July 09
Dry detention basins consist of normally dry basins that are used to retain stormwater. As well as a nutrient stripping function, they are designed to reduce flow rates out of the catchment in larger storm events. In this area, basins will generally be designed as relatively flat areas that are useful as public open space as well as providing for retention of stormwater.
Results of MUSIC Modelling
MUSIC modelling was undertaken to assess whether the proposed BMPs could meet the water quality targets outlined in Section 4.3. The development was modelled as five catchments, as per the current drainage design. Modelling assumptions are given in Appendix K. Modelling for the site was undertaken in discussion with Christian Zammitt of the Department of Water who developed the MUSIC model for the Southern River area. The model was undertaken in line with guidelines for MUSIC modelling developed by GHD for the Water Corporation (GHD, 2007) and with the advice of Christian Zammitt.
Because the detailed design of the area has not yet been undertaken, the work was based on the preliminary design developed by The Civil Group.
The designed system was modelled with as bioretention systems for the swales and water gardens, as this allows for the use of an under drain. The detention systems were modelled as ephemeral ponds.
Table 10: Results of the MUSIC Modelling Runs Undertaken. Earlier runs were undertaken prior to these guidelines being produced and thus did not take them into account
Run Name Assumed Infiltration
Rate (mm/hr)
% TSS reduction
% TP reduction
% TN reduction
% Gross Pollutant reduction
ILWMP Criteria N/A 80 60 45 70
April 08 V2 0.36 97 83 72 100
An infiltration rate of 0.36mm/hr was chosen as a worst case scenario to reflect the potential effects of high groundwater levels on infiltration. This is a worst case scenario for nutrient reduction in surface water discharge because a low infiltration rate means less water (and hence nutrients) infiltrating and hence more leaving the site as surface water. This infiltration rate is equivalent to a system with a medium to heavy clay base, or low infiltration rates due to high groundwater levels. It is likely that the base of the swales will be in materials ranging between sandy clay and sand, which would have an infiltration rate of 3.6 to 360mm/hr, according to MUSIC. The results of the MUSIC modelling are shown in Table 12.
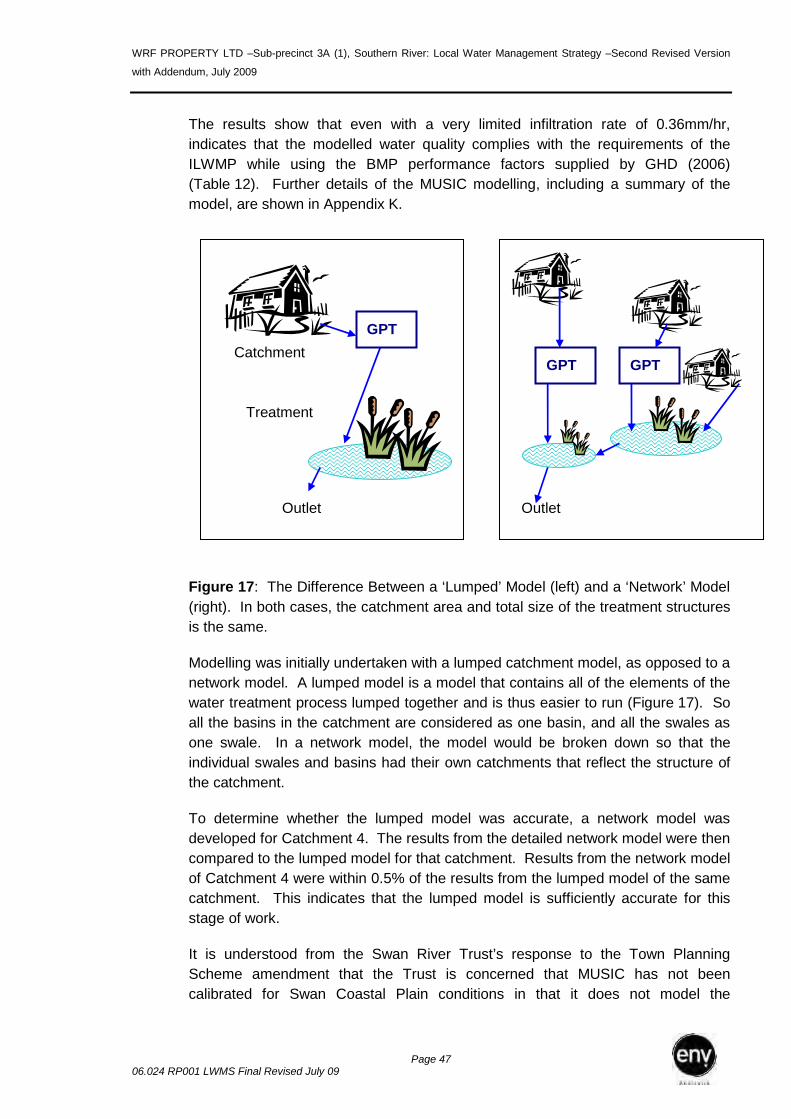
WRF PROPERTY LTD –Sub-precinct 3A (1), Southern River: Local Water Management Strategy –Second Revised Version
with Addendum, July 2009
Page 47 06.024 RP001 LWMS Final Revised July 09
The results show that even with a very limited infiltration rate of 0.36mm/hr, indicates that the modelled water quality complies with the requirements of the ILWMP while using the BMP performance factors supplied by GHD (2006) (Table 12). Further details of the MUSIC modelling, including a summary of the model, are shown in Appendix K.
Figure 17: The Difference Between a ‘Lumped’ Model (left) and a ‘Network’ Model (right). In both cases, the catchment area and total size of the treatment structures is the same.
Modelling was initially undertaken with a lumped catchment model, as opposed to a network model. A lumped model is a model that contains all of the elements of the water treatment process lumped together and is thus easier to run (Figure 17). So all the basins in the catchment are considered as one basin, and all the swales as one swale. In a network model, the model would be broken down so that the individual swales and basins had their own catchments that reflect the structure of the catchment.
To determine whether the lumped model was accurate, a network model was developed for Catchment 4. The results from the detailed network model were then compared to the lumped model for that catchment. Results from the network model of Catchment 4 were within 0.5% of the results from the lumped model of the same catchment. This indicates that the lumped model is sufficiently accurate for this stage of work.
It is understood from the Swan River Trust’s response to the Town Planning Scheme amendment that the Trust is concerned that MUSIC has not been calibrated for Swan Coastal Plain conditions in that it does not model the
GPT Catchment
Outlet
GPT GPT
Outlet
Treatment

WRF PROPERTY LTD –Sub-precinct 3A (1), Southern River: Local Water Management Strategy –Second Revised Version
with Addendum, July 2009
Page 48 06.024 RP001 LWMS Final Revised July 09
interactions between surface water and groundwater and has not been fully calibrated for the Swan Coastal Plain.
MUSIC was used for this LWMS based on advice from the Department of Water and was used in compliance with their criteria and the criteria developed by Water Corporation for the use of MUSIC, including the way that the BMPs are modelled. The DoW at the time agreed that they had calibrated MUSIC for the Southern River area and the project team used the DoW’s calibration methods in the model. We agree that there is limited data on which to base the model on, but this is due to a limit on the data that has been gathered regarding BMP performance on the Swan Coastal Plain (SCP). This is an acknowledged constraint for all stormwater models and all developments on the SCP. MUSIC was used it is the only commercially available model that will model whether the development meets the Southern River Design Criteria for Water Quality Management.
The BMPs used by the development comply with the DoW’s Stormwater Management Manual for Western Australia and as such can be considered as ‘Best Practice’. The system used for the site was first designed without using MUSIC, before checking whether it would meet the Water Quality Management criteria. MUSIC indicated that the stormwater system would comply with the guidelines. The use of MUSIC therefore did not alter the design of the stormwater system for the site.
6.2 IMPACT ON WATER DEPENDANT ECOSYSTEMS
The main water dependant ecosystem in the area is the conservation category wetland to the south of Matison Street. Inspection of the site indicates that it is unlikely that surface water from the site enters the Matison Street wetland, except during extreme rainfall events. The surface soils in the area are sandy and would not support surface runoff except during extreme events. In addition, Matison Street is slightly raised, which would further prevent surface water runoff. This wetland is therefore not generally directly surface water dependant but may receive direct surface water from the site in extreme rainfall events. The wetland will receive groundwater from the site.
It is not proposed to directly drain water across Matison Street and into the wetland. Some overflow of water will occur from C3 and C4 during the 1 in 100 year flood event. These flow volumes will be limited to the pre-development 1 in 100 year flood peak flow rate, as developed by JDA (2002).
Water levels in the Matison Street wetland will be more impacted by the Forrestdale Main Drain (MD) and backflow from Southern River than by water from this site during the 1 in 100 year event (Helen Brookes, GHD, pers. comm.). This is due to backflow from Southern River into the wetland. An assessment of the impact of urbanisation on floods in the Forrestdale MD is currently being undertaken by GHD.

WRF PROPERTY LTD –Sub-precinct 3A (1), Southern River: Local Water Management Strategy –Second Revised Version
with Addendum, July 2009
Page 49 06.024 RP001 LWMS Final Revised July 09
An assessment of the environmental impact of changes to water levels in the drain and associated flooding on the wetlands is also being undertaken. Once these studies and the CoG vegetation report are finalised, the net hydrological and botanical impact of the 1 in 100 year event flow on the wetland will be assessed.
WRF PROPERTY LTD –Sub-precinct 3A (1), Southern River: Local Water Management Strategy –Second Revised Version
with Addendum, July 2009
Page 50 06.024 RP001 LWMS Final Revised July 09
7 GROUNDWATER MANAGEMENT STRATEGY
7.1 CONTROLLED GROUNDWATER LEVELS AND FILL
In appreciation of the shallow depth to groundwater in parts of the site, the use of controlled groundwater levels and/or fill is considered likely in some areas of the site. Given our current understanding of groundwater levels and the relationship of the site to the Conservation Category Wetland, it is considered that subsoil drainage could be provided at the Annual Average Maximum Groundwater Level (AAMGL) and ensure that a 1.5m separation is provided between the AAMGL and housing. Preliminary planning for this concept has been undertaken through the use of AAMGLs developed by JDA (2002).
It is recognised that fill is also required over much of the north of the site, and the area around the conservation category wetland. Some of this material may be able to be provided from cut material from other parts of the site.
7.1.1 Groundwater Impact on Water Dependent Ecosystems
The impact of the development on the groundwater dependant ecosystems to the south of the site will depend on two factors:
• the change in groundwater levels (both maxima and minima) associated with the development; and
• the vegetation associated with those wetlands and the tolerance of the vegetation to groundwater level changes.
Groundwater levels may:
• decrease due to increased abstraction of groundwater for irrigation in summer;
• decrease due to the control of groundwater levels through subsurface drainage in winter; and
• increase due to infiltration of increased volumes of stormwater to groundwater.
This development proposes to minimise the impacts of development on groundwater levels by:
• only allowing the use of shallow groundwater for residential and POS irrigation if modelling can show that sufficient water is available and that this will not have a negative impact on the CCW;
• subsoil drains will not be laid below AAMGL unless modelling can show that this will not have a negative impact on the CCW; and

WRF PROPERTY LTD –Sub-precinct 3A (1), Southern River: Local Water Management Strategy –Second Revised Version
with Addendum, July 2009
Page 51 06.024 RP001 LWMS Final Revised July 09
• infiltrating water as high in the catchment as possible to minimise impacts on the hydrology of the CCW.
7.2 GROUNDWATER QUALITY
7.2.1 Former Poultry Farms
The nutrient levels found in groundwater around the site are generally above the Swan Canning Catchment Clean Up Criteria. Elevated nutrient levels are not uncommon in areas of Bassendean sand where agriculture has occurred. The only evidence of potential contamination from a chicken farm is the elevated phosphorus concentration in MWC, down-gradient of the former broiler farm (Section 3.4.2). This bore is located in a paddock used for relatively intensive horse agistment and the elevated result could be due to horse excretions instead of the historical use as chicken farm. While this indicates that there is some potential for nutrient transport off the site, further work is required to identify whether this is a single value or indicative of contamination.
The poultry farms are currently the subject of Preliminary Site Investigations that will address the potential for contamination (including nutrients) on the site in expectation of a condition of subdivision requiring the investigation of the site, as is the common process for potentially contaminated sites. The process includes an assessment of the risk of contaminants being mobilised and leaving the site will be undertaken. Remediation will be undertaken if required by the DEC and the auditor. The process is and will be undertaken in line with the requirements of the DEC and the Contaminated Sites Act (2003). As part of the remediation of these sites, the top 300mm of soil, which is considered likely to contain most of the stored nutrients and contaminants, will be removed.
7.2.2 Best Management Practices for Groundwater Quality
The best way to manage groundwater quality is to avoid nutrients entering groundwater from fertilisers, via either direct infiltration or through stormwater. The stormwater aspect is managed through the use of nutrient stripping vegetation in swales and basins.
The direct infiltration issue is best resolved through minimising fertiliser use. This will be undertaken by not fertilising Public Open Space and swales managed by the Shire and through the landscaping packages provided to residents. As part of the development, landscaping packages will be provided and these should attempt to minimise fertiliser use. These landscaping packages will be required to include:
• a high Phosphorus Retention Index soil amendment to bind phosphorus to the soil and prevent leaching;

WRF PROPERTY LTD –Sub-precinct 3A (1), Southern River: Local Water Management Strategy –Second Revised Version
with Addendum, July 2009
Page 52 06.024 RP001 LWMS Final Revised July 09
• a minimal area of lawn, with the aim of minimising water and fertiliser use; and
• information about low fertiliser use gardening.
The compliance of the landscaping package with these guidelines should be assessed as part of the UWMP.

WRF PROPERTY LTD –Sub-precinct 3A (1), Southern River: Local Water Management Strategy –Second Revised Version
with Addendum, July 2009
Page 53 06.024 RP001 LWMS Final Revised July 09
8 WETLANDS AND ENVIRONMENTAL WATER REQUIREMENTS
The predominant wetland of concern that may be affected by the site is the Conservation Category Wetland (CCW) to the south of the site. While much of the site is classified as Multiple Use wetland, the area has been cleared and used for farming for decades. The DEC generally considers that Multiple Use wetlands can be utilised for development objectives. The degraded nature of this wetland means that development is likely to be acceptable.
The CCW extends along the Forrestdale Main Drain. The wetland is currently in private ownership. Parts of the wetland lie within the current 1 in 100 year flood plain of the Main Drain. The Main Drain itself is currently subject to a study investigating the impact of urbanisation of the Southern River/Brookdale/Forrestdale/Wungong area on flood areas and vegetation. While the final report of this study is not available, most of the work has been undertaken and Water Corporation has provided advice on the outcomes (E. Sahouryeh and J. Wegner, personal communications). Based on this advice, surface water flows into the wetland to the south of Matison Street will be maintained at pre-development levels.
8.1 DETERMINATION OF ENVIRONMENTAL WATER REQUIREMENTS
Determination of Environmental Water Requirements (EWRs) for wetlands requires an understanding of the vegetation of the wetland and its’ preferred hydrological conditions as well as the current and future hydrological regimes. The vegetation of the CCW has been documented in the City of Gosnells’ environmental report for Precinct 3. The water dependence of this vegetation has been assessed as part of the Forrestdale Main Drain Arterial Drainage Study (the ADS) at the request of the Department of Water. ENV has undertaken the botanical component of this study, however, the findings are yet to be released.
As discussed in Sections 6.2 and 7.1.1, the hydrological impact of the development of Sub-precinct 3A(1) on the adjacent CCW is considered to be manageable in terms of surface water and groundwater. The drainage design maintains the current flood volumes up to the 1 in 100 year event.
8.2 ECOLOGICAL HEALTH MONITORING
The impact of development on the CCW to the south of the site needs to be considered in the context of other potential impacts to the site, including the impacts of the proposed ADS and associated developments upstream of the wetland and within Sub-precinct 3C, which contains the wetland. The potential impacts of the development of Sub-precinct 3A(1) on the wetland are considered

WRF PROPERTY LTD –Sub-precinct 3A (1), Southern River: Local Water Management Strategy –Second Revised Version
with Addendum, July 2009
Page 54 06.024 RP001 LWMS Final Revised July 09
small when compared to the potential impacts of the proposed drainage scheme and the development of the wider catchment.
A co-ordinated effort will be required to monitor the ecological health of the wetland. While this could be achieved through the ADS project, the author understands that this project will not be referred to the EPA and thus monitoring will not be set as a condition by the EPA. It is therefore suggested that the MoU group consider the issue of, and responsibilities for, monitoring of the CCW. It is accepted that such a program may require a pro-rata contribution from local developers. This is supported in principle provided that contributions are equitable.
8.3 REGIONAL WATER MANAGEMENT STRATEGY
A Regional Water Management Strategy (RWMS) has not yet been developed for Precinct 3. However, development on the site should be undertaken in line with the RWMS when this is produced. If the developer wishes to deviate from the RWMS, the reasons for this should be argued at the Urban Water Management Plan (UWMP) stage.
8.4 BUFFERS
The current boundary of the CCW to the south of the site is Matison Street itself. Where possible a 50m buffer has been provided by way of POS adjacent to Matison Street. Lot 20 currently has a house located within this buffer so the buffer at this stage does not continue into this area.
City of Gosnells has proposed a 100m buffer be provided to this wetland. The City’s proposed buffer is informed by ENV’s assessment of the wetland which confirmed its current classification as a CCW wetland and indicated that the wetland has high conservation value. It is understood that the 100m buffer proposed by the City was also based on advice provided by the Department of Environment and Conservation (City of Gosnells, 2006). The requirement for a 100m buffer to CCW wetlands is presented in the WAPC draft document, Guideline for the Determination of Wetland Buffer Requirements. Recent discussions regarding this document between ENV and the wetlands section of the Department of Environment and Conservation (DEC) have indicated that the buffer suggestions in the WAPC document are not representative of policy or practice and that a 50m buffer is the standard requirement by the DEC. Furthermore, in seeking clarification form the DEC on of the impact of cadastre boundaries and existing infrastructure such as roads on buffer requirements, the DEC has provided verbal advice that buffers are generally still required, however, in the circumstance of existing roads, a case by case consideration would be undertaken on whether the road’s impact on important hydrological and ecological functions is such that the positive management benefit of a 50m buffer is effectively negated. In these circumstances consideration would be given to reducing the buffer requirement.

WRF PROPERTY LTD –Sub-precinct 3A (1), Southern River: Local Water Management Strategy –Second Revised Version
with Addendum, July 2009
Page 55 06.024 RP001 LWMS Final Revised July 09
In the specific circumstance of Matison Street itself, whilst it currently represents a barrier to surface water movement, except in high rainfall events, it has been determined that the hydrological and ecological health of the wetland would be benefited by the provision of a 50m buffer, in which intensive land uses are not permitted. The buffer has been designed to maintain the pre development hydrological regime.
In considering the ultimate buffer distance, it should be remembered that, except in the circumstance where clearing of native vegetation is required, the prescription of wetland buffer distances is a function of State Government policy. DEC advice on buffer distances is simply that, advice, with the ultimate decision on final buffer distances resting with Local Governments.

WRF PROPERTY LTD –Sub-precinct 3A (1), Southern River: Local Water Management Strategy –Second Revised Version
with Addendum, July 2009
Page 56 06.024 RP001 LWMS Final Revised July 09
9 MATTERS TO BE ADDRESSED IN THE UWMP
It is recognised that some of the work required for a study of this type was not available at the time of development. Because of this, additional work will be required at the Urban Water Management Plan stage. The work identified for the UWMP stage includes:
• more detailed surveys for acid sulphate soils where required;
• completion of soil and groundwater testing in line with the Contaminated Sites guidelines for the poultry farms (ongoing work);
• developing ecological water requirements for the CCW based on groundwater monitoring and modelling and work done on the Forrestdale Main Drain by Water Corporation with this development, including floodplains, 1 in 100 year flows and potential of development to mitigate impact of the Main Drain on the CCW (UWMP, when Forrestdale Main Drain and CSIRO Precinct Level model becomes available);
• additional work on wetland monitoring requirements and buffer definition for the Conservation Category Wetland to the south (UWMP);
• developing a system to ensure that all houses have rainwater tanks for toilet flushing and providing details of the landscaping package (UWMP);
• review potential for stormwater storage in the Southern River Road reserve (UWMP)
• a detailed post-development monitoring plan; and
• detailed area plan addressing the issue of houses with side boundaries facing roads and road swales (UWMP).
Other items needing to be addressed will be identified in consultation with the regulators following their preliminary review of this document.
WRF PROPERTY LTD –Sub-precinct 3A (1), Southern River: Local Water Management Strategy –Second Revised Version
with Addendum, July 2009
Page 57 06.024 RP001 LWMS Final Revised July 09
10 FUTURE MONITORING AND MODELLING REQUIREMENTS
10.1 SURFACE WATER MONITORING AND MODELLING
Post-development surface water monitoring for a given subdivisional area will commence at practical completion of Stage 1 (i.e. completion of engineering lot construction) of the area covered by a specific UWMP. Monitoring will continue for three years on a similar basis to the pre-development monitoring. A post-development monitoring plan shall be provided in the Urban Water Management Plan. This will include identifying any opportunities for monitoring performance of the stormwater system in conjunction with CSIRO.
10.2 GROUNDWATER MONITORING AND MODELLING
Post-development groundwater monitoring for a given subdivisional area will commence at practical completion of Stage 1 (i.e. completion of engineering lot construction) of the area covered by a specific UWMP. Monitoring will continue for three years on a similar basis to the pre-development monitoring. A post-development monitoring plan shall be provided in the Urban Water Management Plan. This will include identifying any opportunities for monitoring performance of the stormwater system.
10.3 WETLAND MONITORING
The primary wetland of concern is the Conservation Category Wetland to the south of this site. Currently, groundwater level and quality monitoring is being undertaken from a bore within the road reserve adjacent to the wetland. As a minimum, this will be continued as part of the pre- and post-development groundwater monitoring program.
As indicated in Section 8.2, it is recommended that a coordinate monitoring effort is conducted over this wetland. A commitment is provided to contribute to this monitoring program.
WRF PROPERTY LTD –Sub-precinct 3A (1), Southern River: Local Water Management Strategy –Second Revised Version
with Addendum, July 2009
Page 58 06.024 RP001 LWMS Final Revised July 09
11 IMPLEMENTATION
To be addressed following the preliminary regulator review of this document.
Table 11: Table of Responsibilities
Item Scheme Development Interim Maintenance (First two years)
Long-term Maintenance
Rainwater Tanks
Developer (residents to construct their own systems)
Residents Residents
Landscaping Packages
Developer Residents Residents
Waterwise fittings
Developer (residents to construct their own systems)
Residents Residents
Swales and drainage system
Developer Developer Council
Monitoring of the development
Developer Developer for three years following practical completion of Stage 1.
Council
Monitoring of CCW to the south of the site
To be resolved through the MoU group with possible contributions from the developers of Sub-precinct 3A(1).
WRF PROPERTY LTD –Sub-precinct 3A (1), Southern River: Local Water Management Strategy –Second Revised Version
with Addendum, July 2009
Page 59 06.024 RP001 LWMS Final Revised July 09
12 SUMMARY
The objective of this LWMS is to design a development that manages the total water cycle in a sustainable manner. This includes water conservation, stormwater management, groundwater management and wetland management. Sub-precinct 3A(1) aims to manage these issues through the following initiatives.
Water Conservation
• Providing householders with rainwater tanks for toilet flushing and/or washing machines;
• Mandating the use of Waterwise fittings at construction;
• Providing Waterwise landscaping packages that include low water use gardens and soil amendments to minimise water and nutrient loss; and
• Minimising water use in Public Open Space through the use of low water use landscaping treatments and water efficient irrigation systems that are linked to soil moisture characteristics.
Stormwater Management
• Implementing a drainage design that limits the peak outflow from the development to pre-development levels through storage and infiltration on site;
• Designing basins such that the 1 in 100 year flood levels are 0.5m below residential floor levels;
• Including swales in the road reserve that store and infiltrate the 1 in 1 year event within the swale; and
• Implementing a stormwater system that the model indicates will meet the ILWMP targets for nitrogen and phosphorus reduction through the use of swales, living streams and bioretention systems.
Groundwater Management
• Allowing the use of controlled groundwater levels only where it can be demonstrated that these will not affect the Conservation Category Wetland to the south of the site;
• Filling and controlling groundwater levels at or above average annual maximum groundwater levels so that at least 1.5 m clearance is maintained between AAMGL and surface level on residential and commercial lots; and

WRF PROPERTY LTD –Sub-precinct 3A (1), Southern River: Local Water Management Strategy –Second Revised Version
with Addendum, July 2009
Page 60 06.024 RP001 LWMS Final Revised July 09
• A commitment to further monitoring of groundwater quality on the site to determine whether historical practices have impacted on groundwater quality.
Wetland Management
Maintaining pre-development levels of flow into the wetland in 1 in 10 year storm event and limiting runoff in the 1 in 100 year storm to pre-development levels.
This Local Water Management Strategy demonstrates that the land can be developed without significant constraints. We are confident that the outstanding issues can be resolved at the Urban Water Management Plan stage to create a development that meets the goals and ideals of the Integrated Land and Water Management Planning process.

WRF PROPERTY LTD –Sub-precinct 3A (1), Southern River: Local Water Management Strategy –Second Revised Version
with Addendum, July 2009
Page 61 06.024 RP001 LWMS Final Revised July 09
13 REFERENCES
Australian and New Zealand Environment and Conservation Council (2000) National Water Quality Management Strategy: Australian and New Zealand guidelines for fresh and marine water quality.
Coghlan, P. and Loh, M. (2003) Domestic Water Use Study
CSIRO (1999) Urban Stormwater: Best Practice Environmental Guidelines Prepared for the Stormwater Committee
Department of Environmental Protection (1996) Land development sites and impacts on air quality: A guideline for the prevention of dust and smoke pollution from land development sites in Western Australia.
Department of Health (2005) Code of Practice for Reuse of Greywater in Western Australia
ENV (2006) Southern River Precinct 3: Environmental review
Essential Environmental Services (2006) Interim Approach for Integrating Urban Water Management with Land Use Planning within the Southern River Area
Essential Environmental Services (18 September 2006) Meeting Notes: Southern River Sub-Precinct 3A(1) Local Water Management Strategy
Geological Survey of Western Australia (1986) Armadale Part Sheets 2033 I and 2133 IV, Perth Metropolitan Region 1:50 000 Environmental Geology Sheets.
GHD (2005 a) Bletchley Park Local Water Management Strategy
GHD (2005 b) Non-potable Water Use: Guidelines for developers and their consultants (draft)
GHD (2007) MUSIC Guidelines for Perth
Government of Western Australia (2003) State Water Strategy
Institution of Engineers, Australia (1987) Australian Rainfall and Runoff
JDA (2002) Southern River/Forrestdale/Brookdale/Wungong Structure Plan: Urban Water Management Strategy
JDA (2006) Brookdale Redevelopment Master Plan: District Water Management Strategy

WRF PROPERTY LTD –Sub-precinct 3A (1), Southern River: Local Water Management Strategy –Second Revised Version
with Addendum, July 2009
Page 62 06.024 RP001 LWMS Final Revised July 09
Rockwater (2005) Southern River Development Area: Groundwater modelling to assess effects of climatic variations and planned developments.
Swan River Trust (undated) Southern River
Swan River Trust (1999) Swan-Canning Cleanup Program: An Action Plan to clean up the Swan-Canning Rivers and Estuary. Water and Rivers Commission
Water Authority of Western Australia (1987) Perth Urban Water Balance Study
Water Corporation (2006) Nondrinking Water Factsheets Series
Water Corporation (2007 a) Southern River Interim Integrated Land and Water Management Plan
Water Corporation (2007 b) Forrestdale Main Drain Arterial Drainage Scheme (Interim)
West Australian Planning Commission (2004) Draft Water Resources Statement of Planning Policy
West Australian Planning Commission (2003) Planning Bulletin 64: Acid Sulphate Soils

WRF PROPERTY LTD –Sub-precinct 3A (1), Southern River: Local Water Management Strategy –Second Revised Version
with Addendum, July 2009
06.024 RP001 LWMS Final Revised July 09
FIGURES

FIGURE 1 – Site Location
DRAWN BY:JS DATE: 25/8/05
CLIENT: WRF Property Ltd
CHECKED BY: MD
SCALE: NTSJOB NUMBER: 06.024
Source: www.walis.wa.gov.auSource: www.walis.wa.gov.au
Site Location
Site Location
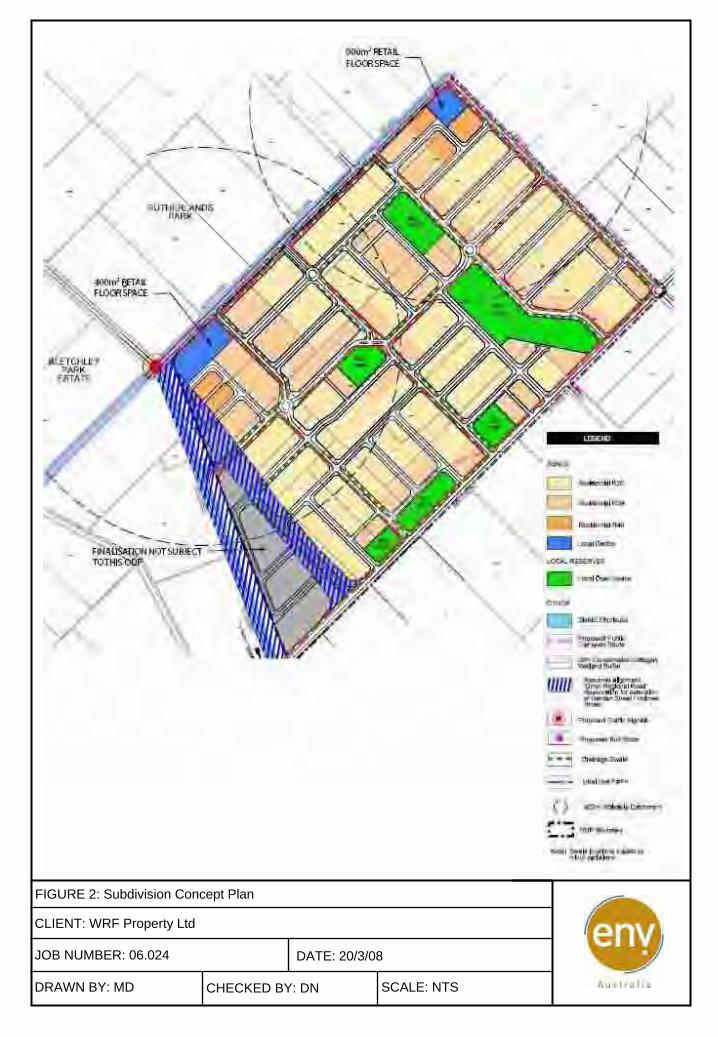
DATE: 20/3/08
SCALE: NTSCHECKED BY: DNDRAWN BY: MD
JOB NUMBER: 06.024
CLIENT: WRF Property Ltd
FIGURE 2: Subdivision Concept Plan

FIGURE 3: Geology
DRAWN BY: MD
DATE: 4/8/06
CLIENT: WRF Property Ltd
CHECKED BY:
JOB NUMBER: 06.024
KeyS8 – Bassendean SandS10 – Bassendean Sand over Guildford FormationSP1 – Peaty Sand
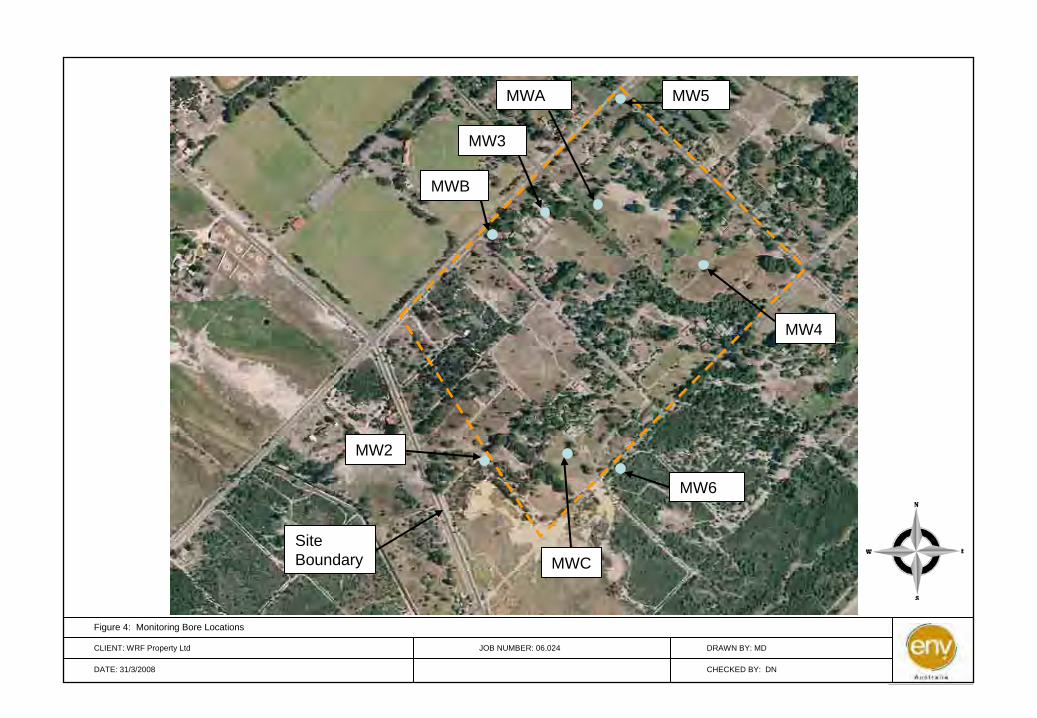
Figure 4: Monitoring Bore Locations
DRAWN BY: MD
DATE: 31/3/2008
CLIENT: WRF Property Ltd
CHECKED BY: DN
JOB NUMBER: 06.024
MWA
MWB
MW6
MWC
MW2
MW4
MW3
MW5
Site Boundary

Figure 5: Acid Sulphate Soils
DRAWN BY: DN
DATE: 31/3/2008
CLIENT: WRF Property Ltd
CHECKED BY: MD
JOB NUMBER: 06.024

Figure 6:Annual Average Maximum Groundwater Levels (AAMGLs) From: Southern River/Forrestdale/Brookdale/Wungong Structure Plan UWMS (JDA, 2002)
DRAWN BY: MD
DATE: 4/8/2006
CLIENT: WRF Property Ltd
CHECKED BY: DN
JOB NUMBER: 06.024
Site Boundary

Figure 7: Annual Average Lowest Groundwater Levels. All values and contours in m AHD.
DRAWN BY: MD
DATE: 2/8/2006
CLIENT: WRF Property Ltd
CHECKED BY: DN
JOB NUMBER: 06.024
Site Boundary
MW2 17.85
MW4 14.88
MW5 14.06
KeyAALGL
(m AHD)
MW6 17.55
MWB 17.64
MWC 17.83
MW3 dry
MWA 16.14
N
17
16
15

3
1000
1001
11
6
A2403
WOONGAN
VERNA
D
MATIS
ON
24
1751
1527
1748
1749
2017
98
23
6
P 21
22
8
15
1799
1805
1793
8
1803
1804
9
9
6
S
SEE FILE 04
1080
7BRADLEY
PRIN
SHANNON
VASS
E
RMBL
LESLIE
1
51851
954
5526
52454
0
520
54152
3
646
4811
1678
722
4
1517
15
73
1508
2
P 1526
1525
1512
1516
1744
1527
460S
460S
WALT
ER ST P
.M.
1512
3
WALT
ER ST P
.M.
825RC0.0
FORRESTDALE M.D. 61401
AH19SBA005
APPROX
SBA004APPROX
AH19
FORRESTDALE M
.D. 6
1401
HO
LME
S
STREET
STREET
SOUTHERN RIV
ER
ROAD
STREET
STREET
STREET
STREET
20
19
21
22
22
25
23
17
16
21
2
21
21
21
21
21
23 23
23
23
24
24
24
22
22
21
21
24
25
22
21
21
18
18
18
20
20
20
20
20
20
20
20
20
20
2020
20 20
20
20
19
19
19
19
19
19
19
19
19
21
21
21
21
21
21
21
21
21
21
21
21
21
21
21
21
21
22
22
22
22
22
22
22
22
2020
2121
21
22
23
23
23
23
23
23
24
24
2425
25
26
27
21
20
20
20
20
20
21
21
22
2
23
24
21
21
21
22
22
22
22
22
23
23
23
23
20
22
20
21
21
21
21
20
22
22
23
20
24
24
24
25
26
26
21
21
21
21
21
21
23
23
24
24
25
2526
24
2524
22
2323
2223
23
23
23
2422
25
23
25
22
22
21
21
21
18
18
18
18
18
18
20
20
1919
19
19
19
19
19
19
21
21
21
21
2123
22
22
17
17
17
17
16
16
16
14
14
14
14
1212
13
13
13
11
18
18
19
20
16
16
17
17
2020
20
20
20
20
20
20
21
21
21
21
22
18
19
16
21
21
17 16
19
19
19
19
18
18
18
18
15
15
5
15
15
15
22
23
0
metres
Mon
07
Apr
08
PR
INT
ED
:
N
A u s t r a l i a
env
SCALE 1 : 7 000 @ A4
100 200 300 400 500
Topography and cadastre supplied by: SICAD, 2006
WRF PROPERTY PTY LTDSOUTHERN RIVER PRECINCT 3A
LEGEND
21
1818
1919
07-084-AAMGL.dgnDATUM: MGA50DRAWN: TE 7-04-08AUTHOR: MD 7-04-08
2020
18 22
21
1821
2218
3.726
FIGURE 8
18.61818.618 18.3018.30
19.5919.5919.57619.576
19.6819.68
17.83117.83119.74219.742
0.5550.555 0.990.99
0.7750.7751.0451.045
1.4881.488
1.7111.7111.4881.488
17.31117.3110.5080.508
MW4MW4
MW5MW5
MWAMWAMW3MW3
MWBMWB
MW2MW2
MWCMWCMW6MW6
1.4881.488AAMGL ( m AHD )Depth to Ground water ( m BGL )
MWBMWB19.53
AVERAGE ANNUAL MAXIMUMGROUNDWATER LEVELS
Subject land boundaryCadastral boundaryTopographic contour ( 1m interval)AAMGL ContourDepth to AAMGLBore location
0m0m
2m2m
2m2m
2m2m
2m2m

Site Boundary
Poultry Egg Farm
Sand Quarry
Drain
Former Broiler Farm
Leslie St Wetland: Approximate Area of Inundation
Southern River Road Drain
Matison Rd Drain
Forrestdale Main Drain
Figure 9: Drainage Features
DRAWN BY: MD
DATE: 31/3/2008
CLIENT: WRF Property Ltd
CHECKED BY: KL
JOB NUMBER: 06.024
Key Surface Water
Sampling Points
SW2
SW2
Dds
Dc
Dm
Dc
Dds
Dm

3
1000
1001
11
6
A2403
WOONGAN
ST
VERNA
DALLEN
MATIS
ON
24
1751
1527
1748
1749
2017
98
23
6
P 21
22
8
1
1531
1539
67
1535
1550
1799
1807
1805
1793
8
1803
1804
9
9
6
1567
SEE FILE JT
1 200
0 077
72
SEE FILE 29
303
SEE FILE 04
1080
7BRADLEY
SERPENTINE
DRYS
DALE
ST
PL
MNDR
BEND
WY
MNDRHOTHAM
WY
FORTESCUE
SERPENTINE
HUTT
MNDR
WY
CHAPMANLOOP
PRINCE R
EGENT
SHANNON
VASS
E
RMBLSHANNON
SERPENTINE
RMBL
PASS
ORD
MAGPIECHANDILLA
JACANA
ST
MARGARET
LESLIE
LESLIE
ST
CHANDIL
1
803
1296
51851
9
1297
575
900458
4 577
581
27
815
825 81
9
15822
848
647 813
812
826
55966
1 571
664
594
665
668
599
P 3
598
606
65160
3
596
611
605
615
568
508
55153
355
655
8
555
553
554
62455
060
8
621
530
529
549
626
642
545
509
511
512
537
534
526
52454
0
520
54152
3
646
4811
1678
722
629
639
633
634
4814
4812
4813
1521
617
806
655
901
903
65865
980
0
52
53
6857
831
843
46
41
1679
9183
783
8
1544
1541
1540
1517
1545
1547
73
1508
2
P 1526
1525
1512
1516
1744
1527
215
39
14
69
3
120
117
3981
5
3545
1817
1818
1792
460S
460S
WALT
ER ST P
.M.
DAV
1512
3
WALT
ER ST P
.M.
200P
7.3 5.3
29.7
24.7
20.9
80.7
24.8
20.5
10.2
58.7
59.8
825RC0.0
FORRESTDALE M.D. 61401
AH19SBA005
APPROX
SBA004APPROX
AH19
FORRESTDALE M
.D. 6
1401
A001APPROX
HO
LME
S
STREET
STREET
SOUTHERN RIV
ER
ROAD
STREET
STREET
STREET
STREET
23
23
22
21
17
18
18
20
20
20
19
1919
20
21
21
20
21
22
21
21
22
25
23
20
19
19
18
17
18
1920
2021
20
20
19
20
21
16
21
19
21
19
18
20
15
21
21
21
21
21
23 23
23
23
24
24
24
22
22
21
21
24
25
22
22
2223
23
23
22
22
24
22
23
24
22
21
21
21
22
2220
16
16
16
17
17
17
17
17
17
17
17
18
18
18
18
18
18
18
18
18
18
18
18
18
18
18
18
20
20
20
20
20
20
20
20
20
20
20
2020
20 20
20
20
20
20
20
20
20
19
19
19
19
19
19
19
19
19
19
19
19
19
19
19
19
19
19
20
21
21
21
21
21
21
20
20
19
19
19
21
21
21
21
21
21
21
21
21
21
21
21
21
21
21
21
21
22
22
22
22
22
22
22
22
2020
2121
21
22
23
23
23
23
23
23
24
24
24
25
25
26
27
21
19
19
20
20
20
20
20
21
21
21
21
21
22
22
22
23
23
24
21
21
21
22
22
22
22
22
23
23
23
23
20
22
20
21
21
21
21
20
22
22
23
20
24
24
24
25
26
26
21
21
21
21
21
21
23
23
24
24
25
2526
24
2524
22
2323
2223
23
23
23
2422
25
23
25
22
22
21
21
21
21
20
20
20
20
19
19
19
18
18
18
18
18
1818
18
18
18
18
18
20
20
1919
19
19
19
19
19
19
19
19
19
19
19
21
21
21
21
2123
22
22
17
17
17
17
17
17
17
17
17
17
17
16
16
1616
16
16
16
16
14
14
14
14
14
14
14
14
14
14
14
1212
13
13
13
11
18
18
18
18
18
18
18
18
18
19
19
19
19
19
19
20
20
20
20
21
20
20
20
20
2020
20
19
19
19
19
19
19
20
20
20
20
20
2021
21
16
16
16
16
16
16
16
16
17
17
17
17
17
17
17
17
17
2020
20
2020
20
20
20
20
20
20
20
21
21
21
21
22
21
21
21
1820
19
16
19
19
19
20
19
19
21
21
21
17 16
19
19
19
19
19
18
18
19 19
19
19
20
21
18
18
20
18
18
18
21
20
211920
21
20
15
15
15
15
15
15
15
15
15
15
15
15
15
15
15
22
23
19
Topography and cadastre supplied by: SICAD, 2006
WRF PROPERTY PTY LTDSOUTHERN RIVER PRECINCT 3A
06-024-F12.dgnDATUM: MGA50DRAWN: TE 1-03-08AUTHOR: MD 1-03-08
flood
fringe
flood
fringe
100 year100 year 100YRRL=21.00
100YRRL=21.00
100YRRL=21.20
100YRRL=15.00
100YRRL=14.50
Mon
07
Apr
08
PR
INT
ED
:
A u s t r a l i a
envGEOMORPHIC WETLANDS OF THESWAN COASTAL PLAIN
FIGURE 10
0
metres
N
SCALE 1 : 10 000 @ A4
100 200 300 400 500
100YRRL=16.00 100YR
RL=17.00
100YRRL=18.00
100YRRL=18.50
100YRRL=19.70
100YRRL=19.10
100YRRL=19.80
LEGEND
21
Geomorphic WetlandsConservation Category WetlandMultiple Use WetlandResource Enhancement Wetland
100YRRL=21.00
Subject land boundaryCadastral boundaryTopographic contour ( 1m interval)100 Year Flood Fringe1:100 year flood level
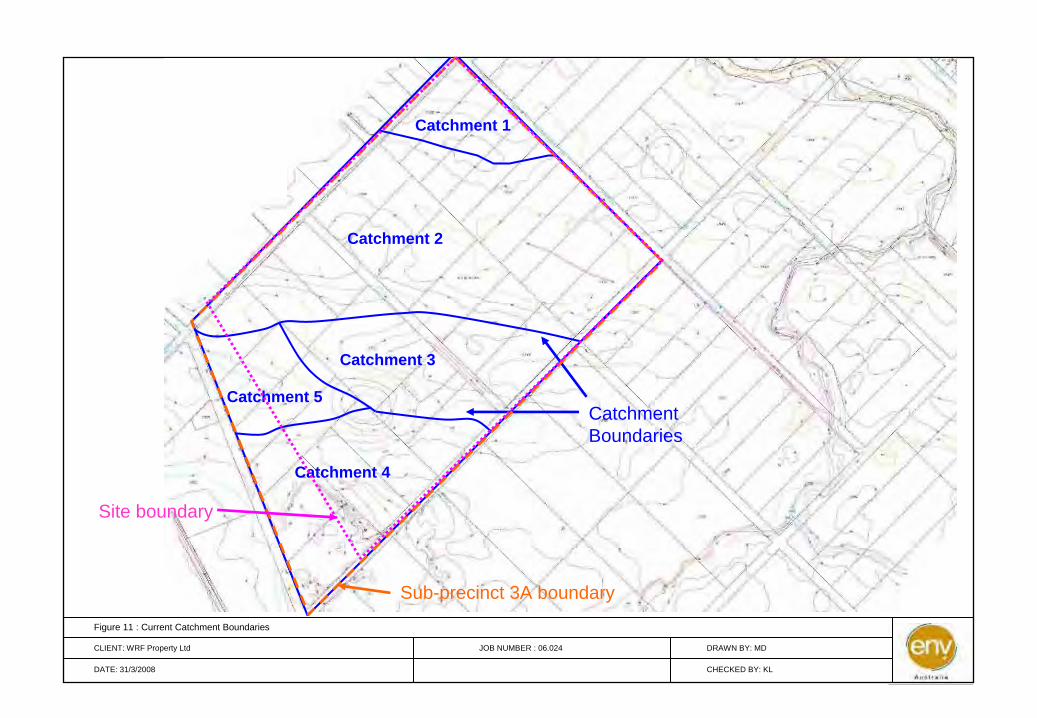
Figure 11 : Current Catchment Boundaries
DRAWN BY: MD
DATE: 31/3/2008
CLIENT: WRF Property Ltd
CHECKED BY: KL
JOB NUMBER : 06.024
Sub-precinct 3A boundary
Catchment 2
Catchment 1
Catchment 3
Catchment 4
Catchment 5Catchment Boundaries
Site boundary
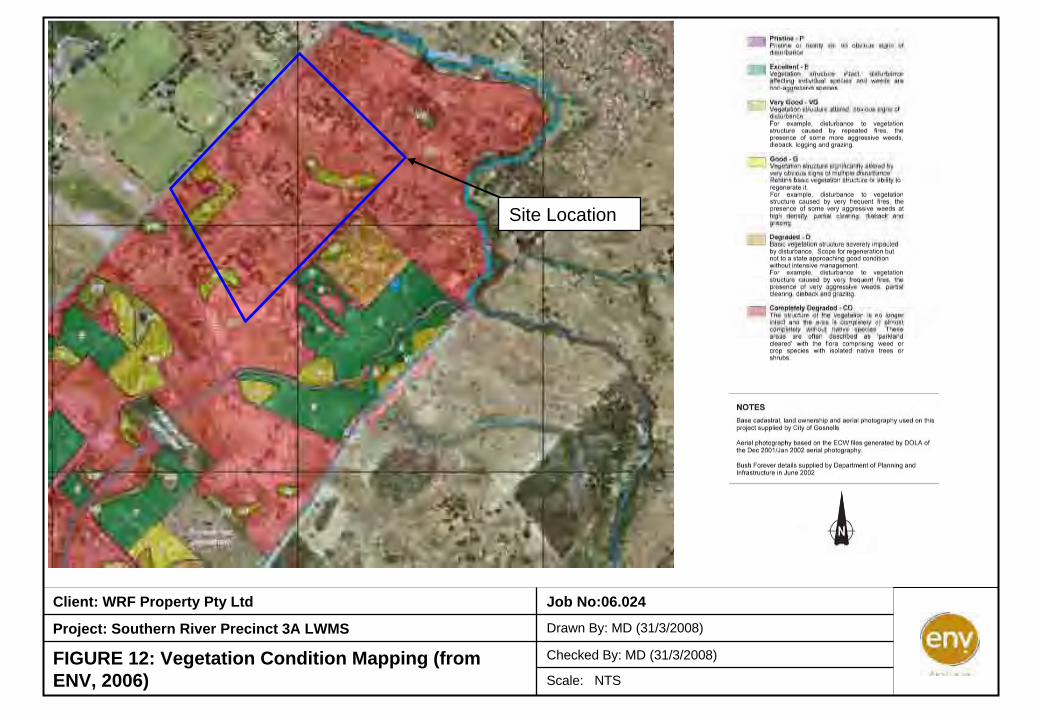
Click to add title
Client: WRF Property Pty Ltd Job No:06.024
Project: Southern River Precinct 3A LWMS Drawn By: MD (31/3/2008)
FIGURE 12: Vegetation Condition Mapping (from ENV, 2006)
Checked By: MD (31/3/2008)
Scale: NTS
Site Location

Mon
07
Apr
08
PR
INT
ED
:
0 50
metres
A u s t r a l i a
envWRF PROPERTY PTY LTD
SOUTHERN RIVER PRECINCT 3ADRAINAGE CATCHMENT PLANNING
FOR WRF LAND HOLDINGFIGURE 14SOURCE: The Civil Group Consulting Civil Engineers, 7488-33B
100 150 200
Approximate SCALE 1 : 4 000 @ A3
06-024-F14.dgn
DATUM: Not spatially correct
DRAWN: TE 7-04-08
AUTHOR: MD 7-04-08
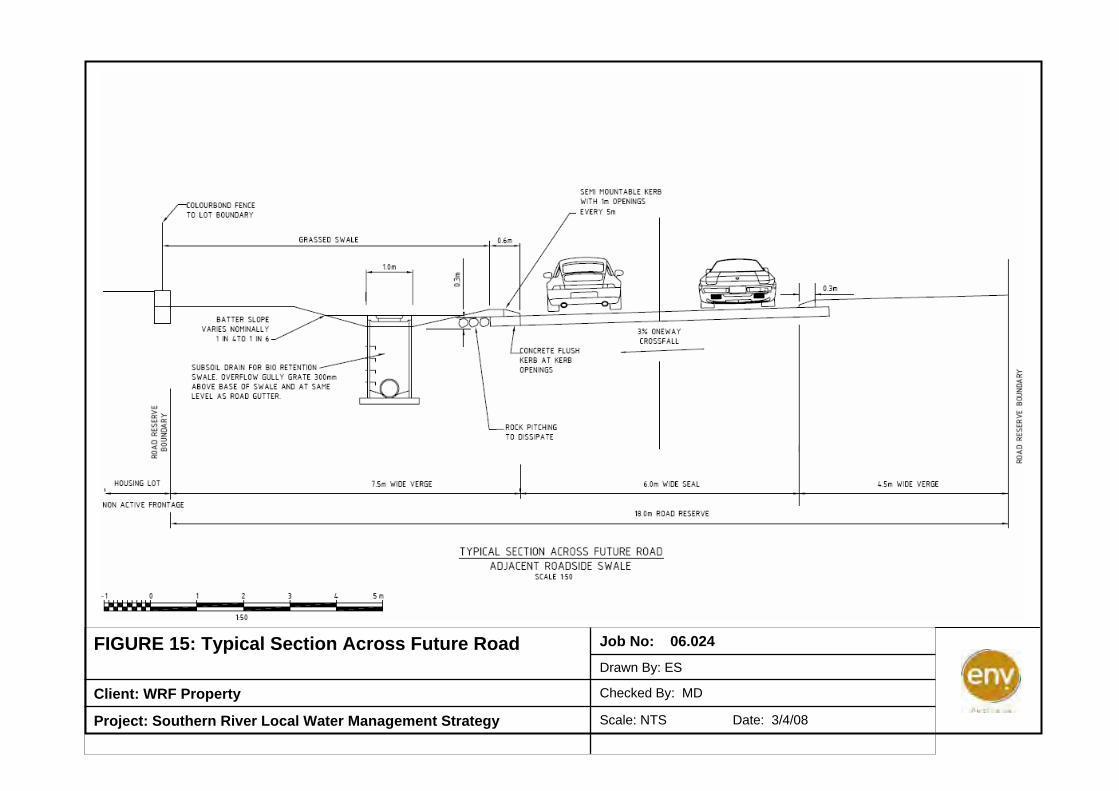
Scale: NTS Date: 3/4/08Project: Southern River Local Water Management Strategy
Checked By: MDClient: WRF Property
Drawn By: ES
Job No: 06.024FIGURE 15: Typical Section Across Future Road
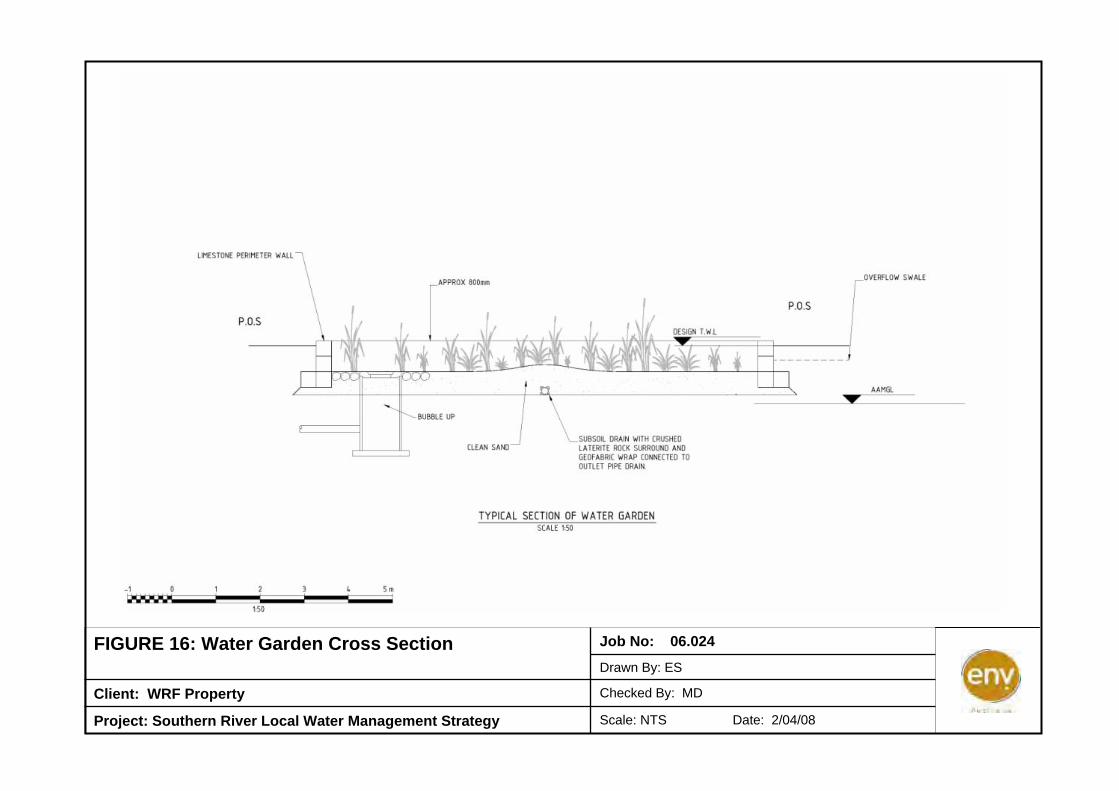
Scale: NTS Date: 2/04/08Project: Southern River Local Water Management Strategy
Checked By: MDClient: WRF Property
Drawn By: ES
Job No: 06.024FIGURE 16: Water Garden Cross Section

WRF PROPERTY LTD –Sub-precinct 3A (1), Southern River: Local Water Management Strategy –Second Revised Version
with Addendum, July 2009
06.024 RP001 LWMS Final Revised July 09
APPENDIX A CHANGES TO REPORT BETWEEN
MARCH 2007 AND APRIL 2008 VERSIONS
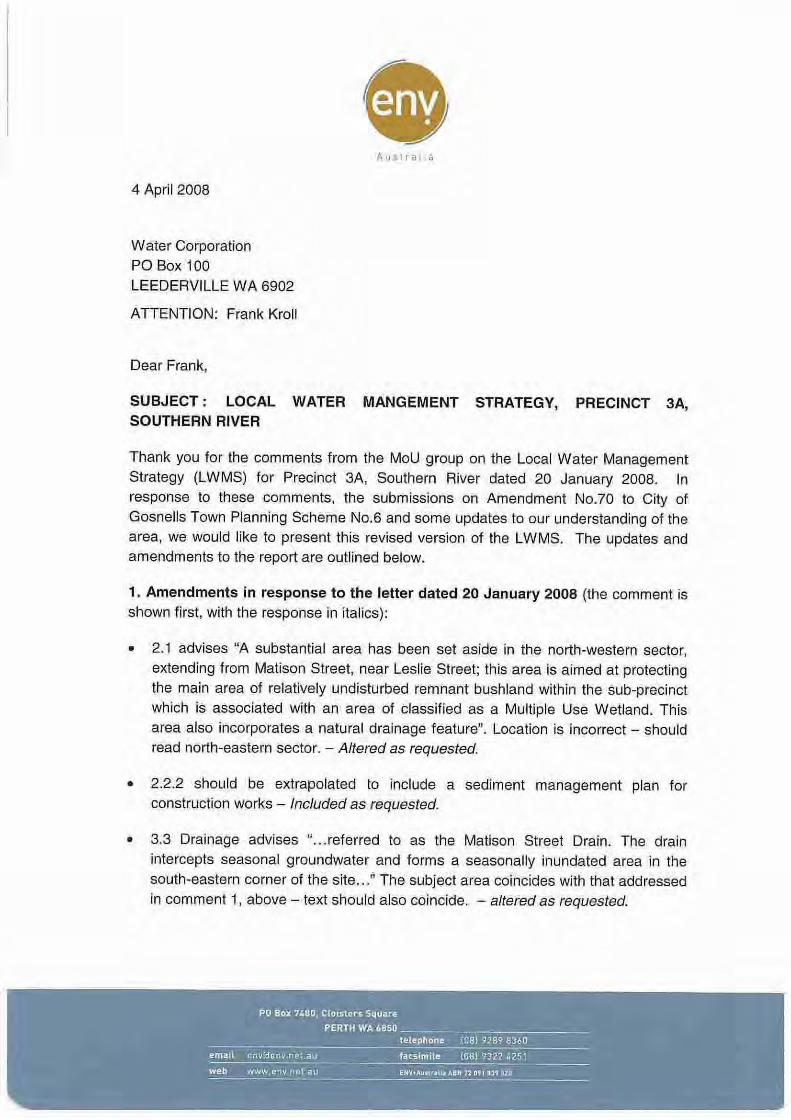


WRF PROPERTY LTD –Sub-precinct 3A (1), Southern River: Local Water Management Strategy –Second Revised Version
with Addendum, July 2009
06.024 RP001 LWMS Final Revised July 09
APPENDIX B MONITORING BORE LOGS

Client: SPM Project: Southern RiverLogged By: S.McHarg Job No: 05.103
Strataprobe Date Logged: 03-Aug-05Monitoring Bore: MW2 Installation Method: Hollow Stem Auger
Depth Sample Monitor Profile Lithology ObservationsBGL Taken Well pH (f) pH (fox)(m) Log
Metal riser used0-0.8 SAND, grey, medium grained, medium sorting 6.76 4.67
0.5 7.47 5.08
7.43 5.130.8-3.7 SAND, light yellow, fine-medium grained
1.0 1.0
7.18 5.08
1.5
2.0 2.0 7.2 5.11
2.5 7.67 5.01
3.0 3.0 6.69 5.15
wet
3.5 6.41 5.14
3.7-4.0 SAND, light grey, fine-medium grained
4.0 4.0 6.12 4.964.0-5.0 SAND, light brown, fine-medium grained, mottling
4.5 6 5.1
5.0 5.0 5.86 4.895-6.0 Sandy CLAY, medium plasticity, sand medium grained,
mottling present
5.5 5.82 5.1
6.0 6.0 6.41 5NOTE: Monitor Well Screen Initial water table at time drilling Cement ENV. AustraliaFilter sock used Meters are below top of casing Level 7Indicates the presence of PASS Monitoring bore 25mm diameter 182 St Georges Terrace
Coordinates - 402 686E / 6 447 858N (GDA 94) Perth, WA, 6000.
Drilled By:
06.024 RP001 Appendix B April 08
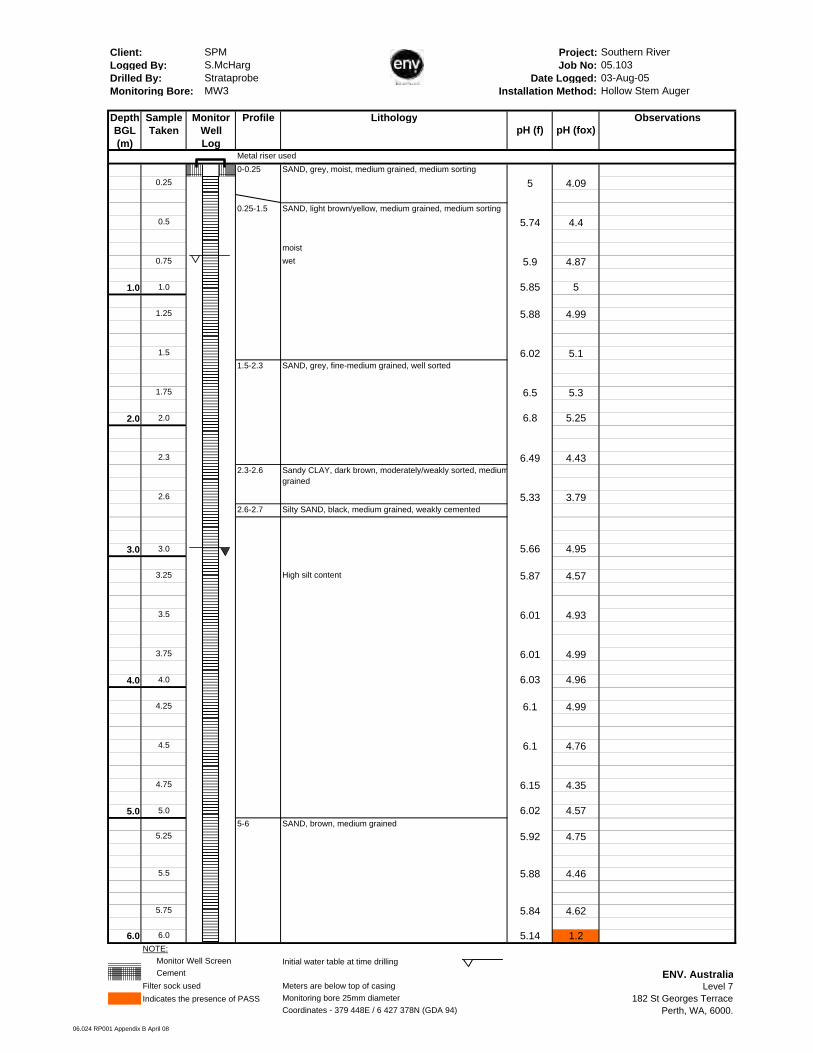
Client: SPM Project: Southern RiverLogged By: S.McHarg Job No: 05.103
Strataprobe Date Logged: 03-Aug-05Monitoring Bore: MW3 Installation Method: Hollow Stem Auger
Depth Sample Monitor Profile Lithology ObservationsBGL Taken Well pH (f) pH (fox)(m) Log
Metal riser used0-0.25 SAND, grey, moist, medium grained, medium sorting
0.25 5 4.09
0.25-1.50.5 5.74 4.4
moist0.75 wet 5.9 4.87
1.0 1.0 5.85 5
1.25 5.88 4.99
1.5 6.02 5.11.5-2.3 SAND, grey, fine-medium grained, well sorted
1.75 6.5 5.3
2.0 2.0 6.8 5.25
2.3 6.49 4.432.3-2.6
2.6 5.33 3.792.6-2.7 Silty SAND, black, medium grained, weakly cemented
3.0 3.0 5.66 4.95
3.25 High silt content 5.87 4.57
3.5 6.01 4.93
3.75 6.01 4.99
4.0 4.0 6.03 4.96
4.25 6.1 4.99
4.5 6.1 4.76
4.75 6.15 4.35
5.0 5.0 6.02 4.575-6 SAND, brown, medium grained
5.25 5.92 4.75
5.5 5.88 4.46
5.75 5.84 4.62
6.0 6.0 5.14 1.2NOTE: Monitor Well Screen Initial water table at time drilling Cement ENV. AustraliaFilter sock used Meters are below top of casing Level 7Indicates the presence of PASS Monitoring bore 25mm diameter 182 St Georges Terrace
Coordinates - 379 448E / 6 427 378N (GDA 94) Perth, WA, 6000.
Drilled By:
SAND, light brown/yellow, medium grained, medium sorting
Sandy CLAY, dark brown, moderately/weakly sorted, mediumgrained
06.024 RP001 Appendix B April 08

Client: SPM Project: Southern RiverLogged By: S.McHarg Job No: 05.103
Strataprobe Date Logged: 03-Aug-05Monitoring Bore: MW4 Installation Method: Hollow Stem Auger
Depth Sample Monitor Profile Lithology ObservationsBGL Taken Well pH (f) pH (fox)(m) Log
Metal riser used0-0.25
0.25 6.17 4.4
0.5 6.69 5.32
0.75 6.52 5.54
1.0 1.0 6.82 5.43
1.25 6.99 4.88
Non-cemented1.5 6.46 4.25
Weakly cemented, iron and organic. Iron mottling
2.0 2.0 6.9 4.142.15 6.08 4.052.2 3.83 1.77
Higher organic component
2.5 5.31 1.92
2.75 6.87 2.96
3.0 3.0 7.22 5.73
3.25 8.44 7.2
3.5 8.31 5.56
3.75 8.33 5.1
4.0 4.0 Clay content increasing 8.26 5.68
4.25 8.03 3.1
4.5 7.89 2.28
4.75 7.84 2.14
5.0 5.0 7.8 1.87
5.25 7.79 1.82
5.5 7.64 1.6
5.75 7.55 1.4
6.0 6.0 7.53 1.37NOTE: Monitor Well Screen Initial water table at time drilling Cement ENV. AustraliaFilter sock used Meters are below top of casing Level 7Indicates the presence of PASS Monitoring bore 25mm diameter 182 St Georges Terrace
Coordinates - 379 448E / 6 427 378N (GDA 94) Perth, WA, 6000.
Drilled By:
Silty SAND, black and grey, fine-medium grained, medium sorting, moderate organic component
Sandy CLAY, blue/green, low-medium plasticity. Sand poorlysorted, medium grained.
06.024 RP001 Appendix B April 08

Client: SPM Project: Southern RiverLogged By: S.McHarg Job No: 05.103
Strataprobe Date Logged: 03-Aug-05Monitoring Bore: MW5 Installation Method: Hollow Stem Auger
Depth Sample Monitor Profile Lithology ObservationsBGL Taken Well pH (f) pH (fox)(m) Log
Metal riser used
wet0.5 5.9 4.85
0.75 5.85 5.170.8-1.3 Silty SAND, brown, weakly cemented, "lumpy"
1.0 1.0 4.93 4.25
1.25 5 3.92
1.3-6.01.5 5.19 3.21
1.75 5.05 2.76
2.0 2.0 5 3.6
2.5 4.7 3.84 Poor Recovery
3.0 3.0 5.3 4.41
3.25 5.72 3 Sulphur like odour
3.5 5.91 4.31
3.75 6.6 4.24
4.0 4.0 6.15 4.05
4.25 6.25 4.6
4.5 6.44 1.67 Sulphur like odour
4.75 6.37 2.39
5.0 5.0 6.48 1.6
5.25
5.5
Sulphur like odour5.75
6.0 6.0NOTE: Monitor Well Screen Initial water table at time drilling Cement ENV. AustraliaFilter sock used Meters are below top of casing Level 7Indicates the presence of PASS Monitoring bore 25mm diameter 182 St Georges Terrace
Coordinates - 403 011E / 6 448 666N (GDA 94) Perth, WA, 6000.
Drilled By:
SAND, grey, medium grained, medium sorting
Clayey SAND, light grey, medium plasticity, fine-medium grained, mottling
06.024 RP001 Appendix B April 08

Client: Project and Job No.: Southern RiverPerformed by: JS and Strataprobe Date Logged: 19/05/06 Easting: 403032Borehole #: MW6 Drill Rig Method: Geoprobe Northing: 6447844
Depth Monitor Horizon Horizon Observations pH pHF pHFOX pH Reaction# SampleBGL Well Depth Lithology (ie. H2S odour) Depth Change Analysed(m) Log (m) (m bgl)
≤4 <3 - - -
0-0.25 SAND,black to dark brown, medium grained, moderatley
sorted.
0.25-0.30 SAND,dark whitey grey, medium grained, moderatley
1.0 sorted.
0.3-2.25 SAND, white, medium grained, moderatley sorted.
2.0
2.25-2.7 SAND, dark white grading to dark brown
(coffee rock low cementing)at 2.7m
2.7-4.0 COFFEE ROCK, dark brown to dark tan, low cementing,
3.0 Fine grained, well sorted.
4.0
End of Hole - 4.0m
5.0
6.0# Reaction with H2O2; L= low, M = medium, H = high, X = extreme
Monitor Well ScreenSand Fill
SWL Standing Water Level
Indication Level
06.024 RP001 Appendix B April 08

Client: Project and Job No.: Southern RiverPerformed by: JS and Strataprobe Date Logged: 19/06/06 Easting:Borehole #: Mwa Drill Rig Method: Geoprobe Northing:
Depth Monitor Horizon Horizon Observations pH pHF pHFOX pH Reaction# SampleBGL Well Depth Lithology (ie. H2S odour) Depth Change Analysed(m) Log (m) (m bgl)
≤4 <3 - - -
0-1.2m SAND,Grey, moderately sorted, medium grained.
sorted.
1.0
1.2-2.5 Coffee Rock, Dark brown, fine grained, well sorted
2.0
Saturated at 2.1m
2.5-3.8m Coffee Rock, saturated sand, fine grained, well sorted
3.0
4.0
End of Hole - 3.8m
5.0
6.0# Reaction with H2O2; L= low, M = medium, H = high, X = extreme
Monitor Well ScreenSand Fill
SWL Standing Water Level
Indication Level
06.024 RP001 Appendix B April 08
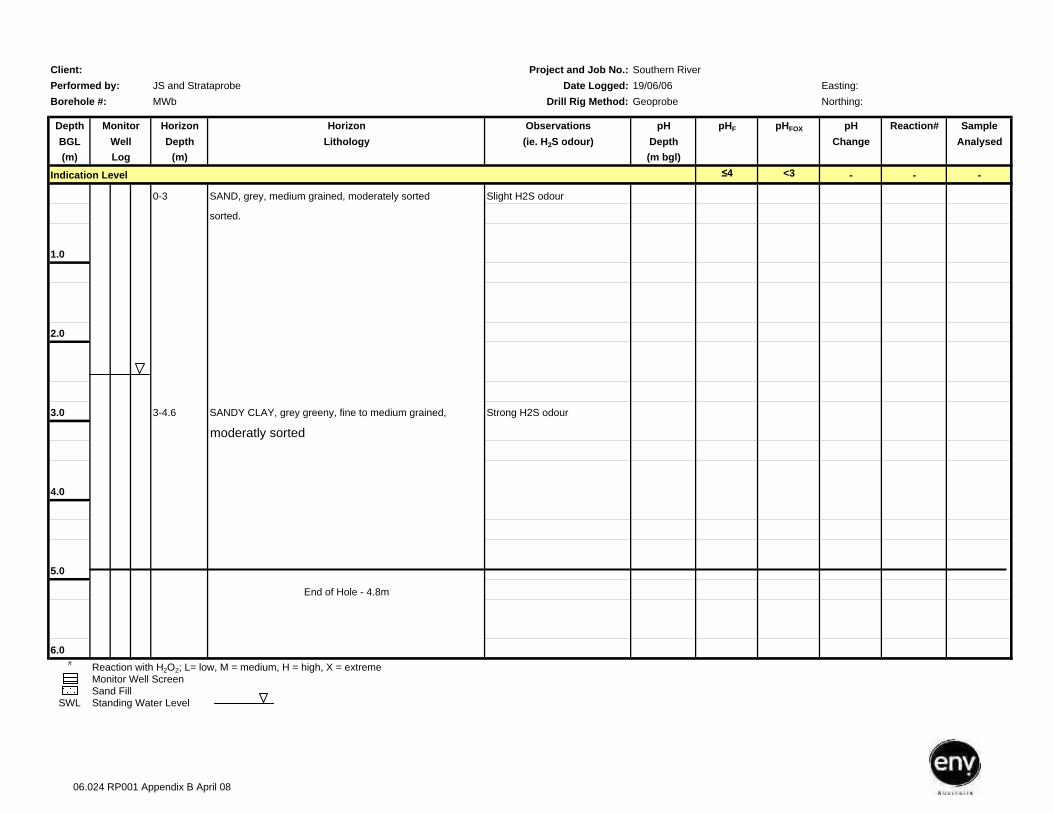
Client: Project and Job No.: Southern RiverPerformed by: JS and Strataprobe Date Logged: 19/06/06 Easting:Borehole #: MWb Drill Rig Method: Geoprobe Northing:
Depth Monitor Horizon Horizon Observations pH pHF pHFOX pH Reaction# SampleBGL Well Depth Lithology (ie. H2S odour) Depth Change Analysed(m) Log (m) (m bgl)
≤4 <3 - - -
0-3 SAND, grey, medium grained, moderately sorted Slight H2S odour
sorted.
1.0
2.0
3.0 3-4.6 SANDY CLAY, grey greeny, fine to medium grained, Strong H2S odour
moderatly sorted
4.0
5.0
End of Hole - 4.8m
6.0# Reaction with H2O2; L= low, M = medium, H = high, X = extreme
Monitor Well ScreenSand Fill
SWL Standing Water Level
Indication Level
06.024 RP001 Appendix B April 08

Client: Project and Job No.: Southern RiverPerformed by: JS and Strataprobe Date Logged: 19/06/06 Easting: 403032Borehole #: MWc Drill Rig Method: Geoprobe Northing: 6447844
Depth Monitor Horizon Horizon Observations pH pHF pHFOX pH Reaction# SampleBGL Well Depth Lithology (ie. H2S odour) Depth Change Analysed(m) Log (m) (m bgl)
≤4 <3 - - -
0-4m SAND, grey to browney grey, medium grained,
moderaltely sorted
1.0
2.0
3.0
4.0 4-4.2m SANDY CLAY, grey green, fine grained, well sorted
End of Hole - 4.2m
5.0
6.0# Reaction with H2O2; L= low, M = medium, H = high, X = extreme
Monitor Well ScreenSand Fill
SWL Standing Water Level
Indication Level
06.024 RP001 Appendix B April 08

WRF PROPERTY LTD –Sub-precinct 3A (1), Southern River: Local Water Management Strategy –Second Revised Version
with Addendum, July 2009
06.024 RP001 LWMS Final Revised July 09
APPENDIX C RECORDED GROUNDWATER
LEVELS

WRF PROPERTY LTD –Sub-precinct 3A (1), Southern River: Local Water Management Strategy – Final Revised, June 2009
APPENDIX C
RECORDED GROUNDWATER LEVELS
06.024 RP001 LMWS Final Revised June 08
Date 16/08/2005 23/08/2005 7/03/2006 24/05/2006 4/07/2006 10/08/2006 13/09/2006 19/10/2006 21/03/2007 11/10/2007 25/10/2007 21/11/2007Rain * 21.8 / 29 0 23/05/2006
Recorded LevelMB1 - 0.87MB2 - 3.56 4.41 4.863 4.981 5.254 5.552 4.684 dry 4.29 4.25 4.54MB3 1.14 1.24 dry dry blocked 2.394 2.024 2.054 dry 1.603 1.76 2.012MB4 1.261 1.27 3.63 3.47 3.269 3.05 1.776 2.698 4.64 1.452 1.78 2.775MB5 - 0.82 2.19 3.334 3.111 2.29 1.195 1.679 4.69 0.995 1.257 1.57MB6 2.439 2.502 2.39 1.859 2.049 3.06 1.595 1.695 1.935MBA 2.525 2.281 1.854 2.03 2.925 1.493 1.635 1.863MBB 2.45 2.175 1.775 2.081 dry 1.485 1.71 1.97MBC 2.803 2.654 2.339 2.476 dry 2.192 2.228 2.44T75 2.231 1.993 1.811 2.133 1.824 2.83 1.425 1.608 2.262T85DoE 8285 3.432 3.476 3.404 3.814 3.38 2.688 2.78 2.93 bore decom
16/08/2005 23/08/2005 7/03/2006 24/05/2006 4/07/2006 10/08/2006 13/09/2006 19/10/2006 21/03/2007 11/10/2007 25/10/2007 21/11/2007MB2 20.182 19.330 18.879 18.761 18.488 18.190 19.058 19.452 19.492 19.202MB3 18.853 18.753 17.599 17.969 17.939 18.39 18.233 17.981MB4 17.794 17.785 15.427 15.585 15.786 16.005 17.279 16.357 14.415 17.603 17.275 16.28MB5 17.263 15.890 14.744 14.967 15.788 16.883 16.399 13.388 17.083 16.821 16.508MB6 18.521 18.458 18.570 19.101 18.911 17.900 19.3645 19.2645 19.0245MBA 17.044 17.288 17.715 17.539 16.644 18.076 17.934 17.706MBB 18.549 18.824 19.224 18.918 19.514 19.289 19.029MBC 18.737 18.886 19.201 19.064 19.348 19.312 19.1T75 18.126 18.364 18.546 18.224 18.533 17.527 18.932 18.749 18.095DoE 8285 23.584 23.540 23.612 23.202 23.636 24.328 24.236 24.086
* rain given as rainfall in mm that day / day previous from data taken at Perth AirportNote: meter used on 23/8 was only marked down to the cm, therefore all estimates are +/- 0.25 cm

WRF PROPERTY LTD –Sub-precinct 3A (1), Southern River: Local Water Management Strategy –Second Revised Version
with Addendum, July 2009
06.024 RP001 LWMS Final Revised July 09
APPENDIX D AVERAGE ANNUAL MAXIMUM AND LOWEST GROUNDWATER LEVEL
CALCULATIONS

APPENDIX DANNUAL AVERAGE LOWEST GROUNDWATER LEVEL CALCULATIONS
Monitoring bores
Date 16/08/2005 23/08/2005 7/03/2006 24/05/2006 4/07/2006 10/08/2006 13/09/2006 19/10/2006 21/03/2007 11/10/2007 25/10/2007 21/11/2007Rain * 21.8 / 29 0 23/05/2006
Recorded LevelMB1 - 0.87MB2 - 3.56 4.41 4.863 4.981 5.254 5.552 4.684 dry 4.29 4.25 4.54MB3 1.14 1.24 dry dry blocked 2.394 2.024 2.054 dry 1.603 1.76 2.012MB4 1.261 1.27 3.63 3.47 3.269 3.05 1.776 2.698 4.64 1.452 1.78 2.775MB5 - 0.82 2.19 3.334 3.111 2.29 1.195 1.679 4.69 0.995 1.257 1.57MB6 2.439 2.502 2.39 1.859 2.049 3.06 1.595 1.695 1.935MBA 2.525 2.281 1.854 2.03 2.925 1.493 1.635 1.863MBB 2.45 2.175 1.775 2.081 dry 1.485 1.71 1.97MBC 2.803 2.654 2.339 2.476 dry 2.192 2.228 2.44T75 2.231 1.993 1.811 2.133 1.824 2.83 1.425 1.608 2.262T85DoE 8285 3.432 3.476 3.404 3.814 3.38 2.688 2.78 2.93 bore decomissioned
16/08/2005 23/08/2005 7/03/2006 24/05/2006 4/07/2006 10/08/2006 13/09/2006 19/10/2006 21/03/2007 11/10/2007 25/10/2007 21/11/2007 depth from GLMB2 20.182 19.330 18.879 18.761 18.488 18.190 19.058 19.452 19.492 19.202 MB2 3.726MB3 18.853 18.753 17.599 17.969 17.939 18.39 18.233 17.981 MB3 0.999MB4 17.794 17.785 15.427 15.585 15.786 16.005 17.279 16.357 14.415 17.603 17.275 16.28 MB4 0.779MB5 17.263 15.890 14.744 14.967 15.788 16.883 16.399 13.388 17.083 16.821 16.508 MB5 0.508MB6 18.521 18.458 18.570 19.101 18.911 17.900 19.3645 19.2645 19.0245 MB6 1.488MBA 17.044 17.288 17.715 17.539 16.644 18.076 17.934 17.706 MBA 0.99MBB 18.549 18.824 19.224 18.918 19.514 19.289 19.029 MBB 1.045MBC 18.737 18.886 19.201 19.064 19.348 19.312 19.1 MBC 1.711T75 18.126 18.364 18.546 18.224 18.533 17.527 18.932 18.749 18.095DoE 8285 23.584 23.540 23.612 23.202 23.636 24.328 24.236 24.086
* rain given as rainfall in mm that day / day previous from data taken at Perth AirportNote: meter used on 23/8 was only marked down to the cm, therefore all estimates are +/- 0.25 cm
Surface Water sites
Date 16/08/2005 13/08/2005 24/05/2006 21/03/2007 11/10/2007 25/10/2007 21/11/2007Rain * 21.8 / 29 0 23/05/2006
Recorded LevelSW1 - 0.68 0.00 0 Dry Dry
SW2 - 0.57 0.00 0 Dry 0.510.68 (0.315m under water) dry
Dm - - 0.00 0 Dry 0.081 dry dry
Level (AHD)SW1 - 18.07SW2 - 20.80Dm - -
Water DepthSW1 - 0.31SW2 - 0.49Dm - -
06.024 RP001 LMWS Final Revised June 09

APPENDIX DAVERAGE ANNUAL MAXIMUM GROUNDWATER LEVEL CALCULATIONS
AAMGL known WL oncalculated AAMGL
08:35:00 12/01/1995 17.917 11/10/200710:25:00 06/04/1995 17.387 18.858 MB2 19.452 19.37811:00:00 28/06/1995 18.577 MB3 18.39 18.31609:45:00 12/10/1995 18.817 18.817 MB4 17.603 17.52908:55:00 11/01/1996 18.297 MB5 17.083 17.00910:55:00 22/04/1996 18.157 MB6 19.3645 19.290507:50:00 10/07/1996 18.957 MBA 18.076 18.00207:45:00 10/10/1996 19.037 19.037 MBB 19.514 19.4407:55:00 16/01/1997 18.197 MBC 19.348 19.27409:05:00 15/04/1997 18.167 T75 18.932 18.85808:35:00 09/07/1997 18.497 DoE 8285 24.328 24.25408:55:00 08/10/1997 18.727 18.72713:25:00 13/01/1998 18.27709:10:00 24/03/1998 17.687 difference between calculated and observed08:25:00 09/07/1998 18.48708:58:00 09/10/1998 18.627 18.627 -0.07410:10:00 12/01/1999 18.14709:00:00 14/04/1999 17.82709:06:00 17/09/1999 18.957 18.95709:20:00 29/05/2000 18.05708:43:00 06/10/2000 18.877 18.87708:26:00 03/05/2001 18.18708:18:00 12/10/2001 18.927 18.92710:55:00 09/05/2002 18.40708:35:00 09/10/2002 18.857 18.85708:06:00 08/05/2003 18.11708:33:00 08/10/2003 18.987 18.98709:59:00 18/05/2004 18.39708:46:00 21/10/2004 18.767 18.767
06.024 RP001 LMWS Final Revised June 09

Levels Graph
13.000
15.000
17.000
19.000
21.000
23.000
25.000
28/05/2005 5/09/2005 14/12/2005 24/03/2006 2/07/2006 10/10/2006 18/01/2007 28/04/2007 6/08/2007 14/11/2007 22/02/2008
Date
Wat
er L
evel
(m A
HD
)
MB2MB3MB4MB5MB6MBAMBBMBCT75DoE 8285

APPENDIX D - Based on readings from 4/7/06
Bore Name ReadingAALGL known
AALGL Calculated
MW2 18.761 20.182 17.854MW3 dry 18.753MW4 15.786 17.785 14.879MW5 14.967 17.263 14.060MW6 18.4575 17.551MWA 17.044 16.137MWB 18.549 17.642MWC 18.737 17.830T75 18.364 17.457
AAMGLDecided to use T75, as it is the closer boreTherefore difference = -0.907 m
06.024 RP001 Appendix D AALGLs.xls Page 1 of 5

AAMGL for T75 (4880), 1975-2004TOC = 20.357 m AHDDate Level Max for year AAMGL Min for year AALGL12:00:00 09/04/1975 17.527 18.834 For whole record 17.45712:00:00 08/05/1975 17.587 18.900 For 1994-2004 18.041 For 1994-200400:00:00 05/06/197512:00:00 11/06/1975 18.03712:00:00 10/07/1975 18.35712:00:00 14/08/1975 18.85712:00:00 09/09/1975 18.93712:00:00 09/10/1975 18.84712:00:00 25/11/1975 18.517 18.937 17.52712:00:00 02/03/1976 17.54712:00:00 06/04/1976 17.25712:00:00 03/05/1976 17.27712:00:00 01/06/1976 17.35712:00:00 02/07/1976 17.67712:00:00 08/09/1976 18.49712:00:00 05/10/1976 18.56712:00:00 09/11/1976 18.317 18.567 17.25712:00:00 06/04/1977 16.86712:00:00 02/05/1977 16.75712:00:00 07/06/1977 16.93712:00:00 04/07/1977 17.41712:00:00 02/09/1977 18.40712:00:00 06/10/1977 18.30712:00:00 01/11/1977 18.197 18.407 16.75712:00:00 15/03/1978 16.88712:00:00 07/04/1978 16.70712:00:00 01/05/1978 16.63712:00:00 01/06/1978 17.32712:00:00 04/07/1978 18.20712:00:00 01/08/1978 18.90712:00:00 03/09/1978 18.75712:00:00 04/10/1978 19.16712:00:00 09/11/1978 18.74712:00:00 04/12/1978 18.537 19.167 16.63712:00:00 03/01/1979 18.17712:00:00 01/02/1979 17.68712:00:00 01/03/1979 17.58712:00:00 02/04/1979 17.41712:00:00 01/05/1979 17.37712:00:00 05/06/1979 17.62712:00:00 03/07/1979 18.29712:00:00 01/08/1979 18.50712:00:00 04/09/1979 18.69712:00:00 01/10/1979 18.51712:00:00 01/11/1979 18.22712:00:00 03/12/1979 17.917 18.697 17.37712:00:00 03/01/1980 17.58712:00:00 01/02/1980 17.22712:00:00 04/03/1980 17.11712:00:00 01/04/1980 16.62712:00:00 07/05/1980 17.28712:00:00 08/06/1980 18.09712:00:00 02/07/1980 18.23712:00:00 01/08/1980 18.70712:00:00 02/09/1980 18.94712:00:00 03/10/1980 18.74712:00:00 03/11/1980 18.52712:00:00 01/12/1980 18.307 18.947 16.62712:00:00 05/01/1981 18.11712:00:00 03/02/1981 17.23712:00:00 03/03/1981 16.93712:00:00 03/04/1981 16.81712:00:00 03/05/1981 16.72712:00:00 02/06/1981 17.52712:00:00 02/07/1981 18.36712:00:00 03/08/1981 18.69712:00:00 01/09/1981 18.83112:00:00 01/10/1981 18.71712:00:00 02/11/1981 18.56712:00:00 02/12/1981 18.317 18.831 16.72712:00:00 04/01/1982 17.670
For whole record
06.024 RP001 Appendix D AALGLs.xls Page 2 of 5

Date Level Max for year AAMGL Min for year AALGL12:00:00 04/02/1982 17.63012:00:00 02/03/1982 17.46012:00:00 01/04/1982 16.67012:00:00 03/05/1982 16.91012:00:00 01/06/1982 17.01012:00:00 02/07/1982 17.67012:00:00 02/08/1982 18.40012:00:00 01/09/1982 18.59012:00:00 01/10/1982 18.60012:00:00 03/11/1982 18.16012:00:00 02/12/1982 17.840 18.600 16.67012:00:00 05/01/1983 17.31012:00:00 01/02/1983 17.03012:00:00 01/03/1983 16.89012:00:00 04/04/1983 16.82012:00:00 06/04/1983 16.82012:00:00 10/04/1983 16.85712:00:00 04/05/1983 17.09012:00:00 03/06/1983 17.36012:00:00 01/07/1983 18.23012:00:00 01/08/1983 18.66012:00:00 01/09/1983 18.94012:00:00 06/10/1983 18.83012:00:00 02/11/1983 18.51012:00:00 01/12/1983 18.360 18.940 16.82012:00:00 05/01/1984 18.06012:00:00 02/02/1984 17.63012:00:00 06/03/1984 17.41012:00:00 02/04/1984 17.16012:00:00 02/05/1984 17.06012:00:00 01/06/1984 17.060 18.060 17.06012:00:00 02/07/1984 17.11012:00:00 01/08/1984 18.71012:00:00 30/09/1984 18.88012:00:00 03/10/1984 18.98012:00:00 06/11/1984 19.05012:00:00 03/12/1984 18.900 19.050 17.11012:00:00 03/01/1985 18.26012:00:00 05/03/1985 17.60012:00:00 01/04/1985 17.44012:00:00 01/05/1985 17.52012:00:00 05/06/1985 17.72012:00:00 03/07/1985 18.10012:00:00 06/08/1985 18.58012:00:00 02/09/1985 18.79012:00:00 02/10/1985 18.58012:00:00 02/10/1985 18.58012:00:00 04/11/1985 18.36012:00:00 02/12/1985 18.127 18.790 17.44010:49:00 15/01/1986 17.71710:09:00 12/02/1986 17.49710:04:00 05/03/1986 17.57716:21:00 04/04/1986 17.27711:03:00 05/05/1986 17.29710:31:00 26/05/1986 17.75709:50:00 07/07/1986 18.48710:49:00 07/08/1986 18.97713:16:00 08/09/1986 18.91710:04:00 03/10/1986 18.78712:20:00 20/11/1986 18.25712:00:00 22/12/1986 18.047 18.977 17.27709:49:00 02/02/1987 17.64709:30:00 03/03/1987 16.87710:00:00 07/04/1987 17.07709:09:00 12/05/1987 17.85710:49:00 12/06/1987 17.79709:09:00 16/07/1987 18.51709:21:00 18/08/1987 18.78709:28:00 18/09/1987 18.34715:38:00 19/10/1987 18.23715:02:00 12/11/1987 18.07714:50:00 14/12/1987 18.007 18.787 16.87714:04:00 25/02/1988 16.887
06.024 RP001 Appendix D AALGLs.xls Page 3 of 5

Date Level Max for year AAMGL Min for year AALGL15:15:00 14/03/1988 16.84711:19:00 29/04/1988 16.93715:17:00 17/05/1988 17.77713:41:00 13/06/1988 18.57713:29:00 22/07/1988 18.78715:07:00 18/08/1988 18.85714:50:00 26/10/1988 18.79714:01:00 22/11/1988 18.667 18.857 16.84708:53:00 20/01/1989 17.44714:16:00 27/04/1989 17.03709:17:00 28/07/1989 18.45709:55:00 18/10/1989 18.287 18.457 17.03709:55:00 12/01/1990 17.90710:04:00 09/04/1990 17.80709:22:00 17/07/1990 18.67709:00:00 11/10/1990 18.267 18.677 17.80715:41:00 07/01/1991 17.18711:32:00 09/04/1991 17.02712:17:00 08/07/1991 18.90709:29:00 01/10/1991 19.097 19.097 17.02711:25:00 24/01/1992 17.82711:10:00 07/04/1992 19.26710:12:00 07/07/1992 19.23709:39:00 09/10/1992 18.94710:36:00 18/01/1993 18.13709:15:00 08/04/1993 17.80709:04:00 15/07/1993 18.82709:54:00 06/10/1993 18.947 19.267 17.80708:22:00 11/01/1994 17.82711:24:00 12/04/1994 17.42709:10:00 25/07/1994 19.31708:54:00 12/10/1994 18.817 19.317 17.42708:35:00 12/01/1995 17.91710:25:00 06/04/1995 17.38711:00:00 28/06/1995 18.57709:45:00 12/10/1995 18.817 18.817 17.38708:55:00 11/01/1996 18.29710:55:00 22/04/1996 18.15707:50:00 10/07/1996 18.95707:45:00 10/10/1996 19.037 19.037 18.15707:55:00 16/01/1997 18.19709:05:00 15/04/1997 18.16708:35:00 09/07/1997 18.49708:55:00 08/10/1997 18.727 18.727 18.16713:25:00 13/01/1998 18.27709:10:00 24/03/1998 17.68708:25:00 09/07/1998 18.487
9/10/1998 18.6270043 18.627 17.68712/01/1999 18.146993314/04/1999 17.827001217/09/1999 18.957 18.957 17.827001229/05/2000 18.057 18.0576/10/2000 18.877 18.8773/05/2001 18.187 18.187
12/10/2001 18.927 18.9279/05/2002 18.407 18.4079/10/2002 18.857 18.8578/05/2003 18.117 18.1178/10/2003 18.987 18.987
18/05/2004 18.397 18.39721/10/2004 18.767 18.76711/05/2005 18.677 18.6774/07/2006 18.364
06.024 RP001 Appendix D AALGLs.xls Page 4 of 5

Bore Level Record for T75
16
16.5
17
17.5
18
18.5
19
19.5
1968 1971 1973 1976 1979 1982 1984 1987 1990 1993 1995 1998 2001 2004 2006 2009
Year
Leve
l
AALGL 17.45 m AHD
AAMGL 18.83 m AHD

WRF PROPERTY LTD –Sub-precinct 3A (1), Southern River: Local Water Management Strategy –Second Revised Version
with Addendum, July 2009
06.024 RP001 LWMS Final Revised July 09
APPENDIX E GROUNDWATER SAMPLING
RESULTS

APPENDIX EGROUNDWATER SAMPLING RESULTS
Monitoring Bores
Date 16/08/2005 23/08/2005 7/03/2006 24/05/2006 4/07/2006 10/08/2006 13/09/2006 19/10/2006 21/03/2007 11/10/2007 25/10/2007 21/11/2007Rain * 21.8 / 29 0 23/05/2006
Recorded LevelMB1 - 0.87MB2 - 3.56 4.41 4.863 4.981 5.254 5.552 4.684 dry 4.29 4.25 4.54MB3 1.14 1.24 dry dry blocked 2.394 2.024 2.054 dry 1.603 1.76 2.012MB4 1.261 1.27 3.63 3.47 3.269 3.05 1.776 2.698 4.64 1.452 1.78 2.775MB5 - 0.82 2.19 3.334 3.111 2.29 1.195 1.679 4.69 0.995 1.257 1.57MB6 2.439 2.502 2.39 1.859 2.049 3.06 1.595 1.695 1.935MBA 2.525 2.281 1.854 2.03 2.925 1.493 1.635 1.863MBB 2.45 2.175 1.775 2.081 dry 1.485 1.71 1.97MBC 2.803 2.654 2.339 2.476 dry 2.192 2.228 2.44T75 2.231 1.993 1.811 2.133 1.824 2.83 1.425 1.608 2.262T85DoE 8285 3.432 3.476 3.404 3.814 3.38 2.688 2.78 2.93 bore decomissioned
16/08/2005 23/08/2005 7/03/2006 24/05/2006 4/07/2006 10/08/2006 13/09/2006 19/10/2006 21/03/2007 11/10/2007 25/10/2007 21/11/2007MB2 20.182 19.330 18.879 18.761 18.488 18.190 19.058 19.452 19.492 19.202MB3 18.853 18.753 17.599 17.969 17.939 18.39 18.233 17.981MB4 17.794 17.785 15.427 15.585 15.786 16.005 17.279 16.357 14.415 17.603 17.275 16.28MB5 17.263 15.890 14.744 14.967 15.788 16.883 16.399 13.388 17.083 16.821 16.508MB6 18.521 18.458 18.570 19.101 18.911 17.900 19.3645 19.2645 19.0245MBA 17.044 17.288 17.715 17.539 16.644 18.076 17.934 17.706MBB 18.549 18.824 19.224 18.918 19.514 19.289 19.029MBC 18.737 18.886 19.201 19.064 19.348 19.312 19.1T75 18.126 18.364 18.546 18.224 18.533 17.527 18.932 18.749 18.095DoE 8285 23.584 23.540 23.612 23.202 23.636 24.328 24.236 24.086
* rain given as rainfall in mm that day / day previous from data taken at Perth AirportNote: meter used on 23/8 was only marked down to the cm, therefore all estimates are +/- 0.25 cm
Surface Water Sites
Date 16/08/2005 13/08/2005 24/05/2006 21/03/2007 11/10/2007 25/10/2007 21/11/2007Rain * 21.8 / 29 0 23/05/2006
Recorded LevelSW1 - 0.68 0.00 0 Dry Dry
SW2 - 0.57 0.00 0 Dry 0.510.68 (0.315m under water) dry
Dm - - 0.00 0 Dry 0.081 dry dry
Level (AHD)SW1 - 18.07SW2 - 20.80Dm - -
Water DepthSW1 - 0.31SW2 - 0.49Dm - -
06.024 RP001 Appendix E (Mar 08)
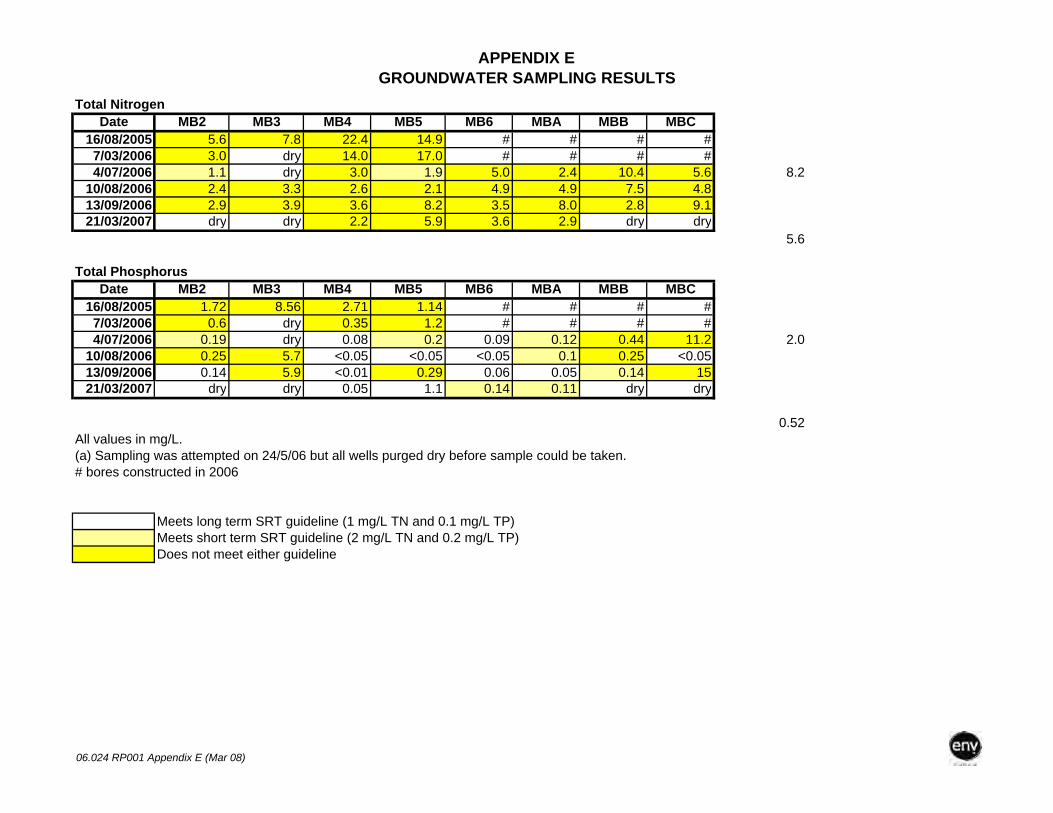
APPENDIX EGROUNDWATER SAMPLING RESULTS
Total NitrogenDate MB2 MB3 MB4 MB5 MB6 MBA MBB MBC
16/08/2005 5.6 7.8 22.4 14.9 # # # #7/03/2006 3.0 dry 14.0 17.0 # # # #4/07/2006 1.1 dry 3.0 1.9 5.0 2.4 10.4 5.6 8.2
10/08/2006 2.4 3.3 2.6 2.1 4.9 4.9 7.5 4.813/09/2006 2.9 3.9 3.6 8.2 3.5 8.0 2.8 9.121/03/2007 dry dry 2.2 5.9 3.6 2.9 dry dry
5.6
Total Phosphorus Date MB2 MB3 MB4 MB5 MB6 MBA MBB MBC
16/08/2005 1.72 8.56 2.71 1.14 # # # #7/03/2006 0.6 dry 0.35 1.2 # # # #4/07/2006 0.19 dry 0.08 0.2 0.09 0.12 0.44 11.2 2.0
10/08/2006 0.25 5.7 <0.05 <0.05 <0.05 0.1 0.25 <0.0513/09/2006 0.14 5.9 <0.01 0.29 0.06 0.05 0.14 1521/03/2007 dry dry 0.05 1.1 0.14 0.11 dry dry
0.52All values in mg/L. (a) Sampling was attempted on 24/5/06 but all wells purged dry before sample could be taken.# bores constructed in 2006
Meets long term SRT guideline (1 mg/L TN and 0.1 mg/L TP)Meets short term SRT guideline (2 mg/L TN and 0.2 mg/L TP)Does not meet either guideline
06.024 RP001 Appendix E (Mar 08)
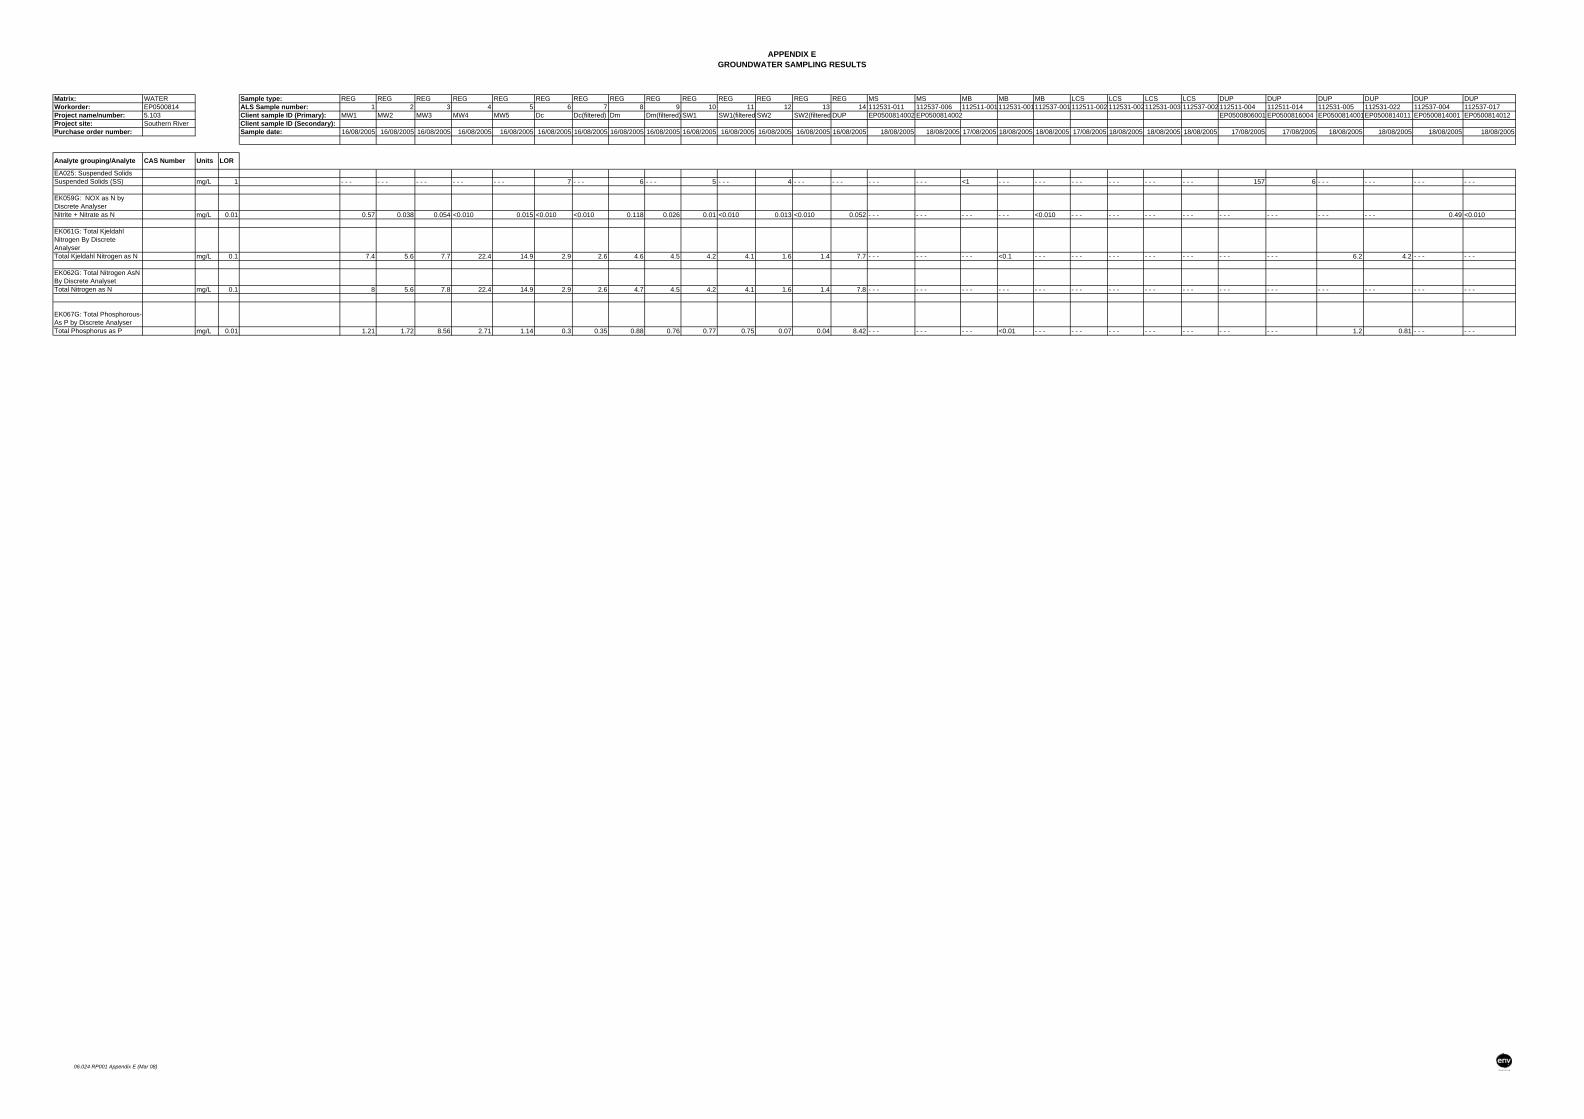
APPENDIX EGROUNDWATER SAMPLING RESULTS
Matrix: WATER Sample type: REG REG REG REG REG REG REG REG REG REG REG REG REG REG MS MS MB MB MB LCS LCS LCS LCS DUP DUP DUP DUP DUP DUPWorkorder: EP0500814 ALS Sample number: 1 2 3 4 5 6 7 8 9 10 11 12 13 14 112531-011 112537-006 112511-001112531-001112537-001112511-002 112531-002112531-003 112537-002112511-004 112511-014 112531-005 112531-022 112537-004 112537-017Project name/number: 5.103 Client sample ID (Primary): MW1 MW2 MW3 MW4 MW5 Dc Dc(filtered) Dm Dm(filtered) SW1 SW1(filtered SW2 SW2(filtered DUP EP0500814002 EP0500814002 EP0500806001 EP0500816004 EP0500814001EP0500814011 EP0500814001 EP0500814012Project site: Southern River Client sample ID (Secondary):Purchase order number: Sample date: 16/08/2005 16/08/2005 16/08/2005 16/08/2005 16/08/2005 16/08/2005 16/08/2005 16/08/2005 16/08/2005 16/08/2005 16/08/2005 16/08/2005 16/08/2005 16/08/2005 18/08/2005 18/08/2005 17/08/2005 18/08/2005 18/08/2005 17/08/2005 18/08/2005 18/08/2005 18/08/2005 17/08/2005 17/08/2005 18/08/2005 18/08/2005 18/08/2005 18/08/2005
EA025: Suspended SolidsSuspended Solids (SS) mg/L 1 - - - - - - - - - - - - - - - 7 - - - 6 - - - 5 - - - 4 - - - - - - - - - - - - <1 - - - - - - - - - - - - - - - - - - 157 6 - - - - - - - - - - - -
EK059G: NOX as N by Discrete AnalyserNitrite + Nitrate as N mg/L 0.01 0.57 0.038 0.054 <0.010 0.015 <0.010 <0.010 0.118 0.026 0.01 <0.010 0.013 <0.010 0.052 - - - - - - - - - - - - <0.010 - - - - - - - - - - - - - - - - - - - - - - - - 0.49 <0.010
EK061G: Total Kjeldahl Nitrogen By Discrete AnalyserTotal Kjeldahl Nitrogen as N mg/L 0.1 7.4 5.6 7.7 22.4 14.9 2.9 2.6 4.6 4.5 4.2 4.1 1.6 1.4 7.7 - - - - - - - - - <0.1 - - - - - - - - - - - - - - - - - - - - - 6.2 4.2 - - - - - -
EK062G: Total Nitrogen AsN By Discrete AnalysetTotal Nitrogen as N mg/L 0.1 8 5.6 7.8 22.4 14.9 2.9 2.6 4.7 4.5 4.2 4.1 1.6 1.4 7.8 - - - - - - - - - - - - - - - - - - - - - - - - - - - - - - - - - - - - - - - - - - - - -
EK067G: Total Phosphorous-As P by Discrete AnalyserTotal Phosphorus as P mg/L 0.01 1.21 1.72 8.56 2.71 1.14 0.3 0.35 0.88 0.76 0.77 0.75 0.07 0.04 8.42 - - - - - - - - - <0.01 - - - - - - - - - - - - - - - - - - - - - 1.2 0.81 - - - - - -
Analyte grouping/Analyte CAS Number Units LOR
06.024 RP001 Appendix E (Mar 08)
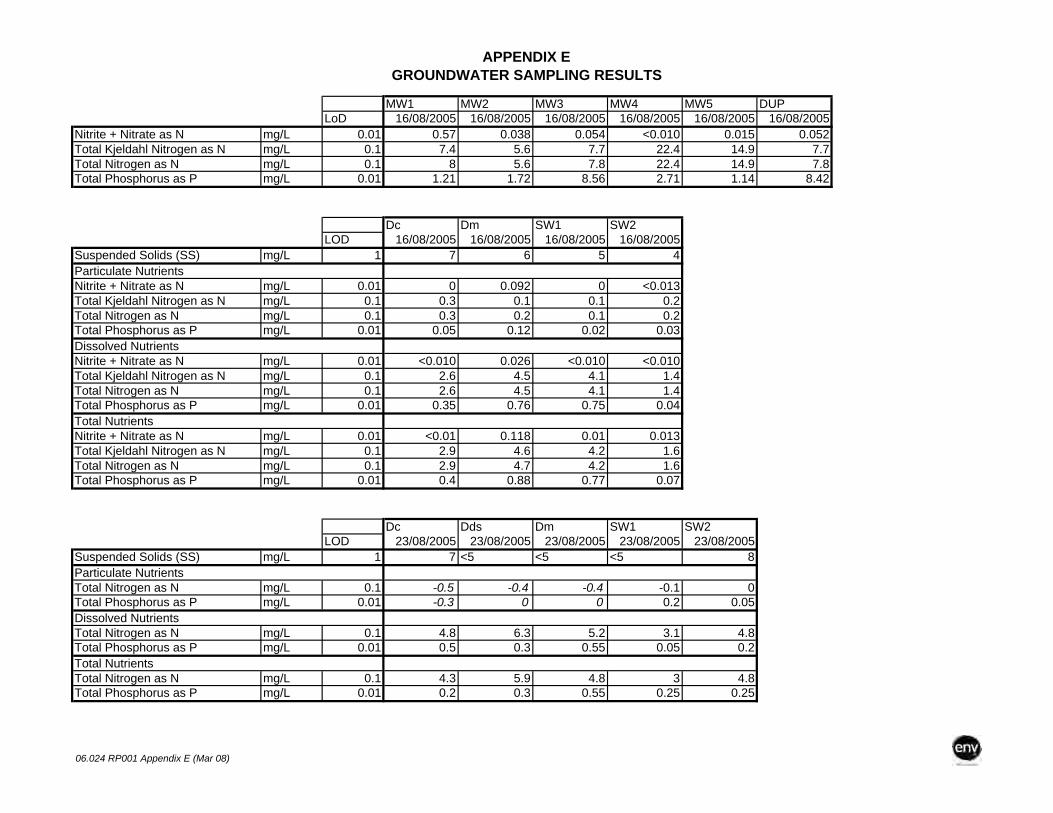
APPENDIX EGROUNDWATER SAMPLING RESULTS
MW1 MW2 MW3 MW4 MW5 DUPLoD 16/08/2005 16/08/2005 16/08/2005 16/08/2005 16/08/2005 16/08/2005
Nitrite + Nitrate as N mg/L 0.01 0.57 0.038 0.054 <0.010 0.015 0.052Total Kjeldahl Nitrogen as N mg/L 0.1 7.4 5.6 7.7 22.4 14.9 7.7Total Nitrogen as N mg/L 0.1 8 5.6 7.8 22.4 14.9 7.8Total Phosphorus as P mg/L 0.01 1.21 1.72 8.56 2.71 1.14 8.42
Dc Dm SW1 SW2LOD 16/08/2005 16/08/2005 16/08/2005 16/08/2005
Suspended Solids (SS) mg/L 1 7 6 5 4Particulate NutrientsNitrite + Nitrate as N mg/L 0.01 0 0.092 0 <0.013Total Kjeldahl Nitrogen as N mg/L 0.1 0.3 0.1 0.1 0.2Total Nitrogen as N mg/L 0.1 0.3 0.2 0.1 0.2Total Phosphorus as P mg/L 0.01 0.05 0.12 0.02 0.03Dissolved NutrientsNitrite + Nitrate as N mg/L 0.01 <0.010 0.026 <0.010 <0.010Total Kjeldahl Nitrogen as N mg/L 0.1 2.6 4.5 4.1 1.4Total Nitrogen as N mg/L 0.1 2.6 4.5 4.1 1.4Total Phosphorus as P mg/L 0.01 0.35 0.76 0.75 0.04Total NutrientsNitrite + Nitrate as N mg/L 0.01 <0.01 0.118 0.01 0.013Total Kjeldahl Nitrogen as N mg/L 0.1 2.9 4.6 4.2 1.6Total Nitrogen as N mg/L 0.1 2.9 4.7 4.2 1.6Total Phosphorus as P mg/L 0.01 0.4 0.88 0.77 0.07
Dc Dds Dm SW1 SW2LOD 23/08/2005 23/08/2005 23/08/2005 23/08/2005 23/08/2005
Suspended Solids (SS) mg/L 1 7 <5 <5 <5 8Particulate NutrientsTotal Nitrogen as N mg/L 0.1 -0.5 -0.4 -0.4 -0.1 0Total Phosphorus as P mg/L 0.01 -0.3 0 0 0.2 0.05Dissolved NutrientsTotal Nitrogen as N mg/L 0.1 4.8 6.3 5.2 3.1 4.8Total Phosphorus as P mg/L 0.01 0.5 0.3 0.55 0.05 0.2Total NutrientsTotal Nitrogen as N mg/L 0.1 4.3 5.9 4.8 3 4.8Total Phosphorus as P mg/L 0.01 0.2 0.3 0.55 0.25 0.25
06.024 RP001 Appendix E (Mar 08)
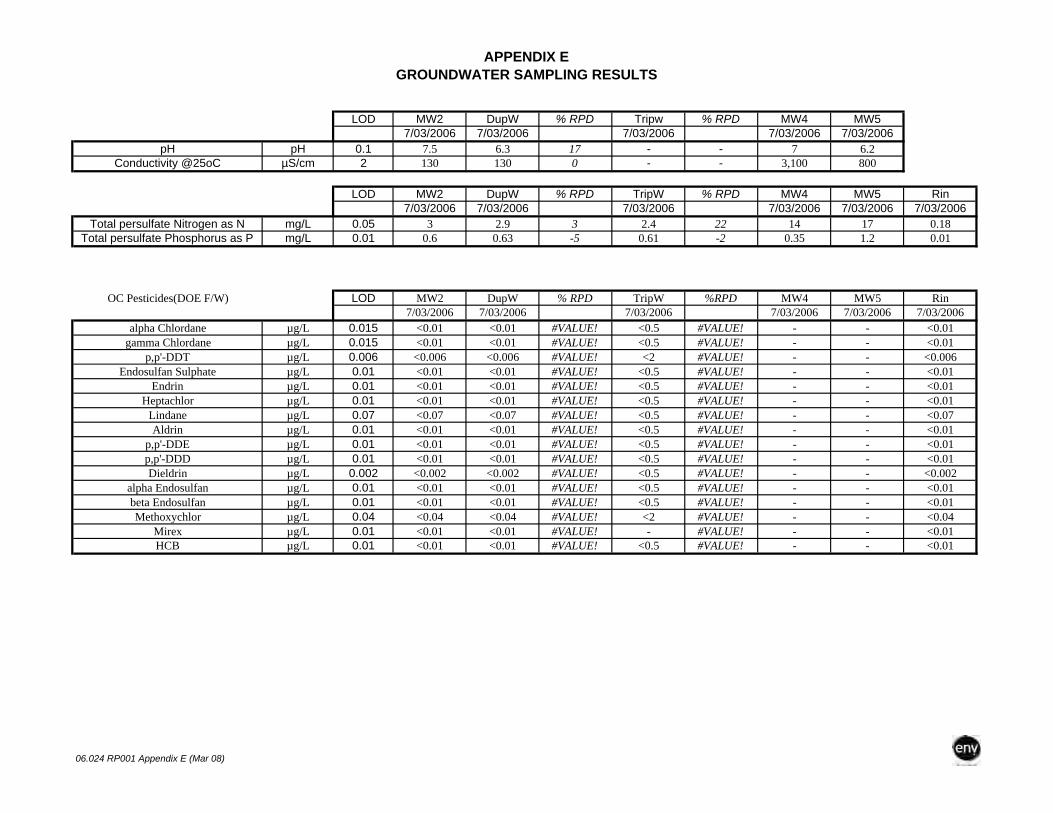
APPENDIX EGROUNDWATER SAMPLING RESULTS
LOD MW2 DupW % RPD Tripw % RPD MW4 MW57/03/2006 7/03/2006 7/03/2006 7/03/2006 7/03/2006
pH pH 0.1 7.5 6.3 17 - - 7 6.2Conductivity @25oC µS/cm 2 130 130 0 - - 3,100 800
LOD MW2 DupW % RPD TripW % RPD MW4 MW5 Rin7/03/2006 7/03/2006 7/03/2006 7/03/2006 7/03/2006 7/03/2006
Total persulfate Nitrogen as N mg/L 0.05 3 2.9 3 2.4 22 14 17 0.18Total persulfate Phosphorus as P mg/L 0.01 0.6 0.63 -5 0.61 -2 0.35 1.2 0.01
OC Pesticides(DOE F/W) LOD MW2 DupW % RPD TripW %RPD MW4 MW5 Rin7/03/2006 7/03/2006 7/03/2006 7/03/2006 7/03/2006 7/03/2006
alpha Chlordane µg/L 0.015 <0.01 <0.01 #VALUE! <0.5 #VALUE! - - <0.01gamma Chlordane µg/L 0.015 <0.01 <0.01 #VALUE! <0.5 #VALUE! - - <0.01
p,p'-DDT µg/L 0.006 <0.006 <0.006 #VALUE! <2 #VALUE! - - <0.006Endosulfan Sulphate µg/L 0.01 <0.01 <0.01 #VALUE! <0.5 #VALUE! - - <0.01
Endrin µg/L 0.01 <0.01 <0.01 #VALUE! <0.5 #VALUE! - - <0.01Heptachlor µg/L 0.01 <0.01 <0.01 #VALUE! <0.5 #VALUE! - - <0.01
Lindane µg/L 0.07 <0.07 <0.07 #VALUE! <0.5 #VALUE! - - <0.07Aldrin µg/L 0.01 <0.01 <0.01 #VALUE! <0.5 #VALUE! - - <0.01
p,p'-DDE µg/L 0.01 <0.01 <0.01 #VALUE! <0.5 #VALUE! - - <0.01p,p'-DDD µg/L 0.01 <0.01 <0.01 #VALUE! <0.5 #VALUE! - - <0.01Dieldrin µg/L 0.002 <0.002 <0.002 #VALUE! <0.5 #VALUE! - - <0.002
alpha Endosulfan µg/L 0.01 <0.01 <0.01 #VALUE! <0.5 #VALUE! - - <0.01beta Endosulfan µg/L 0.01 <0.01 <0.01 #VALUE! <0.5 #VALUE! - - <0.01Methoxychlor µg/L 0.04 <0.04 <0.04 #VALUE! <2 #VALUE! - - <0.04
Mirex µg/L 0.01 <0.01 <0.01 #VALUE! - #VALUE! - - <0.01HCB µg/L 0.01 <0.01 <0.01 #VALUE! <0.5 #VALUE! - - <0.01
06.024 RP001 Appendix E (Mar 08)

APPENDIX EGROUNDWATER SAMPLING RESULTS
Wells ran dry after bailing 3 or 4 times. This is either because there was no groundwater, too silty/sandy to allow water into the small bailer or the bore was not recharging.Waited for 10-20 mins and was bailing for a considerable amount of time with very small quantities of water purged.No samples collected
06.024 RP001 Appendix E (Mar 08)

APPENDIX EGROUNDWATER SAMPLING RESULTS
Reference Description Analyte Description Units Method PQL Sample 1 Sample 2 Sample 3 Sample 4 Sample 5 Sample 6 Sample 7 Sample 8Sample Description MWA MWB MWC MW2 MW3 MW4 MW5 MW6Date Sampled 11/08/2006 10/08/2006 10/08/2006 10/08/2006 10/08/2006 10/08/2006 10/08/2006 10/08/2006Type of Sample Water Water Water Water Water Water Water Water
97760 05.182, MIESS, CoC 1721 Ammonia Nitrogen NH3-N mg/L PEI-010 <0.1 0.9 1.1 0.94 1.2 1.1 0.4 0.2 0.997760 05.182, MIESS, CoC 1721 Nitrate-Nitrogen, NO3-N mg/L PEI-020 <0.05 1.1 0.1 0.82 0.39 <0.05 <0.05 1.1 0.1697760 05.182, MIESS, CoC 1721 Nitrite-Nitrogen, NO2-N mg/L PEI-020 <0.05 <0.05 <0.05 <0.05 <0.05 <0.05 <0.05 <0.05 <0.0597760 05.182, MIESS, CoC 1721 Kjeldahl Nitrogen mg/L PEI-012 <0.1 2.9 6.3 3 0.8 2.2 2.2 0.8 3.897760 05.182, MIESS, CoC 1721 Total Phosphorus, P mg/L PEI-014 <0.05 0.1 0.25 <0.05 0.25 5.7 <0.05 <0.05 <0.05
97760 05.182, MIESS, CoC 1721 Total Dissolved Solids (grav) @ 180oC mg/L PEI-002 <10 760 850 790 250 340 4300 300 29097760 05.182, MIESS, CoC 1721 Ortho Phosphorus, PO4-P mg/L PEI-015 <0.05 <0.05 0.1 <0.05 0.2 5.5 <0.05 <0.05 <0.05
97760 05.182, MIESS, CoC 1721 Conductivity @25oC µS/cm AN-106 <2 1300 1500 1500 400 460 7500 580 190
06.024 RP001 Appendix E (Mar 08)
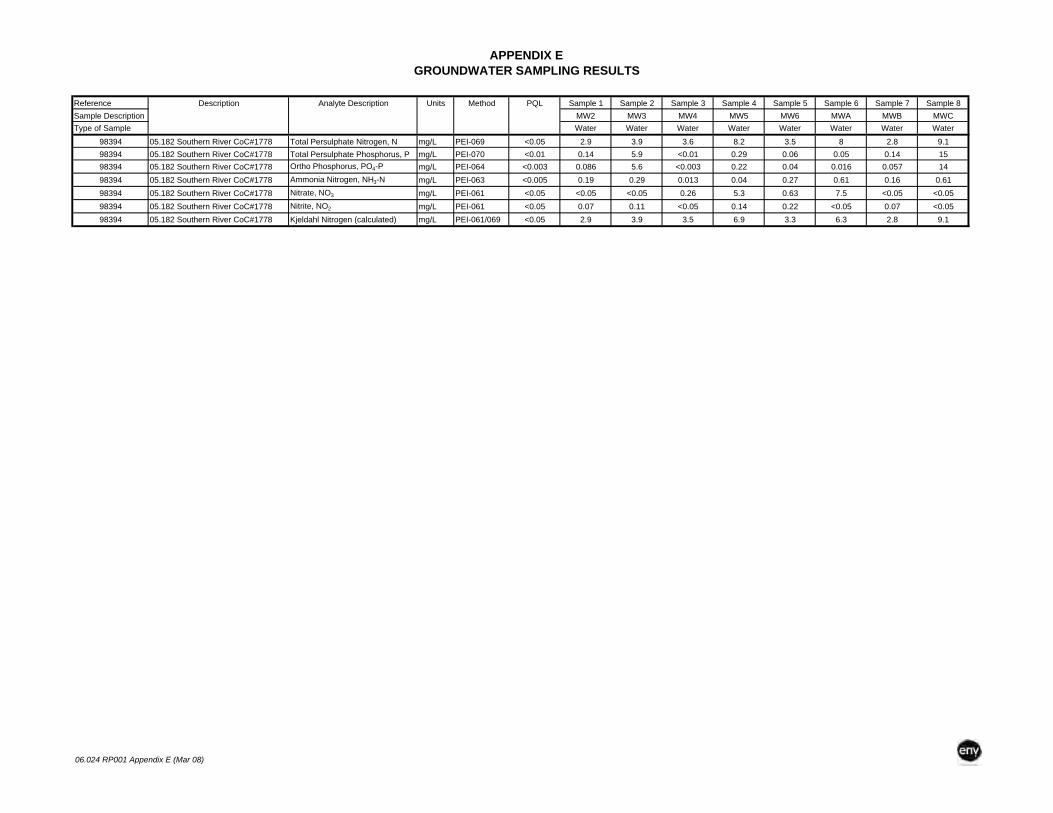
APPENDIX EGROUNDWATER SAMPLING RESULTS
Reference Description Analyte Description Units Method PQL Sample 1 Sample 2 Sample 3 Sample 4 Sample 5 Sample 6 Sample 7 Sample 8Sample Description MW2 MW3 MW4 MW5 MW6 MWA MWB MWCType of Sample Water Water Water Water Water Water Water Water
98394 05.182 Southern River CoC#1778 Total Persulphate Nitrogen, N mg/L PEI-069 <0.05 2.9 3.9 3.6 8.2 3.5 8 2.8 9.198394 05.182 Southern River CoC#1778 Total Persulphate Phosphorus, P mg/L PEI-070 <0.01 0.14 5.9 <0.01 0.29 0.06 0.05 0.14 1598394 05.182 Southern River CoC#1778 Ortho Phosphorus, PO4-P mg/L PEI-064 <0.003 0.086 5.6 <0.003 0.22 0.04 0.016 0.057 1498394 05.182 Southern River CoC#1778 Ammonia Nitrogen, NH3-N mg/L PEI-063 <0.005 0.19 0.29 0.013 0.04 0.27 0.61 0.16 0.6198394 05.182 Southern River CoC#1778 Nitrate, NO3 mg/L PEI-061 <0.05 <0.05 <0.05 0.26 5.3 0.63 7.5 <0.05 <0.0598394 05.182 Southern River CoC#1778 Nitrite, NO2 mg/L PEI-061 <0.05 0.07 0.11 <0.05 0.14 0.22 <0.05 0.07 <0.0598394 05.182 Southern River CoC#1778 Kjeldahl Nitrogen (calculated) mg/L PEI-061/069 <0.05 2.9 3.9 3.5 6.9 3.3 6.3 2.8 9.1
06.024 RP001 Appendix E (Mar 08)

APPENDIX EGROUNDWATER SAMPLING RESULTS
Reference Description Analyte Description Units Method PQL Sample 1 Sample 2 Sample 3 Sample 4Sample Description MWA MW4 MW6 MW5Date Sampled 21/03/2007 21/03/2007 21/03/2007 21/03/2007Type of Sample Water Water Water Water
11236 06.024 CoC#1958 Total Persulphate Nitrogen, N mg/L PEI-069 <0.05 2.9 2.2 3.6 5.911236 06.024 CoC#1958 Total Persulphate Phosphorus, P mg/L PEI-070 <0.01 0.11 0.05 0.14 1.111236 06.024 CoC#1958 Ortho Phosphorus, PO4-P mg/L PEI-064 <0.003 0.08 0.05 0.13 0.0111236 06.024 CoC#1958 Ammonia Nitrogen, NH3-N mg/L PEI-063 <0.005 0.56 0.24 0.79 0.211236 06.024 CoC#1958 Nitrate-Nitrogen, NO3-N mg/L PEI-061 <0.005 0.011 <0.005 <0.005 0.04811236 06.024 CoC#1958 Nitrite-Nitrogen, NO2-N mg/L PEI-061 <0.005 0.016 0.009 0.066 0.01511236 06.024 CoC#1958 Kjeldahl Nitrogen mg/L PEI-065 <0.05 2.8 2.2 3.6 5.8
06.024 RP001 Appendix E (Mar 08)

13
15
17
19
21
23
25
28/05/2005 5/09/2005 14/12/2005 24/03/2006 2/07/2006 10/10/2006 18/01/2007 28/04/2007 6/08/2007 14/11/2007 22/02/2008
Date
Wat
er L
evel
(m A
HD
)
MB2MB3MB4MB5MB6MBAMBBMBCT75DoE 8285
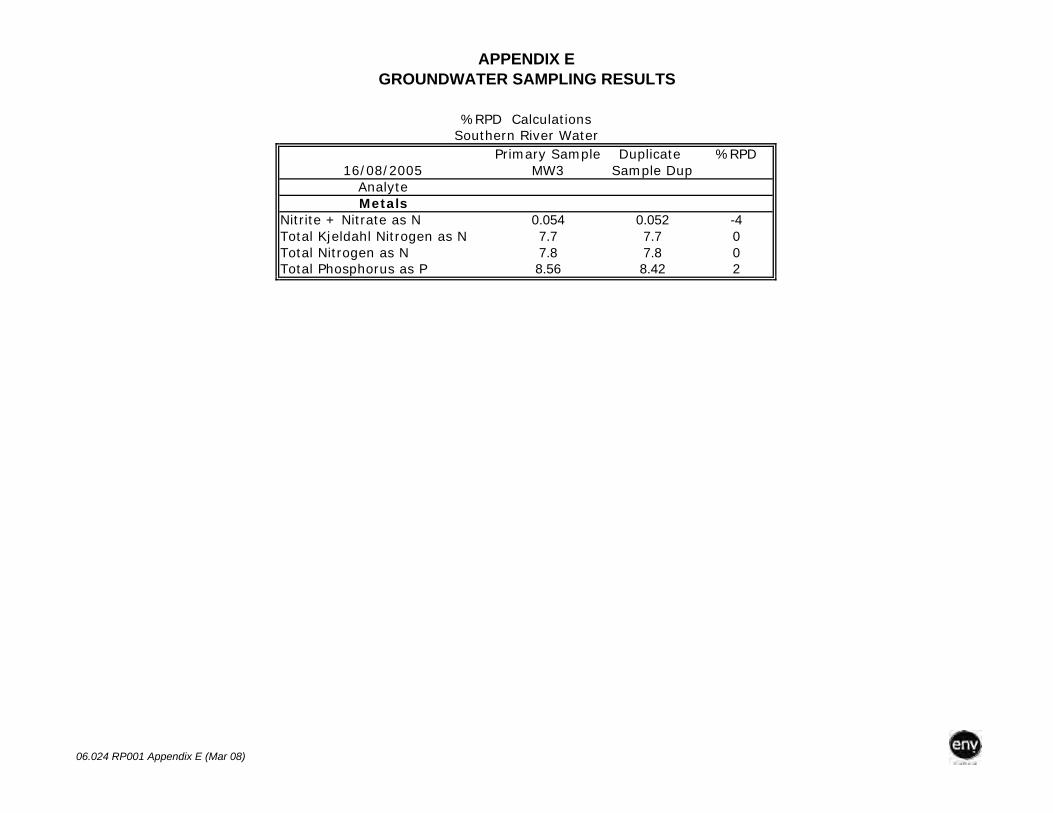
APPENDIX EGROUNDWATER SAMPLING RESULTS
Primary Sample Duplicate %RPD16/08/2005 MW3 Sample Dup
AnalyteMetals
Nitrite + Nitrate as N 0.054 0.052 -4Total Kjeldahl Nitrogen as N 7.7 7.7 0Total Nitrogen as N 7.8 7.8 0Total Phosphorus as P 8.56 8.42 2
%RPD Calculations
Southern River Water
06.024 RP001 Appendix E (Mar 08)

APPENDIX EGROUNDWATER SAMPLING RESULTS
pH, EC and Temperature
Bore Date pH EC Temp pH EC Temp pH EC Temp pH EC Temp pH EC Temp pH EC Temp pH EC Temp pH EC Temp
19/10/2006 4.53 1.13 18.1 5.8 1.33 20.4 5.64 0.99 18.4 5.51 0.21 20.6 5.39 0.65 19.2 6.22 2.13 20.6 4.58 0.57 21.6 5.42 0.18 20.122/03/2007 4.88 1.04 20.92 6.34 4.34 22.22 5.08 0.39 20.39 4.72 0.201 24
MW-3 MW-4 MW-5 MW-6MW-B MW-C MW-2MW-A
06.024 RP001 Appendix E (Mar 08)

APPENDIX EGROUNDWATER SAMPLING RESULTS
SURFACE WATERDate Received: 24/08/2005PO Number:Description: 05.103 CofC 1263-
--------Our Reference: UNITS 91069-1 91069-2 91069-3 91069-4 91069-5 91069-6 91069-7 91069-8Your Reference -- 1U 1F 2U 2F 3U 3F 4U 4FDate Sampled: -- 23/08/2005 23/08/2005 23/08/2005 23/08/2005 23/08/2005 23/08/2005 23/08/2005 23/08/2005Total Suspended Solids @103oC mg/L <5 [NA] 8 [NA] 7 [NA] <5 [NA]Electrical Conductivity @25oC µS/cm 170 [NA] 1,100 [NA] 1,600 [NA] 1,600 [NA]Total Nitrogen, N mg/L 3 3.1 4.8 4.8 4.3 4.7 5.9 6.3Total Phosphorus, P mg/L 0.25 0.2 0.55 0.5 0.2 0.2 0.3 0.3
--------Our Reference: UNITS 91069-9 91069-10 91069-11Your Reference -- 5U 5F DUPDate Sampled: -- 23/08/2005 23/08/2005 23/08/2005Total Suspended Solids @103oC mg/L <5 [NA] [NA]Electrical Conductivity @25oC µS/cm 1,100 [NA] [NA]Total Nitrogen, N mg/L 4.8 5.2 5.4Total Phosphorus, P mg/L 0.55 0.55 0.65
1=SW12=SW23=Dc5=Dm
06.024 RP001 Appendix E (Mar 08)

WRF PROPERTY LTD –Sub-precinct 3A (1), Southern River: Local Water Management Strategy –Second Revised Version
with Addendum, July 2009
06.024 RP001 LWMS Final Revised July 09
APPENDIX F RAINWATER TO TOILET FLUSHING
CALCULATIONS

APPENDIX F - Toilet Water Supply for a 210 m2 house
Assume 210 m2 roof areaAssume 3500 L tankAssume 85% of rainfall enters the tank
Jan Feb Mar Apr May Jun Jul Aug Sep Oct Nov Dec TotalRain 15 6 23 25 91 140 149 123 84 43 26 5 15 745Epan 323 280 242 152 97 64 66 80 108 168 227 290 2099Epot 0 0 0 0 0 0 0 0 0 0 0 0 0
Roof rain (kL) 3.17 1.23 4.91 5.26 19.06 29.39 31.19 25.85 17.73 9.01 5.41 1.10 3.15Rain entering tank (kL) 2.69 1.04 4.18 4.47 16.20 24.98 26.51 21.97 15.07 7.66 4.60 0.93 2.68 130.31Storage from prev month 0.00 0.00 0.00 0.70 1.71 3.50 3.50 3.50 3.50 3.50 3.50 3.50 0.96Rainfall plus prev month 2.69 1.04 4.18 5.18 17.91 28.48 30.01 25.47 18.57 11.16 8.10 4.43 3.64
Toilet water use (kL) 3.472 3.136 3.472 3.472 3.472 3.472 3.472 3.472 3.472 3.472 3.472 3.472 3.472 41.328Volume over monthly use 0.00 0.00 0.70 1.71 14.44 25.01 26.54 22.00 15.10 7.68 4.63 0.96 0.00 118.77
Monthly storage 0 0 0.70 1.71 3.50 3.50 3.50 3.50 3.50 3.50 3.50 0.96 0.00Monthly overflow 0 0 0.00 0.00 10.94 21.51 23.04 18.50 11.60 4.18 1.13 0.00 0.00 90.89Potable water required 0.78 2.09 0.00 0.00 0.00 0.00 0.00 0.00 0.00 0.00 0.00 2.54 0.79 5.41
Rainfall Used 35.91
Inflow 135.72Outflow 132.22
-3.50
Percentage of Rainwater 87 %as total toilet use
06.024 RP001 Appendix F April 08

WRF PROPERTY LTD –Sub-precinct 3A (1), Southern River: Local Water Management Strategy –Second Revised Version
with Addendum, July 2009
06.024 RP001 LWMS Final Revised July 09
APPENDIX G SITE WATER BALANCES

APPENDIX GSITE WATER BALANCES
Predevelopment
Bushland, assuming 75%of rainfall is transpired (as per Rockwater)Total flow to groundwater/streams 100378 kL/yr for site
100 ML/yr for site401510
06.024 RP001 Appendix G (Mar 08)

APPENDIX GSITE WATER BALANCES
Assumptions
Commercial development - 80% roof, 10% paved (Perth Urban Water Balance Study, WAWA 1997)4.99 ha of road reserve, of which 60% is vergeAssume verge is 40% driveway, 60% grassAverage lot size is assumed to be 404 m2.Assume average house size is 210 m2. Therefore there is 194 m2 of lawn and paving. Assume that 60% of the remainder is lawn/garden and remainder is pavingTherefore Lawn/garden area = 116 m2, paving/hardstand = 78 m2. Non-waterwise garden water use is based on 155 kL/house/yr or 424.7 L/house/day as given by E. Sahouryeh of Water CorporationReferences to GHD (2005) are to Non-potable Water Use: Guidelines for developers and their consultants (draft) (GHD, 2005 b in the references)
Irrigation of POS occurs at a rate of 60% of the evaporation rate between September and April. (DoE turf management)70% of houses have lot drainage. Lot drainage and any sub-surface drainage are assumed not to affect recharge rates.Goal of potable water use of 40-60 kL/person/yr. We assume that each house has 2.4 residents (ABS 2001 Data)Drainage areas in POS do not require irrigation.Potable and non-potable water consumption from commercial areas is assumed to be negligible.
Rain on Hard Surfaces is 4.5% Evap, 95.5% stormwater (WAWA, 1987)Rain and Irriation on Soft Surfaces has a 17.5% evap/surface loss (GHD, 2005 b)
Rainfall and Evaporation as per Perth Airport Averages 1995 - 2005Jan Feb Mar Apr May Jun Jul Aug Sep Oct Nov Dec Total
Monthly Rainfall 15 6 23 25 91 140 149 123 84 43 26 5 730Monthly Evaporation 323 280 242 152 97 64 66 80 108 168 227 290 2099Rainfall - Evaporation -308 -274 -219 -127 -6 76 83 43 -24 -125 -202 -284 -1369
Input parametersA Total Lots 802 From plannersB Residential (Ha) 32.41 From plannersC Commercial (Ha) 1 From plannersD POS (Ha) 4.85 From plannersE Drainage in POS (Ha) 2.96 From DPMF Non-Drainage POS (Ha) 1.89 F=D-EG Road Reserve (Ha) 16.74 From plannersH Total Area (Ha) 55 H=B+C+D+GI Road Reserve as road (Ha) 10.044 I=0.6*G Assumes 60% of road reserve is roadJ Road Reserve as swale (Ha) 2.2 From DPMK Road Reserve as verge (Ha) 4.496 K=G-I-JL Verge per house (m2/house) 56.06 L=10000*K/AM Verge driveway per house (m2/house) 22.42 M=0.4*L Driveway assumed to run off onto lawnsN Verge lawn per house 33.64 N=0.6*LO Commercial Irrigated Area 0.10 O=0.1*C
From Above, on a per house basis, excluding vergesO Lot Area (m2) 404P Average house size (m2) 210Q Non verge lawn/garden (m2) 116R External paving/hardstand (m2) 78
06.024 RP001 Appendix G (Mar 08)
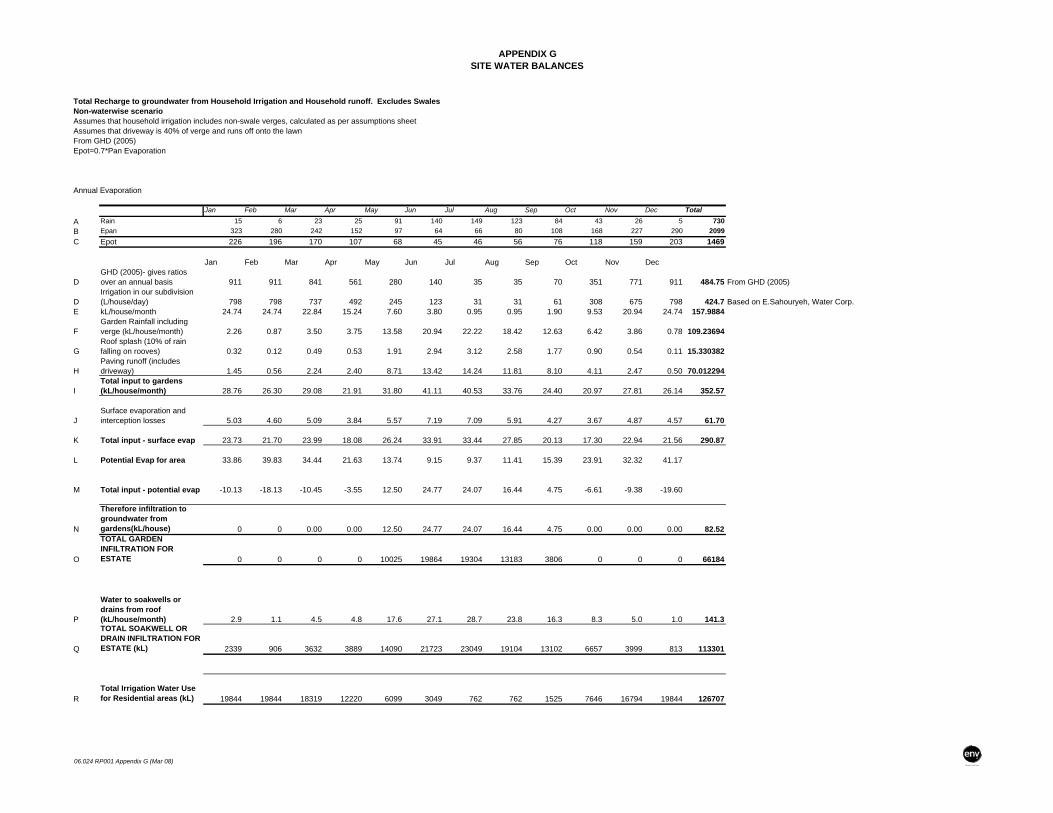
APPENDIX GSITE WATER BALANCES
Total Recharge to groundwater from Household Irrigation and Household runoff. Excludes SwalesNon-waterwise scenarioAssumes that household irrigation includes non-swale verges, calculated as per assumptions sheetAssumes that driveway is 40% of verge and runs off onto the lawnFrom GHD (2005)Epot=0.7*Pan Evaporation
Annual Evaporation
Jan Feb Mar Apr May Jun Jul Aug Sep Oct Nov Dec TotalA Rain 15 6 23 25 91 140 149 123 84 43 26 5 730B Epan 323 280 242 152 97 64 66 80 108 168 227 290 2099C Epot 226 196 170 107 68 45 46 56 76 118 159 203 1469
Jan Feb Mar Apr May Jun Jul Aug Sep Oct Nov Dec
DGHD (2005)- gives ratios over an annual basis 911 911 841 561 280 140 35 35 70 351 771 911 484.75 From GHD (2005)
DIrrigation in our subdivision (L/house/day) 798 798 737 492 245 123 31 31 61 308 675 798 424.7 Based on E.Sahouryeh, Water Corp.
E kL/house/month 24.74 24.74 22.84 15.24 7.60 3.80 0.95 0.95 1.90 9.53 20.94 24.74 157.9884
FGarden Rainfall including verge (kL/house/month) 2.26 0.87 3.50 3.75 13.58 20.94 22.22 18.42 12.63 6.42 3.86 0.78 109.23694
GRoof splash (10% of rain falling on rooves) 0.32 0.12 0.49 0.53 1.91 2.94 3.12 2.58 1.77 0.90 0.54 0.11 15.330382
HPaving runoff (includes driveway) 1.45 0.56 2.24 2.40 8.71 13.42 14.24 11.81 8.10 4.11 2.47 0.50 70.012294
ITotal input to gardens (kL/house/month) 28.76 26.30 29.08 21.91 31.80 41.11 40.53 33.76 24.40 20.97 27.81 26.14 352.57
JSurface evaporation and interception losses 5.03 4.60 5.09 3.84 5.57 7.19 7.09 5.91 4.27 3.67 4.87 4.57 61.70
K Total input - surface evap 23.73 21.70 23.99 18.08 26.24 33.91 33.44 27.85 20.13 17.30 22.94 21.56 290.87
L Potential Evap for area 33.86 39.83 34.44 21.63 13.74 9.15 9.37 11.41 15.39 23.91 32.32 41.17
M Total input - potential evap -10.13 -18.13 -10.45 -3.55 12.50 24.77 24.07 16.44 4.75 -6.61 -9.38 -19.60
N
Therefore infiltration to groundwater from gardens(kL/house) 0 0 0.00 0.00 12.50 24.77 24.07 16.44 4.75 0.00 0.00 0.00 82.52
O
TOTAL GARDEN INFILTRATION FOR ESTATE 0 0 0 0 10025 19864 19304 13183 3806 0 0 0 66184
P
Water to soakwells or drains from roof (kL/house/month) 2.9 1.1 4.5 4.8 17.6 27.1 28.7 23.8 16.3 8.3 5.0 1.0 141.3
Q
TOTAL SOAKWELL OR DRAIN INFILTRATION FOR ESTATE (kL) 2339 906 3632 3889 14090 21723 23049 19104 13102 6657 3999 813 113301
RTotal Irrigation Water Use for Residential areas (kL) 19844 19844 18319 12220 6099 3049 762 762 1525 7646 16794 19844 126707
06.024 RP001 Appendix G (Mar 08)

APPENDIX GSITE WATER BALANCES
Total Recharge to groundwater from Household Irrigation and Household runoff. Excludes SwalesWaterwise scenarioAssumes that household irrigation includes non-swale verges, calculated as per assumptions sheetAssumes that driveway is 40% of verge and runs off onto the lawnFrom GHD (2005)Epot=0.7*Pan Evaporation
Annual Evaporation
Jan Feb Mar Apr May Jun Jul Aug Sep Oct Nov Dec TotalA Rain 15 6 23 25 91 140 149 123 84 43 26 5 730B Epan 323 280 242 152 97 64 66 80 108 168 227 290 2099C Epot 226 196 170 107 68 45 46 56 76 118 159 203 1469
Jan Feb Mar Apr May Jun Jul Aug Sep Oct Nov Dec
DGHD (2005)- gives ratios over an annual basis 911 911 841 561 280 140 35 35 70 351 771 911 484.75 From GHD (2005)
DIrrigation in our subdivision (L/house/day) 798 798 737 492 245 123 31 31 61 308 675 798 425
E kL/house/month 24.74 24.74 22.84 15.24 7.60 3.80 0.95 0.95 1.90 9.53 20.94 24.74 157.9884
F
Garden Rainfall (kL/house/month) includes verge 2.26 0.87 3.50 3.75 13.58 20.94 22.22 18.42 12.63 6.42 3.86 0.78 109.2369
GRoof splash (10% of rain falling on rooves) 0.32 0.12 0.49 0.53 1.91 2.94 3.12 2.58 1.77 0.90 0.54 0.11 15.33038
HPaving runoff (includes driveway) 1.45 0.56 2.24 2.40 8.71 13.42 14.24 11.81 8.10 4.11 2.47 0.50 70.01229
ITotal input to gardens (kL/house/month) 28.76 26.30 29.08 21.91 31.80 41.11 40.53 33.76 24.40 20.97 27.81 26.14 352.57
JSurface evaporation and interception losses 5.03 4.60 5.09 3.84 5.57 7.19 7.09 5.91 4.27 3.67 4.87 4.57 61.70
K Total input - surface evap 23.73 21.70 23.99 18.08 26.24 33.91 33.44 27.85 20.13 17.30 22.94 21.56 290.87
L Potential Evap for area 33.86 39.83 34.44 21.63 13.74 9.15 9.37 11.41 15.39 23.91 32.32 41.17
M Total input - potential evap -10.13 -18.13 -10.45 -3.55 12.50 24.77 24.07 16.44 4.75 -6.61 -9.38 -19.60
N
Therefore infiltration to groundwater from gardens(kL/house) 0 0 0.00 0.00 12.50 24.77 24.07 16.44 4.75 0.00 0.00 0.00 82.52
O
TOTAL GARDEN INFILTRATION FOR ESTATE 0 0 0 0 10025 19864 19304 13183 3806 0 0 0 66184
P
Water to soakwells or drains from roof and paving (kL/house/month) 2.9 1.1 4.5 4.8 17.6 27.1 28.7 23.8 16.3 8.3 5.0 1.0 141.3
Q
TOTAL SOAKWELL OR DRAIN INFILTRATION FOR ESTATE (kL) 2339 906 3632 3889 14090 21723 23049 19104 13102 6657 3999 813 113301
RTotal Irrigation Water Use for Residential areas (kL) 19844 19844 18319 12220 6099 3049 762 762 1525 7646 16794 19844 126707
06.024 RP001 Appendix G (Mar 08)

APPENDIX GSITE WATER BALANCES
Total Recharge to groundwater from Non-Drainage POS and irrigated Commerical areasIncludes both irrigation and rainfallIrrigated commercial areas (ie green space around shopping centres) assumed to be irrigated as per non-drainage POS
From GHD (2005)Epot=0.7*Pan EvaporationAssume that 30% is shrubs, rest is irrigated lawn
Annual Evaporation
Jan Feb Mar Apr May Jun Jul Aug Sep Oct Nov Dec TotalA Rain 15 6 23 25 91 140 149 123 84 43 26 5 730B Epan 323 280 242 152 97 64 66 80 108 168 227 290 2099C Epot 226 196 170 107 68 45 46 56 76 118 159 203 1469
Turf Irrig (kL/d/ha) from GHD (2005) 52 51 34 17 0 0 0 0 0 18 28 47 247Shrub Irrig (kL/d/ha) from GHD (2005) 34 33 21 9 0 0 0 0 0 9 15 31 152Average volume per ha assuming 30% shrubs (kl/d/ha) 46.6 45.6 30.1 14.6 0 0 0 0 0 15.3 24.1 42.2 218.5
For Total Irrigated POS
EMonthly irrigation (kL/month) 2874.75 2813.06 1856.87 900.67 0.00 0.00 0.00 0.00 0.00 943.86 1486.73 2603.32 13479.265
F Rainfall (kL/month) 299.95 116.14 465.66 498.59 1806.56 2785.28 2955.33 2449.51 1679.92 853.53 512.70 104.20 7300.18I Total input (kL/ha/month) 3174.70 2929.21 2322.53 1399.26 1806.56 2785.28 2955.33 2449.51 1679.92 1797.39 1999.43 2707.52 20779.45
JSurface evaporation and interception losses 1105.59 1020.10 808.82 487.29 629.13 969.97 1029.19 853.04 585.03 625.94 696.30 942.89 3636.40
K Total input - surface evap 2069.11 1909.11 1513.71 911.97 1177.42 1815.30 1926.14 1596.47 1094.89 1171.45 1303.13 1764.63 17143.04
L Evapotransipiration for area 4502.81 3904.45 3376.13 2119.89 1346.52 896.59 918.62 1118.83 1508.24 2343.66 3168.44 4035.65 29239.83
MTotal input - evapotranspiration -2433.70 -1995.34 -1862.42 -1207.93 -169.10 918.72 1007.52 477.64 -413.35 -1172.21 -1865.32 -2271.02
N
Therefore infiltration to groundwater from non-drainage POS (kL/month) 0 0 0 0 0 918.7184 1007.517 477.6353 0 0 0 0 2403.87
06.024 RP001 Appendix G (Mar 08)
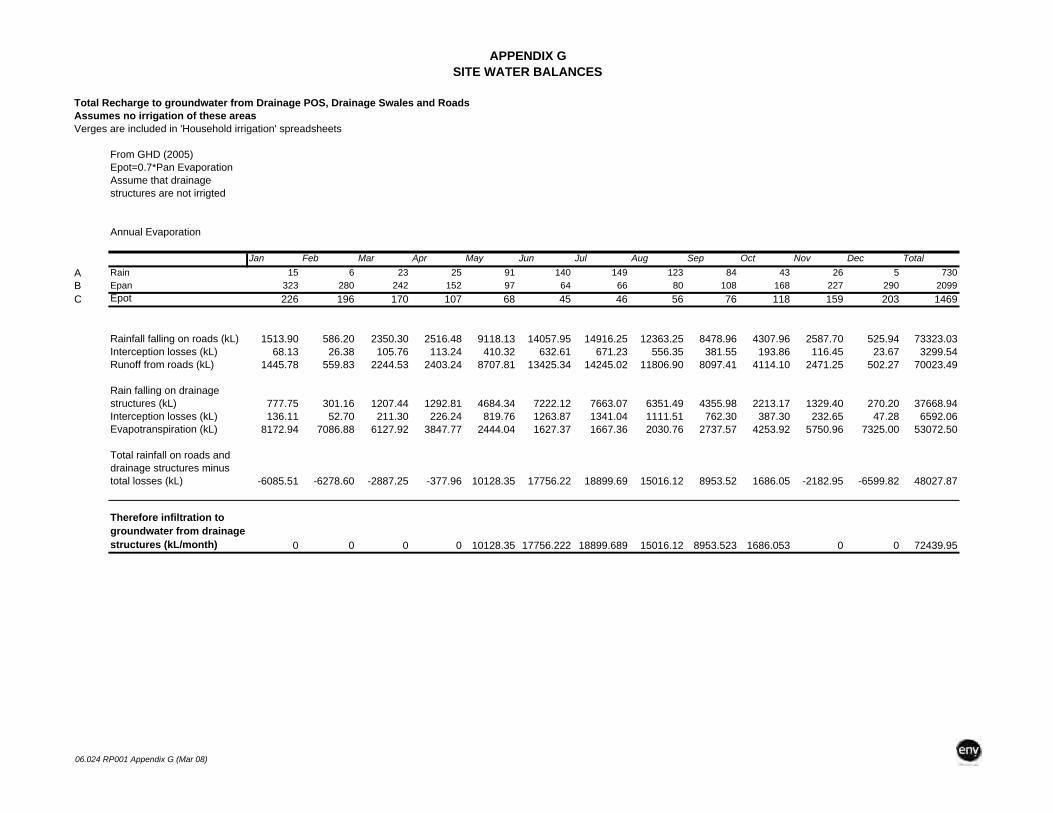
APPENDIX GSITE WATER BALANCES
Total Recharge to groundwater from Drainage POS, Drainage Swales and RoadsAssumes no irrigation of these areasVerges are included in 'Household irrigation' spreadsheets
From GHD (2005)Epot=0.7*Pan EvaporationAssume that drainage structures are not irrigted
Annual Evaporation
Jan Feb Mar Apr May Jun Jul Aug Sep Oct Nov Dec TotalA Rain 15 6 23 25 91 140 149 123 84 43 26 5 730B Epan 323 280 242 152 97 64 66 80 108 168 227 290 2099C Epot 226 196 170 107 68 45 46 56 76 118 159 203 1469
Rainfall falling on roads (kL) 1513.90 586.20 2350.30 2516.48 9118.13 14057.95 14916.25 12363.25 8478.96 4307.96 2587.70 525.94 73323.03Interception losses (kL) 68.13 26.38 105.76 113.24 410.32 632.61 671.23 556.35 381.55 193.86 116.45 23.67 3299.54Runoff from roads (kL) 1445.78 559.83 2244.53 2403.24 8707.81 13425.34 14245.02 11806.90 8097.41 4114.10 2471.25 502.27 70023.49
Rain falling on drainage structures (kL) 777.75 301.16 1207.44 1292.81 4684.34 7222.12 7663.07 6351.49 4355.98 2213.17 1329.40 270.20 37668.94Interception losses (kL) 136.11 52.70 211.30 226.24 819.76 1263.87 1341.04 1111.51 762.30 387.30 232.65 47.28 6592.06Evapotranspiration (kL) 8172.94 7086.88 6127.92 3847.77 2444.04 1627.37 1667.36 2030.76 2737.57 4253.92 5750.96 7325.00 53072.50
Total rainfall on roads and drainage structures minus total losses (kL) -6085.51 -6278.60 -2887.25 -377.96 10128.35 17756.22 18899.69 15016.12 8953.52 1686.05 -2182.95 -6599.82 48027.87
Therefore infiltration to groundwater from drainage structures (kL/month) 0 0 0 0 10128.35 17756.222 18899.689 15016.12 8953.523 1686.053 0 0 72439.95
06.024 RP001 Appendix G (Mar 08)

APPENDIX GSITE WATER BALANCES
Commercial AreasBreakdown of land use as Perth Urban Water Balance, WAWA, 1987
Jan Feb Mar Apr May Jun Jul Aug Sep Oct Nov Dec TotalMonthly Rainfall 15 6 23 25 91 140 149 123 84 43 26 5 730Monthly Evaporation 323 280 242 152 97 64 66 80 108 168 227 290 2099Rainfall - Evaporation -308 -274 -219 -127 -6 76 83 43 -24 -125 -202 -284 -1369
Commercial Area 1 HaCommercial Roof 0.8 HaCommerical Paving 0.1 HaCommercial Irrigated 0.1 Ha Note: Commerical irrigated has been added to POS irrigated for ease of calculations
Rainfall falling on roof and paving(kL) 135.65 52.53 210.60 225.49 817.04 1259.67 1336.58 1107.82 759.76 386.02 231.87 47.13 6570.16Roof Interception losses (kL) 6.10 2.36 9.48 10.15 36.77 56.69 60.15 49.85 34.19 17.37 10.43 2.12 295.66Total Runoff from commercial (kL) 129.55 50.16 201.12 215.34 780.27 1202.99 1276.44 1057.97 725.57 368.65 221.44 45.01 6274.51
06.024 RP001 Appendix G (Mar 08)

APPENDIX GSITE WATER BALANCES
From Rockwater Report, with revised ex-house useEstimated ex-house water use is 424.7 L/house/day as per Water Corppost restrictions estimation
Domestic Water UseGoal of 60 kL/person/yr = 201 kL/house/yr 161202 kL/estate/yr 550.6849315Goal of 40 kL/person/yr = 134 kL/house/yr 107468 kL/estate/yr 367.1232877
Conventional WaterwiseDaily Annual Daily Annual % conventionalL/house/day kL/house/yr L/house/day kL/house/yr
In-houseBath and shower 171 62 161 59 94Washing Machine 139 51 89 32 64Toilet 112 41 75 27 67Tap 83 30 69 25 83other 18 7 14 5 78
523 191 408 149 78
Ex-houseIrrigation 425 155 425 155 100 39867.125 39838.98
Total 948 346 833 304 88
Conventional use as per Perth Domestic Water Use StudyI'm not sure what they used to get the waterwise numbers
Estate Potable Water Use
Conventional Conventional Conventional Waterwise Waterwise WaterwiseNo bore use one third bores All bores No bore use one third bores All boreskL/estate/yr kL/estate/yr kL/estate/yr kL/estate/yr kL/estate/yr kL/estate/yr
In-houseBath and shower 50057 50057 50057 47130 47130 47130Washing Machine 40689 40689 40689 26053 26053 26053Toilet 32786 32786 32786 21654 21654 21654Tap 24297 24297 24297 20198 20198 20198other 5269 5269 5269 4098 4098 4098Total in-house 153098 153098 153098 119133 119133 119133or wastewater produced
Ex-houseIrrigation 124322 82882 0 124410 82940 0
Total Potable Water 277420 235979 153098 243543 202073 119133
Bore water use 0 41441 124322 0 41470 124410
Note: ex-house water use is not proportional to lot size for single residential units (Perth Domestic Water Use Study)
06.024 RP001 Appendix G (Mar 08)

APPENDIX GSITE WATER BALANCES
Post Development Water Balance, Assuming POS Irrigated from Bore water and 1/3 of Households Use BoresNon-waterwise scenarioAll values in ML on this sheet, as opposed to kL on other sheets
Drainage and Infiltration (ML)
Bore Water Use (ML)
Houses 179.48 41.44Non-drainage POS and commercial irrigated areas 2.40 13.48Drainage areas and roads 72.44 0.00Commerical 6.27 0.00
Total recharge to groundwater and drains 260.60 MLTotal bore water use 54.92 MLNet Recharge (Recharge minus bore water use) 205.68 ML
Total potable water use 235.98 MLTotal non-potable water use 54.92 ML
06.024 RP001 Appendix G (Mar 08)

APPENDIX GSITE WATER BALANCES
Post Development Water Balance, Assuming POS Irrigated from Bore water and All Households Use BoresNon-Waterwise scenarioAll values in ML on this sheet, as opposed to kL on other sheets
Drainage and Infiltration (ML)
Bore Water Use (ML)
Houses 179.48 124.32Non-drainage POS and commercial irrigated areas 2.40 13.48Drainage areas and roads 72.44 0.00Commerical 6.27 0.00
Total recharge to groundwater and drains 260.60 MLTotal bore water use 137.80 MLNet Recharge (Recharge minus bore water use) 122.80 ML
Total potable water use 235.98 MLTotal non-potable water use 137.80 ML
06.024 RP001 Appendix G (Mar 08)

APPENDIX GSITE WATER BALANCES
Post Development Water Balance, Assuming POS Irrigated from Bore water and 1/3 of Households Use BoresWaterwise scenarioAll values in ML on this sheet, as opposed to kL on other sheets
Drainage and Infiltration (ML)
Bore Water Use (ML)
Houses 179.48 41.47Non-drainage POS and commercial irrigated areas 2.40 13.48Drainage areas and roads 72.44 0.00Commerical 6.27 0.00
Total recharge to groundwater and drains 205.65 MLTotal bore water use 54.95 MLNet Recharge (Recharge minus bore water use) 150.70 ML
Total potable water use 235.98 MLTotal non-potable water use 54.95 ML
06.024 RP001 Appendix G (Mar 08)
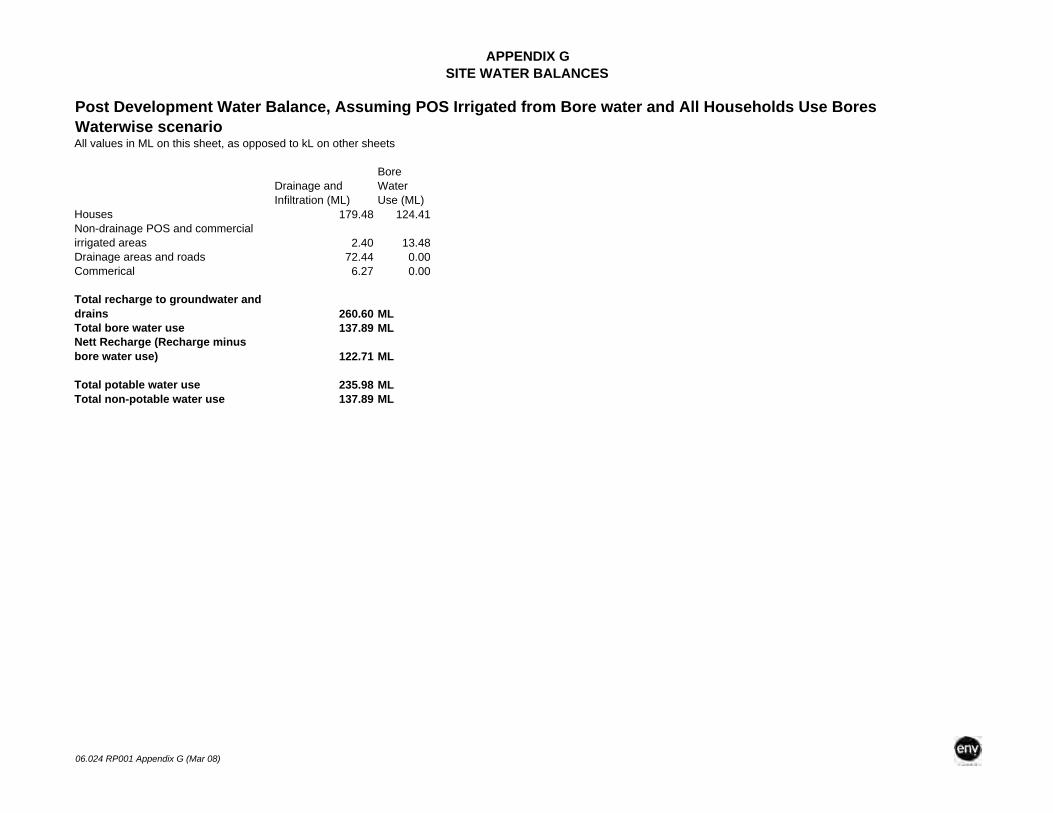
APPENDIX GSITE WATER BALANCES
Post Development Water Balance, Assuming POS Irrigated from Bore water and All Households Use BoresWaterwise scenarioAll values in ML on this sheet, as opposed to kL on other sheets
Drainage and Infiltration (ML)
Bore Water Use (ML)
Houses 179.48 124.41Non-drainage POS and commercial irrigated areas 2.40 13.48Drainage areas and roads 72.44 0.00Commerical 6.27 0.00
Total recharge to groundwater and drains 260.60 MLTotal bore water use 137.89 MLNett Recharge (Recharge minus bore water use) 122.71 ML
Total potable water use 235.98 MLTotal non-potable water use 137.89 ML
06.024 RP001 Appendix G (Mar 08)

APPENDIX GSITE WATER BALANCES
Toilet Water Supply for a 210 m2 houseActual house area used in Model
Assume 210 m2 roof areaAssume 3500 L tankAssume 85% of rainfall enters the tank
Jan Feb Mar Apr May Jun Jul Aug Sep Oct Nov Dec TotalRain 15 6 23 25 91 140 149 123 84 43 26 5 15 745Epan 323 280 242 152 97 64 66 80 108 168 227 290 2099Epot 0 0 0 0 0 0 0 0 0 0 0 0 0
Roof rain (kL) 3.17 1.23 4.91 5.26 19.06 29.39 31.19 25.85 17.73 9.01 5.41 1.10 3.15Rain entering tank (kL) 2.69 1.04 4.18 4.47 16.20 24.98 26.51 21.97 15.07 7.66 4.60 0.93 2.68 130.31Storage from prev month 0.00 0.00 0.00 0.70 1.71 3.50 3.50 3.50 3.50 3.50 3.50 3.50 0.96Rainfall plus prev month 2.69 1.04 4.18 5.18 17.91 28.48 30.01 25.47 18.57 11.16 8.10 4.43 3.64
Toilet water use (kL) 3.472 3.136 3.472 3.472 3.472 3.472 3.472 3.472 3.472 3.472 3.472 3.472 3.472 41.328Volume over monthly use 0.00 0.00 0.70 1.71 14.44 25.01 26.54 22.00 15.10 7.68 4.63 0.96 0.00 118.77
Monthly storage 0 0 0.70 1.71 3.50 3.50 3.50 3.50 3.50 3.50 3.50 0.96 0.00Monthly overflow 0 0 0.00 0.00 10.94 21.51 23.04 18.50 11.60 4.18 1.13 0.00 0.00 90.89Potable water required 0.78 2.09 0.00 0.00 0.00 0.00 0.00 0.00 0.00 0.00 0.00 2.54 0.79 5.41
Rainfall Used 35.91
Inflow 135.72Outflow 132.22
-3.50
Percentage of Rainwater 87 %as total toilet use
06.024 RP001 Appendix G (Mar 08)

APPENDIX GSITE WATER BALANCES
Post Development Water Balance, Assuming POS Irrigated from Bore water and 1/3 of Households Use BoresWaterwise scenario with Rainwater tanks piped to toiletsAll values in ML on this sheet, as opposed to kL on other sheets
Drainage and Infiltration (ML)
Bore Water Use (ML)
Rainwater use (ML)
Houses 150.68 41.47 28.8038Non-drainage POS and commercial irrigated areas 2.40 13.48 0Drainage areas and roads 72.44 0.00 0Commerical 6.27 0.00 0
Total recharge to groundwater and drains 176.85 MLTotal bore water use 54.95 MLNett Recharge (Recharge minus bore water use) 121.90 ML
Total potable water use 207.18 MLTotal non-potable water use 83.75 ML
06.024 RP001 Appendix G (Mar 08)

WRF PROPERTY LTD –Sub-precinct 3A (1), Southern River: Local Water Management Strategy –Second Revised Version
with Addendum, July 2009
06.024 RP001 LWMS Final Revised July 09
APPENDIX H DETAILS OF DRAINAGE PIPE
SIZING AND FLOW RATES
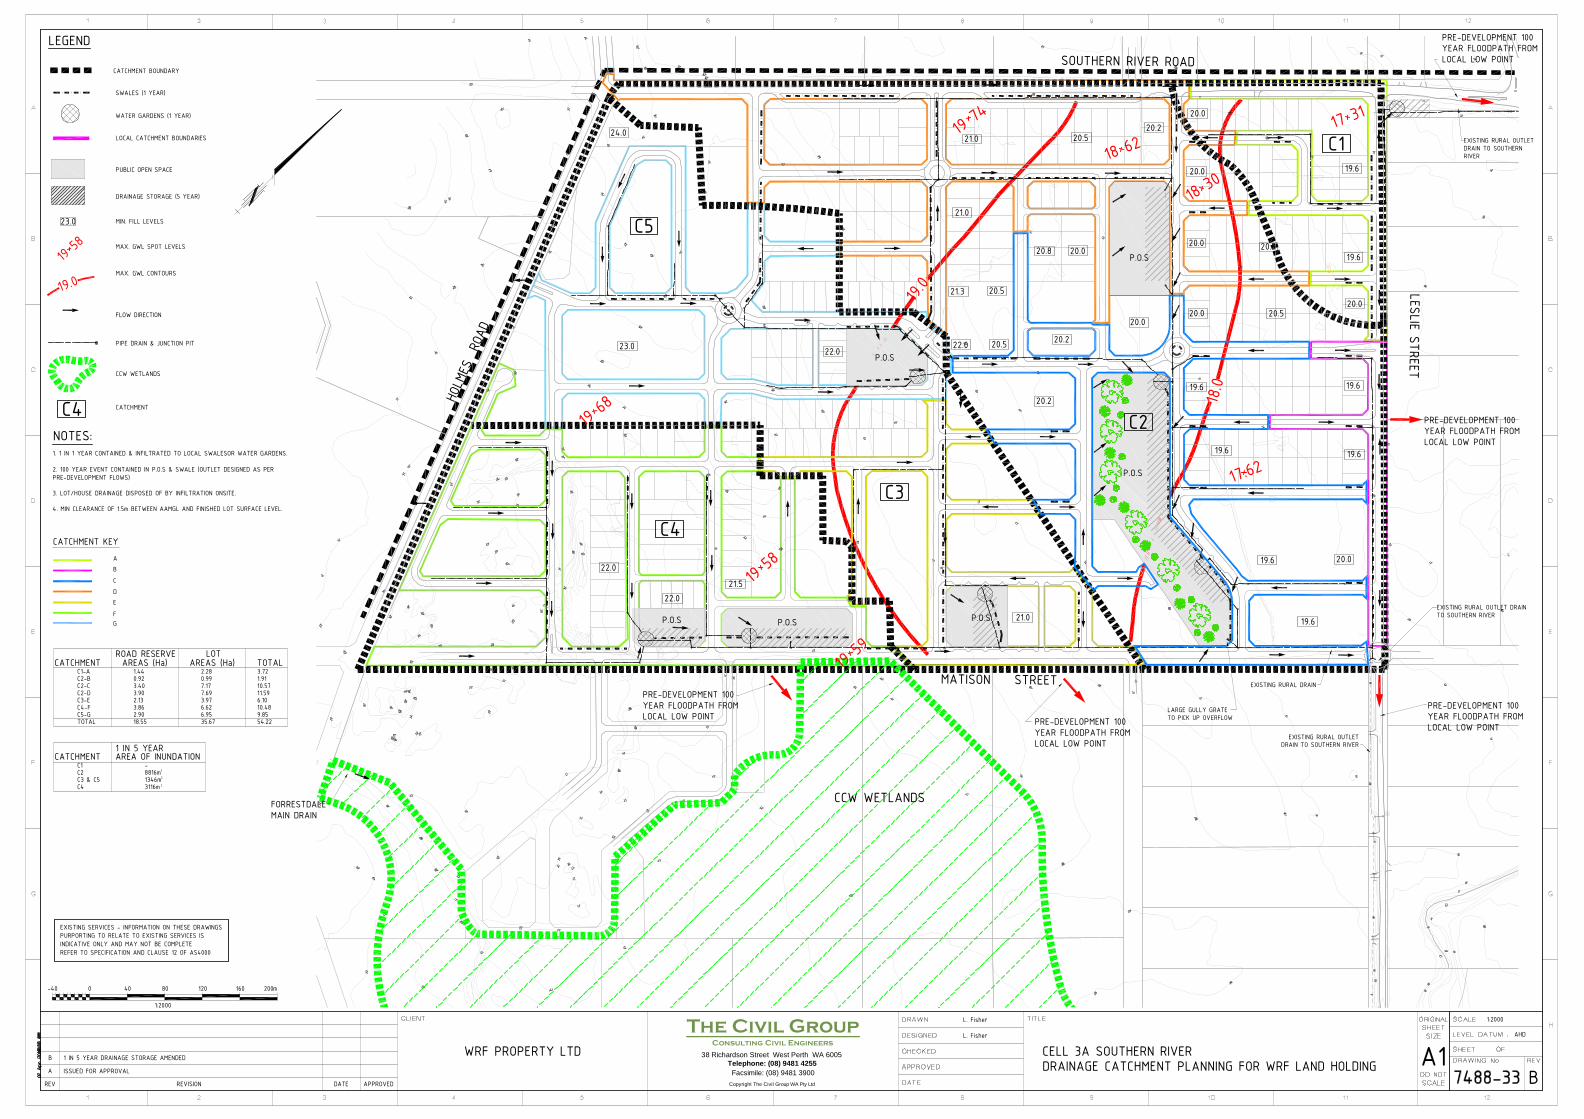
INDICATIVE ONLY AND MAY NOT BE COMPLETE PURPORTING TO RELATE TO EXISTING SERVICES ISEXISTING SERVICES - INFORMATION ON THESE DRAWINGS
REFER TO SPECIFICATION AND CLAUSE 12 OF AS4000
REVISIONREV DATE APPROVED
A1 Facsimile: (08) 9481 3900
Telephone: (08) 9481 425538 Richardson Street West Perth WA 6005
Consulting Civil Engineers
The Civil Group
Copyright The Civil Group WA Pty Ltd B
1:2000
CELL 3A SOUTHERN RIVERDRAINAGE CATCHMENT PLANNING FOR WRF LAND HOLDING
L. Fisher
L. Fisher
WRF PROPERTY LTDA ISSUED FOR APPROVAL
B 1 IN 5 YEAR DRAINAGE STORAGE AMENDED
AHD
LEGEND
CATCHMENT BOUNDARY
PUBLIC OPEN SPACE
DRAINAGE STORAGE (5 YEAR)
SWALES (1 YEAR)
1. 1 IN 1 YEAR CONTAINED & INFILTRATED TO LOCAL SWALESOR WATER GARDENS.
2. 100 YEAR EVENT CONTAINED IN P.O.S & SWALE (OUTLET DESIGNED AS PERPRE-DEVELOPMENT FLOWS)
3. LOT/HOUSE DRAINAGE DISPOSED OF BY INFILTRATION ONSITE.
4. MIN CLEARANCE OF 1.5m BETWEEN AAMGL AND FINISHED LOT SURFACE LEVEL.
23.0 MIN. FILL LEVELS
19 58 MAX. GWL SPOT LEVELS
19.0MAX. GWL CONTOURS
LESLIE STREET
HOLM
ES RO
AD
STREET
18.0
19.0
19.6
19.6
20.5
20.0
20.0
20.0
19.6
19.6 19.6
19.6
20.0
20.5
20.0
19.6 20.0
20.2
20.2
20.0
20.522.0
20.521.3
21.0
20.220.521.0
20.8 20.0
22.021.5
22.0
19 68
MATISON 19
59
19 58
19 74
18 62
18 30
17.62
17 31
SOUTHERN RIVER ROAD
LOCAL CATCHMENT BOUNDARIES
NOTES:
FLOW DIRECTION
CATCHMENT KEY
FG
DE
C
BA
19.6
EXISTING RURAL DRAIN
LARGE GULLY GRATETO PICK UP OVERFLOW
EXISTING RURAL OUTLET DRAINTO SOUTHERN RIVER
EXISTING RURAL OUTLETDRAIN TO SOUTHERNRIVER
C1
P.O.S
C2
P.O.S
C3
PRE-DEVELOPMENT 100YEAR FLOODPATH FROMLOCAL LOW POINT
P.O.S
CATCHMENT AREAS (Ha) AREAS (Ha) TOTALC1-A 1.44 2.28 3.72C2-B 0.92 0.99 1.91C2-C 3.40 7.17 10.57C2-D 3.90 7.69 11.59C3-E 2.13 3.97 6.10C4-F 3.86 6.62 10.48 C5-G 2.90 6.95 9.85TOTAL 18.55 35.67 54.22
ROAD RESERVE LOT
FORRESTDALEMAIN DRAIN
P.O.S P.O.S
C4
WATER GARDENS (1 YEAR)
C4 CATCHMENT
PIPE DRAIN & JUNCTION PIT
C5
P.O.S23.0 22.0
24.0
21.0
PRE-DEVELOPMENT 100YEAR FLOODPATH FROMLOCAL LOW POINTPRE-DEVELOPMENT 100
YEAR FLOODPATH FROMLOCAL LOW POINT
PRE-DEVELOPMENT 100YEAR FLOODPATH FROMLOCAL LOW POINT
0 m40 80 120 160 200-40
1:2000
CCW WETLANDS
CCW WETLANDS
CATCHMENT AREA OF INUNDATIONC1 -C2 8816mC3 & C5 1346mC4 3116m
1 IN 5 YEAR
2
2
2
PRE-DEVELOPMENT 100YEAR FLOODPATH FROMLOCAL LOW POINT
EXISTING RURAL OUTLETDRAIN TO SOUTHERN RIVER

C1
C4
C5
C2
LESLIE STREET
HOLM
ES RO
AD
STREET
SOUTHERN RIVER ROAD
DN400
27
26 25 2423
22 21
21
22
21
19
20
21
20
21
22
21
20 19
19
18
18
17
16
2524
23
22
21
22
22
20
24
1 : 600
20
21 20
23
22
21
21
22
2223 24
24
24
23 22
21
21 20
19
19
20 2123
23
23
21
24
18.47
18.21
19.5419.67
19.25
16.6214.50 1 : 167
14.04
1 : 71
18.30
18.14
1 : 3
001 : 4
50
19.92
1 : 3
00
20.23
19.74
19.971 : 30020
.45
19.90 1 : 300 19.35
19.12
18.97
1 : 6
00
18.94
1 : 300
1 : 60018.90 18.49
1 : 30019.94 1 : 300
1 : 10001 : 1000
REVISIONREV DATE APPROVED
A1 Facsimile: (08) 9481 3900
Telephone: (08) 9481 425538 Richardson Street West Perth WA 6005
Consulting Civil Engineers
The Civil Group
Copyright The Civil Group WA Pty Ltd A
1:2500
WAPC No
CELL 3A SOUTHERN RIVERPRELIMINARY DRAINAGE PIPE LAYOUT (CRITICAL LINES)
L. Fisher
L. Fisher
WRF PROPERTY LTDA ISSUED FOR APPROVAL
AHD
INDICATIVE ONLY AND MAY NOT BE COMPLETE PURPORTING TO RELATE TO EXISTING SERVICES ISEXISTING SERVICES - INFORMATION ON THESE DRAWINGS
REFER TO SPECIFICATION AND CLAUSE 12 OF AS4000
0 m50 100 150 200 250-50
1:2500
1. 1 IN 1 YEAR CONTAINED & INFILTRATED TO LOCAL SWALES.
2. 10 YEAR EVENT CONTAINED IN P.O.S & SWALE
3. LOT/HOUSE DRAINAGE DISPOSED OF BY INFILTRATION ONSITE.
4. MIN CLEARANCE OF 1.5m BETWEEN AAMGL AND FINISHED SURFACE LEVEL.
MATISON
C3
19.61 18.78
1 : 300
19.02 18.89
1 : 600 18.50
1 : 407 17.85
1 : 600
17.62
17.62
21.89
19.70
1 : 450
1 : 3
00
18.71
18.381 : 300
18.47
20.24
1 : 300
1 : 2
00
18.00 1 : 300 17.64
1 : 300
17.39 17.12
1 : 600
20.75
DN400
DN400
1 : 300
18.0018.00
1 : 648
17.62
18.28
1 : 3
00
1:36
NOTES:
19.071 : 600
MAX. GWL SPOT LEVELS
MAX. GWL CONTOURS
FLOW DIRECTION
CATCHMENT
PIPE DRAIN & JUNCTION PIT
LEGEND
CATCHMENT BOUNDARY
PUBLIC OPEN SPACE
DRAINAGE STORAGE (100 YEAR)
SWALES (1 YEAR)
MIN. FILL LEVELS
19 58
19.0
WATER GARDENS (1 YEAR)
C4
1 : 3
00
20.12
20.37
20.58
18.491 : 1000
1 : 10001 : 1000
18.11
18.06
18.63
18.0
19.0
19 68
19 58
19 74
18 62
18 30
17.62
17 31
19.6
19.6
20.2
20.2
20.5
19.6
23.0
P.O.S
P.O.S
P.O.SP.O.S P.O.S
P.O.S
21.0
22.0
22.021.5
22.0
24.0
20.0
20.520.2
20.0
20.0
20.0 20.5
20.020.0
20.520.0
19.6
19.6
19.6
20.0
21.0
21.0
21.3
22.0 20.5
20.8
19.6
19.6
19 59

THE CIVIL GROUPCONSULTING CIVIL ENGINEERS
WRF Property Pty LtdSouthern River Cell 3A (1)
DETAILS OF SWALES, WATER GARDENS AND POS DETENTION STORAGESall levels in AHD
Catchment C4
1 in 1 Year 1 Hour Event - Infiltration and Storage in Roadside Swales and Water Gardens for Roads
1 Road Catchment Area = 3.86Ha x C=0.8 x 15.9mm/Hr = 491m3 runoff2 Swale Length = 460m Surface Area @ one third full = 1,012m23 Swale Volume (Full to 300mm depth) = 386m3 Swale infiltration @1m/day = 42m3/hr - Total = 428m34 Excess required for Water Garden = 491m3 - 428m3 = 63m3
0.8mdeep = ~ 80m2 (diameter of 10m)5 Lots and Commercial sites to contain the 1 in 1 Year 1 Hour event on site via detention and infiltration
1 in 100 Year Event - Detention Storage with a Restricted Outflow equivalent to the Pre-Developed Flows1 Outlet Pipe 300dia at 1 in 300 grade (minimum practical outflow pipe)2 Outlet Pipe IL = 19.60m (at AAMGL)
Base of Detention storage = 20.0m100year TWL = 21.0m
3 A pipe discharges events greater then the 1 in 1 year and up to the 1 in 5 year indirectly to Southern River via drains on Matison St then Leslie St ie bypasses the Forrestdale Main Drain
4 Flood Path via a Weir (Leslie St) at RL 21.0. AHD L=70moverflows the pre-developed 100 year event flow to the CCW adjacent to the Forrestdale Main Drain
5 The POS will require some earthworks to achieve the required storages6 Drainage modelling uses an Initial Loss of 15.9mm based on storage and infiltration of the 1 in 1 year 1 hour event
for roads, lots and commercial developments. A continuing loss of 2.5mm/hr is used.
Storage - Height - Discharge Relationship
RL (m)Available Storage (m3)
Available Discharge (L/s) Notes
20.0 0 5 adopt a subsoil flow of 5L/s20.2 522 35
20.4 1128 55(outflow based on 300dia at 1 in 300 flowing full but not under head)
20.6 1819 5520.8 2596 55
21.0 5000 55Wier operates at RL 21.0m AHD - overflow of pre-developed flow
21.2 10000 19800
note actual comp basin will be constructed in two parts with two separate levels but modelled as one for simplicitystorages based on using 100% of the POS for storage of the 100 Year event
1/04/2008Y:\7488\7488 Correspondence\7488 Swale and Detention Storages.xls
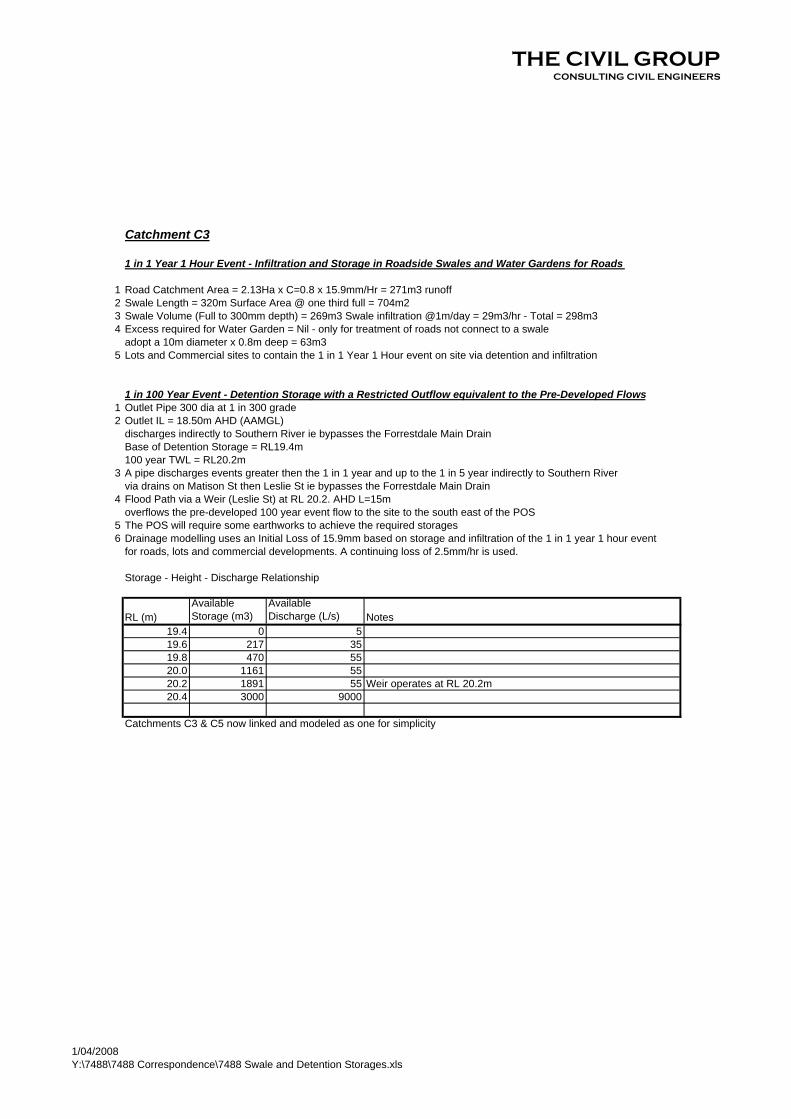
THE CIVIL GROUPCONSULTING CIVIL ENGINEERS
Catchment C3
1 in 1 Year 1 Hour Event - Infiltration and Storage in Roadside Swales and Water Gardens for Roads
1 Road Catchment Area = 2.13Ha x C=0.8 x 15.9mm/Hr = 271m3 runoff2 Swale Length = 320m Surface Area @ one third full = 704m23 Swale Volume (Full to 300mm depth) = 269m3 Swale infiltration @1m/day = 29m3/hr - Total = 298m34 Excess required for Water Garden = Nil - only for treatment of roads not connect to a swale
adopt a 10m diameter x 0.8m deep = 63m35 Lots and Commercial sites to contain the 1 in 1 Year 1 Hour event on site via detention and infiltration
1 in 100 Year Event - Detention Storage with a Restricted Outflow equivalent to the Pre-Developed Flows1 Outlet Pipe 300 dia at 1 in 300 grade2 Outlet IL = 18.50m AHD (AAMGL)
discharges indirectly to Southern River ie bypasses the Forrestdale Main DrainBase of Detention Storage = RL19.4m100 year TWL = RL20.2m
3 A pipe discharges events greater then the 1 in 1 year and up to the 1 in 5 year indirectly to Southern River via drains on Matison St then Leslie St ie bypasses the Forrestdale Main Drain
4 Flood Path via a Weir (Leslie St) at RL 20.2. AHD L=15moverflows the pre-developed 100 year event flow to the site to the south east of the POS
5 The POS will require some earthworks to achieve the required storages6 Drainage modelling uses an Initial Loss of 15.9mm based on storage and infiltration of the 1 in 1 year 1 hour event
for roads, lots and commercial developments. A continuing loss of 2.5mm/hr is used.
Storage - Height - Discharge Relationship
RL (m)Available Storage (m3)
Available Discharge (L/s) Notes
19.4 0 519.6 217 3519.8 470 5520.0 1161 5520.2 1891 55 Weir operates at RL 20.2m20.4 3000 9000
Catchments C3 & C5 now linked and modeled as one for simplicity
1/04/2008Y:\7488\7488 Correspondence\7488 Swale and Detention Storages.xls

THE CIVIL GROUPCONSULTING CIVIL ENGINEERS
Catchment C5
1 in 1 Year 1 Hour Event - Infiltration and Storage in Roadside Swales and Water Gardens for Roads
1 Road Catchment Area = 2.90Ha x C=0.8 x 15.9mm/Hr = 369m3 runoff2 Swale Length = 360m Surface Area @ one third full = 792m23 Swale Volume (Full to 300mm depth) = 302m3 Swale infiltration @1m/day = 33m3/hr - Total = 335m34 Excess required for Water Garden = 369-335 = 34m3 and for treatment of roads not connect to a swale
adopt a 10m diameter x 0.8m deep = 63m35 Lots and Commercial sites to contain the 1 in 1 Year 1 Hour event on site via detention and infiltration
1 in 100 Year Event - Detention Storage with a Restricted Outflow equivalent to the Pre-Developed Flows1 Outlet Pipe 300 dia at 1 in 300 grade2 Outlet IL = 18.90m AHD (AAMGL)
discharges to Catchment C3Base of Detention Storage = RL20.0m100 year TWL = RL21.2
3 A pipe discharges events greater then the 1 in 1 year and up to the 1 in 5 year indirectly to Southern River via drains on Matison St then Leslie St ie bypasses the Forrestdale Main Drain
4 Flood Path via a Weir (road reserve) at RL 21.2. AHD L=15moverflows the pre-developed 100 year event flow to Catchment C3
5 The POS will require some earthworks to achieve the required storages6 Drainage modelling uses an Initial Loss of 15.9mm based on storage and infiltration of the 1 in 1 year 1 hour event
for roads, lots and commercial developments. A continuing loss of 2.5mm/hr is used.
Storage - Height - Discharge Relationship
RL (m)Available Storage (m3)
Available Discharge (L/s) Notes
20.0 0 5 base of comp basin = RL20.020.2 382 3520.4 809 5520.6 1284 5520.8 1809 5521.0 3000 5521.2 5000 55 Weir operates at RL 21.2m21.4 10000 3050
8650Catchments C3 & C5 now linked and modeled as one for simplicity
1/04/2008Y:\7488\7488 Correspondence\7488 Swale and Detention Storages.xls

THE CIVIL GROUPCONSULTING CIVIL ENGINEERS
Catchment C2
1 in 1 Year 1 Hour Event - Infiltration and Storage in Roadside Swales and Water Gardens for Roads
1 Road Catchment Area = 8.22Ha x C=0.8 x 15.9mm/Hr = 1,046m3 runoff2 Swale Length = 1,600m Surface Area @ one third full = 3,520m23 Swale Volume (Full to 300mm depth) = 1,344m3 Swale infiltration @1m/day = 147m3/hr - Total = 1,491m34 Excess required for Water Garden = nil - only required for treatment of roads not connect to a swale
adopt a 2 x 10m diameter x 0.8m deep = 63m35 Lots and Commercial sites to contain the 1 in 1 Year 1 Hour event on site via detention and infiltration
1 in 100 Year Event - Detention Storage with a Restricted Outflow equivalent to the Pre-Developed Flows
1 Outlet Pipe 375dia at 1 in 300 grade2 Outlet Pipe IL = 17.85m AHD (at AAMGL) - Comp Basin outlet pipe at base RL18.0
discharges indirectly to Southern River ie bypasses the Forrestdale Main DrainBase of detention storage modelled at RL18.0 but will be min 300mm above the AAMGL100year TWL 19.10m (or greater to exceed the 100 year flood levels from Southern River)
3 A pipe discharges events greater then the 1 in 1 year and up to the 1 in 5 year indirectly to Southern River via drains on Matison St then Leslie St ie bypasses the Forrestdale Main Drain
4 Weir at RL 19.0m AHD L=20m - overflows to Leslie St and the existing drain5 The POS will require some earthworks to achieve the required storages6 Drainage modelling uses an Initial Loss of 15.9mm based on storage and infiltration of the 1 in 1 year 1 hour event
for roads, lots and commercial developments. A continuing loss of 2.5mm/hr is used.
Storage - Height - Discharge Relationship
RL (m)Available Storage (m3)
Available Discharge (L/s) Notes
18.0 0 14018.2 1459 14018.4 3196 14018.6 5209 14018.8 7499 140 Weir operates at RL18.819.0 10071 315019.2 12926 8750
note actual comp basin will be constructed in three parts with separate levels but modelled as one for simplicityBase of detention storage in actual practice will be 300mm min above the AAMGL
1/04/2008Y:\7488\7488 Correspondence\7488 Swale and Detention Storages.xls

THE CIVIL GROUPCONSULTING CIVIL ENGINEERS
Catchment C1
1 in 1 Year 1 Hour Event - Infiltration and Storage in Roadside Swales and Water Gardens for Roads
1 Road Catchment Area = 1.44Ha x C=0.8 x 15.9mm/Hr = 183m3 runoff2 Swale Length = 220m Surface Area @ one third full = 484m23 Swale Volume (Full to 300mm depth) = 184m3 Swale infiltration @1m/day = 20m3/hr - Total = 204m34 Excess required for Water Garden = nil - only required for treatment of roads not connect to a swale
adopt a 1 x 10m diameter x 0.8m deep = 63m35 Lots and Commercial sites to contain the 1 in 1 Year 1 Hour event on site via detention and infiltration
1 in 100 Year Event - Detention Storage with a Restricted Outflow equivalent to the Pre-Developed Flows
1 Outlet Pipe 300dia at 1 in 200 grade2 Outlet Pipe IL = 16.6m AHD (at AAMGL)
discharges indirectly to Southern River ie bypasses the Forrestdale Main Drain3 A pipe discharges events greater then the 1 in 1 year and up to the 1 in 5 year indirectly to Southern River
via drains on Southern River Rd ie bypasses the Forrestdale Main Drain4 Drainage modelling uses an Initial Loss of 15.9mm based on storage and infiltration of the 1 in 1 year 1 hour event
for roads, lots and commercial developments. A continuing loss of 2.5mm/hr is used.
1/04/2008Y:\7488\7488 Correspondence\7488 Swale and Detention Storages.xls

iWBNM Lite
iWBNM Lite
1 Project Details
Project ID SOUTHERN RIVER CELL 3AProject Description PRE DEVELOPMENT FLOWS FROM RURAL CATCHMENT
Project Location CATCHMENT C1
2 General Parameters 3 Rain Gauge Data
Lag Parameter (C) 1.6 Choose Rain Gauge from Database Add to Database: Name ZoneStream Lag Factor 1 2yr 50yr
Calculation Timestep 1 mins 1 hr F2 Ave RainInitial Loss 10 mm W_Perth 12 hr F50 %Rough
Continuing Loss Rate 4 mm/hr 72 hr G MAF (0.0-1.0)
4 Topology 5 Structure DataSubarea Name Connects to Area Impervious Subarea IWL Storage_Fac Type Elevation Storage
SINK ha % m m3
1 C1 SINK 3.72 0 Weir 1 2 Pipe/Box 1 2 32 Diverts to Sub Diverts to Sub3 Crest Elev [m] Invert [m]4 Length [m] No. Barrels5 Weir Coeff Ent. Type6 Disch-Factor Dia/(Width)[mm]
7 Directed to (Height)[mm]8 Delay [mins] Disch-Factor9 Directed to
10 Delay [mins]Total 3.7 0.0
6 Storm Data 7 Save & RunStorm ARI Duration [mins]
1 1 25 Shortcut: Shift + Ctrl + L2 2 253 5 25 Most Recent File: Y:\7488\7488 Correspondence\WBNM\C1 RURAL.wbn4 10 25 Location of WBNMRun.exe: C:\Documents and Settings\Peterg\My Documents\DRAINAGE\WBNM2007\WBNMrun.exe5 20 256 50 207 100 208 PMF 20
Save & Run
W_Perth
Add

8 ResultsRESULTS FOR: Y:\7488\7488 Correspondence\WBNM\C1 RURAL_Meta.out
Storm 1 2 3 4 6 7 81 Yr 25 Min 2 Yr 25 Min 5 Yr 25 Min 10 Yr 25 Min 50 Yr 20 Min 100 Yr 20 Min PMF Yr 20 Min
Peak Flowrates at Subarea Outlet [Q m3/s]C1 0.015 0.065 0.143 0.205 0.426 0.557 4.863
Inflow Peak m3/sOutflow Peak m3/s
Inflow Volume m3
Max Vol Stored m3
Max Water Elev m
1
5
0.309
20 Yr 25 MinHydrographs
-1
0
1
2
3
4
5
6
0 50 100 150 200
Time [mins]
Flow
rate
[m3 /s
]
C1(1 Yr 20Min)C1(2 Yr 20Min)C1(5 Yr 20Min)C1(10 Yr20 Min)C1(20 Yr20 Min)C1(50 Yr20 Min)C1(100 Yr20 Min)C1(PMF Yr20 Min)()
()
()
()
()
()
()

iWBNM Lite
iWBNM Lite
1 Project Details
Project ID SOUTHERN RIVER CELL 3A - Job No. 7488Project Description 100 YEAR URBAN
Project Location CATCHMENT C1
2 General Parameters 3 Rain Gauge Data
Lag Parameter (C) 1.6 Choose Rain Gauge from Database Add to Database: Name ZoneStream Lag Factor 1 2yr 50yr
Calculation Timestep 5 mins 1 hr F2 Ave RainInitial Loss 15.9 mm (swales capture) W_Perth 12 hr F50 %Rough
Continuing Loss Rate 2.5 mm/hr 72 hr G MAF (0.0-1.0)
4 Topology 5 Structure DataSubarea Name Connects to Area Impervious Subarea IWL Storage_Fac Type Elevation Storage
SINK ha % c1 17 1 OUTLET m m3
1 c1 SINK 3.72 80 Weir 1 2 Pipe/Box 1 2 3 17 02 Diverts to Sub sink Diverts to Sub SINK 17.2 2003 Crest Elev [m] 18 Invert [m] 17 17.4 3004 Length [m] 20 No. Barrels 1 17.6 3005 Weir Coeff 2 Ent. Type 1 17.8 3006 Disch-Factor 1 Dia/(Width)[mm] 300 18 3007 Directed to TOP (Height)[mm] 18.2 3008 Delay [mins] 0 Disch-Factor 1 18.4 3009 Directed to TOP 18.6
10 Delay [mins] 0Total 3.7 80.0
6 Storm Data 7 Save & RunStorm ARI Duration [mins]
1 100 10 Shortcut: Shift + Ctrl + L2 100 153 100 30 Most Recent File: Y:\7488\7488 Correspondence\WBNM\c1 100 year urban - limited storage.wbn4 100 60 Location of WBNMRun.exe: C:\Documents and Settings\Peterg\My Documents\DRAINAGE\WBNM2007\WBNMrun.exe5 100 3606 100 7207 100 14408 100 4320
Save & Run
W_Perth
Add
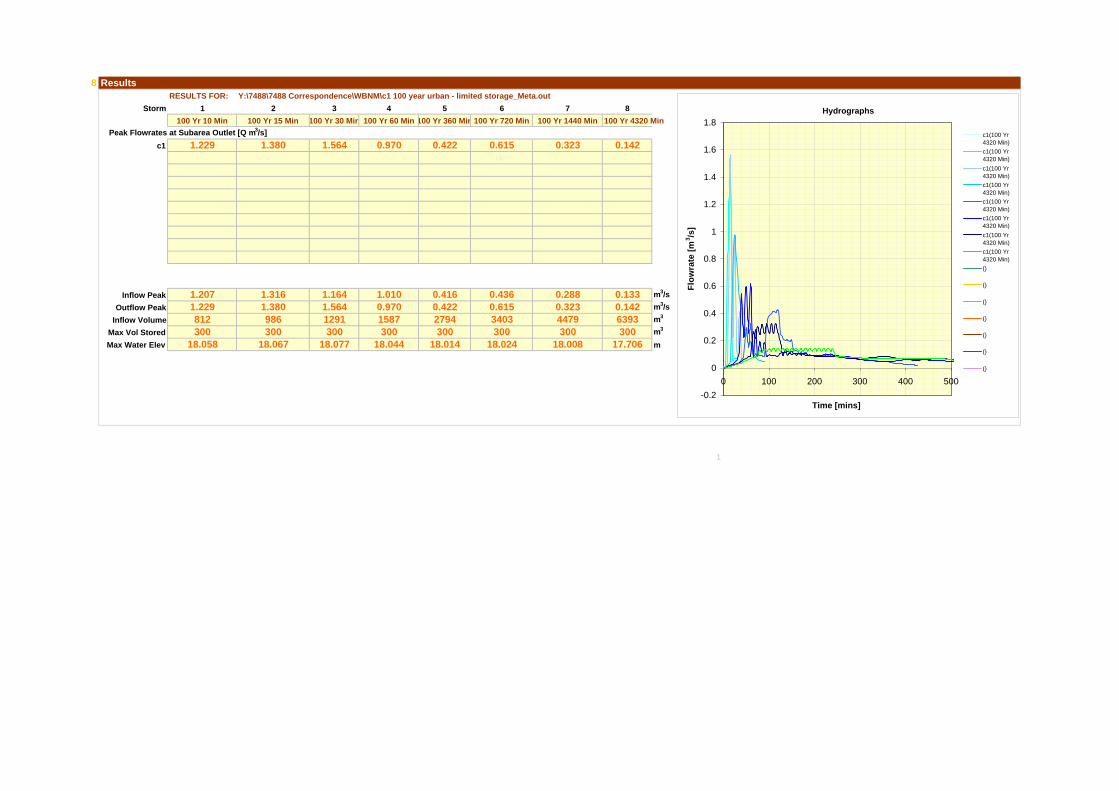
8 ResultsRESULTS FOR: Y:\7488\7488 Correspondence\WBNM\c1 100 year urban - limited storage_Meta.out
Storm 1 2 3 4 6 7 8100 Yr 10 Min 100 Yr 15 Min 100 Yr 30 Min 100 Yr 60 Min 100 Yr 720 Min 100 Yr 1440 Min 100 Yr 4320 Min
Peak Flowrates at Subarea Outlet [Q m3/s]c1 1.229 1.380 1.564 0.970 0.615 0.323 0.142
Inflow Peak 1.207 1.316 1.164 1.010 0.436 0.288 0.133 m3/sOutflow Peak 1.229 1.380 1.564 0.970 0.615 0.323 0.142 m3/s
Inflow Volume 812 986 1291 1587 3403 4479 6393 m3
Max Vol Stored 300 300 300 300 300 300 300 m3
Max Water Elev 18.058 18.067 18.077 18.044 18.024 18.008 17.706 m
1
5
0.422
100 Yr 360 Min
0.4160.4222794300
18.014
Hydrographs
-0.2
0
0.2
0.4
0.6
0.8
1
1.2
1.4
1.6
1.8
0 100 200 300 400 500
Time [mins]
Flow
rate
[m3 /s
]
c1(100 Yr4320 Min)c1(100 Yr4320 Min)c1(100 Yr4320 Min)c1(100 Yr4320 Min)c1(100 Yr4320 Min)c1(100 Yr4320 Min)c1(100 Yr4320 Min)c1(100 Yr4320 Min)()
()
()
()
()
()
()

iWBNM Lite
iWBNM Lite
1 Project Details
Project ID SOUTHERN RIVER CELL 3AProject Description PRE DEVELOPMENT FLOWS FROM RURAL CATCHMENT
Project Location CATCHMENT C2
2 General Parameters 3 Rain Gauge Data
Lag Parameter (C) 1.6 Choose Rain Gauge from Database Add to Database: Name ZoneStream Lag Factor 1 2yr 50yr
Calculation Timestep 1 mins 1 hr F2 Ave RainInitial Loss 10 mm W_Perth 12 hr F50 %Rough
Continuing Loss Rate 4 mm/hr 72 hr G MAF (0.0-1.0)
4 Topology 5 Structure DataSubarea Name Connects to Area Impervious Subarea IWL Storage_Fac Type Elevation Storage
SINK ha % m m3
1 C2 SINK 26.98 0 Weir 1 2 Pipe/Box 1 2 32 Diverts to Sub Diverts to Sub3 Crest Elev [m] Invert [m]4 Length [m] No. Barrels5 Weir Coeff Ent. Type6 Disch-Factor Dia/(Width)[mm]
7 Directed to (Height)[mm]8 Delay [mins] Disch-Factor9 Directed to
10 Delay [mins]Total 27.0 0.0
6 Storm Data 7 Save & RunStorm ARI Duration [mins]
1 1 90 Shortcut: Shift + Ctrl + L2 2 603 5 60 Most Recent File: Y:\7488\7488 Correspondence\WBNM\C2 RURAL.wbn4 10 60 Location of WBNMRun.exe: C:\Documents and Settings\Peterg\My Documents\DRAINAGE\WBNM2007\WBNMrun.exe5 20 606 50 607 100 608 PMF 60
Save & Run
W_Perth
Add

8 ResultsRESULTS FOR: Y:\7488\7488 Correspondence\WBNM\C2 RURAL_Meta.out
Storm 1 2 3 4 6 7 81 Yr 90 Min 2 Yr 60 Min 5 Yr 60 Min 10 Yr 60 Min 50 Yr 60 Min 100 Yr 60 Min PMF Yr 60 Min
Peak Flowrates at Subarea Outlet [Q m3/s]C2 0.250 0.466 0.786 1.021 1.837 2.283 25.992
Inflow Peak m3/sOutflow Peak m3/s
Inflow Volume m3
Max Vol Stored m3
Max Water Elev m
1
5
1.366
20 Yr 60 MinHydrographs
-5
0
5
10
15
20
25
30
0 50 100 150 200
Time [mins]
Flow
rate
[m3 /s
]
C2(1 Yr 60Min)C2(2 Yr 60Min)C2(5 Yr 60Min)C2(10 Yr60 Min)C2(20 Yr60 Min)C2(50 Yr60 Min)C2(100 Yr60 Min)C2(PMF Yr60 Min)()
()
()
()
()
()
()

iWBNM Lite
iWBNM Lite
1 Project Details
Project ID SOUTHERN RIVER CELL 3A - Job No. 7488Project Description 100 YEAR URBAN
Project Location CATCHMENT C2
2 General Parameters 3 Rain Gauge Data
Lag Parameter (C) 1.6 Choose Rain Gauge from Database Add to Database: Name ZoneStream Lag Factor 1 2yr 50yr
Calculation Timestep 5 mins 1 hr F2 Ave RainInitial Loss 15.9 mm (swales capture) W_Perth 12 hr F50 %Rough
Continuing Loss Rate 2.5 mm/hr 72 hr G MAF (0.0-1.0)
4 Topology 5 Structure DataSubarea Name Connects to Area Impervious Subarea IWL Storage_Fac Type Elevation Storage
SINK ha % C2 18 1 OUTLET m m3
1 C2 SINK 22.16 80 Weir 1 2 Pipe/Box 1 2 3 18 02 Diverts to Sub sink Diverts to Sub SINK 18.2 14593 Crest Elev [m] 19.2 Invert [m] 18 18.4 31964 Length [m] 20 No. Barrels 1 18.6 52095 Weir Coeff 2 Ent. Type 1 18.8 74996 Disch-Factor 1 Dia/(Width)[mm] 375 19 100717 Directed to TOP (Height)[mm] 19.2 129268 Delay [mins] 0 Disch-Factor 1 19.4 200009 Directed to TOP
10 Delay [mins] 0Total 22.2 80.0
6 Storm Data 7 Save & RunStorm ARI Duration [mins]
1 100 10 Shortcut: Shift + Ctrl + L2 100 153 100 30 Most Recent File: Y:\7488\7488 Correspondence\WBNM\C2 URBAN 100 YEAR.wbn4 100 60 Location of WBNMRun.exe: C:\Documents and Settings\Peterg\My Documents\DRAINAGE\WBNM2007\WBNMrun.exe5 100 3606 100 7207 100 14408 100 4320
Save & Run
W_Perth
Add
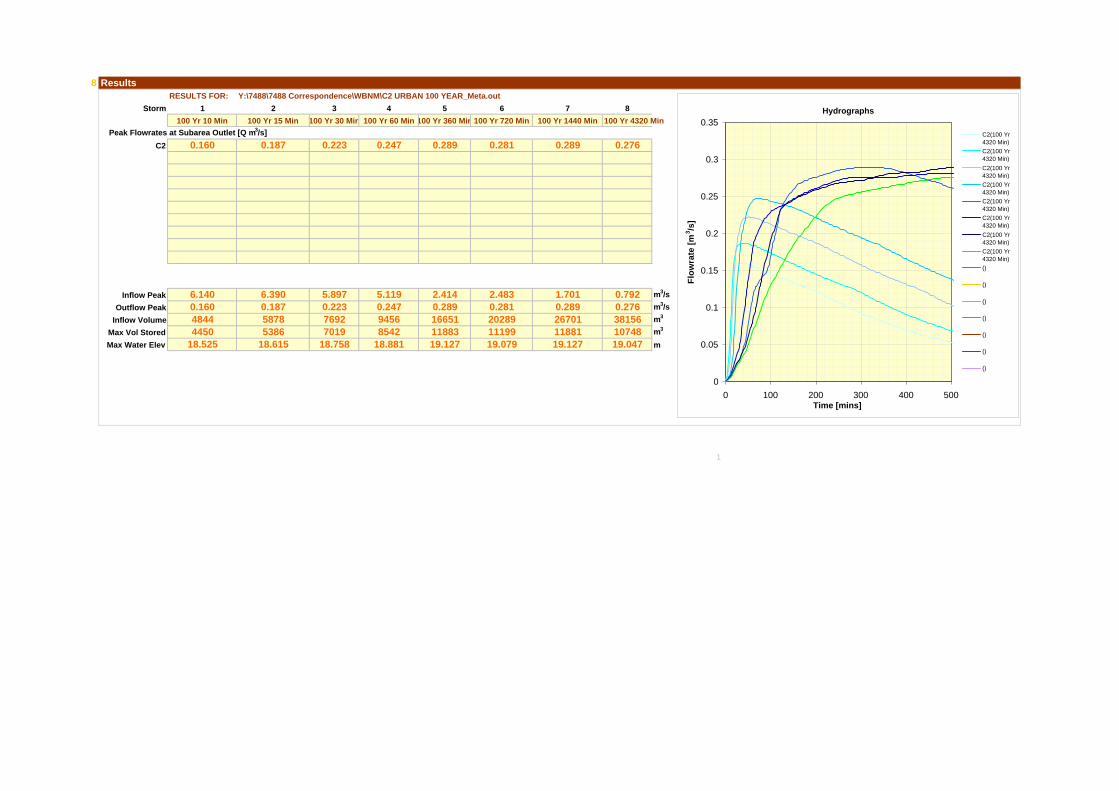
8 ResultsRESULTS FOR: Y:\7488\7488 Correspondence\WBNM\C2 URBAN 100 YEAR_Meta.out
Storm 1 2 3 4 6 7 8100 Yr 10 Min 100 Yr 15 Min 100 Yr 30 Min 100 Yr 60 Min 100 Yr 720 Min 100 Yr 1440 Min 100 Yr 4320 Min
Peak Flowrates at Subarea Outlet [Q m3/s]C2 0.160 0.187 0.223 0.247 0.281 0.289 0.276
Inflow Peak 6.140 6.390 5.897 5.119 2.483 1.701 0.792 m3/sOutflow Peak 0.160 0.187 0.223 0.247 0.281 0.289 0.276 m3/s
Inflow Volume 4844 5878 7692 9456 20289 26701 38156 m3
Max Vol Stored 4450 5386 7019 8542 11199 11881 10748 m3
Max Water Elev 18.525 18.615 18.758 18.881 19.079 19.127 19.047 m
1
5
0.289
100 Yr 360 Min
2.4140.289166511188319.127
Hydrographs
0
0.05
0.1
0.15
0.2
0.25
0.3
0.35
0 100 200 300 400 500Time [mins]
Flow
rate
[m3 /s
]
C2(100 Yr4320 Min)C2(100 Yr4320 Min)C2(100 Yr4320 Min)C2(100 Yr4320 Min)C2(100 Yr4320 Min)C2(100 Yr4320 Min)C2(100 Yr4320 Min)C2(100 Yr4320 Min)()
()
()
()
()
()
()

iWBNM Lite
iWBNM Lite
1 Project Details
Project ID SOUTHERN RIVER CELL 3AProject Description PRE DEVELOPMENT FLOWS FROM RURAL CATCHMENT
Project Location CATCHMENT C3 & C5
2 General Parameters 3 Rain Gauge Data
Lag Parameter (C) 1.6 Choose Rain Gauge from Database Add to Database: Name ZoneStream Lag Factor 1 2yr 50yr
Calculation Timestep 1 mins 1 hr F2 Ave RainInitial Loss 10 mm W_Perth 12 hr F50 %Rough
Continuing Loss Rate 4 mm/hr 72 hr G MAF (0.0-1.0)
4 Topology 5 Structure DataSubarea Name Connects to Area Impervious Subarea IWL Storage_Fac Type Elevation Storage
SINK ha % m m3
1 C3C5 SINK 16.87 0 Weir 1 2 Pipe/Box 1 2 32 Diverts to Sub Diverts to Sub3 Crest Elev [m] Invert [m]4 Length [m] No. Barrels5 Weir Coeff Ent. Type6 Disch-Factor Dia/(Width)[mm]
7 Directed to (Height)[mm]8 Delay [mins] Disch-Factor9 Directed to
10 Delay [mins]Total 16.9 0.0
6 Storm Data 7 Save & RunStorm ARI Duration [mins]
1 1 60 Shortcut: Shift + Ctrl + L2 2 603 5 60 Most Recent File: Y:\7488\7488 Correspondence\WBNM\C3C5 RURAL.wbn4 10 60 Location of WBNMRun.exe: C:\Documents and Settings\Peterg\My Documents\DRAINAGE\WBNM2007\WBNMrun.exe5 20 606 50 607 100 608 PMF 60
Save & Run
W_Perth
Add
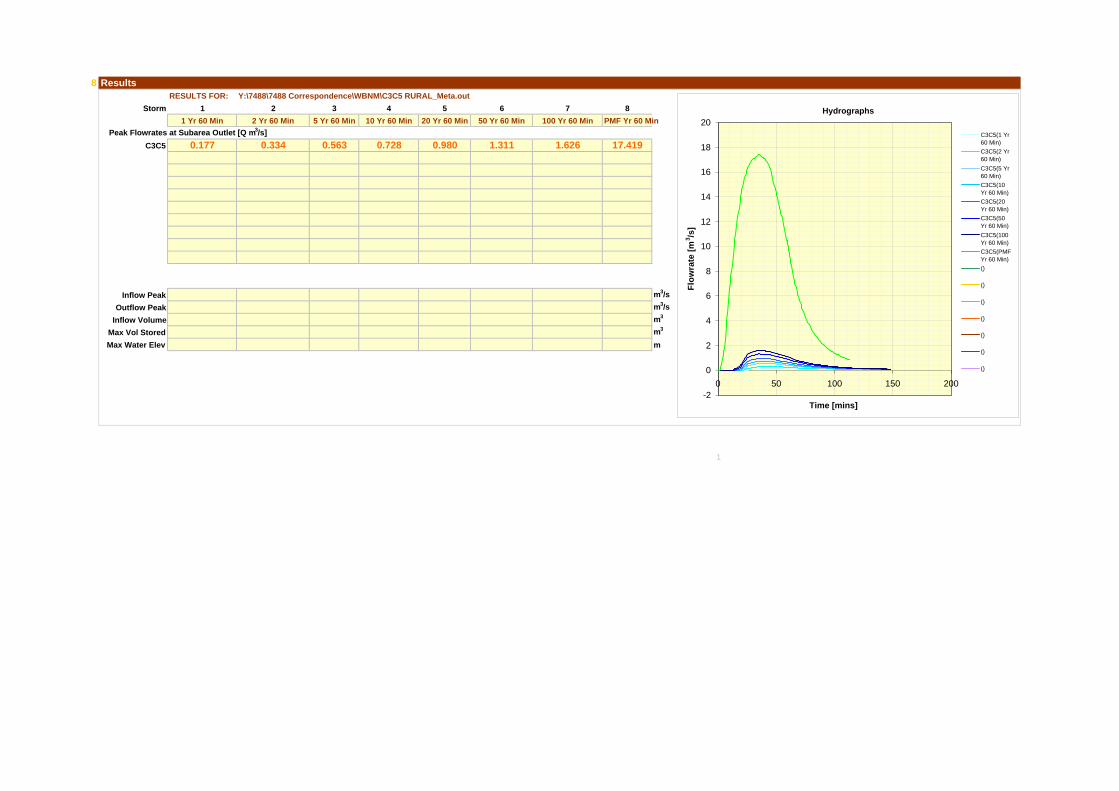
8 ResultsRESULTS FOR: Y:\7488\7488 Correspondence\WBNM\C3C5 RURAL_Meta.out
Storm 1 2 3 4 6 7 81 Yr 60 Min 2 Yr 60 Min 5 Yr 60 Min 10 Yr 60 Min 50 Yr 60 Min 100 Yr 60 Min PMF Yr 60 Min
Peak Flowrates at Subarea Outlet [Q m3/s]C3C5 0.177 0.334 0.563 0.728 1.311 1.626 17.419
Inflow Peak m3/sOutflow Peak m3/s
Inflow Volume m3
Max Vol Stored m3
Max Water Elev m
1
5
0.980
20 Yr 60 MinHydrographs
-2
0
2
4
6
8
10
12
14
16
18
20
0 50 100 150 200
Time [mins]
Flow
rate
[m3 /s
]
C3C5(1 Yr60 Min)C3C5(2 Yr60 Min)C3C5(5 Yr60 Min)C3C5(10Yr 60 Min)C3C5(20Yr 60 Min)C3C5(50Yr 60 Min)C3C5(100Yr 60 Min)C3C5(PMFYr 60 Min)()
()
()
()
()
()
()
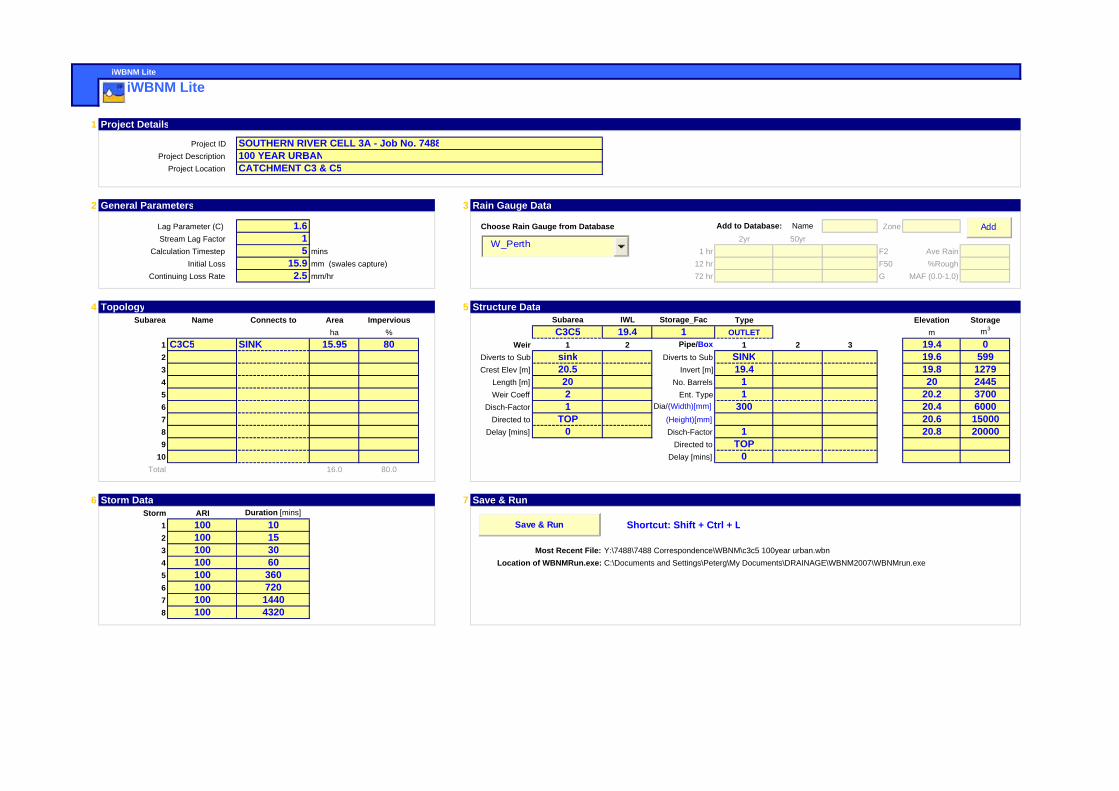
iWBNM Lite
iWBNM Lite
1 Project Details
Project ID SOUTHERN RIVER CELL 3A - Job No. 7488Project Description 100 YEAR URBAN
Project Location CATCHMENT C3 & C5
2 General Parameters 3 Rain Gauge Data
Lag Parameter (C) 1.6 Choose Rain Gauge from Database Add to Database: Name ZoneStream Lag Factor 1 2yr 50yr
Calculation Timestep 5 mins 1 hr F2 Ave RainInitial Loss 15.9 mm (swales capture) W_Perth 12 hr F50 %Rough
Continuing Loss Rate 2.5 mm/hr 72 hr G MAF (0.0-1.0)
4 Topology 5 Structure DataSubarea Name Connects to Area Impervious Subarea IWL Storage_Fac Type Elevation Storage
SINK ha % C3C5 19.4 1 OUTLET m m3
1 C3C5 SINK 15.95 80 Weir 1 2 Pipe/Box 1 2 3 19.4 02 Diverts to Sub sink Diverts to Sub SINK 19.6 5993 Crest Elev [m] 20.5 Invert [m] 19.4 19.8 12794 Length [m] 20 No. Barrels 1 20 24455 Weir Coeff 2 Ent. Type 1 20.2 37006 Disch-Factor 1 Dia/(Width)[mm] 300 20.4 60007 Directed to TOP (Height)[mm] 20.6 150008 Delay [mins] 0 Disch-Factor 1 20.8 200009 Directed to TOP
10 Delay [mins] 0Total 16.0 80.0
6 Storm Data 7 Save & RunStorm ARI Duration [mins]
1 100 10 Shortcut: Shift + Ctrl + L2 100 153 100 30 Most Recent File: Y:\7488\7488 Correspondence\WBNM\c3c5 100year urban.wbn4 100 60 Location of WBNMRun.exe: C:\Documents and Settings\Peterg\My Documents\DRAINAGE\WBNM2007\WBNMrun.exe5 100 3606 100 7207 100 14408 100 4320
Save & Run
W_Perth
Add

8 ResultsRESULTS FOR: Y:\7488\7488 Correspondence\WBNM\c3c5 100year urban_Meta.out
Storm 1 2 3 4 6 7 8100 Yr 10 Min 100 Yr 15 Min 100 Yr 30 Min 100 Yr 60 Min 100 Yr 720 Min 100 Yr 1440 Min 100 Yr 4320 Min
Peak Flowrates at Subarea Outlet [Q m3/s]C3C5 0.143 0.155 0.167 0.177 0.182 0.184 0.181
Inflow Peak 4.578 4.799 4.390 3.801 1.806 1.227 0.570 m3/sOutflow Peak 0.143 0.155 0.167 0.177 0.182 0.184 0.181 m3/s
Inflow Volume 3486 4231 5536 6806 14602 19218 27463 m3
Max Vol Stored 3168 3849 5031 6127 8260 8884 7731 m3
Max Water Elev 20.115 20.213 20.316 20.403 20.45 20.464 20.438 m
1
5
0.183
100 Yr 360 Min
1.7510.183119848617
20.458
Hydrographs
0
0.02
0.04
0.06
0.08
0.1
0.12
0.14
0.16
0.18
0.2
0 100 200 300 400 500Time [mins]
Flow
rate
[m3 /s
]
C3C5(100Yr 4320Min)C3C5(100Yr 4320Min)C3C5(100Yr 4320Min)C3C5(100Yr 4320Min)C3C5(100Yr 4320Min)C3C5(100Yr 4320Min)C3C5(100Yr 4320Min)C3C5(100Yr 4320Min)()
()
()
()

iWBNM Lite
iWBNM Lite
1 Project Details
Project ID SOUTHERN RIVER CELL 3AProject Description PRE DEVELOPMENT FLOWS FROM RURAL CATCHMENT
Project Location CATCHMENT C4
2 General Parameters 3 Rain Gauge Data
Lag Parameter (C) 1.6 Choose Rain Gauge from Database Add to Database: Name ZoneStream Lag Factor 1 2yr 50yr
Calculation Timestep 1 mins 1 hr F2 Ave RainInitial Loss 10 mm W_Perth 12 hr F50 %Rough
Continuing Loss Rate 4 mm/hr 72 hr G MAF (0.0-1.0)
4 Topology 5 Structure DataSubarea Name Connects to Area Impervious Subarea IWL Storage_Fac Type Elevation Storage
SINK ha % m m3
1 C4 SINK 11.31 0 Weir 1 2 Pipe/Box 1 2 32 Diverts to Sub Diverts to Sub3 Crest Elev [m] Invert [m]4 Length [m] No. Barrels5 Weir Coeff Ent. Type6 Disch-Factor Dia/(Width)[mm]
7 Directed to (Height)[mm]8 Delay [mins] Disch-Factor9 Directed to
10 Delay [mins]Total 11.3 0.0
6 Storm Data 7 Save & RunStorm ARI Duration [mins]
1 1 60 Shortcut: Shift + Ctrl + L2 2 603 5 60 Most Recent File: Y:\7488\7488 Correspondence\WBNM\C4.wbn4 10 60 Location of WBNMRun.exe: C:\Documents and Settings\Peterg\My Documents\DRAINAGE\WBNM2007\WBNMrun.exe5 20 606 50 607 100 608 PMF 60
Save & Run
W_Perth
Add

8 ResultsRESULTS FOR: Y:\7488\7488 Correspondence\WBNM\C4_Meta.out
Storm 1 2 3 4 6 7 81 Yr 60 Min 2 Yr 60 Min 5 Yr 60 Min 10 Yr 60 Min 50 Yr 60 Min 100 Yr 60 Min PMF Yr 60 Min
Peak Flowrates at Subarea Outlet [Q m3/s]C4 0.134 0.249 0.420 0.549 0.977 1.203 12.200
Inflow Peak m3/sOutflow Peak m3/s
Inflow Volume m3
Max Vol Stored m3
Max Water Elev m
1
5
0.735
20 Yr 60 MinHydrographs
-2
0
2
4
6
8
10
12
14
0 50 100 150 200
Time [mins]
Flow
rate
[m3 /s
]
C4(1 Yr 60Min)C4(2 Yr 60Min)C4(5 Yr 60Min)C4(10 Yr60 Min)C4(20 Yr60 Min)C4(50 Yr60 Min)C4(100 Yr60 Min)C4(PMF Yr60 Min)()
()
()
()
()
()
()

iWBNM Lite
iWBNM Lite
1 Project Details
Project ID SOUTHERN RIVER CELL 3A - Job No. 7488Project Description 100 YEAR URBAN
Project Location CATCHMENT C4
2 General Parameters 3 Rain Gauge Data
Lag Parameter (C) 1.6 Choose Rain Gauge from Database Add to Database: Name ZoneStream Lag Factor 1 2yr 50yr
Calculation Timestep 5 mins 1 hr F2 Ave RainInitial Loss 15.9 mm (swales capture) W_Perth 12 hr F50 %Rough
Continuing Loss Rate 2.5 mm/hr 72 hr G MAF (0.0-1.0)
4 Topology 5 Structure DataSubarea Name Connects to Area Impervious Subarea IWL Storage_Fac Type Elevation Storage
SINK ha % C4 20 1 OUTLET m m3
1 C4 SINK 10.48 80 Weir 1 2 Pipe/Box 1 2 3 20 02 Diverts to Sub sink Diverts to Sub SINK 20.2 5223 Crest Elev [m] 21 Invert [m] 20 20.4 11284 Length [m] 70 No. Barrels 1 20.6 18195 Weir Coeff 2 Ent. Type 1 20.8 25966 Disch-Factor 1 Dia/(Width)[mm] 300 21 50007 Directed to TOP (Height)[mm] 21.2 100008 Delay [mins] 0 Disch-Factor 1 21.4 200009 Directed to TOP
10 Delay [mins] 0Total 10.5 80.0
6 Storm Data 7 Save & RunStorm ARI Duration [mins]
1 100 10 Shortcut: Shift + Ctrl + L2 100 153 100 30 Most Recent File: Y:\7488\7488 Correspondence\WBNM\c4.wbn4 100 60 Location of WBNMRun.exe: C:\Documents and Settings\Peterg\My Documents\DRAINAGE\WBNM2007\WBNMrun.exe5 100 3606 100 7207 100 14408 100 4320
Save & Run
W_Perth
Add
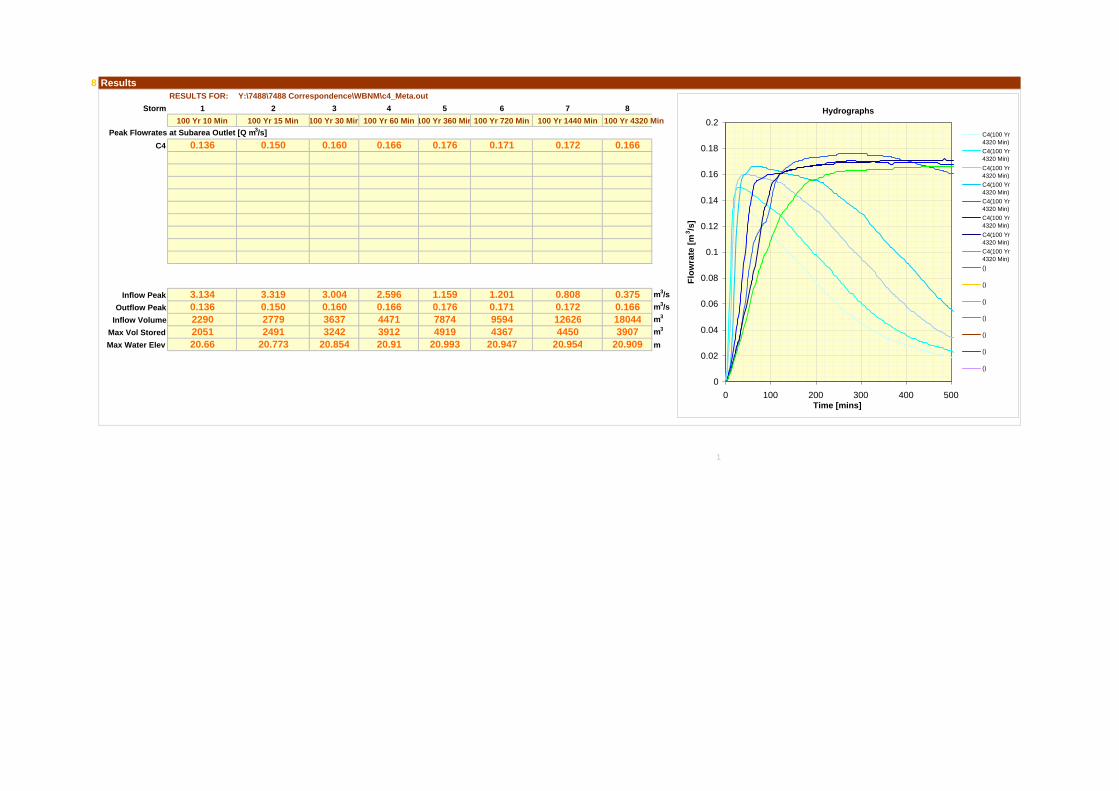
8 ResultsRESULTS FOR: Y:\7488\7488 Correspondence\WBNM\c4_Meta.out
Storm 1 2 3 4 6 7 8100 Yr 10 Min 100 Yr 15 Min 100 Yr 30 Min 100 Yr 60 Min 100 Yr 720 Min 100 Yr 1440 Min 100 Yr 4320 Min
Peak Flowrates at Subarea Outlet [Q m3/s]C4 0.136 0.150 0.160 0.166 0.171 0.172 0.166
Inflow Peak 3.134 3.319 3.004 2.596 1.201 0.808 0.375 m3/sOutflow Peak 0.136 0.150 0.160 0.166 0.171 0.172 0.166 m3/s
Inflow Volume 2290 2779 3637 4471 9594 12626 18044 m3
Max Vol Stored 2051 2491 3242 3912 4367 4450 3907 m3
Max Water Elev 20.66 20.773 20.854 20.91 20.947 20.954 20.909 m
1
5
0.176
100 Yr 360 Min
1.1590.17678744919
20.993
Hydrographs
0
0.02
0.04
0.06
0.08
0.1
0.12
0.14
0.16
0.18
0.2
0 100 200 300 400 500Time [mins]
Flow
rate
[m3 /s
]
C4(100 Yr4320 Min)C4(100 Yr4320 Min)C4(100 Yr4320 Min)C4(100 Yr4320 Min)C4(100 Yr4320 Min)C4(100 Yr4320 Min)C4(100 Yr4320 Min)C4(100 Yr4320 Min)()
()
()
()
()
()
()

WRF PROPERTY LTD –Sub-precinct 3A (1), Southern River: Local Water Management Strategy –Second Revised Version
with Addendum, July 2009
06.024 RP001 LWMS Final Revised July 09
APPENDIX I DRAINAGE DESIGN

INDICATIVE ONLY AND MAY NOT BE COMPLETE PURPORTING TO RELATE TO EXISTING SERVICES ISEXISTING SERVICES - INFORMATION ON THESE DRAWINGS
REFER TO SPECIFICATION AND CLAUSE 12 OF AS4000
REVISIONREV DATE APPROVED
A1 Facsimile: (08) 9481 3900
Telephone: (08) 9481 425538 Richardson Street West Perth WA 6005
Consulting Civil Engineers
The Civil Group
Copyright The Civil Group WA Pty Ltd B
1:2000
CELL 3A SOUTHERN RIVERDRAINAGE CATCHMENT PLANNING FOR WRF LAND HOLDING
L. Fisher
L. Fisher
WRF PROPERTY LTDA ISSUED FOR APPROVAL
B 1 IN 5 YEAR DRAINAGE STORAGE AMENDED
AHD
LEGEND
CATCHMENT BOUNDARY
PUBLIC OPEN SPACE
DRAINAGE STORAGE (5 YEAR)
SWALES (1 YEAR)
1. 1 IN 1 YEAR CONTAINED & INFILTRATED TO LOCAL SWALESOR WATER GARDENS.
2. 100 YEAR EVENT CONTAINED IN P.O.S & SWALE (OUTLET DESIGNED AS PERPRE-DEVELOPMENT FLOWS)
3. LOT/HOUSE DRAINAGE DISPOSED OF BY INFILTRATION ONSITE.
4. MIN CLEARANCE OF 1.5m BETWEEN AAMGL AND FINISHED LOT SURFACE LEVEL.
23.0 MIN. FILL LEVELS
19 58 MAX. GWL SPOT LEVELS
19.0MAX. GWL CONTOURS
LESLIE STREET
HOLM
ES RO
AD
STREET
18.0
19.0
19.6
19.6
20.5
20.0
20.0
20.0
19.6
19.6 19.6
19.6
20.0
20.5
20.0
19.6 20.0
20.2
20.2
20.0
20.522.0
20.521.3
21.0
20.220.521.0
20.8 20.0
22.021.5
22.0
19 68
MATISON 19
59
19 58
19 74
18 62
18 30
17.62
17 31
SOUTHERN RIVER ROAD
LOCAL CATCHMENT BOUNDARIES
NOTES:
FLOW DIRECTION
CATCHMENT KEY
FG
DE
C
BA
19.6
EXISTING RURAL DRAIN
LARGE GULLY GRATETO PICK UP OVERFLOW
EXISTING RURAL OUTLET DRAINTO SOUTHERN RIVER
EXISTING RURAL OUTLETDRAIN TO SOUTHERNRIVER
C1
P.O.S
C2
P.O.S
C3
PRE-DEVELOPMENT 100YEAR FLOODPATH FROMLOCAL LOW POINT
P.O.S
CATCHMENT AREAS (Ha) AREAS (Ha) TOTALC1-A 1.44 2.28 3.72C2-B 0.92 0.99 1.91C2-C 3.40 7.17 10.57C2-D 3.90 7.69 11.59C3-E 2.13 3.97 6.10C4-F 3.86 6.62 10.48 C5-G 2.90 6.95 9.85TOTAL 18.55 35.67 54.22
ROAD RESERVE LOT
FORRESTDALEMAIN DRAIN
P.O.S P.O.S
C4
WATER GARDENS (1 YEAR)
C4 CATCHMENT
PIPE DRAIN & JUNCTION PIT
C5
P.O.S23.0 22.0
24.0
21.0
PRE-DEVELOPMENT 100YEAR FLOODPATH FROMLOCAL LOW POINTPRE-DEVELOPMENT 100
YEAR FLOODPATH FROMLOCAL LOW POINT
PRE-DEVELOPMENT 100YEAR FLOODPATH FROMLOCAL LOW POINT
0 m40 80 120 160 200-40
1:2000
CCW WETLANDS
CCW WETLANDS
CATCHMENT AREA OF INUNDATIONC1 -C2 8816mC3 & C5 1346mC4 3116m
1 IN 5 YEAR
2
2
2
PRE-DEVELOPMENT 100YEAR FLOODPATH FROMLOCAL LOW POINT
EXISTING RURAL OUTLETDRAIN TO SOUTHERN RIVER
WRF PROPERTY LTD –Sub-precinct 3A (1), Southern River: Local Water Management Strategy –Second Revised Version
with Addendum, July 2009
06.024 RP001 LWMS Final Revised July 09
APPENDIX J INDICATIVE LAYOUTS OF ROAD
RESERVES WITH SWALES
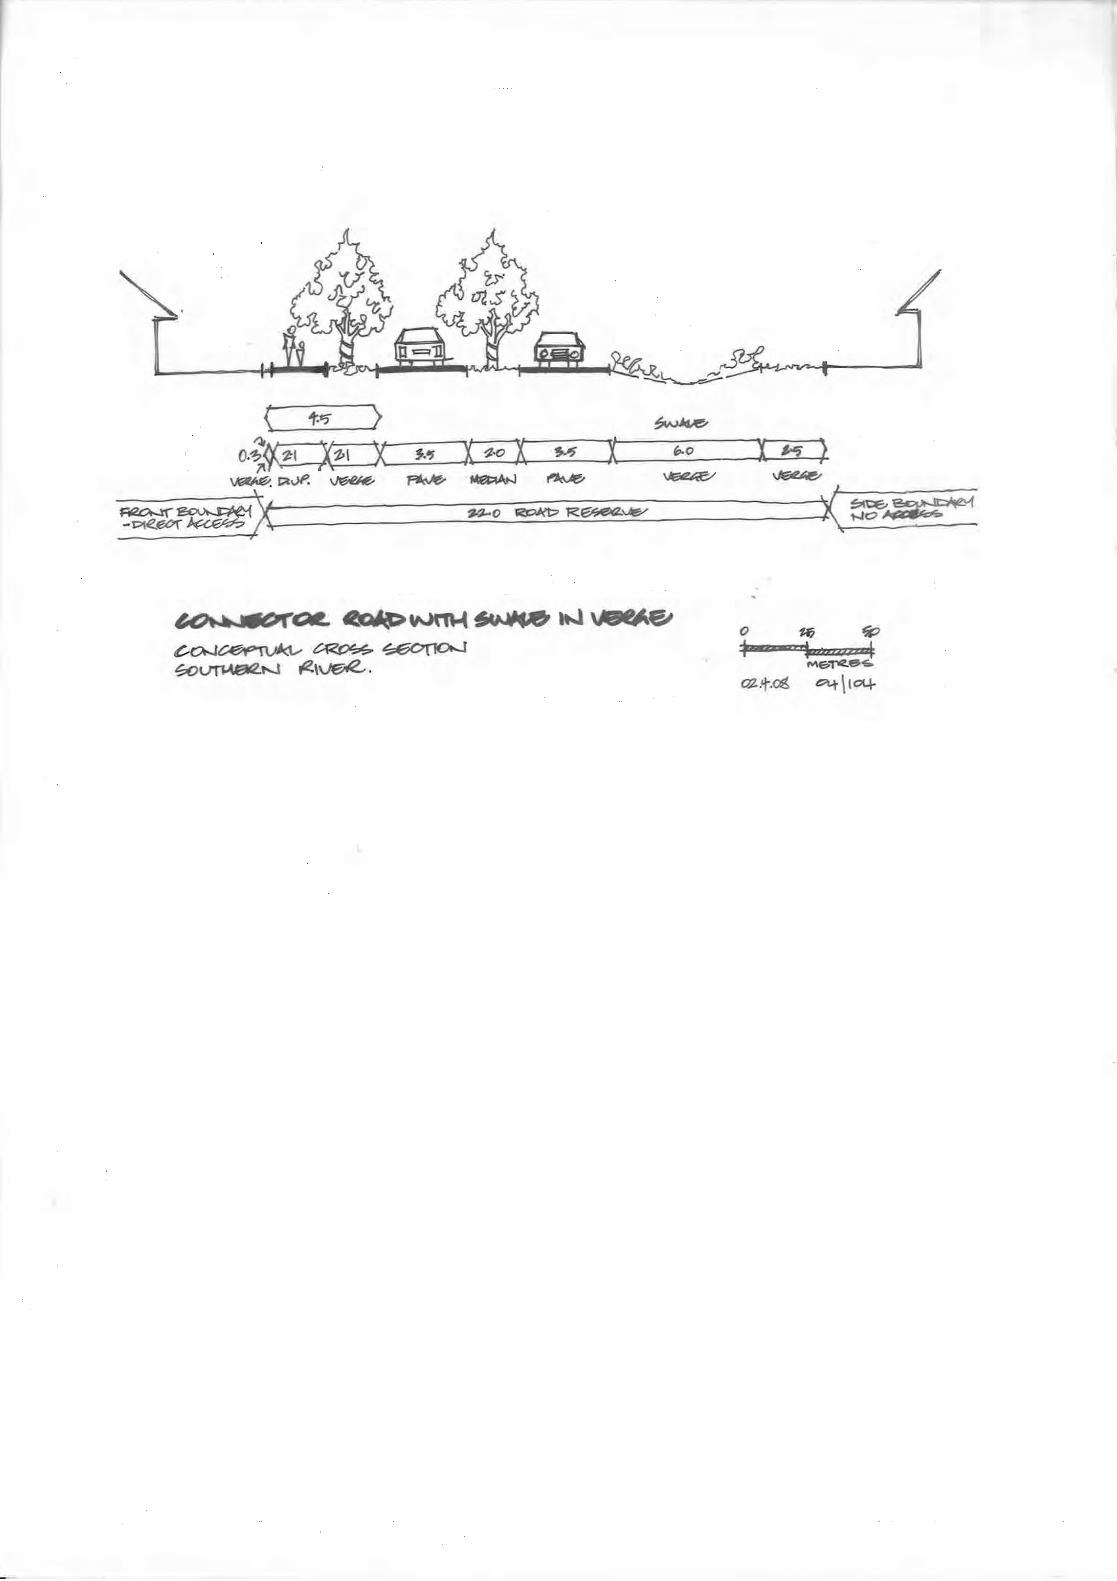
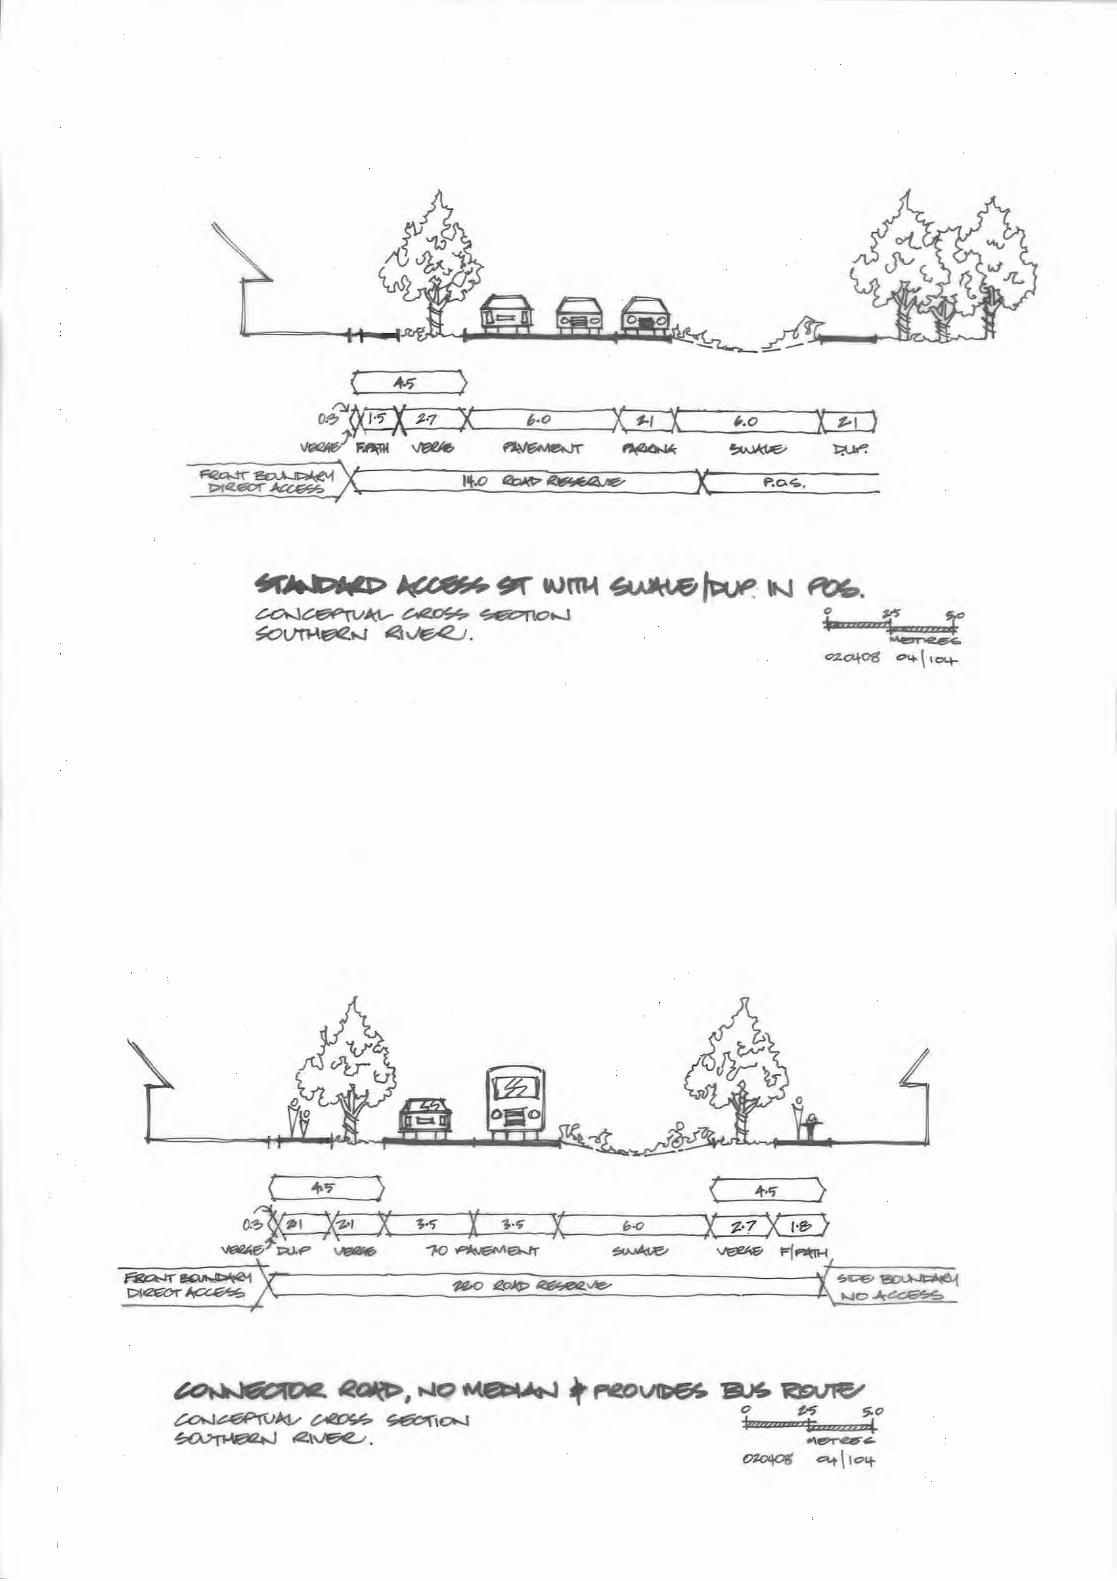


WRF PROPERTY LTD –Sub-precinct 3A (1), Southern River: Local Water Management Strategy –Second Revised Version
with Addendum, July 2009
06.024 RP001 LWMS Final Revised July 09
APPENDIX K DETAILS OF MUSIC MODEL

WRF PROPERTY LTD –Sub-precinct 3A (1), Southern River: Local Water Management Strategy – Final Revised, June 2009
06.024 RP001 LMWS Final Revised June 2009
APPENDIX K
MUSIC Modelling Report This report has been included comply with the guidelines set out in Section 3 of the Draft MUSIC Guidelines for Perth (GHD, June 2006).
Model Version: 3.0.1 Start Date: 1 January 1975 End Date: 31 December 2000 Time Step: 6 minute interval Data Source: Perth Airport data provided by MUSIC. Time step, start and end dates as per Draft MUSIC guidelines for Perth (GHD, 2006)
Catchment Data:
Catchments were modelled as pervious and impervious areas. The roof area was included in the pervious area as it is planned that roof runoff will be infiltrated on site. Water falling on domestic pavements is also assumed to infiltrate on site. This may slightly overestimate the amount of nutrients in the pervious area but this was considered to be a conservative approach.
The impervious area of the catchments was assumed to be equivalent to 60% of the road reserve area plus the commercial areas. The pervious area is equivalent to the residential area.
Catchment Impervious Area (Ha) Pervious Area (Ha) Total (Ha)C1 1.16 2.55 3.71 C2 5.31 21.38 26.69 C3 1.73 8.39 10.12 C4 1.76 8.33 10.09 C5 1.13 5.29 6.42
Node Assumptions:
Source node pollutant and runoff generation as per the guidelines (GHD, 2006). Pervious catchments were assumed to be sand and modelled as per Table 4 of the guidelines.
Treatment node parameters: as per guidelines.
WRF PROPERTY LTD –Sub-precinct 3A (1), Southern River: Local Water Management Strategy – Final Revised, June 2009
06.024 RP001 LMWS Final Revised June 2009
Any potential problems related to the loss of flows from simulations through infiltration.
The swales in the road reserve will generally have nominally 600mm between the base or invert of the swale and the AAMGL. There are some situations where it will be greater than this. Swales are proposed to be 500mm to 600mm deep below the edge of road level, 1m base width and 1 in 6 side slopes. The vegetated detention basins in the POS are expected to have bases on or in the AAMGL. These basins were modelled as ponds in the model with a depth of 0.5 m below the outlet. This was undertaken because these structures are likely to be less linear than a swale and thus will have different hydraulic properties which are more similar to a pond than a linear swale system.
To model this, the swales were modelled under various scenarios to investigate the potential effects of high groundwater levels on infiltration. Modelling was undertaken with a range of infiltration rates between 0.36 and 3.6 mm/hr to reflect this. This range is equivalent to a system with a heavy clay to sandy clay base, or low infiltration rates due to high groundwater levels. It is likely that the base of the swales will be in materials ranging between sand and sandy clay, which would have an infiltration rate of 3.6 to 360 mm/hr, according to MUSIC.
Swales in C1 and C5 were modelled as bioretention systems, as it is likely that bioretention systems will be used in this area with the underdrain at AAMGL to control groundwater levels. These were also modelled with a range of infiltration rates between 0.36 and 18 mm/hr.
Even with all of the systems running with an infiltration rate of 0.36 mm/hr (equivalent to a heavy clay soil type), the system removed 85% of Phosphorus and 75% of Nitrogen, which is above the targets set by the ILWMP.
It is recognised that the basins in the POS may occasionally intersect the groundwater on the site. Swales in the north-eastern corner of the site, near the current chicken farm, will not be placed below AAMGL to limit the abstraction of nutrient rich groundwater from the site. Because of the placement of these structures, they will be above groundwater in summer and thus not receive any summer inflows. This design practice is being undertaken to minimise nuisance insect breeding on the site. Seepage is not considered to be an important part of the model, because it should be limited to periods of a few weeks when groundwater levels are at their highest.
Discussion of any potential problems related to the interaction of groundwater/surface water, including calculations, assumptions and potential inaccuracies.
The assumptions associated with infiltration in MUSIC are all very simple estimates of what may be the case. MUSIC does not model groundwater/surface water interactions and is thus simplification of what occurs on the Swan Coastal Plain.
WRF PROPERTY LTD –Sub-precinct 3A (1), Southern River: Local Water Management Strategy – Final Revised, June 2009
06.024 RP001 LMWS Final Revised June 2009
Assuming that the bottoms of the POS swales are set at AAMGL, the swales may intercept groundwater for perhaps one week every second year. Assumptions that may be made are:
• that the groundwater level rises to an average of 5 cm above AAMGL over this period and the flow does not go significantly above the base of the channel (i.e. dh = 0.05 m);
• the soil at this level is a sandy clay with K = 18 mm/hr; and
• Swales are 30 m wide, there will be a total length of 1,700 m of swale in the POS. Half of this runs in direction normal to groundwater flow and half of it runs parallel to groundwater flow, a total of 865 m could intercept flow, and
• dx = 3 m or the width of the swale sides.
Using Darcy’s equation: Q= K(dh/dx) Q = 0.018 *(0.05/3) = 0.003 m/hr = 0.05 m/week
Given height of 5 cm and width of 865 m, the total area of flow would be 43.25 m2. The total volume of water infiltrated would therefore be in the order of 2 kL over a week. This should be considered as an order of magnitude estimate, but it is not considered to be a significant volume, given the size of the catchment.
More accurate interception values can be modelled through the use of a groundwater model such as MODFLOW.
A description of any non structural treatment measures used
Non-structural treatment measures were not included.