Absolute Calibration of the European Sentinel-3A Surface ...
22
remote sensing Article Absolute Calibration of the European Sentinel-3A Surface Topography Mission over the Permanent Facility for Altimetry Calibration in west Crete, Greece Stelios Mertikas 1, *, Craig Donlon 2 , Pierre Féménias 3 , Constantin Mavrocordatos 2 , Demitris Galanakis 4 , Achilles Tripolitsiotis 4 , Xenophon Frantzis 1 , Costas Kokolakis 1 , Ilias N. Tziavos 5 , George Vergos 5 and Thierry Guinle 6 1 Geodesy and Geomatics Engineering Laboratory, Technical University of Crete, GR-73100 Chania, Greece; [email protected] (X.F.); [email protected] (C.K.) 2 European Space Agency/European Space Research and Technology Centre (ESA/ESTEC), Keplerlaan 1, 2201 AZ Noordwijk, The Netherlands; [email protected] (C.D.); [email protected] (C.M.) 3 European Space Agency/European Space Research Institute (ESA/ESRIN), Via Galileo Galilei, I-00044 Frascati, Italy; [email protected] 4 Space Geomatica P.C., Xanthoudidou 10A, GR-73132 Chania, Greece; [email protected] (D.G.); [email protected] (A.T.) 5 Department of Geodesy and Surveying, Aristotle University of Thessaloniki, University Box 440, 54124 Thessaloniki, Greece; [email protected] (I.N.T.); [email protected] (G.V.) 6 Centre National d’ Etudes Spatiales (CNES), 31401 Toulouse, CEDEX, France; [email protected] * Correspondence: [email protected]; Tel.: +30-28210-37629 Received: 20 October 2018; Accepted: 13 November 2018; Published: 15 November 2018 Abstract: This work presents calibration results for the altimeter of Sentinel-3A Surface Topography Mission as determined at the Permanent Facility for Altimetry Calibration in west Crete, Greece. The facility has been providing calibration services for more than 15 years for all past (i.e., Envisat, Jason-1, Jason-2, SARAL/AltiKa, HY-2A) and current (i.e., Sentinel-3A, Sentinel-3B, Jason-3) satellite altimeters. The groundtrack of the Pass No.14 of Sentinel-3A ascends west of the Gavdos island and continues north to the transponder site on the mountains of west Crete. This pass has been calibrated using three independent techniques activated at various sites in the region: (1) the transponder approach for its range bias, (2) the sea-surface method for the estimation of altimeter bias for its sea-surface heights, and (c) the cross-over analysis for inspecting height observations with respect to Jason-3. The other Pass No.335 of Sentinel-3A descends from southwest of Crete to south and intersects the Gavdos calibration site. Additionally, calibration values for this descending pass are presented, applying sea-surface calibration and crossover analysis. An uncertainty analysis for the altimeter biases derived by the transponder and by sea-surface calibrations is also introduced following the new standard of Fiducial Reference Measurements. Keywords: satellite altimetry; calibration; Sentinel-3A; transponder; sea surface; Crete 1. Introduction For several decades, international satellite Earth Observation (EO) programs have demonstrated their capacity to serve both scientific and societal needs. Currently, 60 agencies from all over the world are operating 154 satellites [1]. Copernicus is the European EO program that relies upon an open and free-of-charge data policy for improving European citizens’ welfare and environmental Remote Sens. 2018, 10, 1808; doi:10.3390/rs10111808 www.mdpi.com/journal/remotesensing
-
Upload
khangminh22 -
Category
Documents
-
view
0 -
download
0
Transcript of Absolute Calibration of the European Sentinel-3A Surface ...

remote sensing
Article
Absolute Calibration of the European Sentinel-3ASurface Topography Mission over the PermanentFacility for Altimetry Calibration in westCrete, Greece
Stelios Mertikas 1,*, Craig Donlon 2, Pierre Féménias 3, Constantin Mavrocordatos 2,Demitris Galanakis 4, Achilles Tripolitsiotis 4, Xenophon Frantzis 1, Costas Kokolakis 1,Ilias N. Tziavos 5 , George Vergos 5 and Thierry Guinle 6
1 Geodesy and Geomatics Engineering Laboratory, Technical University of Crete, GR-73100 Chania, Greece;[email protected] (X.F.); [email protected] (C.K.)
2 European Space Agency/European Space Research and Technology Centre (ESA/ESTEC), Keplerlaan 1,2201 AZ Noordwijk, The Netherlands; [email protected] (C.D.);[email protected] (C.M.)
3 European Space Agency/European Space Research Institute (ESA/ESRIN), Via Galileo Galilei,I-00044 Frascati, Italy; [email protected]
4 Space Geomatica P.C., Xanthoudidou 10A, GR-73132 Chania, Greece;[email protected] (D.G.); [email protected] (A.T.)
5 Department of Geodesy and Surveying, Aristotle University of Thessaloniki, University Box 440,54124 Thessaloniki, Greece; [email protected] (I.N.T.); [email protected] (G.V.)
6 Centre National d’ Etudes Spatiales (CNES), 31401 Toulouse, CEDEX, France; [email protected]* Correspondence: [email protected]; Tel.: +30-28210-37629
Received: 20 October 2018; Accepted: 13 November 2018; Published: 15 November 2018 �����������������
Abstract: This work presents calibration results for the altimeter of Sentinel-3A Surface TopographyMission as determined at the Permanent Facility for Altimetry Calibration in west Crete, Greece.The facility has been providing calibration services for more than 15 years for all past (i.e., Envisat,Jason-1, Jason-2, SARAL/AltiKa, HY-2A) and current (i.e., Sentinel-3A, Sentinel-3B, Jason-3) satellitealtimeters. The groundtrack of the Pass No.14 of Sentinel-3A ascends west of the Gavdos island andcontinues north to the transponder site on the mountains of west Crete. This pass has been calibratedusing three independent techniques activated at various sites in the region: (1) the transponderapproach for its range bias, (2) the sea-surface method for the estimation of altimeter bias for itssea-surface heights, and (c) the cross-over analysis for inspecting height observations with respectto Jason-3. The other Pass No.335 of Sentinel-3A descends from southwest of Crete to south andintersects the Gavdos calibration site. Additionally, calibration values for this descending pass arepresented, applying sea-surface calibration and crossover analysis. An uncertainty analysis forthe altimeter biases derived by the transponder and by sea-surface calibrations is also introducedfollowing the new standard of Fiducial Reference Measurements.
Keywords: satellite altimetry; calibration; Sentinel-3A; transponder; sea surface; Crete
1. Introduction
For several decades, international satellite Earth Observation (EO) programs have demonstratedtheir capacity to serve both scientific and societal needs. Currently, 60 agencies from all over theworld are operating 154 satellites [1]. Copernicus is the European EO program that relies upon anopen and free-of-charge data policy for improving European citizens’ welfare and environmental
Remote Sens. 2018, 10, 1808; doi:10.3390/rs10111808 www.mdpi.com/journal/remotesensing

Remote Sens. 2018, 10, 1808 2 of 22
protection. It is the world’s largest single EO program, a huge European investment that, althoughnot fully operational, already produces a clear economic impact. For every 1 Euro that is spent in theCopernicus program a total of 1.39 Euro of added value is produced in the European economy [2].
The Sentinel satellites are the means to provide the foreseen set of observations for the Copernicusprogram. They consist of six different satellite families (Sentinel-1 to Sentinel-6 and, in the future,to be extended up to Sentinel-9 series) designed to serve different Copernicus services (atmosphere,land, climate change, emergency management, security, marine environment). The Sentinel-3 familycontributes to the Copernicus Marine Services by measuring variables such as sea-surface topography,ocean and land color, and temperature to support operational oceanography and environmental andclimate change monitoring.
Sentinel-3A was launched on 16 February 2016 and its twin satellite Sentinel-3B was put inorbit on 25 April 2018. This Sentinel-3 family is expected to grow soon with two more satellites, i.e.,Sentinel-3C and Sentinel-3D, to ensure continuity of service until 2030 [3].
The Surface Topography Mission (STM) element of Sentinel-3 consists of a dual-frequency (Ku-andC-band) Synthetic Aperture Radar Altimeter (SRAL), a Microwave Radiometer (MWR) and a systemfor Precise Orbit Determination (POD) that includes a Global Navigation Satellite System (GNSS),a DORIS (Détermination d’Orbite et Radiopositionnement Intégré par Satellite) system, and a LaserRetro Reflector. The main objective of Sentinel-3 STM is to deliver sea-surface heights with an accuracyof 3.5 cm [4]. This shall be considered as a combination of contributions arising from the SRAL, MWRand POD instruments. To reach this goal and ensure long-term confidence, accuracy and quality inSentinel-3 data products, calibration and validation (Cal/Val) activities have to be carried out duringall mission phases, i.e., pre-launch, commissioning, and operations.
This work presents the latest results of the external altimeter calibration of the Sentinel-3A STMwith in-situ data at the dedicated Permanent Facility for Altimetry Calibration (PFAC) in west Crete,Greece. This is a Cal/Val facility that provides external range transponder calibration, cross-calibrationwith other altimetry missions, and sea-surface height calibration with in-situ data, primarily in theGavdos island, south of Crete [5]. In addition, validation of the atmospheric delays provided bythe MWR instrument is carried out using observations from a network of Continuously OperatingReference GNSS Stations established in the broader PFAC area.
In the following, Section 2 presents the PFAC infrastructure and instrumentation setting. Then,Section 3 describes the diverse methodologies applied for the calibration of the altimeter products,along with the dataset used. The latest Cal/Val results and their standard uncertainty as deliveredby each methodology are given in Section 4 as well as a comparison of the wet tropospheric delaysas derived by the MWR measurements and the GNSS data processing. Finally, in Section 5, the mainconclusions for the overall performance of Sentinel-3A altimeter and MWR are given along with futureplans for improving uncertainty analysis within the context of the Fiducial Reference Measurementsfor altimetry [6,7].
2. PFAC Infrastructure & Instrumentation
The Sentinel-3 satellite flies at an altitude of 814.5 km following a near-polar sun-synchronousorbit that ensures 104 km ground track separation at the Equator. It needs 385 orbits to perform acomplete Earth cycle. The STM element has a 27-day revisit time upon the same ground location.This temporal repeatability of Sentinel-3 lies between that of Envisat’s and SARAL/AltiKa’s (35-days)and CryoSat-2 (369-days) and Jason (10-days) satellite altimeters.
The Sentinel-3A & Sentinel-3B ground tracks over the island of Crete, Greece are illustratedin Figure 1. The locations of the independent Cal/Val sites that compose the Permanent Facilityfor Altimetry Calibration are also presented in the same Figure. Two of these sites are employedfor the calibration of Sentinel-3A STM element: the CDN1 transponder and the Gavdos sea-surfaceCal/Val facilities.

Remote Sens. 2018, 10, 1808 3 of 22Remote Sens. 2018, 10, x FOR PEER REVIEW 3 of 22
Figure 1. Sentinel-3A (green) and Sentinel-3B (yellow) ground tracks over Greece (left) and the island of Crete (right). The location of several calibration and validation (Cal/Val) sites in west Crete, Greece are shown in the right image.
2.1. CDN1 Transponder Cal/Val Site
The Sentinel-3 Altimeter Calibration Site, named “CDN1 Cal/Val” site, is located on the mountainous of West Crete, at about 1000 m altitude under a triple crossover of Sentinel-3A Pass No.14 (ascending), Sentinel-3B Pass No.335 (descending) and Jason Pass No.18 (descending) (Figure 2).
Figure 2. Upper Left: The CDN1 transponder Cal/Val site has been established to support Cal/Val activities for the Sentinel-3A (green) and Sentinel-3B (blue) missions and for the Jason (red) series (future Sentinel-6/Jason-CS). Upper Right: Aerial view of the CDN1 transponder Cal/Val site in West Crete Mountains. Lower: The sequential calibration of Sentinel-3 along the ascending Pass No.14 with sea-surface and transponder techniques, respectively. Overview of the calibration process along with photos from the satellite calibration infrastructure.
Figure 1. Sentinel-3A (green) and Sentinel-3B (yellow) ground tracks over Greece (left) and the islandof Crete (right). The location of several calibration and validation (Cal/Val) sites in west Crete, Greeceare shown in the right image.
2.1. CDN1 Transponder Cal/Val Site
The Sentinel-3 Altimeter Calibration Site, named “CDN1 Cal/Val” site, is located on themountainous of West Crete, at about 1000 m altitude under a triple crossover of Sentinel-3A Pass No.14(ascending), Sentinel-3B Pass No.335 (descending) and Jason Pass No.18 (descending) (Figure 2).
Remote Sens. 2018, 10, x FOR PEER REVIEW 3 of 22
Figure 1. Sentinel-3A (green) and Sentinel-3B (yellow) ground tracks over Greece (left) and the island of Crete (right). The location of several calibration and validation (Cal/Val) sites in west Crete, Greece are shown in the right image.
2.1. CDN1 Transponder Cal/Val Site
The Sentinel-3 Altimeter Calibration Site, named “CDN1 Cal/Val” site, is located on the mountainous of West Crete, at about 1000 m altitude under a triple crossover of Sentinel-3A Pass No.14 (ascending), Sentinel-3B Pass No.335 (descending) and Jason Pass No.18 (descending) (Figure 2).
Figure 2. Upper Left: The CDN1 transponder Cal/Val site has been established to support Cal/Val activities for the Sentinel-3A (green) and Sentinel-3B (blue) missions and for the Jason (red) series (future Sentinel-6/Jason-CS). Upper Right: Aerial view of the CDN1 transponder Cal/Val site in West Crete Mountains. Lower: The sequential calibration of Sentinel-3 along the ascending Pass No.14 with sea-surface and transponder techniques, respectively. Overview of the calibration process along with photos from the satellite calibration infrastructure.
Figure 2. Upper Left: The CDN1 transponder Cal/Val site has been established to support Cal/Valactivities for the Sentinel-3A (green) and Sentinel-3B (blue) missions and for the Jason (red) series(future Sentinel-6/Jason-CS). Upper Right: Aerial view of the CDN1 transponder Cal/Val site in WestCrete Mountains. Lower: The sequential calibration of Sentinel-3 along the ascending Pass No.14 withsea-surface and transponder techniques, respectively. Overview of the calibration process along withphotos from the satellite calibration infrastructure.

Remote Sens. 2018, 10, 1808 4 of 22
The main instrumentation at the CDN1 Cal/Val site includes a prototype range microwavetransponder [8], two continuously operating GNSS stations, and two meteorological stations. The firstGNSS receiver has been installed on site and has been operational as of June 2014, while the microwavetransponder has been installed and operational as of 28 August 2015 (Figure 3).
Remote Sens. 2018, 10, x FOR PEER REVIEW 4 of 22
The main instrumentation at the CDN1 Cal/Val site includes a prototype range microwave transponder [8], two continuously operating GNSS stations, and two meteorological stations. The first GNSS receiver has been installed on site and has been operational as of June 2014, while the microwave transponder has been installed and operational as of 28 August 2015 (Figure 3).
Figure 3. The operational status of the main instrumentation (microwave transponder, Global Navigation Satellite System (GNSS) receivers and meteorological stations) at the CDN1 transponder Cal/Val site as of 2014.
2.2. Gavdos Sea-Surface Cal/Val Facility
The Gavdos Cal/Val facility has been operational since 2004. It provides absolute calibration values for the Sentinel-3A SRAL altimeter and, more specifically, for its ascending Pass No.14, and for its descending Pass No.335 (Figure 4a). Additionally, this site has been engaged in sea-surface calibration of the Jason missions (Jason-1, Jason-2 and Jason-3, along the descending Pass No.18 and the ascending Pass No.109). In the past, Gavdos has provided Cal/Val results for Jason-1, Jason-2, Jason-3, Envisat, and SARAL/AltiKa satellite altimeters [9]. At present, three tide gauges of different measuring technology (KVR3-radar, KVR4-open air acoustic, and KVR5-pressure) have been used to provide water level observations at the “Karave” harbor site in the Gavdos inland (Figure 4b).
(a) (b)
Figure 4. (a) The location of the Gavdos sea-surface Cal/Val facility enables the provision of calibration services for Sentinel-3A (green) andJason (red) satellite altimetry missions. Ascending and descending passes for both missions are calibrated at the Gavdos Cal/Val facility. (b) The current setup of the “Karave” harbor site in the Gavdos Cal/Val facility.
Since the initial setup in 2001, the instrumentation installed at this sea-surface Cal/Val facility in the Gavdos island has been modified throughout this long period of operation to (a) compensate malfunctions, failures, and damages caused by extreme weather events, (b) to follow up changes in satellite altimetry measuring techniques, and (c) improve the instrumentation’s uncertainty budget (Figure 5).
Figure 3. The operational status of the main instrumentation (microwave transponder, GlobalNavigation Satellite System (GNSS) receivers and meteorological stations) at the CDN1 transponderCal/Val site as of 2014.
2.2. Gavdos Sea-Surface Cal/Val Facility
The Gavdos Cal/Val facility has been operational since 2004. It provides absolute calibrationvalues for the Sentinel-3A SRAL altimeter and, more specifically, for its ascending Pass No.14, and forits descending Pass No.335 (Figure 4a). Additionally, this site has been engaged in sea-surfacecalibration of the Jason missions (Jason-1, Jason-2 and Jason-3, along the descending Pass No.18 andthe ascending Pass No.109). In the past, Gavdos has provided Cal/Val results for Jason-1, Jason-2,Jason-3, Envisat, and SARAL/AltiKa satellite altimeters [9]. At present, three tide gauges of differentmeasuring technology (KVR3-radar, KVR4-open air acoustic, and KVR5-pressure) have been used toprovide water level observations at the “Karave” harbor site in the Gavdos inland (Figure 4b).
Remote Sens. 2018, 10, x FOR PEER REVIEW 4 of 22
The main instrumentation at the CDN1 Cal/Val site includes a prototype range microwave transponder [8], two continuously operating GNSS stations, and two meteorological stations. The first GNSS receiver has been installed on site and has been operational as of June 2014, while the microwave transponder has been installed and operational as of 28 August 2015 (Figure 3).
Figure 3. The operational status of the main instrumentation (microwave transponder, Global Navigation Satellite System (GNSS) receivers and meteorological stations) at the CDN1 transponder Cal/Val site as of 2014.
2.2. Gavdos Sea-Surface Cal/Val Facility
The Gavdos Cal/Val facility has been operational since 2004. It provides absolute calibration values for the Sentinel-3A SRAL altimeter and, more specifically, for its ascending Pass No.14, and for its descending Pass No.335 (Figure 4a). Additionally, this site has been engaged in sea-surface calibration of the Jason missions (Jason-1, Jason-2 and Jason-3, along the descending Pass No.18 and the ascending Pass No.109). In the past, Gavdos has provided Cal/Val results for Jason-1, Jason-2, Jason-3, Envisat, and SARAL/AltiKa satellite altimeters [9]. At present, three tide gauges of different measuring technology (KVR3-radar, KVR4-open air acoustic, and KVR5-pressure) have been used to provide water level observations at the “Karave” harbor site in the Gavdos inland (Figure 4b).
(a) (b)
Figure 4. (a) The location of the Gavdos sea-surface Cal/Val facility enables the provision of calibration services for Sentinel-3A (green) andJason (red) satellite altimetry missions. Ascending and descending passes for both missions are calibrated at the Gavdos Cal/Val facility. (b) The current setup of the “Karave” harbor site in the Gavdos Cal/Val facility.
Since the initial setup in 2001, the instrumentation installed at this sea-surface Cal/Val facility in the Gavdos island has been modified throughout this long period of operation to (a) compensate malfunctions, failures, and damages caused by extreme weather events, (b) to follow up changes in satellite altimetry measuring techniques, and (c) improve the instrumentation’s uncertainty budget (Figure 5).
Figure 4. (a) The location of the Gavdos sea-surface Cal/Val facility enables the provision of calibrationservices for Sentinel-3A (green) andJason (red) satellite altimetry missions. Ascending and descendingpasses for both missions are calibrated at the Gavdos Cal/Val facility. (b) The current setup of the“Karave” harbor site in the Gavdos Cal/Val facility.
Since the initial setup in 2001, the instrumentation installed at this sea-surface Cal/Val facilityin the Gavdos island has been modified throughout this long period of operation to (a) compensatemalfunctions, failures, and damages caused by extreme weather events, (b) to follow up changes insatellite altimetry measuring techniques, and (c) improve the instrumentation’s uncertainty budget(Figure 5).

Remote Sens. 2018, 10, 1808 5 of 22Remote Sens. 2018, 10, x FOR PEER REVIEW 5 of 22
Figure 5. The operational status of the instrumentation (tide gauges, GNSS receivers) at the Gavdos Cal/Val site as of 2004.
2.3. The Regional GNSS Network
To determine precise geodetic coordinates for the reference marks of the PFAC instrumentation, continuously operating reference GNSS stations have been setup at each Cal/Val site (Gavdos, CRS1, RDK1, CDN1). Additional GNSS stations have also been installed in west Crete, in support of PFAC operations and to provide better understanding of the tectonic deformations in this earthquake prone region (Figure 6). The same instrumentation has also been used to derive the atmospheric delays (wet and dry troposphere, ionosphere) for the altimeter’s signals.
Figure 6. The regional GNSS network in Gavdos and west Crete, Greece (left) and availability of GNSS observations (right).
3. Calibration Methodologies & Dataset Used
The scientific community investigates [10] and provides post-launch calibration and validation of satellite altimeter products from the early beginning of the altimetry era [11,12]. Following the technological advances in satellite altimetry, several techniques have been implemented to provide both absolute and relative calibration of satellite altimeters: distributed tide-gauge network (relative), crossover analysis (relative), sea-surface calibration using tide gauges and/or GNSS buoys (absolute indirect), and active transponder calibration (absolute direct). Three of these Cal/Val techniques are put into action at the PFAC, and presented hereafter.
Figure 5. The operational status of the instrumentation (tide gauges, GNSS receivers) at the GavdosCal/Val site as of 2004.
2.3. The Regional GNSS Network
To determine precise geodetic coordinates for the reference marks of the PFAC instrumentation,continuously operating reference GNSS stations have been setup at each Cal/Val site (Gavdos, CRS1,RDK1, CDN1). Additional GNSS stations have also been installed in west Crete, in support of PFACoperations and to provide better understanding of the tectonic deformations in this earthquake proneregion (Figure 6). The same instrumentation has also been used to derive the atmospheric delays(wet and dry troposphere, ionosphere) for the altimeter’s signals.
Remote Sens. 2018, 10, x FOR PEER REVIEW 5 of 22
Figure 5. The operational status of the instrumentation (tide gauges, GNSS receivers) at the Gavdos Cal/Val site as of 2004.
2.3. The Regional GNSS Network
To determine precise geodetic coordinates for the reference marks of the PFAC instrumentation, continuously operating reference GNSS stations have been setup at each Cal/Val site (Gavdos, CRS1, RDK1, CDN1). Additional GNSS stations have also been installed in west Crete, in support of PFAC operations and to provide better understanding of the tectonic deformations in this earthquake prone region (Figure 6). The same instrumentation has also been used to derive the atmospheric delays (wet and dry troposphere, ionosphere) for the altimeter’s signals.
Figure 6. The regional GNSS network in Gavdos and west Crete, Greece (left) and availability of GNSS observations (right).
3. Calibration Methodologies & Dataset Used
The scientific community investigates [10] and provides post-launch calibration and validation of satellite altimeter products from the early beginning of the altimetry era [11,12]. Following the technological advances in satellite altimetry, several techniques have been implemented to provide both absolute and relative calibration of satellite altimeters: distributed tide-gauge network (relative), crossover analysis (relative), sea-surface calibration using tide gauges and/or GNSS buoys (absolute indirect), and active transponder calibration (absolute direct). Three of these Cal/Val techniques are put into action at the PFAC, and presented hereafter.
Figure 6. The regional GNSS network in Gavdos and west Crete, Greece (left) and availability of GNSSobservations (right).
3. Calibration Methodologies & Dataset Used
The scientific community investigates [10] and provides post-launch calibration and validationof satellite altimeter products from the early beginning of the altimetry era [11,12]. Following thetechnological advances in satellite altimetry, several techniques have been implemented to provideboth absolute and relative calibration of satellite altimeters: distributed tide-gauge network (relative),crossover analysis (relative), sea-surface calibration using tide gauges and/or GNSS buoys (absoluteindirect), and active transponder calibration (absolute direct). Three of these Cal/Val techniques areput into action at the PFAC, and presented hereafter.

Remote Sens. 2018, 10, 1808 6 of 22
3.1. Transponder Calibration
In satellite altimetry, the actual observation is the two-way travel time of the altimeter’s signal:transmission by the altimeter, reflection by the Earth’s surface, and recording by the altimeter.Subsequently, given that the speed of light is constant, it is the range (signal propagation time)between the satellite and the Earth’s surface that defines the primary measurement in altimetry. Thus,in order to claim direct and absolute calibration of satellite altimeters it is the range bias that has to beexamined meticulously by external and independent means on the ground.
Microwave transponders are the apparatus to provide the absolute direct range bias of thesatellite altimeter with no averaging of different reflection points and of the dynamic conditions atsea during satellite overpass [13]. In this Cal/Val technique, a transponder on the ground receives thetransmitted data by the altimeter signal as the satellite overflies its location. Then, the transponderamplifies it and transmits it back to the satellite. The amplification procedure at the transponder is fullycontrolled, stable, and designed to ensure that the point target response, such as the one produced bya transponder, is clearly detectable in the recorded signal at the altimeter and certainly distinguishableamong other reflections from the surrounding setting on the ground.
Absolute range calibration of altimeters using transponders have been carried out for Envisat [14],Jason-2 [15], CryoSat-2 [16], and Jason-3 [17]. Sentinel-3A transponder calibration results havebeen presented in [17,18] using the transponder operating at the CDN1 Cal/Val site in West Crete.The technical characteristics of this transponder instrument have been presented elsewhere [8].
The Sentinel-3A altimeter operates under two radar modes: (a) the Low-Resolution Mode (LRM)with the traditional pulse-limited signal transmitted on a 3 Ku-band/1 C-band/3 Ku-band patternsand (b) the Synthetic Aperture Radar (SAR) mode, with a high resolution along its track. SAR mode ismade of bursts, each of which contains 64 Ku-band pulses surrounded by two C-band pulses. The SARmode processing makes use of these 64 echoes within each burst, and it allows narrowing the alongtrack resolution from a few km to about 300 m [19]. The reader can refer to other publications forfurther details on this the SAR mode altimetry [20–22].
Transponder calibration of Sentinel-3A in the SAR mode requires extensive processing ofindividual pulses within each burst as these were first received and retransmitted by the transponderand later received and recorded by the satellite altimeter in its orbit. In-house software has beendeveloped to process all these data for transponder calibration. It relies upon raw Sentinel-3 Level-0products along with raw telemetry data. A comprehensive block diagram of the essential and sequentialsteps involved in the processing of Level-0 products of Sentinel-3A for transponder calibration is givenin Figure 7.
Specifically, transponder calibration in the SAR mode consists of the following steps:
1. Data retrieval. The data necessary for the implementation of the transponder calibration processingare: (a) Sentinel-3A Level-0 binary products; (b) altimeter internal calibration files; (c) satelliteorbit navigation and attitude data; (d) auxiliary data, including Centre of Gravity (COG) and UltraStable Oscillator (USO) data; (e) accurate and absolute transponder’s measuring point coordinatesin relation to a reference coordinate system (i.e., ITRF 2014); (f) atmospheric delays (i.e., wet anddry troposphere, ionosphere) of altimeter signals and geophysical Level-2 corrections; (g) thetransponder’s internal path delay.
2. Waveform Calibration. This step includes the calibration of the Sentinel-3A Level-0 engineeringSAR data products using its internal calibration files (e.g., CAL1 for the time delay in the rangeinstrument correction, CAL2 to compensate distortions in the system transfer function on signalreturns, etc.).
3. Waveform retracking. Used for determining the measured altimeter range. Slant ranges betweenthe satellite and the transponder are computed by waveform retracking of the range compressedSAR data. An example of such a waveform is presented in Figure 8.

Remote Sens. 2018, 10, 1808 7 of 22Remote Sens. 2018, 10, x FOR PEER REVIEW 7 of 22
Figure 7. Flowchart of the transponder calibration developed for range and datation bias estimation of Sentinel-3A.
The measured altimeter range is given as the difference between the gate number (bin number) of the peak (maximum) of each pulse and the reference gate number set on the altimeter, multiplied by the actual “bin resolution” (in theory about 3.125 ns for the Ku-band pulse duration). For example, for Sentinel-3 the tracking point is gate 44, i.e., bin index is 43 for Ku-band, or gate 46, i.e., bin index 45 for C-band, as measuring starts from bin index zero (index = 0). Nonetheless, the effective range resolution with which the actual range is to be determined by the altimeter is driven by the width of the point target response recorded with 3dB, and included in its “Autocal” mode [23]. The measured altimeter distance 𝑅 between the satellite and the transponder, is given by: 𝑅 = 𝑅 + (𝐵 − 𝐵 ) 𝑐 𝜏2
where 𝑅 is the altimeter distance from the satellite to the Earth’s surface corrected for instrumental delays, such as Ultra Stable Oscillator frequency drift, internal path correction or Doppler correction (Called “tracker range”), 𝐵 is the bin number of the maximum signal return by the transponder, 𝐵 is the reference bin number, c is the speed of light, and 𝜏 is the pulse duration in seconds. The altimeter range bias is computed as measured minus theoretical altimeter range after corrections are applied.
Figure 7. Flowchart of the transponder calibration developed for range and datation bias estimationof Sentinel-3A.
The measured altimeter range is given as the difference between the gate number (bin number)of the peak (maximum) of each pulse and the reference gate number set on the altimeter,multiplied by the actual “bin resolution” (in theory about 3.125 ns for the Ku-band pulse duration).For example, for Sentinel-3 the tracking point is gate 44, i.e., bin index is 43 for Ku-band, or gate46, i.e., bin index 45 for C-band, as measuring starts from bin index zero (index = 0). Nonetheless,the effective range resolution with which the actual range is to be determined by the altimeter isdriven by the width of the point target response recorded with 3dB, and included in its “Autocal”mode [23]. The measured altimeter distance Rk between the satellite and the transponder, is given by:
Rk = Rtrc + (Bmax − B0)×cτp
2
where Rtrc is the altimeter distance from the satellite to the Earth’s surface corrected forinstrumental delays, such as Ultra Stable Oscillator frequency drift, internal path correctionor Doppler correction (Called “tracker range”), Bmax is the bin number of the maximum signalreturn by the transponder, B0 is the reference bin number, c is the speed of light, and τp is the

Remote Sens. 2018, 10, 1808 8 of 22
pulse duration in seconds. The altimeter range bias is computed as measured minus theoreticalaltimeter range after corrections are applied.
4. Corrections on the observed range. The altimeter range Rm, as reckoned in the previous step,is corrected for the following quantities: (a) troposphere and ionosphere delays caused by theatmosphere onto the altimeter’s signal; (b) difference between the satellite’s center of gravityand the altimeter’s effective center of measurement; (c) drift of the Ultra Stable Oscillator in thealtimeter; (d) internal delays of the associated instruments as the echo travels back and forth;(e) geophysical corrections (i.e., solid earth tides, etc.) at the transponder location; (f) Dopplercorrection from both altitude rate and velocity of the satellite.
5. Theoretical Range Estimation. The absolute Cartesian coordinates of the satellite (xk, yk, zk) as wellas of the transponder (X0, Y0, Z0) are, respectively, given by the satellite’s navigation files andby local geodetic surveys on the ground. Care should be taken to ensure that all coordinates referto the same geodetic reference frame of coordinates and time. The theoretical range ρk is thencalculated by the Euclidian distance between the satellite and the transponder:
ρk =
√(xk − X0)
2 + (yk −Y0)2 + (zk − Z0)
2
6. Range Bias Determination. Given the measured Rk and the theoretical range ρk betweenthe Sentinel-3A SRAL and the ground transponder, the range bias is estimated as “Bias =
Mean{k}[Rk − ρk], k = 1, 2, · · · , N”, after corrections for time-tagging offsets (datation) andDoppler-altitude slope are applied [20,21,23]. All in all, the Sentinel-3A level 0 products have beenused as input in the custom-made software to derive the SRAL altimeter’s absolute range bias.
Remote Sens. 2018, 10, x FOR PEER REVIEW 8 of 22
4. Corrections on the observed range. The altimeter range Rm, as reckoned in the previous step, is corrected for the following quantities: (a) troposphere and ionosphere delays caused by the atmosphere onto the altimeter’s signal; (b) difference between the satellite’s center of gravity and the altimeter’s effective center of measurement; (c) drift of the Ultra Stable Oscillator in the altimeter; (d) internal delays of the associated instruments as the echo travels back and forth; (e) geophysical corrections (i.e., solid earth tides, etc.) at the transponder location; (f) Doppler correction from both altitude rate and velocity of the satellite.
5. Theoretical Range Estimation. The absolute Cartesian coordinates of the satellite (𝑥 , 𝑦 , 𝑧 ) as well as of the transponder (𝑋 , 𝑌 , 𝑍 ) are, respectively, given by the satellite’s navigation files and by local geodetic surveys on the ground. Care should be taken to ensure that all coordinates refer to the same geodetic reference frame of coordinates and time. The theoretical range 𝜌 is then calculated by the Euclidian distance between the satellite and the transponder: 𝜌 = (𝑥 − 𝑋 ) + (𝑦 − 𝑌 ) + (𝑧 − 𝑍 )
6. Range Bias Determination. Given the measured 𝑅 and the theoretical range 𝜌 between the Sentinel-3A SRAL and the ground transponder, the range bias is estimated as “ 𝐵𝑖𝑎𝑠 =𝑀𝑒𝑎𝑛{ }[𝑅 − 𝜌 ], 𝑘 = 1, 2, ⋯ , 𝑁 ”, after corrections for time-tagging offsets (datation) and Doppler-altitude slope are applied [20,21,23]. All in all, the Sentinel-3A level 0 products have been used as input in the custom-made software to derive the SRAL altimeter’s absolute range bias.
Figure 8. This is an example of the Sentinel-3A signal responses generated by the transponder at the CDN1 Cal/Val site on 21 December 2017, at the mountains of West Crete. Calibrated Synthetic Aperture Radar (SAR) data, shown as a Fast Fourier Transform, are plotted against zero-padded samples and Ku-pulse index in Cycle No.26 of Sentinel-3A. The Pulse Repetition Internal for Sentinel-3A has been 17,800 Hz within a burst and the burst repetition interval is 80 Hz. Relative scale of signal magnitude is shown in color on the vertical bar (arbitrary units).
Overflights for Transponder Calibrations
The ascending Pass No.14 of Sentinel-3A flies over the CDN1 transponder Cal/Val site at 20:00:12 UTC. This event is repeated every 27 days as a result of polar orbits of this satellite. The first transponder calibration for Sentinel-3A commenced on 9 April 2016 (Cycle No.3). Since then, roughly 30 transponder calibrations have been carried out, with a success rate of 95% and clear transponder
Figure 8. This is an example of the Sentinel-3A signal responses generated by the transponder at theCDN1 Cal/Val site on 21 December 2017, at the mountains of West Crete. Calibrated Synthetic ApertureRadar (SAR) data, shown as a Fast Fourier Transform, are plotted against zero-padded samples andKu-pulse index in Cycle No.26 of Sentinel-3A. The Pulse Repetition Internal for Sentinel-3A has been17,800 Hz within a burst and the burst repetition interval is 80 Hz. Relative scale of signal magnitude isshown in color on the vertical bar (arbitrary units).
Overflights for Transponder Calibrations
The ascending Pass No.14 of Sentinel-3A flies over the CDN1 transponder Cal/Val site at 20:00:12UTC. This event is repeated every 27 days as a result of polar orbits of this satellite. The first transponder

Remote Sens. 2018, 10, 1808 9 of 22
calibration for Sentinel-3A commenced on 9 April 2016 (Cycle No.3). Since then, roughly 30 transpondercalibrations have been carried out, with a success rate of 95% and clear transponder responses on SRALrecords (Figure 9). Only two calibrations had to be canceled because of extreme weather conditions(4 January 2017, Cycle No.13) and site maintenance (8 August 2017, Cycle No.21).
Remote Sens. 2018, 10, x FOR PEER REVIEW 9 of 22
responses on SRAL records (Figure 9). Only two calibrations had to be canceled because of extreme weather conditions (4 January 2017, Cycle No.13) and site maintenance (8 August 2017, Cycle No.21).
After each satellite overpass, within 24-h, a movie presentation of the actual and continuous transponder response is created. This movie shows the transponder echo entering the tracking window, reaching its peak (maximum spike at the “point of closest approach”), and then leaving the tracking window (Figure 10).
Figure 9. Timeline of Sentinel-3A Pass No.14 transponder calibrations at the CDN1 Cal/Val site. Green boxes represent successful calibration, whereas red boxes correspond to two calibrations canceled as a consequence of extreme weather conditions (4 January 2017, Cycle No.13, Images above) and site maintenance (8 August 2017, Cycle No.21).
Figure 10. Screenshots of the transponder response movie for the Sentinel-3 Pass No.14 calibration on 8 April 2018. The transponder echo in the altimeters records as it enters (left), reaches its maximum (middle) and leaving (right) the tracking window. Similar echo movies are generated within 24 h after each satellite overpassed the CDN1 transponder Cal/Val site.
3.2. Sea-Surface Calibration
Altimetry calibration relying upon sea-surface heights has been customarily carried out in open seas though for the past few decades also in coastal regions and inland waters [24–27]. Calibrations usually take place where satellite observations are not contaminated by land. This has, up to now, been accomplished by setting up Cal/Val facilities on either small infrastructures at sea (oil platforms or calibrating instrumentation in shallow waters) or on coastal or islet sites next to open oceans where altimeters measure. In the first case, small-scale infrastructures do not contaminate the altimeter’s signal and are commonly located exactly under the satellite altimeter’s ground-track. In the second
Figure 9. Timeline of Sentinel-3A Pass No.14 transponder calibrations at the CDN1 Cal/Val site. Greenboxes represent successful calibration, whereas red boxes correspond to two calibrations canceled asa consequence of extreme weather conditions (4 January 2017, Cycle No.13, Images above) and sitemaintenance (8 August 2017, Cycle No.21).
After each satellite overpass, within 24-h, a movie presentation of the actual and continuoustransponder response is created. This movie shows the transponder echo entering the tracking window,reaching its peak (maximum spike at the “point of closest approach”), and then leaving the trackingwindow (Figure 10).
Remote Sens. 2018, 10, x FOR PEER REVIEW 9 of 22
responses on SRAL records (Figure 9). Only two calibrations had to be canceled because of extreme weather conditions (4 January 2017, Cycle No.13) and site maintenance (8 August 2017, Cycle No.21).
After each satellite overpass, within 24-h, a movie presentation of the actual and continuous transponder response is created. This movie shows the transponder echo entering the tracking window, reaching its peak (maximum spike at the “point of closest approach”), and then leaving the tracking window (Figure 10).
Figure 9. Timeline of Sentinel-3A Pass No.14 transponder calibrations at the CDN1 Cal/Val site. Green boxes represent successful calibration, whereas red boxes correspond to two calibrations canceled as a consequence of extreme weather conditions (4 January 2017, Cycle No.13, Images above) and site maintenance (8 August 2017, Cycle No.21).
Figure 10. Screenshots of the transponder response movie for the Sentinel-3 Pass No.14 calibration on 8 April 2018. The transponder echo in the altimeters records as it enters (left), reaches its maximum (middle) and leaving (right) the tracking window. Similar echo movies are generated within 24 h after each satellite overpassed the CDN1 transponder Cal/Val site.
3.2. Sea-Surface Calibration
Altimetry calibration relying upon sea-surface heights has been customarily carried out in open seas though for the past few decades also in coastal regions and inland waters [24–27]. Calibrations usually take place where satellite observations are not contaminated by land. This has, up to now, been accomplished by setting up Cal/Val facilities on either small infrastructures at sea (oil platforms or calibrating instrumentation in shallow waters) or on coastal or islet sites next to open oceans where altimeters measure. In the first case, small-scale infrastructures do not contaminate the altimeter’s signal and are commonly located exactly under the satellite altimeter’s ground-track. In the second
Figure 10. Screenshots of the transponder response movie for the Sentinel-3 Pass No.14 calibrationon 8 April 2018. The transponder echo in the altimeters records as it enters (left), reaches itsmaximum (middle) and leaving (right) the tracking window. Similar echo movies are generatedwithin 24 h after each satellite overpassed the CDN1 transponder Cal/Val site.
3.2. Sea-Surface Calibration
Altimetry calibration relying upon sea-surface heights has been customarily carried out in openseas though for the past few decades also in coastal regions and inland waters [24–27]. Calibrationsusually take place where satellite observations are not contaminated by land. This has, up to now,

Remote Sens. 2018, 10, 1808 10 of 22
been accomplished by setting up Cal/Val facilities on either small infrastructures at sea (oil platformsor calibrating instrumentation in shallow waters) or on coastal or islet sites next to open oceans wherealtimeters measure. In the first case, small-scale infrastructures do not contaminate the altimeter’ssignal and are commonly located exactly under the satellite altimeter’s ground-track. In the secondcase, coastal Cal/Val sites need to transfer the in-situ reference measurements to open sea wheresatellite measurements are valid.
The Harvest platform, USA [24] and Bass Strait, Australia [25] belong to the first category, whereasthe two European permanent Cal/Val facilities in Corsica, France [26] and Gavdos/Crete, Greece [27]represent the second category.
In the Gavdos/Crete Cal/Val facility, the sea-surface calibration has been implemented in searegions where the Sentinel-3 SRAL and MWR observations are not contaminated by land mass(Figure 11). The groundtrack of Pass No.14 of Sentinel-3A ascends west of Gavdos and continuesnorth to the other transponder Cal/Val site on the mountains of west Crete. This pass has beencalibrated using the transponder; however, before it reaches that site, it comes to pass west of theGavdos Cal/Val site where sea-surface calibration is put into action. Additionally, the other PassNo.335 of Sentinel-3A descends from southwest of Crete to south and intersects the Gavdos calibrationsite. Calibration values for this descending pass are also presented applying sea-surface calibrationand crossover analysis.
Remote Sens. 2018, 10, x FOR PEER REVIEW 10 of 22
case, coastal Cal/Val sites need to transfer the in-situ reference measurements to open sea where satellite measurements are valid.
The Harvest platform, USA [24] and Bass Strait, Australia [25] belong to the first category, whereas the two European permanent Cal/Val facilities in Corsica, France [26] and Gavdos/Crete, Greece [27] represent the second category.
In the Gavdos/Crete Cal/Val facility, the sea-surface calibration has been implemented in sea regions where the Sentinel-3 SRAL and MWR observations are not contaminated by land mass (Figure 11). The groundtrack of Pass No.14 of Sentinel-3A ascends west of Gavdos and continues north to the other transponder Cal/Val site on the mountains of west Crete. This pass has been calibrated using the transponder; however, before it reaches that site, it comes to pass west of the Gavdos Cal/Val site where sea-surface calibration is put into action. Additionally, the other Pass No.335 of Sentinel-3A descends from southwest of Crete to south and intersects the Gavdos calibration site. Calibration values for this descending pass are also presented applying sea-surface calibration and crossover analysis.
During the satellite overpass, the instantaneous sea-surface height at the reference Cal/Val location 𝑘 is established from tide gauge measurements and absolute geodetic heights. Given the satellite’s velocity (~7 km/s), the local tidal range and the tide gauge sampling (i.e., 6-min, 1-min), hourly values of the tide gauge measurements (centered to the satellite pass over the point-of-closest approach) are used to settle the value for the 𝑆𝑆𝐻(𝑘 ). Then, this value is transferred to open sea in the calibrating regions using reference models.
Figure 11. The shaded greenish areas represent the Sentinel-3A Pass No.14 (left, ascending) and Pass No.335 (right, descending) calibrating regions at the Gavdos sea-surface Cal/Val site.
Detailed and precise models have been constructed for the mean dynamic topography (𝑀𝐷𝑇) and geoid undulation (𝒩) in this region [28]. Models are often being validated as a matter of usual practice by means of dedicated boat campaigns. They are used to transfer 𝑆𝑆𝐻 from the Gavdos reference Cal/Val site to open seas [29,30], by first establishing its sea level anomaly (𝑆𝐿𝐴): 𝑆𝐿𝐴(𝑘 ) = 𝑆𝑆𝐻(𝑘 ) − 𝒩(𝑘 ) − 𝑀𝐷𝑇(𝑘 )
The sea level anomaly 𝑆𝐿𝐴(𝑘) is also required for altimeter calibration over the sea surface along the satellite’s track. Subsequently, at each satellite measuring point 𝑘 and in open seas, the following quantities are determined: (1) the Sea Surface Height 𝑆𝑆𝐻(𝑘), calculated as the difference between altitude and altimeter range, after corrections are applied, (2) the geoid height 𝒩(𝑘) above reference ellipsoid, and (3) the mean dynamic topography 𝑀𝐷𝑇(𝑘). Then, the estimated absolute sea-surface height bias for the altimeter can be computed as:
Figure 11. The shaded greenish areas represent the Sentinel-3A Pass No.14 (left, ascending) and PassNo.335 (right, descending) calibrating regions at the Gavdos sea-surface Cal/Val site.
During the satellite overpass, the instantaneous sea-surface height at the reference Cal/Vallocation k0 is established from tide gauge measurements and absolute geodetic heights. Given thesatellite’s velocity (~7 km/s), the local tidal range and the tide gauge sampling (i.e., 6-min, 1-min),hourly values of the tide gauge measurements (centered to the satellite pass over the point-of-closestapproach) are used to settle the value for the SSH(k0). Then, this value is transferred to open sea inthe calibrating regions using reference models.
Detailed and precise models have been constructed for the mean dynamic topography (MDT)and geoid undulation (N ) in this region [28]. Models are often being validated as a matter of usualpractice by means of dedicated boat campaigns. They are used to transfer SSH from the Gavdosreference Cal/Val site to open seas [29,30], by first establishing its sea level anomaly (SLA):
SLA(k0) = SSH(k0)−N (k0)−MDT(k0)

Remote Sens. 2018, 10, 1808 11 of 22
The sea level anomaly SLA(k) is also required for altimeter calibration over the sea surface alongthe satellite’s track. Subsequently, at each satellite measuring point k and in open seas, the followingquantities are determined: (1) the Sea Surface Height SSH(k), calculated as the difference betweenaltitude and altimeter range, after corrections are applied, (2) the geoid height N (k) above referenceellipsoid, and (3) the mean dynamic topography MDT(k). Then, the estimated absolute sea-surfaceheight bias for the altimeter can be computed as:
Bias(k) = SLA(k)− SLA(k0)
The bias per cycle for each Sentinel-3A Pass No.14 and Pass No.335 is thus determined.
Dataset for Sea-Surface Calibration
The Sentinel-3A Pass No.14 is an ascending pass, with groundtrack west of Gavdos. This meansthat just a few seconds before reaching from the south the CDN1 transponder Cal/Val site on themountains, the satellite makes its way up north from the sea, but 10–15 km west of the Gavdos(Figure 12 left). Additionally, the descending Sentinel-3A Pass No.335, coming from the north, crossesat a point on the island where the Gavdos Cal/Val facility is located, at about 08:47:00 UTC every27 days (Figure 12 right). At least two GNSS receivers, as well as three tide gauges, have beencontinuously operating at the Gavdos Cal/Val facility during these Sentinel-3A Passes. This helpsmaintain a high success rate for sea-surface calibrations (Figure 12).
Remote Sens. 2018, 10, x FOR PEER REVIEW 11 of 22
𝐵𝑖𝑎𝑠(𝑘) = 𝑆𝐿𝐴(𝑘) − 𝑆𝐿𝐴(𝑘 )
The bias per cycle for each Sentinel-3A Pass No.14 and Pass No.335 is thus determined.
Dataset for Sea-Surface Calibration
The Sentinel-3A Pass No.14 is an ascending pass, with groundtrack west of Gavdos. This means that just a few seconds before reaching from the south the CDN1 transponder Cal/Val site on the mountains, the satellite makes its way up north from the sea, but 10–15 km west of the Gavdos (Figure 12 left). Additionally, the descending Sentinel-3A Pass No.335, coming from the north, crosses at a point on the island where the Gavdos Cal/Val facility is located, at about 08:47:00 UTC every 27 days (Figure 12 right). At least two GNSS receivers, as well as three tide gauges, have been continuously operating at the Gavdos Cal/Val facility during these Sentinel-3A Passes. This helps maintain a high success rate for sea-surface calibrations (Figure 12).
Figure 12. Timeline of Sentinel-3A Pass No.335 sea-surface calibrations at the Gavdos Cal/Val site in west Crete, Greece. The green boxes illustrate days of satellite overpass and availability of sea-surface heights by the in-situ scientific instruments.
The data used for the sea-surface calibration of Sentinel-3A are SAR mode, Level 2 products, WAT data, Non-Time Critical orbits, and with Processing Baseline PB 2.2 and for its cycles 1–31 (June, 2018).
3.3. Crossover Analysis
Multi-mission crossover analysis provides relative but global calibration results and supports the discovery of geographically distributed error patterns [31]. This analysis was initially applied in [32], while a detailed description of this methodology is given in [33].
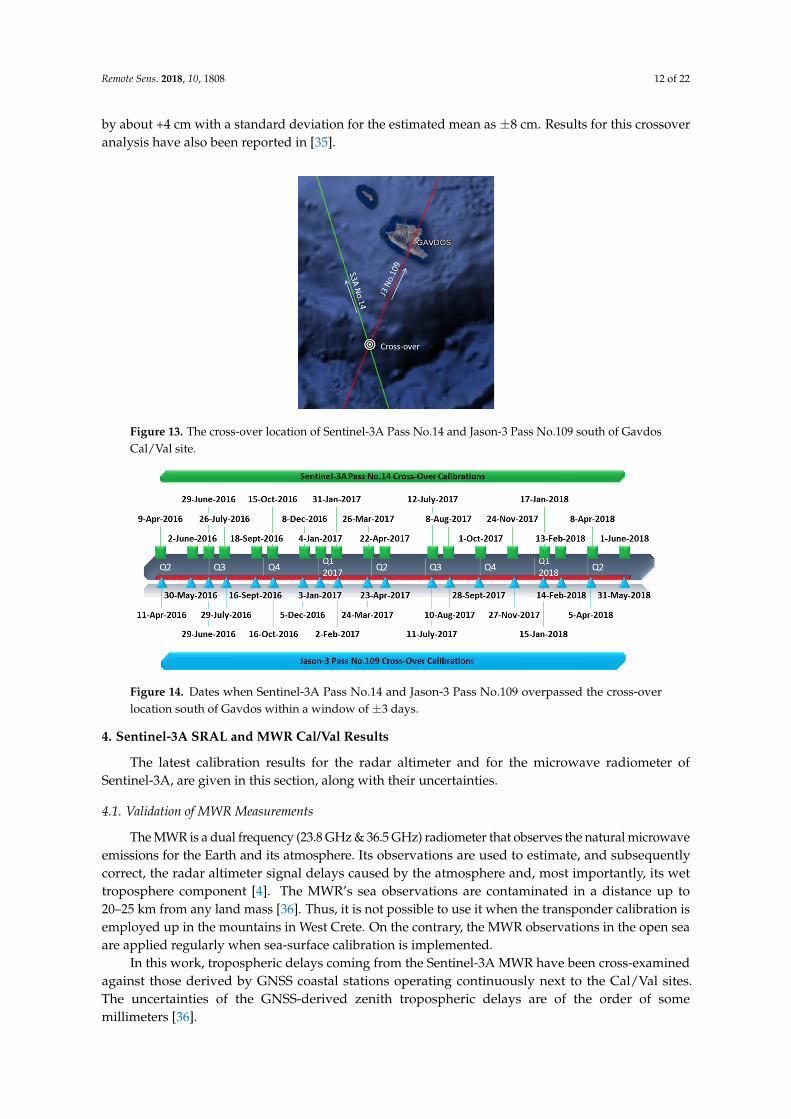
Additionally, a crossover analysis has been carried out with nearby cross-over points in the vicinity of the PFAC Cal/Val sites. The Sentinel-3A Pass No.14, for example, intersects with Jason-3 Pass No.109 about 20 km south of Gavdos (Figure 13). The analysis involves the examination of the sea-surface heights, as estimated by Sentinel-3A and Jason-3, when they overpass that crossover location within a window of ±3 days [34].
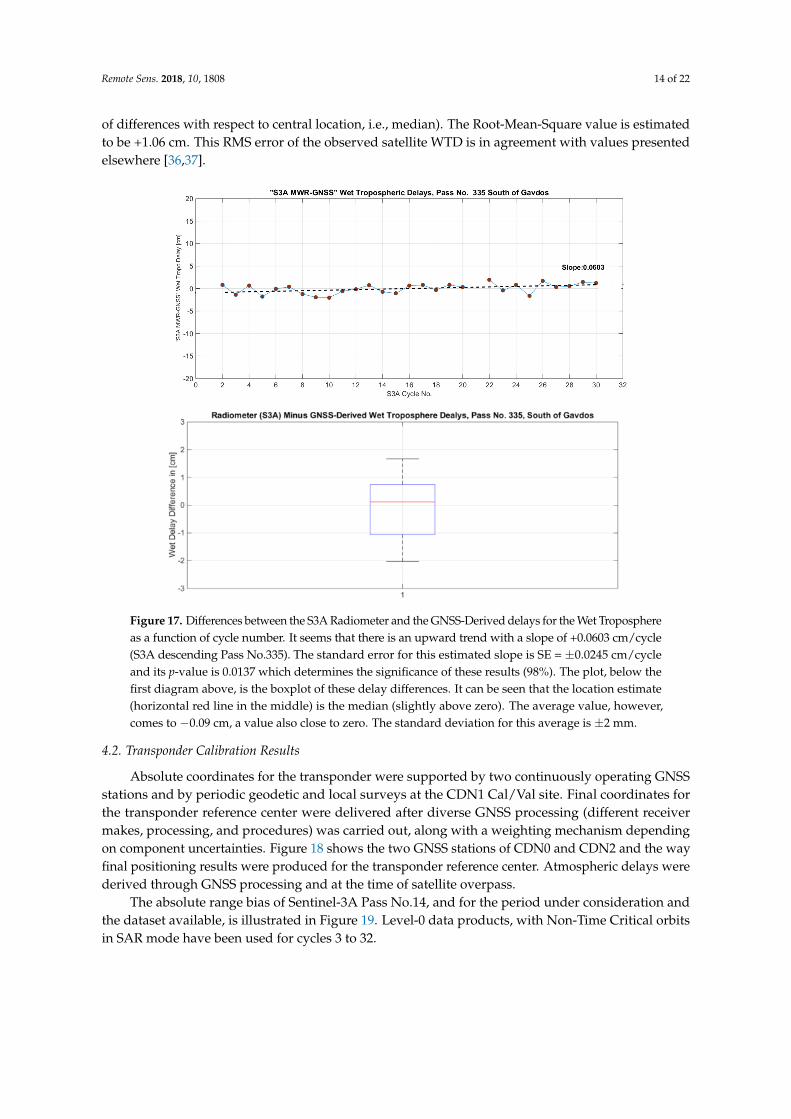
Dates of the crossovers as of April 2016 for both missions are briefly shown in Figure 14. An analysis of the sea-surface heights as estimated by the Sentinel-3A and Jason-3 altimeters at this crossover location indicates that Sentinel-3A measures heights higher than Jason-3 (i.e., S3A-JA3) by about +4 cm with a standard deviation for the estimated mean as ±8 cm. Results for this crossover analysis have also been reported in [35].
Figure 12. Timeline of Sentinel-3A Pass No.335 sea-surface calibrations at the Gavdos Cal/Val site inwest Crete, Greece. The green boxes illustrate days of satellite overpass and availability of sea-surfaceheights by the in-situ scientific instruments.
The data used for the sea-surface calibration of Sentinel-3A are SAR mode, Level 2 products, WATdata, Non-Time Critical orbits, and with Processing Baseline PB 2.2 and for its cycles 1–31 (June, 2018).
3.3. Crossover Analysis
Multi-mission crossover analysis provides relative but global calibration results and supports thediscovery of geographically distributed error patterns [31]. This analysis was initially applied in [32],while a detailed description of this methodology is given in [33].
Additionally, a crossover analysis has been carried out with nearby cross-over points in thevicinity of the PFAC Cal/Val sites. The Sentinel-3A Pass No.14, for example, intersects with Jason-3Pass No.109 about 20 km south of Gavdos (Figure 13). The analysis involves the examination ofthe sea-surface heights, as estimated by Sentinel-3A and Jason-3, when they overpass that crossoverlocation within a window of ±3 days [34].
Dates of the crossovers as of April 2016 for both missions are briefly shown in Figure 14.An analysis of the sea-surface heights as estimated by the Sentinel-3A and Jason-3 altimeters atthis crossover location indicates that Sentinel-3A measures heights higher than Jason-3 (i.e., S3A-JA3)
Remote Sens. 2018, 10, 1808 12 of 22
by about +4 cm with a standard deviation for the estimated mean as ±8 cm. Results for this crossoveranalysis have also been reported in [35].Remote Sens. 2018, 10, x FOR PEER REVIEW 12 of 22
Figure 13. The cross-over location of Sentinel-3A Pass No.14 and Jason-3 Pass No.109 south of Gavdos Cal/Val site.
Figure 14. Dates when Sentinel-3A Pass No.14 and Jason-3 Pass No.109 overpassed the cross-over location south of Gavdos within a window of ±3 days.
4. Sentinel-3A SRAL and MWR Cal/Val Results
The latest calibration results for the radar altimeter and for the microwave radiometer of Sentinel-3A, are given in this section, along with their uncertainties.
4.1. Validation of MWR Measurements
The MWR is a dual frequency (23.8 GHz & 36.5 GHz) radiometer that observes the natural microwave emissions for the Earth and its atmosphere. Its observations are used to estimate, and subsequently correct, the radar altimeter signal delays caused by the atmosphere and, most importantly, its wet troposphere component [4]. The MWR’s sea observations are contaminated in a distance up to 20–25 km from any land mass [36]. Thus, it is not possible to use it when the transponder calibration is employed up in the mountains in West Crete. On the contrary, the MWR observations in the open sea are applied regularly when sea-surface calibration is implemented.
In this work, tropospheric delays coming from the Sentinel-3A MWR have been cross-examined against those derived by GNSS coastal stations operating continuously next to the Cal/Val sites. The uncertainties of the GNSS-derived zenith tropospheric delays are of the order of some millimeters [36].
The dry troposphere and ionosphere delay may be retrieved with accuracy (<1 cm) from global models as their temporal variation is quite small. This is not the case for the wet troposphere delays: these cannot be modeled flawlessly as they change rapidly over time and exhibit values of several cm (e.g., 5–15 cm in wet troposphere over several hours). Hence, the meteorological parameters of
Figure 13. The cross-over location of Sentinel-3A Pass No.14 and Jason-3 Pass No.109 south of GavdosCal/Val site.
Remote Sens. 2018, 10, x FOR PEER REVIEW 12 of 22
Figure 13. The cross-over location of Sentinel-3A Pass No.14 and Jason-3 Pass No.109 south of Gavdos Cal/Val site.
Figure 14. Dates when Sentinel-3A Pass No.14 and Jason-3 Pass No.109 overpassed the cross-over location south of Gavdos within a window of ±3 days.
4. Sentinel-3A SRAL and MWR Cal/Val Results
The latest calibration results for the radar altimeter and for the microwave radiometer of Sentinel-3A, are given in this section, along with their uncertainties.
4.1. Validation of MWR Measurements
The MWR is a dual frequency (23.8 GHz & 36.5 GHz) radiometer that observes the natural microwave emissions for the Earth and its atmosphere. Its observations are used to estimate, and subsequently correct, the radar altimeter signal delays caused by the atmosphere and, most importantly, its wet troposphere component [4]. The MWR’s sea observations are contaminated in a distance up to 20–25 km from any land mass [36]. Thus, it is not possible to use it when the transponder calibration is employed up in the mountains in West Crete. On the contrary, the MWR observations in the open sea are applied regularly when sea-surface calibration is implemented.
In this work, tropospheric delays coming from the Sentinel-3A MWR have been cross-examined against those derived by GNSS coastal stations operating continuously next to the Cal/Val sites. The uncertainties of the GNSS-derived zenith tropospheric delays are of the order of some millimeters [36].
The dry troposphere and ionosphere delay may be retrieved with accuracy (<1 cm) from global models as their temporal variation is quite small. This is not the case for the wet troposphere delays: these cannot be modeled flawlessly as they change rapidly over time and exhibit values of several cm (e.g., 5–15 cm in wet troposphere over several hours). Hence, the meteorological parameters of
Figure 14. Dates when Sentinel-3A Pass No.14 and Jason-3 Pass No.109 overpassed the cross-overlocation south of Gavdos within a window of ±3 days.
4. Sentinel-3A SRAL and MWR Cal/Val Results
The latest calibration results for the radar altimeter and for the microwave radiometer ofSentinel-3A, are given in this section, along with their uncertainties.
4.1. Validation of MWR Measurements
The MWR is a dual frequency (23.8 GHz & 36.5 GHz) radiometer that observes the natural microwaveemissions for the Earth and its atmosphere. Its observations are used to estimate, and subsequentlycorrect, the radar altimeter signal delays caused by the atmosphere and, most importantly, its wettroposphere component [4]. The MWR’s sea observations are contaminated in a distance up to20–25 km from any land mass [36]. Thus, it is not possible to use it when the transponder calibration isemployed up in the mountains in West Crete. On the contrary, the MWR observations in the open seaare applied regularly when sea-surface calibration is implemented.
In this work, tropospheric delays coming from the Sentinel-3A MWR have been cross-examinedagainst those derived by GNSS coastal stations operating continuously next to the Cal/Val sites.The uncertainties of the GNSS-derived zenith tropospheric delays are of the order of somemillimeters [36].

Remote Sens. 2018, 10, 1808 13 of 22
The dry troposphere and ionosphere delay may be retrieved with accuracy (<1 cm) from globalmodels as their temporal variation is quite small. This is not the case for the wet troposphere delays:these cannot be modeled flawlessly as they change rapidly over time and exhibit values of severalcm (e.g., 5–15 cm in wet troposphere over several hours). Hence, the meteorological parametersof temperature, pressure, and humidity are continuously monitored at the PFAC Cal/Val sites.Furthermore, it has been observed that different GNSS processing software (i.e., GAMIT, Bernese,and GIPSY) may produce slightly different values for the troposphere at times, depending on thealgorithms applied and their model resolutions (see Figure 15 as a demonstration example).
Remote Sens. 2018, 10, x FOR PEER REVIEW 13 of 22
temperature, pressure, and humidity are continuously monitored at the PFAC Cal/Val sites. Furthermore, it has been observed that different GNSS processing software (i.e., GAMIT, Bernese, and GIPSY) may produce slightly different values for the troposphere at times, depending on the algorithms applied and their model resolutions (see Figure 15 as a demonstration example).
Figure 15. An example, of the Zenith Wet Troposphere Delay in mm as derived by GNSS processing with GAMIT (left) and GIPSY (right) scientific software for 12 July 2017 at the transponder CDN1 Cal/Val site.
The wet tropospheric corrections (WTC) as produced by Sentinel-3 radiometer, along Pass No.335, have been compared against corrections derived by GNSS processing. Satellite measurements that are flagged as invalid have not been taken into evaluation. The individual radiometer WTC profiles along-track of each cycle of Sentinel-3A have been plotted with respect to distance from the point of closest approach in Gavdos and are shown in Figure 16. The central red line represents a moving median within a window of 15 km of radiometer values as a function of distance. Positive distance denotes north of Gavdos, while negative distance stands for locations south of Gavdos.
Figure 16. Profiles of Zenith Wet Troposphere Corrections in cm, as observed by the S3A radiometer for cycles 1–30, along the descending Pass No.335, starting off north of Crete and converging south onto the Gavdos Cal/Val site (Please see Figure 12, S3A descending Pass No.335, right mage).
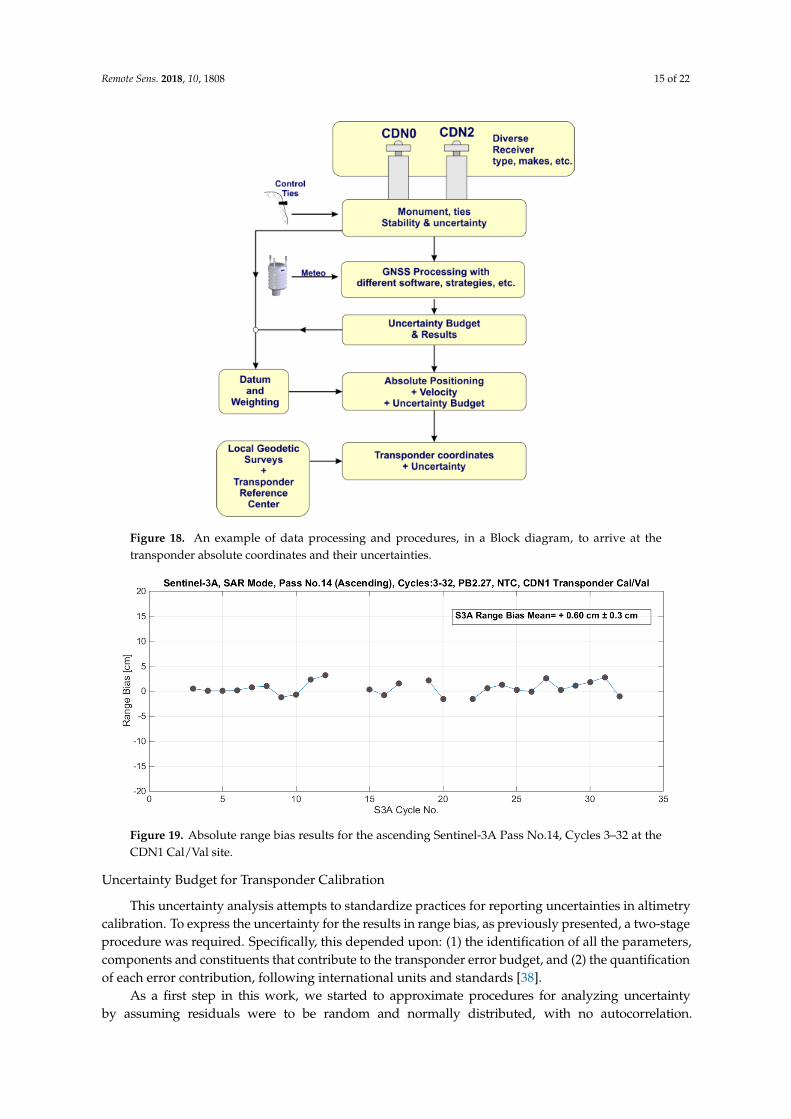
Then, the wet tropospheric delays, as determined by the S3A radiometer, were compared against those derived from the GNSS monitoring stations in Gavdos. Comparisons have been made between the last valid value of the radiometer, about 15–20 south of Gavdos (depending on the S3A pass), and the value produced at the reference GNSS sites in Gavdos, at the same time. It seems that there is an upward trend in the plot of Figure 17 with a slope of +0.0603 cm/cycle (98% significance). The average value of that difference in the wet troposphere delays comes to −0.09 cm, a value very close to zero. The standard deviation for its average is ±2 mm. Additionally, a certain larger number of differences seem to be negative rather than positive (lower plot of Figure 17, asymmetrical distribution of differences with respect to central location, i.e., median). The Root-Mean-Square value is estimated to be +1.06 cm. This RMS error of the observed satellite WTD is in agreement with values presented elsewhere [36,37].
Figure 15. An example, of the Zenith Wet Troposphere Delay in mm as derived by GNSS processingwith GAMIT (left) and GIPSY (right) scientific software for 12 July 2017 at the transponder CDN1Cal/Val site.
The wet tropospheric corrections (WTC) as produced by Sentinel-3 radiometer, along Pass No.335,have been compared against corrections derived by GNSS processing. Satellite measurements thatare flagged as invalid have not been taken into evaluation. The individual radiometer WTC profilesalong-track of each cycle of Sentinel-3A have been plotted with respect to distance from the pointof closest approach in Gavdos and are shown in Figure 16. The central red line represents a movingmedian within a window of 15 km of radiometer values as a function of distance. Positive distancedenotes north of Gavdos, while negative distance stands for locations south of Gavdos.
Remote Sens. 2018, 10, x FOR PEER REVIEW 13 of 22
temperature, pressure, and humidity are continuously monitored at the PFAC Cal/Val sites. Furthermore, it has been observed that different GNSS processing software (i.e., GAMIT, Bernese, and GIPSY) may produce slightly different values for the troposphere at times, depending on the algorithms applied and their model resolutions (see Figure 15 as a demonstration example).
Figure 15. An example, of the Zenith Wet Troposphere Delay in mm as derived by GNSS processing with GAMIT (left) and GIPSY (right) scientific software for 12 July 2017 at the transponder CDN1 Cal/Val site.
The wet tropospheric corrections (WTC) as produced by Sentinel-3 radiometer, along Pass No.335, have been compared against corrections derived by GNSS processing. Satellite measurements that are flagged as invalid have not been taken into evaluation. The individual radiometer WTC profiles along-track of each cycle of Sentinel-3A have been plotted with respect to distance from the point of closest approach in Gavdos and are shown in Figure 16. The central red line represents a moving median within a window of 15 km of radiometer values as a function of distance. Positive distance denotes north of Gavdos, while negative distance stands for locations south of Gavdos.
Figure 16. Profiles of Zenith Wet Troposphere Corrections in cm, as observed by the S3A radiometer for cycles 1–30, along the descending Pass No.335, starting off north of Crete and converging south onto the Gavdos Cal/Val site (Please see Figure 12, S3A descending Pass No.335, right mage).
Then, the wet tropospheric delays, as determined by the S3A radiometer, were compared against those derived from the GNSS monitoring stations in Gavdos. Comparisons have been made between the last valid value of the radiometer, about 15–20 south of Gavdos (depending on the S3A pass), and the value produced at the reference GNSS sites in Gavdos, at the same time. It seems that there is an upward trend in the plot of Figure 17 with a slope of +0.0603 cm/cycle (98% significance). The average value of that difference in the wet troposphere delays comes to −0.09 cm, a value very close to zero. The standard deviation for its average is ±2 mm. Additionally, a certain larger number of differences seem to be negative rather than positive (lower plot of Figure 17, asymmetrical distribution of differences with respect to central location, i.e., median). The Root-Mean-Square value is estimated to be +1.06 cm. This RMS error of the observed satellite WTD is in agreement with values presented elsewhere [36,37].
Figure 16. Profiles of Zenith Wet Troposphere Corrections in cm, as observed by the S3A radiometerfor cycles 1–30, along the descending Pass No.335, starting off north of Crete and converging southonto the Gavdos Cal/Val site (Please see Figure 12, S3A descending Pass No.335, right mage).
Then, the wet tropospheric delays, as determined by the S3A radiometer, were compared againstthose derived from the GNSS monitoring stations in Gavdos. Comparisons have been made betweenthe last valid value of the radiometer, about 15–20 south of Gavdos (depending on the S3A pass),and the value produced at the reference GNSS sites in Gavdos, at the same time. It seems that thereis an upward trend in the plot of Figure 17 with a slope of +0.0603 cm/cycle (98% significance).The average value of that difference in the wet troposphere delays comes to −0.09 cm, a value veryclose to zero. The standard deviation for its average is±2 mm. Additionally, a certain larger number ofdifferences seem to be negative rather than positive (lower plot of Figure 17, asymmetrical distribution
Remote Sens. 2018, 10, 1808 14 of 22
of differences with respect to central location, i.e., median). The Root-Mean-Square value is estimatedto be +1.06 cm. This RMS error of the observed satellite WTD is in agreement with values presentedelsewhere [36,37].Remote Sens. 2018, 10, x FOR PEER REVIEW 14 of 22
Figure 17. Differences between the S3A Radiometer and the GNSS-Derived delays for the Wet Troposphere as a function of cycle number. It seems that there is an upward trend with a slope of +0.0603 cm/cycle (S3A descending Pass No.335). The standard error for this estimated slope is SE = ±0.0245 cm/cycle and its p-value is 0.0137 which determines the significance of these results (98%). The plot, below the first diagram above, is the boxplot of these delay differences. It can be seen that the location estimate (horizontal red line in the middle) is the median (slightly above zero). The average value, however, comes to −0.09 cm, a value also close to zero. The standard deviation for this average is ±2 mm.
4.2. Transponder Calibration Results
Absolute coordinates for the transponder were supported by two continuously operating GNSS stations and by periodic geodetic and local surveys at the CDN1 Cal/Val site. Final coordinates for the transponder reference center were delivered after diverse GNSS processing (different receiver makes, processing, and procedures) was carried out, along with a weighting mechanism depending on component uncertainties. Figure 18 shows the two GNSS stations of CDN0 and CDN2 and the way final positioning results were produced for the transponder reference center. Atmospheric delays were derived through GNSS processing and at the time of satellite overpass.
Figure 17. Differences between the S3A Radiometer and the GNSS-Derived delays for the Wet Troposphereas a function of cycle number. It seems that there is an upward trend with a slope of +0.0603 cm/cycle(S3A descending Pass No.335). The standard error for this estimated slope is SE = ±0.0245 cm/cycleand its p-value is 0.0137 which determines the significance of these results (98%). The plot, below thefirst diagram above, is the boxplot of these delay differences. It can be seen that the location estimate(horizontal red line in the middle) is the median (slightly above zero). The average value, however,comes to −0.09 cm, a value also close to zero. The standard deviation for this average is ±2 mm.
4.2. Transponder Calibration Results
Absolute coordinates for the transponder were supported by two continuously operating GNSSstations and by periodic geodetic and local surveys at the CDN1 Cal/Val site. Final coordinates forthe transponder reference center were delivered after diverse GNSS processing (different receivermakes, processing, and procedures) was carried out, along with a weighting mechanism dependingon component uncertainties. Figure 18 shows the two GNSS stations of CDN0 and CDN2 and the wayfinal positioning results were produced for the transponder reference center. Atmospheric delays werederived through GNSS processing and at the time of satellite overpass.
The absolute range bias of Sentinel-3A Pass No.14, and for the period under consideration andthe dataset available, is illustrated in Figure 19. Level-0 data products, with Non-Time Critical orbitsin SAR mode have been used for cycles 3 to 32.
Remote Sens. 2018, 10, 1808 15 of 22Remote Sens. 2018, 10, x FOR PEER REVIEW 15 of 22
Figure 18. An example of data processing and procedures, in a Block diagram, to arrive at the transponder absolute coordinates and their uncertainties.
The absolute range bias of Sentinel-3A Pass No.14, and for the period under consideration and the dataset available, is illustrated in Figure 19. Level-0 data products, with Non-Time Critical orbits in SAR mode have been used for cycles 3 to 32.
Figure 19. Absolute range bias results for the ascending Sentinel-3A Pass No.14, Cycles 3–32 at the CDN1 Cal/Val site.
Uncertainty Budget for Transponder Calibration
This uncertainty analysis attempts to standardize practices for reporting uncertainties in altimetry calibration. To express the uncertainty for the results in range bias, as previously presented, a two-stage procedure was required. Specifically, this depended upon: (1) the identification of all the
Figure 18. An example of data processing and procedures, in a Block diagram, to arrive at thetransponder absolute coordinates and their uncertainties.
Remote Sens. 2018, 10, x FOR PEER REVIEW 15 of 22
Figure 18. An example of data processing and procedures, in a Block diagram, to arrive at the transponder absolute coordinates and their uncertainties.
The absolute range bias of Sentinel-3A Pass No.14, and for the period under consideration and the dataset available, is illustrated in Figure 19. Level-0 data products, with Non-Time Critical orbits in SAR mode have been used for cycles 3 to 32.
Figure 19. Absolute range bias results for the ascending Sentinel-3A Pass No.14, Cycles 3–32 at the CDN1 Cal/Val site.
Uncertainty Budget for Transponder Calibration
This uncertainty analysis attempts to standardize practices for reporting uncertainties in altimetry calibration. To express the uncertainty for the results in range bias, as previously presented, a two-stage procedure was required. Specifically, this depended upon: (1) the identification of all the
Figure 19. Absolute range bias results for the ascending Sentinel-3A Pass No.14, Cycles 3–32 at theCDN1 Cal/Val site.
Uncertainty Budget for Transponder Calibration
This uncertainty analysis attempts to standardize practices for reporting uncertainties in altimetrycalibration. To express the uncertainty for the results in range bias, as previously presented, a two-stageprocedure was required. Specifically, this depended upon: (1) the identification of all the parameters,components and constituents that contribute to the transponder error budget, and (2) the quantificationof each error contribution, following international units and standards [38].
As a first step in this work, we started to approximate procedures for analyzing uncertaintyby assuming residuals were to be random and normally distributed, with no autocorrelation.

Remote Sens. 2018, 10, 1808 16 of 22
The International Standards Organization Guide to Uncertainty in Measurement [38] classifies elementaluncertainties in two categories: Type A and Type B. Uncertainties that can be evaluated by statisticalmethods are treated as Type A uncertainties, and those evaluated by any other means (scientificjudgment, previous measurement data, experience of the behavior of instruments, manufacturer’sspecifications, data provided in calibration and other reports, uncertainties assigned to reference datataken from handbooks, etc.), are treated as Type B uncertainties. Type B error constituents [38,39],are commonly built up step by step and gradually based on knowledge accumulated from priormeasurements, instrument certificates, scientific knowledge, etc.
The standard uncertainty for each error constituent is formed by combining uncertainties quotedin different ways (Type A and Type B errors, see for details [40]), and by starting off, at this initialstage in transponder calibration, with the following assumptions: (a) The error constituents for thetransponder internal delay and the GNSS antenna reference point were to follow a normal distributions,and (b) all the rest error constituents followed a uniform distribution. All constituents of error sourcesin transponder calibration were identified, and thus, an estimation of their variance is presented.Uncertainties were in that manner appraised for every individual constituent, and later, we integratedthem to determine the more complex and final uncertainty for the reported calibration results. Table 1presents such an uncertainty budget for the transponder calibration following this analysis [38].
Table 1. Uncertainty budget for the transponder calibration, following the International StandardsOrganization “Guide to the Expression of Uncertainty in Measurement” [38].
Contributing Error Constituent Error Type Variance Estimate Standard Uncertainty
Measured range B 3.00 mm ±1.73 mmTransponder Internal Delay B 30.00 mm ±15.00 mmDry Tropospheric Delay B 2.00 mm ±1.16 mmWet Tropospheric Delay B 14.00 mm ±8.10 mmIonospheric Delay B 4.00 mm ±2.31 mmGeophysical corrections B 20.00 mm ±11.60 mmSatellite orbit height B 50.00 mm ±29.00 mmPseudo-Doppler correction B 2.00 mm ±1.16 mmGNSS instrument B 6.00 mm ±3.50 mmGNSS antenna reference point B 4.00 mm ±2.00 mmGNSS repeatability A 6.00 mm ±0.17 mmGNSS-Transponder Leveling A 1.00 mm ±0.18 mmLevelling instrument/method B 1.00 mm ±0.60 mmProcessing & Approximations B 30.00 mm ±17.34 mmOrbit Interpolations B 0.30 mm ±0.17 mmUnaccounted effects B 20.00 mm ±11.60 mmRoot-Sum Squared (Combined) ±41.50 mm
With those error values presented in Table 1, the combined (root-sum-squared uncertainty) andthe expanded uncertainty (standardized at 95% confidence level) were calculated to be ±41.5 mm and±81.3 mm (k[0.005] = 1.96 at 95% with normality, k[α] is called the 100α percentage point or coefficient),respectively. These values correspond to the Sentinel-3A Pass No.14 transponder calibration at theCDN1 Cal/Val site. As soon as supplementary knowledge is accumulated later on, this table has to beiterated and updated with improved values for each error constituent and its uncertainty.
4.3. Sea-Surface Calibration Results
The latest Sentinel-3A sea-surface height Cal/Val results are given in Figure 20 for the ascendingPass No.14 and the descending Pass No.335. It can be seen that the SSH bias along the ascending PassNo.14 is estimated to be −0.12 cm, while the descending Pass No.335 gave an SSH bias of −1.20 cm(N ≈ 30). Both of these results carry a standard deviation for their internal dispersion of about ±5 mm.These figures are to improve in confidence as soon as more calibrations are carried out.

Remote Sens. 2018, 10, 1808 17 of 22
Remote Sens. 2018, 10, x FOR PEER REVIEW 17 of 22
4.3. Sea-Surface Calibration Results
The latest Sentinel-3A sea-surface height Cal/Val results are given in Figure 20 for the ascending Pass No.14 and the descending Pass No.335. It can be seen that the SSH bias along the ascending Pass No.14 is estimated to be −0.12 cm, while the descending Pass No.335 gave an SSH bias of −1.20 cm (N ≈ 30). Both of these results carry a standard deviation for their internal dispersion of about ±5 mm. These figures are to improve in confidence as soon as more calibrations are carried out.
Figure 20. Sea-surface height biases for the ascending Pass No.14 (up) and descending (down) Pass No.335 of Sentinel-3A, as estimated by the Gavdos Cal/Val site.
Uncertainty Budget for Sea-Surface Calibration
By the same token, to estimate uncertainty of results in sea-surface calibration, the following main error components were identified [39]: (1) Cal/Val site coordinate determination. This group identified possible errors induced by the GNSS receiver, its antenna, ground stability, local setting, geodetic control ties, unaccounted effects, etc., and, by GNSS processing and data rectification strategies, to arrive at the absolute geodetic coordinates of the Cal/Val site. (2) Sea-surface height at Cal/Val site. The determination of the sea level at the Cal/Val site in an earth-centered earth-fixed reference system involved several error constituents related to water level observations (made by tide gauges), local conditions, models, for example for significant wave heights [41], setting and measuring and sampling strategies, instrument, monumentation and setting, ground deformation, earth tides, thermal expansion, atmospheric loading, local effects, reference time and coordinate frame for site positioning, etc., and to field leveling surveys when connecting water level records with absolute coordinates of reference site. (3) Local Reference Surfaces. The determination of sea level anomaly constituted the procedure with the largest uncertainty contribution in the sea-surface calibration. This was accomplished by dissecting the way models were applied for transferring
Figure 20. Sea-surface height biases for the ascending Pass No.14 (up) and descending (down) PassNo.335 of Sentinel-3A, as estimated by the Gavdos Cal/Val site.
Uncertainty Budget for Sea-Surface Calibration
By the same token, to estimate uncertainty of results in sea-surface calibration, the following mainerror components were identified [39]: (1) Cal/Val site coordinate determination. This group identifiedpossible errors induced by the GNSS receiver, its antenna, ground stability, local setting, geodeticcontrol ties, unaccounted effects, etc., and, by GNSS processing and data rectification strategies,to arrive at the absolute geodetic coordinates of the Cal/Val site. (2) Sea-surface height at Cal/Valsite. The determination of the sea level at the Cal/Val site in an earth-centered earth-fixed referencesystem involved several error constituents related to water level observations (made by tide gauges),local conditions, models, for example for significant wave heights [41], setting and measuring andsampling strategies, instrument, monumentation and setting, ground deformation, earth tides, thermalexpansion, atmospheric loading, local effects, reference time and coordinate frame for site positioning,etc., and to field leveling surveys when connecting water level records with absolute coordinatesof reference site. (3) Local Reference Surfaces. The determination of sea level anomaly constitutedthe procedure with the largest uncertainty contribution in the sea-surface calibration. This wasaccomplished by dissecting the way models were applied for transferring heights from the Cal/Valsite to open ocean using Mean Sea Surface, Mean Dynamic Topography, and geoid models, as wellas the way their each individual uncertainty is combined to arrive at the final result for sea-surfacecalibration. (4) Cal/Val processing and transformations. The errors induced by the calibration processingand technique and the technique followed to transfer the coastal sea-surface height to the open seawere taken into consideration in this category. (5) Unaccounted effects. Additional effects which werenot taken care of in the previous description.
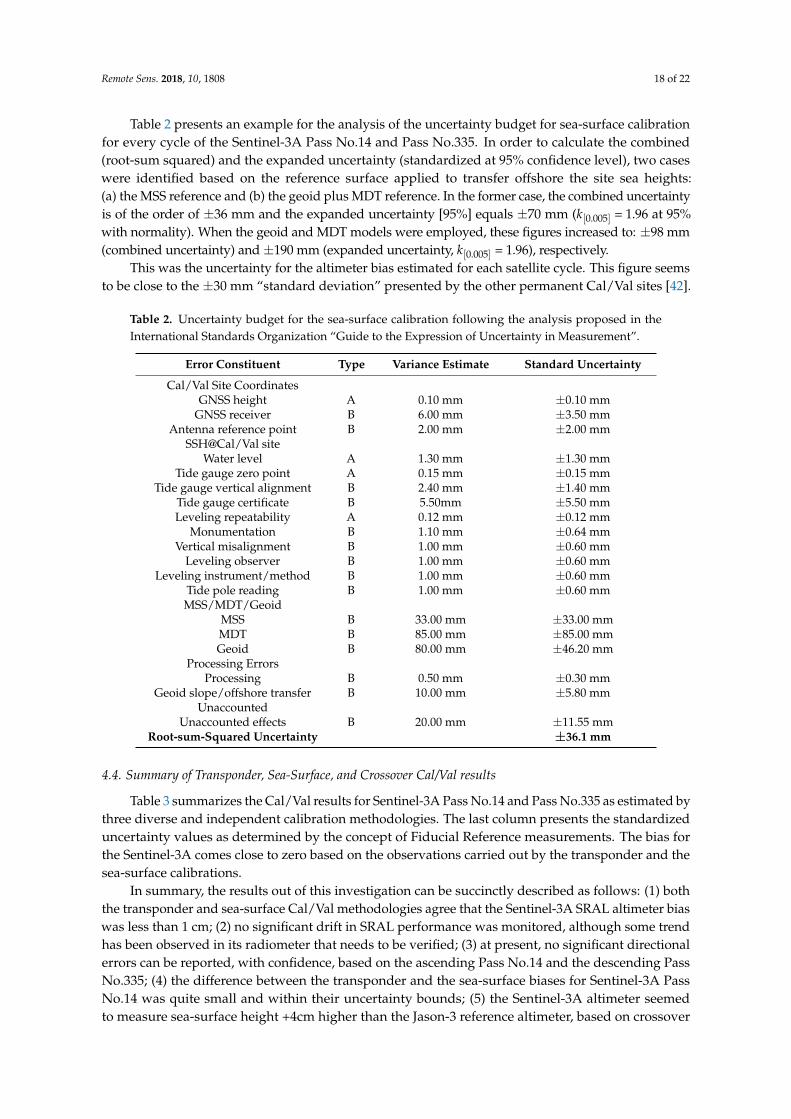
Remote Sens. 2018, 10, 1808 18 of 22
Table 2 presents an example for the analysis of the uncertainty budget for sea-surface calibrationfor every cycle of the Sentinel-3A Pass No.14 and Pass No.335. In order to calculate the combined(root-sum squared) and the expanded uncertainty (standardized at 95% confidence level), two caseswere identified based on the reference surface applied to transfer offshore the site sea heights:(a) the MSS reference and (b) the geoid plus MDT reference. In the former case, the combined uncertaintyis of the order of ±36 mm and the expanded uncertainty [95%] equals ±70 mm (k[0.005] = 1.96 at 95%with normality). When the geoid and MDT models were employed, these figures increased to: ±98 mm(combined uncertainty) and ±190 mm (expanded uncertainty, k[0.005] = 1.96), respectively.
This was the uncertainty for the altimeter bias estimated for each satellite cycle. This figure seemsto be close to the ±30 mm “standard deviation” presented by the other permanent Cal/Val sites [42].
Table 2. Uncertainty budget for the sea-surface calibration following the analysis proposed in theInternational Standards Organization “Guide to the Expression of Uncertainty in Measurement”.
Error Constituent Type Variance Estimate Standard Uncertainty
Cal/Val Site CoordinatesGNSS height A 0.10 mm ±0.10 mm
GNSS receiver B 6.00 mm ±3.50 mmAntenna reference point B 2.00 mm ±2.00 mm
SSH@Cal/Val siteWater level A 1.30 mm ±1.30 mm
Tide gauge zero point A 0.15 mm ±0.15 mmTide gauge vertical alignment B 2.40 mm ±1.40 mm
Tide gauge certificate B 5.50mm ±5.50 mmLeveling repeatability A 0.12 mm ±0.12 mm
Monumentation B 1.10 mm ±0.64 mmVertical misalignment B 1.00 mm ±0.60 mm
Leveling observer B 1.00 mm ±0.60 mmLeveling instrument/method B 1.00 mm ±0.60 mm
Tide pole reading B 1.00 mm ±0.60 mmMSS/MDT/Geoid
MSS B 33.00 mm ±33.00 mmMDT B 85.00 mm ±85.00 mmGeoid B 80.00 mm ±46.20 mm
Processing ErrorsProcessing B 0.50 mm ±0.30 mm
Geoid slope/offshore transfer B 10.00 mm ±5.80 mmUnaccounted
Unaccounted effects B 20.00 mm ±11.55 mmRoot-sum-Squared Uncertainty ±36.1 mm
4.4. Summary of Transponder, Sea-Surface, and Crossover Cal/Val results
Table 3 summarizes the Cal/Val results for Sentinel-3A Pass No.14 and Pass No.335 as estimated bythree diverse and independent calibration methodologies. The last column presents the standardizeduncertainty values as determined by the concept of Fiducial Reference measurements. The bias forthe Sentinel-3A comes close to zero based on the observations carried out by the transponder and thesea-surface calibrations.
In summary, the results out of this investigation can be succinctly described as follows: (1) boththe transponder and sea-surface Cal/Val methodologies agree that the Sentinel-3A SRAL altimeter biaswas less than 1 cm; (2) no significant drift in SRAL performance was monitored, although some trendhas been observed in its radiometer that needs to be verified; (3) at present, no significant directionalerrors can be reported, with confidence, based on the ascending Pass No.14 and the descending PassNo.335; (4) the difference between the transponder and the sea-surface biases for Sentinel-3A PassNo.14 was quite small and within their uncertainty bounds; (5) the Sentinel-3A altimeter seemedto measure sea-surface height +4cm higher than the Jason-3 reference altimeter, based on crossover
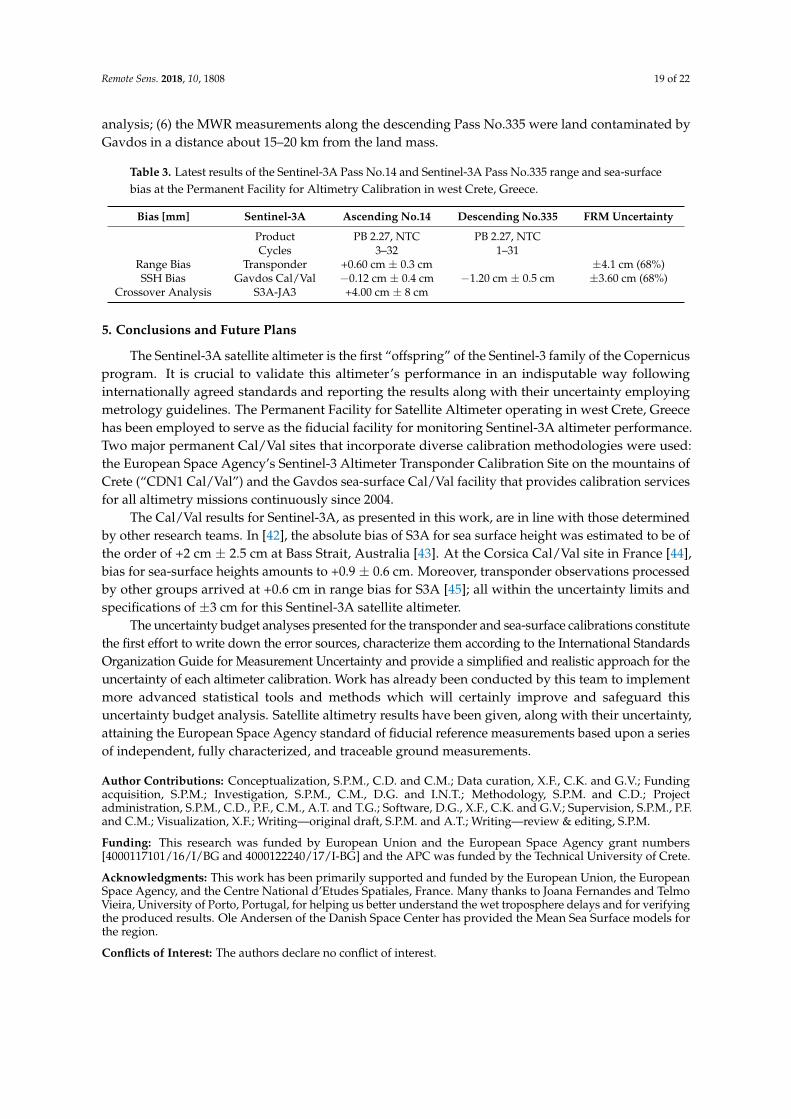
Remote Sens. 2018, 10, 1808 19 of 22
analysis; (6) the MWR measurements along the descending Pass No.335 were land contaminated byGavdos in a distance about 15–20 km from the land mass.
Table 3. Latest results of the Sentinel-3A Pass No.14 and Sentinel-3A Pass No.335 range and sea-surfacebias at the Permanent Facility for Altimetry Calibration in west Crete, Greece.
Bias [mm] Sentinel-3A Ascending No.14 Descending No.335 FRM Uncertainty
Product PB 2.27, NTC PB 2.27, NTCCycles 3–32 1–31
Range Bias Transponder +0.60 cm ± 0.3 cm ±4.1 cm (68%)SSH Bias Gavdos Cal/Val −0.12 cm ± 0.4 cm −1.20 cm ± 0.5 cm ±3.60 cm (68%)
Crossover Analysis S3A-JA3 +4.00 cm ± 8 cm
5. Conclusions and Future Plans
The Sentinel-3A satellite altimeter is the first “offspring” of the Sentinel-3 family of the Copernicusprogram. It is crucial to validate this altimeter’s performance in an indisputable way followinginternationally agreed standards and reporting the results along with their uncertainty employingmetrology guidelines. The Permanent Facility for Satellite Altimeter operating in west Crete, Greecehas been employed to serve as the fiducial facility for monitoring Sentinel-3A altimeter performance.Two major permanent Cal/Val sites that incorporate diverse calibration methodologies were used:the European Space Agency’s Sentinel-3 Altimeter Transponder Calibration Site on the mountains ofCrete (“CDN1 Cal/Val”) and the Gavdos sea-surface Cal/Val facility that provides calibration servicesfor all altimetry missions continuously since 2004.
The Cal/Val results for Sentinel-3A, as presented in this work, are in line with those determinedby other research teams. In [42], the absolute bias of S3A for sea surface height was estimated to be ofthe order of +2 cm ± 2.5 cm at Bass Strait, Australia [43]. At the Corsica Cal/Val site in France [44],bias for sea-surface heights amounts to +0.9 ± 0.6 cm. Moreover, transponder observations processedby other groups arrived at +0.6 cm in range bias for S3A [45]; all within the uncertainty limits andspecifications of ±3 cm for this Sentinel-3A satellite altimeter.
The uncertainty budget analyses presented for the transponder and sea-surface calibrations constitutethe first effort to write down the error sources, characterize them according to the International StandardsOrganization Guide for Measurement Uncertainty and provide a simplified and realistic approach for theuncertainty of each altimeter calibration. Work has already been conducted by this team to implementmore advanced statistical tools and methods which will certainly improve and safeguard thisuncertainty budget analysis. Satellite altimetry results have been given, along with their uncertainty,attaining the European Space Agency standard of fiducial reference measurements based upon a seriesof independent, fully characterized, and traceable ground measurements.
Author Contributions: Conceptualization, S.P.M., C.D. and C.M.; Data curation, X.F., C.K. and G.V.; Fundingacquisition, S.P.M.; Investigation, S.P.M., C.M., D.G. and I.N.T.; Methodology, S.P.M. and C.D.; Projectadministration, S.P.M., C.D., P.F., C.M., A.T. and T.G.; Software, D.G., X.F., C.K. and G.V.; Supervision, S.P.M., P.F.and C.M.; Visualization, X.F.; Writing—original draft, S.P.M. and A.T.; Writing—review & editing, S.P.M.
Funding: This research was funded by European Union and the European Space Agency grant numbers[4000117101/16/I/BG and 4000122240/17/I-BG] and the APC was funded by the Technical University of Crete.
Acknowledgments: This work has been primarily supported and funded by the European Union, the EuropeanSpace Agency, and the Centre National d’Etudes Spatiales, France. Many thanks to Joana Fernandes and TelmoVieira, University of Porto, Portugal, for helping us better understand the wet troposphere delays and for verifyingthe produced results. Ole Andersen of the Danish Space Center has provided the Mean Sea Surface models forthe region.
Conflicts of Interest: The authors declare no conflict of interest.
Remote Sens. 2018, 10, 1808 20 of 22
References
1. CEOS Database. Available online: http://database.eohandbook.com/database/missiontable.aspx (accessedon 20 July 2018).
2. PWC. Study to Examine the Socio-Economic Impact of Copernicus in the EU; European Commission DG GROW I.3;European Commission: Brussels, Belgium, 2016.
3. ESA. Sentinel-3 Family Grows. 2016. Available online: http://m.esa.int/Our_Activities/Observing_the_Earth/Copernicus/Sentinel-3/Sentinel-3_family_grows (accessed on 21 July 2018).
4. ESA. Sentinel-3: ESA’s Global Land and Ocean Mission for GMES Operational Services; ESA Communications:Noordwijk, The Netherlands, 2012; ISBN 978-92-9221-420-3.
5. Rebhan, H.; Goryl, P.; Donlon, C.; Féménias, P.; Bonekamp, H.; Fournier-Sicre, V.; Kwiatkowska, E.;Montagner, F.; Nogueira-Loddo, C.; O’Carroll, A. Sentinel-3 Calibration and Validation Plan; European SpaceAgency, European Space Research and Technology Centre: Noordwijk, The Netherlands, 2012.
6. Donlon, C. Fiducial Reference Measurements for Altimetry. FRM4ALT Project Webportal. Available online:https://goo.gl/Yn23pQ (accessed on 26 June 2018).
7. Mertikas, S.P.; Donlon, C.; Cullen, R.; Tripolitsiotis, A. Scientific and Operational Roadmap for FiducialReference Measurements in Satellite Altimetry Calibration and Validation. Int. Altimet. Cal/Val Rev. Appl.2018, under review.
8. Mertikas, S.P.; Tripolitsiotis, A.; Mavrocordatos, C.; Picot, N.; Féménias, P.; Daskalakis, A.; Boy, F.A permanent infrastructure in Crete for the calibration of Sentinel-3, Cryosat-2 and Jason missions witha transponder. In Proceedings of the ESA Living Planet Symposium 2013 (ESA SP-722), Edinburgh, UK,9–13 September 2013.
9. Mertikas, S.P.; Donlon, C.; Tripolitsiotis, A.; Mavrocordatos, C.; Tziavos, I.N.; Galanakis, D.; Andersen, O.B.;Tripolitsiotis, A.; Frantzis, X.; Lin, M.; et al. Gavdos/West Crete Cal/Val site: Over a decade calibrations forJason series, SARAL/AltiKa, CryoSat-2, Sentinel-3 and HY-2 altimeter satelites. In Proceedings of the ESALiving Planet Symposium 2013 (ESA SP-740), Prague, Czech Republic, 9–13 May 2016.
10. Kolenkiewicz, R.; Martin, C.F. Satellite Altimeter Calibration Techniques. Adv. Space Res. 1990, 10, 269–277.[CrossRef]
11. Christensen, E.J.; Haines, B.J.; Keihm, S.J.; Morris, C.S.; Norman, R.A.; Purcell, G.H.; Williams, B.G.;Wilson, B.D.; Born, G.H.; Parke, M.E.; et al. Calibration of TOPEX/POSEIDON at Platform Harvest.J. Geophys. Res. 1994, 99, 24465–24485. [CrossRef]
12. Menard, Y. Calibration of the TOPEX/POSEIDON altimeters at Lampedusa: Additional results at Harvest.J. Geophys. Res. 1994, 99, 24487–24504. [CrossRef]
13. Pesec, P.; Sunkel, H.; Fachbach, N. Transponders for Altimeter Calibration and Height Transfer.VGI—Österreichische Zeitschrift fü Vermessung Geoinf. 1996, 84, 252–256.
14. Cristea, E.; Moore, P. Altimeter bias determination using two years of transponder observations. In Proceedingsof the “Envisat Symposium” 2007 (ESA SP-636); Lacoste, H., Ouwehand, L., Eds.; ESA Publications Division;European Space Agency: Noordwijk, The Netherlands, 2007.
15. Hausleitner, W.; Moser, F.; Desjonqueres, J.D.; Boy, F.; Picot, N.; Weingrill, J.; Mertikas, S.; Daskalakis, A.A New Method of Precise Jason-2 Altimeter Calibration Using a Microwave Transponder. Mar. Geod. 2012,35, 337–362. [CrossRef]
16. Fornari, M.; Scagliola, M.; Tagliani, N.; Parrinello, T.; Mondejar, A.G. CryoSat SIRAL Calibration andPerformance. IEEE Geosci. Remote Sens. 2014, 702–705. [CrossRef]
17. Mertikas, S.P.; Donlon, C.; Mavrocordatos, C.; Tripolitsiotis, A.; Féménias, P.; Galanakis, D.; Tziavos, I.N.; Boy, F.;Vergos, G.; Andersen, O.B.; et al. Multi-mission calibration results at the Permanent Facility for AltimetryCalibration in west Crete, Greece attaining Fiducial Reference Measurement Standards. In Proceedings of theOcean Surface Topography Science Team Meeting 2017, Miami, FL, USA, 23–27 October 2017.
18. Mondejar, A.; Mertikas, S.; Galanakis, D.; Labroue, S.; Bruniquel, J.; Quartly, G.; Féménias, P.;Mavrocordatos, C.; Wood, J.; Garcia, P.; et al. Sentinel-3 Transponder Calibration Results. In Proceedings ofthe Ocean Surface Topography Science Team Meeting 2017, Miami, FL, USA, 23–27 October 2017. [CrossRef]
19. Egido, A. Fully focused SAR altimetry: Theory and Applications. IEEE Trans. Geosci. Remote Sens. 2017, 55,392–406. [CrossRef]
Remote Sens. 2018, 10, 1808 21 of 22
20. Raney, R.K. The delay/Doppler radar altimeter. IEEE Trans. Geosci. Remote Sens. 1998, 36, 1578–1588.[CrossRef]
21. Raynal, M.; Labroue, S.; Moreau, T.; Boy, F.; Picot, N. From conventional to Delay Doppler altimetry:A demonstration of continuity and improvements with the CryoSat-2 mission. Adv. Space Res. 2018. [CrossRef]
22. Radar Altimetry Tutorial & Toolbox. Available online: http://www.altimetry.info/toolbox/ (accessed on1 August 2018).
23. Garcia, P. S3-A SRAL Cyclic Performance Report; Sentinel-3 Mission Performance Centre, 2017. Availableonline: https://sentinel.esa.int/documents/247904/2829969/Sentinel-3-MPC-SRAL-Cyclic-Report-020(accessed on 14 November 2018).
24. Haines, B.J.; Desai, S.; Born, G. The Harvest Experiment: Calibration of the climate data record fromTOPEX/Poseidon, Jason-1 and the Ocean Surface Topography Mission. Mar. Geod. 2010, 33, 91–113. [CrossRef]
25. Watson, C.; White, N.; Church, J.; Reed, B.; Paul, T.; Richard, C. Absolute calibration in Bass Strait, Australia:TOPEX, Jason-1 and OSTM/Jason-2. Mar. Geod. 2011, 34, 242–260. [CrossRef]
26. Bonnefond, P.; Exertier, P.; Laurain, O.; Guillot, A.; Picot, N.; Cancet, M.; Lyard, F. SARAL/AltiKa Absolutecalibration from the multi-mission Corsica facilities. Mar. Geod. 2015, 38, 171–192. [CrossRef]
27. Mertikas, S.P.; Ioannides, R.T.; Tziavos, I.N.; Vergos, G.S.; Hausleitner, W.; Frantzis, X.; Tripolitsiotis, A.;Partsinevelos, P.; Andrikopoulos, D. Statistical models and latest results in the determination of the absolutebias for the radar altimeters of Jason satellites using the Gavdos facility. Mar. Geod. 2010, 33, 114–149. [CrossRef]
28. Tziavos, I.N.; Vergos, G.S.; Mertikas, S.P.; Daskalakis, A.; Grigoriadis, V.N.; Tripolitsiotis, A. The contributionof local gravimetric geoid models to the calibration of satellite altimetry data and an outlook of the latestGOCE GGM performance in GAVDOS. Adv. Space Res. 2013, 51, 1502–1522. [CrossRef]
29. Mertikas, S.P.; Daskalakis, A.; Tziavos, I.N.; Andersen, O.B.; Vergos, G.; Tripolitsiotis, A.; Zervakis, V.;Frantzis, X.; Partsinevelos, P. Altimetry, bathymetry and geoid variations at the Gavdos permanent Cal/Valfacility. Adv. Space Res. 2012, 51, 1418–1437. [CrossRef]
30. Vergos, G.S.; Tziavos, I.N.; Andritsanos, V.D. On the determination of marine geoid models by least-squarescollocation and spectral methods using heterogeneous data. In A Window on the Future of Geodesy; Sanso, E., Ed.;International Association of Geodesy Symposia; Springer: Berlin/Heidelberg, Germany, 2003. [CrossRef]
31. Dettmering, D.; Bosch, W. Global Calibration of Jason-2 by multi-mission crossover analysis. Mar. Geod.2010, 33, 150–161. [CrossRef]
32. Tai, C.K.; Fu, L.L. On crossover adjustment in satellite altimetry and its oceanographic implications.J. Geophys. Res. 1986, 91, 2549–2554. [CrossRef]
33. Bosch, W.; Dettmering, D.; Schwatke, C. Multi-mission cross-calibration of satellite altimeters: Constructinga long-term data record for global and regional sea level change studies. Remote Sens. 2014, 6, 2255–2281.[CrossRef]
34. Bosch, W.; Savcenko, R. Satellite altimetry: Multi-mission cross calibration. In Dynamic Planet; Tregoring, P.,Rizos, C., Eds.; International Association of Geodesy Symposia; Springer: Berlin/Heidelberg, Germany, 2005.
35. Mertikas, S.; Donlon, C.; Féménias, P.; Mavrocordatos, C.; Galanakis, D.; Tripolitsiotis, A.; Frantzis, X.;Tziavos, I.N.; Vergos, G.; Andersen, O.B.; et al. Fifteen years of Cal/Val service to reference altimetry missions:Calibration of satellite altimetry at the Permanent Facilities in Gavdos and Crete, Greece. Remote Sens. 2018,10, 1557. [CrossRef]
36. Fernandes, M.J.; Lazaro, C. Independent assessment of Sentinel-3A wet tropospheric correction over theopean and coastal ocean. Remote Sens. 2018, 10, 484. [CrossRef]
37. Snajdrova, K.; Boehm, J.; Willis, P.; Hass, R.; Schuh, H. Multi-technique comparison of tropospheric zenithdelays derived during the CONT02 campaign. J. Geod. 2006, 79, 613–623. [CrossRef]
38. BIPM. International Vocabulary of Metrology-Basic and General Concepts and Associated Terms (VIM), 3rd ed.;JCGM/WG 2 Doc. N313; Bureau Int. des Poids et Mesures: Sevres, France, 2012.
39. Mertikas, S.P.; Donlon, C.; Femenias, P.; Mavrocordatos, C.; Galanakis, D.; Guinle, T.; Boy, F.; Tripolitsiotis, A.;Frantzis, X.; Tziavos, I.N.; et al. Fiducial Reference Measurements for Satellite Altimetry Calibration:The Constituents. Int. Altimet. Cal/Val Rev. Appl. 2018. under review.
40. Ratcliffe, C.; Ratcliffe, B. Doubt-Free Uncertainty in Measurement: An Introduction for Engineers and Students;Springer International Publishing: Cham, Switzerland, 2015.
Remote Sens. 2018, 10, 1808 22 of 22
41. Pires, N.; Fernandes, M.J.; Gommenginger, C.; Scharroo, R. Improved sea state bias estimation for altimeterreference missions with altimeter-only three-parameter models. IEEE Trans. Geosci. Remote Sens. 2018,99, 1–15. [CrossRef]
42. Bonnefond, P.; Exertier, P.; Laurain, O.; Guillot, A.; Guinle, T.; Picot, N.; Femenias, P.; Parrinello, T.; Dinardo, S.Corsica: A multi-mission absolute calibration site. In Proceedings of the Ocean Surface Topography ScienceTeam Meeting 2017, Miami, FL, USA, 23–27 October 2017.
43. Watson, C.; Legresy, B.; King, M.; Deane, A. Absolute altimeter bias results from Bass Strait, Australia.In Proceedings of the Ocean Surface Topography Science Team Meeting 2018, Ponta Delgada, Portugal,24–29 September 2018.
44. Bonnefond, P.; Exertier, P.; Laurain, O.; Guinle, T.; Féménias, P. Corsica: A 20-Yr multi-mission absolutealtimeter calibration site. In Proceedings of the Ocean Surface Topography Science Team Meeting 2018,Ponta Delgada, Portugal, 24–29 September 2018.
45. Garcia-Mondejar, A.; Zhao, Z.; Rhines, P. Sentinel-3 Range and Datation Calibration with Crete transponder.In Proceedings of the 25 Years of Progress in Radar Altimetry, Ponta Delgada, Portugal, 24–29 September 2018.
© 2018 by the authors. Licensee MDPI, Basel, Switzerland. This article is an open accessarticle distributed under the terms and conditions of the Creative Commons Attribution(CC BY) license (http://creativecommons.org/licenses/by/4.0/).