Systematic evaluation of environmental and behavioural factors associated with all-cause mortality...
16
Systematic evaluation of environmental and behavioural factors associated with all-cause mortality in the United States National Health and Nutrition Examination Survey Chirag J Patel, 1 David H Rehkopf, 2 John T Leppert, 3 Walter M Bortz, 4 Mark R Cullen, 2 Glenn M Chertow 4 and John PA Ioannidis 1 * 1 Stanford Prevention Research Center, Stanford University School of Medicine, CA, USA 2 Division of General Medical Disciplines, Stanford University School of Medicine, CA, USA 3 Department of Urology, Stanford University School of Medicine, CA, USA and 4 Division of Nephrology, Department of Medicine, Stanford University School of Medicine, CA, USA *Corresponding author. Stanford Prevention Research Center, Stanford University School of Medicine, 1265 Welch Rd, Stanford 94305, CA, USA Email: [email protected] Accepted 4 September 2013 Background Environmental and behavioural factors are thought to contribute to all-cause mortality. Here, we develop a method to systematically screen and validate the potential independent contributions to all- cause mortality of 249 environmental and behavioural factors in the National Health and Nutrition Examination Survey (NHANES). Methods We used Cox proportional hazards regression to associate 249 factors with all-cause mortality while adjusting for sociodemographic factors on data in the 1999–2000 and 2001–02 surveys (median 5.5 follow-up years). We controlled for multiple comparisons with the false discov- ery rate (FDR) and validated significant findings in the 2003–04 survey (median 2.8 follow-up years). We selected 249 factors from a set of all possible factors based on their presence in both the 1999– 2002 and 2003–04 surveys and linkage with at least 20 deceased participants. We evaluated the correlation pattern of validated factors and built a multivariable model to identify their independent contri- bution to mortality. Results We identified seven environmental and behavioural factors associated with all-cause mortality, including serum and urinary cadmium, serum lycopene levels, smoking (3-level factor) and physical activity. In a multivariable model, only physical activity, past smoking, smoking in participant’s home and lycopene were independently associated with mortality. These three factors explained 2.1% of the variance of all-cause mortality after adjusting for demographic and socio-economic factors. Conclusions Our association study suggests that, of the set of 249 factors in NHANES, physical activity, smoking, serum lycopene and serum/urinary cadmium are associated with all-cause mortality as identified in previous studies and after controlling for multiple hypotheses and validation in an inde- pendent survey. Whereas other NHANES factors may be associated with mortality, they may require larger cohorts with longer time of follow-up to detect. It is possible to use a systematic association study to prioritize risk factors for further investigation. Keywords All-cause mortality, exposure, behaviour, environment-wide associ- ation study Published by Oxford University Press on behalf of the International Epidemiological Association ß The Author 2013; all rights reserved. International Journal of Epidemiology 2013;42:1795–1810 doi:10.1093/ije/dyt208 1795 by guest on March 24, 2016 http://ije.oxfordjournals.org/ Downloaded from
Transcript of Systematic evaluation of environmental and behavioural factors associated with all-cause mortality...
Systematic evaluation of environmental andbehavioural factors associated with all-causemortality in the United States National Healthand Nutrition Examination SurveyChirag J Patel,1 David H Rehkopf,2 John T Leppert,3 Walter M Bortz,4 Mark R Cullen,2
Glenn M Chertow4 and John PA Ioannidis1*
1Stanford Prevention Research Center, Stanford University School of Medicine, CA, USA 2Division of General Medical Disciplines,Stanford University School of Medicine, CA, USA 3Department of Urology, Stanford University School of Medicine, CA, USA and4Division of Nephrology, Department of Medicine, Stanford University School of Medicine, CA, USA
*Corresponding author. Stanford Prevention Research Center, Stanford University School of Medicine, 1265 Welch Rd, Stanford94305, CA, USA Email: [email protected]
Accepted 4 September 2013
Background Environmental and behavioural factors are thought to contribute toall-cause mortality. Here, we develop a method to systematicallyscreen and validate the potential independent contributions to all-cause mortality of 249 environmental and behavioural factors in theNational Health and Nutrition Examination Survey (NHANES).
Methods We used Cox proportional hazards regression to associate 249 factorswith all-cause mortality while adjusting for sociodemographic factorson data in the 1999–2000 and 2001–02 surveys (median 5.5 follow-upyears). We controlled for multiple comparisons with the false discov-ery rate (FDR) and validated significant findings in the 2003–04survey (median 2.8 follow-up years). We selected 249 factors froma set of all possible factors based on their presence in both the 1999–2002 and 2003–04 surveys and linkage with at least 20 deceasedparticipants. We evaluated the correlation pattern of validated factorsand built a multivariable model to identify their independent contri-bution to mortality.
Results We identified seven environmental and behavioural factors associatedwith all-cause mortality, including serum and urinary cadmium, serumlycopene levels, smoking (3-level factor) and physical activity. In amultivariable model, only physical activity, past smoking, smoking inparticipant’s home and lycopene were independently associated withmortality. These three factors explained 2.1% of the variance of all-causemortality after adjusting for demographic and socio-economic factors.
Conclusions Our association study suggests that, of the set of 249 factors in NHANES,physical activity, smoking, serum lycopene and serum/urinary cadmiumare associated with all-cause mortality as identified in previous studiesand after controlling for multiple hypotheses and validation in an inde-pendent survey. Whereas other NHANES factors may be associated withmortality, they may require larger cohorts with longer time of follow-upto detect. It is possible to use a systematic association study to prioritizerisk factors for further investigation.
Keywords All-cause mortality, exposure, behaviour, environment-wide associ-ation study
Published by Oxford University Press on behalf of the International Epidemiological Association
� The Author 2013; all rights reserved.
International Journal of Epidemiology 2013;42:1795–1810
doi:10.1093/ije/dyt208
1795
by guest on March 24, 2016
http://ije.oxfordjournals.org/D
ownloaded from
IntroductionIdentification of environmental and behavioural fac-tors associated with mortality is critical for publichealth and preventive care. Many of these factorsmay be possible to modify, as opposed to geneticand demographic factors (age, sex, race/ethnicity)that are impossible to change and socio-economic fac-tors (e.g. income, education and occupation) that arevery difficult to change. McGinnis, Foege, Mokdadet al. identify behavioural and environmental risk fac-tors as ‘actual causes of deaths in the United States’,requiring as much attention and response as standardproximate clinical conditions.1,2 One way to ascertainand compare environmental and behavioural risks formortality is to integrate data from national healthsurveys linked with mortality registries.2,3 There is alarge body of literature on studies that try to identifyenvironmental factors and behaviours that may in-crease or decrease death risk. However, these studiestypically assess and report one or a few factors at atime, and may lack systematic validation in independ-ent datasets. Modern humans are now exposed to acomplex array of environmental and behavioural fac-tors4,5 and in theory many behaviours may entailhealth risks and benefits. However, there is a lackof analytic strategies that aim to decipher concur-rently how multiple environmental and behaviouralfactors are associated with mortality. Further, poten-tial environmental exposure and behavioural risk maybe modified or determined by demographic attributes,such as sex, race/ethnicity and socio-economic status.Lack of standardization in the analysis may lead toinflated or spurious irreproducible effects.6,7 This is incontrast to current-day genome-wide association stu-dies (GWAS), a systematic analytic strategy to correl-ate millions of common genetic factors with diseasetraits.8 These investigations have resulted in a robustliterature of genetic findings in contrast to environ-mentally- or behaviourally-based investigations.8
We have recently developed methods for environ-ment-wide association study (EWAS), aiming tosearch for and validate environmental factorsassociated with disease and disease-related pheno-types.9–11 Here, we extend this methodology to sys-tematically evaluate the associations of 249environmental and behavioural factors, such asblood and urine biomarkers of exposure (e.g. pollu-tants and nutrients), and behavioural factors (e.g.physical activity, smoking and alcohol consumption),with all-cause mortality. We analyze the associationof 249 factors on all-cause mortality using informa-tion collected from participants of the 1999–2002United States National Health and Nutrition andExamination Survey (NHANES) with linked mortalityinformation ascertained by the National Death Index(NDI) in 2006. We subsequently validate findings inan independent survey, 2003–04 NHANES. Last, weevaluate the correlation pattern between tentativelyvalidated factors and identify those that have
independent effects on all-cause mortality and howthese interplay with demographic and socio-economicattributes.
MethodsNHANES 1999–2000, 2001–02 and 2003–04We downloaded NHANES laboratory, questionnaireand National Death Index (NDI) linked mortalitydata for 1999–00, 2001–02 and 2003–04 surveys.Mortality information was collected from the date ofthe survey participation through 31 December 2006and ascertained via a probabilistic match betweenNHANES and NDI death certificate information. TheNDI matches individuals on personal and demo-graphic criteria, such as social security number anddate of birth, and its performance has been describedelsewhere (e.g. ref 12). Overall, 9555, 11 021, and10 100 participants were followed in the 1999–2000,2001–02 and 2003–04 surveys, respectively, with 611,470 and 276 assumed death events, respectively. Weused the 1999–2000 and 2001–02 surveys to scan forfactors associated with all-cause mortality (‘training’dataset) and reserved the 2003–04 survey to replicatefindings from the training set.
Factors such as age, sex, race/ethnicity, educationalattainment, occupation and income are hypothesizedto be associated with both mortality and environ-mental/behavioural factors and we estimated theirassociation with mortality.13 Further, these sociode-mographic factors may also confound associations ofenvironmental/behavioural factors with death. InNHANES, race/ethnicity was coded as Non-HispanicWhite (‘White’), Mexican American (‘Mexican’),Non-Hispanic Black (‘Black’), Other Hispanic andOther. We coded educational attainment as lessthan high school, high school equivalent and greaterthan high school education. We estimated socio-economic status (SES) as the categorical quintile ofincome/poverty index as previously described.9,10 Weestimated occupation in categories corresponding towhite-collar and professional (reference group),white-collar and semi-routine (e.g. technicians),blue-collar and high-skill (e.g mechanics, constructiontrades and military) and blue-collar and semi-routine(e.g. personal services, farmworkers) as previouslydescribed.14
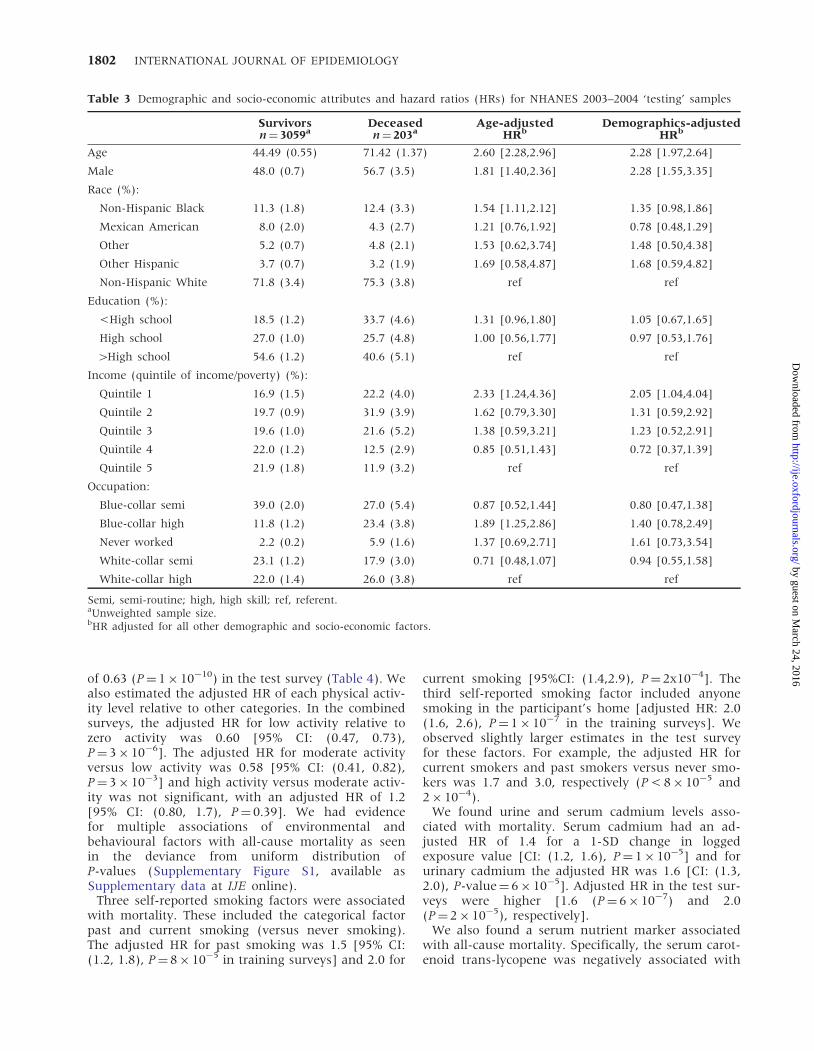
Figure 1 depicts our procedure. We assessed a totalof 249 environmental and behavioural factors, seeTable 1 and Supplementary Table S1 (available asSupplementary data at IJE online). These factorswere either (i) information on behaviours, such asself-reported dietary intake (from a food frequencyquestionnaire), self-reported alcohol consumption,self-reported smoking, body mass index (BMI) froma physical examination or self-reported physical activ-ity; or (ii) physical/chemical biomarkers of externalexposures measured in serum or urine, such as
1796 INTERNATIONAL JOURNAL OF EPIDEMIOLOGY
by guest on March 24, 2016
http://ije.oxfordjournals.org/D
ownloaded from

blood lead concentration. Table 1 shows examples offactors and Table S1 (available as Supplementary dataat IJE online) provides a listing of all factors. Therewere a total of 416, 467 and 574 factors in the 1999–2000, 2001–02 and 2003–04 surveys, respectively. Next,from these 406, 457 and 564 factors, we identified atotal of 347 that were present in all three surveys. Ofthese 347 factors, we found 249 that could be linkedwith at least 20 deceased participants in the training
(1999–2000 and 2001–02 surveys) and testing (2003–04) datasets independently (Figure 1A, B).
Behavioural factors included three surveying alcoholconsumption, one on ‘street drug’ use, 58 factors onfood and nutrient consumption, 23 on smoking-related behaviours [e.g. ‘current or past smoker?(versus never smoker)’, ‘does anyone in your house-hold smoke (yes/no)?’)] one on physical activity andthree on social support (e.g. ‘have anyone to help?’,
Figure 1 Methodology to scan for environmental and behavioural factors associated with mortality. (A) Summary ofenvironmental and behavioural variables in three independent NHANES surveys (1999–2000, 2001–02, 2003–04). (B)Training (combined 1999–2000 and 2001–02 surveys) and testing survey information. (C) Associating each 249 variableswith all-cause mortality (SES, socio-economic status estimate, quintile of income/poverty ratio). (D) Empirical false dis-covery rate (FDR) estimation in training surveys. (E) Proportional hazards assumption verification. (F) Tentative validation(P <0.05 in testing surveys). (G) Estimation of variance explained by tentatively validated factors with independent con-tribution and interaction with demographic variables
ENVIRONMENTAL AND BEHAVIOURAL FACTORS IN ALL-CAUSE MORTALITY 1797
by guest on March 24, 2016
http://ije.oxfordjournals.org/D
ownloaded from
‘how many close friends do you have?’). We discussthese variables in the following. First, the three fac-tors on alcohol consumption included five or moredrinks per day, number of drinks per day in lastmonth [z-standardized (divided by the populationstandard deviation to facilitate comparison of effects)ordinal factor] and how many total days drinking peryear (z-standardized ordinal factor).
The 23 smoking factors included four regardingfamily smoking behaviour and 19 on personal smok-ing behaviour. The four family smoking behaviourfactors included any smokers in the household (refer-ent group: no smokers in household), total number ofcigarette smokers in the household (z-standardizedordinal factor) and the total number of cigarettessmoked at home (z-standardized ordinal factor).
Table 1 Number and examples of environmental and behavioural factors
Factor category No. Examples
Behavioural factors:
Alcohol use 3 Drink five per day (yes/no)?
Quantity drinks per day (ordinal)
Personal smoking 19 Current or past smoker (referent: no smoking)
Smoke cigars 20 times in life (yes/no)?
Family smoking 4 Does anyone smoke in the home?
Total cigarette smokers in home (ordinal)
Cotinine 1 Serum levels of nicotine metabolite (log and per 1 SD)
Physical activity 1 Health.gov guideline activity levels (ordinal)
Social support 3 Anyone to help (yes/no)?
First-degree support (yes/no)?
Street drug use 1 Ever used cocaine or street drugs (yes/no)?
Body mass index 4 <18.5 kg/m2, or
525 and <30 kg/m2, or
530 and <35 kg/m2, or
535 kg/m2 (referent: 518.5 and <25 kg/m2)
Food nutrient recall 58 Dietary nutrient intake levels derived from Food frequencyquestionnaire (FFQ) (continuous and adjusted forcaloric intake)
Environmental Factors (serum- and urine-based):
Bacterial infection 2 MRSA 1 present (yes/no)
S. aureus present (yes/no)
Viral infection 5 Hepatitis B antibody (yes/no)
Hepatitis A antibody (yes/no)
Diakyl 6 Urinary dimethylphosphate (log per 1 SD)
Dioxins 7 2,3,7,8-tetrachlorodibenzodioxin (log and per 1 SD)
Furans 10 2,3,7,8-tetrachlorodibenzofuran (log and per 1 SD)
Heavy metals 15 Urinary cadmium (log and per 1 SD)
Serum cadmium (log and per 1 SD)
Hydrocarbons 21 Urinary 1-hydroxyfluorene (log and per 1SD)
Nutrients and minerals 15 Serum folate (log and per 1 SD)
Serum vitamin D (log and per 1 SD)
Polychlorinated biphenyls 34 Serum (polychlorinated biphenyls) PCB170 (log and per 1 SD)
Pesticides 22 Serum heptachlor epoxide (log and per 1 SD)
Phthalates 12 Urinary mono-n-butyl phthalate (log and per 1 SD)
Phytoestrogens 6 Urinary enterolactone (log and per 1 SD)
Total 249
1798 INTERNATIONAL JOURNAL OF EPIDEMIOLOGY
by guest on March 24, 2016
http://ije.oxfordjournals.org/D
ownloaded from

The 18 factors regarding personal behaviour includeda categorical factor on current or past smoking (ana-lyzed as a two-level categorical factor with neversmoking as a referent) and four on ever-used cigars,chewing tobacco, snuff and pipes (referent group:never smoked the item). Specifically for current andpast smokers, factors included the number of cigar-ettes smoked just before quitting (z-standardizedordinal factor), how many years smoked (z-standar-dized ordinal factor), number of cigarettes currentlysmoking (z-standardized ordinal factor), the averagenumber of cigarettes smoked per day in the pastmonth (z-standardized ordinal factor) and an esti-mated nicotine, tar and carbon monoxide content ofsmoked item (z-standardized ordinal factors). Otherfactors for current smokers included years sincestarted smoking (z-standardized ordinal variable).
Physical activity was estimated by deriving metabolicequivalents for self-reported leisure and normal-timeactivities15 and treated as an ordinal factor based onHealth.gov physical activity guideline categories for noaerobic activity, low activity (medium intensity activitygreater than baseline but fewer than 150 min/week),moderate activity (150 to 300 medium intensity min/week) and high activity (4300 min medium intensiveactivity per week or4150 min high intensity per week)as previously described.10,16
The 58 self-reported food and nutrient consumptionfactors were determined from one in-person 24-hinterview (1999–2000, 2001–02) or two 24-h (2003–04) in-person and telephone interviews using theUnited States Department of Agriculture andDepartment of Health and Human Services foodrecall questionnaires.17–20 These food and nutrientconsumption factors were linearly adjusted by totalcaloric intake and z-standardized.
We considered BMI as another behavioural four-levelcategorical factor. We divided BMI into five categoriesas previously described,21 including <18.5 kg/m2,518.5 and <25 kg/m2, 525 and <30 kg/m2,530 and <35 kg/m2, and 535 kg/m2. The 518.5 and<25 kg/m2 category was the reference group.
The 156 factors were serum or urine-based measuresof environmental exposure, including infectiousagents, environmental chemicals and nutrients.Broadly, these included a serum marker of nicotinemetabolism (cotinine), dioxins (n¼ 7 markers),furans (n¼ 10), heavy metals (n¼ 15), hydrocarbons(n¼ 21), nutrients (n¼ 15), polychlorinated biphenyls(n¼ 34), pesticides (n¼ 22), phthalates (n¼ 12), oes-trogenic compounds (n¼ 6), bacterial (n¼ 2) and viralorganisms (n¼ 6). With the exception of assays de-tecting infectious agents (which were positive/nega-tive assays), factors were continuous in scale.Continuous biomarker factors that had a right-skewed distribution were log-transformed and z-stan-dardized as previously described.9,10
Different measures of environmental and behaviouralfactors had different numbers of eligible participants
for mortality follow-up assessment (Figure 1B). Inthe training surveys (1999–2002), there were 330–6008 eligible participants (with 26–655 death events).For the replication survey (2003–04), there were177–3258 eligible participants (with 20–202 deaths)(Supplementary Table S1, available as Supplementarydata at IJE online). We used the R-project survival andsurvey library for all analyses and accounted for clusterspseudo-strata, pseudo-sampling units and participantweights to accommodate the complex sampling ofthe data.22,23 Estimates were verified with STATA.24
Systematic scan of environmental andbehavioural factors associated with all-causemortalityWe associated each of the 249 factors to all-causemortality serially using proportional hazards (Cox) re-gression, while adjusting for sociodemographic attri-butes described above, including age, sex, an estimateof SES (categorical quintiles of poverty to incomeratio), educational attainment, occupation and race/ethnicity in the training surveys, the 1999–2002NHANES (the ‘training’ step, Figure 1C). We usedthe FDR to correct for multiple hypotheses asdescribed previously9–11 (Figure 1D). The FDR is theestimated proportion of the false discoveries madeover the number of total discoveries made at agiven significance level. We used a permutation simu-lation method to estimate the numerator, the numberof false positives incurred at a significance thresholdas documented earlier.9,11,25 Specifically, to estimatethe expected number of false positives, we permutedthe censorship and follow-up time variable withineach stratum of the survey; in other words, partici-pants were randomly assigned mortality status. Then,we re-ran survival analyses for each of the 249 fac-tors. We repeated this process 100 times to attain adistribution of P-values drawn from the null distribu-tion. The permutation method accounts for the correl-ation amongst factors.26 We set an FDR threshold of5% to identify findings in the training step for valid-ation in the testing survey. For each factor that passedthe FDR threshold in the training step, we assessedviolation of proportional hazards by examining inter-action between the factor and follow-up time.
We deemed a factor tentatively validated if it hadachieved FDR <5% significance in the training scan(1999–2002 surveys) and achieved nominal statisticalsignificance in the test (2003–04) survey (P-value<0.05, Figure 1D–F). For validated findings, we com-puted an overall adjusted hazard ratio (referred to as‘overall HR’) by combining both the training and test-ing survey datasets (Figure 1F). We verified whetherthe validated factors violated the proportional hazardsassumption by checking their interaction with follow-up time. We did not have evidence that any of thesefactors significantly violated the assumption (P40.05).
We assessed the non-parametric correlations amongfactors that had an FDR < 5% in the training step,
ENVIRONMENTAL AND BEHAVIOURAL FACTORS IN ALL-CAUSE MORTALITY 1799
by guest on March 24, 2016
http://ije.oxfordjournals.org/D
ownloaded from

specifically bi-serial correlations between binary fac-tors and Spearman correlations when consideringquantitative factors. We visualized these pairwise cor-relations in a heat map and arranged the factors usinga hierarchical clustering algorithm27 as previouslydescribed.11
We computed the power for detection of factors atP-value corresponding to FDR <5% (equivalent toP¼ 0.0003) for sample sizes corresponding to eachfactor tested at a range of adjusted HR of (1.1, 1.3,1.5, 1.7 and 1.9) with the powerSurvEpi R library.28
Specifically, this library implements methods thattake into account the correlation among the factorand adjustment co-variates29,30 sample size andnumber of death events to estimate power at agiven P-value threshold and HR. We then estimatedhow many factors we would detect if every one of the249 were associated with all-cause mortality for FDR<5% (P <0.0003) and each HR above by totalling thepower estimations for each factor tested (Supplemen-tary Table S2, available as Supplementary data atIJE online). At HRs of 1.1, 1.3, 1.5, 1.7 and 1.9, weestimated we would find 7 out of 249 (3%), 120/249(49%), 194/249 (79%), 221/249 (89%) and 233/249(94%), respectively, if all 249 factors were associatedwith all-cause mortality. We concluded we wereadequately powered to detect modest and largeassociations (HR 41.3 or HR <0.8), but not weakassociations with all-cause mortality.
Interaction checks with two lowest SEScategories, male sex and Non-Hispanic Blackrace/ethnicityFor tentatively validated factors, we aimed to assesstheir interaction with demographic and socio-eco-nomic characteristics associated with risk for all-cause mortality, namely male sex, two lowest SESquintiles and Non-Hispanic Black race/ethnicity inthe combined cohort (training and testing cohorts,Figure 1G). Specifically, we modelled the interactionsamong each of the validated findings and the threedemographic factors with a multiplicative term in theCox proportional hazards model while controlling forthe remaining demographic co-variates above (age,sex, education, quintile of SES, occupation and race/ethnicity). As one example, the interaction betweenserum cadmium exposure (‘X’) and male sex wouldhave been modelled as: log(HR)¼ b1 * Xþ b2 *maleþ b3 * X * maleþ other adjustment covariates(age, race/ethnicity, education, SES, occupation). Weassessed whether inclusion of the interaction term(b3) was significant at the Bonferroni level of signifi-cance after considering 7 times 3 interaction tests(P < 0.05/21¼ 0.002).
Variance explained of validated factorsTo estimate the additive effects and overall varianceexplained by identified factors, we built three multi-variable models that included tentatively validated
factors (Figure 1G). The first models contained tenta-tively validated factors in addition to age, sex, quin-tiles of SES, education and occupation as definedabove. The third model contained tentatively validatedfactors in addition to age, sex and race/ethnicity butexcluded socio-economic factors. We hypothesizedthat the socio-economic factors may influence someof the environmental and behavioural factors. Underthis hypothesis, the strength of the associations of theenvironmental/behavioural factors might be strongerin a model without socio-economic co-variates (SES,education and occupation) versus models with socio-economic factors. We computed the Nagelkerke R2 toestimate the variance explained for each model and,in addition, ascribed solely to the environmental andbehavioural factors. We computed standard errorsaround the Nagelkerke R2 with a bootstrapping pro-cedure that accommodated stratified data.31
ResultsBaseline characteristics of deceased andsurviving participants in NHANES 99–02and NHANES 03–04There were a total of 6008 eligible participants forstudy in NHANES 1999–2002 with a median time tofollow-up of 66 months. As expected, we found im-portant associations among demographic characteris-tics and mortality, including older age [adjustedhazard ratio (HR)¼ 2.2 (2.1, 2.4) for a 10-yearincrease], male sex [HR¼ 1.7 (1.4, 2.1)], and non-Hispanic Black race/ethnicity [HR¼ 1.4 (1.1, 1.8) rela-tive to non-Hispanic Whites]. We also observed higherrisk depending on SES (as defined by quintile ofincome-poverty ratio). Individuals at the two lowestSES standings had greater than 2-fold risk fordeath [HR¼ 2.2, (1.5, 3.6) and 2.4 (1.7, 3.4) for firstand second quintiles, respectively] versus the highestSES (Table 2). Supplementary Table S1 (available asSupplementary data at IJE online) shows factors thatdiffered among alive and deceased participants.
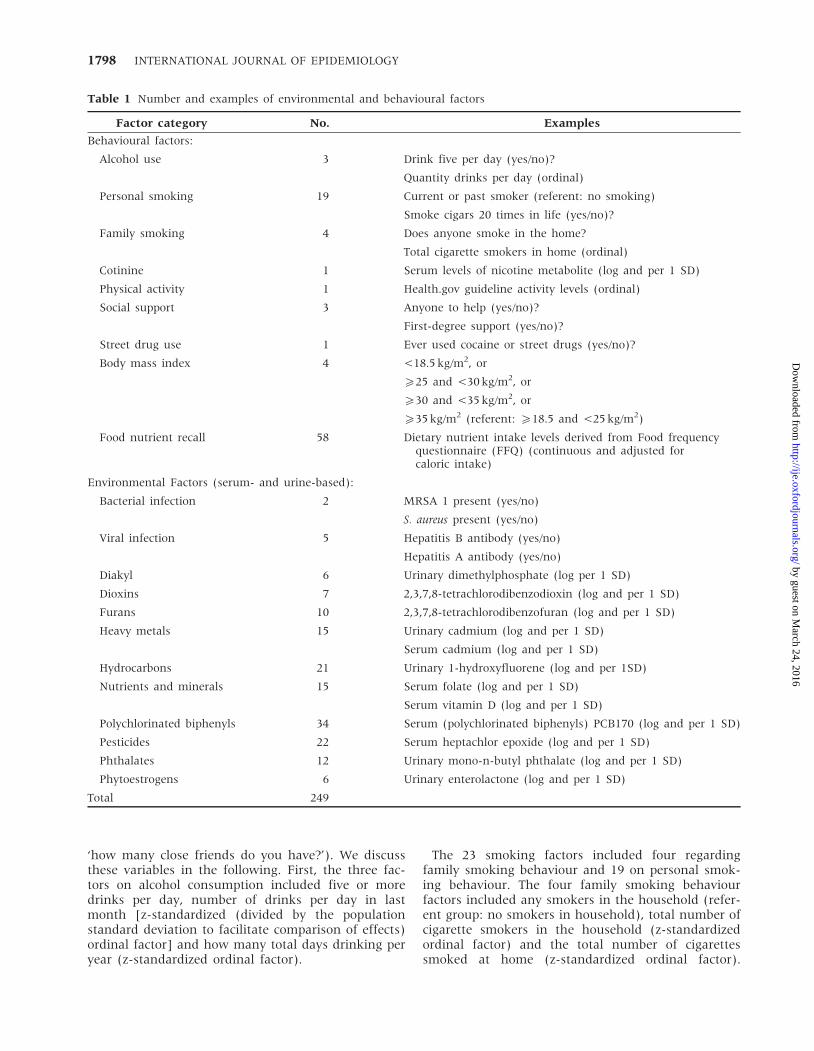
NHANES 2003–04 was used for validation. Therewere a total of 3262 eligible participants for study inNHANES 2003–04 with a median follow-up of 34months. We observed similar trends in NHANES2003–04 (Table 3). Participants in NHANES 2003–04had higher mean survivor age of 44.5 years anddeceased mean age of 71.4 years. The adjusted HRfor a 10-year increase in age was 2.6 [95% CI: 2.3,3.0)] versus 2.2 in NHANES 1999–2002. We observeddouble the risk for men [adjusted HR¼ 2.0 (1.5, 2.7)].
Limited cause of death information was available fordeceased participants and was coded as InternationalClassification of Diseases version 10 (ICD10) codes.The Center for Disease Control and Prevention(CDC)/National Center for Health Statistics (NCHS)binned ICD10 codes into 113 groups. The top fivecauses of death for participants in the 1999–2001
1800 INTERNATIONAL JOURNAL OF EPIDEMIOLOGY
by guest on March 24, 2016
http://ije.oxfordjournals.org/D
ownloaded from

surveys included the groups ‘other forms of ischaemicheart disease’ (ICD10 codes I20, I25.1–I25.9, 10% of thedeceased population), ‘cerebrovascular diseases’(ICD10: I60–I69, 8% of deceased participants), ‘otherdiseases’ (more than ten ICD10 groups, 7% of deceasedparticipants), ‘malignant neoplasms of trachea, bron-chus and lung’ (ICD10: C33–C34, 7%), and ‘acute myo-cardial infarction’ (ICD10: I21–I22, 6% of deceasedparticipants). The top five causes of death for deceasedparticipants in the 2003–04 survey were similar andincluded ‘other forms of ischaemic heart disease’(12% of deceased participants), ‘malignant neoplasmsof trachea, bronchus and lung’ (10% of deceasedparticipants), ‘other diseases’ (8%), ‘acute myocardialinfarction’ (8%) and ‘cerebrovascular diseases’ (6%).
Systematic scan of environmental andbehavioural factors associated withall-cause mortalityWe associated each of the 249 environmental andbehavioural factors (self-reported or biomarkers of
exposure) with all-cause mortality in turn, adjustingfor age, sex, race/ethnicity, SES, occupation and edu-cational attainment in the NHANES 1999–2002 sur-veys (the ‘training’ dataset). Figure 2 shows theresults, visualizing the adjusted hazard ratio versusthe P-value of the association. Adjusted HR denotesrisk for all-cause mortality per 1 SD for continuousfactors or per incremental change for ordinal values.For categorical or binary factors, adjusted hazardratios denote risk relative to the referent category(‘negative’ for an exposure).
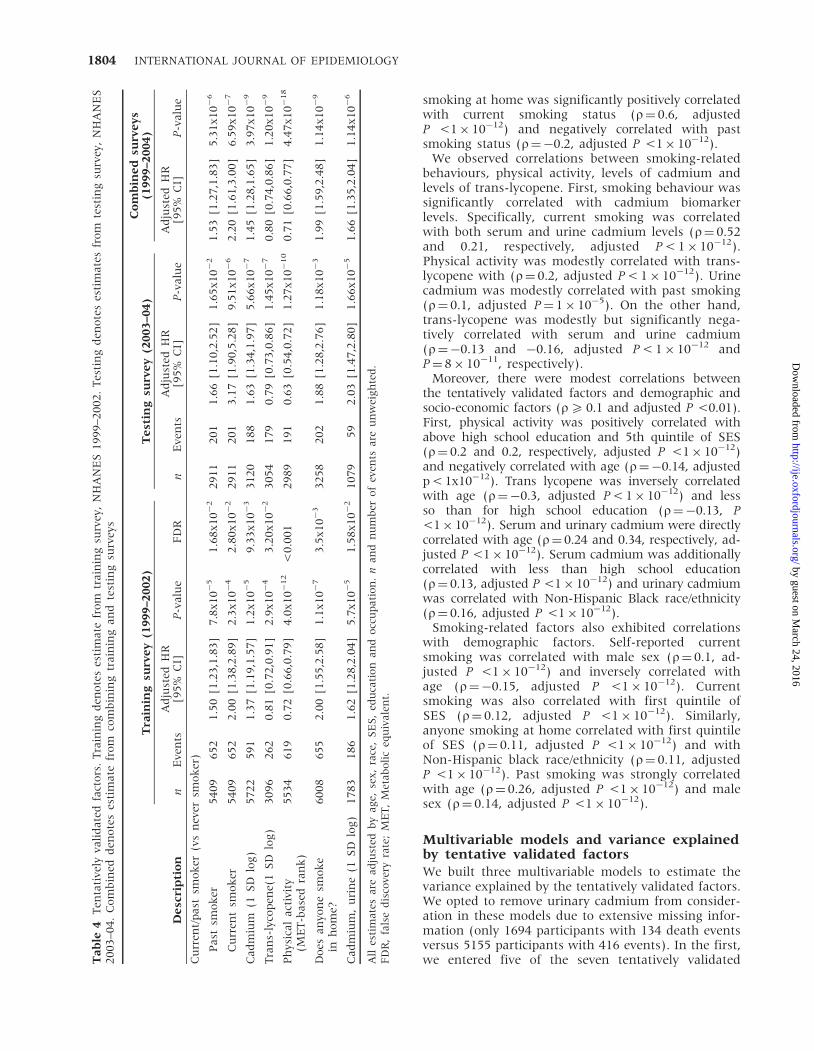
We found 7 (out of 249) factors at FDR <5% in thetraining surveys (1999–2002 NHANES) and were ableto tentatively validate all 7 factors in the test survey(P <0.05 in 2003–04 NHANES) (Table 4, Figure 2).The strongest association included physical activity,analyzed as an ordinal factor (representing the trendfrom no, low, medium and high activity as defined byHealth.gov categories) with adjusted HR of 0.72 forthe trend [CI: (0.66, 0.79), P-value¼ 4� 10�12] inthe training surveys (Figure 2) and an adjusted HR
Table 2 Demographic and socio-economic attributes and hazard ratios (HRs) for NHANES 1999–2002 ‘training’ samples
Survivorsn¼ 5353a
Deceasedn¼ 655a
Age-adjustedHRb
Demographic-adjustedHRb
Age 43.45 (0.34) 68.25 (0.83) 2.32 [2.15,2.49] 2.24 [2.07,2.43]
Male 47.9 (0.6) 52.9 (2.4) 1.56 [1.26,1.93] 1.72 [1.38,2.13]
Race (%):
Non-Hispanic Black 10.4 (1.2) 11.4 (1.4) 1.66 [1.33,2.08] 1.40 [1.09,1.81]
Mexican American 7.2 (0.9) 3.6 (0.8) 1.15 [0.80,1.64] 0.86 [0.60,1.23]
Other 4.7 (0.6) 1.6 (0.6) 0.57 [0.30,1.08] 0.54 [0.30,0.98]
Other Hispanic 6.8 (1.7) 5.6 (2.2) 1.18 [0.77,1.80] 0.92 [0.59,1.43]
Non-Hispanic White 70.8 (1.8) 77.7 (2.4) ref ref
Education (%):
<High school 20.8 (0.9) 37.5 (2.4) 1.42 [1.14,1.77] 1.24 [0.98,1.57]
High school 25.7 (1.0) 29.2 (1.9) 1.65 [1.33,2.05] 1.23 [0.98,1.54]
4High school 53.5 (1.5) 33.2 (2.5) ref ref
Income (quintile of income/poverty) (%):
Quintile 1 16.9 (0.9) 19.2 (2.0) 2.39 [1.70,3.38] 2.32 [1.51,3.57]
Quintile 2 18.5 (1.1) 33.5 (2.8) 2.47 [1.74,3.50] 2.41 [1.69,3.44]
Quintile 3 19.9 (0.7) 22.0 (2.3) 1.89 [1.29,2.75] 1.76 [1.20,2.57]
Quintile 4 19.6 (0.6) 13.8 (1.7) 1.68 [1.08,2.59] 1.60 [1.03,2.48]
Quintile 5 25.1 (1.4) 11.4 (2.0) ref ref
Occupation:
Blue-collar semi 38.1 (1.0) 39.1 (2.8) 1.58 [1.25,1.99] 1.18 [0.87,1.59]
Blue-collar high 10.3 (0.7) 14.6 (1.8) 1.73 [1.22,2.43] 1.10 [0.78,1.55]
Never worked 2.6 (0.2) 2.8 (0.7) 0.78 [0.40,1.50] 0.76 [0.37,1.58]
White-collar semi 20.9 (0.8) 19.0 (1.4) 0.96 [0.77,1.19] 0.98 [0.74,1.30]
White-collar high 23.5 (0.8) 19.1 (1.8) ref ref
Semi, semi-routine; high, high skill; ref, referent.aUnweighted sample size.bHR adjusted for all other demographic and socio-economic factors.
ENVIRONMENTAL AND BEHAVIOURAL FACTORS IN ALL-CAUSE MORTALITY 1801
by guest on March 24, 2016
http://ije.oxfordjournals.org/D
ownloaded from
of 0.63 (P¼ 1� 10�10) in the test survey (Table 4). Wealso estimated the adjusted HR of each physical activ-ity level relative to other categories. In the combinedsurveys, the adjusted HR for low activity relative tozero activity was 0.60 [95% CI: (0.47, 0.73),P¼ 3� 10�6]. The adjusted HR for moderate activityversus low activity was 0.58 [95% CI: (0.41, 0.82),P¼ 3� 10�3] and high activity versus moderate activ-ity was not significant, with an adjusted HR of 1.2[95% CI: (0.80, 1.7), P¼ 0.39]. We had evidencefor multiple associations of environmental andbehavioural factors with all-cause mortality as seenin the deviance from uniform distribution ofP-values (Supplementary Figure S1, available asSupplementary data at IJE online).
Three self-reported smoking factors were associatedwith mortality. These included the categorical factorpast and current smoking (versus never smoking).The adjusted HR for past smoking was 1.5 [95% CI:(1.2, 1.8), P¼ 8� 10�5 in training surveys] and 2.0 for
current smoking [95%CI: (1.4,2.9), P¼ 2x10�4]. Thethird self-reported smoking factor included anyonesmoking in the participant’s home [adjusted HR: 2.0(1.6, 2.6), P¼ 1� 10�7 in the training surveys]. Weobserved slightly larger estimates in the test surveyfor these factors. For example, the adjusted HR forcurrent smokers and past smokers versus never smo-kers was 1.7 and 3.0, respectively (P < 8� 10�5 and2� 10�4).
We found urine and serum cadmium levels asso-ciated with mortality. Serum cadmium had an ad-justed HR of 1.4 for a 1-SD change in loggedexposure value [CI: (1.2, 1.6), P¼ 1� 10�5] and forurinary cadmium the adjusted HR was 1.6 [CI: (1.3,2.0), P-value¼ 6� 10�5]. Adjusted HR in the test sur-veys were higher [1.6 (P¼ 6� 10�7) and 2.0(P¼ 2� 10�5), respectively].
We also found a serum nutrient marker associatedwith all-cause mortality. Specifically, the serum carot-enoid trans-lycopene was negatively associated with
Table 3 Demographic and socio-economic attributes and hazard ratios (HRs) for NHANES 2003–2004 ‘testing’ samples
Survivorsn¼ 3059a
Deceasedn¼ 203a
Age-adjustedHRb
Demographics-adjustedHRb
Age 44.49 (0.55) 71.42 (1.37) 2.60 [2.28,2.96] 2.28 [1.97,2.64]
Male 48.0 (0.7) 56.7 (3.5) 1.81 [1.40,2.36] 2.28 [1.55,3.35]
Race (%):
Non-Hispanic Black 11.3 (1.8) 12.4 (3.3) 1.54 [1.11,2.12] 1.35 [0.98,1.86]
Mexican American 8.0 (2.0) 4.3 (2.7) 1.21 [0.76,1.92] 0.78 [0.48,1.29]
Other 5.2 (0.7) 4.8 (2.1) 1.53 [0.62,3.74] 1.48 [0.50,4.38]
Other Hispanic 3.7 (0.7) 3.2 (1.9) 1.69 [0.58,4.87] 1.68 [0.59,4.82]
Non-Hispanic White 71.8 (3.4) 75.3 (3.8) ref ref
Education (%):
<High school 18.5 (1.2) 33.7 (4.6) 1.31 [0.96,1.80] 1.05 [0.67,1.65]
High school 27.0 (1.0) 25.7 (4.8) 1.00 [0.56,1.77] 0.97 [0.53,1.76]
4High school 54.6 (1.2) 40.6 (5.1) ref ref
Income (quintile of income/poverty) (%):
Quintile 1 16.9 (1.5) 22.2 (4.0) 2.33 [1.24,4.36] 2.05 [1.04,4.04]
Quintile 2 19.7 (0.9) 31.9 (3.9) 1.62 [0.79,3.30] 1.31 [0.59,2.92]
Quintile 3 19.6 (1.0) 21.6 (5.2) 1.38 [0.59,3.21] 1.23 [0.52,2.91]
Quintile 4 22.0 (1.2) 12.5 (2.9) 0.85 [0.51,1.43] 0.72 [0.37,1.39]
Quintile 5 21.9 (1.8) 11.9 (3.2) ref ref
Occupation:
Blue-collar semi 39.0 (2.0) 27.0 (5.4) 0.87 [0.52,1.44] 0.80 [0.47,1.38]
Blue-collar high 11.8 (1.2) 23.4 (3.8) 1.89 [1.25,2.86] 1.40 [0.78,2.49]
Never worked 2.2 (0.2) 5.9 (1.6) 1.37 [0.69,2.71] 1.61 [0.73,3.54]
White-collar semi 23.1 (1.2) 17.9 (3.0) 0.71 [0.48,1.07] 0.94 [0.55,1.58]
White-collar high 22.0 (1.4) 26.0 (3.8) ref ref
Semi, semi-routine; high, high skill; ref, referent.aUnweighted sample size.bHR adjusted for all other demographic and socio-economic factors.
1802 INTERNATIONAL JOURNAL OF EPIDEMIOLOGY
by guest on March 24, 2016
http://ije.oxfordjournals.org/D
ownloaded from

all-cause mortality (Figure 2; Table 4). Specifically,trans-lycopene had an HR of 0.6, and higher levelsof trans-lycopene were associated with a 20%decreased risk for mortality (Table 4). Adjusted HRsin the test surveys for these variables were similar.
Several factors had higher HR (42) but did not haveFDR <5%, including hepatitis C antibody and hepa-titis B surface antigen. Antibodies to hepatitis C hadan adjusted HR of 2.7 in the training surveys 2.7 [95%CI: (1.4, 5.0), P¼ 0.002, FDR¼ 10%] and 2.2 in thecombined surveys [95% CI: (1.2, 3.9), P¼ 0.009].Hepatitis B surface antigen presence had an adjustedHR of 2.6 in the training surveys [95% CI: (0.9, 7.3),P¼ 0.08, FDR430%] and 2.1 in the combined surveys[95% CI: (0.8, 6.0), P¼ 0.1].
Interaction checks with two lowest SEScategories, male sex and Non-Hispanic Blackrace/ethnicityWe estimated whether the seven validated factorsinteracted with three demographic categories (totalof 21 tests of interaction). We could not conclude
that any of these demographic factors modified asso-ciations for all-cause mortality after consideration ofmultiple hypotheses (P 40.05 for all 21 interactiontests).
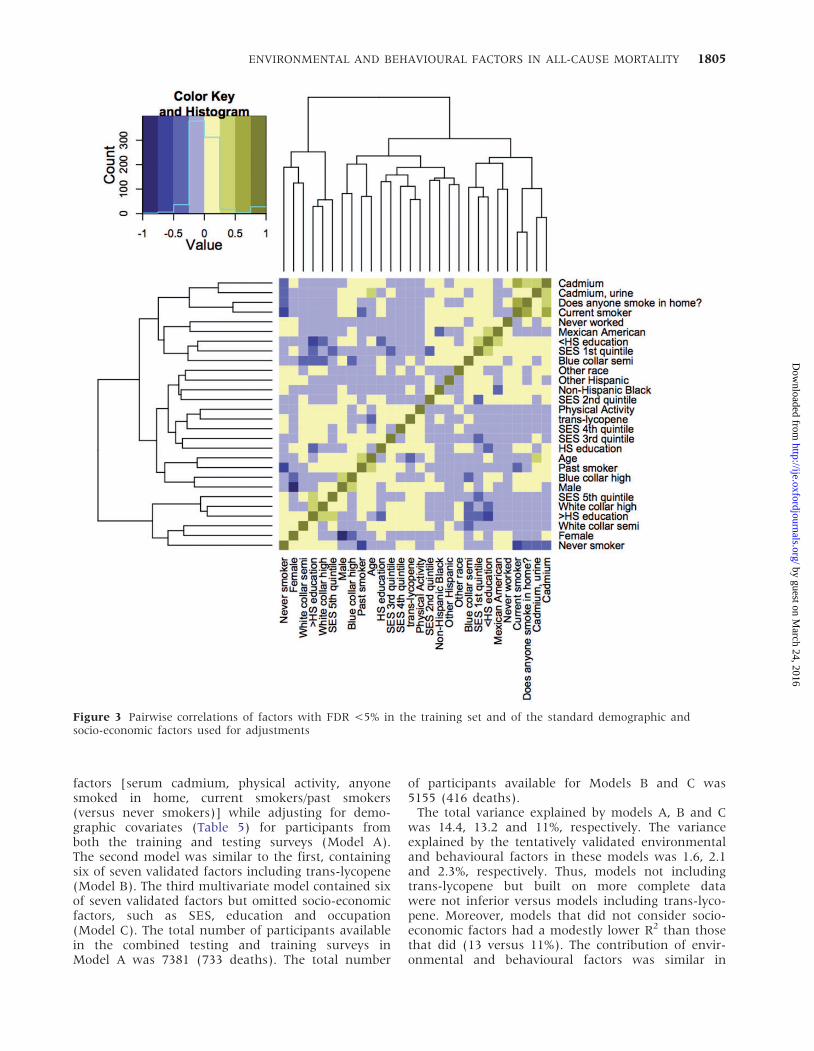
Correlation pattern between putative riskfactorsWe assessed the correlations among each of the en-vironmental and behavioural factors with FDR <5%(n¼ 7) and adjustment covariates (n¼ 21) andobserved that there were many modest correlationsamong the 351 pairwise correlations that were calcu-lated; 210 of the 378 correlations were significant(Bonferroni-adjusted P < 0.05). The 5th to 95th per-centile range of the absolute value of r was 0.005 to0.30 (Figure 3) and the correlations that were signifi-cant had absolute values ranging from 0.04 to 0.62.
There were significant correlations between similarfactors belonging to the same group, such as smoking-and cadmium-related factors. For example, the correl-ation between serum and urinary cadmium levels was0.45 (adjusted P <1� 10�12). Self-reported anybody
Figure 2 Volcano plot of 249 environmental and behavioural factor associations with all-cause mortality in training step(all black points). Red horizontal line denotes FDR-adjusted level of statistical significance (FDR¼ 5%, P-value¼ 0.0003).Red points show the standard demographic and socio-economic factors considered for adjustments. For SES: SES_0: 1stquantile of SES, SES_1: 2nd quantile of SES, SES_2: 3rd quantile of SES, SES_3: 4th quantile of SES; SES HR are relative tohighest quintile of SES. For education: education_hs: high school education, education_less_hs: less than high schooleducation, education HR relative to greater than hig -school education. For occupation: occupation_blue_semi: semi bluec-ollar, occupation_blue_high: high blue-collar, occupation_white_semi: semi white-collar, occupation_never: never worked.Filled black markers denote validated factors. –log10(P-value) for physical activity and age are annotated in parentheses,since they are extreme. Y-axis is discontinuous to accommodate higher –log10(P-values) for physical activity and age
ENVIRONMENTAL AND BEHAVIOURAL FACTORS IN ALL-CAUSE MORTALITY 1803
by guest on March 24, 2016
http://ije.oxfordjournals.org/D
ownloaded from
smoking at home was significantly positively correlatedwith current smoking status (r¼ 0.6, adjustedP <1� 10�12) and negatively correlated with pastsmoking status (r¼�0.2, adjusted P <1� 10�12).
We observed correlations between smoking-relatedbehaviours, physical activity, levels of cadmium andlevels of trans-lycopene. First, smoking behaviour wassignificantly correlated with cadmium biomarkerlevels. Specifically, current smoking was correlatedwith both serum and urine cadmium levels (r¼ 0.52and 0.21, respectively, adjusted P < 1� 10�12).Physical activity was modestly correlated with trans-lycopene with (r¼ 0.2, adjusted P < 1� 10�12). Urinecadmium was modestly correlated with past smoking(r¼ 0.1, adjusted P¼ 1� 10�5). On the other hand,trans-lycopene was modestly but significantly nega-tively correlated with serum and urine cadmium(r¼�0.13 and �0.16, adjusted P < 1� 10�12 andP¼ 8� 10�11, respectively).
Moreover, there were modest correlations betweenthe tentatively validated factors and demographic andsocio-economic factors (r5 0.1 and adjusted P <0.01).First, physical activity was positively correlated withabove high school education and 5th quintile of SES(r¼ 0.2 and 0.2, respectively, adjusted P <1� 10�12)and negatively correlated with age (r¼�0.14, adjustedp < 1x10�12). Trans lycopene was inversely correlatedwith age (r¼�0.3, adjusted P < 1� 10�12) and lessso than for high school education (r¼�0.13, P<1� 10�12). Serum and urinary cadmium were directlycorrelated with age (r¼ 0.24 and 0.34, respectively, ad-justed P <1� 10�12). Serum cadmium was additionallycorrelated with less than high school education(r¼ 0.13, adjusted P <1� 10�12) and urinary cadmiumwas correlated with Non-Hispanic Black race/ethnicity(r¼ 0.16, adjusted P <1� 10�12).
Smoking-related factors also exhibited correlationswith demographic factors. Self-reported currentsmoking was correlated with male sex (r¼ 0.1, ad-justed P <1� 10�12) and inversely correlated withage (r¼�0.15, adjusted P <1� 10�12). Currentsmoking was also correlated with first quintile ofSES (r¼ 0.12, adjusted P <1� 10�12). Similarly,anyone smoking at home correlated with first quintileof SES (r¼ 0.11, adjusted P <1� 10�12) and withNon-Hispanic black race/ethnicity (r¼ 0.11, adjustedP <1� 10�12). Past smoking was strongly correlatedwith age (r¼ 0.26, adjusted P <1� 10�12) and malesex (r¼ 0.14, adjusted P <1� 10�12).
Multivariable models and variance explainedby tentative validated factorsWe built three multivariable models to estimate thevariance explained by the tentatively validated factors.We opted to remove urinary cadmium from consider-ation in these models due to extensive missing infor-mation (only 1694 participants with 134 death eventsversus 5155 participants with 416 events). In the first,we entered five of the seven tentatively validatedT
ab
le4
Ten
tati
vely
vali
date
dfa
cto
rs.
Tra
inin
gd
eno
tes
esti
mate
fro
mtr
ain
ing
surv
ey,
NH
AN
ES
19
99
–2
00
2.
Tes
tin
gd
eno
tes
esti
mate
sfr
om
test
ing
surv
ey,
NH
AN
ES
20
03
–0
4.
Co
mb
ined
den
ote
ses
tim
ate
fro
mco
mb
inin
gtr
ain
ing
an
dte
stin
gsu
rvey
s
De
scri
pti
on
Tra
inin
gsu
rve
y(1
99
9–2
00
2)
Te
stin
gsu
rve
y(2
00
3–0
4)
Co
mb
ine
dsu
rve
ys
(19
99
–20
04
)
nE
ven
tsA
dju
sted
HR
[95
%C
I]P
-valu
eF
DR
nE
ven
tsA
dju
sted
HR
[95
%C
I]P
-valu
eA
dju
sted
HR
[95
%C
I]P
-valu
e
Cu
rren
t/p
ast
smo
ker
(vs
nev
ersm
ok
er)
Past
smo
ker
54
09
65
21
.50
[1.2
3,1
.83
]7
.8x
10�
51
.68
x1
0�
22
91
12
01
1.6
6[1
.10
,2.5
2]
1.6
5x
10�
21
.53
[1.2
7,1
.83
]5
.31
x1
0�
6
Cu
rren
tsm
ok
er5
40
96
52
2.0
0[1
.38
,2.8
9]
2.3
x1
0�
42
.80
x1
0�
22
91
12
01
3.1
7[1
.90
,5.2
8]
9.5
1x
10�
62
.20
[1.6
1,3
.00
]6
.59
x1
0�
7
Cad
miu
m(1
SD
log)
57
22
59
11
.37
[1.1
9,1
.57
]1
.2x
10�
59
.33
x1
0�
33
12
01
88
1.6
3[1
.34
,1.9
7]
5.6
6x
10�
71
.45
[1.2
8,1
.65
]3
.97
x1
0�
9
Tra
ns-
lyco
pen
e(1
SD
log)
30
96
26
20
.81
[0.7
2,0
.91
]2
.9x
10�
43
.20
x1
0�
23
05
41
79
0.7
9[0
.73
,0.8
6]
1.4
5x
10�
70
.80
[0.7
4,0
.86
]1
.20
x1
0�
9
Ph
ysic
al
act
ivit
y(M
ET
-base
dra
nk
)5
53
46
19
0.7
2[0
.66
,0.7
9]
4.0
x1
0�
12
<0
.00
12
98
91
91
0.6
3[0
.54
,0.7
2]
1.2
7x
10�
10
0.7
1[0
.66
,0.7
7]
4.4
7x
10�
18
Do
esan
yon
esm
ok
ein
ho
me?
60
08
65
52
.00
[1.5
5,2
.58
]1
.1x
10�
73
.5x
10�
33
25
82
02
1.8
8[1
.28
,2.7
6]
1.1
8x
10�
31
.99
[1.5
9,2
.48
]1
.14
x1
0�
9
Cad
miu
m,
uri
ne
(1S
Dlo
g)
17
83
18
61
.62
[1.2
8,2
.04
]5
.7x
10�
51
.58
x1
0�
21
07
95
92
.03
[1.4
7,2
.80
]1
.66
x1
0�
51
.66
[1.3
5,2
.04
]1
.14
x1
0�
6
All
esti
mate
sare
ad
just
edb
yage,
sex
,ra
ce,
SE
S,
edu
cati
on
an
do
ccu
pati
on
.n
an
dn
um
ber
of
even
tsare
un
wei
gh
ted
.F
DR
,fa
lse
dis
cove
ryra
te;
ME
T,
Met
ab
oli
ceq
uiv
ale
nt.
1804 INTERNATIONAL JOURNAL OF EPIDEMIOLOGY
by guest on March 24, 2016
http://ije.oxfordjournals.org/D
ownloaded from
factors [serum cadmium, physical activity, anyonesmoked in home, current smokers/past smokers(versus never smokers)] while adjusting for demo-graphic covariates (Table 5) for participants fromboth the training and testing surveys (Model A).The second model was similar to the first, containingsix of seven validated factors including trans-lycopene(Model B). The third multivariate model contained sixof seven validated factors but omitted socio-economicfactors, such as SES, education and occupation(Model C). The total number of participants availablein the combined testing and training surveys inModel A was 7381 (733 deaths). The total number
of participants available for Models B and C was5155 (416 deaths).
The total variance explained by models A, B and Cwas 14.4, 13.2 and 11%, respectively. The varianceexplained by the tentatively validated environmentaland behavioural factors in these models was 1.6, 2.1and 2.3%, respectively. Thus, models not includingtrans-lycopene but built on more complete datawere not inferior versus models including trans-lyco-pene. Moreover, models that did not consider socio-economic factors had a modestly lower R2 than thosethat did (13 versus 11%). The contribution of envir-onmental and behavioural factors was similar in
Figure 3 Pairwise correlations of factors with FDR <5% in the training set and of the standard demographic andsocio-economic factors used for adjustments
ENVIRONMENTAL AND BEHAVIOURAL FACTORS IN ALL-CAUSE MORTALITY 1805
by guest on March 24, 2016
http://ije.oxfordjournals.org/D
ownloaded from

Ta
ble
5M
ult
ivari
ab
lem
od
elco
effi
cien
ts
Mo
de
lA
Mo
de
lB
Mo
de
lC
Mu
ltiv
ari
ate
HR
[95
%C
I]P
-valu
eM
ult
ivari
ate
HR
[95
%C
I]P
-valu
eM
ult
ivari
ate
HR
[95
%C
I]P
-valu
e
Past
smo
ker
(vs.
nev
erS
mo
ker
)1
.36
[1.1
2,1
.64
]1
.49
x1
0�
31
.27
[0.9
4,1
.71
]0
.01
31
.28
[0.9
4,1
.73
]0
.11
3
Cu
rren
tS
mo
ker
(vs.
Nev
ersm
ok
er)
1.1
[0.7
2,1
.67
]0
.65
50
.91
[0.4
9,1
.71
]0
.77
50
.92
[0.5
,1.7
]0
.80
Ser
um
cad
miu
m(1
SD
of
log)
1.2
4[1
.11
,1.4
]2
.88
x1
0�
41
.24
[1.0
3,1
.49
]0
.02
11
.26
[1.0
4,1
.52
]0
.01
7
Tota
lp
hys
ical
act
ivit
y(M
ET
-base
dra
nk
)0.7
3[0
.68,0
.79]
3.0
6x
10�
14
0.6
7[0
.6,0
.74
]9
.99
x1
0�
16
0.6
5[0
.59
,0.7
2]
1.1
1x
10�
16
Do
esan
yon
esm
ok
ein
ho
me?
1.6
7[1
.24
,2.2
4]
7.3
0x
10�
41
.69
[1.1
7,2
.44
]4
.85
x1
0�
31
.76
[1.2
3,2
.51
]1
.98
x1
0�
3
Tra
ns-
lyco
pen
e(1
SD
of
log)
..
0.8
4[0
.77
,0.9
1]
3.0
2x
10�
50
.84
[0.7
7,0
.91
]4
.61
x1
0�
5
n(n
um
ber
of
even
ts)
7,3
81
(733)
5,1
55
(416)
5,1
55
(416)
Nagel
ker
ke
R2
0.1
44
[0.1
27
,0
.15
6]a
0.1
32
[0.1
11
,0
.14
38
]a0
.11
[0.1
02
,0
.12
9]a
Nagel
ker
ke
R2
(fu
ll-r
edu
ced
)0
.01
6[0
.00
9,
0.0
22
]a0
.02
1[0
.01
2,
0.0
28
]a0
.02
3[0
.01
5,0
.03
0]a
Mo
del
Ava
riab
les
Past
/cu
rren
tsm
ok
er,
seru
mca
dm
ium
,to
tal
ph
ysic
al
act
ivit
y,an
yon
esm
ok
ein
ho
me?
,age,
sex
,ra
ce/e
thn
icit
y,ed
uca
tio
n,
SE
S,
edu
cati
on
,o
ccu
pati
on
Mo
del
Bva
riab
les
Past
/cu
rren
tsm
ok
er,
seru
mca
dm
ium
,to
tal
ph
ysic
al
act
ivit
y,an
yon
esm
ok
ein
ho
me?
,tr
an
s-ly
cop
ene,
age,
sex
,ra
ce/e
thn
icit
y,ed
uca
tio
n,
SE
S,
edu
cati
on
,o
ccu
pati
on
Mo
del
Cva
riab
les
Past
/cu
rren
tsm
ok
er,
seru
mca
dm
ium
,to
tal
ph
ysic
al
act
ivit
y,an
yon
esm
ok
ein
ho
me?
,tr
an
s-ly
cop
ene,
age,
sex
,ra
ce/e
thn
icit
y
ME
T,
Met
ab
oli
ceq
uiv
ale
nt.
aC
Ico
mp
ute
db
yb
oo
tstr
ap
.
1806 INTERNATIONAL JOURNAL OF EPIDEMIOLOGY
by guest on March 24, 2016
http://ije.oxfordjournals.org/D
ownloaded from
models B and C. On the other hand, current smoking(P 40.7 in Models A–C, Table 5) and past smoking(Models B–C, Table 5) lost nominal significance(P 40.05) in multivariable models, indicating the cor-relative nature of the tentatively validated factors.
DiscussionOut of the 249 tested environmental and behaviouralfactors, we found that only physical activity, smokingand cadmium levels have consistent evidence forstrong and validated associations with all-cause mor-tality. Some other factors might have been missed dueto limited power. This suggests that the study of pu-tative environmental and behavioural risk factors thatregulate all-cause mortality at the general populationlevel will require very large studies and careful valid-ation. Given the small effect sizes of validated factors,continuing to perform modest-size studies with select-ive reporting of a few putative risk factors is unlikelyto yield reliable and conclusive answers. Tentativelyvalidated factors accounted for approximately 2% ofthe risk variance when demographic factors wereaccounted for, and this decreased little when socio-economic factors (income, education and occupation)were also accounted for. This suggests that little ofthe impact of these two modifiable behaviours outof 249 examined is explained by the few measuredsocio-economic forces that possibly influence physic-ally inactivity or smoking.
Whereas we did not subject the socio-economic fac-tors to validation, the volcano plot (Figure 2) showsthat descriptively the two lowest quintiles of incomewere strongly associated with mortality, with a hazardratio larger than any of the individual environmentaland behavioural factors tested. This relation specific tothe two lowest levels of income and mortality is con-sistent with prior work done on an earlier wave ofNHANES14 and thus should be further investigated,given the out-of-sample replication and strength ofassociation we observe.
Reassuringly, we were able to elicit well-known as-sociations between smoking and physical activity andall-cause mortality. Our estimates of increased riskwith current and past smoking are very similar tothose of a recent meta-analysis where relative riskswere 1.83 for current smokers and 1.34 for past smo-kers.32 Our protective estimates from physical activityare also similar to those identified by a recent largemeta-analysis of 80 cohorts.33 Physical activity34 andcurrent smoking35,36 are associated with average in-crease of 3–4 and decrease of 10 years in life expect-ancy, respectively, and physical inactivity andsmoking are thought to be each responsible for ap-proximately five million deaths worldwide. Our multi-variable analysis also reiterates the combined effect ofbehavioural/environmental risk factors on mortality.37
Nutrition and nutrition quality has also been con-nected with mortality risk. We found a marker for a
carotenoid nutrient (trans-lycopene) associated withall-cause mortality. Several observational studieshave found correlations between carotenoid levelsand mortality among elderly, for example amongwomen38 and among Italian individuals.39 InNHANES III, Shardell and colleagues observed amodest decrease in mortality for 2nd and 3rd quar-tiles of lycopene.40 However, interventions focusingon carotenoid-related nutrients have not shown anybenefits in clinical trials for prevention of chronic dis-ease and cause-specific death (e.g ref41). Further, arandomized trial of a ‘tomato-rich diet’ containinghigh amounts of lycopene failed to change chronicdisease risk profiles of 255 UK-based participants.42
Some investigations have suggested harm.43
Therefore, trans-lycopene may be a surrogate markerof other ‘healthy’ behaviours and possibly of a‘healthy diet’ profile. It is unclear which measuredor unmeasured correlate of trans-lycopene levelsmay be responsible for the association with mortalityrisk. Further, what exactly constitutes a ‘healthy diet’is currently very difficult to define, in contrast to ear-lier claims.44 We have previously documented a largecorrelation matrix of environmental factors,10 andfurther studies should investigate how nutritionaland other environmental and behavioural factorsrelate to one another8 to potentially trace sources ofbias and harness confounding.
We found that urinary and serum cadmium werealso associated with all-cause mortality. Tellez-Plazaet al. have reported similar results in these partici-pants for blood and urinary cadmium on bothall-cause and cardiovascular-related mortality, whileadjusting for many other cardiovascular-related riskfactors including smoking, cholesterol, blood pressureand medication use.45 Further studies will need toevaluate the relationship of behaviours that lead tocadmium exposure and all-cause or cause-specificmortality. For example, serum cadmium is postulatedto indicate current exposure whereas urinary cad-mium may reflect total body burden of cadmium,but urinary cadmium is reflective of serum levels.46
Serum cadmium levels increase as humans age, andsources include ambient air pollution (through fossilfuel combustion), diet and smoking.46 Cadmiumlevels were significantly correlated with smokingand age; however, the association of death risk withserum levels of cadmium was significant in the multi-variable models even after smoking had beenaccounted for.
Our analysis on all-cause mortality has severallimitations. First, to consider multiple factors in sys-tematic and standard fashion, we had to make as-sumptions about what covariates to adjust for in ourinitial scan and replication procedure. Investigatorsmay consider a different set of adjusting covariatesspecific for each factor; however, it is unclear howto attain a ‘standard’ set of covariates. We focusedon a set of demographic factors (age, sex and
ENVIRONMENTAL AND BEHAVIOURAL FACTORS IN ALL-CAUSE MORTALITY 1807
by guest on March 24, 2016
http://ije.oxfordjournals.org/D
ownloaded from
race/ethnicity) that are impossible to modify, and on aset of socio-economic factors (income, education, oc-cupation) that are very difficult for individuals tomodify (although they are amenable to social andother multi-level interventions). Second, not all par-ticipants in NHANES have available measurements onthe entire set of all factors assayed; thus, it is notpossible to subject the scan to the same number ofparticipants for each environmental and behaviouralfactor considered. This type of non-random missinginformation may lead to biased findings, as the sub-samples may not be representative of the largersample. Although we did not detect any differencesin population demographics of sub-samples, we ac-knowledge that missing data could have led to lossof power. Third, along these lines, our power calcula-tions based on the available data with non-missinginformation suggest that we had power to detectmodest relative risks, but many small effects couldeasily have been missed. The need to understandsmall effects requires a recalibration of our thinkingabout risk-factor epidemiology, with emphasis on verylarge studies and careful replication. For small effects,differentiating noise from genuine signals is difficult.Fourth, residual confounding is always possible in anyobservational associations, even those that are seem-ingly consistent and validated in different datasets.
Fifth, our data had a relative short follow-up in boththe training (median 6 years) and testing (median 3years) surveys and lacked repeated measurements offactors to assess the longer-term risk of these factorson mortality through time. We emphasize that in aninvestigation of non-institutionalized people in thegeneral population, many environmental and behav-ioural factors will require longer exposure and follow-up times to detect associations with mortality.Whereas factors found through this study havestrong evidence for association with all-cause mortal-ity, we cannot rule out important factors not identi-fied by these methods or these data. Further, thedeceased participants considered here are older indi-viduals (68 and 73 years mean age of deceased par-ticipants in the 1999–2002 and 2003–04 surveys,respectively), many of whose cause of death includedchronic cardiovascular-related disease, such as heartdisease.
Relatedly, many environmental factors, such as in-fectious agents, are only applicable to a small subsetof the population, have lower prevalence and/or play arole in cause-specific mortality such as cancer.Therefore, a systematic scan of factors in a generalpopulation will be underpowered to detect these pu-tative associations in the context of all-cause mortal-ity. Specifically, the top causes of death in the generalpopulation included cardiovascular-related diseases(e.g. ischaemic heart disease, stroke and myocardialinfarction) and the findings may only be pertinent toaetiologies of these diseases. On the other hand, fac-tors with larger effect sizes but higher FDR (outliers
on the volcano plot) can be noted for further investi-gation. For example, outliers in this study includedhepatitis B and C, factors that may cause livercancer.47 We emphasize that factors that are not topfindings in such a scan may still play a large role inmortality risk, albeit in smaller sub-populations.
Sixth, we cannot claim that our systematic scan ofenvironmental and behavioural factors in NHANEScovers the entire space of the ‘exposome’.48 The CDCand NCHS have selected an array of behavioural andenvironmental factors based on their prevalence,measurement feasibility and hypothesized influenceon population health. Furthermore, unlike staticgenetic factors, there is heterogeneity in exposure orself-reported factor ascertainment and exposures/behavioural factors will follow unique temporalpatterns throughout an individual’s lifetime.49 For ex-ample, factors such as pollutants (e.g. polychlorinatedbiphenyls) are lipophilic and persistent in fatty tissueand are accrue in tissue over time.10 Other factors,such as bisphenol A, are metabolized rapidly, areshort-lived and assume that individuals are continu-ously exposed to the factor (e.g. ref 50). Further, therelationships between the biomarkers and actual ex-posure are also difficult to surmise due to issues ofsample timing and differential elimination. Self-reported dietary factors derived from a single pointin time can be error-prone51,52 and there are docu-mented examples of lack of concordance with object-ive indicators of intake.53,54 As a result of lack ofcomprehensive measures and heterogeneity, our sys-tematic scan will have missed other candidate factorsputatively associated with mortality risk.
Acknowledging these caveats, we have shown a gen-eralized and systematic approach to identify strongand validated correlates of all-cause mortality and pri-oritize hypotheses regarding the association betweenenvironmental and behavioural factors and mortality.Instead of focusing on a few putative risk factors at atime, our approach gives a wider perspective aboutthe strength of the evidence (or lack thereof) andthe impact of a wide array of putative risk factorsthat may be possible to modify.
Supplementary DataSupplementary data are available at IJE online.
FundingThis work was supported by the National Heart, Lung,and Blood Institute [T32 HL007034] to C.J.P., and theNational Institute of Diabetes and Digestive Diseases[K24 DK085446] to G.M.C. and [K23 DK089086] toJ.T.L.
Conflict of interest: None declared.
1808 INTERNATIONAL JOURNAL OF EPIDEMIOLOGY
by guest on March 24, 2016
http://ije.oxfordjournals.org/D
ownloaded from
KEY MESSAGES
� Identification of environmental and behavioural factors associated with mortality is critical for publichealth and preventive care. However, there are few investigations that systematically search forassociations between environmental and behavioural factors and all-cause mortality.
� Here, we systematically associate 249 environmental and behavioural factors, such as urineary orserum markers of environmental exposure and self-reported nutrients, with time-to-death, and wereable to tentatively validate five factors robustly associated with mortality.
� Instead of focusing on a few risk factors at a time, our approach gives a wider perspective about thestrength of the evidence (or lack thereof) and the impact of a wide array of risk factors that may bepossible to modify.
References1 McGinnis JM, Foege WH. Actual causes of death in the
United States. JAMA 1993;270:2207–12.2 Mokdad AH, Marks JS, Stroup DF, Gerberding JL. Actual
causes of death in the United States, 2000. JAMA 2004;291:1238–45.
3 Danaei G, Ding EL, Mozaffarian D et al. The preventablecauses of death in the United States: comparative riskassessment of dietary, lifestyle, and metabolic risk fac-tors. PLoS Med 2009;6:e1000058.
4 Wild CP. The exposome: from concept to utility. Int JEpidemiol 2012;41:24–32.
5 Schwartz D, Collins F. Medicine. Environmental biologyand human disease. Science 2007;316:695–96.
6 Ioannidis JP. Why most discovered true associations areinflated. Epidemiology 2008;19:640–48.
7 Ioannidis JPA. Why Most Published Research FindingsAre False. PLoS Med 2005;2:e124.
8 Ioannidis J, Loy EY, Poulton R, Chia KS. ResearchingGenetic Versus Nongenetic Determinants of Disease: AComparison and Proposed Unification. Sci Transl Med2009;1:8.
9 Patel CJ, Bhattacharya J, Butte AJ. An Environment-Wide Association Study (EWAS) on type 2 diabetes mel-litus. PLoS One 2010;5:e10746.
10 Patel CJ, Cullen MR, Ioannidis JP, Butte AJ. Systematicevaluation of environmental factors: persistent pollutantsand nutrients correlated with serum lipid levels. Int JEpidemiol 2012;41:828–43.
11 Tzoulaki I, Patel CJ, Okamura T et al. A nutrient-wideassociation study on blood pressure. Circulation 2012;126:2456–64.
12 Fillenbaum GG, Burchett BM, Blazer DG. Identifying anational death index match. Am J Epidemiol 2009;170:515–18.
13 Adler NE, Rehkopf DH. U.S. disparities in health: descrip-tions, causes, and mechanisms. Annu Rev Public Health2008;29:235–52.
14 Rehkopf DH, Berkman LF, Coull B, Krieger N. The non-linear risk of mortality by income level in a healthy popu-lation: US National Health and Nutrition ExaminationSurvey mortality follow-up cohort, 1988-2001. BMCPublic Health 2008;8:383.
15 Ainsworth BE, Haskell WL, Whitt MC et al. Compendiumof physical activities: an update of activity codes and METintensities. Med Sci Sports Exerc 2000;32(Suppl 9):S498–504.
16 US Department of Health and Human Services. 2008Physical Activity Guidelines for Americans. Available from:http://www.health.gov/paguidelines/pdf/paguide.pdf (15January 2013, date last accessed).
17 Blanton CA, Moshfegh AJ, Baer DJ, Kretsch MJ. TheUSDA Automated Multiple-Pass Method accurately esti-mates group total energy and nutrient intake. J Nutr2006;136:2594–99.
18 U.S. Department of Agriculture, Agricultural ResearchService, Beltsville Human Nutrition Research Centeret al. What We Eat in America, NHANES 2003-2004.Beltsville, MD: Beltsville Human Nutrition ResearchCenter; Available from: ftp://ftp.cdc.gov/pub/Health_Statistics/nchs/nhanes/2003-2004/DR1TOT_C.XPT (15January 2013, date last accessed).
19 U.S. Department of Agriculture, Agricultural ResearchService, Beltsville Human Nutrition Research Centeret al. What We Eat in America, NHANES 2001-2002.Beltsville, MD: Beltsville Human Nutrition ResearchCenter; Available from: ftp://ftp.cdc.gov/pub/Health_Statistics/nchs/nhanes/2001-2002/DRXTOT_B.XPT (15January 2013, date last accessed).
20 U.S. Department of Agriculture, Agricultural ResearchService, Beltsville Human Nutrition Research Centeret al. What We Eat in America, NHANES 1999-2000.Beltsville, MD: Beltsville Human Nutrition ResearchCenter; Available from: ftp://ftp.cdc.gov/pub/Health_Statistics/nchs/nhanes/1999-2000/DRXTOT.XPT (15January 2013, date last accessed).
21 Flegal KM, Graubard BI, Williamson DF, Gail MH.Cause-specific excess deaths associated withunderweight, overweight, and obesity. JAMA 2007;298:2028–37.
22 Therneau T. A Package for Survival Analysis in S., R packageversion 2.36-14. 2012.
23 Lumley T. Survey: Analysis of Complex Survey Samples. Rpackage version 3.14; 2009.
24 StataCorp. Stata Statistical Software: Release 10. 10th edn.College Station, TX: StataCorp LP, 2007.
25 Patel CJ, Chen R, Kodama K, Ioannidis JP, Butte AJ.Systematic identification of interaction effects betweengenome- and environment-wide associations in type 2diabetes mellitus. Hum Genet 2013;132:495–509.
26 Efron B. Large-Scale Inference. Cambridge, UK: CambridgeUniversity Press, 2010.
27 Gordon A. Classification. 2nd edn. Boca Raton, FL:Chapman and Hall/CRC, 1999.
ENVIRONMENTAL AND BEHAVIOURAL FACTORS IN ALL-CAUSE MORTALITY 1809
by guest on March 24, 2016
http://ije.oxfordjournals.org/D
ownloaded from
28 Qiu W, Chavarro J, Lazarus R, Rosner B, Ma J.powerSurvEpi: Power and sample size calculation for sur-vival analysis of epidemiological studies; R package ver-sion 0.0.6; 2012.
29 Hsieh FY, Lavori PW. Sample-size calculations for the Coxproportional hazards regression model with nonbinarycovariates. Control Clin Trials 2000;21:552–60.
30 Schoenfeld DA. Sample-size formula for the proportional-hazards regression model. Biometrics 1983;39:499–503.
31 Davison A, Hinkley D. Bootstrap Methods and TheirApplication. Cambridge, UK: Cambridge University Press,1997.
32 Gellert C, Schottker B, Brenner H. Smoking and all-causemortality in older people: systematic review and meta-analysis. Arch Intern Med 2012;172:837–44.
33 Samitz G, Egger M, Zwahlen M. Domains of physicalactivity and all-cause mortality: systematic review anddose-response meta-analysis of cohort studies. Int JEpidemiol 2011;40:1382–400.
34 Moore SC, Patel AV, Matthews CE et al. Leisure timephysical activity of moderate to vigorous intensity andmortality: a large pooled cohort analysis. PLoS Med2012;9:e1001335.
35 Jha P, Ramasundarahettige C, Landsman V et al. 21st-century hazards of smoking and benefits of cessation inthe United States. N Engl J Med 2013;368:341–50.
36 Pirie K, Peto R, Reeves GK, Green J, Beral V. The 21stcentury hazards of smoking and benefits of stopping: aprospective study of one million women in the UK. Lancet2013;381:133–41.
37 Loef M, Walach H. The combined effects of healthy life-style behaviours on all cause mortality: a systematicreview and meta-analysis. Prev Med 2012;5:163–70.
38 Nicklett EJ, Semba RD, Xue QL et al. Fruit and vegetableintake, physical activity, and mortality in older commu-nity-dwelling women. J Am Geriatr Soc 2012;60:862–68.
39 Lauretani F, Semba RD, Dayhoff-Brannigan M et al. Lowtotal plasma carotenoids are independent predictors ofmortality among older persons: the InCHIANTI study.Eur J Nutr 2008;47:335–40.
40 Shardell MD, Alley DE, Hicks GE et al. Low-serum carot-enoid concentrations and carotenoid interactions predictmortality in US adults: the Third National Health andNutrition Examination Survey. Nutr Res 2011;31:178–89.
41 MRC/BHF Heart Protection Study of antioxidant vitaminsupplementation in 20,536 high-risk individuals: a rando-mised placebo-controlled trial. Lancet 2002;360:23–33.
42 Thies F, Masson LF, Rudd A et al. Effect of a tomato-richdiet on markers of cardiovascular disease risk in moder-ately overweight, disease-free, middle-aged adults: a ran-domized controlled trial. Am J Clin Nutr 2012;95:1013–22.
43 Bjelakovic G, Nikolova D, Gluud LL, Simonetti RG,Gluud C. Antioxidant supplements for prevention of mor-tality in healthy participants and patients with variousdiseases. Cochrane Database Syst Rev 2012;3:CD007176.
44 Hu FB, Willett WC. Optimal Diets for Prevention ofCoronary Heart Disease. JAMA 2002;288:2569–78.
45 Tellez-Plaza M, Navas-Acien A, Menke A,Crainiceanu CM, Pastor-Barriuso R, Guallar E. Cadmiumexposure and all-cause and cardiovascular mortality inthe U.S. general population. Environ Health Perspect 2012;120:1017–22.
46 Centers for Disease Control and Prevention, Agency forToxic Substances and Disease Registry. ATDSR–Toxicological Profile: Cadmium. http://www.atsdr.cdc.gov/toxprofiles/tp.asp?id¼48&tid¼15 (15 January 2013, datelast accessed).
47 Altekruse SF, McGlynn KA, Reichman ME.Hepatocellular carcinoma incidence, mortality, and sur-vival trends in the United States from 1975 to 2005.J Clin Oncol 2009;27:1485–91.
48 Rappaport SM, Smith MT. Environment and DiseaseRisks. Science 2010;330:460–61.
49 Athersuch TJ. The role of metabolomics in characterizingthe human exposome. Bioanalysis 2012;4:2207–12.
50 Calafat AM, Ye X, Wong LY, Reidy JA, Needham LL.Exposure of the U.S. population to bisphenol A and 4-ter-tiary-octylphenol: 2003-2004. Environ Health Perspect 2008;116:39–44.
51 Briefel RR, Flegal KM, Winn DM, Loria CM, Johnson CL,Sempos CT. Assessing the nation’s diet: limitations of thefood frequency questionnaire. J Am Diet Assoc 1992;92:959–62.
52 Byers T. Food frequency dietary assessment: how bad isgood enough? Am J Epidemiol 2001;154:1087–88.
53 Brown D. Do food frequency questionnaires have toomany limitations? J Am Diet Assoc 2006;106:1541–42.
54 Schatzkin A, Kipnis V, Carroll RJ et al. A comparison ofa food frequency questionnaire with a 24-hour recallfor use in an epidemiological cohort study: resultsfrom the biomarker-based Observing Protein andEnergy Nutrition (OPEN) study. Int J Epidemiol 2003;32:1054–62.
1810 INTERNATIONAL JOURNAL OF EPIDEMIOLOGY
by guest on March 24, 2016
http://ije.oxfordjournals.org/D
ownloaded from