Edge-competing Pathological Liver Vessel Segmentation with ...
Open Access2008Kilpinenet al.Volume 9, Issue 9, Article R139MethodSystematic bioinformatic analysis of expression levels of 17,330 human genes across 9,783 samples from 175 types of healthy and pathological tissuesSami Kilpinen¤*†, Reija Autio¤‡, Kalle Ojala*†, Kristiina Iljin*, Elmar Bucher*, Henri Sara*, Tommi Pisto*, Matti Saarela‡, Rolf I Skotheim*§, Mari Björkman*, John-Patrick Mpindi*, Saija Haapa-Paananen*, Paula Vainio*, Henrik Edgren*†, Maija Wolf*†, Jaakko Astola‡, Matthias Nees*, Sampsa Hautaniemi¶ and Olli Kallioniemi*†
Addresses: *Medical Biotechnology, VTT Technical Research Centre and University of Turku, Itäinen pitkäkatu 4C, Turku, Finland. †Institute for Molecular Medicine Finland (FIMM), University of Helsinki, Tukholmankatu 8, Helsinki, Finland. ‡Department of Signal Processing, Tampere University of Technology, Korkeakoulunkatu 1, Tampere, Finland. §Department of Cancer Prevention, Institute for Cancer Research, Rikshospitalet-Radiumhospitalet Medical Centre, Oslo, NO-0310, Norway. ¶Computational Systems Biology Laboratory, Institute of Biomedicine and Genome-Scale Biology Research Program, University of Helsinki, Haartmaninkatu 8, Finland.
¤ These authors contributed equally to this work.
Correspondence: Olli Kallioniemi. Email: [email protected]
© 2008 Kilpinen et al; licensee BioMed Central Ltd. This is an open access article distributed under the terms of the Creative Commons Attribution License (http://creativecommons.org/licenses/by/2.0), which permits unrestricted use, distribution, and reproduction in any medium, provided the original work is properly cited.GeneSapiens<p>A method for the comparison of mRNA expression levels of most human genes across gene expression array experiments, and a data-base of the results, are presented.</p>
Abstract
Our knowledge on tissue- and disease-specific functions of human genes is rather limited and highlycontext-specific. Here, we have developed a method for the comparison of mRNA expressionlevels of most human genes across 9,783 Affymetrix gene expression array experimentsrepresenting 43 normal human tissue types, 68 cancer types, and 64 other diseases. This databaseof gene expression patterns in normal human tissues and pathological conditions covers 113 milliondatapoints and is available from the GeneSapiens website.
BackgroundA fundamental challenge in the post-genome era is the iden-tification of the context-specific functions of human genesacross healthy and disease tissues. Thousands of gene expres-sion microarray measurements are performed each year bythe scientific community and many of the data are made pub-licly available. In order to make use of this resource, integra-tion of large collections of gene expression data from differenttissues and microarray platforms is required. Available data-
sets, however, are often discordant and challenging to inte-grate due to the variety of the technologies used.Nevertheless, meta-analyses have already been shown tofacilitate the analysis of gene expression across healthy anddisease states [1-3]. Due to the use of various microarray plat-forms in studies, the multiple datasets are typically analyzedseparately [4-9], for instance, focusing on cancer-normalcomparisons within an organ type. Other studies have lookedfor systematic co-expression patterns between genes across
Published: 19 September 2008
Genome Biology 2008, 9:R139 (doi:10.1186/gb-2008-9-9-r139)
Received: 15 May 2008Revised: 7 August 2008Accepted: 19 September 2008
The electronic version of this article is the complete one and can be found online at http://genomebiology.com/2008/9/9/R139
Genome Biology 2008, 9:R139
http://genomebiology.com/2008/9/9/R139 Genome Biology 2008, Volume 9, Issue 9, Article R139 Kilpinen et al. R139.2
multiple datasets in order to predict functions of genes[1,3,10-15]. While this is useful for the understanding of com-mon shared functions of genes across different organs, highlytissue- or disease-specific gene functions may be missed.
Here, we describe the development of a database of in silicotranscriptomics data that currently integrates 157 separatestudies involving 9,783 human specimens, from 43 normaltissue types, 68 cancer types and 64 other disease types. Thelaunch of the database was made possible by the developmentand validation of a novel method to normalize data arisingfrom different Affymetrix microarray generations. The arraydata are linked with detailed clinical classifications and end-points and are available through an interactive web interfacedesigned for exploration by biologists and available at theGeneSapiens website [16]. We demonstrate here the applica-tion of the GeneSapiens system to the tissue- and disease-spe-cific expression profiles of human genes one at a time or asgene clusters.
Results and discussionOverview of the in silico transcriptomics data in the GeneSapiens systemThe database was constructed from 9,783 CEL files ofAffymetrix based gene expression measurements from nor-mal and pathological human in vivo tissues and cells. Weselected data from the five most widely used Affymetrix arraygenerations (HG-U95A, HG-U95Av2, HG-U133A, HG-U133B, HG-U133 Plus 2), which were then normalizedtogether. The detailed contents of the database are describedin Additional data files 3 and 4. Each sample was systemati-cally manually annotated with detailed information (whenavailable) on sample collection procedures, demographicdata, anatomic location, disease type, and clinicopathologicaldetails. These integrated data make it possible to generateexpression profiles of any gene across 175 human tissue anddisease types.
Custom software was developed to construct the databasefrom the collection of CEL files and manually curated annota-tions linked to each sample. The software was based upon aPerl wrapper calling several subprograms written in Perl, R[17], C++ and MySQL and Linux Bash scripts. The subpro-grams identify unique CEL files by using cyclic redundancychecks, preprocess the files, perform the normalization steps,fetch gene annotations from Ensembl and incorporate themanually made annotation for each sample, create a completeMySQL database and perform the final integrity checks. Vis-ualization and analysis tools were implemented in R [17], andthe processed data are made available through a user-friendlyand interactive web site [16]. We also implemented a virtualmachine approach, the final result being a hardware-inde-pendent and rapidly installable complete operating systemoptimized for running the GeneSapiens database and web-server for the visualization interface.
Development of the data normalization procedureWe implemented a three-step normalization strategy thatconsisted of probe-level preprocessing, equalization transfor-mation (Q) and array-generation-based gene centering(AGC). We demonstrate that these steps resulted in data thatare comparable across the major Affymetrix arraygenerations.
Step I: data preprocessing at the probe levelWe first used the MAS5.0 method [18] to preprocess raw datain the .CEL files. MAS5.0 is an optimal algorithm for the pur-pose of analyzing very large datasets [19] as it requires lessmemory than other widely used methods, and the biologicalrepresentativity of the MAS5.0 normalized data is well docu-mented [19]. In the three-step normalization approach, thesubsequent normalization stages also minimized possibleproblems generated by the MAS5.0 preprocessing algorithm.
Importantly, we mapped the probes from each array genera-tion type directly to Ensembl gene IDs by using alternativeCDF files (version 10) [20] to avoid inaccuracies generated bythe original probeset design of Affymetrix arrays. Therefore,this resulted in the optimal redefinition of the gene specifici-ties of the probes and excluded those probes that, accordingto the recent genome assembly, mapped to multiple genes ornowhere in the genome.
Step II: Q normalizationAfter preprocessing, we performed sample-wise normaliza-tion of the entire dataset at the gene level. This was done byequalization transformation [21] (Q), which is similar to thewidely used quantile normalization [22] in which the samplesare transformed by substituting their values with the meansof quantiles in the entire dataset. In the Q procedure, wetransformed each sample to follow a normal distribution thatwas estimated from the log2-transformed values of the entiredataset (Additional data file 1). The estimated parameterswere a mean of 8 and standard deviation of 2. This step of thesample-wise normalization was necessary to prevent a smallnumber of aberrant samples from dominating the mean val-ues for genes within an array generation used in the AGCcorrection.
Step III: array-generation-based gene centering (AGC normalization)We developed a novel AGC method to avoid the bias causedby the different oligos quantifying the same gene in the differ-ent Affymetrix array generations. The AGC method is basedon the availability of data, on each array generation, from alarge number of samples representing different tissues or dis-eases. In the AGC method, a correction factor is calculated foreach gene in each array generation. These correction factorsare then used to normalize the gene expression distributionsacross the whole database (see Materials and methods fordetails).
Genome Biology 2008, 9:R139

http://genomebiology.com/2008/9/9/R139 Genome Biology 2008, Volume 9, Issue 9, Article R139 Kilpinen et al. R139.3
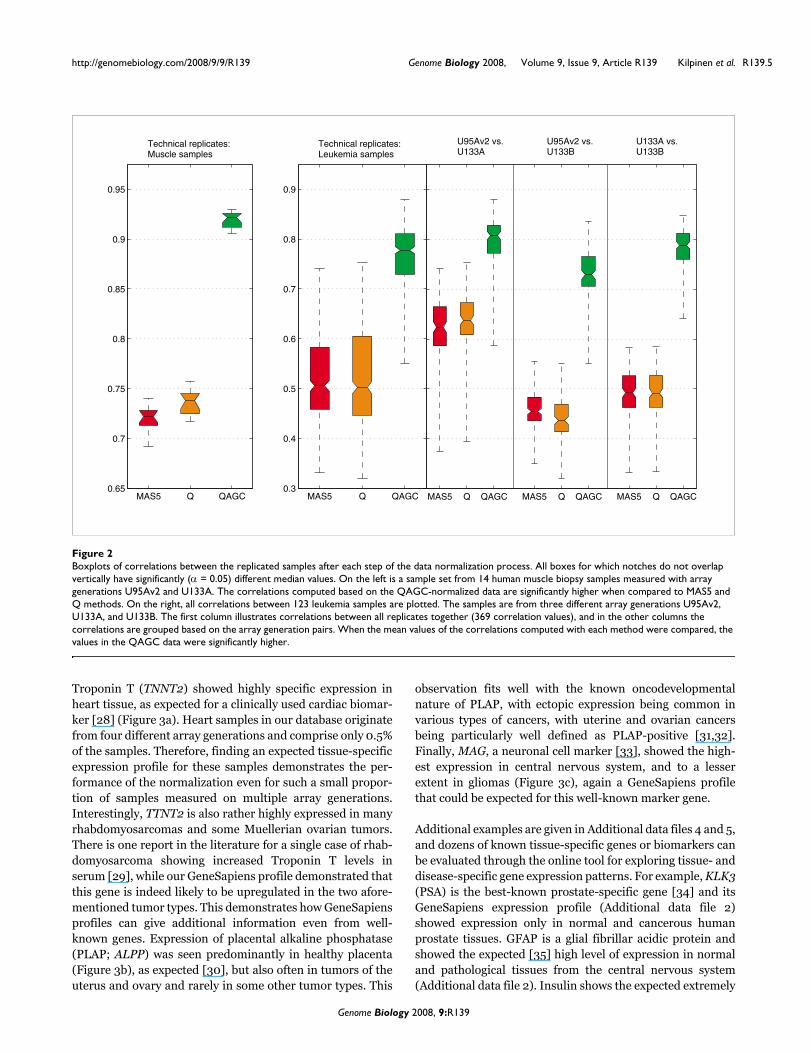
Validating the entire normalization protocolWe validated the AGC method as well as the entire normali-zation procedure by a number of ways and demonstrated thatwe had achieved improved comparability of the data acrossthe multiple array generations. First, analysis by multi-dimensional scaling (MDS) showed that samples from 15 nor-mal human tissues tested clustered initially based on the fourarray generations (Figure 1a, b), but after the AGC procedure,the tissue of origin was the primary driver of the clustering(Figure 1c, d). Second, in K-means clustering of the samedata, we showed that the corrected rand index [23] (a meas-ure of the accuracy of the sample segregation into character-istic clusters) for array generations decreased from 0.45 to0.15 and that of the tissues jumped from 0.22 to 0.92 (Addi-tional data file 5). Third, correlation of data from two largedatasets where the same samples had been analyzed on twodifferent array generations improved significantly after theAGC correction (Figure 2), reaching across-generation corre-lations of 0.9. Finally, and most importantly, we showed thatthe gene profiles of multiple previously known tissue-specificgenes matched exactly with those expected based on litera-ture data. Therefore, we expect poorly known genes to pro-vide similarly informative results on their biological andmedical importance. These various validation steps aredescribed in more detail below.
Multi-dimensional scaling analysisWe applied MDS [24] to the data processed by Q normaliza-tion alone or after the AGC correction. This was done to com-pare the variability (that is, noise) caused by the arraygeneration with the biological variability in the data. We eval-uated 1,137 healthy tissue samples having 7,390 genes incommon without any missing values. The samples repre-sented 15 distinct anatomical locations with more than 20samples from each site. The samples were measured with fourarray generations (HG-U133A Plus 2, HG-U133A, HG-U95Aand HG-U95Av2). In Q normalized data, only some tissue-associated variation could be observed (Figure 1a), while theclusters were primarily driven by the array generations (Fig-ure 1b). After the AGC step was applied, a major change in theclustering of the samples was seen. Array generations nolonger defined clusters (Figure 1c), which were now formedpredominantly by the tissue types (Figure 1d). The effect wasvery striking and defined, for example, a clear cluster of neu-ronal, muscle, hematological and lung tissues. Even thoughthe MDS in three dimensions gives an illustrative example ofthe segregation of these 15 tissues types, we do not expect theclusters to be completely separated with MDS and only threedimensions. The main reason is that there is significant bio-logical similarity as well as biological variability within eachtissue type (such as multiple overlapping cell types). How-ever, this analysis was not meant to provide a demonstrationof complete classification accuracy of human tissues butrather to validate the biological relevance of our data. Takentogether, the analysis indicates clear improvement in overall
biological relevance of the data after our three-step normali-zation procedure.
K-means clusteringWe clustered the data before and after normalization withfour initial centroids using the median values of each arraygeneration, and again with 15 initial centroids using themedian values of each tissue type. This test was done for thespecific purpose of comparing the impact of the variation gen-erated by the array generations before and after normaliza-tion. We calculated the corrected rand indices [23] for eachclustering to see whether the array generations or the tissuetypes form more accurate clusters. The corrected rand indexcompares partitions defined by the K-means clustering to theknown partitions of the data (for example, partitions by arraygeneration or by tissue type). The index varies between [1, 0]where one indicates that the partitions are identical and notdue to chance, whereas zero indicates that the found parti-tions would be expected by chance. The corrected rand indexfor the array generations went down from 0.45 to 0.15 whenwe applied the AGC normalization, while the corrected randindex for tissues jumped from 0.22 to 0.92. The percentagesof samples per array generation and per tissue type segre-gated to the distinct clusters are given in Additional data file5.
We also tested the impact of the Q normalization step by per-forming the same clustering operations on AGC correctedMAS5 data. In this case, the corrected rand index for arraygenerations was 0.11 and for tissue types 0.84. This resultshowed that AGC could also significantly improve MAS5 dataeven without the Q normalization, but that the three consec-utive steps provided the optimal ability to distinguish biolog-ically relevant signals.
Correlations of technical replicatesWe then studied the correlations between technical replicatesof the same samples analyzed on different Affymetrix arraygenerations. While in itself this does not ensure optimal nor-malization, such analyses have often been used to comparedata from different array generations in previous publications[4,9,25]. Thus, we used data from three datasets as a basis forthese analyses [9,26,27]. We first used data for 14 samples ofhuman muscle biopsy samples from patients with inflamma-tory myopathies [9]. For these cases, data from hybridiza-tions on both HG-U95Av2 and HG-U133A human arrayswere available. The correlation coefficient of each replicatepair was > 0.9 when normalized with the AGC method com-pared to the correlation of the preprocessed and Q normal-ized values, which were less than 0.75, a significant difference(Figure 2a). We then utilized a dataset from St Jude Chil-dren's Research Hospital [26,27] of 123 human leukemias,each analyzed with the three array generations; HG-U95Av2,HG-U133A and HG-U1331B. The mean value of the correla-tions computed based on the AGC corrected data was signifi-cantly higher, 0.78, than the mean of correlations computed
Genome Biology 2008, 9:R139

http://genomebiology.com/2008/9/9/R139 Genome Biology 2008, Volume 9, Issue 9, Article R139 Kilpinen et al. R139.4
based on pre-processed or Q normalized values, which was0.5 (Figure 2b). For most comparisons, the Q normalized cor-relations were also slightly higher than those with pre-processing alone.
In summary, validation of the normalization approach (Fig-ures 1a–d, 2a, b; Additional data file 5) together indicate that,in our three-step data processing procedure, the samplesclustered mainly according to array generation, until the lastAGC correction is applied. After the last AGC step, the biolog-ical origin of the samples, and not the array generation, drovethe clustering (Figure 1d). Therefore, our in silico transcrip-tomics data have been integrated across all the array genera-tions to the extent that biological variability caused by thetissue and disease types will exceed the technical noise causedby the array generations. This does not mean that the differ-ences between array generations are non-existent, but theywill be smaller than most of the biological differences. Thefinal and most important validation of the method was the
demonstration that known tissue-and disease-specific genesgenerated expected profiles across all tissues and diseases(see examples below), thus validating that technical variationis diminished enough to allow accurate biological findings tobe made.
Validating GeneSapiens expression profiles with known tissue-specific genesTo evaluate the biological relevance of gene expression pro-files from in silico transcriptomics data, we generated tissue-and disease-wide expression profiles for well-known tissue-specific marker genes. Figure 3 provides examples of theGeneSapiens plots for TNNT2, ALPP and MAG. In theseplots, all the 9,783 samples are represented along the x-axisin a pre-determined fixed order, first the normal tissues, thencancers and then other diseases. The y-axis reflects the rela-tive level of gene expression after the three-step normaliza-tion approach.
Multidimensional scaling (MDS) of Q normalized data before and after AGC correctionFigure 1Multidimensional scaling (MDS) of Q normalized data before and after AGC correction. MDS was performed using 1,137 healthy in vivo samples representing 15 tissue categories with 7,390 genes in common without missing values. Color codes show the array generation of each sample for panles on the left-hand side and the high level anatomical system from which samples originate for panels on the right-hand side. (a, b) Clustering of samples in Q normalized data without AGC correction. (a) Clustering driven dominantly by the array generations, but some biological division can be seen in the form of some division within the large clusters. (b) Several tissue classes are separated into two or more clusters due to the different array generation of origin. (c, d) After QAGC, array generations no longer define clusters (c) but instead tissue types form distinct clusters (d).
(a) (b)
(c) (d)
Genome Biology 2008, 9:R139
http://genomebiology.com/2008/9/9/R139 Genome Biology 2008, Volume 9, Issue 9, Article R139 Kilpinen et al. R139.5
Troponin T (TNNT2) showed highly specific expression inheart tissue, as expected for a clinically used cardiac biomar-ker [28] (Figure 3a). Heart samples in our database originatefrom four different array generations and comprise only 0.5%of the samples. Therefore, finding an expected tissue-specificexpression profile for these samples demonstrates the per-formance of the normalization even for such a small propor-tion of samples measured on multiple array generations.Interestingly, TTNT2 is also rather highly expressed in manyrhabdomyosarcomas and some Muellerian ovarian tumors.There is one report in the literature for a single case of rhab-domyosarcoma showing increased Troponin T levels inserum [29], while our GeneSapiens profile demonstrated thatthis gene is indeed likely to be upregulated in the two afore-mentioned tumor types. This demonstrates how GeneSapiensprofiles can give additional information even from well-known genes. Expression of placental alkaline phosphatase(PLAP; ALPP) was seen predominantly in healthy placenta(Figure 3b), as expected [30], but also often in tumors of theuterus and ovary and rarely in some other tumor types. This
observation fits well with the known oncodevelopmentalnature of PLAP, with ectopic expression being common invarious types of cancers, with uterine and ovarian cancersbeing particularly well defined as PLAP-positive [31,32].Finally, MAG, a neuronal cell marker [33], showed the high-est expression in central nervous system, and to a lesserextent in gliomas (Figure 3c), again a GeneSapiens profilethat could be expected for this well-known marker gene.
Additional examples are given in Additional data files 4 and 5,and dozens of known tissue-specific genes or biomarkers canbe evaluated through the online tool for exploring tissue- anddisease-specific gene expression patterns. For example, KLK3(PSA) is the best-known prostate-specific gene [34] and itsGeneSapiens expression profile (Additional data file 2)showed expression only in normal and cancerous humanprostate tissues. GFAP is a glial fibrillar acidic protein andshowed the expected [35] high level of expression in normaland pathological tissues from the central nervous system(Additional data file 2). Insulin shows the expected extremely
Boxplots of correlations between the replicated samples after each step of the data normalization processFigure 2Boxplots of correlations between the replicated samples after each step of the data normalization process. All boxes for which notches do not overlap vertically have significantly (α = 0.05) different median values. On the left is a sample set from 14 human muscle biopsy samples measured with array generations U95Av2 and U133A. The correlations computed based on the QAGC-normalized data are significantly higher when compared to MAS5 and Q methods. On the right, all correlations between 123 leukemia samples are plotted. The samples are from three different array generations U95Av2, U133A, and U133B. The first column illustrates correlations between all replicates together (369 correlation values), and in the other columns the correlations are grouped based on the array generation pairs. When the mean values of the correlations computed with each method were compared, the values in the QAGC data were significantly higher.
MAS5 Q QAGC0.65
0.7
0.75
0.8
0.85
0.9
0.95
Technical replicates:Muscle samples
MAS5 Q QAGC0.3
0.4
0.5
0.6
0.7
0.8
0.9
Technical replicates:Leukemia samples
MAS5 Q QAGC MAS5 Q QAGC MAS5 Q QAGC
U95Av2 vs.U133A
U95Av2 vs.U133B
U133A vs.U133B
Genome Biology 2008, 9:R139

http://genomebiology.com/2008/9/9/R139 Genome Biology 2008, Volume 9, Issue 9, Article R139 Kilpinen et al. R139.6
Detailed expression profiles of TNNT2, ALPP and MAGFigure 3Detailed expression profiles of TNNT2, ALPP and MAG. (a) TNNT2 is a clinically used cardiac biomarker and, as expected, it shows heart-specific expression. In addition, it has been shown that TNNT2 has elevated expression in some cases of rhabdomyosarcoma, also visible from the profile. (b) ALPP had high expression in placenta and somewhat elevated expression in uterine tumors. Additionally, serous ovarian tumors showed elevated expression when compared to the mucinous ones. (c) Known neuronal marker gene MAG similarly shows an expression profile that was highly central nervous system specific.
2000 4000 6000 8000
050
0010
000
1500
0
TNNT2, ENSG00000118194
Samples
circulating reticulocyteheartperipheral nerv.systempancreas
ALLsarcomamesotheliomaperitoneal cancer
2000 4000 6000 8000
010
020
030
040
0
ALPP, ENSG00000163283
Samples
circulating reticulocyteperipheral nerv.systemendocrine systemliveruterusplacenta
ALLperitoneal cancerovarian canceruterine cancercervical cancer
2000 4000 6000 8000
010
0020
0030
0040
0050
0060
00
MAG, ENSG00000105695
Samples
central nerv. system glioma
Anatomical systemHematologicalConnect. and musc.RespiratoryNervousEndocrine & Salivary
GI tract & organsUrogenitalGynegological & BreastStem cells
(a)
(b)
(c)
Genome Biology 2008, 9:R139

http://genomebiology.com/2008/9/9/R139 Genome Biology 2008, Volume 9, Issue 9, Article R139 Kilpinen et al. R139.7
pancreas-specific expression (Additional data file 6). LDHC,a known germ-cell specific marker [36], showed a strong tes-tis-specific expression profile (Additional data file 6).
GeneSapiens makes it possible to generate gene expressionprofiles for 17,330 genes across 175 systematically annotatedhuman tissues in a uniform scale with 2,265 to 9,783 datapoints per gene. Due to the breadth of the tissue and diseasespectrum, this kind of analysis provides novel insights intothe biological, medical and clinical associations of genes. Fur-thermore, the expression levels of a given gene can be com-pared across all normal tissues and all disease types, not justbetween specific test and control samples (like normal andtumor tissues from the same organ as is usually done). Figure4a, b illustrate the power of this global tissue- and disease-wide analysis, displaying the expression profile of the PRAMEgene. PRAME (preferentially expressed melanoma antigen)showed high expression in normal testis, but was very highlyover-expressed in a large variety of human cancers. PRAMEover-expression has been previously described in many can-cer forms [37] and is known to function as a dominant repres-sor of retinoic acid receptor signaling [37].
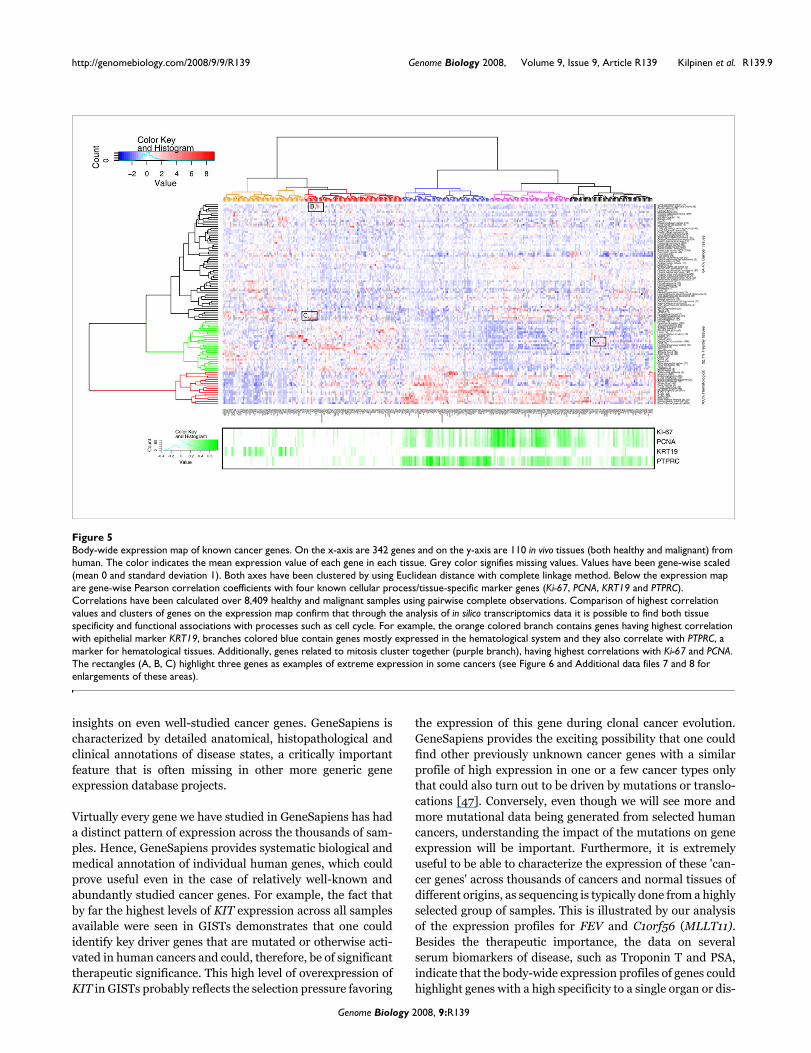
'Body-map' analysis to visualize expression profiles for groups of genes across all tissues and diseasesTo illustrate the power of GeneSapiens analysis in the study ofgene expression profiles of human cancer genes (as definedby Sanger Center human cancer gene census), we produced aclustered map of the mean expression levels of 342 cancergenes across 110 healthy and malignant human tissues (Fig-ure 5). Clustering along the sample type (y-axis) revealed thatbased on the expression profiles of these cancer genes, thesamples could be divided into three overall classes: solidtumors (84.4% of sample types were malignant in this class),normal tissues (82.1% of sample types were healthy in thisclass) and hematological samples (100% sample types werenormal or malignant hematological samples in this class).Thus, the group of classic cancer genes had distinctly differ-ent expression between healthy and malignant solid tissues,but in hematological samples, cancer and normal samplescould not be separated.
Clustering of the cancer genes according to their mean body-wide expression profiles revealed five characteristic sub-groups. Expression of MKI67 (Ki-67) [38] and PCNA [39]genes, two cell proliferation markers, showed the highest cor-relations with specific branches of the cancer genes (Figure 5,purple branch). KRT19 (a known epithelial marker) [40] andPTPRC (an established marker for hematopoiesis) [41]revealed a correlation with genes in the orange and bluebranches. Genes most highly associated with proliferationmarkers were clearly the ones with gain of expression in solidmalignant tissues. The branch colored red contained enrich-ments of Gene Ontology classes [42,43] related to differenti-ation, cell adhesion and catabolic processes (data not shown),
which fits with the tendency for down-regulation of this groupof cancer genes in malignant tumors.
This kind of body-wide expression map of genes can also beused to pinpoint medically interesting associations for indi-vidual genes (three examples marked with rectangles andlabeled A, B and C). KIT had the highest GeneSapiens expres-sion level in gastrointestinal stromal tumors (GISTs; Figure 5,rectangle A, and Figure 6). KIT is a key therapeutic target ofGleevec in GIST tumors [44]. The body-wide expression pro-files of GeneSapiens would have therefore readily identifiedthis association of KIT with GIST samples along with thistherapeutic opportunity.
The second example is FEV (Figure 5, rectangle B, and Addi-tional data file 7), a gene known to have functions in healthynervous system. This ETS-family transcription factor showedlow, but detectable, expression in healthy central nervous sys-tem and in prostate. In malignant tissues FEV had highly ele-vated expression in synovial sarcoma, neuroblastoma,malignant peripheral nerve sheath tumors, and small intesti-nal adenocarcinoma, and somewhat elevated expression inprostate cancer.
The third example of cancer gene profiles is C1orf56, alsoknown as AF1Q or MLLT11 (Figure 5, rectangle C, and Addi-tional data file 8). In healthy tissues it was expressed only inthe nervous system, but in malignant tissues there was gain ofexpression in T-cell acute lymphoid leukemia, Ewing sar-coma, lung small cell cancer, and nephroblastoma, andextreme overexpression in neuroblastoma. MLLT11 is knownto be fused to the MLL gene in acute leukemias [45]. Thisraises the possibility that MLLT11 could be a fusion gene tar-get [46,47] or undergoing activating mutations in a range oftumor types. Alternatively, the high levels of expression inthese tumors suggest that this gene is often activated in can-cer by other mechanisms.
ConclusionThe major advantage of the GeneSapiens data mining meth-odology is that it provides an integrated view of human geneexpression levels across thousands of samples representinghundreds of different tissue and disease types. GeneSapiensoffers unprecedented possibilities to study gene expressionlevels not only between a particular tumor type and the corre-sponding normal tissue, but by providing body-wide over-views of gene expression levels across all kinds of normal anddisease states. While meta-analysis of microarray data[48,49] has been previously demonstrated to be powerful intaking advantage of the enormous amounts of publicly avail-able data [1,2,50] most existing methods, such as Oncomine[2] and Genvestigator [51], are based on the analysis of onestudy at a time. Others, like the Celsius resource, provide theanalysis option on one Affymetrix array generation only,therefore providing data from a more limited spectrum of tis-
Genome Biology 2008, 9:R139

http://genomebiology.com/2008/9/9/R139 Genome Biology 2008, Volume 9, Issue 9, Article R139 Kilpinen et al. R139.8
sues and diseases. In comparison, GeneSapiens providesinsights on 'body- and disease-wide' expression of 17,330genes in approximately 10,000 human samples. Its value is
evidenced by the capturing of much of the known data on bio-logical and medical associations for several tissue-specificmarker genes (Figures 3, 4, 5, 6), as well as in providing new
Detailed gene expression profile of PRAMEFigure 4Detailed gene expression profile of PRAME. (a) Body-wide expression profile of the PRAME gene across the database. Each dot represents the expression of PRAME in one sample. Anatomical origins of each sample are marked with colored bars below the gene plot. Sample types having higher than average expression or an outlier expression profile are additionally colored in the figure (legend at the top left corner). The PRAME gene is a highly testis-specific gene in normal samples, but is ectopically expressed across the majority of human cancers. Gene plots like these can easily be used to identify outlier expression profiles, like as can be seen for kidney cancer in this case, where only a small fraction of the tumors are PRAME positive. (b) Box plot analysis of the PRAME expression levels across a variety of normal and cancer tissues. The number of samples in each category is shown in parentheses. Normal tissues are shown with green boxes and cancerous ones with red boxes. The box refers to the quartile distribution (25-75%) range, with the median shown as a black horizontal line. In addition, the 95% range and individual outlier samples are shown.
2000 4000 6000 8000
010
0020
0030
0040
0050
00
PRAME, ENSG00000185686
Samples
circulating reticulocyteperipheral nervous systemliverpancreastestisuterus
ALLsarcomaperitoneal cancerlung cancerneuroblastomaadrenal gland cancer
kidney cancertesticular cancerother urogenital tumorovarian canceruterine cancerbreast cancer
Anatomical system
HematologicalConnectivity and muscularRespiratoryNervousEndocrine & Salivary
GI tract & organsUrogenitalGynegological & BreastStem cells
Blo
od
lym
ph
oid
cell
(96)
Blo
od
mye
loid
cell
(32)
Blo
od
un
spec
ified
leu
kocy
te(2
8)B
on
em
arro
wm
yelo
idce
ll(1
0)B
on
em
arro
w(8
)H
emat
op
oie
ticst
emce
ll(2
6)C
ircu
latin
gre
ticu
locy
te(3
0)W
ho
leb
loo
d(4
1)L
ymp
hat
icsy
stem
(96)
Mu
scle
(73)
To
ng
ue
(11)
Hea
rt(4
9)B
loo
dve
ssel
(8)
Ad
ipo
setis
sue
(16)
Hai
rfo
llicl
e(1
6)C
entr
aln
ervo
us
syst
em(4
25)
Per
iph
eral
ner
vou
ssy
stem
(20)
Sal
ivar
yg
lan
d(9
)R
esp
irat
ory
syst
em(1
23)
Co
lore
ctal
(23)
Oth
erG
Isys
tem
(33)
Liv
er(1
5)L
iver
and
bili
ary
syst
em(9
)P
ancr
eas
(17)
En
do
crin
esy
stem
(52)
Kid
ney
(59)
Bla
dd
er(2
0)T
estis
(22)
Pro
stat
e(1
47)
Bre
ast(
15)
Ova
ry(1
0)U
teru
s(3
0)P
lace
nta
(48)
Oth
eru
rog
enita
lsys
tem
(11)
Mes
ench
ymal
stem
cell
(10)
Ad
ult
stem
cell
(10)
B-A
LL
(793
)T
-AL
L(6
8)B
-CL
L(1
01)
AM
L(3
22)
Pla
sma
cell
leu
kem
ia(6
)M
yelo
ma
(102
)B
-cel
llym
ph
om
a(1
98)
Bu
rkitt
sly
mp
ho
ma
(36)
T-c
elll
ymp
ho
ma
(43)
Ch
on
dro
sarc
om
a(1
5)O
steo
sarc
om
a(1
1)E
win
gs
sarc
om
a(1
8)S
yno
vial
sarc
om
a(1
2)L
eio
myo
sarc
om
a(1
2)R
hab
do
myo
sarc
om
a(3
7)L
ipo
sarc
om
a(1
6)S
arco
ma,
NO
S(9
)M
elan
om
a(8
)G
liom
a(2
75)
Neu
rob
last
om
a(1
23)
Ora
lsq
uam
ou
sce
llca
rcin
om
a(3
4)L
aryn
go
ph
aryn
xsq
uam
ou
sce
llca
rcin
om
a(9
)L
un
gad
eno
carc
ino
ma
(311
)L
un
g,l
arg
ece
llca
nce
r(8
)L
un
g,s
mal
lcel
lcan
cer
(6)
Lu
ng
,sq
uam
ou
sce
llca
rcin
om
a(8
3)L
un
g,c
arci
no
idtu
mo
r(2
7)M
eso
thel
iom
a(3
5)E
sop
hag
us
aden
oca
rcin
om
a(1
3)G
astr
icad
eno
carc
ino
ma
(21)
GIS
T(6
)S
mal
lin
test
ine,
aden
oca
rcin
om
a(6
)C
olo
rect
alca
rcin
om
a(5
05)
Liv
erca
nce
r(7
)P
ancr
eatic
can
cer
(29)
Ad
ren
altu
mo
rs(1
1)T
hyr
oid
carc
ino
ma
(58)
Ren
alca
nce
r(2
09)
Nep
hro
bla
sto
ma
(33)
Bla
dd
erca
nce
r(1
74)
Tes
tis,s
emin
om
a(1
5)T
estis
,no
n-s
emin
om
a(9
0)P
rost
ate
aden
oca
rcin
om
a(3
49)
Bre
astd
uct
alca
nce
r(3
27)
Bre
astl
ob
ula
rca
nce
r(4
6)B
reas
tmed
ulla
ryca
nce
r(1
2)B
reas
tcan
cer,
oth
ers
(15)
Bre
astc
arci
no
ma,
NO
S(6
52)
Ova
rian
,cle
arce
llca
rcin
om
a(2
0)O
vari
an,e
nd
om
etri
oid
carc
ino
ma
(37)
Ova
rian
,mu
cin
ou
sca
rcin
om
a(1
9)O
vari
an,s
ero
us
carc
ino
ma
(141
)O
vari
anad
eno
carc
ino
ma,
NO
S(5
9)O
vari
antu
mo
r,o
ther
s(1
0)P
erito
neu
mad
eno
carc
ino
ma
(13)
Ute
rin
esa
rco
ma
(14)
Ute
rin
ead
eno
carc
ino
ma
(140
)U
teri
ne,
Mu
lleri
antu
mo
r(1
5)C
ervi
cala
den
oca
rcin
om
a(8
)C
ervi
cals
qu
amo
us
cell
carc
ino
ma
(57)
Vag
ina/
Vu
lva
carc
ino
ma
(9)
0
1000
2000
3000
4000
(a)
(b)
Genome Biology 2008, 9:R139
http://genomebiology.com/2008/9/9/R139 Genome Biology 2008, Volume 9, Issue 9, Article R139 Kilpinen et al. R139.9
insights on even well-studied cancer genes. GeneSapiens ischaracterized by detailed anatomical, histopathological andclinical annotations of disease states, a critically importantfeature that is often missing in other more generic geneexpression database projects.
Virtually every gene we have studied in GeneSapiens has hada distinct pattern of expression across the thousands of sam-ples. Hence, GeneSapiens provides systematic biological andmedical annotation of individual human genes, which couldprove useful even in the case of relatively well-known andabundantly studied cancer genes. For example, the fact thatby far the highest levels of KIT expression across all samplesavailable were seen in GISTs demonstrates that one couldidentify key driver genes that are mutated or otherwise acti-vated in human cancers and could, therefore, be of significanttherapeutic significance. This high level of overexpression ofKIT in GISTs probably reflects the selection pressure favoring
the expression of this gene during clonal cancer evolution.GeneSapiens provides the exciting possibility that one couldfind other previously unknown cancer genes with a similarprofile of high expression in one or a few cancer types onlythat could also turn out to be driven by mutations or translo-cations [47]. Conversely, even though we will see more andmore mutational data being generated from selected humancancers, understanding the impact of the mutations on geneexpression will be important. Furthermore, it is extremelyuseful to be able to characterize the expression of these 'can-cer genes' across thousands of cancers and normal tissues ofdifferent origins, as sequencing is typically done from a highlyselected group of samples. This is illustrated by our analysisof the expression profiles for FEV and C1orf56 (MLLT11).Besides the therapeutic importance, the data on severalserum biomarkers of disease, such as Troponin T and PSA,indicate that the body-wide expression profiles of genes couldhighlight genes with a high specificity to a single organ or dis-
Body-wide expression map of known cancer genesFigure 5Body-wide expression map of known cancer genes. On the x-axis are 342 genes and on the y-axis are 110 in vivo tissues (both healthy and malignant) from human. The color indicates the mean expression value of each gene in each tissue. Grey color signifies missing values. Values have been gene-wise scaled (mean 0 and standard deviation 1). Both axes have been clustered by using Euclidean distance with complete linkage method. Below the expression map are gene-wise Pearson correlation coefficients with four known cellular process/tissue-specific marker genes (Ki-67, PCNA, KRT19 and PTPRC). Correlations have been calculated over 8,409 healthy and malignant samples using pairwise complete observations. Comparison of highest correlation values and clusters of genes on the expression map confirm that through the analysis of in silico transcriptomics data it is possible to find both tissue specificity and functional associations with processes such as cell cycle. For example, the orange colored branch contains genes having highest correlation with epithelial marker KRT19, branches colored blue contain genes mostly expressed in the hematological system and they also correlate with PTPRC, a marker for hematological tissues. Additionally, genes related to mitosis cluster together (purple branch), having highest correlations with Ki-67 and PCNA. The rectangles (A, B, C) highlight three genes as examples of extreme expression in some cancers (see Figure 6 and Additional data files 7 and 8 for enlargements of these areas).
Genome Biology 2008, 9:R139

http://genomebiology.com/2008/9/9/R139 Genome Biology 2008, Volume 9, Issue 9, Article R139 Kilpinen et al. R139.10
ease type, and, therefore, with potential value as serumbiomarkers.
The third important aspect of the GeneSapiens system is theinteractive nature of the analysis options that we have gener-ated for making these data publicly available in a user-friendly format. We have set up an interactive website [16] toprovide access to the in silico transcriptomics data withdetailed expression profiles for 17,330 genes across all the9,783 annotated healthy and pathological human samples.We provide the possibility to analyze the levels of geneexpression across all the tissues and malignant diseases (box-and-whisker plots; Figure 3a–d), as well as to analyze geneexpression at the level of individual samples. The 'GeneSapi-ens plot' (see, for example, Figure 4a) displays expression lev-els of the genes in each of the 10,000 samples, arranged inanatomical order and by disease type. The datapoints dis-played are interactive and provide links to the specific type ofthe sample, the histopathological diagnosis and the type ofthe array generation used. We also provide filtered analysisoptions where users can explore in detail a particular organ ordisease type as well as the option of analyzing the correlationof any two genes across the whole database or subsets of tis-sues or diseases. Taken together, we believe that the GeneSa-piens analysis system provides a highly useful resource to thebiomedical research community.
Materials and methodsData collectionThis in silico collection of human transcriptomes was con-structed by collecting 9,783 publicly available Affymetrixmicroarray experiments in the form of CEL files as sourcematerial. The uniqueness of the collected files was tested withthe cyclic redundancy check algorithm (cksum). For a com-plete listing of the original source data from 157 separatestudies, please see Additional data file 3. We combined datafrom the following Affymetrix generations (HG-U95A, HG-U95Av2, HG-U133A, HG-U133B, HG-U133 Plus 2). Eventhough HG-U133A and HG-U133B are not different genera-tions, they do have 2,074 common genes, and we consideredthem as such for the practical purposes of our normalization.
Data preprocessingData from all CEL files were pre-processed with the MAS5.0algorithm [18] with default parameters. Although differentopinions exist about optimal preprocessing methods [52],recent comparison studies indicate that MAS5.0 provides the
Blood lympho id cell (96)Blood myeloid cell (32)
Blood unspeci fied leukocyt e (28)Bone marro w myelo id cell (10)
Bone marro w (8)Hematopo ietic s tem cell (26)Circulating reticulocyt e (30)
Whole blood (41)Lymphatic sys tem (96)
Musc le (73)Tongue (11)
Heart (49)Blood vesse l (8)
Ad ipose tissu e (16)Hair fo llic le (16)
Central nervous sys tem (425)Peripher al nervous syst em (20)
Salivary g land (9)Resp iratory sys tem (123)
Colo rectal (23)Other GI sys tem (33)
Liver (15)Liver and bilia ry syst em (9)
Pancreas (17)Endocr ine sys tem (52)
Kidney (59)Bladder (20)
Testis (22)Pros tate (147)
Breast (15)Ovary (10)
Uterus (30)Placent a (48)
Other u rogeni tal syst em (11)Mesenchy mal s tem cell (10)
Adul t s tem cell (10)B-ALL (793)
T-ALL (68)B-CLL (101)
AML (322)Plasma cell leukem ia (6)
Myeloma (102)B-cell lymphom a (198)
Burk itts lymphom a (36)T-cell lymphoma (43)
Chondr osar coma (15)Osteosar coma (11)
Ewings sarcoma (18)Synovi al sarcoma (12)Leiomyosar coma (12)
Rhabdo myosarcoma (37)Liposar coma (16)Sarcoma, NOS (9)
Melanoma (8)Glio ma (275)
Neurob lastoma (123)Oral squa mous cell carc inoma (34)
Lung adenocar cinoma (311)Lung , large cell cance r (8)Lung, small cell cancer (6)
Lung , squam ous cell carcinoma (83)Lung, carcinoi d tumor (27)
Meso thelio ma (35)Esophagu s adenocar cinoma (13)
Gastric adenoca rc inoma (21)GIST (6)
Small intestine, adenocar cinoma (6)Colo rectal carc inoma (505)
Liver cance r (7)Pancr eatic cancer (29)
Adrenal tumors (11)Thyro id carcinoma (58)
Renal cance r (209)Nephr oblastoma (33)Bladder cance r (174)
Testis , seminom a (15)Testis , non-seminoma (90)
Pros tate adenocar cinom a (349)Breast duct al cance r (327)Breast lobu lar cancer (46)
Breast medu lla ry cancer (12)Breast cancer , others (15)
Breast carc inom a, NOS (652)Ovarian, clear cell carcinoma (20)
Ovarian, endom etrioid carcinoma (37)Ovarian, mucinous carc inom a (19)
Ovarian, serous carc inoma (141)Ovarian adenocar cinom a, NOS (59)
Ovarian tumor, others (10)Peritoneum adenocar cinoma (13)
Uterine sarcoma (14)Uterine adenocar cinoma (140)
Uterine, Mulle rian tumor (15)Cerv ical adenocar cinoma (8)
Cerv ical squam ous cell carc inoma (57)Vagina/Vulva carc inom a (9)
0 1000 2000 3000 4000
KIT ENSG00000157404Heart (54)Glioma (475)Central nerv.system (426)GIST (6)Peripheral nerv.system (20)Colorectal (6)Skin (3)
TS
HR
Wt1
CC
DC
6D
DX
10K
ITT
AF
15B
CR
MLL
T4
GN
AS
Laryngopharynx squamous cell carcinoma (9 )
Expression profile for the KIT gene shows interesting patterns in the bodymap in Figure 5Figure 6Expression profile for the KIT gene shows interesting patterns in the bodymap in Figure 5. KIT exhibits extremely high expression in gastrointestinal stromal tumors. KIT is known to be inhibited by Gleevec®, demonstrating that findings like these pinpoint immediate possibilities for drug repositioning.
Genome Biology 2008, 9:R139

http://genomebiology.com/2008/9/9/R139 Genome Biology 2008, Volume 9, Issue 9, Article R139 Kilpinen et al. R139.11
most faithful cellular network construction [53] and optimalidentification of differentially expressed genes [54]. In addi-tion, other preprocessing methods may create false positiveresults [53,55,56]. We used version 10 of the alternative CDFfiles [20] summarizing the probe level intensities directly tothe Ensemble [57] gene IDs (Ensembl build 46). Probes map-ping to multiple genes and other problems associated with oldgenerations of Affymetrix probe designs were therebyexcluded. Within our normalization process the term pre-processing refers only to steps performed by the MAS5.0algorithm, and subsequent normalization steps are describedbelow.
Sample-wise normalization with equalization transformationWe utilized equalization transformation (Q) [21], a methodsimilar to widely used quantile normalization [22], to nor-malize the pre-processed data. After Q normalization, thedataset had the desired distribution that has been determinedprior to transformation. The normal distribution with meanof 8 and standard deviation 2 (N(8, 4)) was selected as thedesired distribution since the distribution of logarithmic, pre-processed values of all samples (N = 9,783) with median 7.92and standard deviation 2.3 was near to this distribution(Additional data file 1). EQ values were brought to exponen-tial scale to maintain the scale of the original values.
The quantile normalization [22] would be another choice toperform normalization but has considerable drawbacks inthis particular setting. First, it does not perform well whenthere is variation in the number of genes between samples.This problem is magnified when merging thousands of sam-ples from different array generations. Also, the means of thequantiles may vary substantially when new samples areadded to the dataset, whereas the change caused by the equal-ization transformation is smaller. Quantile normalization isalso resource-intensive to compute for thousands of sampleswith different numbers of measured genes. Thus, equaliza-tion transformation (Q) [21] was the method of choice in thisstudy.
Array-generation-based gene centering (AGC)To be able to compare the samples of in silico transcriptomicsalso between the array generations, we developed a novelmethod for gene-wise normalization of the data. In this AGCmethod we assume that the mean of the expression values forany particular gene in each array generation is the same. If themean value of some of the array generations differs substan-tially from the others, the shift is assumed to be caused by thearray generation based variation, and the AGC method aimsto correct this variation. The AGC method requires that thecollection of samples to be analyzed is large enough so thatone can assume the distribution of values of each gene k torepresent the total distribution of all potential expression val-ues across all tissues for each array generation i. Therefore,the AGC method normalizes the data to have mean values μi,
k= μall, k for all array generations i, where μall, k is the mean ofall values of the gene k. Further, it is assumed that the mini-mum and the maximum estimates for the gene value arereached and the range of the gene k should approximately be[ak, bk], where ak is the lowest 2% value and bk is the largest2% value of gene k. AGC values should not go over this range.However, if the new centered value exceeds the range, the dif-ference is diminished towards the range limits with coeffi-cient c, 0 ≤ c ≤ 1. Here, the coefficient is set to c = 1/5.Coefficient c is necessary to prevent some extremely tissue-specific genes from having arbitrarily large correction factors,which is possible if the specific tissue is absent from one ormore array generation. The coefficient c affects 2.9% of allcorrection factors. Of those cases, the proportion of the cor-rection factor modified by coefficient c was, on the average,7.6%. Thus, the coefficient c affected an extreme minority ofthe corrections in a significant manner, but nevertheless, itwas found to be crucial for the AGC method. The centered val-ues can now be obtained with:
where xi, j, k is the value of gene k in sample j from array gen-eration i, μi, k is the mean of the values of gene k across arraygeneration I, and μall, k is the mean of the values of gene kacross all array generations. Further, the adjusted values arecomputed based on the equation:
The resulting AGC values are now AGCvalue = 2y.
Some other methods [58,59] are useful to combine differentdatasets. However, these are computationally very demand-ing and probably impractical for datasets comprising almost10,000 samples. Additionally, the performance of thesemethods is not validated for integration of multiple datasets.
Sample annotation and manual curationAnnotation of the samples is important to make biologicaland medical sense of the data. Since not all sources of CELfiles come with annotations following the MIAME standards[60], we performed manual annotation of all the data in thedatabase. Annotation terms linked to each sample weredefined by a team of seven biologists and medical doctors.The content of the database in terms of healthy, malignantand other disease samples can be seen in Additional data file4
Gene annotationGene annotation is based on Ensembl. The database has datafor each Ensembl gene, even those not featured on any arrays.Gene data include transcript and protein product informa-
˘ ( ), , , , , ,x xi j k i j k i k all k= − −μ μ
y
b c x b x b
a c a xi j k
k i j k k i j k k
k k i j k, ,
, , , ,
, ,
(˘ ), ˘ ,
( ˘ ),=
+ − >
− −
for
forr
otherwise.
˘ ,
˘ ,
, ,
, ,
x a
x
i j k k
i j k
<
⎧
⎨⎪⎪
⎩⎪⎪
Genome Biology 2008, 9:R139
http://genomebiology.com/2008/9/9/R139 Genome Biology 2008, Volume 9, Issue 9, Article R139 Kilpinen et al. R139.12
tion, chromosome name and position (band and nucleotidecount), biotype (protein coding, miRNA, ribosomal, and soon), and Hugo and Entrez IDs for each gene. These data weredownloaded from the Ensembl web site, using the sameEnsembl genome build version (release 46) as that used forthe construction of the used alternative CDF files [20].
Multidimensional scaling and clustering accuracyWe utilized classic MDS in order to diminish the number ofthe dimensions within the data [24]. With MDS, 1,137 sam-ples with 7,390 dimensions (that is, genes) were brought tolow-dimensional space so that the distance between eachsample pair with these new dimensions is very close to thedistance between the original values of the samples. As a dis-tance metric, we used Manhattan distance.
K-means clustering and rand index analysisK-means clustering was performed with default parametersin R. The initial centroids were given as the median value ofeach gene in array generations or tissues. The algorithm wasallowed to run for a maximum of 100,000 iterations for eachclustering. The corrected rand index [23] was calculated in Rwith fpc library.
Replicate analysisReplicate analysis was performed by comparing the correla-tion coefficients of the logarithmic values of two or threehybridizations from a single biological sample using standardmethods of computing the Pearson correlation coefficient.This was done for all samples described in [9,26,27].
Body-wide expression profiles of genesWe visualize the expression profile of a single gene across allhuman tissues with boxplots and with custom designed body-wide expression plots. In the boxplots, the expression profilesof a single gene are displayed and grouped into healthy sam-ples (green boxes) and malignant samples (red boxes). Bothtypes are in anatomically meaningful order, allowing easycomparison of related tissue types. Numbers of samples ineach tissue type are in parentheses.
Custom designed body-wide expression profiles show theexpression pattern of a single gene at the level of individualsamples, while its layout allows easy analysis of the biologicalor medical significance of the profile. The y-axis provides theexpression level of the gene and the x-axis contains all sam-ples arranged into a fixed order by the type of the sample(healthy, malignant) and subsequently by the tissue type.Thus, each dot describes the expression level of a particulargene in one sample. The anatomical origin of each sample canbe seen from the color bar at the bottom of the image. Tissuesexpressing the gene at a high level (more than one standarddeviation higher than the baseline for that gene or having agroup of outlier data points) are colored.
Body-wide gene expression heatmaps for human cancer genesBodywide expression maps of genes are done with hierarchi-cal clustering (Euclidean distance with Ward linkage) ofmean expression profile for 342 genes across 110 in vivo tis-sues. The number of samples per tissue type is given in paren-theses. Values for each gene are mean-centered at 0 with astandard deviation of 1.
Availability of dataAs the in silico transcriptomics data of this project are com-posed of custom integration of already public microarray datawe provide a table describing the origins of the data used toconstruct GeneSapiens (Additional data file 3). We have setup a website [16] to allow browsing of expression profiles ofthese genes and associated information as well as generationof correlations/scatterplots between any pairs of genes acrossany tissues.
AbbreviationsAGC: array-generation-based gene centering; GIST: gastroin-testinal stromal tumor; MDS: multi-dimensional scaling;PLAP: placental alkaline phosphatase; Q: quantile; QAGC: Qnormalized data to which AGC correction has been applied.
Competing interestsThe institute has filed a patent application regarding the nor-malization methodology.
Authors' contributionsSK contributed to the majority of data analysis, database con-struction and development of normalization and writing ofthe manuscript. RA and MS contributed to the developmentand testing of the normalization. KO and EB contributed todata collection and the annotation process. KO also contrib-uted to data mining methods and checking of all annotations.KI had a major contribution to the annotation. SH contrib-uted to the development of normalization and supervised thecomparison and validation of the normalization methods. OKsupervised the entire project for database construction, datamining and annotation efforts and participated in manuscriptwriting and editing. The remaining authors contributedtowards annotation, data visualization and other methods aswell as editing the manuscript.
Additional data filesThe following additional data are available with the onlineversion of this paper. Additional data file 1 shows the distri-bution of preprocessed datapoints across the entire database(solid line) and normal distribution (N(8, 4)) estimated fromit (dashed line). Additional data file 2 shows boxplots of vari-ous known tissue-specific genes. Additional data file 3 lists
Genome Biology 2008, 9:R139

http://genomebiology.com/2008/9/9/R139 Genome Biology 2008, Volume 9, Issue 9, Article R139 Kilpinen et al. R139.13
the sources for all the raw expression data files used in thisstudy. Additional data file 4 lists the various healthy tissues,cancers and non-cancer diseases represented by the samplesin the database and the amounts of samples in each of thesecategories. Additional data file 5 lists rand indices for the dif-ferent normalizations, and the distribution of array genera-tions and tissues into clusters with Q and QAGC (Qnormalized data to which AGC correction has been applied)normalized data. Additional data file 6 shows boxplots of var-ious known tissue-specific genes. Additional data file 7 showsthat FEV has clearly elevated expression in several malignan-cies, when compared to any healthy tissue. Most interestinglythis ETS-factor family member appears to have slightly ele-vated expression in prostate cancer when compared tohealthy prostate. Additional data file 8 shows that expressionof the C1orf56 gene, also known as AF1Q or MLLT11, showsextreme expression in several cancers, especially inneuroblastoma.Additional data file 1Distribution of preprocessed datapoints across the entire database and normal distribution (N(8, 4)) estimated from itDistribution of preprocessed datapoints across the entire database (solid line) and normal distribution (N(8, 4)) estimated from it (dashed line).Click here for fileAdditional data file 2Boxplots of various known tissue-specific genes(a) KLK3 (PSA) is a known prostate specific gene. This specificity is perfectly shown in its expression profile. (b) GFAP, a gene cod-ing for glial fibrillary acidic protein, is known to be expressed in central nervous system. Its expression profile perfectly confirms this prior knowledge.Click here for fileAdditional data file 3Sources for all the raw expression data files used in this studySources for all the raw expression data files used in this study.Click here for fileAdditional data file 4Various healthy tissues, cancers and non-cancer diseases repre-sented by the samples in the database and the amounts of samples in each of these categoriesVarious healthy tissues, cancers and non-cancer diseases repre-sented by the samples in the database and the amounts of samples in each of these categories.Click here for fileAdditional data file 5Rand indices for the different normalizations, and the distribution of array generations and tissues into clusters with Q and QAGC normalized dataRand indices for the different normalizations, and the distribution of array generations and tissues into clusters with Q and QAGC normalized data.Click here for fileAdditional data file 6Boxplots of various known tissue-specific genes(a) Insulin (INS) has pancreas specific expression, as one expects it to have. (b) LDHC is a known testis-specific gene and it is expressed above background only in healthy testis.Click here for fileAdditional data file 7FEV has clearly elevated expression in several malignancies, when compared to any healthy tissueMost interestingly this ETS-factor family member appears to have slightly elevated expression in prostate cancer when compared to healthy prostate.Click here for fileAdditional data file 8Expression of the C1orf56 gene shows extreme expression in sev-eral cancers, especially in neuroblastomaExpression of the C1orf56 gene, also known as AF1Q or MLLT11, shows extreme expression in several cancers, especially in neuroblastoma.Click here for file
AcknowledgementsThe authors would like to acknowledge all annotators of the database aswell as Dr Outi Monni for providing facilities in the Biomedicum BiochipCenter. This study was supported by the Marie Curie Canceromics(MEXT-CT-2003-2728) grant from the EU, EU-EPITRON (LSHC-CT-2005-518417), Cancer Organizations of Finland, Sigrid Juselius Foundation,Turku TE-Centre, and Academy of Finland (SysBio research program no.5207532 and Centres of Excellence funding no. 213502) as well as personalgrants from the Emil Aaltonen Foundation, the Foundation of Technology,the Finnish Konkordia Fund and the Foundation for Commercial and Tech-nical Sciences (to RA). The authors would like to thank Kristine Kleivi,Sirkku Pollari, Juha Rantala, Santosh Gupta and Kimmo Jaakkola for theirhelp in annotation of microarray data.
References1. Lee HK, Hsu AK, Sajdak J, Qin J, Pavlidis P: Coexpression analysis
of human genes across many microarray datasets. GenomeRes 2004, 14:1085-1094.
2. Rhodes DR, Yu J, Shanker K, Deshpande N, Varambally R, Ghosh D,Barrette T, Pandey A, Chinnaiyan AM: ONCOMINE: a cancermicroarray database and integrated data-mining platform.Neoplasia 2004, 6:1-6.
3. Segal E, Shapira M, Regev A, Pe'er D, Botstein D, Koller D, FriedmanN: Module networks: identifying regulatory modules andtheir condition-specific regulators from gene expressiondata. Nat Genet 2003, 34:166-176.
4. Elo LL, Lahti L, Skottman H, Kylaniemi M, Lahesmaa R, Aittokallio T:Integrating probe-level expression changes across genera-tions of Affymetrix arrays. Nucleic Acids Res 2005, 33:e193.
5. Irizarry RA, Warren D, Spencer F, Kim IF, Biswal S, Frank BC, Gabri-elson E, Garcia JG, Geoghegan J, Germino G, Griffin C, Hilmer SC,Hoffman E, Jedlicka AE, Kawasaki E, Martinez-Murillo F, MorsbergerL, Lee H, Petersen D, Quackenbush J, Scott A, Wilson M, Yang Y, YeSQ, Yu W: Multiple-laboratory comparison of microarrayplatforms[see comment][erratum appears in Nat Methods.2005 Jun;2(6):477]. Nat Methods 2005, 2:345-350.
6. Jarvinen AK, Hautaniemi S, Edgren H, Auvinen P, Saarela J, KallioniemiOP, Monni O: Are data from different gene expression micro-array platforms comparable? Genomics 2004, 83:1164-1168.
7. Larkin JE, Frank BC, Gavras H, Sultana R, Quackenbush J: Independ-ence and reproducibility across microarray platforms[seecomment]. Nat Methods 2005, 2:337-344.
8. Marshall E: Getting the noise out of gene arrays. Science 2004,306:630-631.
9. Hwang KB, Kong SW, Greenberg SA, Park PJ: Combining geneexpression data from different generations of oligonucle-otide arrays. BMC Bioinformatics 2004, 5:159.
10. Eisen MB, Spellman PT, Brown PO, Botstein D: Cluster analysisand display of genome-wide expression patterns. Proc NatlAcad Sci USA 1998, 95:14863-14868.
11. Niehrs C, Pollet N: Synexpression groups in eukaryotes. Nature1999, 402:483-487.
12. Rhodes DR, Kalyana-Sundaram S, Mahavisno V, Barrette TR, GhoshD, Chinnaiyan AM: Mining for regulatory programs in the can-cer transcriptome. Nat Genet 2005, 37:579-583.
13. Segal E, Yelensky R, Koller D: Genome-wide discovery of tran-scriptional modules from DNA sequence and geneexpression. Bioinformatics 2003, 19(Suppl 1):i273-282.
14. Segal E, Friedman N, Koller D, Regev A: A module map showingconditional activity of expression modules in cancer. NatGenet 2004, 36:1090-1098.
15. Zhang W, Morris QD, Chang R, Shai O, Bakowski MA, Mitsakakis N,Mohammad N, Robinson MD, Zirngibl R, Somogyi E, Laurin N,Eftekharpour E, Sat E, Grigull J, Pan Q, Peng WT, Krogan N, Green-blatt J, Fehlings M, Kooy D van der, Aubin J, Bruneau BG, Rossant J,Blencowe BJ, Frey BJ, Hughes TR: The functional landscape ofmouse gene expression. J Biol 2004, 3:21.
16. GeneSapiens [http://www.genesapiens.org]17. R Development Core Team: R: A Language and Environment for Statis-
tical Computing Vienna, Austria: R Foundation for StatisticalComputing; 2007.
18. Statistical Algorithms Description Document [http://www.affymetrix.com/support/technical/whitepapers/]
19. Pepper SD, Saunders EK, Edwards LE, Wilson CL, Miller CJ: The util-ity of MAS5 expression summary and detection callalgorithms. BMC Bioinformatics 2007, 8:273.
20. Dai M, Wang P, Boyd AD, Kostov G, Athey B, Jones EG, Bunney WE,Myers RM, Speed TP, Akil H, Watson SJ, Meng F: Evolving gene/transcript definitions significantly alter the interpretation ofGeneChip data. Nucleic Acids Res 2005, 33:e175.
21. Kauraniemi P, Hautaniemi S, Autio R, Astola J, Monni O, Elkahloun A,Kallioniemi A: Effects of Herceptin treatment on global geneexpression patterns in HER2-amplified and nonamplifiedbreast cancer cell lines. Oncogene 2004, 23:1010-1013.
22. Bolstad BM, Irizarry RA, Astrand M, Speed TP: A comparison ofnormalization methods for high density oligonucleotidearray data based on variance and bias. Bioinformatics 2003,19:185-193.
23. Hubert Lawrence AP: Comparing partitions. J Classification1985:193-218.
24. Khan J, Simon R, Bittner M, Chen Y, Leighton SB, Pohida T, Smith PD,Jiang Y, Gooden GC, Trent JM, Meltzer PS: Gene expression pro-filing of alveolar rhabdomyosarcoma with cDNAmicroarrays. Cancer Res 1998, 58:5009-5013.
25. Bhattacharya S, Mariani TJ: Transformation of expression inten-sities across generations of Affymetrix microarrays usingsequence matching and regression modeling. Nucleic Acids Res2005, 33:e157.
26. Ross ME, Zhou X, Song G, Shurtleff SA, Girtman K, Williams WK, LiuHC, Mahfouz R, Raimondi SC, Lenny N, Patel A, Downing JR: Classi-fication of pediatric acute lymphoblastic leukemia by geneexpression profiling. Blood 2003, 102:2951-2959.
27. Yeoh EJ, Ross ME, Shurtleff SA, Williams WK, Patel D, Mahfouz R,Behm FG, Raimondi SC, Relling MV, Patel A, Cheng C, Campana D,Wilkins D, Zhou X, Li J, Liu H, Pui CH, Evans WE, Naeve C, Wong L,Downing JR: Classification, subtype discovery, and predictionof outcome in pediatric acute lymphoblastic leukemia bygene expression profiling. Cancer Cell 2002, 1:133-143.
28. Christenson RH, Duh SH, Newby LK, Ohman EM, Califf RM, GrangerCB, Peck S, Pieper KS, Armstrong PW, Katus HA, Topol EJ: Cardiactroponin T and cardiac troponin I: relative values in short-term risk stratification of patients with acute coronary syn-dromes. GUSTO-IIa Investigators. Clin Chem 1998, 44:494-501.
29. Isotalo PA, Greenway DC, Donnelly JG: Metastatic alveolarrhabdomyosarcoma with increased serum creatine kinaseMB and cardiac troponin T and normal cardiac troponin I.Clin Chem 1999, 45:1576-1578.
30. Plouzek CA, Leslie KK, Stephens JK, Chou JY: Differential geneexpression in the amnion, chorion, and trophoblast of thehuman placenta. Placenta 1993, 14:277-285.
31. Kellen JA, Bush RS, Malkin A: Placenta-like alkaline phosphatasein gynecological cancers. Cancer Res 1976, 36:269-271.
32. Ind TE, Iles RK, Carter PG, Lowe DG, Shepherd JH, Hudson CN,Chard T: Serum placental-type alkaline phosphatase activityin women with squamous and glandular malignancies of the
Genome Biology 2008, 9:R139
http://genomebiology.com/2008/9/9/R139 Genome Biology 2008, Volume 9, Issue 9, Article R139 Kilpinen et al. R139.14
reproductive tract. J Clin Pathol 1994, 47:1035-1037.33. Philippe E, Omlin FX, Droz B: Myelin-associated glycoprotein
immunoreactive material: an early neuronal marker of dor-sal root ganglion cells during chick development. Brain Res1986, 392:275-277.
34. Shaw JL, Diamandis EP: Distribution of 15 human kallikreins intissues and biological fluids. Clin Chem 2007, 53:1423-1432.
35. Brenner M, Kisseberth WC, Su Y, Besnard F, Messing A: GFAP pro-moter directs astrocyte-specific expression in transgenicmice. J Neurosci 1994, 14:1030-1037.
36. Kalejs M, Erenpreisa J: Cancer/testis antigens and gametogene-sis: a review and "brain-storming" session. Cancer Cell Int 2005,5:4.
37. Epping MT, Wang L, Edel MJ, Carlee L, Hernandez M, Bernards R:The human tumor antigen PRAME is a dominant repressorof retinoic acid receptor signaling. Cell 2005, 122:835-847.
38. Schluter C, Duchrow M, Wohlenberg C, Becker MH, Key G, Flad HD,Gerdes J: The cell proliferation-associated antigen of antibodyKi-67: a very large, ubiquitous nuclear protein with numer-ous repeated elements, representing a new kind of cell cycle-maintaining proteins. J Cell Biol 1993, 123:513-522.
39. Martinez-Lara I, Gonzalez-Moles MA, Ruiz-Avila I, Bravo M, RamosMC, Fernandez-Martinez JA: Proliferating cell nuclear antigen(PCNA) as a marker of dysplasia in oral mucosa. Acta StomatolBelg 1996, 93:29-32.
40. Lacroix M: Significance, detection and markers of dissemi-nated breast cancer cells. Endocr Relat Cancer 2006,13:1033-1067.
41. Aiuti A, Friedrich C, Sieff CA, Gutierrez-Ramos JC: Identification ofdistinct elements of the stromal microenvironment thatcontrol human hematopoietic stem/progenitor cell growthand differentiation. Exp Hematol 1998, 26:143-157.
42. Dennis G Jr, Sherman BT, Hosack DA, Yang J, Gao W, Lane HC, Lem-picki RA: DAVID: Database for Annotation, Visualization, andIntegrated Discovery. Genome Biol 2003, 4:P3.
43. Ashburner M, Ball CA, Blake JA, Botstein D, Butler H, Cherry JM,Davis AP, Dolinski K, Dwight SS, Eppig JT, Harris MA, Hill DP, Issel-Tarver L, Kasarskis A, Lewis S, Matese JC, Richardson JE, Ringwald M,Rubin GM, Sherlock G: Gene ontology: tool for the unificationof biology. The Gene Ontology Consortium. Nat Genet 2000,25:25-29.
44. Demetri GD, von Mehren M, Blanke CD, Abbeele AD Van den, Eisen-berg B, Roberts PJ, Heinrich MC, Tuveson DA, Singer S, Janicek M,Fletcher JA, Silverman SG, Silberman SL, Capdeville R, Kiese B, PengB, Dimitrijevic S, Druker BJ, Corless C, Fletcher CD, Joensuu H: Effi-cacy and safety of imatinib mesylate in advanced gastrointes-tinal stromal tumors. N Engl J Med 2002, 347:472-480.
45. Tse W, Meshinchi S, Alonzo TA, Stirewalt DL, Gerbing RB, WoodsWG, Appelbaum FR, Radich JP: Elevated expression of the AF1qgene, an MLL fusion partner, is an independent adverseprognostic factor in pediatric acute myeloid leukemia. Blood2004, 104:3058-3063.
46. Iljin K, Wolf M, Edgren H, Gupta S, Kilpinen S, Skotheim RI, Peltola M,Smit F, Verhaegh G, Schalken J, Nees M, Kallioniemi O: TMPRSS2fusions with oncogenic ETS factors in prostate cancerinvolve unbalanced genomic rearrangements and are associ-ated with HDAC1 and epigenetic reprogramming. Cancer Res2006, 66:10242-10246.
47. Tomlins SA, Rhodes DR, Perner S, Dhanasekaran SM, Mehra R, SunXW, Varambally S, Cao X, Tchinda J, Kuefer R, Lee C, Montie JE, ShahRB, Pienta KJ, Rubin MA, Chinnaiyan AM: Recurrent fusion ofTMPRSS2 and ETS transcription factor genes in prostatecancer. Science 2005, 310:644-648.
48. Brazma A, Parkinson H, Sarkans U, Shojatalab M, Vilo J, Abeyguna-wardena N, Holloway E, Kapushesky M, Kemmeren P, Lara GG,Oezcimen A, Rocca-Serra P, Sansone SA: ArrayExpress - a publicrepository for microarray gene expression data at the EBI.Nucleic Acids Res 2003, 31:68-71.
49. Edgar R, Domrachev M, Lash AE: Gene Expression Omnibus:NCBI gene expression and hybridization array datarepository. Nucleic Acids Res 2002, 30:207-210.
50. Day A, Carlson MR, Dong J, O'Connor BD, Nelson SF: Celsius: acommunity resource for Affymetrix microarray data.Genome Biol 2007, 8:R112.
51. Zimmermann P, Hirsch-Hoffmann M, Hennig L, Gruissem W: GEN-EVESTIGATOR. Arabidopsis microarray database and anal-ysis toolbox. Plant Physiol 2004, 136:2621-2632.
52. Seo J, Hoffman EP: Probe set algorithms: is there a rational best
bet? BMC Bioinformatics 2006, 7:395.53. Lim WK, Wang K, Lefebvre C, Califano A: Comparative analysis
of microarray normalization procedures: effects on reverseengineering gene networks. Bioinformatics 2007, 23:i282-288.
54. Choe SE, Boutros M, Michelson AM, Church GM, Halfon MS: Pre-ferred analysis methods for Affymetrix GeneChips revealedby a wholly defined control dataset. Genome Biol 2005, 6:R16.
55. Harr B, Schlotterer C: Comparison of algorithms for the analy-sis of Affymetrix microarray data as evaluated by co-expres-sion of genes in known operons. Nucleic Acids Res 2006, 34:e8.
56. Ploner A, Miller LD, Hall P, Bergh J, Pawitan Y: Correlation test toassess low-level processing of high-density oligonucleotidemicroarray data. BMC Bioinformatics 2005, 6:80.
57. Hubbard T, Andrews D, Caccamo M, Cameron G, Chen Y, Clamp M,Clarke L, Coates G, Cox T, Cunningham F, Curwen V, Cutts T, DownT, Durbin R, Fernandez-Suarez XM, Gilbert J, Hammond M, HerreroJ, Hotz H, Howe K, Iyer V, Jekosch K, Kahari A, Kasprzyk A, Keefe D,Keenan S, Kokocinsci F, London D, Longden I, McVicker G, et al.:Ensembl 2005. Nucleic Acids Res 2005, 33:D447-453.
58. Benito M, Parker J, Du Q, Wu J, Xiang D, Perou CM, Marron JS:Adjustment of systematic microarray data biases. Bioinformat-ics 2004, 20:105-114.
59. Gilks WR, Tom BD, Brazma A: Fusing microarray experimentswith multivariate regression. Bioinformatics 2005, 21(Suppl2):ii137-143.
60. Brazma A, Hingamp P, Quackenbush J, Sherlock G, Spellman P,Stoeckert C, Aach J, Ansorge W, Ball CA, Causton HC, GaasterlandT, Glenisson P, Holstege FC, Kim IF, Markowitz V, Matese JC, Parkin-son H, Robinson A, Sarkans U, Schulze-Kremer S, Stewart J, Taylor R,Vilo J, Vingron M: Minimum information about a microarrayexperiment (MIAME)-toward standards for microarraydata. Nat Genet 2001, 29:365-371.
Genome Biology 2008, 9:R139
Copyright © 2022 FDOKUMEN