Novel bifluorene based conjugated systems: synthesis and properties
Journal of Alloys and Compounds 537 (2012) 269–274
Contents lists available at SciVerse ScienceDirect
Journal of Alloys and Compounds
journal homepage: www.elsevier .com/locate / ja lcom
Synthesis, characterization, and third-order nonlinear optical propertiesof copper quantum dots embedded in sodium borosilicate glass
Jiasong Zhong a, Weidong Xiang a,b,⇑, Haijun Zhao b, Wenguang Zhao c, Guoxin Chen c, Xiaojuan Liang b
a College of Materials Science and Engineering, Tongji University, Shanghai 201804, Chinab College of Materials and Environmental Engineering, Hangzhou Dianzi University, Hangzhou 310018, Chinac Ningbo Institute of Material Technology and Engineering, Chinese Academy of Sciences, Ningbo 315201, China
a r t i c l e i n f o
Article history:Received 15 April 2012Received in revised form 15 May 2012Accepted 17 May 2012Available online 24 May 2012
Keywords:CopperSol–gelQuantum dotsZ-scanTEMXRD
0925-8388/$ - see front matter � 2012 Elsevier B.V. Ahttp://dx.doi.org/10.1016/j.jallcom.2012.05.046
⇑ Corresponding author at: College of Materials SciUniversity, Shanghai 201804, China. Tel.: +86 5786689644.
E-mail address: [email protected] (W. X
a b s t r a c t
Copper quantum dots embedded in sodium borosilicate glass matrix were fabricated and analyzed interms of their structural, chemical, and optical properties. X-ray powder diffraction (XRD) and X-rayphotoelectron spectroscopy (XPS) analyses revealed that copper quantum dots were in face-centered-cubic crystalline phase and in the metallic state. Size and distribution of the quantum dots were mea-sured by transmission electron microscopy (TEM) as well as high-resolution transmission electronmicroscopy (HRTEM). The results showed spherical shape have formed uniformly in the glass, andthe size of these quantum dots were range from 1.5 to 5 nm with the average particle size about2.7 nm. The third-order nonlinear optical properties of copper quantum dots doped glass were investi-gated by using Z-scan technique at the wavelength of 800 nm with femtosecond Ti: sapphire laser radi-ation. The value of third-order optical nonlinear susceptibility v(3) of the glass was estimated to be2.41 � 10�11 esu.
� 2012 Elsevier B.V. All rights reserved.
1. Introduction
Over the past two decades, much attention has been focused onthe nonlinear optical progresses of low-dimensional materials suchas quantum dots and quantum wires [1–3]. Quantum dots whoseradii are smaller than the bulk exciton Bohr radius constitute a classof materials intermediate between molecular and bulk forms ofmatter. Compared with bulk materials, quantum dots can be en-hanced nonlinear optical response, resulting in promising applica-tions in all-optical data processing fields [4]. In view of thesespecial properties, fabrication of quantum dots by various methodssuch as molecular beam epitaxy (MBE) [5], organic synthesis [6] andhigh temperature melting method [7,8] has been an emerging areaof research for different optical, electronic, magnetic, and spectro-scopic applications [9]. Therefore, the investigation of quantum dotshas attracted enormous theoretical and experimental interest [1,2].
Metal quantum dots embedded in dielectric matrices exhibitpromising nonlinear optical properties, particularly in theenhancement of the optical Kerr susceptibility [10]. Among them,noble metal quantum dots embedded in dielectric matrices hastriggered more and more interests of researchers due to their large
ll rights reserved.
ence and Engineering, Tongji7 86596013; fax: +86 577
iang).
third-order nonlinear susceptibility [11]. And the majority ofresearch in this field has aimed at synthesizing gold and silverquantum dots due to their rare electrical and optical properties[12,13]. However, gold and silver are expensive which may limittheir practical applications. Compared with silver and gold quan-tum dots doped glass, copper doped glass are much cheaper, andshow many similar properties as their noble metals siblings makingit a promising candidate in practical application [14]. Especially,copper quantum dots in the silicate containing glasses may bepromising for the photoinduced optical effects [15].
Copper (Cu) is of great importance in metallic materials sciencedue to high electrical conductivity and excellent catalytic property[16,17]. Up to now, great efforts have been made to fabricate Cunanoparticles in various forms and embedded in different matricesexhibit considerable optical nonlinearities. There are several re-ports in the literature concerning the nonlinear optical propertiesof Cu nanoparticles embedded in silica matrix [18,19], sapphirematrix [20], indium tin oxide matrix [21], Al2O3 matrix [22], TiO2
matrix [23], and SrTiO3 matrix [24].In this article, Cu quantum dots embedded in sodium borosili-
cate glass matrix have been synthesized by combing the sol–gelprocess and heat treatment in H2 gas. The characterization of theparticles was accomplished by the use of XRD, TEM, XPS as wellas UV–vis spectroscopy. Nonlinear optical properties of the Cuquantum dots were studied using the Z-scan technique.

Fig. 2. The typical optical scheme of Z-scan technique: (a) the closed-aperture (CA)model; (b) the open-aperture (OA) model. BS – beam splitters; L, L1, L2 – focusinglens; D1, D2 – detector.
270 J. Zhong et al. / Journal of Alloys and Compounds 537 (2012) 269–274
2. Experimental section
2.1. Materials
Tetraethoxysilane ((Si(OC2H5)4, TEOS, AR), copper nitrate (Cu(NO3)2�3H2O, AR),boric acid (H3BO3, AR), metallic sodium (Na, 99.7%), 2-methoxyethanol (C3H8O2,AR), hydrochloric acid (HCl, AR) and absolute ethyl alcohol (C2H5OH, AR) were pur-chased from Aladdin Chemistry Co., Ltd, Shanghai, China. All chemicals were useddirectly without any further purification.
2.2. Synthesis of copper quantum dots
5.74Na2O–21.38B2O3–72.88SiO2 glass [25] doped with 1.25 wt% Cu was pre-pared by a typical sol–gel method, and the procedure was as follows: SiO2 compo-nent was obtained by hydrolysis of TEOS in ethanol using deionized water and HCl(pH = 2). For B2O3 and Na2O components, the H3BO3 was dissolved in C3H8O2 andthe metallic Na was dissolved in ethanol to form two precursor solutions. Then,the boron and sodium precursor solutions were added into the TEOS solutionaccording to the designed glass composition. After the three-component solutionwas stirred for 1 h at room temperature, a methanol solution of Cu(NO3)2�3H2Owas added in an amount to form 1.25 wt% Cu. The four-component mixed solutionwas gelled and aged at 80 �C for 2 weeks. Finally the gel was heat-treated accordingto the following steps: first, the stiff gel was heated at 450 �C for 10 h with flowingoxygen gas to remove the organic substances and to decompose Cu(NO3)2. Second,the heated gel was exposed to dry H2 gas to convert CuO to Cu at 450 �C for 10 h. Atlast, the gel was heated to 600 �C for 10 h to become a well-densified glass. The pureand doped with Cu quantum dots sodium borosilicate glass were obtained, and allof the resulting glass sizes were Ø10 mm�1 mm as shown in Fig. 1.
2.3. Characterization
The crystalline structure of the glass doped with Cu quantum dots was mea-sured by Germany Bruker X-ray diffractometer (XRD, 40 kV, 20 mA) at Cu Ka radi-ation (k = 0.15406 nm) and a scan rate of 0.02� in the range of 10–80�. X-rayphotoelectron spectroscopy (XPS) spectra were collected using AXI ULTRA DLDspectrometer with monochrome Al Ka as the excitation source. Peak-shifts fromcharging of the specimens were corrected using a binding energy of 284.6 eV forthe 1 s peak of adventitious carbon. Transmission electron microscopy (TEM) withscanning-mode TEM images, high-resolution TEM (HRTEM) and selected area elec-tron diffraction (SAED) images studies for imaging and direct determination of crys-tal size of quantum dots were carried out using an FEI Tecnai F20 transmissionelectron microscope operating at 200 kV. The TEM samples were prepared by dropsample dispersed in ethanol onto a carbon-coated holey copper grid followedby drying at room-temperature and storage in desiccators before use. Opticalabsorption spectra of the sol were recorded on an ultraviolet–visible (UV–vis)spectrophotometer (Perkin–Elmer Lambda 9UV/Vis/VIR) between wavelength of300 and 800 nm.
2.4. Nonlinear optical properties measurements
The Z-scan technique was a simple, highly sensitive, single beam experimentaltechnique for determining the sign and magnitude of the nonlinear refraction andnonlinear absorption. The typical optical scheme for realizing the Z-scan techniquewas shown in Fig. 2. In Z-scan technique, a Gaussian beam from a laser in right focusgeometry was used to measure the transmittance of a sample through a finiteaperture in the far-field as a function of the sample position z measured withrespect to the focal plane. Z-scan technique contains two typical configurations,
Fig. 1. Photograph image of glasses: (a) doped with Cu and (b) pure glass matrix.
the closed-aperture Z-scan (CA) model and the open-aperture Z-scan (OA) model.Fig. 2a represented the typical optical scheme of the CA Z-scan model. The closeaperture transmittance of a tightly focused Gaussian beam through a finite apertureS (linear transmission) in the far field was measured as a function of the sampleposition z with respect to the focal plane. Fig. 2b represented the typical opticalscheme of the OA Z-scan model. A purely third-order nonlinear absorption wassymmetric with respect to the focus (z = 0) where they have a maximum transmit-tance (saturation absorption) or minimum transmittance (reverse saturationabsorption or two photon absorption).
The laser used was a mode-locked Ti: sapphire (Coherent Mira 900-D) laserwith a wavelength of 800 nm and pulse duration of 200 fs. For Z-scan measure-ments with aperture, an aperture of 1.0 mm diameter was employed. The glasseswere subjected to Z-scan analysis with a diameter of 10 mm.
3. Results and discussion
3.1. XRD studies
To further determine the chemical consistent of the glass, X-raydiffraction measurement was performed. The XRD patterns of thepure (a) and Cu-doped (b) glass substrate are presented in Fig. 3.The broad diffraction peak in the range from 15.4� to 37.8� is char-acteristic peaks of pure sodium borosilicate glass substrate. Threesharpening diffraction peaks emerge at 2h = 43.3�, 50.4�, and74.1�, which can represent (111), (200), and (220) crystal planesof the face-centered-cubic structure crystalline Cu [7], respectively.The lattice constant calculated from the above was found to bea = 3.612 Å, which is almost in agreement with the standard datafrom JCPDS Card No. 04-0836 (a = 3.615 Å). No other peaks aredetected in the XRD pattern, confirming high purity of the Cu
Fig. 3. XRD patterns of the pure (a) and copper-doped (b) glass substrate.

J. Zhong et al. / Journal of Alloys and Compounds 537 (2012) 269–274 271
quantum dots. These results demonstrate that Cu quantum dotshave been embedded in sodium borosilicate glass substrate.
3.2. TEM studies
TEM was used to further study the morphology and microstruc-ture of the glass. A typical TEM image of the glass shows that awide particles distribution of almost spherical shapes and withsizes in the range between 1.5 and 5 nm could be observed inFig. 4a. Because of the very small nanoscale dimensions of the Cuparticles, it becomes difficult to examine in detail their shape.Therefore, these nanometer-sized particles are further determinedby the scanning transmission electron microscopy (STEM), asshown in Fig. 4b. As heavier elements scatter electrons more effec-tively, they appear brighter in STEM images. Thus, Cu quantumdots embedded in sodium borosilicate glass matrix structures ex-hibit a distinct difference in intensity between the nanocrystalsand glass matrix. The grayish area represents the sodium borosili-cate glass matrix. In contrast, homogeneous Cu quantum dotsshould appear uniformly bright. As can be seen in Fig. 4c, the par-ticle size distribution is narrow and the size varied from 1.5 to5 nm with the average particle size about 2.7 nm. In the HRTEMimages (Fig. 4d), crystal lattice fringes from the Cu quantum dotscan be seen clearly in the dark areas, and the sodium borosilicatematrix is also well crystallized. Inset in Fig. 4d is the electrondiffraction pattern, displaying 2 diffused rings. The rings are as-signed to Cu (111), (220) diffraction planes, respectively. It is also
Fig. 4. TEM image of the glass: (a) TEM morphology image, (b) STEM image, (c)
confirmed that the quantum dots distributed in the glass matrixare cubic Cu crystallites.
3.3. XPS analysis
The purity and composition of the nanoparticles were furtherexamined by XPS as shown in Fig. 5. Fig. 5a shows the XPS surveyspectrum of sodium borosilicate glass doped with Cu quantumdots. The Cu 2p, Cu 3p, Si 2p, Si2s, Na 1s, B 1s and O 1s photoelec-tron peaks are observed besides Na KLL and O KLL Auger electronpeak as well as C 1s peak. The C 1s spectrum is from surface con-tamination. This is useful for energy calibration and by referring toC 1s at 284.6 eV. No other impurities are observed. The high-reso-lution core level photoelectron spectrum of Cu 2p is reported inFig. 5b. The XPS spectrum gives two main contributions: a domi-nant pair Cu 2p3/2 at 932.7 eV and Cu 2p1/2 at 952.7 eV. Thesevalues are close to that of standard Cu crystal XPS (Cum 2p3/2,932.7 eV; Cum 2p1/2, 952.5 eV) [26], indicating that the Cu keepsmetallic state in the composite arrays [27].
3.4. Optical absorption spectroscopy
Fig. 6 illustrated the absorption spectra for the glass with metal-lic Cu quantum dots. The spectra range between 400 and 850 nm. Areductive heat treatment in H2 lead to easy transformation of cop-per oxides to metallic copper; however, size and concentration ofparticles influencing an optical response of glass can be different
size distribution image, and (d) HRTEM image, inset shows the SAED image.
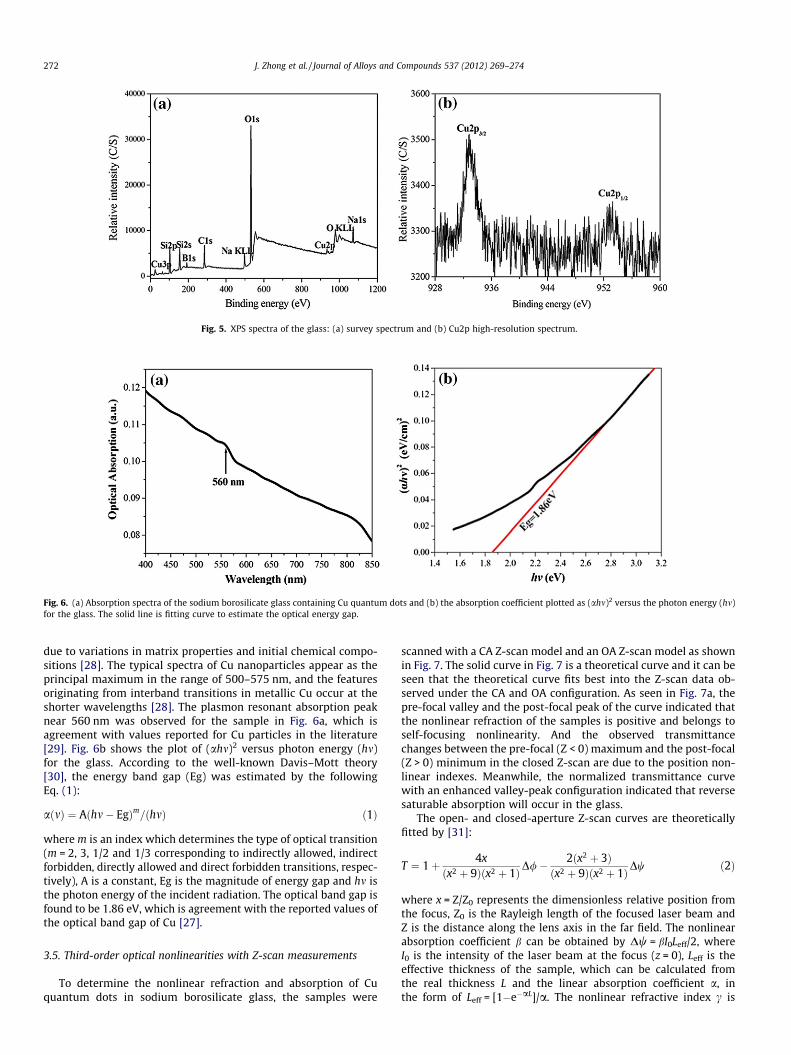
Fig. 5. XPS spectra of the glass: (a) survey spectrum and (b) Cu2p high-resolution spectrum.
Fig. 6. (a) Absorption spectra of the sodium borosilicate glass containing Cu quantum dots and (b) the absorption coefficient plotted as (ahm)2 versus the photon energy (hm)for the glass. The solid line is fitting curve to estimate the optical energy gap.
272 J. Zhong et al. / Journal of Alloys and Compounds 537 (2012) 269–274
due to variations in matrix properties and initial chemical compo-sitions [28]. The typical spectra of Cu nanoparticles appear as theprincipal maximum in the range of 500–575 nm, and the featuresoriginating from interband transitions in metallic Cu occur at theshorter wavelengths [28]. The plasmon resonant absorption peaknear 560 nm was observed for the sample in Fig. 6a, which isagreement with values reported for Cu particles in the literature[29]. Fig. 6b shows the plot of (ahm)2 versus photon energy (hm)for the glass. According to the well-known Davis–Mott theory[30], the energy band gap (Eg) was estimated by the followingEq. (1):
aðmÞ ¼ Aðhm� EgÞm=ðhmÞ ð1Þ
where m is an index which determines the type of optical transition(m = 2, 3, 1/2 and 1/3 corresponding to indirectly allowed, indirectforbidden, directly allowed and direct forbidden transitions, respec-tively), A is a constant, Eg is the magnitude of energy gap and hm isthe photon energy of the incident radiation. The optical band gap isfound to be 1.86 eV, which is agreement with the reported values ofthe optical band gap of Cu [27].
3.5. Third-order optical nonlinearities with Z-scan measurements
To determine the nonlinear refraction and absorption of Cuquantum dots in sodium borosilicate glass, the samples were
scanned with a CA Z-scan model and an OA Z-scan model as shownin Fig. 7. The solid curve in Fig. 7 is a theoretical curve and it can beseen that the theoretical curve fits best into the Z-scan data ob-served under the CA and OA configuration. As seen in Fig. 7a, thepre-focal valley and the post-focal peak of the curve indicated thatthe nonlinear refraction of the samples is positive and belongs toself-focusing nonlinearity. And the observed transmittancechanges between the pre-focal (Z < 0) maximum and the post-focal(Z > 0) minimum in the closed Z-scan are due to the position non-linear indexes. Meanwhile, the normalized transmittance curvewith an enhanced valley-peak configuration indicated that reversesaturable absorption will occur in the glass.
The open- and closed-aperture Z-scan curves are theoreticallyfitted by [31]:
T ¼ 1þ 4xðx2 þ 9Þðx2 þ 1ÞD/� 2ðx2 þ 3Þ
ðx2 þ 9Þðx2 þ 1ÞDw ð2Þ
where x = Z/Z0 represents the dimensionless relative position fromthe focus, Z0 is the Rayleigh length of the focused laser beam andZ is the distance along the lens axis in the far field. The nonlinearabsorption coefficient b can be obtained by Dw = bI0Leff/2, whereI0 is the intensity of the laser beam at the focus (z = 0), Leff is theeffective thickness of the sample, which can be calculated fromthe real thickness L and the linear absorption coefficient a, inthe form of Leff = [1�e�aL]/a. The nonlinear refractive index c is
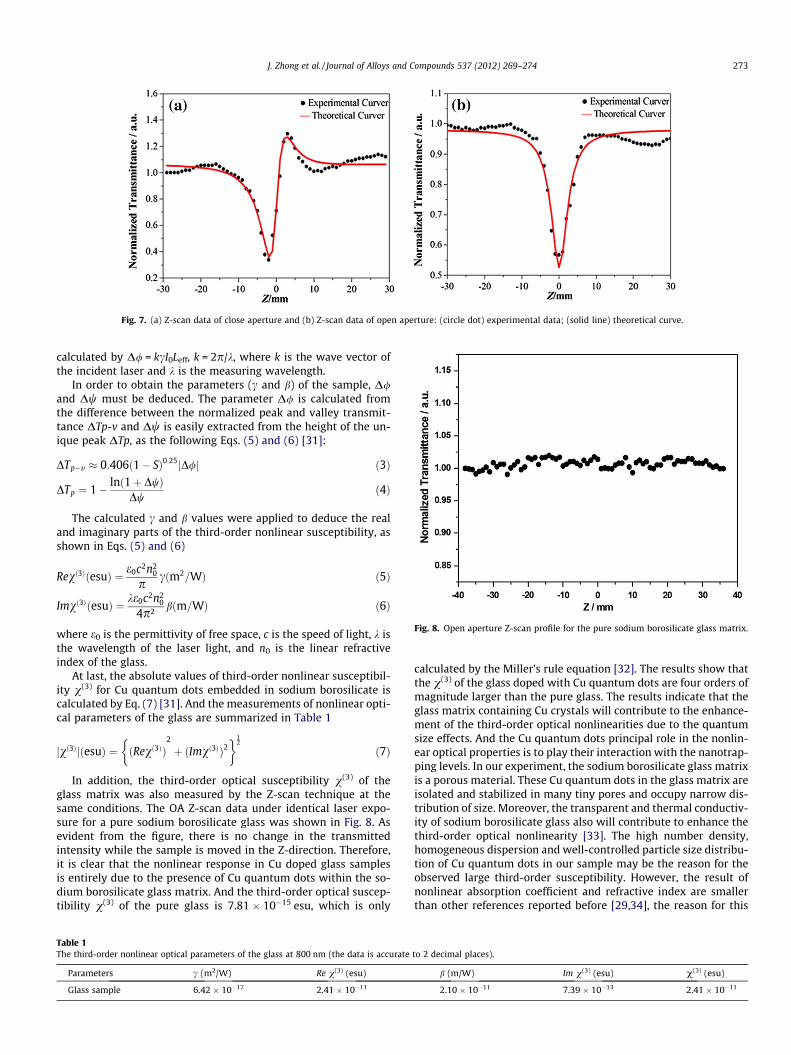
Fig. 7. (a) Z-scan data of close aperture and (b) Z-scan data of open aperture: (circle dot) experimental data; (solid line) theoretical curve.
Fig. 8. Open aperture Z-scan profile for the pure sodium borosilicate glass matrix.
J. Zhong et al. / Journal of Alloys and Compounds 537 (2012) 269–274 273
calculated by D/ = kcI0Leff, k = 2p/k, where k is the wave vector ofthe incident laser and k is the measuring wavelength.
In order to obtain the parameters (c and b) of the sample, D/and Dw must be deduced. The parameter D/ is calculated fromthe difference between the normalized peak and valley transmit-tance DTp-v and Dw is easily extracted from the height of the un-ique peak DTp, as the following Eqs. (5) and (6) [31]:
DTp�v � 0:406ð1� SÞ0:25jD/j ð3Þ
DTp ¼ 1� lnð1þ DwÞDw
ð4Þ
The calculated c and b values were applied to deduce the realand imaginary parts of the third-order nonlinear susceptibility, asshown in Eqs. (5) and (6)
Revð3ÞðesuÞ ¼ e0c2n20
pcðm2=WÞ ð5Þ
Imvð3ÞðesuÞ ¼ ke0c2n20
4p2 bðm=WÞ ð6Þ
where e0 is the permittivity of free space, c is the speed of light, k isthe wavelength of the laser light, and n0 is the linear refractiveindex of the glass.
At last, the absolute values of third-order nonlinear susceptibil-ity v(3) for Cu quantum dots embedded in sodium borosilicate iscalculated by Eq. (7) [31]. And the measurements of nonlinear opti-cal parameters of the glass are summarized in Table 1
jvð3ÞjðesuÞ ¼ ðRevð3ÞÞ� 2
þ ðImvð3ÞÞ2�1
2
ð7Þ
In addition, the third-order optical susceptibility v(3) of theglass matrix was also measured by the Z-scan technique at thesame conditions. The OA Z-scan data under identical laser expo-sure for a pure sodium borosilicate glass was shown in Fig. 8. Asevident from the figure, there is no change in the transmittedintensity while the sample is moved in the Z-direction. Therefore,it is clear that the nonlinear response in Cu doped glass samplesis entirely due to the presence of Cu quantum dots within the so-dium borosilicate glass matrix. And the third-order optical suscep-tibility v(3) of the pure glass is 7.81 � 10�15 esu, which is only
Table 1The third-order nonlinear optical parameters of the glass at 800 nm (the data is accurate
Parameters c (m2/W) Re v(3) (esu)
Glass sample 6.42 � 10�17 2.41 � 10�11
calculated by the Miller’s rule equation [32]. The results show thatthe v(3) of the glass doped with Cu quantum dots are four orders ofmagnitude larger than the pure glass. The results indicate that theglass matrix containing Cu crystals will contribute to the enhance-ment of the third-order optical nonlinearities due to the quantumsize effects. And the Cu quantum dots principal role in the nonlin-ear optical properties is to play their interaction with the nanotrap-ping levels. In our experiment, the sodium borosilicate glass matrixis a porous material. These Cu quantum dots in the glass matrix areisolated and stabilized in many tiny pores and occupy narrow dis-tribution of size. Moreover, the transparent and thermal conductiv-ity of sodium borosilicate glass also will contribute to enhance thethird-order optical nonlinearity [33]. The high number density,homogeneous dispersion and well-controlled particle size distribu-tion of Cu quantum dots in our sample may be the reason for theobserved large third-order susceptibility. However, the result ofnonlinear absorption coefficient and refractive index are smallerthan other references reported before [29,34], the reason for this
to 2 decimal places).
b (m/W) Im v(3) (esu) v(3) (esu)
2.10 � 10�11 7.39 � 10�13 2.41 � 10�11

274 J. Zhong et al. / Journal of Alloys and Compounds 537 (2012) 269–274
could attribute to low local density of Cu nanoparticles and shortpulse duration used in Z-scan, which may associated with quan-tum effect and thermal effect, respectively. And further researchesare in progress.
4. Conclusions
In summary, the sodium borosilicate glass doped with Cuquantum dots have been successfully fabricated with conventionalsol–gel method. It was clear that Cu quantum dots in face-centered-cubic crystal system have uniformly formed in the glass matrix, andthe size distribution of these quantum dots generally ranged from1.5 nm to 5 nm with the average particle size about 2.7 nm. Theoptical absorption properties were measured from 400 to 850 nm,and the absorption peak at 560 nm was observed. The nonlinearoptical properties of the glasses were determined using Z-scanmethod at the wavelength of 800 nm. The obtained third-orderoptical nonlinear refractive index c, the absorption coefficient b,and the susceptibility v(3) of the glass were 6.42 � 10�17 m2/W,2.10 � 10�11 m/W, and 2.41 � 10�11 esu, respectively.
Acknowledgements
We thank the Professor Shixun Dai and Doctor Feifei Chen ofNingbo University for his useful help and suggestion in Z-scanmeasurement. The work was financially supported by the NationalNature Science Foundation of China (Nos. 50772075, 50972107 and51172165), Zhejinag Province Key Scientific and TechnologicalInnovations Team of China (No. 2009R50010), and Key Foundationof Zhejiang Province Natural Science Foundation of China (No.Z4110347).
References
[1] H.S. Kim, K.B. Yoon, J. Am. Chem. Soc. 134 (2012) 2539–2542.[2] F. Todescato, I. Fortunati, S. Gardin, E. Garbin, E. Collini, R. Bozio, J.J. Jasieniak,
G.D. Giustina, G. Brusatin, S. Toffanin, R. Signorini, Adv. Funct. Mater. 22 (2012)337–344.
[3] M. Aslan, B.G. Yalçın, M. Üstündag, J. Alloys Compd. 519 (2012) 55–59.[4] F. D’Amore, S.M. Pietralunga, P. Lorusso, M. Martinelli, A. Zappettini, E. Dal Bo,
F. Tassone, P. Tognini, M. Travagnin, Phys. Stat. Sol. C 4 (2004) 1001–1004.[5] E. Piskorska-Hommel, V. Holy, O. Caha, A. Wolska, A. Gust, C. Kruse, H. Kröncke,
J. Falta, D. Hommel, J. Alloys Compd. 523 (2012) 155–160.[6] T.S. Huang, C.Y. Cheng, Y.C. Chen, C.T. Wan, M.V.M. Rao, Y.K. Su, IEEE Phot.
Technol. Lett. 22 (2010) 305–307.
[7] C. Cheng, H.L. Jiang, D.W. Ma, X.Y. Cheng, Opt. Commun. 284 (2011) 4491–4495.
[8] R.S.S. Saravanan, D. Pukazhselvan, C.K. Mahadevan, J. Alloys Compd. 517(2012) 139–148.
[9] S.S. Nath, D. Chakdar, G. Gope, J. Kakati, B. Kalita, A. Talukdar, D.K. Avasthi, J.Appl. Phys. 105 (2009) 094305–094309.
[10] Z.W. Xiong, W.G. Sun, X.M. Wang, F. Jiang, W.D. Wu, J. Alloys Compd. 513(2012) 300–303.
[11] X.C. Yang, Z.W. Dong, H.X. Liu, J.X. Xu, S.X. Qian, Chem. Phys. Lett. 475 (2009)256–259.
[12] V.L. Schmit, R. Martoglio, B. Scott, A.D. Strickland, K.T. Carron, J. Am. Chem. Soc.134 (2012) 59–62.
[13] L. De Boni, E.C. Barbano, T.A. De Assumpção, L. Misoguti, L.R.P. Kassab, S.C.Zilio, Opt. Express 20 (2012) 6844–6850.
[14] Y. Teng, J.J. Zhou, F.F. Luo, G. Lin, J.R. Qiu, J. Non-Cryst. Solids 357 (2011) 2380–2383.
[15] T. Srikumar, I.V. Kityk, Ch. Srinivasa Rao, Y. Gandhi, M. Piasecki, P. Bragiel, V.Ravi Kumar, N. Veeraiah, Ceram. Int. 37 (2011) 2762–2779.
[16] K.J. Ziegler, R.C. Doty, K.P. Johnston, B.A. Korgel, J. Am. Chem. Soc. 123 (2001)7797–7803.
[17] S. Mallick, S. Sharma, M. Banerjee, S.S. Ghosh, A. Chattopadhyay, A. Paul, ACSAppl. Mater. Inter. 4 (2012) 1313–1323.
[18] Y.H. Wang, Y.M. Wang, J.D. Lu, L.L. Ji, R.G. Zang, R.W. Wang, Opt. Commun. 283(2010) 486–489.
[19] S. Ju, P.R. Watekar, S. Jeong, Y. Kim, W.T. Han, J. Nanosci. Nanotechnol. 12(2012) 629–634.
[20] R.A. Ganeev, A.I. Ryasnyanski, A.L. Stepanov, T. Usmanov, C. Marques, R.C. daSilva, E. Alves, Opt. Spectrosc. 101 (2006) 615–622.
[21] A.I. Ryasnyansky, B. Palpant, S. Debrus, R.I. Khaibullin, A.L. Stepanov, J. Opt. Soc.Am. B 23 (2006) 1348–1353.
[22] R.D. Nalda, R.D. Coso, J. Requejo-Isidro, J. Olivares, A. Suarez-Garcia, J. Solis,C.N. Afonso, J. Opt. Soc. Am. B 19 (2002) 289–296.
[23] Y. Takeda, O.A. Plaksin, K. Kono, N. Kishimoto, Surf. Coat. Technol. 196 (2005)30–33.
[24] A. Cetin, R. Kibar, M. Hatipoglu, Y. Karabulut, N. Can, Physica B: Condens.Matter. 405 (2010) 2323–2325.
[25] W.D. Xiang, S.S. Tang, X.Y. Zhang, X.J. Liang, J. Alloys Compd. 471 (2009) 498–501.
[26] J.F. Moulder, W.F. Stickle, K.D. Bomben, Handbook of X-ray PhotoelectronSpectroscopy, Perkin–Elmer Corporation, America, 1992, p. 86.
[27] C.H. Zhao, B.P. Zhang, S.J. Wang, P.P. Shang, S. Li, L.P. Yan, Mater. Des. 32 (2011)947–950.
[28] V.S. Gurin, A.A. Alexeenko, S.A. Zolotovskaya, K.V. Yumashev, Mater. Sci. Eng. C26 (2006) 952–955.
[29] Y.H. Wang, L. Wei, J.D. Lu, L.L. Ji, R.G. Zang, R.W. Wang, H.Q. Li, Vacuum 86(2011) 285–289.
[30] E.A. Davis, N.F. Mott, Philos. Mag. 22 (1970) 903–922.[31] M. Sheik-Bahae, A.A. Said, T.H. Wei, D.J. Hagan, E.W. Van Stryland, IEEE J.
Quantum Electron. 26 (1990) 760–769.[32] N. Sugimoto, H. Kanbara, S. Fujiwara, K. Tanaka, Y. Shimizugawa, J. Opt. Soc.
Am. B 16 (1999) 1904–1908.[33] X.Y. Yang, W.D. Xiang, H.J. Zhao, H.T. Liu, X.Y. Zhang, X.J. Liang, J. Alloys Compd.
509 (2011) 7283–7289.[34] A.L. Stepanov, R.A. Ganeev, A.I. Ryasnyansky, T. Usmanov, Nucl. Instrum.
Methods Phys. Res. B 206 (2003) 624–628.
Copyright © 2022 FDOKUMEN