Synthesis and Photophysical Studies of Pt(II)(bipyridyl) Complexes with Heteroatom- Substituted...
41
47 CHAPTER THREE Synthesis and Photophysical Studies of Pt(II)(bipyridyl) Complexes with Heteroatom- Substituted Maltol Derivatives: Long-lived Room Temperature Luminescence Introduction. Square Planar Platinum(II) Complexes Eisenberg complexes. The Eisenberg group first described the photochemistry of square planar Pt II (bpy)Ln complexes, which arise from an unusual metal-assisted ligand- to-ligand charge transfer (LLCT). 1–3 As shown in Scheme 3.1, the ancillary ligand Ln acts as an electron donor, typically dithiols or acetylides, while the bipyridine acts as electron acceptor, as it does in the well characterized [Ru(bpy)3] 2+ complex and related luminophores. The Pt II (bpy)Ln complexes demonstrate exceptionally long lived emissions, quite rare for d 8 square planar complexes known at that time. Subsequently, a number of Pt(bpy)(electron-donor) complexes have been reported with emissions in the range of 540-650 nm with lifetimes varying from nanosecond at room temperature to microsecond when cooled to 77 K. 4–7 Aromatic dithiolate donors demonstrate some of the longest lived (µs) excited state lifetimes for this luminophore motif. 6,8–12 Alternating the chelating atoms (O,O, O,S) and the in-ring heteroatom of the electron-donor allows tuning of the photophysical and photochemical properties, such as HOMO/LUMO band gaps, excited state lifetimes, near IR emissions, and singlet-oxygen sensitization. 13–15
Transcript of Synthesis and Photophysical Studies of Pt(II)(bipyridyl) Complexes with Heteroatom- Substituted...

47
CHAPTER THREE
Synthesis and Photophysical Studies of Pt(II)(bipyridyl) Complexes with Heteroatom-Substituted Maltol Derivatives: Long-lived Room Temperature Luminescence
Introduction.
Square Planar Platinum(II) Complexes
Eisenberg complexes. The Eisenberg group first described the photochemistry of
square planar PtII(bpy)Ln complexes, which arise from an unusual metal-assisted ligand-
to-ligand charge transfer (LLCT).1–3 As shown in Scheme 3.1, the ancillary ligand Ln acts
as an electron donor, typically dithiols or acetylides, while the bipyridine acts as electron
acceptor, as it does in the well characterized [Ru(bpy)3]2+ complex and related
luminophores. The PtII(bpy)Ln complexes demonstrate exceptionally long lived
emissions, quite rare for d8 square planar complexes known at that time. Subsequently, a
number of Pt(bpy)(electron-donor) complexes have been reported with emissions in the
range of 540-650 nm with lifetimes varying from nanosecond at room temperature to
microsecond when cooled to 77 K.4–7 Aromatic dithiolate donors demonstrate some of
the longest lived (µs) excited state lifetimes for this luminophore motif.6,8–12 Alternating
the chelating atoms (O,O, O,S) and the in-ring heteroatom of the electron-donor allows
tuning of the photophysical and photochemical properties, such as HOMO/LUMO band
gaps, excited state lifetimes, near IR emissions, and singlet-oxygen sensitization.13–15

48
Scheme 3.1 General synthesis and structure of Pt(bpy)(electron-donor) complexes.
In this work, a series of PtII(bpy)Ln complexes have been synthesized using
thiomaltol (Htma), dithiomaltol (Httma) and hydroxypyridinthione (Hopto) ligands,
Scheme 3.2. Previous reports have shown these hydroxythiones to be strong metal
chelators for biomedical applications.16–19 As previously noted, unusual photoreductive
chemistry by Ru(II) and Zn(II) complexes of dithiomaltol suggests the reactivity resulted
from pseudo-aromaticity within the hetero-substituted hydroxypyridthione ring.20 The
complexes [Pt(bpy)tma][PF6] (3-1), [Pt(bpy)ttma][PF6] (3-2), and [Pt(bpy)(hopto)][PF6]
(3-3) which represent the first Pt(bpy)(electron-donor) complexes with mixed O,S atom
chelation and as will be shown, they exhibit some of the longest luminescence lifetimes
for this structural motif.
Scheme 3.2 Mixed, O,S and O,O chelating ligands
N
NPt
Cl
Cl+
N
NPt
X
Y
Ethylene Glycol
X
Y
ElectronDonor
ElectronAcceptor
hv
e-
O
S
OH
Htma
S
S
OH
Httma
N
S
OH
Hopto
O
O
OH
Maltol
N
O
OH
Deferiprone
N
O
OH
PhHppp

49
Experimental
Materials and Methods
Reagents. Compounds such as 3-hydroxy-2-methyl-4H-pyran-2-one (maltol,
Aldrich), Lawesson’s reagent, (2,2’-bipyridine)dichloroplatinum(II), (Alfa Aesar), and
phosphorous pentasulfide (P4S10) (Acros) were used as received from vendors. 3-
hydroxy-2-methyl-4H-pyran-4-thione (thiomaltol, Htma), 3-hydroxy-2-methyl-4H-
thiopyran-4-thione (dithiomaltol, Httma), and 3-hydroxy-1,2-dimethylpyridine-4(1H)-
thione (Hopto) were synthesized by previously reported methods.16–18,21 Acetonitrile
(CH3CN, Fischer) and dichloromethane (CH2Cl2, Fischer) were purified and dried on
glass columns under argon. Ethylene glycol (BDH) was degassed before each use.
Physical measurements. Electronic absorption, steady-state luminescence,
relative quantum yields,22 self-quenching, and steady-state Stern-Volmer experiments
were carried out in degassed, anhydrous CH3CN on a HP Agilent 8453 UV-Visible
spectrophotometer and a Hitachi Fluorescence Spectrophotometer F-7000. Self-
quenching experiments for emission intensity maxima as a function of concentration (10-
4–10-5 mol/L) were used for room temperature emission lifetime studies and measured in
CH3CN. Low-temp lifetimes (77 K) were measured in a dimethylformamide-methylene
chloride-methanol (DMM) solution on a PTI Spectrofluorometer with steady-state, nano-
and micro-second lifetime accessories at the Omary Lab. Elemental analysis of each
sample was performed by Atlantic Microlab Inc.

50
Electrochemistry. Redox potentials were measured by cyclic voltammetry (CV)
under anaerobic conditions using a CHI-760B potentiostat in dry-degassed CH3CN with
0.1 M tetrabutylammonioum hexafluorophosphate (TBAPF6) as the supporting
electrolyte. The cells consisted of a Pt-disk working electrode, AgCl coated Ag reference
wire, and a coiled Pt wire auxiliary electrode. All electrochemical measurements were
corrected using the ferrocene/ferrocenium couple (Fc/Fc+ = 642 mV vs. NHE). 1H NMR
(499.78 MHz) spectra were recorded on a Varian 500 NMR System in deuterated-
acetonitrile (CD3CN), unless noted otherwise. Accurate masses were resolved by
electrospray ionization mass spectrometry (ESI-MS) on a Thermo Scientific LTQ
Orbitrap Discovery in methanol (CH3OH) solutions of 1-10 ppm.
Photophysical studies. Lifetime studies were performed on solutions in
deuterated-acetonitrile (CD3CN) with absorbances between 0.05–0.3 AU at the 355 nm
excitation wavelength. The laser pulse energy was 1–2.5 mJ at 355 nm. Room
temperature emission lifetimes were measured in CH3CN while low-temp lifetimes (77
K) were measured in a dimethylformamide-methylene chloride-methanol (DMM)
solution on a PTI Spectrofluorometer with steady-state, nano- and micro-second lifetime
accessories.
Singlet oxygen. Measurements of 1O2 quantum yields and luminescence
quenching rates of 1O2 were determined by the Selke Lab using a time-resolved Nd:YAG
laser set-up (excitation pulse duration 4–6 ns at 355 nm and 5–7 ns at 532 nm, Minilase
II, New Wave Research Inc.) and a liquid N2 cooled Ge photodetector (Applied Detector
Corporation Model 403 S). A Schott color glass filter (model RG850, cut-on 850 nm,

51
Newport, USA) was taped to the sapphire entrance of the detector to block ultraviolet and
visible radiation. The port opening to the detector contained a long wave pass filter
(silicon filter model 10LWF ~ 1000, Newport, USA) which transmits in the range of
1100–2220 nm and blocks in the range of 800–954 nm, a band pass filter (model BP-
1270–080-B*, CWL 1270 nm, Spectrogen, USA) which blocks in the UV, visible, and IR
regions and only transmits in the range of 1200 to 1310 nm with a maximum
transmission of 60% at 1270 nm. Signals were digitized on a LeCroy 9350 CM 500 MHz
oscilloscope and analyzed using Origin software. All experiments were carried out at
ambient temperature and air. UV-visible spectra were recorded on a Cary 300 Bio
Spectrophotometer (Varian).
The absorbance of the reference sensitizer (perinaphthenone) and the PtII
complexes were matched within 80%. The initial 1O2 intensity was extrapolated to t = 0.
The data points of the initial 0–5 s were not used due to electronic interference signals
from the detector. The quenching rates of 1O2 were measured by Stern–Volmer analysis
using methylene blue as sensitizer at 532 nm in (CD3CN). The concentration of the PtII
complexes used in the measurements ranged between 0.01–0.6 mM.
Experiments with (2,2’-Bipyridine)Platinum(II) and Thiolated Chelates (O,S)
Synthesis of thiomaltol, 3-hydroxy-2-methyl-4-pyranthione, Htma. In a glove box
3.54 g maltol (0.0280 mol) and 3.80 g P2S5 (0.00855 mol) were measured and removed in
a sealed flask. Hot, dry dioxane was added to the flask and refluxed under N2 for 2.5 hr.
250 mL of DI H2O was added to the dark green solution and stored in refridgeration over
night. Filtration gave yellow powder/crystalline mixture, 1.58g (39.7%). ESI MS: m/z,

52
NMR 1H NMR (500 MHz, CDCl3) δ 7.77 (s, 1H), 7.58 (d, J = 5.0 Hz, 1H), 7.32 (d, J =
5.0 Hz, 1H), 2.45 (s, 3H). UV-vis: CH3CN, ƛmax (ε in M-1•cm-1) 206 (ε =12,000), 275 (ε
=14,000), 359 (ε =19,000).
Synthesis of 3-hydroxy-2-methyl-4H-thiopyridinone (HOPTO). Thiomaltol, 0.502
g (3.98 mmol) was dissolved into 20.0 mL of deionized water and degassed. Then, 3.5
mL MeNH3 (40% in water) was added by syringe resulting in an amber solution. The
colored solution was then refluxed under anaerobic conditions for 54 hours. Cooling to
room temperature resulted in a red precipitate collected by filtration, 0.432 g (70.0 %
yield). 1H NMR (500 MHz, CDCl3) δ 8.77 (s, 1H), 7.47 (d, J = 6.7 Hz, 1H), 7.11 (d, J =
6.7 Hz, 1H), 3.78 (s, 3H), 2.50 (s, 3H). UV-vis: CH3CN, ƛmax (ε in M-1•cm-1) 213 (ε =
2,790), 257 (ε = 1,630), 349 (ε = 4,210).
Synthesis of (2,2’-bipyridine)thiomaltolatoplatinum(II) hexafluorophosphate,
[Pt(bpy)(tma)][PF6], 3-1. A 0.127 g (0.300 mmol) sample of Pt(bpy)Cl2 and 0.0433 g
(0.304 mmol) thiomaltol were dissolved in 5.0 mL ethylene glycol and refluxed for 30
min. The mixture was then poured into a solution of 200 mL DI H2O and KPF6 1.10 g
(5.98 mmol). The orange-red solid was collected after refrigeration (2 hr) and washed
with DI H2O. Purification by chromatography on basic alumnia with CH3CN/CH2Cl2 as
the eluent (1:1) yielded 0.126 g (0.197 mmol, 64.8% based on Pt). Product was
characterized by 1H NMR (500 MHz, CD3CN) δ 8.90 (d, J = 4.9 Hz, 1H), 8.70 (d, J = 5.6
Hz, 1H), 8.25 (td, J = 7.8, 1.5 Hz, 1H), 8.16 (m, 2H), 8.03 (d, J = 4.7 Hz, 1H), 7.72 (ddd,
J = 7.3, 5.6, 1.4 Hz, 1H), 7.47 (d, J = 4.7 Hz, 1H), 7.42 (ddd, J = 7.7, 5.8, 2.0 Hz, 1H),
2.66 (s, 3H), ESI-MS m/z 492 ([M]+). UV-vis: CH3CN, max ( = M-1•cm-1) 268 (22,000),

53
309 (10,600), 321 (12,000), 340 (6,340), 430 (13,300); Anal. for [C16H14N2O2PtS][PF6]:
calculated(found) C, 30.15(31.09): H, 2.06 (2.09): N, 4.39 (4.29).
Synthesis of (2,2’-bipyridine)dithiomaltolatoplatinum(II) hexafluorophosphate,
[Pt(bpy)(ttma)][PF6], 3-2a. A 0.0988 g (0.234 mmol) sample of Pt(bpy)Cl2 and 0.0452 g
(0.286 mmol) dithiomaltol were dissolved in 5.0 mL ethylene glycol and refluxed for 30
min with color change from yellow to red. The mixture was then poured into 200 mL of
DI H2O and 0.557 g (3.03 mmol) of KPF6. The new solution was allowed to stand in an
ice bath, forming a purple precipitate that was collected as a red-orange solid and washed
with DI H2O. Purification by chromatography on basic alumnia with CH3CN/CH2Cl2 as
the eluent (1:1) yielded 0.122 g (0.186 mmol, 79.5% based on PtII). 1H NMR (500 MHz,
(CD3)2SO) δ 8.72 (d, J = 5.2 Hz, 1H), 8.57 (d, J = 5.5 Hz, 1H), 8.44 (d, J = 9.0 Hz, 1H),
8.36 (d, J = 8.1 Hz, 1H), 8.28 (t, J = 7.8 Hz, 1H), 8.15 (t, J = 7.8 Hz, 1H), 8.06 (d, J = 9.0
Hz, 1H), 7.75 (t, J = 6.3 Hz, 1H), 7.42 (t, J = 6.6 Hz, 1H), 2.60 (s, 3H), ESI-MS m/z 508
([M]+), UV-vis: CH3CN, max( = M-1•cm-1) 247 (15,800), 268 (18,800), 307 (9,970), 320
(4,380), 458 (15,500); Anal. for [C16H14N2OPtS2][PF6]: calculated(found) C,
29.41(29.20), H, 2.01(1.98), N, 4.29(4.17).
Synthesis of (4,4’-diterbutyl-2,2’-bipyridine)dithiomaltolplatinum(II)-
hexafluorophosphate (3-2b). A mixture of 4,4’-di-tert-butyl-bipyridineplatinum(II)
dichloride (102.1 mg, 0.1909 mmol) and dithiomaltol (32.0 mg, 0.202 mmol) were
combined into a round bottom flask. 10.0 mL of ethylene glycol, degassed, was added to
the mixture and stirred. The suspension was set to reflux under N2 for 6 hrs. The
reaction’s mixture was poured into a 200 mL solution of 0.2 M KPF6 and stored

54
overnight at 1.1˚C. The red-orange precipitate was filtered off and washed with 3 x 10
mL portions of DI H2O. Purification by column chromatography on silca with 5% MeOH
in DCM yielded 50.6 mg (0.0661 mmol, 34.6 %, based on PtII). 1H NMR (500 MHz,
CD3CN) δ 9.00 (d, J = 5.9 Hz, 1H), 8.69 (d, J = 6.2 Hz, 1H), 8.31 (s 1H), 8.25 (s, 1H),
8.12 (m, 2H), 7.83 (d, J = 6.04 1H), 7.51 (d, J = 6.1 Hz, 1H), 2.74 (s, 3H), 1.49 (s, 9H),
1.44 (s, 9H).
Synthesis of (2,2’-bipyridine)(3,4-HOPTO)platinum(II) hexafluorophosphate,
[Pt(bpy)(HOPTO)][PF6] 3-3. A sample of 0.225 g of Pt(bpy)Cl2 (0.549 mmol) was
added to a solution of 3,4-HOPTO, 0.0826 g (0.532 mmol) dissolved in 5.0 mL of
ethylene glycol and refluxed. After refluxing for 30 min, 3.51 g KPF6 (19.1 mmol) were
dissolved in 300 mL DI H2O and added to the reaction solution. A brown precipitate was
collected by filtration and washed with DI H2O. Purification by chromatography on basic
alumnia with CH3CN/CH2Cl2 as the eluent (1:1) yielded 0.230 g (0.354 mmol, 64.5%
based on PtII). 1H NMR (500 MHz, CD3CN) δ 9.56 (d, J = 5.8 Hz, 1H), 9.04 (d, J = 5.5
Hz, 1H), 8.72 (d, J = 5.6 Hz, 1H), 8.18 (m, 2H), 7.72 (m, 1H), 7.62 (m, 1H), 7.46 (d, J =
6.6 Hz, 1H), 7.40 (td, J = 5.7, 3.3 Hz, 1H), 7.28 (d, J = 6.4 Hz, 1H), 3.93 (s, 3H), 2.61 (s,
3H), ESI-MS m/z 505 ([M]+), UV-vis: CH3CN, max ( = M-1•cm-1) 277 (9,560), 309
(6,660), 316 (5,990), 360 (3,730), 440 (2,360), Anal. for [C17H17N3OPtS][PF6]:
calculated(found) C, 31.39(32.85), H, 2.48(2.93), N, 6.46(6.29).

55
Experiments with (2,2’-Bipyridine)Platinum(II) and Oxygen Chelates (O,O)
Synthesis of 3-hydroxy-2-methyl-1-phenyl-4-pyridinone, Hppp. Maltol (4.0331 g,
0.03198 mol) and aniline (6.3631 g, 0.06833 mol) were combined into a 250 mL round-
bottom-Schlenk flask and diluted with 100 mL of 1% HCl(aq). The mixture was sealed
and set in a heated silicone oil bath for 3 days at 120˚C. The off-white precipitate was
separated by filtration and decolorized with black carbon in hot-methanol. The slurry was
then filtered through a glass frit. Isolation by crystallization yielded 1.7977 g (8.9384
mmol, 25.88%). 1H NMR (500 MHz, acetone) δ 7.60 (m, 3H), 7.51 (d, J = 7.3 Hz, 1H),
7.48 (m, 2H), 6.27 (d, J = 7.3 Hz, 1H), 2.04 (s, 3H).
Preparation of diaqua(2,2’-bipyridine)platinum(II) nitrate, [Pt(bpy)
(H2O)2][(NO3)2]. To a vigorously stirred flask of 2,2’bipyridineplatinum(II)chloride
(0.513 g, 1.22 mmol) in degassed nano-pure water (144 mL), 2.29 molar equivalents of
silver nitrate (0.467 g, 2.78 mmol) was added. The suspension was stirred under N2 for
14 hr at room temperature forming a green/grey slurry. The suspension was filtered three
times through a celite plug to remove silver chloride. The mixture was used as collected
for synthesis of (2,2’-bipyridine)(maltolato)platinum(II)hexafluorophosphate.
Synthesis of (2,2’-bipyridine)(maltolato)platinum(II)hexafluorophosphate,
[Pt(bpy)(ma)][PF6] 3-4. To the 8.44 mM solution of Pt(bpy)(NO3)2 • 2H2O (0.607
mmol) previously prepared, >1 molar equivalent of maltol (532.1 mg, 4.22 mmol) and
triethylamine (0.625 mL, 4.48 mmol) dissolved in nano-pure H2O (72.0 mL) and added.
After stirring for 12 hr, 1.42 g KPF6 (7.71 mmol) dissolved into 500 mL DI H2O and

56
added to the reaction mixture and refrigerated for 4 hr. Filtration and purification on
alumina with MeCN/H2O collected 140 mg of a bright red solid, 37.1 % Yield. 1H NMR
(500 MHz, (CD3)2CO) δ 9.07 (dd, J = 16.0, 5.3 Hz), 8.57 (d, J = 7.6 Hz), 8.47 (d, J = 7.9
Hz), 8.31 (d, J = 5.1 Hz), 7.03 (d, J = 5.1 Hz), 2.67 (s), ESI-MS m/z 476 ([M]+), UV-vis:
CH3CN, max ( = M-1•cm-1) 256 (4,020), 304 (1,760), 316 (1,700), 348 (870), 397 (941),
Synthesis of 2,2’-bipyridine(3-hydroxy-1,2-dimethyl-4-pyridinone)platinum(II)
hexafluorophosphate, [Pt(bpy)(HOPO)][PF6] 3-5. A solution of Pt(bpy)(NO3)2 • 2H2O
(0.241 mmol) and, triethylamine, 0.40 mL, and 40.1 mg of HOPO were combined and
stirred for 12 hr. The reaction was then added to a solution of 317 mg KPF6 (2.02 mmol)
dissolved into 200.0 mL DI H2O and allowed to precipitate in the refrigerator. Filtration
afforded 58.0 mg, 54.3 % yield. 1H NMR (500 MHz, CD3CN) δ 8.95 (d, J = 5.8 Hz, 1H),
8.85 (d, J = 4.7 Hz, 1H), 8.26 (t, J = 7.9 Hz, 2H), 8.17 (d, J = 8.0 Hz, 2H), 7.64 (m, 2H),
6.95 (d, J = 2.1 Hz, 1H), 6.87 (s, 1H), 2.51 (s, 3H), 2.19 (s, 3H), 13C NMR (125 MHz,
CD3CN) δ 213.45, 155.55, 150.95, 148.49, 146.40, 141.39, 141.12, 133.44, 132.66,
128.04, 127.89, 124.04, 123.80, 122.78, 105.32, 23.84; ESI-MS m/z 489 ([M]+), UV-vis:
CH3CN, max ( = M-1•cm-1) 239 (30,600), 258 (32,300), 301 (17,000), 312 (16,200), 423
(5,260).
Synthesis of 2,2’-bipyridine(3-hydroxy-2-methyl-1-phenyl-4-pyridinone)
platinum(II)hexafluorophosphate, [Pt(bpy)(hppp)][PF6] 3-6. To an 8.44 mM solution of
Pt(bpy)(NO3)2 (0.607mmol), >1 molar equivalent of 3-hydroxy-2methyl-1-phenyl-4-
pyridinone (hppp, 901,8 mg, 4.48 mmol) and triethylamine (0.625 mL, 4.48 mmol)
dissolved in nano-pure H2O (72.0 mL) and added. After stirring for 12 hr, 1.42 g KPF6

57
(7.71 mmol) dissolved into 500 mL DI H2O and added to the reaction mixture,
refrigerated for 4 hr. Filtration collected a dark red solid, 226 mg, 58.6 % yield. 1H NMR
(500 MHz, CD3CN) δ 8.75 (dd, 16.1 ,5.7 Hz, 2H), 8.20 (ddd, J = 16.1, 8.2, 1.5 Hz, 2H),
8.07 (dd, J = 7.7, 3.1 Hz, 2H), 7.65 (m, 3H) 7.58 (dtd, 25.31, 5.66, 1.33 Hz, 2H), 7.49 (d,
J = 6.9 Hz, 1H), 7.44 (ddd, J = 5.5, 3.4, 1.5 Hz, 2H), 6.61 (d, J = 6.8 Hz, 1H), 2.14 (s,
3H), 13C NMR (125 MHz, CD3CN) δ 207.34, 176.03, 160.60, 156.90, 156.60, 156.34,
149.50, 149.31, 141.32, 140.28, 140.01, 137.26, 134.79, 130.41, 130.16, 128.02, 127.83,
126.59, 123.75, 123.63, 110.31, ESI-MS m/z 551 ([M]+), UV-vis: CH3CN, max ( = M-
1•cm-1) 257 (18,600), 303 (8,240), 316 (8,030), 422 (4,280).
Results
Studies with (2,2’-Bipyridine)Platinum(II) and Thiolated Chelates (O,S)
Synthesis and characterization of 3-1 – 3-3. The ligands Htma, Httma, and Hopto
(Scheme 3.2) were synthesized from methods in reported literature.16,24–26 The syntheses
of Pt-complexes 3-1 – 3-3 were adapted from previous reports.6,9–11,27–29 The ligands were
mixed with stoichiometric Pt(bpy)Cl2 or Pt(tbu-bpy)Cl2 and refluxed in ethylene glycol
until a color change was observed. The reaction mixture was diluted in water, and the Pt-
containing products precipitated as hexafluorophosphate salts which are air stable for
extended periods. Crude products were separated by column chromatography and the
purified samples characterized by 1H NMR spectra, ESI-MS, and elemental analysis, and
13C NMR spectra where elemental analysis is unavailable.

58
NMR Characterization. The conversion of a pyrone to thiopyrone shifts the
vinylic proton signals in 1H NMR spectra downfield, implying increased aromaticity of
the heterocyclic system.30 A measure of the aromaticity is obtained using Eq. 3.1, the
averaged chemical shifts of vinylic ring protons. As seen in Figure 3.1, the apparent
aromaticity of compounds vary with 3-2 > 3-1 > 3-3, with average vinylic chemical shifts
in ppm of 8.32, 7.76 and 7.30 respectively. By this measure, all three complexes with the
maltol-derivatives have aromaticity greater than that of toluene-3,4-dithiolate in the
classic Eisenberg PtII(bpy)Ln complex, with an average of 6.83 ppm.6
2⁄ 3.1
Figure 3.1 1H NMR spectra (CD3CN) of 3-1 (top), 3-2 (middle) and 3-3 (bottom) from 9.5 ppm – 6.0 ppm.
Redox properties. Cyclic voltammograms of complexes 1-3 in CH3CN solution
are shown in Figure 3.2, and the determined reduction potentials are given in Table 3.1.
6.57.07.58.08.59.09.5ppm

59
In general, voltammograms for all three complexes show reductions attributable to both
the heterosubstituted maltol and the bipyridine ligands.31
Previously reported Pt(diimine)(dithiolate) complexes show irreversible
oxidations ca. 0.6 V NHE, which were attributed to Pt-centered oxidation.6,10 The
oxidations observed for complexes 3-1 – 3-3 are decidedly more positive, between 1 to 2
V vs. NHE, but assignment of ligand- or metal-based is difficult.
The reductions of the maltol-derived ligands are electrochemically irreversible
with following oxidation waves, likely due to structural changes upon reduction. For
instance, the cyclic voltammogram of 3-1 shows a small oxidation current at ca. -0.4 V,
which is only seen after sweeping through the reductive peak at -0.79 V. Similar
irreversible reductive and following oxidative waves were observed in voltammograms of
Httma, Zn(ttma)2 and (ttma)Ru(bpy)2(PF6).20 The more negative current waves are
attributable to reduction of the Pt-coordinated bipyridines, as have been previously
reported in analogous compounds. For complex 3-3, the irreversible maltol-based
reduction appears to overlap that of the bipyridine, ca. -0.92 V.
Table 3.1 Redox potentials of compounds 3-1 – 3-3
cmp EOx (V NHE) L ERed (V NHE) Bpy (Ep)
3-1 1.94ir -0.79ir -0.18f
-1.09rv (0.143)
3-2a 1.76ir -0.70ir
-0.47 -1.15rv (0.061)
3-3 1.37ir
-0.92ir -0.80rv (0.079)
Annotations: rv = chemically reversible, ir = irreversible, f = following wave. All potentials referenced to Fc/Fc+ at 642 mV vs. NHE.
60
Figure 3.2 Cyclic voltammograms of complexes 3-1 (top), 3-2a (middle) and 3-3 (bottom) under anaerobic conditions in CH3CN and 0.1 M TBAPF6, v = 100 mV s-1
Photochemical characterization. Electronic absorption spectra of compounds 3-1
– 3-3 in CH3CN, shown in Figure 3.3-6, have identifiable bands attributable to both the
bipyridine and maltol-derived ligands, from 250-400 nm, as well as characteristic LLCT
bands between 400-500 nm. The peak absorption wavelengths and tentative assignments
are given in Table 3.2. The wavelengths of absorption assigned to the maltol-derived
ligand in the complexes vary in similar order as their free ligand absorptions, with 3-1 <
3-2a < 3-3, while those assigned to the LLCT follow as 3-1 < 3-3 < 3-2a, with compound
3-2a having a much weaker and broader LLCT absorption.
-2.0 -1.0 0.0 1.0 2.0
E (V vs. NHE)

61
Figure 3.3 Room temperature UV-vis absorption of 3-1 (–-) & emission (---)
Figure 3.4 Room temperature UV-vis absorption of 3-2 (–-) & emission (---)
Figure 3.5 Room temperature UV-vis absorption of 3-2b (–-) & emission (---)
250 350 450 550 650 750
Nor
mal
ized
Int
ensi
ty
Wavelength (nm)
250 350 450 550 650 750
Nor
mal
ized
Int
ensi
ty
Wavelength (nm)
250 350 450 550 650 750
Nor
mal
ized
Int
ensi
ty
Wavelength (nm)

62
Figure 3.6 Room temperature UV-vis absorption of 3-3 (–-) & emission (---)
Table 3.2 Electronic absorption maxima of complexes 3-1 - 3-3
For solutions of all three complexes studied, excitation into the low energy LLCT
band gave a strong emission at room temperature, shown in Figure 3.3-6, with data listed
in Table 3.3. The quantum yields and Stokes shifts varied in the order of 3-2a > 3-1 > 3-
3, which also follows the pyranthione and pyridthione aromaticity as determined by
NMR. The excited state lifetimes reported in Table 3.2 were attained from purified
samples in airtight cuvettes while minimizing emission-quenching contaminants; plots of
the emission decay are given in Figure 3.8, Figure 3.10, Figure 3.12, Figure 3.14, Figure
250 350 450 550 650 750
Nor
mal
ized
Int
ensi
ty
Wavelength (nm)
# ƛmax (nm) ε (103 M-1•cm-1) assignment3-1 268 22.0 bpy
340 6.34 tma 430 13.3 LLCT
3-2a 268 18.9 bpy 355 4.38 ttma 458 15.5 LLCT
3-3 277 9.56 bpy 360 3.73 hopto 442 2.36 LLCT

63
3.17, Figure 3.19. The emission of 3-2a though significantly weaker than the others, is
still easily observable at room temperature. The emission lifetimes measured in frozen
DMM glass (DMF/CH2Cl2/CH3OH, 1:1:1 by volume) at 77K were significantly longer
and essentially identical for all three complexes.
Figure 3.7 Room temperature excitation/emission (–/(– –) spectra of 3-1, 430 nm/630 nm at 2.2 × 10⁻⁵ M
Figure 3.8 Room temperature lifetime of 3-1 (–-) & fit (---)
300 400 500 600 700
Arb
itra
y U
nits
(A
U)
Time (µs)
90 110 130 150 170 190
Arb
itra
y U
nits
(A
U)
Time (µs)

64
Figure 3.9. Low temperature (77K) excitation/emission (–/(– –) spectra of 3-1, 430 nm/630 nm at 2.2×10⁻⁵ M in DMM
Figure 3.10 Low temperature (77K) lifetime of 3-1 (–-) & fit (---) in DMM
Figure 3.11 Room temperature excitation/emission (–/(– –) spectra of 3-2a, 460 nm/690 nm at 8.4×10⁻⁵ M in DMM
300 400 500 600 700
Arb
itra
y U
nits
(A
U)
Time (µs)
90 190 290 390
Arb
itra
y U
nits
(A
U)
Time (µs)
400 500 600 700 800
Arb
itra
y U
nits
(A
U)
Wavelenth (nm)

65
Figure 3.12 Room temperature lifetime of 3-2a (–-) & fit (---) in DMM
Figure 3.13 Low temperature (77K) excitation/emission (–)/(– –) spectra of 3-2a, 458 nm/645 nm at 8.4×10⁻⁵ M in DMM
Figure 3.14 Low temperature (77K) lifetime of 3-2 (–-) & fit (---) in DMM
90 110 130 150 170 190
Arb
itra
y U
nits
(A
U)
Time (µs)
400 500 600 700 800
Arb
itra
y U
nits
(A
U)
Wavelenth (nm)
90 190 290 390
Arb
itra
y U
nits
(A
U)
Time (µs)
66
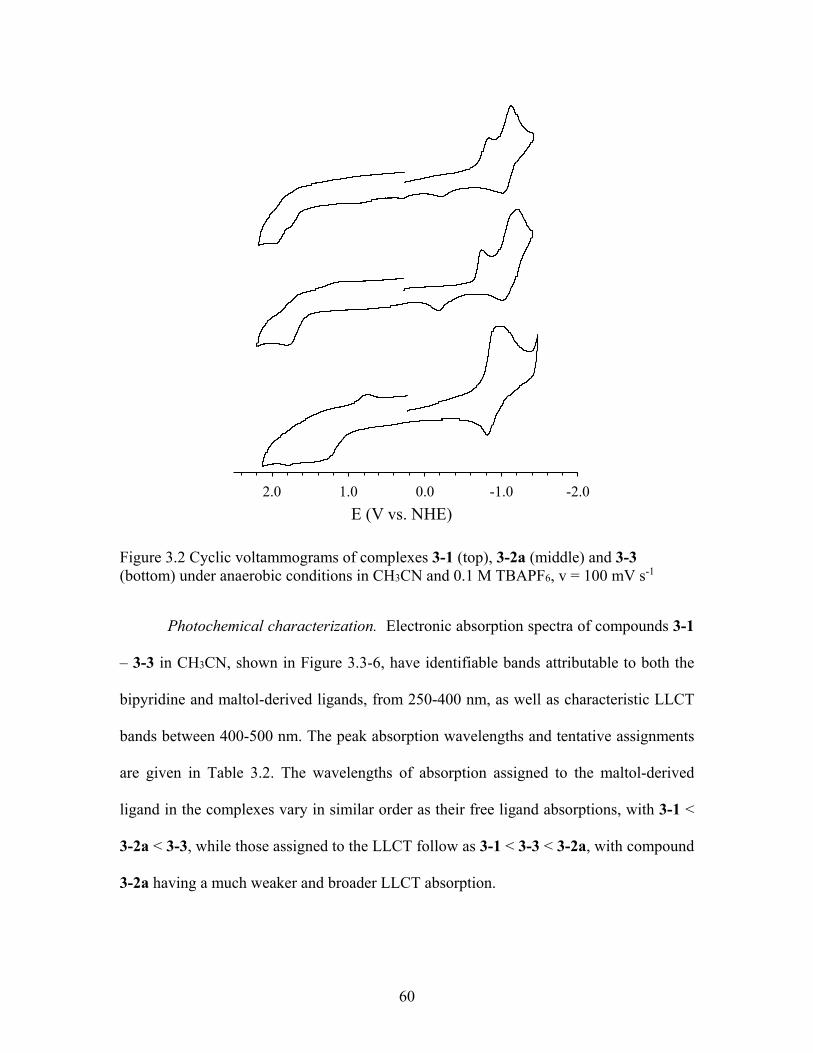
Figure 3.15 Room temperature visible excitation/emission (–/– –) and near IR emission (– –) of 3-2b in DMM
Figure 3.16 Room temperature excitation/emission (–/– –) spectra of 3-3, 440 nm/630 nm at 2.6×10⁻⁴ M in DMM
Figure 3.17 Room temperature lifetime of 3-3 (–-) & fit (---) in DMM
350 650 950 1250
Arb
itrar
y U
nits
(A
U)
Wavelength (nm)
350 450 550 650 750
Arb
itra
y U
nits
(A
U)
Wavelenth (nm)
100 120 140 160 180 200
Arb
itra
y U
nits
(A
U)
Time (µs)

67
Figure 3.18 Low temperature (77K) excitation/emission (– –/ –) spectra of 3-3, 435 nm/600 nm at 2.6×10⁻⁴ M in DMM
Figure 3.19 Low temperature (77K) lifetime of 3-3 (–-) & fit (---) in DMM
Table 3.3 Excitation and emission peak wavelengths, lifetimes (τ) at 298 K and 77 K, and quantum yield (φF) for complexes 3-1, 3-2a and 3-3
The room temperature fluorescence quantum yields for each complex were
measured by comparing the emission spectra to [Ru(bpy)3]2+ with a known fluorescence
350 450 550 650
Arb
itra
y U
nits
(A
U)
Wavelenth (nm)
90 190 290 390
Arb
itra
y U
nits
(A
U)
Time (µs)
# Ex.
(nm) Em. (nm)
τ (µs) 298 K
φFa
τ (μs) 77 K
3-1 430 630 1.7 0.021 44 3-2 460 690 2.7 0.068 46 3-3 450 640 0.76 0.050 44
68
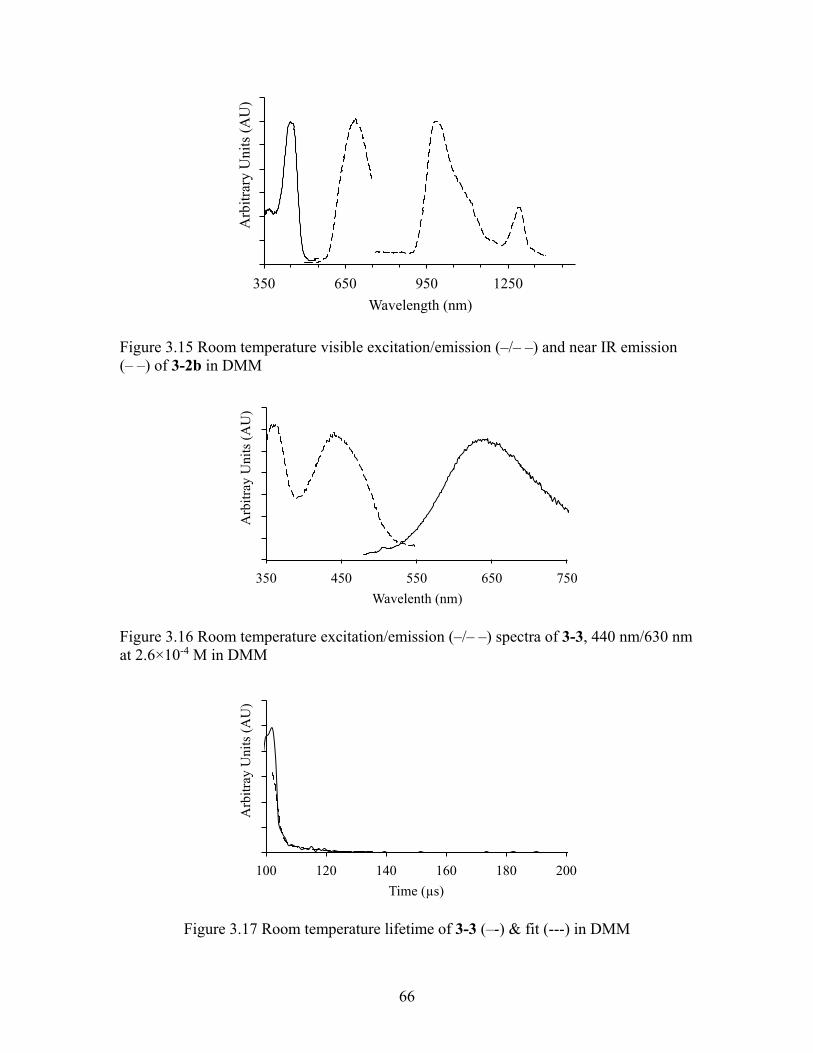
quantum yield (φF = 8 %) and are reported as derived from Eq. 3.3 as relative quantum
yield (F), where A is the absorbance at excitation, F is the area under the emission
curve, and n is the refractive index of the solvents used. Subscripts s and x refer to the
standard and unknown.
Quenching of luminescence. Initial emission studies of complexes 3-1 – 3-3
displayed wide variability in lifetimes and intensities. For instance, emissions were
dramatically reduced by exposure to air. Samples capped with standard plastic, silicon-
lined lids for fluorescence cells also exhibited variable emission intensities. Reproducible
data were obtained by using samples contained in high-throughput quartz tubes prepared
in a glovebox, capped with PTFE lids, and then sealed with wax.
Systematic quenching studies were first undertaken using methylviologen
([MV]2+). Plots of the relative emission intensity (I0/IQ) as a function of methylviologen
concentration [MV]2+, obtained the Stern-Volmer constant, Ksv, calculated from Eq. 3.2
and reported in Table 3.4. Luminescence intensity ratios increased linearly with
increasing [MV2+] with 3-3 having the largest Ksv, at 2.2 x 10⁻⁵ M-1•s-1.
Table 3.4 Stern-Volmer constants (Ksv) calculated for quenching of complex 3-1 – 3-3 luminescence by [MV]2+
# Ksv (105 M-1s-1) 3-1 1.2 3-2 1.9 3-3 2.2

69
Figure 3.20 Quenching of 3-1, 3-2a, and 3-3 luminescence by methyl viologen
⁄ 1 3.2
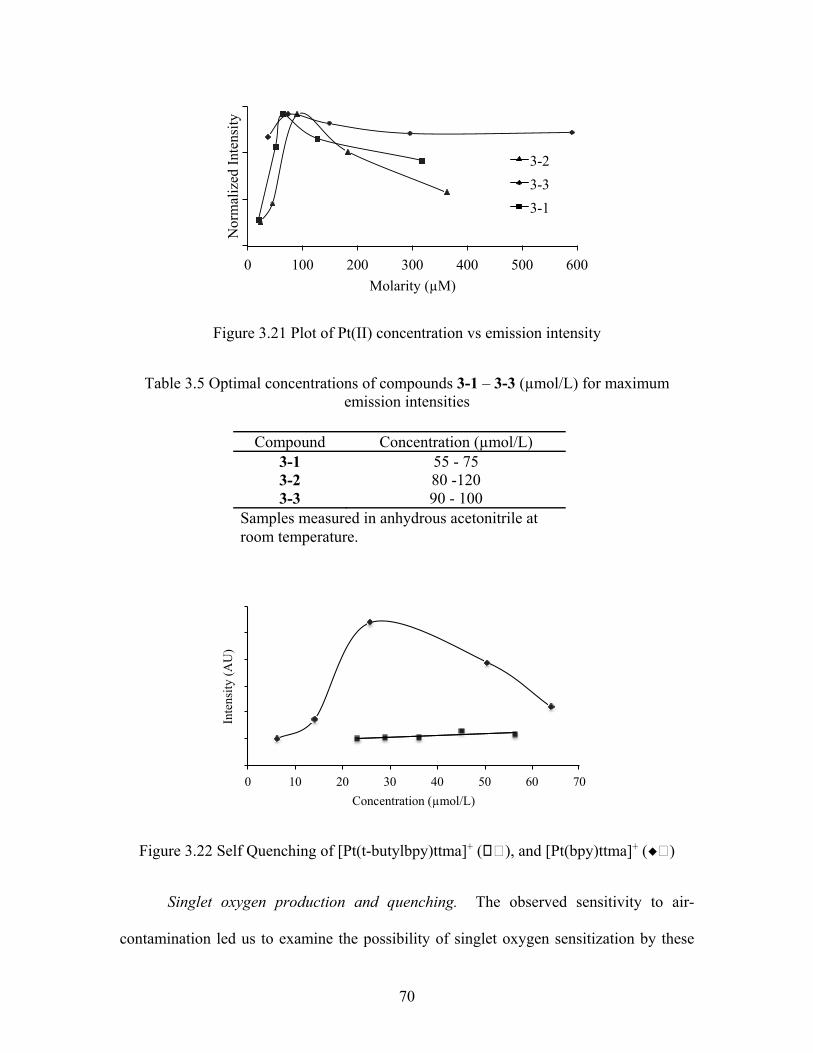
Self-quenching was also investigated using plots of concentration (mol/L) vs.
emission intensity (AU). All three complexes show self-quenching above ca. 90 uM
(Figure 3.21). For this reason, lower complex concentrations were used for all data
reported.
70
Figure 3.21 Plot of Pt(II) concentration vs emission intensity
Table 3.5 Optimal concentrations of compounds 3-1 – 3-3 (µmol/L) for maximum emission intensities
Figure 3.22 Self Quenching of [Pt(t-butylbpy)ttma]+ ( ), and [Pt(bpy)ttma]+ (◆ )
Singlet oxygen production and quenching. The observed sensitivity to air-
contamination led us to examine the possibility of singlet oxygen sensitization by these
0 100 200 300 400 500 600
Nor
mal
ized
Int
ensi
ty
Molarity (µM)
3-2
3-3
3-1
0 10 20 30 40 50 60 70
Inte
nsit
y (A
U)
Concentration (µmol/L)
Compound Concentration (µmol/L) 3-1 55 - 75 3-2 80 -120 3-3 90 - 100
Samples measured in anhydrous acetonitrile at room temperature.

71
complexes. Singlet oxygen quantum yields were measured by monitoring the
characteristic 1O2 emission in the near IR (1270 nm region) and comparison of the
emission signal with perinaphthenone as a reference compound with a known singlet
oxygen quantum yield ( of 1.0. The 1O2 quantum yields vary significantly, from
almost unity for complex 3-2a to just 0.18 for 3-3, Table 3.6.
The ability of these compounds to quench 1O2 was determined by using
Methylene Blue as external sensitizer. All were moderate to strong quenchers of singlet
oxygen. Total rates of singlet oxygen removal (kT) were obtained by time-resolved near
IR luminescence quenching experiments; kT represents the sum of both physical and
chemical quenching of singlet oxygen removal by complexes. The results are
summarized in Table 3.6, and typical Stern-Volmer plots are shown in below. The
dithiomaltol complex 3-2a was both the best sensitizer and slowest quencher of 1O2.
Figure 3.23 Plots of singlet oxygen luminescence quenching constants (Kobs) vs. concentration of complexes 3-1 – 3-3

72
Table 3.6 Quantum yields for singlet oxygen generation () and rate constants for singlet oxygen quenching (kT) by compounds 3-1 – 3-3
Accurate lifetimes reported in Table 3.3 were attained from purified samples in
airtight cuvettes while minimizing emission-quenching contaminants. Emission spectra
were recorded in DMM glass (DMF/CH2Cl2/CH3OH, 1:1:1 by volume) showing a tenfold
increase in the lifetime magnitude. Fluorescence quantum yields for each complex were
measured by comparing the emission spectra to Ru(bpy)32+ with a known fluorescence
quantum yield (F = 8%) and are reported in Table 3.3 from Eq. 3.3 as relative quantum
yield (F where A is the absorbance at excitation, F is the area under the emission
curve and n is the refractive index of the solvents used. Subscripts s and x refer to the
standard and unknown.
Φ ⁄ ⁄ ⁄ Φ 3.3
Studies with (2,2’-bipyridine)platinum(II) and Oxygen Chelates (O,O)
Synthesis and characterization of 3-4 - 3-6. The ligand 1-phenyl-2-methyl-3-
hydroxy-4-pyridinone was synthesized from methods in literature.35,36 Ligand
coordination with platinum was adapted and modified from previous methods and
methods within this work, drastic changes in color were observed.4 Column
kT (M-1 s-1)
1 0.53 ± 0.04 1.1 ± 0.1 107 2 0.95 ± 0.05 2.5 ± 0.2 106 3 0.18 ± 0.02 1.8 ± 0.1 107

73
chromatography gave optimal separation. The resulting complexes are very sensitive to
light and oxygen in solution, as observed by the metallic coating left on the glassware.
These platinum materials (3-4 – 3-6) are not air stable like complexes 3-1 – 3-3 in their
solid form. The same precautions as in experiments of complexes 3-1 – 3-3 were taken
regarding samples fluorescence intensity.
Aromaticity. As before, the aromaticity was measured using Eq. 3.1. The
averaged chemical shifts giving the trend 3-4 > 3-5 > 3-6, where δ (ppm) = 7.67, 6.91 and
6.84 respectively, Figure 3.24. Experiments with 5 show reproducible results of sample
degradation in solution by NMR spectra. Time lapsed NMR experiments were not
compiled. In each sample, a percentage of product was observed with significantly large
amounts of material resembling platinum coordinated to bipyridine.
Figure 3.24 1H NMR spectra (CD3CN) of 3-4 (bottom), 3-5 (middle) and 3-6 (top) from 9.5 ppm – 6.0 ppm
74
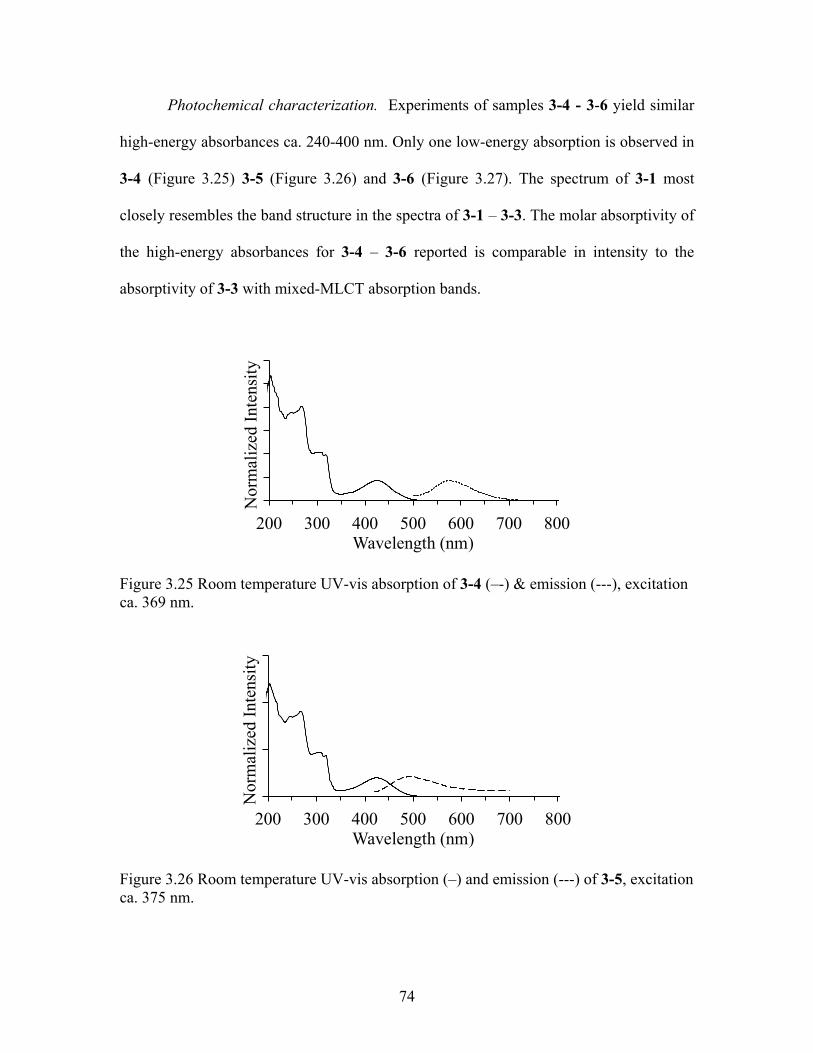
Photochemical characterization. Experiments of samples 3-4 - 3-6 yield similar
high-energy absorbances ca. 240-400 nm. Only one low-energy absorption is observed in
3-4 (Figure 3.25) 3-5 (Figure 3.26) and 3-6 (Figure 3.27). The spectrum of 3-1 most
closely resembles the band structure in the spectra of 3-1 – 3-3. The molar absorptivity of
the high-energy absorbances for 3-4 – 3-6 reported is comparable in intensity to the
absorptivity of 3-3 with mixed-MLCT absorption bands.
Figure 3.25 Room temperature UV-vis absorption of 3-4 (–-) & emission (---), excitation ca. 369 nm.
Figure 3.26 Room temperature UV-vis absorption (–) and emission (---) of 3-5, excitation ca. 375 nm.
200 300 400 500 600 700 800
Nor
mal
ized
Int
ensi
ty
Wavelength (nm)
200 300 400 500 600 700 800
Nor
mal
ized
Int
ensi
ty
Wavelength (nm)

75
Figure 3.27 Room temperature UV-vis absorption of 3-6 (–-) & emission (---), excitation ca. 450 nm.
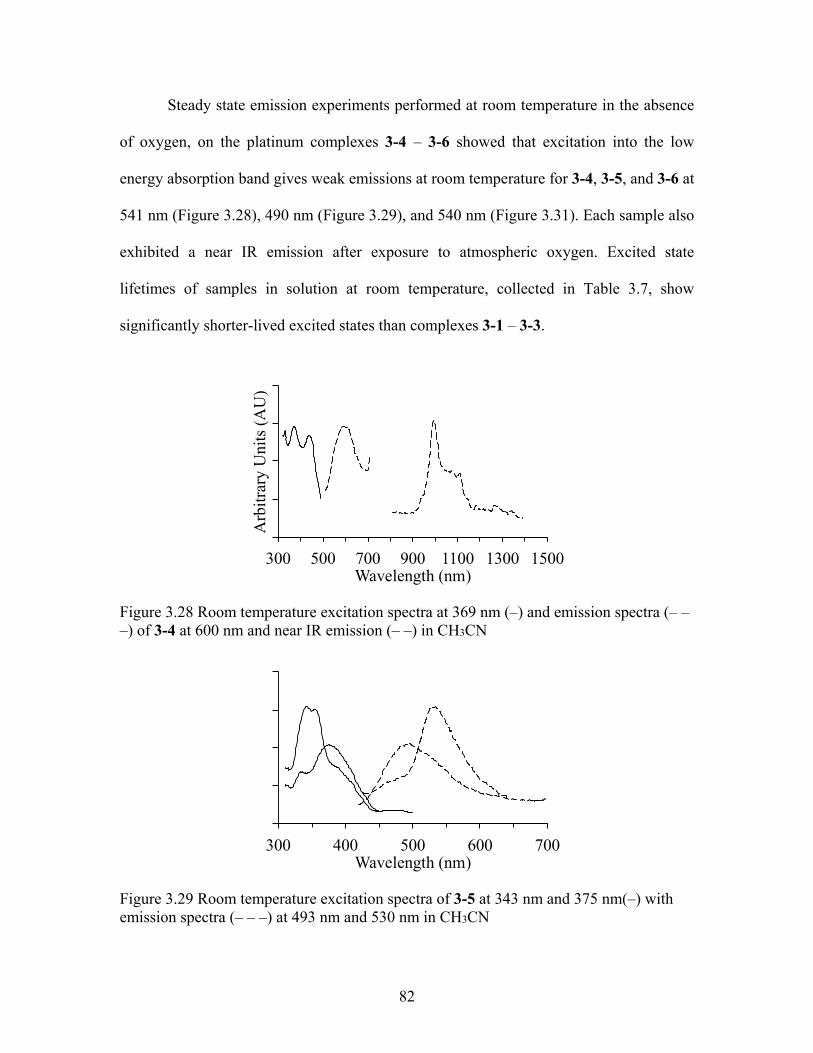
Steady state emission experiments performed at room temperature in the absence
of oxygen, on the platinum complexes 3-4 – 3-6 showed that excitation into the low
energy absorption band gives weak emissions at room temperature for 3-4, 3-5, and 3-6 at
541 nm (Figure 3.28), 490 nm (Figure 3.29), and 540 nm (Figure 3.31). Each sample also
exhibited a near IR emission after exposure to atmospheric oxygen. Excited state
lifetimes of samples in solution at room temperature, collected in Table 3.7, show
significantly shorter-lived excited states than complexes 3-1 – 3-3.
Figure 3.28 Room temperature excitation spectra at 369 nm (–) and emission spectra (– – –) of 3-4 at 600 nm and near IR emission (– –) in CH3CN
200 300 400 500 600 700 800 N
orm
aliz
ed I
nten
sity
Wavelength (nm)
300 500 700 900 1100 1300 1500
Arb
itra
ry U
nits
(A
U)
Wavelength (nm)

76
Figure 3.29 Room temperature excitation spectra of 3-5 at 343 nm and 375 nm(–) with emission spectra (– – –) at 493 nm and 530 nm in CH3CN
Figure 3.30. Near IR excitation, ca. 425 nm, and emission, ca. 980 nm, spectra of 3-5 in CH3CN at room temperature.
Figure 3.31 Room temperature excitation/emission (–/– –) spectra of 3-6, 450 nm/630 nm and near IR emission spectra in CH3CN at room temperature.
300 400 500 600 700 Wavelength (nm)
300 500 700 900 1100 1300 1500
Arb
itra
ry U
nits
(A
U)
Wavelength (nm)
300 500 700 900 1100 1300 1500
Arb
itra
ry U
nits
(A
U)
Wavelength (nm)

77
Table 3.7. Summary of photochemical data for complexes 4-6
Discussion
Analysis of (2,2’-Bipyridine)Platinum(II) and Thiolated Chelates (O,S)
Photophysical and photochemical behaviors. In this work, thione-substituted
maltol derivatives are used as electron donors in the classic Eisenberg motif of
PtII(bpy)Ln complexes. These Pt(II) complexes exhibit long-lived emissions from unusual
ligand-to-ligand charge transfer absorptions. The previously reported room temperature
emission lifetimes of such PtII(bpy)Ln complexes range from 1 ns to 1 µs for the
dithiolate adducts and 300 to 700 ns for the diacetylide complexes.6,10,27 Analogous
lifetimes of compounds 3-1 – 3-3 at both room temperature and 77 K are significantly
longer than both the PtII(bpy)Ln complexes and Pt(II) complexes 3-4 – 3-6 with 1 having
the longest at 2.7 µs at room temperature and an absolute quantum yield of ca. 7%.
The use of maltol-derived donors in the Eisenberg motif was suggested by
unusual oxidation chemistry described in previous work.20,29 For instance, the outersphere
oxidation of [Ru(bpy)2(ttma)]+ engenders C-H oxidation at the pendant methyl rather
than S-based oxidation at the thione or ring sulfide, Scheme 3.3.14,20,29 As previously
noted, the C-H oxidation products are also obtained by photo-induced electron transfer in
# Abs. (nm) (M1•cm-1) Em. (nm) τ (µs) 298 K
3-4 397 941 600 980
0.317
3-5 423 4770 493 540 980
0.676
3-5 422 232 493 540 980
0.477

78
flash quench experiments.20 Such pendant methyl oxidation resembles benzylic C-H
activations in aromatic systems, and suggested an aromaticity in the metal-bound
dithiomaltol ligand. The Zn(ttma)2 complex was also shown to engender photo-
reductions from a long-lived emission in the near IR.20 The calculated aromaticity of the
related thiopyriliums, an oxidized tautomeric form of the ligand shown in Scheme 3.3, is
second only to that of benzene.32–34
Scheme 3.3 Proposed thio-pyrillium intermediate in C-H activation mechanism
We suggest that LLCT may engender similar aromaticity in the heterosubstituted-
maltolato ligands of compounds 3-1 – 3-6. For these Pt(bpy)(electron-donor) complexes,
the apparent aromaticity of the donor ligands correlates with several photophysical
properties observed: the molar absorptivity of low energy LLCT absorptions and the
Stokes shift and quantum yields of the long-lived emissions.
The long-lived emissive states of compounds 3-1 – 3-3 also facilitate energy
transfer, e.g., the luminescence quenching demonstrated by [MV]2+ and O2. Indeed,
compound 3-2a shows a remarkable ability to generate singlet-oxygen and of the three
SO
S
(bpy)2Ru+2 SO
S
(bpy)2Ru+2
O
OxidantNaOH(aq)
S+O
S
(bpy)2Ru+3

79
compounds it has the lowest rate of singlet-oxygen quenching, an order of magnitude
lower than 3-1 and 3-3.
With each material, the collisional rate constants (Ksv) are of the same order of
magnitude, 105 M-1s-1 due to the negligible changes in overall size and shape. However
the largest Ksv is reported for 3-2b with the terbutyl- functional groups added to the
bipyridine, increasing the rate by altering the occurrence of collisional quenching. Studies
on the formation and quenching rate of singlet-oxygen show 3-2a to have the highest
return on formation (95%) of singlet-oxygen indicating use, or applications for singlet-
oxygen sensing. The lowest quenching rate constant is observed for 3-2a by an order of
magnitude compared to 3-1 and 3-3. It is likely that quenching rate studies with
methylviologen and singlet-oxygen are less dependent on the aromaticity of the donor-
ligands and more on the ability of the hetero-atom in the ring to donate electrons or the
collisional frequency due to size.
Aromaticity. As before, the aromaticity was measured using Eq. 3.1. The
averaged chemical shifts giving the trend 3-4 > 3-5 > 3-6, where δ (ppm) = 7.67, 6.91 and
6.84 respectively, Figure 3.24. Experiments with 5 show reproducible results of sample
degradation in solution by NMR spectra. Time lapsed NMR experiments were not
compiled. In each sample, a percentage of product was observed with significantly large
amounts of material resembling platinum coordinated to bipyridine.

80
Figure 3.24 1H NMR spectra (CD3CN) of 3-4 (bottom), 3-5 (middle) and 3-6 (top) from 9.5 ppm – 6.0 ppm
Photochemical characterization. Experiments of samples 3-4 - 3-6 yield similar
high-energy absorbances ca. 240-400 nm. Only one low-energy absorption is observed in
3-4 (Figure 3.25) 3-5 (Figure 3.26) and 3-6 (Figure 3.27). The spectrum of 3-1 most
closely resembles the band structure in the spectra of 3-1 – 3-3. The molar absorptivity of
the high-energy absorbances for 3-4 – 3-6 reported is comparable in intensity to the
absorptivity of 3-3 with mixed-MLCT absorption bands.

81
Figure 3.25 Room temperature UV-vis absorption of 3-4 (–-) & emission (---), excitation ca. 369 nm.
Figure 3.26 Room temperature UV-vis absorption (–) and emission (---) of 3-5, excitation ca. 375 nm.
Figure 3.27 Room temperature UV-vis absorption of 3-6 (–-) & emission (---), excitation ca. 450 nm.
200 300 400 500 600 700 800 N
orm
aliz
ed I
nten
sity
Wavelength (nm)
200 300 400 500 600 700 800
Nor
mal
ized
Int
ensi
ty
Wavelength (nm)
200 300 400 500 600 700 800
Nor
mal
ized
Int
ensi
ty
Wavelength (nm)
82
Steady state emission experiments performed at room temperature in the absence
of oxygen, on the platinum complexes 3-4 – 3-6 showed that excitation into the low
energy absorption band gives weak emissions at room temperature for 3-4, 3-5, and 3-6 at
541 nm (Figure 3.28), 490 nm (Figure 3.29), and 540 nm (Figure 3.31). Each sample also
exhibited a near IR emission after exposure to atmospheric oxygen. Excited state
lifetimes of samples in solution at room temperature, collected in Table 3.7, show
significantly shorter-lived excited states than complexes 3-1 – 3-3.
Figure 3.28 Room temperature excitation spectra at 369 nm (–) and emission spectra (– – –) of 3-4 at 600 nm and near IR emission (– –) in CH3CN
Figure 3.29 Room temperature excitation spectra of 3-5 at 343 nm and 375 nm(–) with emission spectra (– – –) at 493 nm and 530 nm in CH3CN
300 500 700 900 1100 1300 1500
Arb
itra
ry U
nits
(A
U)
Wavelength (nm)
300 400 500 600 700 Wavelength (nm)

83
Figure 3.30. Near IR excitation, ca. 425 nm, and emission, ca. 980 nm, spectra of 3-5 in CH3CN at room temperature.
Figure 3.31 Room temperature excitation/emission (–/– –) spectra of 3-6, 450 nm/630 nm and near IR emission spectra in CH3CN at room temperature.
Table 3.7. Summary of photochemical data for complexes 4-6
300 500 700 900 1100 1300 1500 A
rbit
rary
Uni
ts (
AU
)
Wavelength (nm)
300 500 700 900 1100 1300 1500
Arb
itra
ry U
nits
(A
U)
Wavelength (nm)
# Abs. (nm) (M1•cm-1) Em. (nm) τ (µs) 298 K
3-4 397 941 600 980
0.317
3-5 423 4770 493 540 980
0.676
3-5 422 232 493 540 980
0.477

84
Analysis of (2,2’Bipyridine)Platinum(II) and Oxygen Chelates (O,O)
Here, the maltol, HOPO, and Hppp ligands are used to generate new O,O chelates
in the Eisenberg motif. These Pt(II) complexes exhibit shorter-lived emissions than the
O,S analogues but are comparable to the emissive square planar platinum complexes
previously reported.6,10,27 The apparent aromaticity of the donor ligands still correlates
with several photophysical properties: weaker or lesser intensities in the molar
absorptivity, Stokes shift and the emission lifetimes, as pyrones and pyridinones are still
quite aromatic.37–39
Conclusions
This work represents the first application of sulfur-oxygen and oxygen-oxygen
chelate donor ligands to study of Eisenberg’s square planar PtII(bpy)Ln. These bidentate
chelates derived from hetero-atom substitution of maltol demonstrate unusual
photochemistry. In application with the O,S chelates, the Pt(II) complexes provide the
longest lived luminescence yet reported for this ligand-to-ligand-charge-transfer (LLCT)
motif. It is also shown that the aromaticity of the heteroaromatic ligands correlate with
the observed photochemical lifetimes and quantum yields. As a result of the
luminescence lifetimes of these compounds, they demonstrate unusual activity as 1O2
sensitizers.

85
REFERENCES
(1) Hoertz, P. G.; Staniszewski, A.; Marton, A.; Higgins, G. T.; Incarvito, C. D.; Rheingold, A. L.; Meyer, G. J. J. Am. Chem. Soc. 2006, 128, 8234–8245.
(2) Zuleta, J. A.; Bevilacqua, J. M.; Proserpio, D. M.; Harvey, P. D.; Eisenberg, R. Inorg. Chem. 1992, 31, 2396–2404.
(3) Zuleta, J. A.; Bevilacqua, J. M.; Rehm, J. M.; Eisenberg, R. Inorg. Chem. 1992, 31, 1332–1337.
(4) Carland, M.; Tan, K. J.; White, J. M.; Stephenson, J.; Murray, V.; Denny, W. A.; McFadyen, W. D. J. Inorg. Biochem. 2005, 99, 1738–1743.
(5) Cummings, S. D.; Eisenberg, R. Inorg. Chem. 1995, 34, 3396–3403.
(6) Cummings, S. D.; Eisenberg, R. J. Am. Chem. Soc. 1996, 118, 1949–1960.
(7) McGarrah, J. E.; Kim, Y.-J.; Hissler, M.; Eisenberg, R. Inorg. Chem. 2001, 40, 4510–4511.
(8) Kato, M. Bull. Chem. Soc. Jpn. 2007, 80, 287–294.
(9) Chakraborty, S.; Wadas, T. J.; Hester, H.; Schmehl, R.; Eisenberg, R. Inorg. Chem. 2005, 44, 6865–6878.
(10) Hissler, M.; McGarrah, J. E.; Connick, W. B.; Geiger, D. K.; Cummings, S. D.; Eisenberg, R. Coord. Chem. Rev. 2000, 208, 115–137.
(11) Bevilacqua, J. M.; Eisenberg, R. Inorg. Chem. 1994, 33, 2913–2923.
(12) Zuleta, J. A.; Bevilacqua, J. M.; Proserpio, D. M.; Harvey, P. D.; Eisenberg, R. Inorg. Chem. 1992, 31, 2396–2404.
(13) Zhang, Y.; Ley, K. D.; Schanze, K. S. Inorg. Chem. 1996, 35, 7102–7110.
(14) Connick, W. B.; Gray, H. B. J. Am. Chem. Soc. 1997, 119, 11620–11627.
(15) Zhang, D.; Bin, Y.; Tallorin, L.; Tse, F.; Hernandez, B.; Mathias, E. V.; Stewart, T.; Bau, R.; Selke, M. Inorg. Chem. 2013, 52, 1676–1678.
(16) Lewis, J. A.; Puerta, D. T.; Cohen, S. M. Inorg. Chem. 2003, 42, 7455–7459.
(17) Monga, V.; Patrick, B. O.; Orvig, C. Inorg. Chem. 2005, 44, 2666–2677.

86
(18) Brayton, D.; Jacobsen, F. E.; Cohen, S. M.; Farmer, P. J. Chem. Commun. 2006, 206.
(19) Schlesinger, S. R.; Bruner, B.; Farmer, P. J.; Kim, S.-K. J. Enzyme Inhib. Med. Chem. 2013, 28, 137–142.
(20) Bruner, B.; Walker, M. B.; Ghimire, M. M.; Zhang, D.; Selke, M.; Klausmeyer, K.; Omary, M.; Farmer, P. J. Dalton Trans. 2014, 43, 11548-11556.
(21) Rendina, L. M.; Vittal, J. J.; Puddephatt, R. J. Organometallics 1995, 14, 1030–1038.
(22) Fery-Forgues, S.; Lavabre, D. J. Chem. Educ. 1999, 76, 1260.
(23) Portenkirchner, E.; Oppelt, K.; Ulbricht, C.; Egbe, D. A. M.; Neugebauer, H.; Knör, G.; Sariciftci, N. S. J. Organomet. Chem. 2012, 716, 19–25.
(24) Brayton, D.; Jacobsen, F. E.; Cohen, S. M.; Farmer, P. J. Chem. Commun. 2006, 206.
(25) Lewis, J. A.; Tran, B. L.; Puerta, D. T.; Rumberger, E. M.; Hendrickson, D. N.; Cohen, S. M. Dalton Trans. 2005, 2588.
(26) Chaves, S.; Jelic, R.; Mendonça, C.; Carrasco, M.; Yoshikawa, Y.; Sakurai, H.; Santos, M. A. Metallomics 2010, 2, 220–227.
(27) Zuleta, J. A.; Chesta, C. A.; Eisenberg, R. J. Am. Chem. Soc. 1989, 111, 8916–8917.
(28) Zuleta, J. A.; Bevilacqua, J. M.; Rehm, J. M.; Eisenberg, R. Inorg. Chem. 1992, 31, 1332–1337.
(29) Backlund, M.; Ziller, J.; Farmer, P. J. Inorg. Chem. 2008, 47, 2864–2870.
(30) Jon, J.; Derbyshire, W.; Gutowsky, H. S. J. Phys. Chem. 1965, 69, 1–5.
(31) Geary, E. A. M.; Yellowlees, L. J.; Jack, L. A.; Oswald, I. D. H.; Parsons, S.; Hirata, N.; Durrant, J. R.; Robertson, N. Inorg. Chem. 2005, 44, 242–250.
(32) Smitherman, H. C.; Ferguson, L. N. Tetrahedron 1968, 24, 923–932.
(33) Jonas, J.; Derbyshire, W.; Gutowsky, H. S. J. Phys. Chem. 1965, 69, 1–5.
(34) Saieswari, A.; Deva Priyakumar, U.; Narahari Sastry, G. J. Mol. Struct. THEOCHEM 2003, 663, 145–148.
(35) Harris, R. L. N. Aust. J. Chem. 1976, 29, 1329–1334.
(36) Zhang, Z.; Rettig, S. J.; Orvig, C. Inorg. Chem. 1991, 30, 509–515.

87
(37) Schleyer, P. von R. Chem. Rev. 2001, 101, 1115–1118.
(38) Zborowski, K.; Grybos, R.; Proniewicz, L. M. J. Phys. Org. Chem. 2005, 18, 250–254.
(39) Pozharskii, A. F. Chem. Heterocycl. Compd. 1985, 21, 717–749.


![Excited-State Diproton Transfer in [2, 2′-Bipyridyl]-3, 3′-diol: the Mechanism Is Sequential, Not Concerted](https://static.fdokumen.com/doc/165x107/6332daff5f7e75f94e094ac2/excited-state-diproton-transfer-in-2-2-bipyridyl-3-3-diol-the-mechanism.jpg)