Synovial VLA1+ T cells display an oligoclonal and partly distinct repertoire in rheumatoid and...
10
Synovial VLA-1+ Tcells display an oligoclonal and partly distinct repertoire in rheumatoid and psoriatic arthritis Itamar Goldstein a, ⁎ ,1 , Amos J. Simon a,1 , Shomron Ben Horin d , Sarit Matzri b , Alexander Koltakov b , Pnina Langevitz c , Gideon Rechavi a , Ninette Amariglio a , Ilan Bank b,c a Cancer Research Center and Institute of Hematology, The Chaim Sheba Medical Center and Tel Aviv University, Israel b Laboratory for Immunoregulation, The Chaim Sheba Medical Center and Tel Aviv University, Israel c Department of Medicine F and Rheumatology Unit, The Chaim Sheba Medical Center and Tel Aviv University, Israel d Department of Gastroenterology, The Chaim Sheba Medical Center and Tel Aviv University, Israel Received 1 November 2007; accepted with revision 21 February 2008 Available online 5 May 2008 Abstract VLA-1 integrin expressing T cells are more frequent in inflammatory synovial fluids (SF) compared to peripheral blood. Recent studies suggest that VLA-1 expression mainly marks IFNγ+ Tcells while excluding both IL-4+ and regulatory FoxP3+ Tcells. To further characterize the TCR repertoire of the potentially pathogenic VLA-1+ IFNγ+ T cells, isolated from SF of adult patients with rheumatoid and psoriatic arthritis, we determined the complementarity determining region (CDR)3 spectratypes. Here we show in a cohort of 9 patients that VLA-1+ Tcells display a perturbed repertoire that, moreover, differs from that of VLA-1- synovial T cells and even VLA-1+ PB T cells. Importantly, random sequencing of the CDR3 region of the TCR variable β (BV) 6.1 gene of both VLA-1+ and VLA-1- synovial T cells, in one patient, revealed that their sequences were by and large different (29 out of 33 clones). Thus, our results imply that VLA-1+ T cells that infiltrate into inflamed joints represent a partly distinct and highly oligoclonal population of Th1 cells, probably selected by unique antigens. © 2008 Elsevier Inc. All rights reserved. KEYWORDS Inflammatory arthritis; Very late activation antigen (VLA-1); Integrin; Effector and memory T cells; T cell receptor (TCR); CDR3 length diversity; TCR repertoire Introduction It is presumed that inflammatory arthritis, including rheuma- toid arthritis (RA) and psoriatic arthritis (PA) are caused by a breakdown in self-tolerance that leads to expansion of T cell clones specific for self-antigens found in the synovium [1–5]. Better identification and characterization of the pathogenic Tcell subsets involved in autoantigen recognition is critical in order to fully understand the immunopathogenic principles underlying these diseases. In this context, CD45RO+ Tcells that infiltrate human inflamed tissues, including: RA synovium, the lungs of sarcoidosis patients, and psoriatic lesion are highly enriched for T cells expressing the collagen receptor, α1β1 integrin, VLA-1 [6–11]. This integrin is induced on the surface of T cells several days after their activation, and enables their ⁎ Corresponding author. The Sheba Cancer Research Center and Rheumatology Unit, Chaim Sheba Medical Center, Tel Hashomer 52621, Israel. Fax: +972 3 5303506. E-mail addresses: [email protected] (I. Goldstein), [email protected] (I. Bank). 1 These authors contributed equally to this work. 1521-6616/$ – see front matter © 2008 Elsevier Inc. All rights reserved. doi:10.1016/j.clim.2008.02.014 available at www.sciencedirect.com www.elsevier.com/locate/yclim Clinical Immunology (2008) 128, 75–84
Transcript of Synovial VLA1+ T cells display an oligoclonal and partly distinct repertoire in rheumatoid and...

ava i l ab l e a t www.sc i enced i r ec t . com
www.e l sev i e r. com/ loca te /yc l im
Clinical Immunology (2008) 128, 75–84
Synovial VLA-1+ Tcells display an oligoclonal and partlydistinct repertoire in rheumatoid and psoriatic arthritisItamar Goldstein a,⁎,1, Amos J. Simon a,1, Shomron Ben Horin d, Sarit Matzri b,Alexander Koltakov b, Pnina Langevitz c, Gideon Rechavi a,Ninette Amariglio a, Ilan Bank b,c
a Cancer Research Center and Institute of Hematology, The Chaim Sheba Medical Center and Tel Aviv University, Israelb Laboratory for Immunoregulation, The Chaim Sheba Medical Center and Tel Aviv University, Israelc Department of Medicine F and Rheumatology Unit, The Chaim Sheba Medical Center and Tel Aviv University, Israeld Department of Gastroenterology, The Chaim Sheba Medical Center and Tel Aviv University, Israel
Received 1 November 2007; accepted with revision 21 February 2008Available online 5 May 2008
⁎ Corresponding author. The ShebaRheumatology Unit, Chaim Sheba Me52621, Israel. Fax: +972 3 5303506.
E-mail addresses: Itamar.Goldstein(I. Goldstein), [email protected] (I.1 These authors contributed equally
1521-6616/$ – see front matter © 200doi:10.1016/j.clim.2008.02.014
Abstract VLA-1 integrin expressing T cells are more frequent in inflammatory synovial fluids(SF) compared to peripheral blood. Recent studies suggest that VLA-1 expression mainly marksIFNγ+ Tcells while excluding both IL-4+ and regulatory FoxP3+ Tcells. To further characterize theTCR repertoire of the potentially pathogenic VLA-1+ IFNγ+ T cells, isolated from SF of adultpatients with rheumatoid and psoriatic arthritis, we determined the complementaritydetermining region (CDR)3 spectratypes. Here we show in a cohort of 9 patients that VLA-1+Tcells display a perturbed repertoire that, moreover, differs from that of VLA-1− synovial Tcellsand even VLA-1+ PB T cells. Importantly, random sequencing of the CDR3 region of the TCRvariable β (BV) 6.1 gene of both VLA-1+ and VLA-1− synovial Tcells, in one patient, revealed thattheir sequences were by and large different (29 out of 33 clones). Thus, our results imply thatVLA-1+ Tcells that infiltrate into inflamed joints represent a partly distinct and highly oligoclonalpopulation of Th1 cells, probably selected by unique antigens.© 2008 Elsevier Inc. All rights reserved.
KEYWORDSInflammatory arthritis;Very late activationantigen (VLA-1);Integrin;Effector and memoryT cells;T cell receptor (TCR);CDR3 length diversity;TCR repertoire
Introduction
It is presumed that inflammatory arthritis, including rheuma-toid arthritis (RA) and psoriatic arthritis (PA) are caused by a
Cancer Research Center anddical Center, Tel Hashomer
@sheba.health.gov.ilBank).to this work.
8 Elsevier Inc. All rights reserved
breakdown in self-tolerance that leads to expansion of T cellclones specific for self-antigens found in the synovium [1–5].Better identification and characterization of the pathogenicTcell subsets involved in autoantigen recognition is critical inorder to fully understand the immunopathogenic principlesunderlying these diseases. In this context, CD45RO+Tcells thatinfiltrate human inflamed tissues, including: RA synovium, thelungs of sarcoidosis patients, and psoriatic lesion are highlyenriched for T cells expressing the collagen receptor, α1β1integrin, VLA-1 [6–11]. This integrin is induced on the surfaceof Tcells several days after their activation, and enables their
.
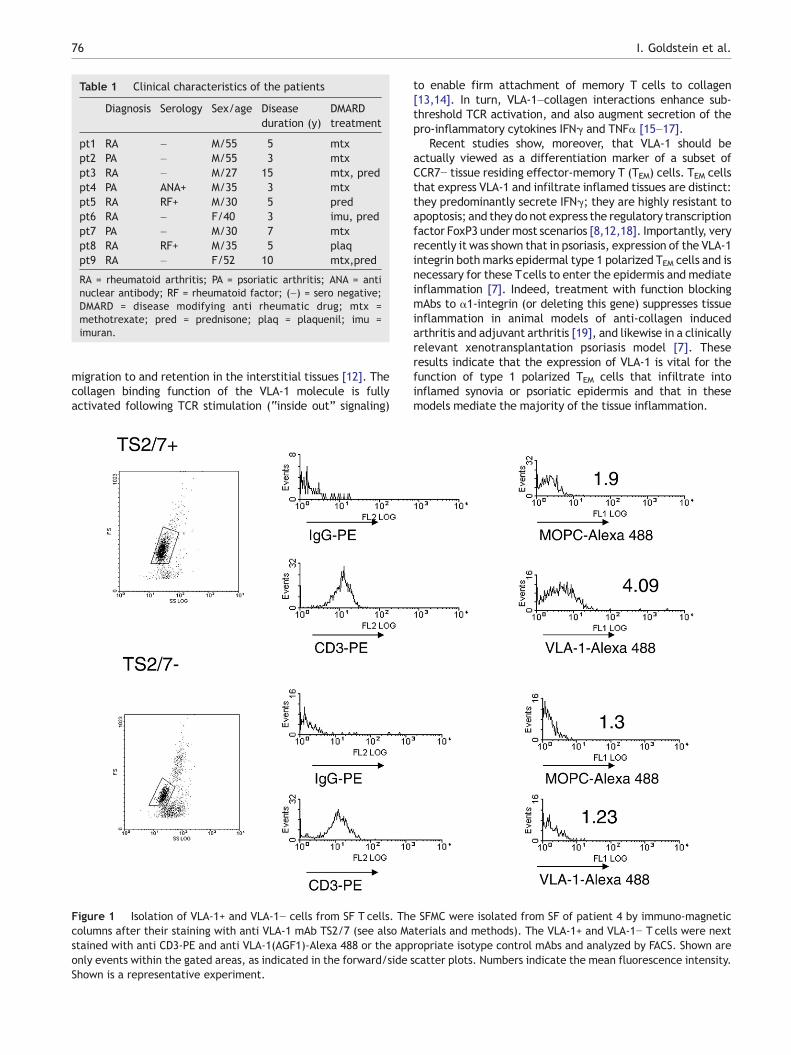
Table 1 Clinical characteristics of the patients
Diagnosis Serology Sex/age Diseaseduration (y)
DMARDtreatment
pt1 RA – M/55 5 mtxpt2 PA – M/55 3 mtxpt3 RA – M/27 15 mtx, predpt4 PA ANA+ M/35 3 mtxpt5 RA RF+ M/30 5 predpt6 RA – F/40 3 imu, predpt7 PA – M/30 7 mtxpt8 RA RF+ M/35 5 plaqpt9 RA – F/52 10 mtx,pred
RA = rheumatoid arthritis; PA = psoriatic arthritis; ANA = antinuclear antibody; RF = rheumatoid factor; (–) = sero negative;DMARD = disease modifying anti rheumatic drug; mtx =methotrexate; pred = prednisone; plaq = plaquenil; imu =imuran.
76 I. Goldstein et al.
migration to and retention in the interstitial tissues [12]. Thecollagen binding function of the VLA-1 molecule is fullyactivated following TCR stimulation (“inside out” signaling)
Figure 1 Isolation of VLA-1+ and VLA-1− cells from SF T cells. Thcolumns after their staining with anti VLA-1 mAb TS2/7 (see also Mastained with anti CD3-PE and anti VLA-1(AGF1)-Alexa 488 or the apponly events within the gated areas, as indicated in the forward/sideShown is a representative experiment.
to enable firm attachment of memory T cells to collagen[13,14]. In turn, VLA-1–collagen interactions enhance sub-threshold TCR activation, and also augment secretion of thepro-inflammatory cytokines IFNγ and TNFα [15–17].
Recent studies show, moreover, that VLA-1 should beactually viewed as a differentiation marker of a subset ofCCR7− tissue residing effector-memory T (TEM) cells. TEM cellsthat express VLA-1 and infiltrate inflamed tissues are distinct:they predominantly secrete IFNγ; they are highly resistant toapoptosis; and they do not express the regulatory transcriptionfactor FoxP3 undermost scenarios [8,12,18]. Importantly, veryrecently it was shown that in psoriasis, expression of the VLA-1integrin bothmarks epidermal type 1 polarized TEM cells and isnecessary for these Tcells to enter the epidermis and mediateinflammation [7]. Indeed, treatment with function blockingmAbs to α1-integrin (or deleting this gene) suppresses tissueinflammation in animal models of anti-collagen inducedarthritis and adjuvant arthritis [19], and likewise in a clinicallyrelevant xenotransplantation psoriasis model [7]. Theseresults indicate that the expression of VLA-1 is vital for thefunction of type 1 polarized TEM cells that infiltrate intoinflamed synovia or psoriatic epidermis and that in thesemodels mediate the majority of the tissue inflammation.
e SFMC were isolated from SF of patient 4 by immuno-magneticterials and methods). The VLA-1+ and VLA-1− T cells were nextropriate isotype control mAbs and analyzed by FACS. Shown arescatter plots. Numbers indicate the mean fluorescence intensity.

77TCR repertoire of synovial VLA-1+ T cells
In antigen naive or polyclonally activated T cells, thecomplementarity determining region (CDR)3 lengths of agiven TCR BV gene family are distributed in a Gaussianmanner [20]. In contrast, antigenic selection leads torelative enhancement or contraction of specific CDR3lengths, and accordingly the presence of dominant CDR3lengths indicates responses to specific antigens [2,21].Whether the VLA-1+ TEM cells represent a distinct pathogenicpopulation of clonally expanded T cells, continuouslyresponding to synovial autoantigens, is currently unknown.
The goal of the current study was to evaluate the TCRrepertoire of the VLA-1+ synovial T cells of patients with RAor PA, and thus to verify the distinctive nature of the VLA-1+population, as compare to SF VLA-1− T cells and peripheralblood Tcells of the same patients. This aim was accomplishedusing CDR3 spectratyping and random sequencing of selectedBV genes.
Materials and methods
Human subjects
The study was approved by the Institutional Ethics (Helsinki)Committee at the Chaim Sheba Medical Center and allpatients signed informed consent forms. PB (10–30 ml)samples were obtained from patients attending the Rheu-
Figure 2 CDR3 spectratype of BV4 and BV11 gene families withPatient's #1 SF T cells, which were obtained by Ficoll Hypaque densVLA-1-FITC mAbs. Cells were analyzed after gating on the viable MCisotype control mAbs stain (not shown). Numbers indicate the percenspectratypes of BV4 and BV11 gene families. The VLA-1+ and VLA-columns after staining with the anti VLA-1 mAb TS2/7. CDR3 specamplification of cDNA with BV4 and BV11 family specific fluorescein
matology clinic (Table 1). SF (10–50 ml) was drawn forclinical indications. Diagnoses were according to AmericanCollege of Rheumatology criteria for diagnosis of RA [22] andaccepted criteria for diagnosis of PA [23].
Monoclonal antibodies (mAbs) and FACS analysis
The mAb 1B3.1 (IgA) against the I-domain region of the α1integrin, and mAb TS2/7 (IgG1) against a non I-domain regionof the α1 integrin, were purified from supernatants of therespective hybridomas [24,25]. Indirect stainingwith anti VLA-1 mAb 1B3.1, or TEPC-15 as negative control, was performedusing secondary FITC-conjugated goat anti-mouse Ig (Sigma, StLouis, MO) [24,25]. The Alexa Fluor® 488 labeled mouse mAbAGF1.1 (IgG2a), directed against the I-domain of the α1integrin was provided by H. Gardner (Biogen Idec, Cambridge,MA). The PE-conjugated mouse mAb to human α1-integrin(SR84;CD49a)was purchased fromPharmingen (BDBioscience,San Jose, CA). The following fluorescent-conjugated mousemAbs directedagainst humanCD3 (FITCor PerCp), CD4 (FITC orAPC), CD25 (PE or APC), IFNγ (PE or APC), and theirappropriate isotype control fluorochrome-conjugated mAbswere all purchased from Pharmingen. The Alexa Fluor® 647conjugated mouse mAb anti-human IL-17A was obtained fromeBiosience (San Diego, CA). The cells were analyzed on aFACSCalibur™ using the Cellquest software™ (BD Biosciences)
in a representative SF. Left hand panel shows FACS analysis ofity centrifugation, and thereafter stained with anti-CD4-PE andpopulation, and quadrants were set according to the negativetage of cells in each quadrant. Right hand panel shows the CDR31− cells of the SF T cells were separated by immuno-magnetictratyping of the indicated gene families was performed afterated primers. CDR3 lengths are indicated under selected peaks.

Table 2 Summary of BV4 and BV11 CDR3 lengths ofprominent peaks, and oligoclonality within VLA-1+ andVLA-1− SF TC
Pt# BV4,VLA-1+
BV4,VLA-1−
BV11,VLA-1+
BV11,VLA-1−
NLP Sp NLP sp NLP sp NLP sp
pt1 181 O 184 P 199 O 205 Ppt2 184 O 187 O 202 O — –pt3 178 O 181 O — – 208 Opt4 184 O 184 P 202 O 202 Opt5 184 O 184 P 202 O 202 Opt6 — – 181 O ND NDpt7 187 O 184 O ND NDpt8 184 O 187 O 202 O 192 Opt9 184 O 187 O/P ND ND#OP 8/9 6/9 5/5 4/5#different NLP 6/9 4/6
Nucleotide length of the most prominent peaks (NLP) in the BV4and BV11 CDR3 spectratypes (sp) in all 9 pts studied areindicated. Instances in which sp exhibited a pattern clearlydistinct from the normal Gaussian distribution are designated O;polyclonal spectratypes [e.g. BV4 spectratype of VLA-1− SF TC ofpt1, Fig. 2] is indicated with P. —=no expression of a gene familydetected; ND=not done; #OP=ratio of oligoclonal spectratypesto number of spectratypes analyzed. # different NLP=thenumber of paired VLA-1+ and VLA-1− spectratypes that differ inNLP as proportion of number of spectratypes analyzed.
Table 3 Nucleotide length of the most prominent CDR3 ofmultiple BV families in the SF TC of patient 4
VLA-1+ VLA-1− VLA-1+ VLA-1−
Gene family NLP NLP NL2P NL2P
BV2 200 204 204 200BV5.1⁎ 251 254 260 257BV5.2.3⁎ 239 227 227 224BV6⁎ 294 294 291 291BV8⁎ 168 168 174 174BV13⁎ 169/175 172 172 169BV15⁎ 304 279 294 291BV20⁎ 191 191/194 188 191/194BV21⁎ 170/176 176 179 182BV23 150 156 156 152# 6/10 8/10
Nucleotide lengths of the most prominent (NLP) and the secondmost prominent (NL2P) peak within the indicated BV gene familyspectratypes of the VLA-1+ and VLA-1 SF TC of pt4. ⁎ indicatesspectratypes shown in Figure 3. Where 2 peaks are equivalent,both are indicated (e.g BV21 170/176). #: number/total of pairedVLA-1+ and VLA-1− spectratypes differing in NLP or NL2P.
78 I. Goldstein et al.
or the FlowJo 7.2.2 software (Tree Star, Ashland, OR). Theviable lymphocytes were identified by their forward scatterand side scatter characteristics.
Separation of T cells subsets
The lymphocytes from SF and peripheral blood were isolatedby density centrifugation on Histopaque 1077 (Sigma). TheVLA-1+ and VLA-1− cell populationswere isolated as previouslydescribed [26]. Briefly, the cells were first stained with TS2/7mAbs and the VLA-1+ fraction was positively selected by usingthe MACS® cell separation system as recommended by themanufacturer (Miltenyi Biotec, Germany). The VLA-1+ T cellfraction routinely contained N65% VLA-1+/hi Tcells as analyzedby flow cytometry immediately after separation, whereas theVLA-1− cell fraction contained b0.5% VLA-1+ cells (Fig. 1).
CDR3 spectratype analysis
Total RNA was extracted from purified Tcells subsets using anRNeasy Kit (Qiagen, Hilden, Germany). Complementary DNA(cDNA) was synthesized using a First-Strand cDNA Synthesis Kitwith an oligo-dT primer (Amersham Pharmacia Biotech,Uppsala, Sweden). Aliquots of cDNA were amplified usingfluorescently-labeled Vβ-specific primers and a non labeledCβprimer as previously described [27]. Sequences were amplifiedby PCR in a 20 μl reaction mixture containing 0.2 μM of eachprimer and 0.5 U of Taq polymerase (TaKaRa, Osaka, Japan) in10mM Tris–HCl (pH 8.3), 50mM KCl, 1.5mMMgCl2, and 0.2mMof each dNTP. The amplification conditions consisted of 40cycles of denaturation at 94 °C for 1min, annealing at 55 °C for1 min, and extension at 72 °C for 1.5 min followed by a single
extension at 72 °C for 15 min. Labeled PCR products weremixed with a size marker (GeneScan™-500 ROX, AppliedBiosystems). Size and fluorescence intensity of the productswere determined using an automated DNA sequencer (ABI 377,Perkin-Elmer Applied Biosystems, USA). Data were analyzedusing GeneScan software (Perkin-Elmer Applied Biosystems).
CDR3 sequencing
RNA was prepared using the ‘TRIZOL’ method, according tomanufacturer protocol (Invitrogen, USA). RNA concentrationwas determined by spectrophotometer (NanoDrop, USA). cDNAwas synthesized using random hexamer (Promega, UK) withSUPERSCRIPT™ II RNaseH-negative reverse transcriptase (GibcoBRL, UK). cDNAwas amplified by PCR, using specific primers forhuman Tcell receptor β chain Vβ6: 5′ AGCCTGGGGCAGGGCC-CAGAGTT 3′ and B constant: 5′ GTGTTTGAGCCATcellsAGAA 3′.The amplified ~280 base pair fragment was separated on 2%agarose gel, cut and purified using gel extraction kit (RBC,Taiwan), ligated into pGEM plasmid (Promega, USA) andtransformed into competent DH5a bacterial cells (Invitrogen,USA). Cells were plated onto X-GAL/IPTG/Amp selective platesfor blue/white selection. White colonies were picked, DNAplasmid prepared (Qiagen, USA) and DNA sequence for eachclone was performed using T7 and SP6 universal primers.Sequences were analyzed using ABI 3100 automatic sequencerand software (ABI, USA).
Results
CDR3 spectratypes of selected BV families in SFVLA-1+ and VLA-1− T cells are distinct and containsubset-specific oligoclonal expansions
To characterize the TCR repertoire of the VLA-1+ Tcells in SFin relation to that of VLA-1− T cells, the respective subsets

Figure 3 CDR3 spectratypes of BV families of VLA-1+ and VLA-1− SF T cells from patient4. The cDNA of the VLA-1+ and VLA-1− SFT cells of patient 4 was subjected to CDR3 spectratyping of the indicated BV families. Scales proportional to CDR3 nucleotide lengthand fluorescence signal strength, for each gene family, are indicated in the corresponding spectratypes. CDR3 lengths are indicatedunder selected peaks.
79TCR repertoire of synovial VLA-1+ T cells
were isolated from SF of 6 patients with RA and 3 with PA(Table 1). Initially, CDR3 spectratypes of BV4 and BV11 genefamilies were analyzed. As seen in the representativeexample in Figure 2, the BV4 spectratype of the VLA-1+subset of patient #1 displayed a prominent 181 nucleotidelength peak accompanied by smaller flanking peaks of 184–196 nucleotides whereas the SF VLA-1− T cells subsetdisplayed a more heterogeneous distribution. Similarly, theVLA-1+ BV11 gene family spectratype contained a singlemajor CDR3 peak whereas a more polyclonal distribution wasfound in the VLA-1− T cells subset spectratype. Relevantfeatures of similar analyses of BV4 and BV11 gene familyCDR3 spectratypes of all the 9 patients studied aresummarized here and in Table 2 (see also Figs. 2 and 6;depicting representative spectratypes from patients 1, 8 and9 respectively). As revealed, 8/9 and 6/9 VLA-1+ and VLA-1−BV4 spectratypes respectively, and 5/5 and 4/5 of therespective BV11 spectratypes had a perturbed distribution.
Table 4 Comparison of spectratypes of VLA-1+ and VLA-1− SF TC
# pts # BV genefamiliesstudied
# of pairedspectratypes
# of spectratypes diverging fromthe Gaussian distribution in VLA-1+SF subset
9 12 31 22
Summary of all paired VLA-1− and VLA-1+ spectratypes of SF TC comnucleotide length of the most prominent peak.
Moreover, the dominant CDR3 lengths in each subset weredistinct in 6/9 and 4/6 of the BV4 and BV11 spectratypes,respectively. Other detectable differences were as follows:absence of BV4 gene products in the VLA-1+ Tcells of patient3 and of BV11 genes in patient 6 contrasting with anoligoclonal spectratypes in the corresponding VLA-1−T cells; and lack of BV11 gene products in VLA-1− T cells asopposed to an oligoclonal pattern in VLA-1+ T cells. Thus,different TCR ‘clones’ appear to dominate the BV4 and BV11repertoire of the VLA-1+ and VLA-1− subsets in SF of patientswith RA or PA.
VLA-1+ and VLA-1− T cells from SF display distinctCDR3 spectratypes within multiple BV families
We determined whether these unique features of the TCRrepertoire of the VLA-1+ and VLA-1− SF Tcells subsets extendto additional BV gene families. As summarized in Table 3 and
# of spectratypes diverging fromthe Gaussian distribution in VLA-1−SF subset
# of paired VLA-1− and +SF spectratypes withdifferent NLP
19 20
pared in the study with respect to pattern of spectratype and

Figure 4 Jβ gene usage frequency in SF VLA-1+ and VLA-1subsets. Bars represent the number of clones in the VLA-1−(grey) and (VLA-1+ white) subsets using the J regions indicatedon the abscissa.
80 I. Goldstein et al.
Figure 3, multiple VLA-1+ and VLA-1− spectratypes of T cellsfrom the SF of patient 4 exhibited distinct features.Additionally, the VLA-1+ spectratype appeared more per-turbed (e.g BV6, BV8 and BV20 gene families) than thematching spectratype of the VLA-1− T cells. The mainfeatures of the summarized data from all the experiments
Figure 5 CDR3 amino acid sequences of SF VLA-1+ and VLA-1− subgene region (random distribution). The amino acid sequence of the Cin white and VLA-1− clones in black.
undertaken in the study showed: (i) skewed TCR repertoiresin both VLA-1+ and VLA-1− T cells from SF (in 22 and 19spectratypes of the VLA-1+ and VLA-1− SF T cells respec-tively); and (ii) different lengths of the prominent CDR3‘clones’ (in 20 of the 31 paired spectratypes) (Table 4). Thus,VLA-1− and VLA-1+ Tcells subsets in SF each express a uniqueTCR repertoire, indicating antigen-specific expansion ofdifferent clones within each subset. It should be noted,however, that some of the prominent CDR3 length peaks inthe VLA-1+ subset were also detected, albeit less promi-nently, in the VLA-1− subset (e.g in the BV21 and BV52.3spectratypes of patient 4 and the BV4 and BV11 spectratypesof patient 8, as shown in Figs. 3 and 6 respectively).
CDR3 sequences of VLA-1+ T cells from SF are byand large distinct
To directly compare, at a higher resolution, the TCRs of VLA-1+ and VLA-1− T cells found in SF, we cloned and sequencedthe CDR3 region of the BV6.1 gene of VLA-1+ and VLA-1−T cells from the SF of patient #4. We elected to study thisparticular BV gene family because its VLA-1+ population hada highly perturbed spectratype and patient #4 had psoriasis.In this respect psoriasis is a disease in which oligoclonalexpansions of BV6 expressing Tcells in inflamed skin plaqueshave been reported [28] and moreover VLA-1+ T cells havebeen shown to be crucial for its development [7].
As shown in Figure 4, we sequenced 28 and 13 Vβ6.1+ VLA-1− and VLA-1+ Vβ6.1 clones respectively. These clones were
sets. Bars indicate the number of clones using the indicated JβDR3 region is indicated on the x-axis. VLA-1+ clones are depicted
81TCR repertoire of synovial VLA-1+ T cells
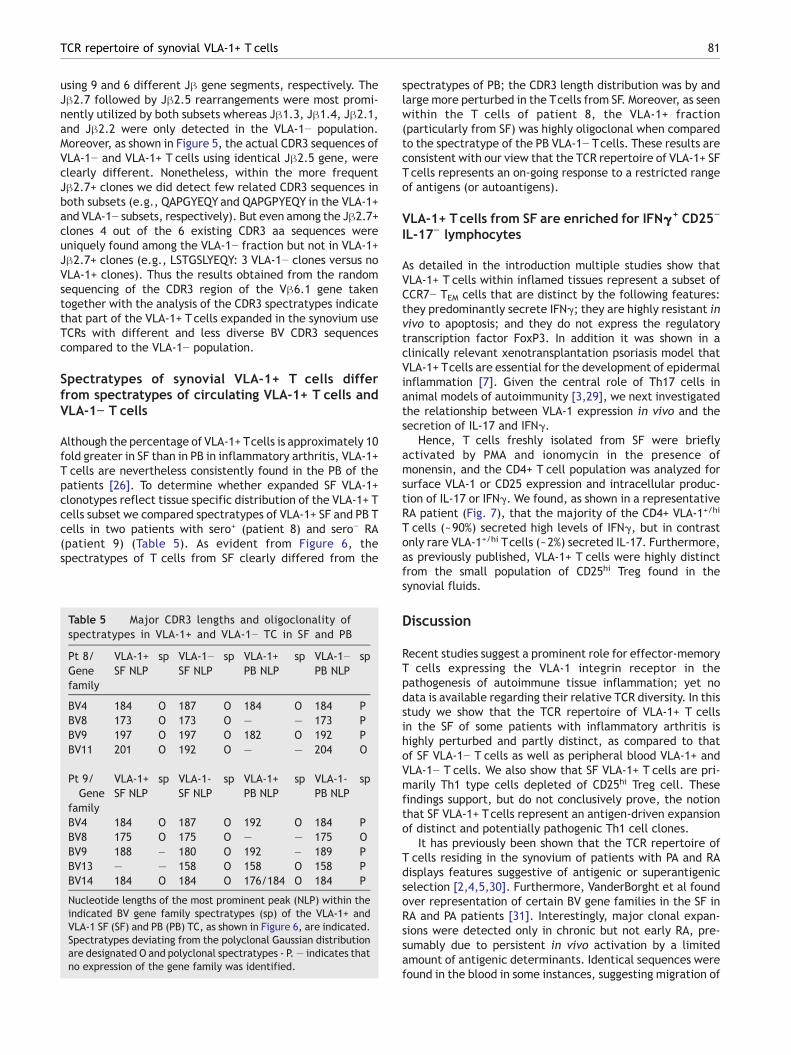
using 9 and 6 different Jβ gene segments, respectively. TheJβ2.7 followed by Jβ2.5 rearrangements were most promi-nently utilized by both subsets whereas Jβ1.3, Jβ1.4, Jβ2.1,and Jβ2.2 were only detected in the VLA-1− population.Moreover, as shown in Figure 5, the actual CDR3 sequences ofVLA-1− and VLA-1+ T cells using identical Jβ2.5 gene, wereclearly different. Nonetheless, within the more frequentJβ2.7+ clones we did detect few related CDR3 sequences inboth subsets (e.g., QAPGYEQYand QAPGPYEQY in the VLA-1+and VLA-1− subsets, respectively). But even among the Jβ2.7+clones 4 out of the 6 existing CDR3 aa sequences wereuniquely found among the VLA-1− fraction but not in VLA-1+Jβ2.7+ clones (e.g., LSTGSLYEQY: 3 VLA-1− clones versus noVLA-1+ clones). Thus the results obtained from the randomsequencing of the CDR3 region of the Vβ6.1 gene takentogether with the analysis of the CDR3 spectratypes indicatethat part of the VLA-1+ Tcells expanded in the synovium useTCRs with different and less diverse BV CDR3 sequencescompared to the VLA-1− population.
Spectratypes of synovial VLA-1+ T cells differfrom spectratypes of circulating VLA-1+ T cells andVLA-1− T cells
Although the percentage of VLA-1+ Tcells is approximately 10fold greater in SF than in PB in inflammatory arthritis, VLA-1+T cells are nevertheless consistently found in the PB of thepatients [26]. To determine whether expanded SF VLA-1+clonotypes reflect tissue specific distribution of the VLA-1+ Tcells subset we compared spectratypes of VLA-1+ SF and PB Tcells in two patients with sero+ (patient 8) and sero− RA(patient 9) (Table 5). As evident from Figure 6, thespectratypes of T cells from SF clearly differed from the
Table 5 Major CDR3 lengths and oligoclonality ofspectratypes in VLA-1+ and VLA-1− TC in SF and PB
Pt 8/Genefamily
VLA-1+SF NLP
sp VLA-1−SF NLP
sp VLA-1+PB NLP
sp VLA-1−PB NLP
sp
BV4 184 O 187 O 184 O 184 PBV8 173 O 173 O — — 173 PBV9 197 O 197 O 182 O 192 PBV11 201 O 192 O — — 204 O
Pt 9/Gene
family
VLA-1+SF NLP
sp VLA-1-SF NLP
sp VLA-1+PB NLP
sp VLA-1-PB NLP
sp
BV4 184 O 187 O 192 O 184 PBV8 175 O 175 O — — 175 OBV9 188 – 180 O 192 – 189 PBV13 — — 158 O 158 O 158 PBV14 184 O 184 O 176/184 O 184 P
Nucleotide lengths of the most prominent peak (NLP) within theindicated BV gene family spectratypes (sp) of the VLA-1+ andVLA-1 SF (SF) and PB (PB) TC, as shown in Figure 6, are indicated.Spectratypes deviating from the polyclonal Gaussian distributionare designated O and polyclonal spectratypes - P.— indicates thatno expression of the gene family was identified.
spectratypes of PB; the CDR3 length distribution was by andlarge more perturbed in the Tcells from SF. Moreover, as seenwithin the T cells of patient 8, the VLA-1+ fraction(particularly from SF) was highly oligoclonal when comparedto the spectratype of the PB VLA-1− Tcells. These results areconsistent with our view that the TCR repertoire of VLA-1+ SFT cells represents an on-going response to a restricted rangeof antigens (or autoantigens).
VLA-1+ Tcells from SF are enriched for IFNγ+ CD25−
IL-17− lymphocytes
As detailed in the introduction multiple studies show thatVLA-1+ T cells within inflamed tissues represent a subset ofCCR7− TEM cells that are distinct by the following features:they predominantly secrete IFNγ; they are highly resistant invivo to apoptosis; and they do not express the regulatorytranscription factor FoxP3. In addition it was shown in aclinically relevant xenotransplantation psoriasis model thatVLA-1+ Tcells are essential for the development of epidermalinflammation [7]. Given the central role of Th17 cells inanimal models of autoimmunity [3,29], we next investigatedthe relationship between VLA-1 expression in vivo and thesecretion of IL-17 and IFNγ.
Hence, T cells freshly isolated from SF were brieflyactivated by PMA and ionomycin in the presence ofmonensin, and the CD4+ T cell population was analyzed forsurface VLA-1 or CD25 expression and intracellular produc-tion of IL-17 or IFNγ. We found, as shown in a representativeRA patient (Fig. 7), that the majority of the CD4+ VLA-1+/hi
T cells (~90%) secreted high levels of IFNγ, but in contrastonly rare VLA-1+/hi Tcells (~2%) secreted IL-17. Furthermore,as previously published, VLA-1+ T cells were highly distinctfrom the small population of CD25hi Treg found in thesynovial fluids.
Discussion
Recent studies suggest a prominent role for effector-memoryT cells expressing the VLA-1 integrin receptor in thepathogenesis of autoimmune tissue inflammation; yet nodata is available regarding their relative TCR diversity. In thisstudy we show that the TCR repertoire of VLA-1+ T cellsin the SF of some patients with inflammatory arthritis ishighly perturbed and partly distinct, as compared to thatof SF VLA-1− T cells as well as peripheral blood VLA-1+ andVLA-1− T cells. We also show that SF VLA-1+ T cells are pri-marily Th1 type cells depleted of CD25hi Treg cell. Thesefindings support, but do not conclusively prove, the notionthat SF VLA-1+ Tcells represent an antigen-driven expansionof distinct and potentially pathogenic Th1 cell clones.
It has previously been shown that the TCR repertoire ofT cells residing in the synovium of patients with PA and RAdisplays features suggestive of antigenic or superantigenicselection [2,4,5,30]. Furthermore, VanderBorght et al foundover representation of certain BV gene families in the SF inRA and PA patients [31]. Interestingly, major clonal expan-sions were detected only in chronic but not early RA, pre-sumably due to persistent in vivo activation by a limitedamount of antigenic determinants. Identical sequences werefound in the blood in some instances, suggesting migration of
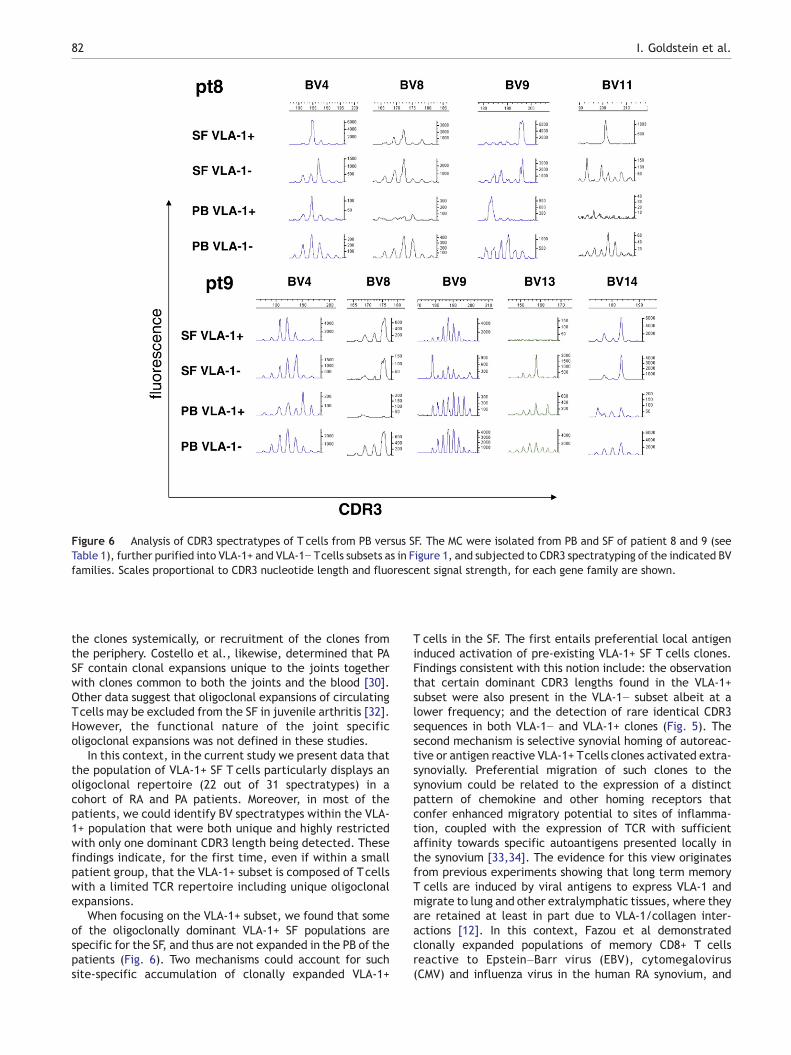
Figure 6 Analysis of CDR3 spectratypes of T cells from PB versus SF. The MC were isolated from PB and SF of patient 8 and 9 (seeTable 1), further purified into VLA-1+ and VLA-1− Tcells subsets as in Figure 1, and subjected to CDR3 spectratyping of the indicated BVfamilies. Scales proportional to CDR3 nucleotide length and fluorescent signal strength, for each gene family are shown.
82 I. Goldstein et al.
the clones systemically, or recruitment of the clones fromthe periphery. Costello et al., likewise, determined that PASF contain clonal expansions unique to the joints togetherwith clones common to both the joints and the blood [30].Other data suggest that oligoclonal expansions of circulatingTcells may be excluded from the SF in juvenile arthritis [32].However, the functional nature of the joint specificoligoclonal expansions was not defined in these studies.
In this context, in the current study we present data thatthe population of VLA-1+ SF T cells particularly displays anoligoclonal repertoire (22 out of 31 spectratypes) in acohort of RA and PA patients. Moreover, in most of thepatients, we could identify BV spectratypes within the VLA-1+ population that were both unique and highly restrictedwith only one dominant CDR3 length being detected. Thesefindings indicate, for the first time, even if within a smallpatient group, that the VLA-1+ subset is composed of Tcellswith a limited TCR repertoire including unique oligoclonalexpansions.
When focusing on the VLA-1+ subset, we found that someof the oligoclonally dominant VLA-1+ SF populations arespecific for the SF, and thus are not expanded in the PB of thepatients (Fig. 6). Two mechanisms could account for suchsite-specific accumulation of clonally expanded VLA-1+
T cells in the SF. The first entails preferential local antigeninduced activation of pre-existing VLA-1+ SF T cells clones.Findings consistent with this notion include: the observationthat certain dominant CDR3 lengths found in the VLA-1+subset were also present in the VLA-1− subset albeit at alower frequency; and the detection of rare identical CDR3sequences in both VLA-1− and VLA-1+ clones (Fig. 5). Thesecond mechanism is selective synovial homing of autoreac-tive or antigen reactive VLA-1+ Tcells clones activated extra-synovially. Preferential migration of such clones to thesynovium could be related to the expression of a distinctpattern of chemokine and other homing receptors thatconfer enhanced migratory potential to sites of inflamma-tion, coupled with the expression of TCR with sufficientaffinity towards specific autoantigens presented locally inthe synovium [33,34]. The evidence for this view originatesfrom previous experiments showing that long term memoryT cells are induced by viral antigens to express VLA-1 andmigrate to lung and other extralymphatic tissues, where theyare retained at least in part due to VLA-1/collagen inter-actions [12]. In this context, Fazou et al demonstratedclonally expanded populations of memory CD8+ T cellsreactive to Epstein–Barr virus (EBV), cytomegalovirus(CMV) and influenza virus in the human RA synovium, and

Figure 7 VLA-1+ CD4+ T cells from the SF of RA patients areenriched for IFNγ+ CD25− IL-17− cells. Freshly isolated SF werebriefly activated by PMA and ionomycin in the presence ofmonensin, and the CD4+ Tcell population was analyzed for surfaceVLA-1 or CD25 expression and intracellular cytokine production byFACS. The contour plots depict the analysis of VLA-1 expressiontogether with either IFN-γ (right upper panel), IL-17 (left lowerpanel), or CD25 (right lower panel) within CD4+ Tcells. Depicted isthe analysis of a typical patient out of four patients examined.
83TCR repertoire of synovial VLA-1+ T cells
TCR sequences characteristic of EBV reactive T cells cloneshave been detected in psoriatic arthritis SF [35,36]. It ispossible that oligoclonally expanded VLA-1+ T cells in SF ofarthritis patients represent memory T cells that have beenoriginally induced by viral antigens, but now continuouslyexpand in response to autoantigen that they aberrantlyrecognize as well. In this regard, there was no evidence ofacute or chronic viral infection, including EBV and CMV, inany of the patients. However, serological data concerningprevious infection with these viruses was not obtained, andexperiments to directly address this hypothesis are planned.
Lastly, we show that CD4+ T cells that express VLA-1 invivo are mostly Th1 cells that are moreover distinct fromCD25hi Treg cells, findings that are in accord with previousobservations [18]. Interestingly, we also show now that only asmall fraction of the VLA-1+ T cells produce IL-17. Of note,the SF in the RA patients we examined up to now containedonly a small population of Th17 cells (2–5% of CD4+ T cells,n=5) as compared to N40% IFNγ+ T cells. These latter dataare in agreement with a recent study of multiple RAperipheral blood (n=123) and synovial fluids (n=12) samples.In this study IL-17 positive T cells were identified, as in ourstudy, by intracellular staining of ex vivo stimulated T cells.This study shows that Th1 – but not Th17 cells – accumulatein RA SF, and the authors concluded that they could notobtain evidence that supports the predominance of Th17cells in RA [37]. Although in the mice model of collagen-induced arthritis Th17 – but not Th1 – cells play a centralrole [3,29], it seems that further studies will be needed tofully define the precise role of Th17 versus Th1 cells in theinitiation and/or maintenance of chronic synovitis in humanRA or PA.
Multiple studies suggest that targeting the VLA-1 mole-cule with mAbs could be used for therapy of inflammatoryresponses by blocking immune cell migration adhesion andcytokine production in situ [19]. Our results suggest that thisform of therapy is likely to target a unique set of in vivoexpanded T cell clones at the site of inflammation, whilesparing naive, central memory, regulatory and other VLA-1−T cell subsets. Our study also demonstrates, for the firsttime, the feasibility of identifying patient's specific TCR BVCDR3 sequences/peptides of in vivo expanded collagenadherent SF VLA-1+ Th1 clones. As therapeutic vaccinationusing CDR3 BV peptides expressed by potentially pathogenicT cells (or the irradiated pathogenic T cell clones) may be afeasible approach for developing patient-specific treatmentof autoimmune diseases [38], our approach to identify suchsequences could further facilitate the development ofpatient-tailored TCR BV peptide based vaccines and inves-tigate their therapeutic potential.
Acknowledgments
This work was supported in part by an investigator initiatedresearch grant from Biogen Idec to I.B. G.R. holds the DjerasiChair for Oncology (Sackler School of Medicine, Tel AvivUniversity). Part of this work was performed in partial fulfill-ment of the requirements of the MSc of S. Matzri at theSackler School of Medicine (Tel Aviv University).
References
[1] F.M. Brennan, A.L. Hayes, C.J. Ciesielski, P. Green, B.M.Foxwell, M. Feldmann, Evidence that rheumatoid arthritissynovial T cells are similar to cytokine-activated T cells:involvement of phosphatidylinositol 3-kinase and nuclear factorκB pathways in tumor necrosis factor α production inrheumatoid arthritis, Arthritis Rheum. 46 (2002) 31–41.
[2] A. Lim, A. Toubert, C. Pannetier, M. Dougados, D. Charron, P.Kourilsky, J. Even, Spread of clonal T-cell expansions inrheumatoid arthritis patients, Hum. Immunol. 48 (1996) 77–83.
[3] S.K. Lundy, S. Sarkar, L.A. Tesmer, D.A. Fox, Cells of the synoviumin rheumatoid arthritis. T lymphocytes, Arthritis Res. Ther. 9(2007) 202.
[4] C.C. Striebich, M.T. Falta, Y. Wang, J. Bill, B.L. Kotzin, Selectiveaccumulation of related CD4+ Tcell clones in the synovial fluid ofpatients with rheumatoid arthritis, J. Immunol. 161 (1998)4428–4436.
[5] S. Strober, J. Holoshitz, Mechanisms of immune injury inrheumatoid arthritis: evidence for the involvement of T cellsand heat-shock protein, Immunol. Rev. 118 (1990) 233–255.
[6] I. Bank, D. Roth, M. Book, A. Guterman, I. Shnirrer, R. Block, M.Ehrenfeld, P. Langevitz, H. Brenner, M. Pras, Expression andfunctions of very late antigen 1 in inflammatory joint diseases,J. Clin. Immunol. 11 (1991) 29–38.
[7] C. Conrad, O. Boyman, G. Tonel, A. Tun-Kyi, U. Laggner, A. deFougerolles, V. Kotelianski, H. Gardner, F.O. Nestle, α1β1integrin is crucial for accumulation of epidermal Tcells and thedevelopment of psoriasis, Nat. Med. 13 (2007) 836–842.
[8] I. Goldstein, S. Ben-Horin, J. Li, I. Bank, H. Jiang, L. Chess,Expression of the α1β1 integrin, VLA-1, marks a distinct subset ofhuman CD4+memory Tcells, J. Clin. Invest. 112 (2003) 1444–1454.
[9] M.E. Hemler, D. Glass, J.S. Coblyn, J.G. Jacobson, Very lateactivation antigens on rheumatoid synovial fluid T lympho-cytes. Association with stages of T cell activation, J. Clin.Invest. 78 (1986) 696–702.

84 I. Goldstein et al.
[10] A. Laffon, F. Sanchez-Madrid, M. Ortiz de Landazuri, A. JimenezCuesta, A. Ariza, C. Ossorio, P. Sabando, Very late activationantigen on synovial fluid T cells from patients with rheumatoidarthritis andother rheumatic diseases, Arthritis Rheum.32 (1989)386–392.
[11] C. Saltini, M.E. Hemler, R.G. Crystal, T lymphocytes compart-mentalized on the epithelial surface of the lower respiratorytract express the very late activation antigen complex VLA-1,Clin. Immunol. Immunopathol. 46 (1988) 221–233.
[12] S.J. Ray, S.N. Franki, R.H. Pierce, S. Dimitrova, V. Koteliansky,A.G. Sprague, P.C. Doherty, A.R. de Fougerolles, D.J. Topham,The collagen binding α1β1 integrin VLA-1 regulates CD8 T cell-mediated immune protection against heterologous influenzainfection, Immunity 20 (2004) 167–179.
[13] B.M. Chan, J.G. Wong, A. Rao, M.E. Hemler, T cell receptor-dependent, antigen-specific stimulation of a murine T cellclone induces a transient, VLA protein-mediated binding toextracellular matrix, J. Immunol. 147 (1991) 398–404.
[14] B.H. Luo, C.V. Carman, T.A. Springer, Structural basis of integrinregulation and signaling, Annu. Rev. Immunol. 25 (2007) 619–647.
[15] I. Bank, A. Koltakov, E. Nir-Glickman, I. Goldstein, J. Li, J.Roitelman, L. Chess, Lovastatin and phospholipase Cγ regulateconstitutive and protein kinase C dependent integrin mediatedinteractions of human T-cells with collagen, Cell. Immunol. 223(2003) 35–45.
[16] S. Ben-Horin, I. Bank, The role of very late antigen-1 in immune-mediated inflammation, Clin. Immunol. 113 (2004) 119–129.
[17] S. Fiorucci, A. Mencarelli, B. Palazzetti, A.G. Sprague, E. Distrutti,A. Morelli, T.I. Novobrantseva, G. Cirino, V.E. Koteliansky, A.R. deFougerolles, Importance of innate immunity and collagen bindingintegrin α1β1 in TNBS-induced colitis, Immunity 17 (2002)769–780.
[18] I. Goldstein, S. Ben-Horin, A. Koltakov, H. Chermoshnuk, V.Polevoy, Y. Berkun, N. Amariglio, I. Bank, α1β1 Integrin+ andregulatory Foxp3+ T cells constitute two functionally distincthuman CD4+ T cell subsets oppositely modulated by TNF-αblockade, J. Immunol. 178 (2007) 201–210.
[19] A.R. de Fougerolles, A.G. Sprague, C.L. Nickerson-Nutter, G.Chi-Rosso, P.D. Rennert, H.Gardner, P.J.Gotwals, R.R. Lobb, V.E.Koteliansky, Regulation of inflammation by collagen-bindingintegrins α1β1 and α2β1 in models of hypersensitivity andarthritis, J. Clin. Invest. 105 (2000) 721–729.
[20] R. Schwab, P. Szabo, J.S. Manavalan, M.E. Weksler, D.N. Posnett,C. Pannetier, P. Kourilsky, J. Even, Expanded CD4+ and CD8+ Tcellclones in elderly humans, J. Immunol. 158 (1997) 4493–4499.
[21] J.C. Goodall, P. Bledsoe, J.S. Gaston, Tracking antigen-specifichuman T lymphocytes in rheumatoid arthritis by Tcell receptoranalysis, Hum. Immunol. 60 (1999) 798–805.
[22] F.C. Arnett, S.M. Edworthy, D.A. Bloch, D.J. McShane, J.F. Fries,N.S. Cooper, L.A. Healey, S.R. Kaplan, M.H. Liang, H.S. Luthra,et al., The American Rheumatism Association 1987 revisedcriteria for the classification of rheumatoid arthritis, ArthritisRheum. 31 (1988) 315–324.
[23] P.S. Helliwell, W.J. Taylor, Classification and diagnostic criteriafor psoriatic arthritis, Ann. Rheum. Dis. 64 (2005) ii3–ii8.
[24] I. Bank, M. Hemler, M.B. Brenner, D. Cohen, V. Levy, J. Belko, C.Crouse, L. Chess, A novel monoclonal antibody, 1B3.1, binds toa new epitope of the VLA-1 molecule, Cell. Immunol. 122(1989) 416–423.
[25] I. Bank, J. Kapyla, R. Doolman, A. Grinbaum, J. Bank, B.A. Sela,Analysis of recombinant human α1β1 I-domain with a function-
blocking monoclonal antibody, 1B3.1, Isr. Med. Assoc. J. 2(2000) 19–20.
[26] I. Bank, A. Koltakov, I. Goldstein, L. Chess, Lymphocytesexpressing α1β1 integrin (very late antigen-1) in peripheralblood of patients with arthritis are a subset of CD45RO(+) T-cellsprimed for rapid adhesion to collagen IV, Clin. Immunol. 105(2002) 247–258.
[27] J. Even, A. Lim, I. Puisieux, L. Ferradini, P.Y. Dietrich, A.Toubert, T. Hercend, F. Triebel, C. Pannetier, P. Kourilsky, T-cellrepertoires in healthy and diseased human tissues analysed byT-cell receptor β-chain CDR3 size determination: evidence foroligoclonal expansions in tumours and inflammatory diseases,Res. Immunol. 146 (1995) 65–80.
[28] A. Menssen, P. Trommler, S. Vollmer, D. Schendel, E. Albert, L.Gurtler, G. Riethmuller, J.C. Prinz, Evidence for an antigen-specific cellular immune response in skin lesions of patientswith psoriasis vulgaris, J. Immunol. 155 (1995) 4078–4083.
[29] J. Furuzawa-Carballeda, M.I. Vargas-Rojas, A.R. Cabral, Auto-immune inflammation from the Th17 perspective, Autoimmun.Rev. 6 (2007) 169–175.
[30] P.J. Costello, R.J. Winchester, S.A. Curran, K.S. Peterson, D.J.Kane, B. Bresnihan, O.M. FitzGerald, Psoriatic arthritis jointfluids are characterized by CD8 and CD4 Tcell clonal expansionsappear antigen driven, J. Immunol. 166 (2001) 2878–2886.
[31] A. VanderBorght, P. Geusens, C. Vandevyver, J. Raus, P.Stinissen, Skewed T-cell receptor variable gene usage in thesynovium of early and chronic rheumatoid arthritis patients andpersistence of clonally expanded T cells in a chronic patient,Rheumatology (Oxford) 39 (2000) 1189–1201.
[32] L.R. Wedderburn, M.K. Maini, A. Patel, P.C. Beverley, P. Woo,Molecular fingerprinting reveals non-overlapping T cell oligo-clonality between an inflamed site and peripheral blood, Int.Immunol. 11 (1999) 535–543.
[33] T. Nanki, T. Imai, K. Nagasaka, Y. Urasaki, Y. Nonomura, K.Taniguchi, K. Hayashida, J. Hasegawa, O. Yoshie, N. Miyasaka,Migration of CX3CR1-positive Tcells producing type 1 cytokinesand cytotoxic molecules into the synovium of patients withrheumatoid arthritis, Arthritis Rheum. 46 (2002) 2878–2883.
[34] C.M. Weyand, J.J. Goronzy, T-cell responses in rheumatoidarthritis: systemic abnormalities-local disease, Curr. Opin.Rheumatol. 11 (1999) 210–217.
[35] C. Fazou, H. Yang, A.J. McMichael, M.F. Callan, Epitopespecificity of clonally expanded populations of CD8+ T cellsfound within the joints of patients with inflammatory arthritis,Arthritis Rheum. 44 (2001) 2038–2045.
[36] S.A. Curran, O.M. FitzGerald, P.J. Costello, J.M. Selby, D.J.Kane, B. Bresnihan, R. Winchester, Nucleotide sequencing ofpsoriatic arthritis tissue before and during methotrexateadministration reveals a complex inflammatory Tcell infiltratewith very few clones exhibiting features that suggest they drivethe inflammatory process by recognizing autoantigens,J. Immunol. 172 (2004) 1935–1944.
[37] H. Yamada, Y. Nakashima, K. Okazaki, T. Mawatari, J.I. Fukushi,N. Kaibara, A.Hori, Y. Iwamoto, Y. Yoshikai, Th1 but not Th17 cellspredominate in the joints of patients with rheumatoid arthritis,Ann. Rheum. Dis. (in press) (6 December 2007, Electronicpublication ahead of print), doi:10.1136/ard.2007.080341.
[38] A. Vanderborght, P. Geusens, J. Raus, P. Stinissen, The auto-immune pathogenesis of rheumatoid arthritis: role of autoreac-tiveTcells and new immunotherapies, Semin. Arthritis Rheum.31(2001) 160–175.