Alterations of the synovial T cell repertoire in anti-citrullinated protein antibody-positive...
13
ARTHRITIS & RHEUMATISM Vol. 60, No. 7, July 2009, pp 1944–1956 DOI 10.1002/art.24635 © 2009, American College of Rheumatology Alterations of the Synovial T Cell Repertoire in Anti–Citrullinated Protein Antibody–Positive Rheumatoid Arthritis Tineke Cantaert, 1 Sophie Brouard, 2 Rogier M. Thurlings, 1 Annaick Pallier, 2 Gabriela Franco Salinas, 1 Christophe Braud, 2 Paul L. Klarenbeek, 1 Niek de Vries, 1 Yiping Zhang, 3 Jean-Paul Soulillou, 2 Paul P. Tak, 1 and Dominique Baeten 1 Objective. The association of HLA–DRB1 alleles with anti–citrullinated protein antibodies (ACPAs) in rheumatoid arthritis (RA) suggests the potential in- volvement of T lymphocytes in ACPA-seropositive dis- ease. The purpose of this study was to investigate this hypothesis by systematic histologic and molecular ana- lyses of synovial T cells in ACPA versus ACPA– RA patients. Methods. Synovial biopsy samples were obtained from 158 RA patients. Inflammation was determined histologically and immunohistochemically. RNA was extracted from peripheral blood mononuclear cells and synovial tissues obtained from 11 ACPA RA patients, 7 ACPA– RA patients, and 10 spondylarthritis (SpA) patients (arthritis controls). T lymphocyte clonality was studied by combined quantitative and qualitative T cell receptor CDR3 length distribution (LD) analysis and direct sequencing analysis. Results. ACPA and ACPA– RA patients were similar at both the clinical and histologic levels. At the molecular level, however, patients with ACPA synovi- tis displayed a marked elevation of qualitative CDR3 LD alterations as compared with those with ACPA– synovi- tis and with the SpA controls. These differences in CDR3 LD were not observed in the peripheral blood, indicating a selective recruitment and/or local expan- sion of T cells in the synovial compartment. The CDR3 LD alterations reflected true monoclonal or oligoclonal expansions, as confirmed by direct sequencing of the T cell receptor. The CDR3 LD alterations in RA synovium did not correlate with B cell clonal expansions but were inversely associated with synovial lymphoid neogenesis. Conclusion. The T cell repertoire is specifically restricted in RA patients with ACPA synovitis. Whereas the origin and role of these clonal alterations remain to be determined, our data suggest the prefer- ential involvement of T lymphocytes in ACPA- seropositive RA. Rheumatoid arthritis (RA) displays marked het- erogeneity at the immunologic level, as illustrated by the presence of rheumatoid factor and/or anti–citrullinated protein antibodies (ACPAs) in a large subset of patients. The latter autoantibodies, which target protein epitopes that have been posttranslationally modified by citrulli- nation, are highly specific for RA (1–3). Besides the diagnostic value of ACPAs, recently published data have also raised the hypothesis that these autoantibodies may define a separate subset of RA (4). The strongest evidence for this concept comes from genetic studies indicating the preferential association of This publication reflects only the authors’ views. The Euro- pean Community is not liable for any use that may be made of the information herein. Supported in part by a Human Immunology Research grant from the Dana Foundation, by the Dutch Arthritis Association (Reu- mafonds), and by the European Community Sixth Framework Pro- gramme. Dr. Baeten’s work was supported by a Vidi grant from The Netherlands Scientific Organization. 1 Tineke Cantaert, PhD, Rogier M. Thurlings, MD, Gabriela Franco Salinas, Paul L. Klarenbeek, MD, Niek de Vries, MD, PhD, Paul P. Tak, MD, PhD, Dominique Baeten, MD, PhD: Academic Medical Center, University of Amsterdam, Amsterdam, The Nether- lands; 2 Sophie Brouard, PhD, Annaick Pallier, Christophe Braud, PhD, Jean-Paul Soulillou, MD, PhD: INSERM U643, Nantes, France; 3 Yiping Zhang, MD, PhD: University of California, Irvine. Drs. Brouard and Soulillou are members of the Scientific Advisory Board of TcLand Expression, for which they receive hono- raria (less than $10,000). Address correspondence and reprint requests to Dominique Baeten, MD, PhD, Clinical Immunology and Rheumatology, F4-218, Academic Medical Center, University of Amsterdam, Meibergdreef 9, 1105 AZ Amsterdam, The Netherlands. E-mail: d.l.baeten@ amc.uva.nl. Submitted for publication September 17, 2008; accepted in revised form April 1, 2009. 1944
-
Upload
independent -
Category
Documents
-
view
0 -
download
0
Transcript of Alterations of the synovial T cell repertoire in anti-citrullinated protein antibody-positive...

ARTHRITIS & RHEUMATISMVol. 60, No. 7, July 2009, pp 1944–1956DOI 10.1002/art.24635© 2009, American College of Rheumatology
Alterations of the Synovial T Cell Repertoirein Anti–Citrullinated Protein Antibody–Positive
Rheumatoid Arthritis
Tineke Cantaert,1 Sophie Brouard,2 Rogier M. Thurlings,1 Annaick Pallier,2
Gabriela Franco Salinas,1 Christophe Braud,2 Paul L. Klarenbeek,1 Niek de Vries,1
Yiping Zhang,3 Jean-Paul Soulillou,2 Paul P. Tak,1 and Dominique Baeten1
Objective. The association of HLA–DRB1 alleleswith anti–citrullinated protein antibodies (ACPAs) inrheumatoid arthritis (RA) suggests the potential in-volvement of T lymphocytes in ACPA-seropositive dis-ease. The purpose of this study was to investigate thishypothesis by systematic histologic and molecular ana-lyses of synovial T cells in ACPA� versus ACPA– RApatients.
Methods. Synovial biopsy samples were obtainedfrom 158 RA patients. Inflammation was determinedhistologically and immunohistochemically. RNA wasextracted from peripheral blood mononuclear cells andsynovial tissues obtained from 11 ACPA� RA patients,7 ACPA– RA patients, and 10 spondylarthritis (SpA)patients (arthritis controls). T lymphocyte clonality wasstudied by combined quantitative and qualitative T cell
receptor CDR3 length distribution (LD) analysis anddirect sequencing analysis.
Results. ACPA� and ACPA– RA patients weresimilar at both the clinical and histologic levels. At themolecular level, however, patients with ACPA� synovi-tis displayed a marked elevation of qualitative CDR3 LDalterations as compared with those with ACPA– synovi-tis and with the SpA controls. These differences inCDR3 LD were not observed in the peripheral blood,indicating a selective recruitment and/or local expan-sion of T cells in the synovial compartment. The CDR3LD alterations reflected true monoclonal or oligoclonalexpansions, as confirmed by direct sequencing of the Tcell receptor. The CDR3 LD alterations in RA synoviumdid not correlate with B cell clonal expansions but wereinversely associated with synovial lymphoid neogenesis.
Conclusion. The T cell repertoire is specificallyrestricted in RA patients with ACPA� synovitis.Whereas the origin and role of these clonal alterationsremain to be determined, our data suggest the prefer-ential involvement of T lymphocytes in ACPA-seropositive RA.
Rheumatoid arthritis (RA) displays marked het-erogeneity at the immunologic level, as illustrated by thepresence of rheumatoid factor and/or anti–citrullinatedprotein antibodies (ACPAs) in a large subset of patients.The latter autoantibodies, which target protein epitopesthat have been posttranslationally modified by citrulli-nation, are highly specific for RA (1–3).
Besides the diagnostic value of ACPAs, recentlypublished data have also raised the hypothesis that theseautoantibodies may define a separate subset of RA (4).The strongest evidence for this concept comes fromgenetic studies indicating the preferential association of
This publication reflects only the authors’ views. The Euro-pean Community is not liable for any use that may be made of theinformation herein.
Supported in part by a Human Immunology Research grantfrom the Dana Foundation, by the Dutch Arthritis Association (Reu-mafonds), and by the European Community Sixth Framework Pro-gramme. Dr. Baeten’s work was supported by a Vidi grant from TheNetherlands Scientific Organization.
1Tineke Cantaert, PhD, Rogier M. Thurlings, MD, GabrielaFranco Salinas, Paul L. Klarenbeek, MD, Niek de Vries, MD, PhD,Paul P. Tak, MD, PhD, Dominique Baeten, MD, PhD: AcademicMedical Center, University of Amsterdam, Amsterdam, The Nether-lands; 2Sophie Brouard, PhD, Annaick Pallier, Christophe Braud,PhD, Jean-Paul Soulillou, MD, PhD: INSERM U643, Nantes, France;3Yiping Zhang, MD, PhD: University of California, Irvine.
Drs. Brouard and Soulillou are members of the ScientificAdvisory Board of TcLand Expression, for which they receive hono-raria (less than $10,000).
Address correspondence and reprint requests to DominiqueBaeten, MD, PhD, Clinical Immunology and Rheumatology, F4-218,Academic Medical Center, University of Amsterdam, Meibergdreef 9,1105 AZ Amsterdam, The Netherlands. E-mail: [email protected].
Submitted for publication September 17, 2008; accepted inrevised form April 1, 2009.
1944
the HLA–DRB1 shared epitope alleles, PTPN22 poly-morphisms, and IRF5 polymorphisms with ACPA� RArather than ACPA– RA (5–7). Accordingly, a gene–environment interaction between the shared epitope andsmoking in ACPA�, but not ACPA–, RA has beenreported in northern European RA patient cohorts(8,9). On the other hand, however, the association of thespecific HLA–DRB1 alleles with ACPA� RA appearsto vary between different populations (10–12), and thespecific gene–environment interaction in ACPA� RAcould not be confirmed in all studies (13,14).
At the clinical level, several studies have consis-tently indicated that the presence of ACPAs is associ-ated with more-severe joint destruction over time(15,16). In contrast, the clinical presentation and diseaseseverity are not different between ACPA� and ACPA–patients and the difference in the severity of jointdestruction holds true only at the group level, with animportant overlap between the two subsets at the indi-vidual level. Taken together, neither the genetic nor theclinical data are unequivocal, and further immunologicand molecular data are required to confirm or reject thehypothesis that ACPA� and ACPA– RA are 2 distinctdisease subsets.
Two lines of evidence suggest that T lymphocytesmay be involved in the pathogenesis of ACPA� RA.First, the fact that ACPA are classed-switched antibod-ies directed against a peptide antigen suggests T cellhelp. Second, the association with the HLA–DRB1shared epitope alleles supports the concept that specificantigenic epitopes could be presented to T cells in anHLA-restricted manner (17–19). Whether such epitopesshould be citrullinated or not remains unclear. Onestudy demonstrated that a citrullinated peptide of vi-mentin binds with higher affinity than its native coun-terpart to HLA–DRB1*0401, *0404, and *0101 but notother HLA–DRB1 alleles (20), a theory supported by Tcell reactivity to citrullinated epitopes in HLA–DR4–transgenic mice immunized with citrullinated humanfibrinogen (21). In contrast, however, extensive studieswith fibrinogen peptides could not confirm that citrulli-nation influences the HLA–DR binding or the T cellreactivity in human RA (22). Alternatively, T cells mayrecognize a noncitrullinated epitope of a protein com-plex in which a distinct citrullinated part is recognized bythe B cell receptor, allowing adequate antigen-specificcollaboration between T cells and B cells (3). Formaldemonstration of such a mechanism is complicated bythe fact that the driving autoantigenic epitopes have notbeen identified in human RA. As a consequence, direct
evidence of specific T cell reactivity in ACPA� RA hasnot been provided.
Peptides presented in the context of MHC arerecognized by the T cell receptor (TCR). The TCR isgenerated by gene segment rearrangements in whichnucleotides can be removed or added randomly at thejunctions between the segments, generating as much as2.5 � 107 to 1 � 108 different TCRs (23). Mostvariability can be found in the third complementarity-determining region (CDR3). After antigenic stimula-tion, a T cell will expand and form a clonally identicalpopulation leading to modifications of the Gaussian-likeCDR3 length distribution (LD) (24,25). Therefore,studying the CDR3 LD can provide direct evidence forthe involvement of T cells in a specific disease (26,27).Since synovial tissue is the major target organ of RA andsince ACPA are produced locally in the synovium (28–31), we used a novel technique for qualitative andquantitative TCR analysis to study clonal alterations atthe primary site of inflammation in ACPA� versusACPA– RA patients using spondylarthritis (SpA) pa-tients as controls.
PATIENTS AND METHODS
Patients and samples. Synovial tissue biopsy sampleswere obtained by needle arthroscopy of a swollen knee joint, asdescribed in detail elsewhere (32). Samples were obtainedfrom 158 RA patients who fulfilled the criteria of the Ameri-can College of Rheumatology (33) and from 10 SpA patientswho fulfilled the criteria of the European SpondylarthropathyStudy Group (34). None of the patients had been treated witha biologic agent. Sixteen biopsy samples were obtained fromeach study patient. Eight biopsy samples from each patientwere snap-frozen in liquid nitrogen, and the other 8 werestored in TRIzol (Invitrogen, Carlsbad, CA) at –80°C for RNAextraction.
Peripheral blood mononuclear cells (PBMCs) from 13RA patients, 8 SpA patients, and 12 age-matched healthyindividuals were isolated from whole blood samples by Ficollgradient techniques (Sigma-Aldrich, St. Louis, MO). ACPAlevels were determined with the use of an anti-CCP2 kit(Euro-Diagnostica, Arnhem, The Netherlands). All study sub-jects gave written informed consent, as approved by the localMedical Ethics Committee.
Histologic and immunohistochemical analyses of sy-novium. Synovial tissue biopsy samples were processed andevaluated for lining layer thickness, vascularity, global inflam-matory infiltration, and lymphoid aggregates, as describedpreviously (35–37). Synovial tissues from the 158 RA patientswere divided into 2 groups. In one group of synovial tissues(n � 54), the synovial cells were phenotyped by immunohis-tochemistry using anti-CD3 (clone UCHT-1; DakoCytoma-tion, Glostrup, Denmark), anti-CD20 (clone L26; DakoCyto-mation), and anti-CD138 (clone CBL455; Chemicon,Temecula, CA) monoclonal antibodies. In the other group of
SYNOVIAL T CELL REPERTOIRE ALTERATIONS IN ACPA-POSITIVE RA 1945

synovial tissues (n � 104), tissue was stained with anti-CD3(clone SK7; Becton Dickinson, Franklin Lakes, NJ), anti-CD22(clone CLB-B-ly/1,6B11; Sanquin, Amsterdam, The Nether-lands), and anti-CD38 (clone HB-7; Becton Dickinson) mono-clonal antibodies.
After blocking with swine serum, sections were incu-bated with the primary antibody or concentration- and isotype-matched control antibodies for 30 minutes. Stainings were thenperformed using a 3-step immunoperoxidase method. Stainedsections from group 1 tissues were scored on a semiquantita-tive 4-point scale by 2 independent observers (TC and DB)who were blinded with regard to clinical data, ACPA status,and RF status of the patients (38), whereas stained sectionsfrom group 2 tissues were analyzed by computer-assisted imageanalysis to determine the total number of positive cells persquare millimeter using the QWin analysis system (Leica,Cambridge, UK) (39).
Analysis of the TCR repertoire. The TCR repertoirewas analyzed using TcLandscape technology (TcLand Expres-sion, Nantes, France), which has been described and validatedelsewhere (27,40). Samples were selected on the basis ofcomparable synovial histologic features and a high semiquan-titative score for infiltrating T cells. RNA was extracted usingTRIzol reagent (Invitrogen). The concentration and quality of
RNA for each sample were evaluated using nanoRNA Chips(Agilent, Cheshire, UK). Two micrograms of RNA was reversetranscribed into complementary DNA (cDNA; BoehringerMannheim, Indianapolis, IN). The cDNA was amplified bypolymerase chain reaction (PCR) using a C� primer and 1 ofthe 26 V�-specific primers (model 9600 PerkinElmer Thermo-cycler; Applied Biosystems, Foster City, CA). Each amplifica-tion product was subjected to an elongation reaction using adye-labeled C� primer, then heat-denatured, loaded onto a 6%acrylamide–8M urea gel, and electrophoresed for 9 hoursusing an Applied Biosystems 373A DNA Sequencer. Theamount of each specific V� family transcript was divided by thenumber of hypoxanthine guanine phosphoribosyltransferase(HPRT) transcripts.
TcLandscape data analysis. Analysis of CDR3 lengthdistribution was performed using Immunoscope software(27,40–42) (Figure 1). One drawback of classic spectratyping isthat a low number of transcripts for a given V� family increasesthe chance of false-positive deviation from Gaussian distribu-tion. Using the data from quantitative reverse transcription–PCR (the ratio of V� to HPRT transcripts), previous dilutionexperiments on peripheral blood T cells allowed us to definefor each V� family the minimum number of transcripts neededfor reliable assessment of the CDR3 LD profile (Brouard S, et
Figure 1. Composition of the TcLandscape profiles. TcLandscapes are 3-dimensional representations of the integrated analysis of qualitative andquantitative alterations in the T cell receptor repertoire. The x-axis shows the individual V� families, the y-axis shows the ratio of V� transcripts tohypoxanthine guanine phosphoribosyltransferase (HPRT) transcripts, as determined by V�-specific quantitative polymerase chain reaction, and thez-axis shows the length distribution (LD) of the third complementarity-determining region (CDR3), as determined by spectratyping. If cDNA copynumbers were below the preset threshold for a given V� family (as for V�16 in this example; indicated by the red “x” over the arrow), the alterationof the CDR3 LD was not included in the analysis for that particular V� family. If cDNA copy numbers reached the threshold (as for V�3 and V�21in this example), the percentage alteration of the CDR3 LD from the expected Gaussian curve was calculated for each V� family, and the resultsare represented as color codes from green, which indicates almost Gaussian distribution (as for V�3 in this example), to dark red, which indicatesstrongly altered profiles (as for V�21 in this example).
1946 CANTAERT ET AL

Tab
le1.
Clin
ical
and
dem
ogra
phic
feat
ures
ofth
eR
Aan
dSp
Apa
tient
s,by
AC
PAst
atus
and
byty
peof
tissu
ean
alyz
ed*
Clin
ical
anal
ysis
TcL
ands
cape
anal
ysis
PBM
Csa
mpl
esSy
novi
altis
sue
sam
ples
AC
PA�
(n�
112)
AC
PA�
(n�
46)
AC
PA�
(n�
9)A
CPA
�(n
�4)
SpA
patie
nts
(n�
8)A
CPA
�(n
�11
)A
CPA
�(n
�7)
SpA
patie
nts
(n�
10)
Age
,yea
rs56
(48–
65)
55(4
2–62
)57
(51–
65)
44(3
5–62
)50
(42–
58)
57(5
0–75
)51
(42–
59)
40(3
1–48
)N
o.m
ale/
fem
ale
36/7
68/
381/
92/
42/
62/
93/
57/
3R
F�
,no.
(%)
95(8
5)10
(22)
8(8
9)2
(50)
08
(72)
3(4
2)0
Dis
ease
dura
tion,
year
s8
(3–1
6)5
(1–1
4)13
(2–1
6)10
(5–1
5)12
(5–1
9)13
(2–1
8)13
(11–
14)
13(4
–18)
DA
S28
5.6
(4.9
–6.6
)6.
0(5
.0–6
.9)
5.1
(4.9
–6.4
)6.
1(3
.8–6
.8)
NA
5.0
(4.8
–6.9
)6.
9(3
.0–7
.6)
NA
Patie
nt’s
asse
ssm
ent
ofdi
seas
eac
tivit
y,by
VA
S59
(34–
75)
65(4
8–77
)47
(18–
68)
67(4
0–88
)55
(50–
70)
78(4
7–90
)83
(23–
91)
52(3
4–61
)
CR
P,m
g/lit
er16
.5(8
.0–4
2.3)
8.0
(3.0
–32.
5)11
.0(3
.5–1
2.0)
30.5
(24.
0–10
0.0)
17.5
(9.8
–88.
3)13
.0(1
1.1–
85.0
)32
.1(7
.0–9
8.0)
14.5
(8.5
–32.
5)E
SR,m
m/h
our
35.5
(22.
3–49
.8)
27.0
(12.
0–45
.0)
38.0
(20.
1–48
.5)
50.0
(41.
1–71
.0)
20.5
(8.5
–26.
0)40
.5(2
9.1–
63.0
)41
.0(2
6.1–
74.0
)18
.5(9
.5–4
4.5)
Swol
len
join
tco
unt
10(6
–15)
11(5
–16)
9(4
–13)
13(1
1–16
)0
(0–1
)8
(3–1
4)5
(3–1
5)2
(1–4
)T
ende
rjo
int
coun
t7
(3–1
3)10
(4–1
8)7
(6–1
2)12
(7–1
3)0
(0–3
)6
(1–9
)3
(0–1
5)1
(1–3
)T
hera
py,n
o.(%
)of
patie
nts
DM
AR
Ds
98(8
8)40
(87)
9(1
00)
4(1
00)
4(5
0)10
(90)
6(8
5)3
(30)
NSA
IDs
65(5
8)39
(85)
8(8
9)3
(75)
8(1
00)
3(2
7)4
(57)
7(7
0)C
ortic
oste
roid
s35
(31)
16(3
5)1
(11)
0(0
)0
(0)
2(1
8)1
(9)
0(0
)
*E
xcep
twhe
rein
dica
ted
othe
rwis
e,va
lues
are
the
med
ian
(int
erqu
artil
era
nge)
.RA
�rh
eum
atoi
dar
thri
tis;S
pA�
spon
dyla
rthr
itis;
AC
PA�
anti–
citr
ullin
ated
prot
ein
antib
ody;
PBM
C�
peri
pher
albl
ood
mon
onuc
lear
cell;
RF
�rh
eum
atoi
dfa
ctor
;DA
S28
�D
isea
seA
ctiv
ity
Scor
e28
-join
tas
sess
men
t;N
A�
not
appl
icab
le;V
AS
�vi
sual
anal
ogsc
ale
(0–1
00m
m);
CR
P�
C-r
eact
ive
prot
ein;
ESR
�er
ythr
ocyt
ese
dim
enta
tion
rate
;DM
AR
Ds
�di
seas
e-m
odify
ing
antir
heum
atic
drug
s;N
SAID
s�
nons
tero
idal
antii
nfla
mm
ator
ydr
ugs.
SYNOVIAL T CELL REPERTOIRE ALTERATIONS IN ACPA-POSITIVE RA 1947

al: unpublished observations). V� families not reaching thisquantitative threshold were excluded from the CDR3 LDanalysis in order to avoid false-positive high levels of CDR3LD alterations. All V� families passing this quantitative check-point were analyzed by classic spectratyping for the TCRlength distribution: the percentage alteration of each V� familywas calculated (area under the curve) as the deviation from theexpected Gaussian profile for polyclonal T cells.
Subsequently, the results were analyzed by V� family,or the values of all V� families were integrated by taking theaverage of the percentage alteration of each V� family for thatsample, resulting in a single value (global percentage alter-ation) for each sample. CDR3 LD was analyzed either contin-uously or dichotomously, using a 25% alteration as the cutofflevel (�25% versus �25%) (27). Combined CDR3 LD alter-ations for each V� family and the quantitative data for theV�-to-HPRT ratio were represented in integrated landscapes,which are referred to as TcLandscape (Figure 1).
Cloning and sequencing of the V� TCR rearrange-ments. PCRs were performed using specific V�–J� primers in a50-�l volume containing 1 unit of Herculase II fusion DNApolymerase (Stratagene, Madison, WI) in the supplier’s bufferand following the manufacturer’s instructions for the cyclingconditions. PCR amplification products were visualized bymigration on agarose gels, and the PCR products were thencloned in pCR2.1 vector using a TOPO TA cloning kit(Invitrogen). For sequencing purposes, PCR was conducteddirectly on TOP 10 Escherichia coli colonies (Invitrogen) asrecommended by the manufacturer. Sequencing reactionswere conducted directly on these products using universalprimers and T7 promoter. Sequences corresponding to theCDR3 region were extracted and analyzed.
Immunoglobulin VH gene sequencing. Analysis of theIg VH gene was performed as described elsewhere (37,43). IgVH and VDJ genes were amplified by PCR and ligated into thepGEM-T vector (Promega, Madison, WI) and transfected intoEscherichia coli DH5�. The double-stranded DNA templatefrom the colonies containing VH gene inserts was sequenced
(MCLab, South San Francisco, CA). A mucosal B cell lym-phoma and peripheral blood cells from a healthy individualwere used as positive and negative controls, respectively.
Statistical analysis. Clinical and histologic data werenot normally distributed and are expressed as the median andinterquartile range and were analyzed with the Mann-WhitneyU test. The CDR3 LD and the V�-to-C� ratio passed the testsfor normality, and the results are represented as the mean �SD; these values were analyzed with Student’s unpaired orpaired 2-sided t-tests. Dichotomous data were analyzed usingFisher’s exact test. P values less than 0.05 were consideredsignificant.
RESULTS
Similar systemic disease activity in ACPA� andACPA– RA patients. Since the aim of our study was todetect qualitative differences in T cell involvement inACPA� versus ACPA– RA, we first investigatedwhether the 2 groups were similar in terms of diseaseactivity. We studied a cross-sectional cohort of 158patients with active RA who had not been treated withbiologic agents; 112 were ACPA� and 46 were ACPA–.The age and sex distributions were similar in the 2groups, but the disease duration was shorter in theACPA– group (P � 0.027) (Table 1). Disease activitywas similar in the 2 groups. Similarly, there were nosignificant differences in the patient’s assessment ofglobal disease activity (by visual analog scale), erythro-cyte sedimentation rate, serum levels of C-reactive pro-tein, or swollen joint count. The tender joint count waslower in the ACPA� RA patients (P � 0.04). There wasno difference in treatment regimens between the 2
Table 2. Comparison of histologic features of RA synovial tissue samples analyzed by 2 differentmethods, by ACPA status*
RA samples scoredsemiquantitatively (n � 54)†
RA samples scoredquantitatively (n � 104)‡
ACPA�(n � 37)
ACPA�(n � 17)
ACPA�(n � 71)
ACPA�(n � 33)
Cellular infiltration 1.8 (1.0–2.0) 2.0 (1.0–2.0) NA NAVascularization 1.5 (1.0–2.0) 1.0 (1.0–2.0) NA NALining layer thickness 1.0 (1.0–1.5) 1.0 (1.0–2.0) NA NAT lymphocytes 1.5 (1.0–2.0) 1.5 (0.3–2.0) 103 (40–302) 84 (30–239)B lymphocytes 1.0 (0.0–2.0) 0.8 (0.0–2.0) 37 (17–87) 43 (18–43)Plasma cells 0.0 (0.0–1.0) 1.2 (0.5–2.0) 259 (72–2,109) 377 (71–2,361)
* Anti–citrullinated protein antibody (ACPA) was determined with the use of an anti-CCP2 kit. Thediagnostic cutoff value for defining positivity was 25 units/ml. Differences between the ACPA� andACPA� groups were not significant, as determined by Mann-Whitney U test. NA � not available.† Histologic features of rheumatoid arthritis (RA) synovial tissue samples were scored semiquantitativelyon a 4-point scale (range 0–3) by 2 independent observers. Values are the median (range).‡ Histologic features of RA synovial tissue samples were assessed quantitatively by digital image analysis(see Patients and Methods for details). Values are the median (range) per mm2.
1948 CANTAERT ET AL
groups. These data confirm that clinical disease activityis similar in ACPA� and ACPA– RA patients, even ifthe former subset has a worse prognosis in terms ofstructural damage (15,16).
Similar levels of inflammation and T cell infil-tration in ACPA� and ACPA– RA synovitis. In order toascertain whether local disease activity in the joint ofinterest was also similar in the 2 RA subsets, we per-formed histologic analyses of the synovial tissue biopsysamples. Assessment of 54 RA synovial tissue samples,consisting of 37 ACPA� and 17 ACPA– samples, re-vealed no differences in intimal lining layer hyperplasia,degree of vascularization, and global cellular infiltration(Table 2). There was no difference in the number ofinfiltrating CD3� T cells, CD20� B cells, and CD138�plasma cells (Table 2).
Since these data conflicted with those in a recentreport demonstrating increased T cell infiltration in RA
patients with ACPA� synovitis (44), we also analyzedthe lymphocytic cell infiltrate in 104 RA samples, usingdifferent antibodies in order to exclude technical biasesand using digital image analysis for scoring in order toincrease the sensitivity for detecting small differences(39). In this independent set of tissue samples, there wasno significant difference in the presence of CD3� Tcells, CD22� B cells, or CD38� plasma cells betweenthe 2 groups (Table 2). This extensive study indicatesthat, with the exception of synovial lymphoid neogenesis,the global synovial tissue architecture as well as theinfiltration by T lymphocytes and B lymphocytes iscomparable in ACPA� and ACPA– RA patients.
Marked alterations in CDR3 LD in RA patientswith ACPA� synovitis. We analyzed synovial tissuebiopsy samples obtained from the actively inflamed kneejoints of RA patients by the combined quantitative andqualitative TcLandscape technology. To avoid false-
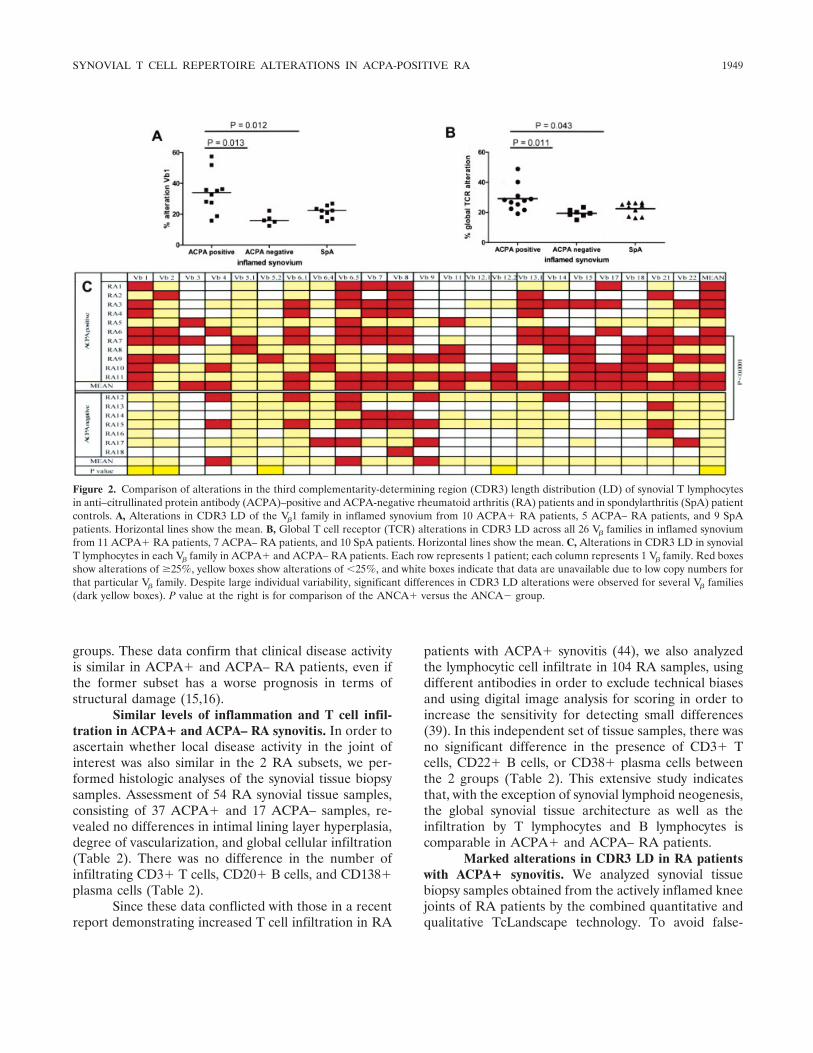
Figure 2. Comparison of alterations in the third complementarity-determining region (CDR3) length distribution (LD) of synovial T lymphocytesin anti–citrullinated protein antibody (ACPA)–positive and ACPA-negative rheumatoid arthritis (RA) patients and in spondylarthritis (SpA) patientcontrols. A, Alterations in CDR3 LD of the V�1 family in inflamed synovium from 10 ACPA� RA patients, 5 ACPA– RA patients, and 9 SpApatients. Horizontal lines show the mean. B, Global T cell receptor (TCR) alterations in CDR3 LD across all 26 V� families in inflamed synoviumfrom 11 ACPA� RA patients, 7 ACPA– RA patients, and 10 SpA patients. Horizontal lines show the mean. C, Alterations in CDR3 LD in synovialT lymphocytes in each V� family in ACPA� and ACPA– RA patients. Each row represents 1 patient; each column represents 1 V� family. Red boxesshow alterations of �25%, yellow boxes show alterations of �25%, and white boxes indicate that data are unavailable due to low copy numbers forthat particular V� family. Despite large individual variability, significant differences in CDR3 LD alterations were observed for several V� families(dark yellow boxes). P value at the right is for comparison of the ANCA� versus the ANCA� group.
SYNOVIAL T CELL REPERTOIRE ALTERATIONS IN ACPA-POSITIVE RA 1949

positive clonal alterations that can be observed withclassic spectratyping, CDR3 LD alterations were ex-cluded if quantitative analysis showed that the cDNAcopy number was below the threshold for CDR3 LDanalysis.
Although all V� families were clearly expressedby peripheral blood T cells, the cDNA copy numbers forV�13.5, V�16, V�23, and V�24 were below the thresholdfor CDR3 LD analysis in all synovial tissue specimens.Other V� families with low numbers of transcripts variedbetween individual patients (Figure 2C, white boxes).
For each V� family, we separately calculated thepercentage alteration as the deviation from Gaussiandistribution (Figure 1). Qualitative analysis of V� fami-lies with sufficient transcript numbers showed that theCDR3 LD alterations were significantly higher in theACPA� RA patients than in the ACPA– RA patientsfor V�1, V�2, V�5.2, and V�12.2, with a similar trend forV�6.1, V�11, V�17, and V�18 (Figures 2A and C). Whenthe values for the different V� families per sample wereintegrated by calculating the mean alteration, the globalLD alteration was significantly higher in ACPA� than inACPA– RA samples (mean � SD 29.1 � 8.6% versus19.5 � 4.6%; P � 0.011) (Figures 2B and C). Accord-ingly, 54% of the V� families in the ACPA� samples hada CDR3 LD alteration of �25%, as compared with only26% of the V� families in the ACPA– samples (P �0.001) (Figure 2C).
To confirm the specificity of the restricted CDR3repertoire in ACPA� RA patients, we compared sam-ples from ACPA� RA patients with those from SpApatients (arthritis controls). Although there was nodifference in CDR3 LD alterations of synovial tissue Tcells between the pooled RA cohort and the SpApatients, the CDR3 LD alterations were significantlyhigher in the ACPA�, but not the ACPA–, RA patientsthan in the SpA patients (29.1 � 8.6% versus 22.6 �4.2%; P � 0.043) (Figure 2B). Dichotomous analysis(�25% alteration versus �25% alteration) showed thatthe number of V� families with strong clonal alterationswas higher in ACPA�, but not ACPA–, RA patientsthan in SpA patients (54% versus 33%; P � 0.001)(Figure 2C).
Moreover, subgrouping the RA patients accord-ing to rheumatoid factor (RF) status (positive andnegative) did not reveal any differences in CDR3 LDalterations (26.8 � 8.3% versus 23.1 � 8.5%; P � 0.37).Stratification for RF positivity in both the ACPA� andthe ACPA– groups did not show any significant differ-ences, indicating that the presence of RF is not influ-encing the observed CDR3 LD alterations.
Taken together, these data indicate a marked andspecific increase in TCR CDR3 LD alterations in theinflamed synovial tissue of ACPA� RA patients ascompared with the ACPA– RA patients as well as withthe SpA arthritis controls.
Specificity of TCR CDR3 LD alterations forinflamed synovium in ACPA� RA patients. RA is asystemic disease, with the synovial tissue as its primarytarget. Studies in organ-specific immune-mediated in-flammatory diseases (27,42) demonstrated that specificalterations of the CDR3 LD can be observed in theperipheral blood compartment. However, we could notdetect such alterations in RA peripheral blood T cells.First, the degree of CDR3 LD alteration was signifi-cantly lower in peripheral blood T cells than in synovialtissue in both RA patients (16.0 � 3.7% versus 25.4 �8.3%; P � 0.001) and SpA patients, who served aschronic arthritic disease controls (13.9 � 2.3% versus22.6 � 4.2%; P � 0.001) (Figure 3A). Furthermore, RAperipheral blood T cells showed a pattern of CDR3 LDsimilar to that in peripheral blood T cells from SpAcontrols and from age-matched healthy controls (Figure3A), indicating that in arthritic diseases in general and inRA in particular, T cell clonal alterations are morepronounced in the primary target organ of the disease.
Second, there was no difference in the CDR3 LDglobal alteration in peripheral blood T cells fromACPA� versus ACPA– RA patients (16.6 � 3.5%versus 14.6 � 4.1%) (Figure 3B). Accordingly, there wasno difference in the number of V� families with a CDR3LD deviation of �25% between ACPA� and ACPA–RA patients (10.3% versus 9.5%). Comparison of theCDR3 LD alteration in paired samples of peripheralblood and synovial tissue T cells from 5 RA patients (3ACPA� and 2 ACPA–) indicated that, whereas most V�
families displayed a much higher CDR3 LD alteration inthe synovium than in the blood, some specific V� familieshad a lower degree of CDR3 LD alteration in theinflamed joint (Figures 3C and D).
These data demonstrate that T cell populationsin the inflamed synovium are not merely a reflection ofbystander infiltration of peripheral blood T cells, butrather, they indicate a selective recruitment and/or localexpansion of specific T cell clones in ACPA� RA.
Characterization of the oligoclonal T cell popu-lation in ACPA� RA synovitis. Since the difference inCDR3 LD we observed in ACPA� versus ACPA– RAsynovial T cells supports a distinct role of synovial T cellsin the pathogenesis of ACPA� RA, we characterizedthese synovial T cells in terms of clonality and clonalsize. To confirm that the alterations in TCR CDR3 LD
1950 CANTAERT ET AL

found in specific V� families resulted from genuineoligoclonal alterations, we performed an additionalspectratyping analysis of the J� gene segments of 9strongly altered synovial V� families (3 from ACPA�RA, 4 from ACPA– RA, and 2 from SpA patients). AllV� families depicting high levels of CDR3 LD alterationalso showed discrete usage of J� segments. We thensequenced the V–J regions in 3 RA and 3 SpA patientswho had highly altered J� frequency distributions. Allsamples analyzed (n � 6) displayed oligoclonal or mono-clonal expansions; 3 examples are illustrated in Figure4A. These data demonstrate that the observed alter-ations in CDR3 LD, as measured by TcLandscapetechnology, identify true monoclonal and oligoclonal Tcell expansions in the synovial tissue.
To assess the preferential alteration of specific V�
families and their clonal size, we calculated the numberof transcripts for each V� family as a function of the totalnumber of C� transcripts for each sample. Pronouncedclonal alterations were not restricted to a particularfamily, either in a single sample or across samples fromdifferent patients (Figure 2C). Analysis of the ratio of V�
to C� for each V� family showed a quantitatively similar
V� usage in ACPA� and ACPA– RA synovitis as well asin SpA synovitis (Figure 4B). Comparison of the ratio ofV� to C� for each separate V� family between ACPA�RA synovial samples with and without a high degree ofCDR3 LD alterations did not show quantitative expan-sion in samples with qualitative alterations, except forthe V�6.5 family (mean V�-to-C� ratio 0.049 in sampleswith �25% alteration versus 0.028 in samples with�25% alterations; P � 0.019). Taken together, thesedata confirm the qualitative clonal alterations inACPA� synovitis but suggest that they are not paral-leled by marked quantitative expansions of the clonal Tcell size.
TCR CDR3 LD alterations in ACPA� RA are notdriven by ectopic lymphoid neogenesis. Since our dataindicated distinct T cell clonal alterations in ACPA�RA as compared with ACPA– RA, we explored arelationship with B cell autoimmunity in the inflamedsynovium. Although difficult to assess in human trans-lational studies, we approached this question by exten-sive sequencing of Ig VH genes in 8 RA synovial tissuesamples (4 from ACPA� patients and 4 from ACPA–patients). Although single and dual expansions of B cell
Figure 3. A, Comparison of global T cell receptor (TCR) alterations in the third complementarity-determiningregion (CDR3) length distribution (LD) in peripheral blood mononuclear cells (PBMCs) from healthy control(HC) subjects and in PBMCs and synovial tissues (ST) from rheumatoid arthritis (RA) patients andspondylarthritis (SpA) patient controls. Each symbol represents a single subject. Horizontal lines show the mean.B, Comparison of global TCR alterations in CDR3 LD in peripheral blood T cells from anti–citrullinated proteinantibody (ACPA)–positive and ACPA-negative RA patients. Each symbol represents a single subject. Horizontallines show the mean. C and D, Direct comparison of TCR alterations in CDR3 LD in T cells from the synoviumand peripheral blood from a single ACPA� (C) and a single ACPA– (D) RA patient. Each line represents asingle V� family.
SYNOVIAL T CELL REPERTOIRE ALTERATIONS IN ACPA-POSITIVE RA 1951

clones were observed in 4 and 3 samples, respectively,there was no correlation with TCR CDR3 LD alter-ations (data not shown).
Since direct interactions between antigen-specificT and B lymphocytes and the resulting clonal expansionsmay be facilitated by a dedicated microarchitecture inthe inflamed tissue, we explored the relationship be-tween T cell clonal alterations and synovial lymphoidneogenesis. The degree of TCR CDR3 LD alterationstended to be similar in SpA samples with versus thosewithout synovial lymphoid neogenesis (P � 0.117). Thisrelationship was reversed in RA: the degree of TCRCDR3 LD alterations was significantly higher in RAsamples without ectopic lymphoid neogenesis (mean �SD 31.0 � 9.3%) than in samples with ectopic lymphoidneogenesis (19.6 � 2.4%) (P � 0.005). Accordingly, in
the total RA cohort used for histologic analysis, synoviallymphoid neogenesis was less frequently observed insamples from ACPA� patients (25 of 113 [22%]) than inthose from ACPA� patients (21 of 44 [48%]; P �0.031).
DISCUSSION
Based on their association with HLA–DRB1alleles, T cells have been proposed to play a pivotal rolein the pathogenesis of RA and have been the subject ofextensive molecular analyses during the 1990s. Thesestudies have provided a number of crucial insights. First,both the V� usage and the T cell clonality appeared to beskewed in RA (45). Second, this skewing is a primaryevent, rather than merely a consequence of inflamma-
Figure 4. A, Direct sequencing of the T cell receptor of specific V�–J� families that showed a high degree of alterationof the third complementarity-determining region (CDR3) length distribution (LD), as identified by TcLandscapeanalysis of inflamed synovial tissues from anti–citrullinated protein antibody (ACPA)–positive and ACPA-negativerheumatoid arthritis (RA) patients and from spondylarthritis (SpA) patient controls. Shown are RNA and proteinsequences in the CDR3 of representative samples from an ACPA� RA patient (V�4–J�2.2), an ACPA-negative RApatient (V�21–J�2.5), and an SpA patient control (V�9–J�1.5). The monoclonal and biclonal patterns confirm that thealterations in CDR3 LD, as measured by the TcLandscape technology, identify true clonal expansions. Numbers at theright are the number of clones with the sequence/the number analyzed. B, Relative usage of different V� families by Tcells from the synovium of ACPA� RA (n � 11), ACPA� RA (n � 7), and SpA (n � 10) patients. Relative usage wascalculated by dividing the number of transcripts for each V� family by the total number of C� transcripts in each patient.
1952 CANTAERT ET AL
tion, since the unaffected siblings of RA patients alsodisplay expanded T cell clonotypes (46,47). Third, al-though alterations have been noted in the peripheralcompartment (48), they are more pronounced in thejoint, are similar in different joints in the same patient,and are stable over time (49,50). Finally, the ability totransfer disease to SCID mice by injection of RAsynovial T lymphocytes suggests a pathogenic role forthese cells (51). Further translation of these featuresinto mechanisms of disease has been hampered by thehigh degree of heterogeneity between patients, thepotential biases related to the origin of the samples, andthe technical constraints, such as false-positive spectra-typing results due to low numbers of transcripts.
In the present study, we combined state-of-the-art synovial biopsy sampling and integrated quantitativeand qualitative analysis of CDR3 length distribution torevisit the role of T cells in RA synovitis in the context ofthe novel hypothesis that ACPA� and ACPA– RA maybe distinct pathologic entities. This approach allowedthe confirmation of a number of essential findings, suchas the skewing of V� usage and the preferential clonalalteration in the synovial versus the peripheral compart-ment, and revealed new features. The use of an appro-priate inflammatory control demonstrated that synovialTCR alterations are not RA-specific but are also foundin other chronic inflammatory joint diseases. The majornovel finding of our study is that T cell clonal alterationspresent in the inflamed RA synovium are significantlyincreased in ACPA� versus ACPA– RA. This increasewas specific for ACPA� RA, since it was confirmed bycomparison with SpA synovitis. Furthermore, RF posi-tivity did not influence the observed difference in CDR3LD alterations. The CDR3 LD alteration is specific forsynovial T cells, since we did not detect elevated levels ofCDR3 LD alterations in peripheral blood T cells fromACPA� RA patients. These data support at the molec-ular level the novel concept that ACPA� and ACPA–RA patients have distinct pathophysiologic features, andour data suggest the preferential involvement of T cellsin ACPA� RA patients.
One of the first questions raised by this observa-tion is which T cell subset harbors these clonal alter-ations? In this study, we analyzed unselected synovial Tcells, since isolation of T cells from synovial tissue eitherby interleukin-2–driven expansion or by extraction withenzymatic agents induces severe biases in the T cell poolor phenotype markers. Previous studies have demon-strated that naive T cells are undetectable in synovialtissue and that most synovial T cells are memory T cells(52). On the other hand, the data on CD4 versus CD8
clonal alterations in RA are in conflict: the most prom-inent clonal expansions are often found in the CD8�populations in RA (53) as well other pathologic condi-tions (27,42), whereas other studies have demonstratedclear clonal alterations in the CD4� populations(47,50,54).
A related question is what is the origin of theseclonal alterations? The most accepted concept is that thepresence of synovial T cell expansions reflects activationand/or proliferation in response to a local antigen (54–56). This would be consistent with our finding that theprofiles identified in synovium are not merely a reflec-tion of peripheral blood alterations, as well as with ourprevious demonstrations of HLA–DRB–restricted pre-sentation of autoantigens in RA synovitis (17–19).
The hypothesis that synovial T cell expansionsarise in response to local antigen raises a number ofadditional issues. First, the exact nature of the antigensthat drive this process is unknown. Moreover, the spe-cific presence of these TCR alterations in ACPA� RAsynovitis does not necessarily imply that the antigenshould be citrullinated (3,20–22).
Second, the strong association between ACPA�RA and HLA–DRB1 alleles does not allow for deter-mining the extent to which the TCR repertoire restric-tion is shaped by the DRB-restricted antigen or by theclass II molecule itself (55). It has been reported thatHLA–DR4� healthy control subjects do not differ fromHLA–DR4– healthy controls in terms of the size ofclonal expansions or the families that were expanded,but the unaffected siblings of RA patients displayedclonal CD4� T cell specificities (47), which suggests thatthe TCR repertoire may be intrinsically shaped by thebroader genetic background (46,57).
Third, we previously showed low numbers ofKi-67� lymphocytes in synovial tissue, which is evidenceagainst strong local proliferation (27). The T cells couldhave proliferated in the secondary lymphoid organs andthen migrated to the synovium, where they accumulated.A most intriguing finding is that not only antigen-drivenproliferation, but also homeostatic proliferation, leads toa marked contraction of the T cell repertoire (58).
The recent development of a novel microarray-based method of monitoring the TCR repertoire at thesingle-clone level (59) will enable us to test the hypothe-sis that homeostatic proliferation can lead to contractionof the T cell repertoire. This implies that not only thepresence, but also the absence, of specific TCR reactiv-ities may be relevant to the disease process and, thus,that the mere presence of clonal TCR alterations is notitself an argument in favor of T cell–directed therapies.
SYNOVIAL T CELL REPERTOIRE ALTERATIONS IN ACPA-POSITIVE RA 1953
Our observation raises the question of whether Tcells are directly involved in the ACPA response. Asindicated, the hypothesis that T cells recognizing citrul-linated antigens provide help to autoreactive, ACPA-specific B cells needs further confirmation (20–22).Alternatively, the T cells could react to a noncitrulli-nated epitope included in the protein complex that isrecognized by ACPA� B cells (3). However, our trans-lational approach did not allow us to detect a clearrelationship between TCR CDR3 LD alterations andclonal B cell expansions in rheumatoid synovium. Incontrast, our data provide evidence against the conceptthat ectopic lymphoid neogenesis contributes to thisprocess by facilitating T cell–B cell interactions since, incontrast to SpA, the degree of TCR alteration was lowerin RA samples with than in RA samples without theclear formation of lymphoid aggregates. This observa-tion is consistent with our recent reports that synovialectopic lymphoid neogenesis does not determine hu-moral autoimmunity in RA (27,60) and even supportsthe concept that this specific microarchitecture is asso-ciated with a better preservation of the T cell diversity inthe inflamed synovium.
In conclusion, the findings of our study indicatethat the T cell repertoire is specifically restricted inpatients with ACPA� RA synovitis. Whereas the originand role of these clonal alterations remain to be deter-mined, these data suggest the preferential involvementof T lymphocytes in ACPA-seropositive RA.
AUTHOR CONTRIBUTIONS
All authors were involved in drafting the article or revising itcritically for important intellectual content, and all authors approvedthe final version to be published. Dr. Baeten had full access to all of thedata in the study and takes responsibility for the integrity of the dataand the accuracy of the data analysis.Study conception and design. Cantaert, Baeten.Acquisition of data. Cantaert, Thurlings, Pallier, Braud, de Vries,Baeten.Analysis and interpretation of data. Cantaert, Brouard, Pallier, Sali-nas, Klarenbeek, de Vries, Zhang, Soulillou, Tak, Baeten.
REFERENCES
1. Girbal-Neuhauser E, Durieux JJ, Arnaud M, Dalbon P, Sebbag M,Vincent C, et al. The epitopes targeted by the rheumatoidarthritis-associated antifilaggrin autoantibodies are posttransla-tionally generated on various sites of (pro)filaggrin by deiminationof arginine residues. J Immunol 1999;162:585–94.
2. Schellekens GA, de Jong BA, van den Hoogen FH, van de PutteLB, van Venrooij WJ. Citrulline is an essential constituent ofantigenic determinants recognized by rheumatoid arthritis-specificautoantibodies. J Clin Invest 1998;101:273–81.
3. Cantaert T, De Rycke L, Bongartz T, Matteson EL, Tak PP,Nicholas AP, et al. Citrullinated proteins in rheumatoid arthritis:
crucial. . .but not sufficient! [review]. Arthritis Rheum 2006;54:3381–9.
4. Klareskog L, Ronnelid J, Lundberg K, Padyukov L, Alfredsson L.Immunity to citrullinated proteins in rheumatoid arthritis. AnnuRev Immunol 2008;26:651–75.
5. Huizinga TW, Amos CI, van der Helm-van Mil AH, Chen W, vanGaalen FA, Jawaheer D, et al. Refining the complex rheumatoidarthritis phenotype based on specificity of the HLA–DRB1 sharedepitope for antibodies to citrullinated proteins. Arthritis Rheum2005;52:3433–8.
6. Plenge RM, Padyukov L, Remmers EF, Purcell S, Lee AT,Karlson EW, et al. Replication of putative candidate-gene associ-ations with rheumatoid arthritis in �4,000 samples from NorthAmerica and Sweden: association of susceptibility with PTPN22,CTLA4, and PADI4. Am J Hum Genet 2005;77:1044–60.
7. Sigurdsson S, Padyukov L, Kurreeman FA, Liljedahl U, WimanAC, Alfredsson L, et al. Association of a haplotype in thepromoter region of the interferon regulatory factor 5 gene withrheumatoid arthritis. Arthritis Rheum 2007;56:2202–10.
8. Klareskog L, Stolt P, Lundberg K, Kallberg H, Bengtsson C,Grunewald J, et al, and the Epidemiological Investigation ofRheumatoid Arthritis Study Group. A new model for an etiologyof rheumatoid arthritis: smoking may trigger HLA–DR (sharedepitope)–restricted immune reactions to autoantigens modified bycitrullination. Arthritis Rheum 2006;54:38–46.
9. Linn-Rasker SP, van der Helm-van Mil AH, van Gaalen FA,Kloppenburg M, de Vries RR, le Cessie S, et al. Smoking is a riskfactor for anti-CCP antibodies only in rheumatoid arthritis pa-tients who carry HLA-DRB1 shared epitope alleles. Ann RheumDis 2006;65:366–71.
10. Xue Y, Zhang J, Chen YM, Guan M, Zheng SG, Zou HJ. TheHLA-DRB1 shared epitope is not associated with antibodiesagainst cyclic citrullinated peptide in Chinese patients with rheu-matoid arthritis. Scand J Rheumatol 2008;37:183–7.
11. Poor G, Nagy ZB, Schmidt Z, Brozik M, Meretey K, Gergely P Jr.Genetic background of anticyclic citrullinated peptide autoanti-body production in Hungarian patients with rheumatoid arthritis.Ann N Y Acad Sci 2007;1110:23–32.
12. Charpin C, Balandraud N, Guis S, Roudier C, Toussirot E, Rak J,et al. HLA-DRB1*0404 is strongly associated with high titers ofanti-cyclic citrullinated peptide antibodies in rheumatoid arthritis.Clin Exp Rheumatol 2008;26:627–31.
13. Lee HS, Irigoyen P, Kern M, Lee A, Batliwalla F, Khalili H, et al.Interaction between smoking, the shared epitope, and anti–cycliccitrullinated peptide: a mixed picture in three large North Amer-ican rheumatoid arthritis cohorts. Arthritis Rheum 2007;56:1745–53.
14. Verpoort KN, Papendrecht-van der Voort EA, van der Helm-vanMil AH, Jol-van der Zijde CM, van Tol MJ, Drijfhout JW, et al.Association of smoking with the constitution of the anti–cycliccitrullinated peptide response in the absence of HLA–DRB1shared epitope alleles. Arthritis Rheum 2007;56:2913–8.
15. De Rycke L, Peene I, Hoffman IE, Kruithof E, Union A, DrijfhoutJW, et al. Rheumatoid factor and anticitrullinated protein anti-bodies in rheumatoid arthritis: diagnostic value, associations withradiological progression rate, and extra-articular manifestations.Ann Rheum Dis 2004;63:1587–93.
16. Ronnelid J, Wick MC, Lampa J, Lindblad S, Nordmark B,Klareskog L, et al. Longitudinal analysis of citrullinated protein/peptide antibodies (anti-CP) during 5 year follow up in earlyrheumatoid arthritis: anti-CP status predicts worse disease activityand greater radiological progression. Ann Rheum Dis 2005;64:1744–9.
17. Steenbakkers PG, Baeten D, Rovers E, Veys EM, Rijnders AW,Meijerink J, et al. Localization of MHC class II/human cartilageglycoprotein-39 complexes in synovia of rheumatoid arthritis pa-
1954 CANTAERT ET AL
tients using complex-specific monoclonal antibodies. J Immunol2003;170:5719–27.
18. Baeten D, Steenbakkers PG, Rijnders AM, Boots AM, Veys EM,De Keyser F. Detection of major histocompatibility complex/human cartilage gp-39 complexes in rheumatoid arthritis synovitisas a specific and independent histologic marker. Arthritis Rheum2004;50:444–51.
19. Van Lierop MJ, den Hoed L, Houbiers J, Vencovsky J, RuzickovaS, Krystufkova O, et al. Endogenous HLA–DR–restricted presen-tation of the cartilage antigens human cartilage gp-39 and mela-noma inhibitory activity in the inflamed rheumatoid joint. ArthritisRheum 2007;56:2150–9.
20. Hill JA, Southwood S, Sette A, Jevnikar AM, Bell DA, Cairns E.Cutting edge: the conversion of arginine to citrulline allows for ahigh-affinity peptide interaction with the rheumatoid arthritis-associated HLA-DRB1*0401 MHC class II molecule. J Immunol2003;171:538–41.
21. Hill JA, Bell DA, Brintnell W, Yue D, Wehrli B, Jevnikar AM, etal. Arthritis induced by posttranslationally modified (citrullinated)fibrinogen in DR4-IE transgenic mice. J Exp Med 2008;205:967–79.
22. Auger I, Sebbag M, Vincent C, Balandraud N, Guis S, Nogueira L,et al. Influence of HLA–DR genes on the production of rheuma-toid arthritis–specific autoantibodies to citrullinated fibrinogen.Arthritis Rheum 2005;52:3424–32.
23. Arstila TP, Casrouge A, Baron V, Even J, Kanellopoulos J,Kourilsky P. A direct estimate of the human �� T cell receptordiversity. Science 1999;286:958–61.
24. Gorski J, Yassai M, Zhu X, Kissela B, Kissela B, Keever C, et al.Circulating T cell repertoire complexity in normal individuals andbone marrow recipients analyzed by CDR3 size spectratyping:correlation with immune status. J Immunol 1994;152:5109–19.
25. Pannetier C, Even J, Kourilsky P. T-cell repertoire diversity andclonal expansions in normal and clinical samples. Immunol Today1995;16:176–81.
26. Gorochov G, Neumann AU, Kereveur A, Parizot C, Li T, KatlamaC, et al. Perturbation of CD4� and CD8� T-cell repertoiresduring progression to AIDS and regulation of the CD4� reper-toire during antiviral therapy. Nat Med 1998;4:215–21.
27. Laplaud DA, Ruiz C, Wiertlewski S, Brouard S, Berthelot L,Guillet M, et al. Blood T-cell receptor � chain transcriptome inmultiple sclerosis. Characterization of the T cells with alteredCDR3 length distribution. Brain 2004;127(Pt 5):981–95.
28. Masson-Bessiere C, Sebbag M, Durieux JJ, Nogueira L, VincentC, Girbal-Neuhauser E, et al. In the rheumatoid pannus, anti-filaggrin autoantibodies are produced by local plasma cells andconstitute a higher proportion of IgG than in synovial fluid andserum. Clin Exp Immunol 2000;119:544–52.
29. Baeten D, Peene I, Union A, Meheus L, Sebbag M, Serre G, et al.Specific presence of intracellular citrullinated proteins in rheuma-toid arthritis synovium: relevance to antifilaggrin autoantibodies.Arthritis Rheum 2001;44:2255–62.
30. Chapuy-Regaud S, Sebbag M, Baeten D, Clavel C, Foulquier C,De Keyser F, et al. Fibrin deimination in synovial tissue is notspecific for rheumatoid arthritis but commonly occurs duringsynovitides. J Immunol 2005;174:5057–64.
31. De Rycke L, Nicholas AP, Cantaert T, Kruithof E, Echols JD,Vandekerckhove B, et al. Synovial intracellular citrullinated pro-teins colocalizing with peptidyl arginine deiminase as pathophysi-ologically relevant antigenic determinants of rheumatoidarthritis–specific humoral autoimmunity. Arthritis Rheum 2005;52:2323–30.
32. Baeten D, Van den Bosch F, Elewaut D, Stuer A, Veys EM, DeKeyser F. Needle arthroscopy of the knee with synovial biopsysampling: technical experience in 150 patients. Clin Rheumatol1999;18:434–41.
33. Arnett FC, Edworthy SM, Bloch DA, McShane DJ, Fries JF,
Cooper NS, et al. The American Rheumatism Association 1987revised criteria for the classification of rheumatoid arthritis.Arthritis Rheum 1988;31:315–24.
34. Dougados M, van der Linden S, Juhlin R, Huitfeldt B, Amor B,Calin A, et al. The European Spondylarthropathy Study Grouppreliminary criteria for the classification of spondylarthropathy.Arthritis Rheum 1991;34:1218–27.
35. Baeten D, Demetter P, Cuvelier C, Van den Bosch F, Kruithof E,Van Damme N, et al. Comparative study of the synovial histologyin rheumatoid arthritis, spondyloarthropathy, and osteoarthritis:influence of disease duration and activity. Ann Rheum Dis 2000;59:945–53.
36. Canete JD, Santiago B, Cantaert T, Sanmarti R, Palacin A, CelisR, et al. Ectopic lymphoid neogenesis in psoriatic arthritis. AnnRheum Dis 2007;66:720–6.
37. Cantaert T, Kolln J, Timmer T, van der Pouw-Kraan TC, Van-dooren B, Thurlings RM, et al. B lymphocyte autoimmunity inrheumatoid synovitis is independent of ectopic lymphoid neogen-esis. J Immunol 2008;181:785–94.
38. Baeten D, Kruithof E, De Rycke L, Vandooren B, Wyns B,Boullart L, et al. Diagnostic classification of spondylarthropathyand rheumatoid arthritis by synovial histopathology: a prospectivestudy in 154 consecutive patients. Arthritis Rheum 2004;50:2931–41.
39. Haringman JJ, Vinkenoog M, Gerlag DM, Smeets TJ, Zwinder-man AH, Tak PP. Reliability of computerized image analysis forthe evaluation of serial synovial biopsies in randomized controlledtrials in rheumatoid arthritis. Arthritis Res Ther 2005;7:R862–7.
40. Guillet M, Brouard S, Gagne K, Sebille F, Cuturi MC, Delsuc MA,et al. Different qualitative and quantitative regulation of V� TCRtranscripts during early acute allograft rejection and toleranceinduction. J Immunol 2002;168:5088–95.
41. Miqueu P, Guillet M, Degauque N, Dore JC, Soulillou JP,Brouard S. Statistical analysis of CDR3 length distributions for theassessment of T and B cell repertoire biases. Mol Immunol2007;44:1057–64.
42. Brouard S, Dupont A, Giral M, Louis S, Lair D, Braudeau C, et al.Operationally tolerant and minimally immunosuppressed kidneyrecipients display strongly altered blood T-cell clonal regulation.Am J Transplant 2005;5:330–40.
43. Da RR, Qin Y, Baeten D, Zhang Y. B cell clonal expansion andsomatic hypermutation of Ig variable heavy chain genes in thesynovial membrane of patients with osteoarthritis. J Immunol2007;178:557–65.
44. Van Oosterhout M, Bajema I, Levarht EW, Toes RE, HuizingaTW, van Laar JM. Differences in synovial tissue infiltrates be-tween anti–cyclic citrullinated peptide–positive rheumatoid arthri-tis and anti–cyclic citrullinated peptide–negative rheumatoid ar-thritis. Arthritis Rheum 2008;58:53–60.
45. Howell MD, Diveley JP, Lundeen KA, Esty A, Winters ST, CarloDJ, et al. Limited T-cell receptor �-chain heterogeneity amonginterleukin 2 receptor-positive synovial T cells suggests a role forsuperantigen in rheumatoid arthritis. Proc Natl Acad Sci U S A1991;88:10921–5.
46. Nanki T, Kohsaka H, Mizushima N, Ollier WE, Carson DA,Miyasaka N. Genetic control of T cell receptor BJ gene expressionin peripheral lymphocytes of normal and rheumatoid arthritismonozygotic twins. J Clin Invest 1996;98:1594–601.
47. Waase I, Kayser C, Carlson PJ, Goronzy JJ, Weyand CM. Oligo-clonal T cell proliferation in patients with rheumatoid arthritis andtheir unaffected siblings. Arthritis Rheum 1996;39:904–13.
48. Goronzy JJ, Bartz-Bazzanella P, Hu W, Jendro MC, Walser-KuntzDR, Weyand CM. Dominant clonotypes in the repertoire ofperipheral CD4� T cells in rheumatoid arthritis. J Clin Invest1994;94:2068–76.
49. Jenkins RN, Nikaein A, Zimmermann A, Meek K, Lipsky PE. T
SYNOVIAL T CELL REPERTOIRE ALTERATIONS IN ACPA-POSITIVE RA 1955
cell receptor V� gene bias in rheumatoid arthritis. J Clin Invest1993;92:2688–701.
50. Rittner HL, Zettl A, Jendro MC, Bartz-Bazzanella P, Goronzy JJ,Weyand CM. Multiple mechanisms support oligoclonal T cellexpansion in rheumatoid synovitis. Mol Med 1997;3:452–65.
51. Mima T, Saeki Y, Ohshima S, Nishimoto N, Matsushita M,Shimizu M, et al. Transfer of rheumatoid arthritis into severecombined immunodeficient mice: the pathogenetic implications ofT cell populations oligoclonally expanding in the rheumatoidjoints. J Clin Invest 1995;96:1746–58.
52. Struyk L, Hawes GE, Dolhain RJ, van Scherpenzeel A, GodthelpB, Breedveld FC, et al. Evidence for selective in vivo expansion ofsynovial tissue-infiltrating CD4� CD45RO� T lymphocytes onthe basis of CDR3 diversity. Int Immunol 1994;6:897–907.
53. Fitzgerald JE, Ricalton NS, Meyer AC, West SG, Kaplan H,Behrendt C, et al. Analysis of clonal CD8� T cell expansions innormal individuals and patients with rheumatoid arthritis. J Im-munol 1995;154:3538–47.
54. Striebich CC, Falta MT, Wang Y, Bill J, Kotzin BL. Selectiveaccumulation of related CD4� T cell clones in the synovial fluid ofpatients with rheumatoid arthritis. J Immunol 1998;161:4428–36.
55. Ikeda Y, Masuko K, Nakai Y, Kato T, Hasanuma T, Yoshino SI,
et al. High frequencies of identical T cell clonotypes in synovialtissues of rheumatoid arthritis patients suggest the occurrence ofcommon antigen-driven immune responses. Arthritis Rheum1996;39:446–53.
56. Li Y, Sun GR, Tumang JR, Crow MK, Friedman SM. CDR3sequence motifs shared by oligoclonal rheumatoid arthritis syno-vial T cells: evidence for an antigen-driven response. J Clin Invest1994;94:2525–31.
57. Goronzy JJ, Zettl A, Weyand CM. T cell receptor repertoire inrheumatoid arthritis. Int Rev Immunol 1998;17:339–63.
58. Jendro MC, Ganten T, Matteson EL, Weyand CM, GoronzyJJ. Emergence of oligoclonal T cell populations following thera-peutic T cell depletion in rheumatoid arthritis. Arthritis Rheum1995;38:1242–51.
59. Bonarius HP, Baas F, Remmerswaal EB, van Lier RA, ten BergeIJ, Tak PP, et al. Monitoring the T-cell receptor repertoire atsingle-clone resolution. PLoS ONE 2006;1:e55.
60. Thurlings RM, Wijbrandts CA, Mebius RE, Cantaert T, DinantHJ, van der Pouw-Krann TC, et al. Synovial lymphoid neogenesisdoes not define a specific clinical rheumatoid arthritis phenotype.Arthritis Rheum 2008;58:1582–9.
1956 CANTAERT ET AL