Synaptic Inputs Compete during Rapid Formation of the Calyx of Held
16
Development/Plasticity/Repair Synaptic Inputs Compete during Rapid Formation of the Calyx of Held: A New Model System for Neural Development Paul S. Holcomb, 1 Brian K. Hoffpauir, 1 Mitchell C. Hoyson, 1 Dakota R. Jackson, 1 Thomas J. Deerinck, 4 Glenn S. Marrs, 1 Marlin Dehoff, 1 Jonathan Wu, 2 Mark H. Ellisman, 4,5 and George A. Spirou 1,2,3 1 Center for Neuroscience, West Virginia University School of Medicine, Morgantown, West Virginia 26506-9303, 2 Department of Otolaryngology, West Virginia University School of Medicine, Morgantown, West Virginia 26506-9303, 3 Department of Physiology and Pharmacology, West Virginia University School of Medicine, Morgantown, West Virginia 26506-9303, 4 National Center for Microscopy and Imaging Research, University of California, San Diego, California 92092-0608, and 5 Department of Neuroscience, University of California, San Diego, California 92092-0608 Hallmark features of neural circuit development include early exuberant innervation followed by competition and pruning to mature innervation topography. Several neural systems, including the neuromuscular junction and climbing fiber innervation of Purkinje cells, are models to study neural development in part because they establish a recognizable endpoint of monoinnervation of their targets and because the presynaptic terminals are large and easily monitored. We demonstrate here that calyx of Held (CH) innervation of its target, which forms a key element of auditory brainstem binaural circuitry, exhibits all of these characteristics. To investigate CH development, we made the first application of serial block-face scanning electron microscopy to neural development with fine temporal resolution and thereby accomplished the first time series for 3D ultrastructural analysis of neural circuit formation. This approach revealed a growth spurt of added apposed surface area (ASA) 200 m 2 /d centered on a single age at postnatal day 3 in mice and an initial rapid phase of growth and competition that resolved to monoinnervation in two-thirds of cells within 3 d. This rapid growth occurred in parallel with an increase in action potential threshold, which may mediate selection of the strongest input as the winning competitor. ASAs of competing inputs were segregated on the cell body surface. These data suggest mechanisms to select “winning” inputs by regional reinforcement of postsynaptic membrane to mediate size and strength of competing synaptic inputs. Introduction The overproduction of synaptic connections and subsequent pruning is a common theme in nervous system development (Purves and Lichtman, 1980). Model systems to study these events include the neuromuscular junction (NMJ; Wu et al., 2010), climbing fiber innervation of Purkinje cells (CF:PC; Wa- tanabe and Kano, 2011), and retinal ganglion cell innervation of the dorsal lateral geniculate nucleus (RGC:dLGN; Hong and Chen, 2011) because nerve terminals are large and easily identi- fied, and because the end point of 1:1 or few-to-one innervation ratio is easily quantified. In each of these systems, innervation begins as contact by multiple small inputs, proceeds through an early competitive stage whereby several inputs strengthen, and completes by final pruning to, in most cases, a single “winning” input. Another neural connection characterized by monoinnervation is the calyx of Held contact with principal cells of the medial nucleus of the trapezoid body (CH:MNTB), but there is uncertainty about the prevalence of competition among synaptic inputs (Hoffpauir et al., 2006; Rodríguez-Contreras et al., 2008) and, therefore, whether it exhibits the hallmark developmental features of other neural systems (Borst and Soria van Hoeve, 2012). This typically mammalian neural connection is part of massive binaural convergence circuitry in the auditory brainstem (Warr, 1972). Light microscopic techniques es- tablished rapid growth of CHs in rats over several days during the first postnatal week (Kandler and Friauf, 1993; Rodríguez-Contreras et al., 2008). In mice, rapid growth in synaptic currents occurred in a narrow temporal window between postnatal day (P) 2 and P4. Both serial section electron microscopy and minimal stimulation physio- logical techniques in brain slices revealed only a small percentage of MNTB neurons innervated by multiple large inputs at P4 (2 of 19, 11%; 4 of 29, 17%, respectively; Hoffpauir et al., 2006). Electrophys- iological counting techniques revealed multiple small inputs onto most cells from late embryonic and younger postnatal ages (Rodríguez-Contreras et al., 2008; Hoffpauir et al., 2010). Therefore, it seems plausible that the CH:MNTB also passes through hallmark developmental stages found in other neural systems. To objectively assay the dynamics of calyx formation, we used an anatomical approach because physiological counting tech- Received March 12, 2013; revised May 24, 2013; accepted June 1, 2013. Author contributions: P.S.H., B.K.H., G.S.M., M.H.E., and G.A.S. designed research; P.S.H., B.K.H., M.H., D.R.J., T.J.D., G.S.M., M.D., J.W., and G.A.S. performed research; P.S.H., B.K.H., M.C.H., D.R.J., G.S.M., J.W., M.H.E., and G.A.S. analyzed data; P.S.H. and G.A.S. wrote the paper. This work was supported by National Institutes of Health (NIH) Grant R01 DC007695 to G.A.S., NIH Grant F32 DC008730 to B.K.H., NIH Grant F32 DC105462 to G.S.M., NIH/National Institute of General Medical Sciences (NIGMS) Grant CoBRE P30 GM103503 to the WVU Center for Neuroscience, and NIH/NIGMS Grant P41 GM103412 to the National Center for Microscopy and Imaging Research. We thank an additional 21 tracers who segmented neurons for 3D reconstruction and analysis, Brian Pope for tissue preparation, and Gerry Hobbs for assistance with statistical analysis. Bill Mallers contributed original scores for videos. We appreciate the insightful comments of two anony- mous reviewers. The authors declare no competing financial interests. Correspondence should be addressed to George A. Spirou, Center for Neuroscience, West Virginia University School of Medicine, One Medical Center Drive, Morgantown, WV 26506-9303. E-mail: [email protected]. DOI:10.1523/JNEUROSCI.1087-13.2013 Copyright © 2013 the authors 0270-6474/13/3312954-16$15.00/0 12954 • The Journal of Neuroscience, August 7, 2013 • 33(32):12954 –12969
Transcript of Synaptic Inputs Compete during Rapid Formation of the Calyx of Held
Development/Plasticity/Repair
Synaptic Inputs Compete during Rapid Formation of theCalyx of Held: A New Model System for Neural Development
Paul S. Holcomb,1 Brian K. Hoffpauir,1 Mitchell C. Hoyson,1 Dakota R. Jackson,1 Thomas J. Deerinck,4 Glenn S. Marrs,1
Marlin Dehoff,1 Jonathan Wu,2 Mark H. Ellisman,4,5 and George A. Spirou1,2,3
1Center for Neuroscience, West Virginia University School of Medicine, Morgantown, West Virginia 26506-9303, 2Department of Otolaryngology, WestVirginia University School of Medicine, Morgantown, West Virginia 26506-9303, 3Department of Physiology and Pharmacology, West Virginia UniversitySchool of Medicine, Morgantown, West Virginia 26506-9303, 4National Center for Microscopy and Imaging Research, University of California, San Diego,California 92092-0608, and 5Department of Neuroscience, University of California, San Diego, California 92092-0608
Hallmark features of neural circuit development include early exuberant innervation followed by competition and pruning to matureinnervation topography. Several neural systems, including the neuromuscular junction and climbing fiber innervation of Purkinje cells,are models to study neural development in part because they establish a recognizable endpoint of monoinnervation of their targets andbecause the presynaptic terminals are large and easily monitored. We demonstrate here that calyx of Held (CH) innervation of its target,which forms a key element of auditory brainstem binaural circuitry, exhibits all of these characteristics. To investigate CH development,we made the first application of serial block-face scanning electron microscopy to neural development with fine temporal resolution andthereby accomplished the first time series for 3D ultrastructural analysis of neural circuit formation. This approach revealed a growthspurt of added apposed surface area (ASA) �200 �m 2/d centered on a single age at postnatal day 3 in mice and an initial rapid phase ofgrowth and competition that resolved to monoinnervation in two-thirds of cells within 3 d. This rapid growth occurred in parallel with anincrease in action potential threshold, which may mediate selection of the strongest input as the winning competitor. ASAs of competinginputs were segregated on the cell body surface. These data suggest mechanisms to select “winning” inputs by regional reinforcement ofpostsynaptic membrane to mediate size and strength of competing synaptic inputs.
IntroductionThe overproduction of synaptic connections and subsequentpruning is a common theme in nervous system development(Purves and Lichtman, 1980). Model systems to study theseevents include the neuromuscular junction (NMJ; Wu et al.,2010), climbing fiber innervation of Purkinje cells (CF:PC; Wa-tanabe and Kano, 2011), and retinal ganglion cell innervation ofthe dorsal lateral geniculate nucleus (RGC:dLGN; Hong andChen, 2011) because nerve terminals are large and easily identi-fied, and because the end point of 1:1 or few-to-one innervationratio is easily quantified. In each of these systems, innervationbegins as contact by multiple small inputs, proceeds through an
early competitive stage whereby several inputs strengthen, andcompletes by final pruning to, in most cases, a single “winning”input.
Another neural connection characterized by monoinnervation isthe calyx of Held contact with principal cells of the medial nucleus ofthe trapezoid body (CH:MNTB), but there is uncertainty about theprevalence of competition among synaptic inputs (Hoffpauir et al.,2006; Rodríguez-Contreras et al., 2008) and, therefore, whether itexhibits the hallmark developmental features of other neural systems(Borst and Soria van Hoeve, 2012). This typically mammalian neuralconnection is part of massive binaural convergence circuitry in theauditory brainstem (Warr, 1972). Light microscopic techniques es-tablished rapid growth of CHs in rats over several days during thefirst postnatal week (Kandler and Friauf, 1993; Rodríguez-Contreraset al., 2008). In mice, rapid growth in synaptic currents occurred in anarrow temporal window between postnatal day (P) 2 and P4. Bothserial section electron microscopy and minimal stimulation physio-logical techniques in brain slices revealed only a small percentage ofMNTB neurons innervated by multiple large inputs at P4 (2 of 19,11%; 4 of 29, 17%, respectively; Hoffpauir et al., 2006). Electrophys-iological counting techniques revealed multiple small inputs ontomost cells from late embryonic and younger postnatal ages(Rodríguez-Contreras et al., 2008; Hoffpauir et al., 2010). Therefore,it seems plausible that the CH:MNTB also passes through hallmarkdevelopmental stages found in other neural systems.
To objectively assay the dynamics of calyx formation, we usedan anatomical approach because physiological counting tech-
Received March 12, 2013; revised May 24, 2013; accepted June 1, 2013.Author contributions: P.S.H., B.K.H., G.S.M., M.H.E., and G.A.S. designed research; P.S.H., B.K.H., M.H., D.R.J.,
T.J.D., G.S.M., M.D., J.W., and G.A.S. performed research; P.S.H., B.K.H., M.C.H., D.R.J., G.S.M., J.W., M.H.E., andG.A.S. analyzed data; P.S.H. and G.A.S. wrote the paper.
This work was supported by National Institutes of Health (NIH) Grant R01 DC007695 to G.A.S., NIH Grant F32DC008730 to B.K.H., NIH Grant F32 DC105462 to G.S.M., NIH/National Institute of General Medical Sciences (NIGMS)Grant CoBRE P30 GM103503 to the WVU Center for Neuroscience, and NIH/NIGMS Grant P41 GM103412 to theNational Center for Microscopy and Imaging Research. We thank an additional 21 tracers who segmented neuronsfor 3D reconstruction and analysis, Brian Pope for tissue preparation, and Gerry Hobbs for assistance with statisticalanalysis. Bill Mallers contributed original scores for videos. We appreciate the insightful comments of two anony-mous reviewers.
The authors declare no competing financial interests.Correspondence should be addressed to George A. Spirou, Center for Neuroscience, West Virginia University
School of Medicine, One Medical Center Drive, Morgantown, WV 26506-9303. E-mail: [email protected]:10.1523/JNEUROSCI.1087-13.2013
Copyright © 2013 the authors 0270-6474/13/3312954-16$15.00/0
12954 • The Journal of Neuroscience, August 7, 2013 • 33(32):12954 –12969
niques provide an underestimate of convergent synaptic inputsdue to sectioning of axons in brain slice preparations. Also, con-vergent inputs may share stimulation thresholds and be unre-solvable. Serial block-face scanning electron microscopy (SBEM)provides high resolution to identify neuronal contacts and accu-rately registers cellular ultrastructure through large tissue vol-umes (Denk and Horstmann, 2004; Briggman et al., 2011). SBEMand related techniques were developed to generate maps of neu-ral circuits, called connectomes, with the eventual objective ofcomparing brains among normal and pathological states (Klein-feld et al., 2011). Here we make the first application of thesetechnologies to the developing brain with fine temporal resolu-tion to reveal changing neural connections across the age rangecritical for calyx growth (P2–P9). We demonstrate early exuber-ant innervation, establish that competition is a common process,and pinpoint P3 as a uniquely active day in CH growth, duringwhich cell apposition areas increase at a rate exceeding 200�m 2/d. These data provide metrics for CH growth dynamicsmore precise than for other model systems and exemplify utilityof the CH:MNTB system for studies of synaptogenesis with rele-vance to other neural systems throughout the brain.
Materials and MethodsEthical approval. All procedures involving animals were approved by theWest Virginia University (WVU) Institutional Animal Care and UseCommittee and were in accordance with policies of the United StatesPublic Health Service.
Animals. A breeding colony of mice (FVB/NJ; The Jackson Laboratory;or FVB/NCr; National Cancer Institute) was maintained within the vi-varium at West Virginia University School of Medicine. Timed pregnan-cies were performed by pairing mice overnight. Assuming fertilizationoccurred around midnight, gestation time was �19 d [embryonic day(E) 0 –E18] with birth typically occurring overnight. Animals werechecked twice daily, so ages denoted herein are accurate to within 12 h.
Tissue processing for SBEM. Unless otherwise indicated, all reagentswere purchased from Sigma-Aldrich. A single mouse of either sex wasused at each age (P2, P3, P4, P6, and P9) with the exception of P2, wherea second mouse was used to check data consistency. This second P2mouse, as well as the P3 and P4 mice, were littermates; the mice used forP6 and P9 were littermates from a separate litter. Key image features werealso compared and were consistent with those from separate animals in adifferent study where serial sections were imaged by transmission elec-tron microscopy (Hoffpauir et al., 2006). Each mouse was anesthetizedand perfused with normal Ringer’s solution containing xylocaine (0.2mg/ml) and heparin (20 U/ml) for 2 min at 35°C followed by 0.15 M
cacodylate buffer containing 2.5% glutaraldehyde (Polysciences), 2%formaldehyde (Fisher Scientific) with 2 mM calcium chloride at 35°C for5 min. Brains were removed from the skull and postfixed for an addi-tional 18 h on ice in the same solution. Brain tissue was cut into 200-�m-thick sections in the coronal plane using a vibratome (Ted Pella) inice-cold 0.15 M cacodylate buffer containing 2 mM calcium chloride, thenwashed for 30 min in the same solution. The MNTB was identified infree-floating sections using a dissecting microscope and the superiorolivary complex containing the MNTB, with surrounding tissue (�1.5 �1.5 mm), was dissected from the tissue. The tissue was photographed andthe location of the MNTB was mapped relative to contours of the brainsurface and cut edges of the tissue block. A solution containing 3% po-tassium ferrocyanide (Electron Microscopy Sciences) in 0.3 M cacodylatebuffer with 4 mM calcium chloride was combined with an equal volumeof 4% aqueous osmium tetroxide and added immediately to the tissue for1 h at room temperature (RT). Tissue was processed sequentially throughfiltered 1% thiocarbohydrazide (Electron Microscopy Sciences; all waterwas nanopure filtered; Nanopure Diamond, Barnstead International) for20 min at RT, 2% osmium for 30 min at RT, and 1% uranyl acetateovernight at 4°C following triple rinses in H2O for 5 min each betweeneach step. Tissue was triple rinsed in H2O at RT for 30 min. A leadaspartate solution was prepared (0.066 g lead nitrate; Electron Micros-
copy Sciences), dissolved in 10 ml of 0.003 M aspartic acid solution, pHadjusted to 5.5 with 1N KOH, warmed in a 60°C oven for 30 min, andfiltered. Sections were placed into filtered lead aspartate solution in the60°C oven for 30 min. The tissue was rinsed five times for 3 min in H2Oand then dehydrated through graded alcohols into acetone and flat-embedded in Durcopan resin (Electron Microscopy Sciences) betweenmylar strips and placed in a 60°C oven for 48 h. Tissue samples werephotographed and shipped to the National Center for Microscopy andImaging Research (University of California San Diego) for imaging. TheMNTB was identified by comparing photographs of tissue before andafter staining.
SBEM imaging. Resin-embedded tissues were mounted on aluminumspecimen pins (Gatan) using cyanoacrylic glue and precision trimmedwith a glass knife to a rectangle �0.5 � 0.75 mm so that tissue wasexposed on all four sides. Silver paint (Ted Pella) was used to electricallyground the edges of the tissue block to the aluminum pin. The entirespecimen was then sputter coated with a thin layer of gold/palladium toenhance conductivity. After the block was faced with a 3View ultrami-crotome unit (Gatan) to remove the top layer of gold/palladium, thetissue morphology became visible by back-scattered electron detectorimaging and the remaining coating on the edges of the block served toreduce charging. A low-magnification image (�500�) was collected toidentify the MNTB and midline and to target the medial MNTB for serialimage collection. Tissue blocks were scanned using a Quanta field emis-sion gun scanning electron microscope (FEI) or a Merlin scanning elec-tron microscope (Zeiss) and sectioned at a thickness of 60 or 40 nm (P9).Accuracy of section thickness was estimated by assuming circularity ofmitochondria and comparing the diameter of longitudinally orientedorganelles with diameters measured in the image plane (Wilke et al.,2013). These values approximated the nominal section thickness (P2,58.4 nm; P3, 55.3 nm; P4, 56.5 nm; P6, 53.2 nm; P9, 35.9 nm). Tissuedimensions and pixel sizes are indicated in Table 1.
Segmentation and three-dimensional reconstruction. Image files wereshipped to WVU for analysis. Cells were segmented, reconstructed, andanalyzed using the IMOD 3D reconstruction and visualization software(Boulder Laboratory for 3-D Electron Microscopy of Cells, University ofColorado, Boulder). Most reconstructions were completed using either aVelocity D55SQ workstation (Xeon X5677 3.46 GHz quad-core proces-sor, 96 GB RAM, 640 GB solid state drive storage, 2.4 TB 15,000 rpmserial attached Small Computer System Interface storage, Linux Red HatEnterprise Release 5.7; Pogo Linux), a Dell Precision T7500 desktopcomputer (Dual Intel Xeon X5687 3.6 GHz quad-core CPUs, 48 GBRAM, 240 GB solid state drive storage, 2.5 TB 15,000 rpm serial attachedSmall Computer System Interface storage, Windows 7 Professional 64-bit operating system; Dell), or a Dell Precision T1500 desktop computer(Intel Core i5–750 2.67 GHz quad-core processor, 16 GB RAM, 600 GBsolid state drive, Windows 7 Professional 64-bit operating system; Dell).Each computer was interfaced to an interactive display drawing tabletand pen (Model DTU-2231, Wacom) for manual segmentation of ob-jects within the tissue volume. Many reconstructions were performed onimage volume subsets on laptop computers running IMOD and inter-faced to a Wacom Bamboo Splash drawing tablet. Neurons were identi-fied within each SBEM dataset and differentiated from glia byultrastructural criteria (Peters et al., 1991). Cells were omitted from trac-ing if a portion of the cell body was truncated by the bounds of the
Table 1. Image volumes and analysisa
Postnatalday
Tissue dimensions(�m)
Pixel size(nm)
Tissue volume(�m 3)
Number of cellsanalyzed
Number of cellsin volume
2 124.8 5.7 965,473 21 713 96 � 84 � 50.2 12.0 404,813 37 374 80 � 80 � 59.9 10.0 383,360 18 186 98 � 78.4 � 68 4.9 522,458 43 439 153.6 � 115.2 � 59.2 4.8 1,047,527 66 66aDimensions are formatted as width � height � depth. Pixel dimensions reported as one side of a square pixel.Cells were considered to be within the volume if all portions of the cell body, nucleus, and identified inputs werecompletely enclosed within the volume. Of the 185 cells analyzed, 57 of these cells were qualitatively determined tohave a single dominant input (P9) and the remaining 128 cells were quantitatively analyzed using ASA.
Holcomb et al. • Synaptic Competition during Calyx of Held Development J. Neurosci., August 7, 2013 • 33(32):12954 –12969 • 12955
dataset, or if a sufficient portion of an input extended outside of the datavolume to prevent its identification as a distinct input. The nucleus, cellbody, and all neural inputs were segmented for 58 cells across tissuesamples from P2 to P6 and dendrites were segmented for 51 of these cells.Reduced quantitative analysis of only input number and size was assessedfor an additional 61 cells across this age range; inputs were tracked toseparate axons and axons were tracked through the image volume. Qual-itative determination of a dominant large input was possible for 57 of the66 cells present in the P9 volume due to the large size of the terminal. Forcells at P9 where a dominant large input was not evident (9 of 66),quantitative analysis of apposed surface area (ASA) was performed. Alarge tracing team (total 28 people) completed the segmentations. Weestablished a ranking process of expert-level and junior-level compe-tency for tracing team members to minimize the two most commontypes of errors in segmentation: (1) missed cellular features because partsof cellular objects (e.g., cell body, neural input) were overlooked or mis-takenly considered not to be connected to an object, or (2) introductionof new features by fusing two different objects resulting from uncertaintyin aligning small-caliber structures (�100 nm) across sections. Experttracers (initially G.A.S. and B.K.H., who completed a previous serialsection EM study of the MNTB; Hoffpauir et al., 2006) were identified bytheir experience and absence of errors during segmentation. Errors incategory 1 were addressed by having expert tracers proof all of the work ofjunior tracers. Category 2 issues were identified during tracing and wereresolved by review with an expert tracer and, if necessary, tracking thequestioned object through the image volume to determine whether it wasa part of a different cell. All junior tracers were instructed to highlightuncertainties in tracking objects across sections for resolution by experttracers. A final check was to examine rendered structures for atypicalfeatures, such as obtuse branching angles or sudden changes in dimen-sion, and reinspect these structures in the image volume. Consistentabsence of these defined errors led to promotion of junior tracers toexpert status. To balance efficiency and accuracy, manual segmentationwas performed on every third section containing each object; compari-sons between traces of every section and every third section yielded adifference of �5% in total surface area. ASAs were traced at the contactbetween each presynaptic input and its postsynaptic partner and meshedusing the IMOD meshing tool, creating a two-dimensional sheet-likesurface. Surface area calculations were accomplished using the imodinfocommand, which calculates the total surface area by summing all of thetriangular areas composing the meshed surface (http://bio3d.colorado.edu/imod/doc/man/imodinfo.html). All binning and ratio calculationswere performed using Microsoft Excel (Microsoft) and graphs were gen-erated using Matlab (The MathWorks).
Electroporation and imaging of acute brain slices. Mouse whole-head orbrainstem slices (250 –350 �m) were generated using a CompresstomeVF-200 tissue cutter (Precisionary Instruments) in ice-cold oxygenatedACSF. Extracellular solution of ACSF consisted of (in mM) the following:125 NaCl2, 2.5 KCl, 1 MgCl2, 2 CaCl2, 25 glucose, 25 NaHCO3, 1.25NaH2PO4, 0.4 ascorbic acid, 3 myo-inositol, and 2 Na-pyruvate, pH 7.3.A total of eight mice aged P3 (7 animals) and P4 (1 animal) were used togenerate brainstem tissue slices for these experiments. Following section-ing, slices were allowed to cool to RT before transfer to an in vitro record-ing chamber, where they were maintained in oxygenated ACSF at 35°C(dual in-line heating units, and a heated stage with an RC-27L tissuechamber and TC-344B temperature control module; Warner Instru-ments) until completion of electroporation labeling (typically �2 h).Constant perfusion of oxygenated ACSF (2 ml/min) was supplied by aValvelink 8 perfusion system (Automate Scientific). All data collectionfor imaging or electrophysiological experiments was complete within 6 hof tissue sectioning.
Focal application of fluorescent markers was accomplished by selec-tive targeting of afferent fiber bundles at the ventral midline and proxi-mal to the MNTB. Afferent fibers and terminals were labeled byelectroporation of Alexa fluorescent dyes (5% in PBS) coupled to dextran(Alexa 488 or 548; Invitrogen). Electroporation pulses of 20 – 40 V weredelivered in sets of 10 pulses at 16 Hz through pipettes of 2–3 M� resis-tance. Stimulation protocols were created and controlled by pClamp 9.2software (Molecular Devices) and administered through an S-940/S-910
stimulus isolation system (Dagan). Pipette guidance and differential in-terference contrast observation of tissue slices was performed with anAxioskop II plus microscope (Zeiss) with a 40� (0.75 numerical aper-ture) dipping lens.
Image stacks (Z-step size 0.7–1.2 �m) were collected using either aZeiss LSM510 confocal microscope or custom-built 2P microscope(Yang et al., 2013). Confocal microscopy was performed using a 20�(0.75 numerical aperture) PLAN NEOFLOUR lens. The 2P system wascomprised of a Verdi-V18 pumped, Mira-HP Ti-Sapphire laser (Coherent)mode-locked at 780 nm, an upright microscope (Moveable Microscope,Sutter Instrument) equipped with a scanner (Cambridge Instruments) and20� (1.0 numerical aperture) PLAN APO dipping lens (Olympus). Imageacquisition was controlled using ScanImage software (Pologruto et al., 2003)operating on a Matlab platform. Images were converted to TIFF format andimported into Imaris (Bitplane) for viewing and qualitative analysis. Imagesof the compressed image stacks were imported into Photoshop (Adobe) forhighlighting and figure creation.
Calcium imaging and electrophysiology. Data are replotted and reana-lyzed from Hoffpauir et al. (2010) and that article should be consulted fordetailed experimental methods. Briefly, for minimal stimulation experi-ments a dual-shaft tungsten microelectrode (FHC) was positioned overtrapezoid body afferent fibers at the ventral midline. Tissue visualizationfor these experiments was performed on the Axioskop II system withconstant ACSF perfusion at 35°C as described above. Connected cellswere identified by evoked calcium signals following loading with Fura-2-AM (Invitrogen). Excitation light at 340 and 380 nm was supplied byrapid filter switching with a Lambda DG-4 system (Sutter Instrument)controlled by HC Image software (Hamamatsu) and images werecaptured at 25 Hz with a Hamamatsu C9100-12 EM-CCD camera. Re-sponsive cells were targeted for whole-cell voltage-clamp recording(Vhold � �70 mV) using a multiclamp 700A microelectrode amplifier,Digidata 1322A digitizer, and CV-7A headstage controlled by pClamp9.2 software (Molecular Devices). Data were acquired at a sampling rateof 50 kHz and low-pass filtered at 6 kHz. Series resistance compensationwas set to at least 70% for all recordings. Internal recording solution forvoltage clamp contained the following (in mM): 114 K-gluconate, 26 KCl,2 MgCl2, 0.1 CaCl2, 1.1 EGTA-Na4, 10 HEPES, 5 Na-phosphocreatine,and 4 ATP-Mg, pH 7.3. Trapezoid body stimuli were varied in 2 V incre-ments from 2 to 40 V. A selected minimal stimulation set was repeatedfour times in a randomized presentation order to circumvent effects ofstimulus order.
Statistical analysis and curve-fitting. The increase in average ASA sizebetween P2 and P6 was assessed using nonparametric tests, since sizedistributions were skewed toward large values and had increasing vari-ability with age. For these reasons, data were transformed so that SDswere identical and the hypothesis that means increased each day from P2to P4 was tested. A Jonckheere–Terpstra test was used to assess overallsignificance and a post hoc test attributed to Hayter-Stone in Hollanderand Wolf (1999) was used to assess differences between individual pairsof means. Other statistical analysis used the t test. Values reported in thetext are mean � SD.
The rate for emergence of dominant, large inputs was determinedusing the following equation:
y � A1 � e�t�2
�
where t is age, � is the time constant, A (100) normalizes the maximum(asymptotic) value to 100%, and (t � 2) shifts the beginning value to P2.
Data for calyx growth were fit to a Boltzmann equation and comparedwith fits for maturation of action potential (AP) firing phenotype and APthreshold to current injection (Hoffpauir et al., 2010):
Y �A1 � A2
1 � et�t1/ 2
k
� A2
where A1 and A2 are the initial and final conditions, respectively, t is age,t1/2 is the age of half-maturation, and k is the slope factor.
12956 • J. Neurosci., August 7, 2013 • 33(32):12954 –12969 Holcomb et al. • Synaptic Competition during Calyx of Held Development
ResultsSBEM is a powerful tool to investigate nervoussystem developmentTo quantify growth dynamics of the CH, resolution of cellularultrastructure was necessary to assay the size and extent of phys-ical contact between nerve terminals and the postsynaptic neu-ron, verify that terminals contained structural elements ofsynapses, and exclude frequent axon-somatic contacts in the de-veloping MNTB that lack synaptic machinery (Hoffpauir et al.,2006). Furthermore, although most cells of the MNTB in miceare considered principal cells, a small percentage of neurons maybe of a different cell type, and not innervated by CHs (Banks andSmith, 1992). We considered that ultrastructural criteria mightbe useful to identify nonprincipal cells at young postnatal agesand exclude them for a more accurate analysis of calyx growthdynamics.
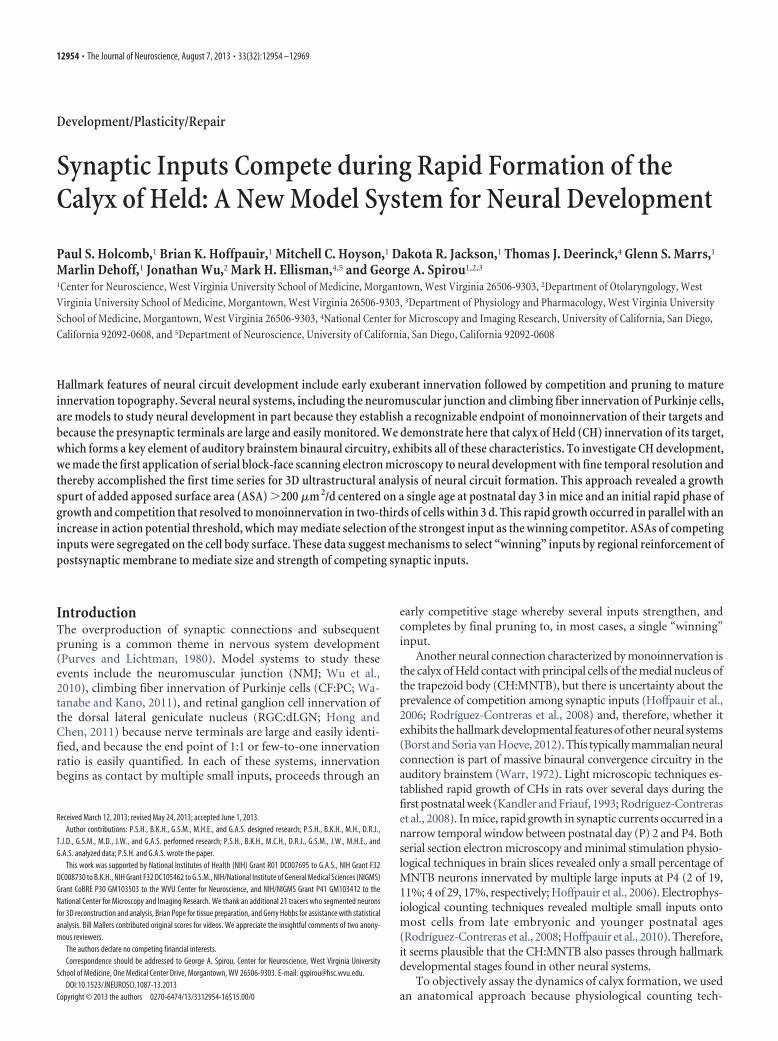
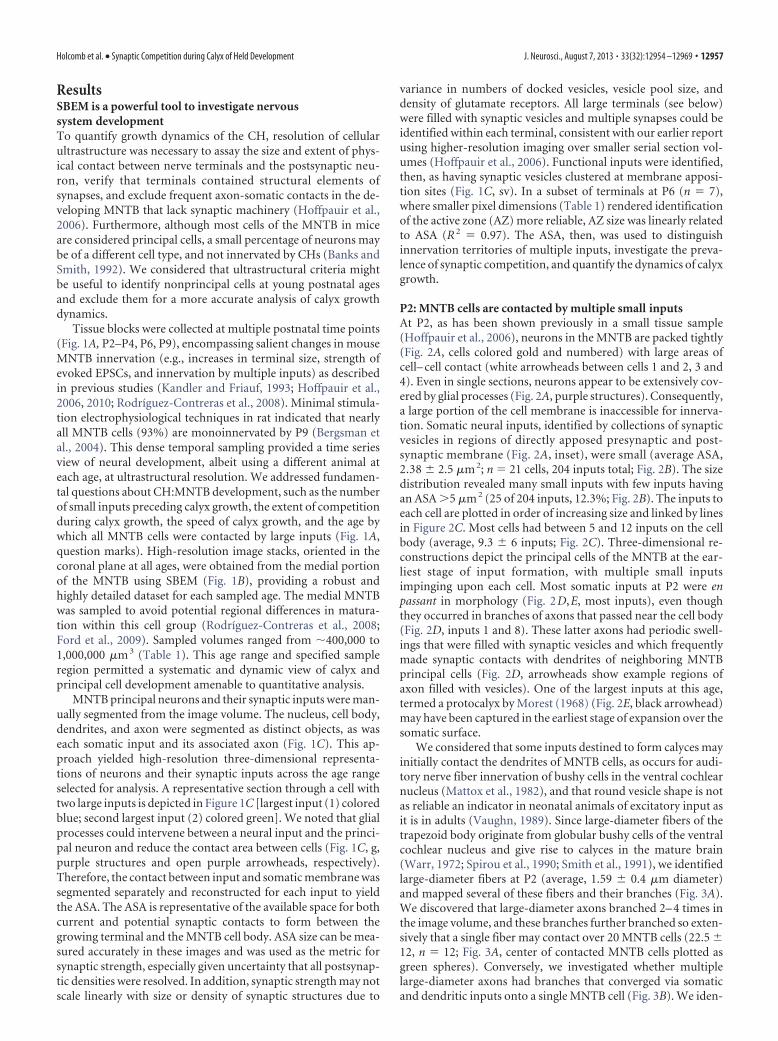
Tissue blocks were collected at multiple postnatal time points(Fig. 1A, P2–P4, P6, P9), encompassing salient changes in mouseMNTB innervation (e.g., increases in terminal size, strength ofevoked EPSCs, and innervation by multiple inputs) as describedin previous studies (Kandler and Friauf, 1993; Hoffpauir et al.,2006, 2010; Rodríguez-Contreras et al., 2008). Minimal stimula-tion electrophysiological techniques in rat indicated that nearlyall MNTB cells (93%) are monoinnervated by P9 (Bergsman etal., 2004). This dense temporal sampling provided a time seriesview of neural development, albeit using a different animal ateach age, at ultrastructural resolution. We addressed fundamen-tal questions about CH:MNTB development, such as the numberof small inputs preceding calyx growth, the extent of competitionduring calyx growth, the speed of calyx growth, and the age bywhich all MNTB cells were contacted by large inputs (Fig. 1A,question marks). High-resolution image stacks, oriented in thecoronal plane at all ages, were obtained from the medial portionof the MNTB using SBEM (Fig. 1B), providing a robust andhighly detailed dataset for each sampled age. The medial MNTBwas sampled to avoid potential regional differences in matura-tion within this cell group (Rodríguez-Contreras et al., 2008;Ford et al., 2009). Sampled volumes ranged from �400,000 to1,000,000 �m 3 (Table 1). This age range and specified sampleregion permitted a systematic and dynamic view of calyx andprincipal cell development amenable to quantitative analysis.
MNTB principal neurons and their synaptic inputs were man-ually segmented from the image volume. The nucleus, cell body,dendrites, and axon were segmented as distinct objects, as waseach somatic input and its associated axon (Fig. 1C). This ap-proach yielded high-resolution three-dimensional representa-tions of neurons and their synaptic inputs across the age rangeselected for analysis. A representative section through a cell withtwo large inputs is depicted in Figure 1C [largest input (1) coloredblue; second largest input (2) colored green]. We noted that glialprocesses could intervene between a neural input and the princi-pal neuron and reduce the contact area between cells (Fig. 1C, g,purple structures and open purple arrowheads, respectively).Therefore, the contact between input and somatic membrane wassegmented separately and reconstructed for each input to yieldthe ASA. The ASA is representative of the available space for bothcurrent and potential synaptic contacts to form between thegrowing terminal and the MNTB cell body. ASA size can be mea-sured accurately in these images and was used as the metric forsynaptic strength, especially given uncertainty that all postsynap-tic densities were resolved. In addition, synaptic strength may notscale linearly with size or density of synaptic structures due to
variance in numbers of docked vesicles, vesicle pool size, anddensity of glutamate receptors. All large terminals (see below)were filled with synaptic vesicles and multiple synapses could beidentified within each terminal, consistent with our earlier reportusing higher-resolution imaging over smaller serial section vol-umes (Hoffpauir et al., 2006). Functional inputs were identified,then, as having synaptic vesicles clustered at membrane apposi-tion sites (Fig. 1C, sv). In a subset of terminals at P6 (n � 7),where smaller pixel dimensions (Table 1) rendered identificationof the active zone (AZ) more reliable, AZ size was linearly relatedto ASA (R 2 � 0.97). The ASA, then, was used to distinguishinnervation territories of multiple inputs, investigate the preva-lence of synaptic competition, and quantify the dynamics of calyxgrowth.
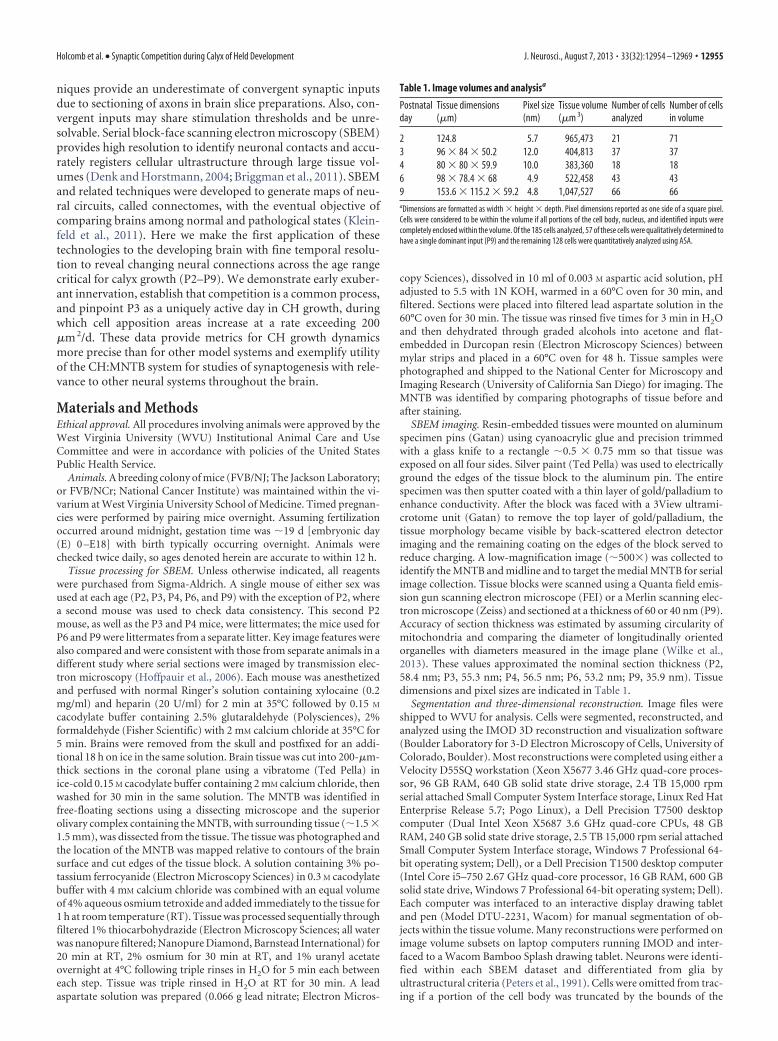
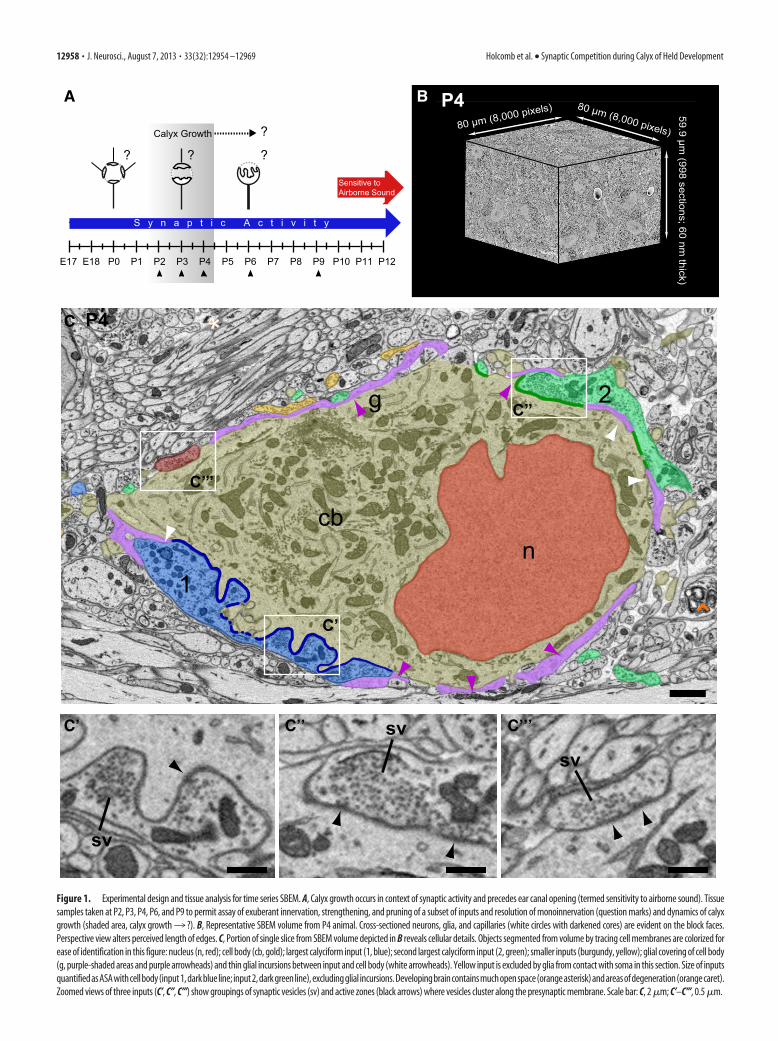
P2: MNTB cells are contacted by multiple small inputsAt P2, as has been shown previously in a small tissue sample(Hoffpauir et al., 2006), neurons in the MNTB are packed tightly(Fig. 2A, cells colored gold and numbered) with large areas ofcell– cell contact (white arrowheads between cells 1 and 2, 3 and4). Even in single sections, neurons appear to be extensively cov-ered by glial processes (Fig. 2A, purple structures). Consequently,a large portion of the cell membrane is inaccessible for innerva-tion. Somatic neural inputs, identified by collections of synapticvesicles in regions of directly apposed presynaptic and post-synaptic membrane (Fig. 2A, inset), were small (average ASA,2.38 � 2.5 �m 2; n � 21 cells, 204 inputs total; Fig. 2B). The sizedistribution revealed many small inputs with few inputs havingan ASA �5 �m 2 (25 of 204 inputs, 12.3%; Fig. 2B). The inputs toeach cell are plotted in order of increasing size and linked by linesin Figure 2C. Most cells had between 5 and 12 inputs on the cellbody (average, 9.3 � 6 inputs; Fig. 2C). Three-dimensional re-constructions depict the principal cells of the MNTB at the ear-liest stage of input formation, with multiple small inputsimpinging upon each cell. Most somatic inputs at P2 were enpassant in morphology (Fig. 2D,E, most inputs), even thoughthey occurred in branches of axons that passed near the cell body(Fig. 2D, inputs 1 and 8). These latter axons had periodic swell-ings that were filled with synaptic vesicles and which frequentlymade synaptic contacts with dendrites of neighboring MNTBprincipal cells (Fig. 2D, arrowheads show example regions ofaxon filled with vesicles). One of the largest inputs at this age,termed a protocalyx by Morest (1968) (Fig. 2E, black arrowhead)may have been captured in the earliest stage of expansion over thesomatic surface.
We considered that some inputs destined to form calyces mayinitially contact the dendrites of MNTB cells, as occurs for audi-tory nerve fiber innervation of bushy cells in the ventral cochlearnucleus (Mattox et al., 1982), and that round vesicle shape is notas reliable an indicator in neonatal animals of excitatory input asit is in adults (Vaughn, 1989). Since large-diameter fibers of thetrapezoid body originate from globular bushy cells of the ventralcochlear nucleus and give rise to calyces in the mature brain(Warr, 1972; Spirou et al., 1990; Smith et al., 1991), we identifiedlarge-diameter fibers at P2 (average, 1.59 � 0.4 �m diameter)and mapped several of these fibers and their branches (Fig. 3A).We discovered that large-diameter axons branched 2– 4 times inthe image volume, and these branches further branched so exten-sively that a single fiber may contact over 20 MNTB cells (22.5 �12, n � 12; Fig. 3A, center of contacted MNTB cells plotted asgreen spheres). Conversely, we investigated whether multiplelarge-diameter axons had branches that converged via somaticand dendritic inputs onto a single MNTB cell (Fig. 3B). We iden-
Holcomb et al. • Synaptic Competition during Calyx of Held Development J. Neurosci., August 7, 2013 • 33(32):12954 –12969 • 12957
E17 E18 P0 P1 P2 P3 P4 P5 P6 P7 P8 P9 P10
S y n a p t i c A c t i v i t y
Sensitive toAirborne Sound
P11 P12
Calyx Growth
?
A
?
?
?
C P4
ncb
1
2
*
g
C’
C’’
C’’’
A
80 µm (8,000 pixels) 80 µm (8,000 pixels)
59.9 µm (998 sections; 60 nm
thick)P4
C’ C’’ C’’’
sv
svsv
B
Figure 1. Experimental design and tissue analysis for time series SBEM. A, Calyx growth occurs in context of synaptic activity and precedes ear canal opening (termed sensitivity to airborne sound). Tissuesamples taken at P2, P3, P4, P6, and P9 to permit assay of exuberant innervation, strengthening, and pruning of a subset of inputs and resolution of monoinnervation (question marks) and dynamics of calyxgrowth (shaded area, calyx growth3 ?). B, Representative SBEM volume from P4 animal. Cross-sectioned neurons, glia, and capillaries (white circles with darkened cores) are evident on the block faces.Perspective view alters perceived length of edges. C, Portion of single slice from SBEM volume depicted in B reveals cellular details. Objects segmented from volume by tracing cell membranes are colorized forease of identification in this figure: nucleus (n, red); cell body (cb, gold); largest calyciform input (1, blue); second largest calyciform input (2, green); smaller inputs (burgundy, yellow); glial covering of cell body(g, purple-shaded areas and purple arrowheads) and thin glial incursions between input and cell body (white arrowheads). Yellow input is excluded by glia from contact with soma in this section. Size of inputsquantifiedasASAwithcellbody(input1,darkblueline; input2,darkgreenline),excludingglial incursions.Developingbraincontainsmuchopenspace(orangeasterisk)andareasofdegeneration(orangecaret).Zoomed views of three inputs (C’, C’’, C’’’) show groupings of synaptic vesicles (sv) and active zones (black arrows) where vesicles cluster along the presynaptic membrane. Scale bar: C, 2 �m; C’–C’’’, 0.5 �m.
12958 • J. Neurosci., August 7, 2013 • 33(32):12954 –12969 Holcomb et al. • Synaptic Competition during Calyx of Held Development
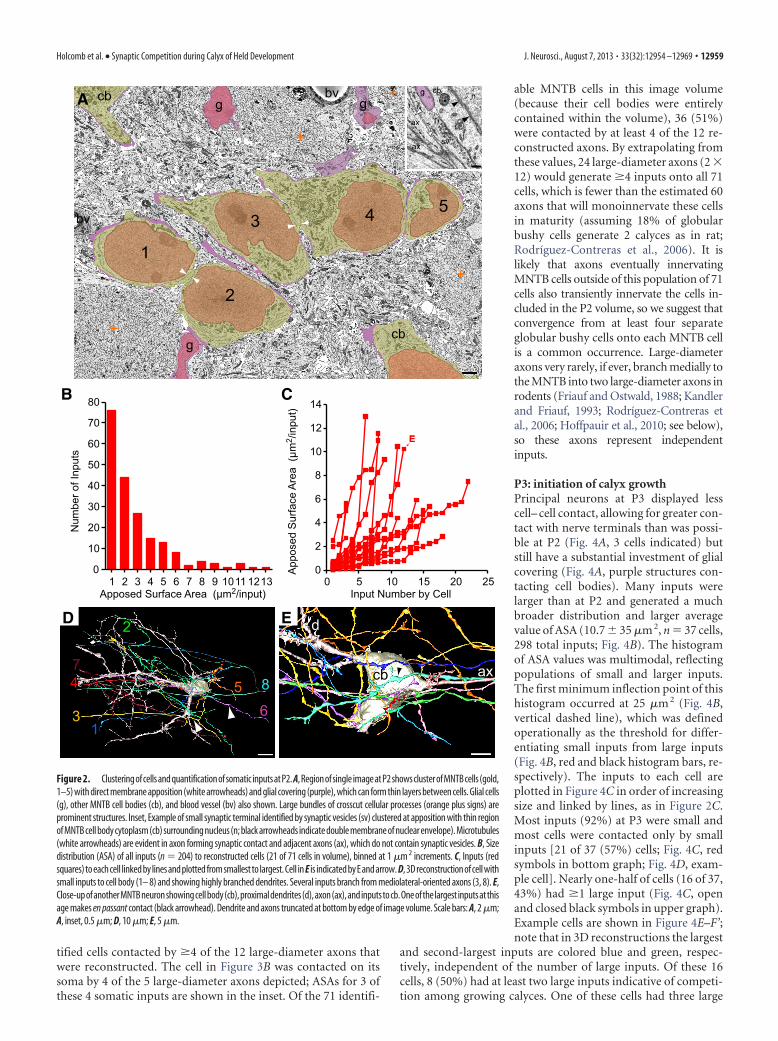
tified cells contacted by �4 of the 12 large-diameter axons thatwere reconstructed. The cell in Figure 3B was contacted on itssoma by 4 of the 5 large-diameter axons depicted; ASAs for 3 ofthese 4 somatic inputs are shown in the inset. Of the 71 identifi-
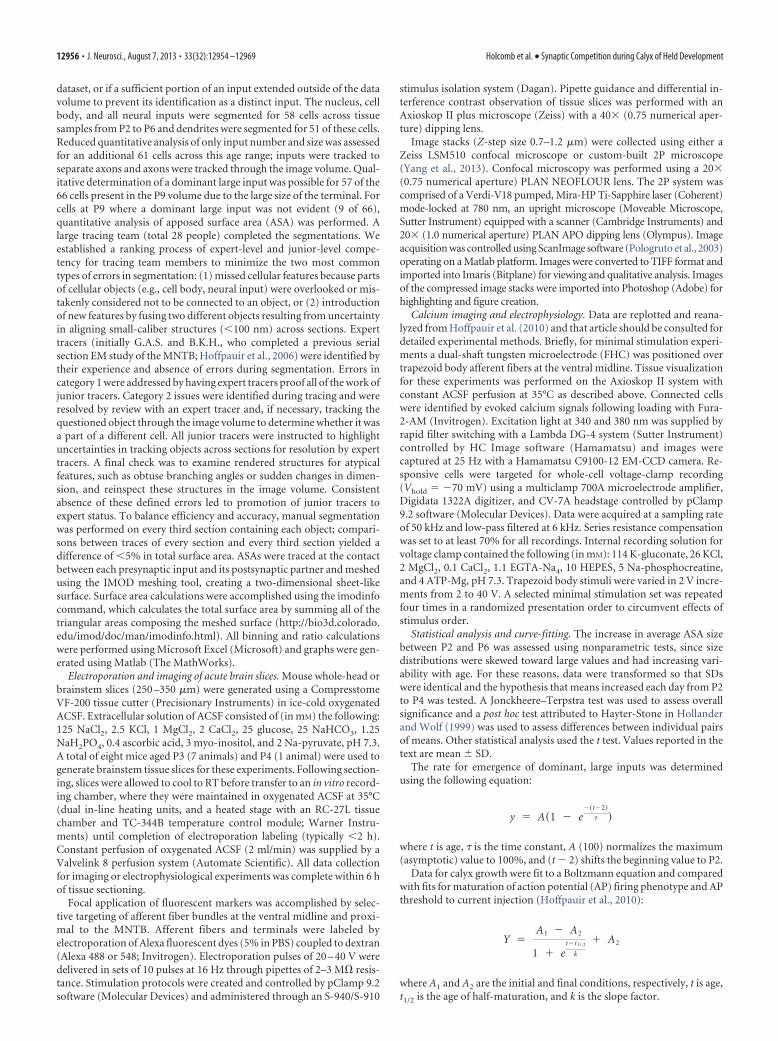
able MNTB cells in this image volume(because their cell bodies were entirelycontained within the volume), 36 (51%)were contacted by at least 4 of the 12 re-constructed axons. By extrapolating fromthese values, 24 large-diameter axons (2 �12) would generate �4 inputs onto all 71cells, which is fewer than the estimated 60axons that will monoinnervate these cellsin maturity (assuming 18% of globularbushy cells generate 2 calyces as in rat;Rodríguez-Contreras et al., 2006). It islikely that axons eventually innervatingMNTB cells outside of this population of 71cells also transiently innervate the cells in-cluded in the P2 volume, so we suggest thatconvergence from at least four separateglobular bushy cells onto each MNTB cellis a common occurrence. Large-diameteraxons very rarely, if ever, branch medially tothe MNTB into two large-diameter axons inrodents (Friauf and Ostwald, 1988; Kandlerand Friauf, 1993; Rodríguez-Contreras etal., 2006; Hoffpauir et al., 2010; see below),so these axons represent independentinputs.
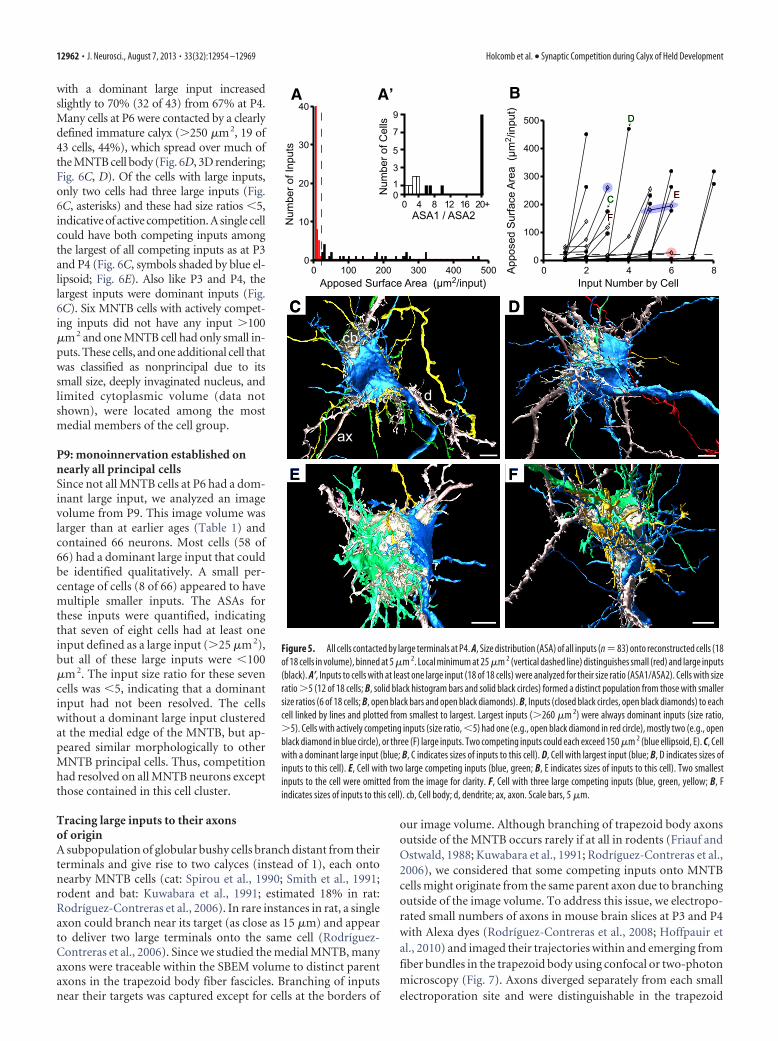
P3: initiation of calyx growthPrincipal neurons at P3 displayed lesscell– cell contact, allowing for greater con-tact with nerve terminals than was possi-ble at P2 (Fig. 4A, 3 cells indicated) butstill have a substantial investment of glialcovering (Fig. 4A, purple structures con-tacting cell bodies). Many inputs werelarger than at P2 and generated a muchbroader distribution and larger averagevalue of ASA (10.7 � 35 �m 2, n � 37 cells,298 total inputs; Fig. 4B). The histogramof ASA values was multimodal, reflectingpopulations of small and larger inputs.The first minimum inflection point of thishistogram occurred at 25 �m 2 (Fig. 4B,vertical dashed line), which was definedoperationally as the threshold for differ-entiating small inputs from large inputs(Fig. 4B, red and black histogram bars, re-spectively). The inputs to each cell areplotted in Figure 4C in order of increasingsize and linked by lines, as in Figure 2C.Most inputs (92%) at P3 were small andmost cells were contacted only by smallinputs [21 of 37 (57%) cells; Fig. 4C, redsymbols in bottom graph; Fig. 4D, exam-ple cell]. Nearly one-half of cells (16 of 37,43%) had �1 large input (Fig. 4C, openand closed black symbols in upper graph).Example cells are shown in Figure 4E–F’;note that in 3D reconstructions the largest
and second-largest inputs are colored blue and green, respec-tively, independent of the number of large inputs. Of these 16cells, 8 (50%) had at least two large inputs indicative of competi-tion among growing calyces. One of these cells had three large
B C
Num
ber o
f Inp
uts
Apposed Surface Area (µm2/input) Input Number by Cell
D E
A
1
2
3 4 5
1
2
3
54
App
osed
Sur
face
Are
a (µ
m2 /
inpu
t)
EE
1 2 3 4 5 6 7 8 9 1011 12130
10
20
30
40
50
60
70
80
0 5 10 15 20 250
2
4
6
8
10
12
14
6
78
sv
ax
ax
cb
cbg
g gbv
bv
+
+
+
+
cb
d
ax
g cbn
Figure 2. Clusteringofcellsandquantificationofsomatic inputsatP2. A,Regionofsingle imageatP2showsclusterofMNTBcells(gold,1–5) with direct membrane apposition (white arrowheads) and glial covering (purple), which can form thin layers between cells. Glial cells(g), other MNTB cell bodies (cb), and blood vessel (bv) also shown. Large bundles of crosscut cellular processes (orange plus signs) areprominent structures. Inset, Example of small synaptic terminal identified by synaptic vesicles (sv) clustered at apposition with thin regionof MNTB cell body cytoplasm (cb) surrounding nucleus (n; black arrowheads indicate double membrane of nuclear envelope). Microtubules(white arrowheads) are evident in axon forming synaptic contact and adjacent axons (ax), which do not contain synaptic vesicles. B, Sizedistribution (ASA) of all inputs (n � 204) to reconstructed cells (21 of 71 cells in volume), binned at 1 �m 2 increments. C, Inputs (redsquares) to each cell linked by lines and plotted from smallest to largest. Cell in E is indicated by E and arrow. D, 3D reconstruction of cell withsmall inputs to cell body (1– 8) and showing highly branched dendrites. Several inputs branch from mediolateral-oriented axons (3, 8). E,Close-upofanotherMNTBneuronshowingcellbody(cb),proximaldendrites(d),axon(ax),andinputstocb.Oneofthelargest inputsatthisage makes en passant contact (black arrowhead). Dendrite and axons truncated at bottom by edge of image volume. Scale bars: A, 2 �m;A, inset, 0.5 �m; D, 10 �m; E, 5 �m.
Holcomb et al. • Synaptic Competition during Calyx of Held Development J. Neurosci., August 7, 2013 • 33(32):12954 –12969 • 12959
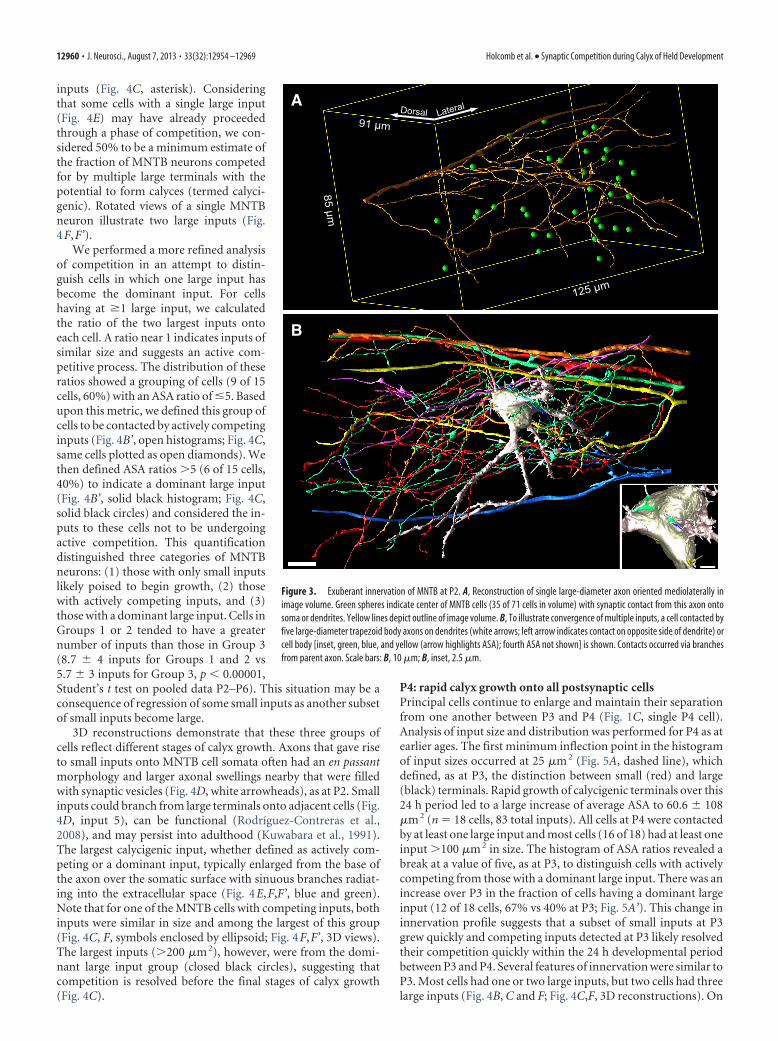
inputs (Fig. 4C, asterisk). Consideringthat some cells with a single large input(Fig. 4E) may have already proceededthrough a phase of competition, we con-sidered 50% to be a minimum estimate ofthe fraction of MNTB neurons competedfor by multiple large terminals with thepotential to form calyces (termed calyci-genic). Rotated views of a single MNTBneuron illustrate two large inputs (Fig.4F,F’).
We performed a more refined analysisof competition in an attempt to distin-guish cells in which one large input hasbecome the dominant input. For cellshaving at �1 large input, we calculatedthe ratio of the two largest inputs ontoeach cell. A ratio near 1 indicates inputs ofsimilar size and suggests an active com-petitive process. The distribution of theseratios showed a grouping of cells (9 of 15cells, 60%) with an ASA ratio of �5. Basedupon this metric, we defined this group ofcells to be contacted by actively competinginputs (Fig. 4B’, open histograms; Fig. 4C,same cells plotted as open diamonds). Wethen defined ASA ratios �5 (6 of 15 cells,40%) to indicate a dominant large input(Fig. 4B’, solid black histogram; Fig. 4C,solid black circles) and considered the in-puts to these cells not to be undergoingactive competition. This quantificationdistinguished three categories of MNTBneurons: (1) those with only small inputslikely poised to begin growth, (2) thosewith actively competing inputs, and (3)those with a dominant large input. Cells inGroups 1 or 2 tended to have a greaternumber of inputs than those in Group 3(8.7 � 4 inputs for Groups 1 and 2 vs5.7 � 3 inputs for Group 3, p � 0.00001,Student’s t test on pooled data P2–P6). This situation may be aconsequence of regression of some small inputs as another subsetof small inputs become large.
3D reconstructions demonstrate that these three groups ofcells reflect different stages of calyx growth. Axons that gave riseto small inputs onto MNTB cell somata often had an en passantmorphology and larger axonal swellings nearby that were filledwith synaptic vesicles (Fig. 4D, white arrowheads), as at P2. Smallinputs could branch from large terminals onto adjacent cells (Fig.4D, input 5), can be functional (Rodríguez-Contreras et al.,2008), and may persist into adulthood (Kuwabara et al., 1991).The largest calycigenic input, whether defined as actively com-peting or a dominant input, typically enlarged from the base ofthe axon over the somatic surface with sinuous branches radiat-ing into the extracellular space (Fig. 4E,F,F’, blue and green).Note that for one of the MNTB cells with competing inputs, bothinputs were similar in size and among the largest of this group(Fig. 4C, F, symbols enclosed by ellipsoid; Fig. 4F,F’, 3D views).The largest inputs (�200 �m 2), however, were from the domi-nant large input group (closed black circles), suggesting thatcompetition is resolved before the final stages of calyx growth(Fig. 4C).
P4: rapid calyx growth onto all postsynaptic cellsPrincipal cells continue to enlarge and maintain their separationfrom one another between P3 and P4 (Fig. 1C, single P4 cell).Analysis of input size and distribution was performed for P4 as atearlier ages. The first minimum inflection point in the histogramof input sizes occurred at 25 �m 2 (Fig. 5A, dashed line), whichdefined, as at P3, the distinction between small (red) and large(black) terminals. Rapid growth of calycigenic terminals over this24 h period led to a large increase of average ASA to 60.6 � 108�m 2 (n � 18 cells, 83 total inputs). All cells at P4 were contactedby at least one large input and most cells (16 of 18) had at least oneinput �100 �m 2 in size. The histogram of ASA ratios revealed abreak at a value of five, as at P3, to distinguish cells with activelycompeting from those with a dominant large input. There was anincrease over P3 in the fraction of cells having a dominant largeinput (12 of 18 cells, 67% vs 40% at P3; Fig. 5A’). This change ininnervation profile suggests that a subset of small inputs at P3grew quickly and competing inputs detected at P3 likely resolvedtheir competition quickly within the 24 h developmental periodbetween P3 and P4. Several features of innervation were similar toP3. Most cells had one or two large inputs, but two cells had threelarge inputs (Fig. 4B, C and F; Fig. 4C,F, 3D reconstructions). On
A
85 µm
91 µm
125 µm
B
Dorsal Lateral
Figure 3. Exuberant innervation of MNTB at P2. A, Reconstruction of single large-diameter axon oriented mediolaterally inimage volume. Green spheres indicate center of MNTB cells (35 of 71 cells in volume) with synaptic contact from this axon ontosoma or dendrites. Yellow lines depict outline of image volume. B, To illustrate convergence of multiple inputs, a cell contacted byfive large-diameter trapezoid body axons on dendrites (white arrows; left arrow indicates contact on opposite side of dendrite) orcell body [inset, green, blue, and yellow (arrow highlights ASA); fourth ASA not shown] is shown. Contacts occurred via branchesfrom parent axon. Scale bars: B, 10 �m; B, inset, 2.5 �m.
12960 • J. Neurosci., August 7, 2013 • 33(32):12954 –12969 Holcomb et al. • Synaptic Competition during Calyx of Held Development

one cell (Fig. 4B, F) these three inputswere considered to be in active competi-tion. A single cell could have both com-peting inputs among the largest of allcompeting inputs (Fig. 5B, symbolsshaded by blue ellipsoid; Fig. 5E). Thelargest inputs (�260 �m 2) were the dom-inant inputs on their respective cells (Fig.5B–D). The presence of some cells at P3without large inputs and all cells at P4with large inputs but a wide range of sizes(Fig. 5B) supports the idea that initiationof calyx formation within a specified re-gion of the MNTB is relatively well syn-chronized within a �24 h period.
P6: increased numbers ofmonoinnervated cellsAt P6, a larger volume of the medial por-tion of the MNTB was captured than atP3, yet it contained a similar number of cells(43 cells), due in part to their wider spacing(Fig. 6A). The input size histogram revealeda minimum inflection point of 35 �m2,similar to P3 and P4, to distinguish smallfrom large inputs (Fig. 6B). Similar to P4, allbut one cell at P6 (42 of 43) had at least onelarge input. Some cells had more small in-puts than at P4, so the average ASA de-creased to 42.6�105 �m2 (n�43 cells, 306total inputs). The histogram of input sizeratios was divided into values �5 or �5, asat P3 and P4, defining cells with activelycompeting inputs (�5) or a dominant largeinput (�5) (Fig. 6B’). The fraction of cells
cb
d1
2
354
6
B
0 50 100 150 200 250 300 3500
10
20
30
225B’
0 4 8 12 16 20+0
1
2
3
4
5
6
ASA1 / ASA2
Num
ber o
f Cel
ls
C
050
100150200250300350400
Input Number by Cell
D
D
EE
EE
FF
A
1
2
3
ax
+
bv
Num
ber o
f Inp
uts
Apposed Surface Area (µm2/input)
App
osed
Sur
face
Are
a (µ
m2 /
inpu
t)
1 2 3 4 5 6 7 8 9 10
*
0 5 10 15 200
102030
+
g
sv
cb
cb
ng
F'F'FF
Figure 4. Separation of cells and beginning of rapid nerve terminal growth at P3. A, Region of single image showing small fieldof cells (1–3) with small inputs and less cell– cell contact than at P2, yet retaining significant coverage of cell body surface by glia(purple). A large input (blue) contacts cell 1. Color scheme same as Figure 2. Crosscut cellular processes (orange plus signs)
4
indicated as in Figure 2. Inset, Inputs to two adjacent cell bod-ies (cb) identified by synaptic vesicles (sv) and mitochondriaand covered by glial process (g, purple). B, Size distribution(ASA) of all inputs (n � 298) onto reconstructed cells (37 of 37cells in volume), binned at 5 �m 2. Local minimum at 25 �m 2
(vertical dashed line) is operational distinction between small(red) and large inputs (black). B’, Inputs to cells with at leastone large input (16 of 37 cells) were analyzed for relative sizeof two largest inputs (size ratio: ASA1/ASA2). Cells with ASA1/ASA2 � 5 (7 of 16 cells, closed histogram bars) formed a dis-tinct population from those with smaller size ratios (9 of 16cells, open black bars). C, Inputs (closed black circles, openblack diamonds, red squares) to each cell linked by lines andplotted from smallest to largest. Cells had one (e.g., open blackdiamond inside blue or red circle), mostly two or three (aster-isk) large inputs and both inputs could exceed 100 �m 2 (blueellipsoid, F). Cells with only small inputs (red) graphed sepa-rately for clarity. D, 3D rendering of representative cell con-tacted by only small inputs. Input 5 is branched from a largernerve terminal growing on an adjacent cell body. Sizes of in-puts to this cell shown in C and marked D. Only largest 6 of 11inputs shown for clarity. E, 3D rendering of representative cellwith a dominant large input (blue). Sizes of inputs to this cellshown in C and marked E. F, F’, 3D rendering of cell showinglargest (blue) and second largest (green, rotated view of samecell) inputs, both of which were �100 �m 2. Sizes of inputs tothis cell shown in C and marked F. cb, Cell body; d, dendrite; ax,axon. Scale bars: A, 2 �m; A, inset, 0.5 �m; D–F’, 5 �m.
Holcomb et al. • Synaptic Competition during Calyx of Held Development J. Neurosci., August 7, 2013 • 33(32):12954 –12969 • 12961
with a dominant large input increasedslightly to 70% (32 of 43) from 67% at P4.Many cells at P6 were contacted by a clearlydefined immature calyx (�250 �m2, 19 of43 cells, 44%), which spread over much ofthe MNTB cell body (Fig. 6D, 3D rendering;Fig. 6C, D). Of the cells with large inputs,only two cells had three large inputs (Fig.6C, asterisks) and these had size ratios �5,indicative of active competition. A single cellcould have both competing inputs amongthe largest of all competing inputs as at P3and P4 (Fig. 6C, symbols shaded by blue el-lipsoid; Fig. 6E). Also like P3 and P4, thelargest inputs were dominant inputs (Fig.6C). Six MNTB cells with actively compet-ing inputs did not have any input �100�m2 and one MNTB cell had only small in-puts. These cells, and one additional cell thatwas classified as nonprincipal due to itssmall size, deeply invaginated nucleus, andlimited cytoplasmic volume (data notshown), were located among the mostmedial members of the cell group.
P9: monoinnervation established onnearly all principal cellsSince not all MNTB cells at P6 had a dom-inant large input, we analyzed an imagevolume from P9. This image volume waslarger than at earlier ages (Table 1) andcontained 66 neurons. Most cells (58 of66) had a dominant large input that couldbe identified qualitatively. A small per-centage of cells (8 of 66) appeared to havemultiple smaller inputs. The ASAs forthese inputs were quantified, indicatingthat seven of eight cells had at least oneinput defined as a large input (�25 �m 2),but all of these large inputs were �100�m 2. The input size ratio for these sevencells was �5, indicating that a dominantinput had not been resolved. The cellswithout a dominant large input clusteredat the medial edge of the MNTB, but ap-peared similar morphologically to otherMNTB principal cells. Thus, competitionhad resolved on all MNTB neurons exceptthose contained in this cell cluster.
Tracing large inputs to their axonsof originA subpopulation of globular bushy cells branch distant from theirterminals and give rise to two calyces (instead of 1), each ontonearby MNTB cells (cat: Spirou et al., 1990; Smith et al., 1991;rodent and bat: Kuwabara et al., 1991; estimated 18% in rat:Rodríguez-Contreras et al., 2006). In rare instances in rat, a singleaxon could branch near its target (as close as 15 �m) and appearto deliver two large terminals onto the same cell (Rodríguez-Contreras et al., 2006). Since we studied the medial MNTB, manyaxons were traceable within the SBEM volume to distinct parentaxons in the trapezoid body fiber fascicles. Branching of inputsnear their targets was captured except for cells at the borders of
our image volume. Although branching of trapezoid body axonsoutside of the MNTB occurs rarely if at all in rodents (Friauf andOstwald, 1988; Kuwabara et al., 1991; Rodríguez-Contreras et al.,2006), we considered that some competing inputs onto MNTBcells might originate from the same parent axon due to branchingoutside of the image volume. To address this issue, we electropo-rated small numbers of axons in mouse brain slices at P3 and P4with Alexa dyes (Rodríguez-Contreras et al., 2008; Hoffpauir etal., 2010) and imaged their trajectories within and emerging fromfiber bundles in the trapezoid body using confocal or two-photonmicroscopy (Fig. 7). Axons diverged separately from each smallelectroporation site and were distinguishable in the trapezoid
0 2 4 6 80
100
200
300
400
500
0 100 200 300 400 5000
10
20
30
40
Num
ber o
f Inp
uts
Apposed Surface Area (µm2/input)
Num
ber o
f Cel
ls
ASA1 / ASA2
App
osed
Sur
face
Are
a (µ
m2 /
inpu
t)
Input Number by Cell
A A’ B
cb
d
ax
FFEE
DDCC
FF
EE
DD
CC0 4 8 12 16 20+01
3
5
7
9
Figure 5. All cells contacted by large terminals at P4. A, Size distribution (ASA) of all inputs (n�83) onto reconstructed cells (18of 18 cells in volume), binned at 5 �m 2. Local minimum at 25 �m 2 (vertical dashed line) distinguishes small (red) and large inputs(black). A’, Inputs to cells with at least one large input (18 of 18 cells) were analyzed for their size ratio (ASA1/ASA2). Cells with sizeratio �5 (12 of 18 cells; B, solid black histogram bars and solid black circles) formed a distinct population from those with smallersize ratios (6 of 18 cells; B, open black bars and open black diamonds). B, Inputs (closed black circles, open black diamonds) to eachcell linked by lines and plotted from smallest to largest. Largest inputs (�260 �m 2) were always dominant inputs (size ratio,�5). Cells with actively competing inputs (size ratio, �5) had one (e.g., open black diamond in red circle), mostly two (e.g., openblack diamond in blue circle), or three (F) large inputs. Two competing inputs could each exceed 150 �m 2 (blue ellipsoid, E). C, Cellwith a dominant large input (blue; B, C indicates sizes of inputs to this cell). D, Cell with largest input (blue; B, D indicates sizes ofinputs to this cell). E, Cell with two large competing inputs (blue, green; B, E indicates sizes of inputs to this cell). Two smallestinputs to the cell were omitted from the image for clarity. F, Cell with three large competing inputs (blue, green, yellow; B, Findicates sizes of inputs to this cell). cb, Cell body; d, dendrite; ax, axon. Scale bars, 5 �m.
12962 • J. Neurosci., August 7, 2013 • 33(32):12954 –12969 Holcomb et al. • Synaptic Competition during Calyx of Held Development

body (data not shown) before entering thefields of view depicted in this figure. Ourgoal was to label a small enough numberof axons in each preparation to evaluatewhether branches of single axons con-verged into the same vicinity via largenerve endings. Only 1 of 20 axons studiedin this fashion exhibited the potential forsuch convergence (Fig. 7A, axon high-lighted in yellow and putative terminalsby white arrows). For this axon, the nerveterminals were �5 �m apart, but it wasdifficult to assess whether they contactedthe same cell. An angled view from theimage stack suggested that the inputs con-tacted different postsynaptic structuresdue to curvature of the larger terminal(Fig. 7A, inset, asterisks). An example ofmore typical branching patterns and con-vergence are shown in Figure 7B. One axonis highlighted in yellow and expands into asingle large terminal. Another labeled axonalso ends in a large terminal, possibly ontothe same but more likely onto a neighboringcell body (Fig. 7B, 2). A third axon (Fig. 7B,3) delivers a large terminal that in turn ex-tends long, thin processes. These data con-firm that the incidence of single axons thatbranch at distant locations and convergeonto single MNTB cells via large terminals isvery rare and that our estimates of synapticcompetition reflect true convergence ofneuronal projections.
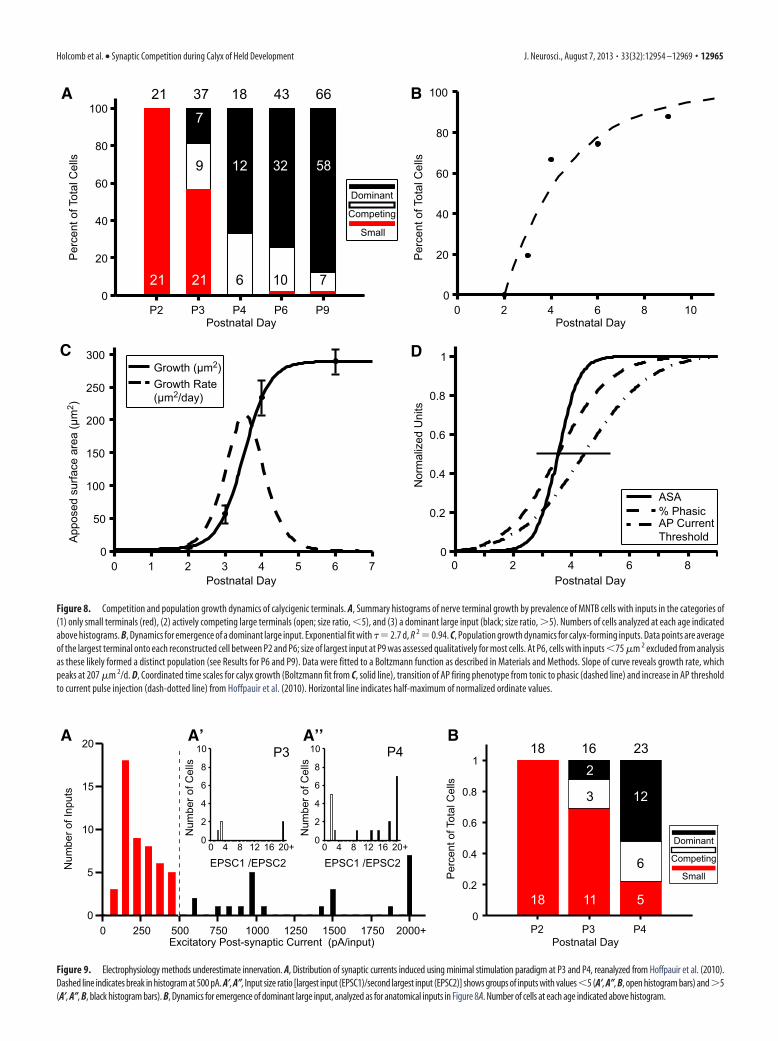
Dynamics of calyx growth andsynchronization withpostsynaptic maturationEmergence of a dominant, large inputFigure 8A shows a histogram summary ofthe distribution of MNTB cells across agebased upon categorization of their inputs:(1) cells with only small inputs (red), (2)cells with actively competing inputs (openblack, ASA ratio �5), and (3) cells with adominant large input (solid black, ASAratio �5). The growth of large inputs ontoMNTB cells is a rapid and well synchro-nized process, as indicated by the elimina-tion (with 1 exception at P6 and P9) ofcells with only small inputs between P2and P4, and a significant increase in thepercentage of cells with a dominant, largeinput from P3 to P4. These data also per-mitted quantification of the rate at whicha single input emerged as a dominant in-put and were fit to a single exponentialgrowth curve with � � 2.7 d (Fig. 8B).
Rate of calyx growthTo further explore the growth dynamicsof this system, averages of the largest in-
0 3 6 9 12 150
50100150200250300350400450500550
B B’ C
D EE
DD
EE
213
14
12
10
8
6
4
2
00 50 150 250 350 450 550
25
20
15
10
5
00 4 8 12 16 20+
Num
ber o
f Inp
uts
Apposed Surface Area (µm2/input)
Num
ber o
f Cel
ls
ASA1 / ASA2
App
osed
Sur
face
Are
a (µ
m2 /
inpu
t)
Input Number by Cell
A
1
2
3
g
bv
4
ax
ax
**
cb
d
ax
5
cb
sv
sv
Figure 6. Continued growth and competition at P6. A, Region of single image showing small field of neurons with dominantlarge (cells 2–5; large inputs to cells 3 and 5 not captured in this section) and actively competing inputs (3 inputs shown onto cell1) and a glial (g) cell body. Axon forming calyx onto cell 4 enters at right edge of image. Glial laminae (purple) cover portions of cellbody but also the nonsynaptic surface of calyces and calycigenic inputs. Color scheme same as Figure 4A. Fiber fascicle traverses inmediolateral direction at bottom of image. A, Inset, Terminals contain visible active zones defined by synaptic vesicles (sv)clustered along the presynaptic membrane (black arrowheads). B, Size distribution (ASA) of all inputs (n � 306) onto recon-structed cells (43 of 43 cells in volume), binned at 5 �m 2 increments. Local minimum at 35 �m 2 (vertical dashed line) distin-guishes small (red) and large inputs (black) that potentially form the single calyceal input. B’, Inputs to cells with at least one largeinput (42 of 43 cells) were analyzed for size ratio (ASA1/ASA2). Cells with size ratio �5 (32 cells, solid black histogram bars) formeda distinct population from those with smaller size ratios (10 cells, open black bars). C, Inputs (solid black circles, open blackdiamonds, red squares) to each cell linked by lines and plotted from smallest to largest. Largest inputs (�250 �m 2) were alwaysdominant inputs (size ratio, �5). Cells with actively competing inputs (size ratio, �5) had two or three (asterisks) large inputs.Two competing inputs could each exceed 125 �m 2 (blue ellipsoid, E). D, Cell with a dominant large input (blue; C, D indicates sizesof inputs to this cell). Smaller inputs omitted for clarity. E, Cell with two large competing inputs (blue, green; C, E indicates sizes ofinputs to this cell). Most smaller inputs omitted for clarity. cb, Cell body; d, dendrite; ax, axon; bv, blood vessel. Scale bars: A, 2 �m;A, inset, 0.5 �m; D, 5 �m; E, 2 �m.
Holcomb et al. • Synaptic Competition during Calyx of Held Development J. Neurosci., August 7, 2013 • 33(32):12954 –12969 • 12963

puts onto each cell body at ages P2–P6 were used to generate agrowth curve for the populations of sampled cells (Fig. 8C). ABoltzmann fit to the data revealed a half-maximal age (t1/2) of3.5 d at a calyx size of 145 �m 2. The maximum growth rate (Fig.8C, dashed curve) at t1/2 was 207 �m 2 per day. Note that thisdescription of population growth dynamics may underestimatethe growth rate of individual calyces. Additionally, ASA was com-pared across ages using nonparametric statistical methods (seeMaterials and Methods). The daily increase in mean size from P2to P4 was highly significant (Z � 6.64, p � 0.0001, nonparametricJonckheere–Terpstra test, see Materials and Methods). Infollow-up individual comparisons, the mean for P2 was signifi-cantly smaller than P3 (p � 0.0001), which in turn was signifi-
cantly smaller than P4 (p � 0.0003). Previously it wasdemonstrated that maturation of MNTB cells parallels calyxgrowth (Hoffpauir et al., 2010; Rusu and Borst, 2011), althoughthe population dynamics of calyx growth could only be estimatedfrom physiological measures and serial section EM at the singletime point of P4 (Hoffpauir et al., 2006). Boltzmann fits to phys-iological data from Hoffpauir et al. (2010) are replotted withanatomical measures of calyx growth in Figure 8D. Both the tran-sition from tonic to phasic firing and the increase in AP currentthreshold begin �1 d earlier than growth of calycigenic termi-nals. The half-maximal times for percentage phasic cells (t1/2 �3.5 d) is identical to calyx growth and the value for increase in APcurrent threshold is �1 d delayed (t1/2 � 4.4 d).
Correspondence between electrophysiological and anatomicalcounting methodsBecause these ultrastructural data reveal all inputs onto theMNTB cell, we used them as a template to similarly analyze phys-iological measures of input number and synaptic current ampli-tude from Hoffpauir et al. (2010). Since minimal stimulationtechniques revealed fewer inputs per cell and there were fewerinputs measured physiologically per age, we combined agesP2–P4 to capture the transition in input size and generate a his-togram of evoked EPSC amplitudes. This histogram had a notice-able gap at 500 pA, which we defined as differentiating large fromsmall inputs (Fig. 9A). This value was intermediate betweenthreshold values (�400 pA–1 nA adjusted for holding potential)for calyceal inputs used in studies of older animals, which havefewer small inputs (Forsythe and Barnes-Davies, 1993; Futai etal., 2001; Bergsman et al., 2004). For cells with at �1 large input,we next calculated the ratio of EPSCs separately for each age. AtP3, 31% (5 of 16) of cells had �1 large input, and at P4 this valueincreased to 78% (18 of 23). The fraction of cells with �1 largeinput was slightly less than values obtained using SBEM (41% atP3, 100% at P4), consistent with the notion that some inputs arecut during brain slice preparation or that some inputs have sim-ilar thresholds, resulting in underestimates of cells having largeinputs. We next calculated the input size ratio, as with anatomicaldata, as a metric for cells that had an established dominant input.At P3 and P4, the input size histograms had a break at values of�4, similar to anatomical data, to differentiate cells with activelycompeting inputs from cells with a dominant input (Fig. 9A’,A’’).At P3, 2 of 16 (12.5%) cells had a dominant large input and at P4this fraction increased to 12 of 23 (52%). As with the other phys-iological parameters, these values were less than anatomical mea-sures (Fig. 9B).
Innervation territories of competing inputs are segregatedAs calyx-forming inputs grow, they establish new synapses withthe MNTB neuron. At the NMJ, postsynaptic receptor sites aremapped onto the muscle surface and are relatively invariant inposition although they grow in size (Balice-Gordon and Licht-man, 1990). Also, innervation of receptor loci can be traded be-tween competing inputs (Walsh and Lichtman, 2003). For CF:PCinnervation, small inputs are intermingled on the cell body beforethe eventual “winning” input extends over the dendritic end ofthe cell body in the capuchon stage of terminal development(Sugihara, 2005; Hashimoto et al., 2009). We investigated loca-tions of competing inputs on the MNTB somatic surface to de-termine whether competing inputs were interdigitated, whichwould indicate that they vied for the same postsynaptic territory,or whether they were segregated as eventually occurs at the CF:PC. The ASA and glial incursions for all actively competing in-
A
B
1
2
3
**
Figure 7. Branches of parent axon do not converge onto the same MNTB cell. A, Subset ofaxons electroporated with Alexa Fluor 488 dye and imaged using two-photon microscopy in P3animal. Images in both panels are of the collapsed image stack. Only example of axon andbranches that terminate near each other (colorized yellow; white arrows indicate terminals).Inset, Close-up of boxed region viewed at angle to demonstrate curvature of large ending(arrow) away from smaller ending (both indicated with asterisks), likely indicating innervationof different postsynaptic structures. B, Typical pattern of branching and innervation where axondid not branch at medial locations (area not shown to right of B) and branches terminate indistinct regions in the MNTB. Axons 1 and 2 terminate via large endings near each other (P4animal). Scale bars: A, B, 20 �m; A, inset, 5 �m.
12964 • J. Neurosci., August 7, 2013 • 33(32):12954 –12969 Holcomb et al. • Synaptic Competition during Calyx of Held Development
0 250 500 750 1000 1250 1500 1750 2000+0
5
10
15
20A A’
Num
ber o
f Inp
uts
Excitatory Post-synaptic Current (pA/input)
Num
ber o
f Cel
ls
EPSC1 /EPSC2
A’’
Num
ber o
f Cel
ls
EPSC1 /EPSC2
B
0 4 8 12 16 20+0
2
4
6
8
10 P4
0 4 8 12 16 20+0
2
4
6
8
10 P3
P2 P3 P40
0.2
0.4
0.6
0.8
1
SmallPer
cent
of T
otal
Cel
ls
Postnatal Day
18 16 23
18 11 5
3
6
12
2
Competing
Dominant
Figure 9. Electrophysiology methods underestimate innervation. A, Distribution of synaptic currents induced using minimal stimulation paradigm at P3 and P4, reanalyzed from Hoffpauir et al. (2010).Dashed line indicates break in histogram at 500 pA. A’, A’’, Input size ratio [largest input (EPSC1)/second largest input (EPSC2)] shows groups of inputs with values�5 (A’, A’’, B, open histogram bars) and�5(A’, A’’, B, black histogram bars). B, Dynamics for emergence of dominant large input, analyzed as for anatomical inputs in Figure 8A. Number of cells at each age indicated above histogram.
0 2 4 6 80
0.2
0.4
0.6
0.8
1
0 1 2 3 4 5 6 70
50
100
150
200
250
300
Small
21 37 18 43P
erce
nt o
f Tot
al C
ells
Postnatal Day
A
C D
ASA% PhasicAP CurrentThreshold
Nor
mal
ized
Uni
ts
Postnatal Day
B
0 2 4 6 8 100
20
40
60
80
100
P2 P3 P4 P6 P90
20
40
60
80
100
21 21
9
7
6
12
10
32
7
58
66
Postnatal Day
Per
cent
of T
otal
Cel
ls
App
osed
sur
face
are
a (µ
m2 )
Growth (µm2)Growth Rate (µm2/day)
Postnatal Day
Figure 8. Competition and population growth dynamics of calycigenic terminals. A, Summary histograms of nerve terminal growth by prevalence of MNTB cells with inputs in the categories of(1) only small terminals (red), (2) actively competing large terminals (open; size ratio, �5), and (3) a dominant large input (black; size ratio, �5). Numbers of cells analyzed at each age indicatedabove histograms. B, Dynamics for emergence of a dominant large input. Exponential fit with �� 2.7 d, R 2 � 0.94. C, Population growth dynamics for calyx-forming inputs. Data points are averageof the largest terminal onto each reconstructed cell between P2 and P6; size of largest input at P9 was assessed qualitatively for most cells. At P6, cells with inputs �75 �m 2 excluded from analysisas these likely formed a distinct population (see Results for P6 and P9). Data were fitted to a Boltzmann function as described in Materials and Methods. Slope of curve reveals growth rate, whichpeaks at 207 �m 2/d. D, Coordinated time scales for calyx growth (Boltzmann fit from C, solid line), transition of AP firing phenotype from tonic to phasic (dashed line) and increase in AP thresholdto current pulse injection (dash-dotted line) from Hoffpauir et al. (2010). Horizontal line indicates half-maximum of normalized ordinate values.
Holcomb et al. • Synaptic Competition during Calyx of Held Development J. Neurosci., August 7, 2013 • 33(32):12954 –12969 • 12965
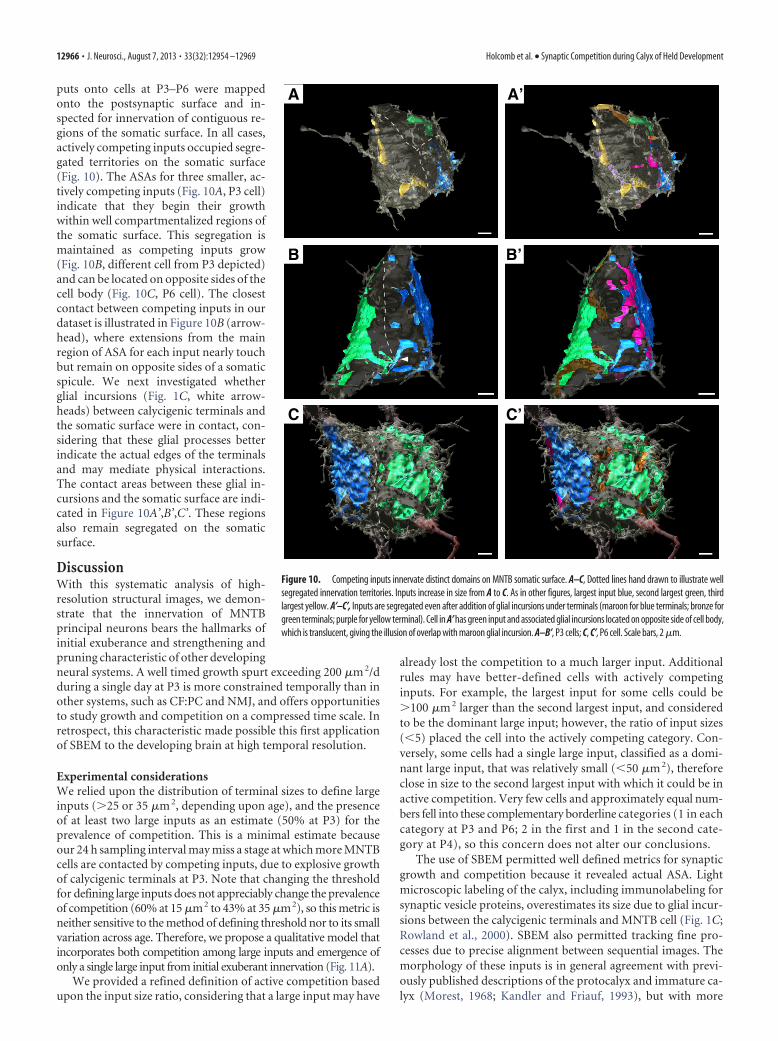
puts onto cells at P3–P6 were mappedonto the postsynaptic surface and in-spected for innervation of contiguous re-gions of the somatic surface. In all cases,actively competing inputs occupied segre-gated territories on the somatic surface(Fig. 10). The ASAs for three smaller, ac-tively competing inputs (Fig. 10A, P3 cell)indicate that they begin their growthwithin well compartmentalized regions ofthe somatic surface. This segregation ismaintained as competing inputs grow(Fig. 10B, different cell from P3 depicted)and can be located on opposite sides of thecell body (Fig. 10C, P6 cell). The closestcontact between competing inputs in ourdataset is illustrated in Figure 10B (arrow-head), where extensions from the mainregion of ASA for each input nearly touchbut remain on opposite sides of a somaticspicule. We next investigated whetherglial incursions (Fig. 1C, white arrow-heads) between calycigenic terminals andthe somatic surface were in contact, con-sidering that these glial processes betterindicate the actual edges of the terminalsand may mediate physical interactions.The contact areas between these glial in-cursions and the somatic surface are indi-cated in Figure 10A’,B’,C’. These regionsalso remain segregated on the somaticsurface.
DiscussionWith this systematic analysis of high-resolution structural images, we demon-strate that the innervation of MNTBprincipal neurons bears the hallmarks ofinitial exuberance and strengthening andpruning characteristic of other developingneural systems. A well timed growth spurt exceeding 200 �m 2/dduring a single day at P3 is more constrained temporally than inother systems, such as CF:PC and NMJ, and offers opportunitiesto study growth and competition on a compressed time scale. Inretrospect, this characteristic made possible this first applicationof SBEM to the developing brain at high temporal resolution.
Experimental considerationsWe relied upon the distribution of terminal sizes to define largeinputs (�25 or 35 �m 2, depending upon age), and the presenceof at least two large inputs as an estimate (50% at P3) for theprevalence of competition. This is a minimal estimate becauseour 24 h sampling interval may miss a stage at which more MNTBcells are contacted by competing inputs, due to explosive growthof calycigenic terminals at P3. Note that changing the thresholdfor defining large inputs does not appreciably change the prevalenceof competition (60% at 15 �m2 to 43% at 35 �m2), so this metric isneither sensitive to the method of defining threshold nor to its smallvariation across age. Therefore, we propose a qualitative model thatincorporates both competition among large inputs and emergence ofonly a single large input from initial exuberant innervation (Fig. 11A).
We provided a refined definition of active competition basedupon the input size ratio, considering that a large input may have
already lost the competition to a much larger input. Additionalrules may have better-defined cells with actively competinginputs. For example, the largest input for some cells could be�100 �m 2 larger than the second largest input, and consideredto be the dominant large input; however, the ratio of input sizes(�5) placed the cell into the actively competing category. Con-versely, some cells had a single large input, classified as a domi-nant large input, that was relatively small (�50 �m 2), thereforeclose in size to the second largest input with which it could be inactive competition. Very few cells and approximately equal num-bers fell into these complementary borderline categories (1 in eachcategory at P3 and P6; 2 in the first and 1 in the second cate-gory at P4), so this concern does not alter our conclusions.
The use of SBEM permitted well defined metrics for synapticgrowth and competition because it revealed actual ASA. Lightmicroscopic labeling of the calyx, including immunolabeling forsynaptic vesicle proteins, overestimates its size due to glial incur-sions between the calycigenic terminals and MNTB cell (Fig. 1C;Rowland et al., 2000). SBEM also permitted tracking fine pro-cesses due to precise alignment between sequential images. Themorphology of these inputs is in general agreement with previ-ously published descriptions of the protocalyx and immature ca-lyx (Morest, 1968; Kandler and Friauf, 1993), but with more
A A’
B B’
C C’
Figure 10. Competing inputs innervate distinct domains on MNTB somatic surface. A–C, Dotted lines hand drawn to illustrate wellsegregated innervation territories. Inputs increase in size from A to C. As in other figures, largest input blue, second largest green, thirdlargest yellow. A’–C’, Inputs are segregated even after addition of glial incursions under terminals (maroon for blue terminals; bronze forgreen terminals; purple for yellow terminal). Cell in A’ has green input and associated glial incursions located on opposite side of cell body,which is translucent, giving the illusion of overlap with maroon glial incursion. A–B’, P3 cells; C, C’, P6 cell. Scale bars, 2 �m.
12966 • J. Neurosci., August 7, 2013 • 33(32):12954 –12969 Holcomb et al. • Synaptic Competition during Calyx of Held Development
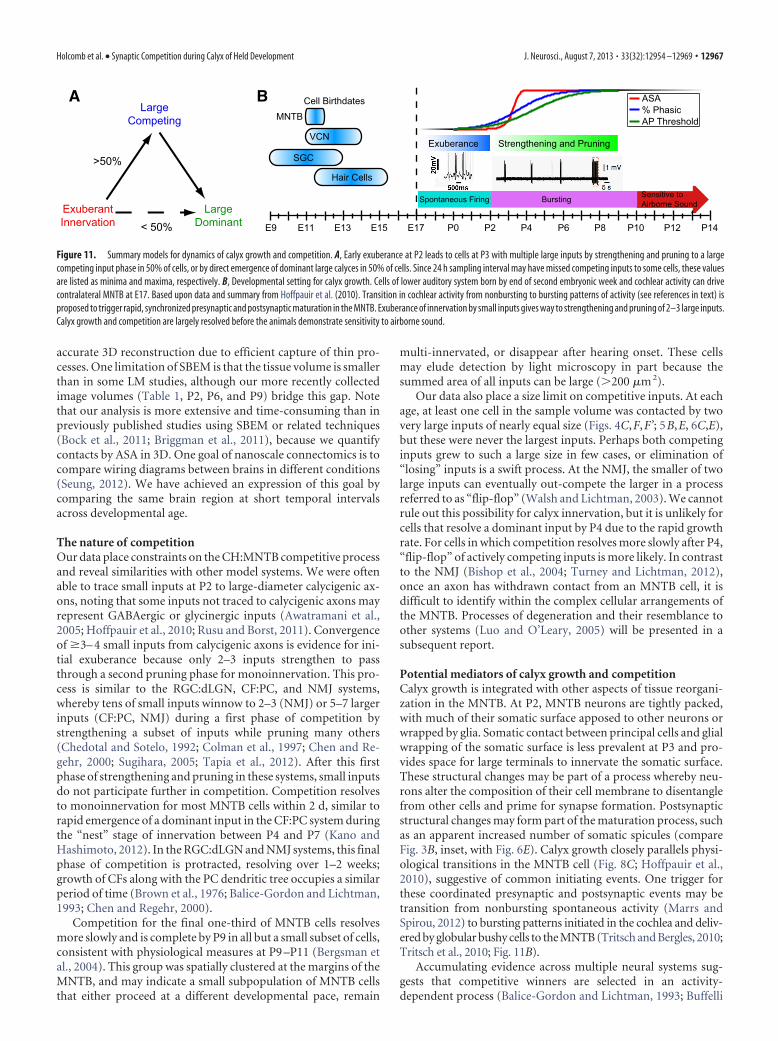
accurate 3D reconstruction due to efficient capture of thin pro-cesses. One limitation of SBEM is that the tissue volume is smallerthan in some LM studies, although our more recently collectedimage volumes (Table 1, P2, P6, and P9) bridge this gap. Notethat our analysis is more extensive and time-consuming than inpreviously published studies using SBEM or related techniques(Bock et al., 2011; Briggman et al., 2011), because we quantifycontacts by ASA in 3D. One goal of nanoscale connectomics is tocompare wiring diagrams between brains in different conditions(Seung, 2012). We have achieved an expression of this goal bycomparing the same brain region at short temporal intervalsacross developmental age.
The nature of competitionOur data place constraints on the CH:MNTB competitive processand reveal similarities with other model systems. We were oftenable to trace small inputs at P2 to large-diameter calycigenic ax-ons, noting that some inputs not traced to calycigenic axons mayrepresent GABAergic or glycinergic inputs (Awatramani et al.,2005; Hoffpauir et al., 2010; Rusu and Borst, 2011). Convergenceof �3– 4 small inputs from calycigenic axons is evidence for ini-tial exuberance because only 2–3 inputs strengthen to passthrough a second pruning phase for monoinnervation. This pro-cess is similar to the RGC:dLGN, CF:PC, and NMJ systems,whereby tens of small inputs winnow to 2–3 (NMJ) or 5–7 largerinputs (CF:PC, NMJ) during a first phase of competition bystrengthening a subset of inputs while pruning many others(Chedotal and Sotelo, 1992; Colman et al., 1997; Chen and Re-gehr, 2000; Sugihara, 2005; Tapia et al., 2012). After this firstphase of strengthening and pruning in these systems, small inputsdo not participate further in competition. Competition resolvesto monoinnervation for most MNTB cells within 2 d, similar torapid emergence of a dominant input in the CF:PC system duringthe “nest” stage of innervation between P4 and P7 (Kano andHashimoto, 2012). In the RGC:dLGN and NMJ systems, this finalphase of competition is protracted, resolving over 1–2 weeks;growth of CFs along with the PC dendritic tree occupies a similarperiod of time (Brown et al., 1976; Balice-Gordon and Lichtman,1993; Chen and Regehr, 2000).
Competition for the final one-third of MNTB cells resolvesmore slowly and is complete by P9 in all but a small subset of cells,consistent with physiological measures at P9 –P11 (Bergsman etal., 2004). This group was spatially clustered at the margins of theMNTB, and may indicate a small subpopulation of MNTB cellsthat either proceed at a different developmental pace, remain
multi-innervated, or disappear after hearing onset. These cellsmay elude detection by light microscopy in part because thesummed area of all inputs can be large (�200 �m 2).
Our data also place a size limit on competitive inputs. At eachage, at least one cell in the sample volume was contacted by twovery large inputs of nearly equal size (Figs. 4C,F,F’; 5B,E, 6C,E),but these were never the largest inputs. Perhaps both competinginputs grew to such a large size in few cases, or elimination of“losing” inputs is a swift process. At the NMJ, the smaller of twolarge inputs can eventually out-compete the larger in a processreferred to as “flip-flop” (Walsh and Lichtman, 2003). We cannotrule out this possibility for calyx innervation, but it is unlikely forcells that resolve a dominant input by P4 due to the rapid growthrate. For cells in which competition resolves more slowly after P4,“flip-flop” of actively competing inputs is more likely. In contrastto the NMJ (Bishop et al., 2004; Turney and Lichtman, 2012),once an axon has withdrawn contact from an MNTB cell, it isdifficult to identify within the complex cellular arrangements ofthe MNTB. Processes of degeneration and their resemblance toother systems (Luo and O’Leary, 2005) will be presented in asubsequent report.
Potential mediators of calyx growth and competitionCalyx growth is integrated with other aspects of tissue reorgani-zation in the MNTB. At P2, MNTB neurons are tightly packed,with much of their somatic surface apposed to other neurons orwrapped by glia. Somatic contact between principal cells and glialwrapping of the somatic surface is less prevalent at P3 and pro-vides space for large terminals to innervate the somatic surface.These structural changes may be part of a process whereby neu-rons alter the composition of their cell membrane to disentanglefrom other cells and prime for synapse formation. Postsynapticstructural changes may form part of the maturation process, suchas an apparent increased number of somatic spicules (compareFig. 3B, inset, with Fig. 6E). Calyx growth closely parallels physi-ological transitions in the MNTB cell (Fig. 8C; Hoffpauir et al.,2010), suggestive of common initiating events. One trigger forthese coordinated presynaptic and postsynaptic events may betransition from nonbursting spontaneous activity (Marrs andSpirou, 2012) to bursting patterns initiated in the cochlea and deliv-ered by globular bushy cells to the MNTB (Tritsch and Bergles, 2010;Tritsch et al., 2010; Fig. 11B).
Accumulating evidence across multiple neural systems sug-gests that competitive winners are selected in an activity-dependent process (Balice-Gordon and Lichtman, 1993; Buffelli
Sensitive toAirborne Sound
E17 P0 P2 P4 P6 P8 P10 P12E15E13E11E9 P14
Synaptic Activity (MNTB)
MNTB
VCN
SGC
Hair Cells
Cell Birthdates ASA% PhasicAP Threshold
Exuberance Strengthening and Pruning
Spontaneous Firing BurstingExuberantInnervation
LargeCompeting
LargeDominant
>50%
< 50%
BA
Figure 11. Summary models for dynamics of calyx growth and competition. A, Early exuberance at P2 leads to cells at P3 with multiple large inputs by strengthening and pruning to a largecompeting input phase in 50% of cells, or by direct emergence of dominant large calyces in 50% of cells. Since 24 h sampling interval may have missed competing inputs to some cells, these valuesare listed as minima and maxima, respectively. B, Developmental setting for calyx growth. Cells of lower auditory system born by end of second embryonic week and cochlear activity can drivecontralateral MNTB at E17. Based upon data and summary from Hoffpauir et al. (2010). Transition in cochlear activity from nonbursting to bursting patterns of activity (see references in text) isproposed to trigger rapid, synchronized presynaptic and postsynaptic maturation in the MNTB. Exuberance of innervation by small inputs gives way to strengthening and pruning of 2–3 large inputs.Calyx growth and competition are largely resolved before the animals demonstrate sensitivity to airborne sound.
Holcomb et al. • Synaptic Competition during Calyx of Held Development J. Neurosci., August 7, 2013 • 33(32):12954 –12969 • 12967
et al., 2003; Hooks and Chen, 2006; Ohtsuki and Hirano, 2008;Favero et al., 2012) triggered by cell signaling pathways involvingprotein kinases (for review, see Watanabe and Kano, 2011) andpossibly subject to global factors, such as metabolic load of thepresynaptic neuron (Kasthuri and Lichtman, 2003). Activelycompeting calyces are also growing, indicating a level of supportfor both inputs by the MNTB cell. In contrast to the NMJ, whereaxons vie for a fixed postsynaptic receptor area (Turney and Lich-tman, 2012), competing calycigenic inputs are segregated on thesomatic surface (Fig. 10). This spatial organization may facilitatereinforcement via a Hebbian mechanism of inputs that stayahead of the rapid and concurrent increase in AP threshold. Lo-cation of calyx-forming inputs on the somatic surface may be adeterminant of the eventual winner, similar to early designationof the winning CF as the first to innervate the dendritic pole of thePC body (Hashimoto et al., 2009). Further investigation shouldinclude assessment of CH:MNTB growth dynamics across theentire frequency axis of the MNTB so that local competing mech-anisms can be compared with global mechanisms, including mis-matched chemical signals, such as Ephs and ephrins (Hsieh et al.,2010; Nakamura et al., 2012), as has been studied at the NMJ(Tapia et al., 2012).
In summary, the CH:MNTB shares features with other modelsystems for neural development. A unique feature for the CH:MNTB is the more rapid occurrence of these developmentalevents and their completion before the onset of sensitivity toairborne sound between P10 and P12 (Ehret, 1976; Romand andEhret, 1990; Kamiya et al., 2001; Sonntag et al., 2009). This com-pressed time frame has made possible precise quantification ofpopulation growth dynamics and may offer experimental advan-tages to decipher cellular mechanisms for synaptic growth andcompetition.
NotesThis article has associated cover videos.
ReferencesAwatramani GB, Turecek R, Trussell LO (2005) Staggered development of
GABAergic and glycinergic transmission in the MNTB. J Neurophysiol93:819 – 828. Medline
Balice-Gordon RJ, Lichtman JW (1990) In vivo visualization of the growthof pre- and postsynaptic elements of neuromuscular junctions in themouse. J Neurosci 10:894 –908. Medline
Balice-Gordon RJ, Lichtman JW (1993) In vivo observations of pre- andpostsynaptic changes during the transition from multiple to single inner-vation at developing neuromuscular junctions. J Neurosci 13:834 – 855.Medline
Banks MI, Smith PH (1992) Intracellular recordings from neurobiotin-labeled cells in brain slices of the rat medial nucleus of the trapezoid body.J Neurosci 12:2819 –2837. Medline
Bergsman JB, De Camilli P, McCormick DA (2004) Multiple large inputs toprincipal cells in the mouse medial nucleus of the trapezoid body. J Neu-rophysiol 92:545–552. CrossRef Medline
Bishop DL, Misgeld T, Walsh MK, Gan WB, Lichtman JW (2004) Axonbranch removal at developing synapses by axosome shedding. Neuron44:651– 661. CrossRef Medline
Bock DD, Lee WC, Kerlin AM, Andermann ML, Hood G, Wetzel AW, Yur-genson S, Soucy ER, Kim HS, Reid RC (2011) Network anatomy and invivo physiology of visual cortical neurons. Nature 471:177–182. CrossRefMedline
Borst JG, Soria van Hoeve J (2012) The calyx of held synapse: from modelsynapse to auditory relay. Annu Rev Physiol 74:199 –224. CrossRefMedline
Briggman KL, Helmstaedter M, Denk W (2011) Wiring specificity in thedirection-selectivity circuit of the retina. Nature 471:183–188. CrossRefMedline
Brown MC, Jansen JK, Van Essen D (1976) Polyneuronal innervation ofskeletal muscle in new-born rats and its elimination during maturation.J Physiol 261:387– 422. Medline
Buffelli M, Burgess RW, Feng G, Lobe CG, Lichtman JW, Sanes JR (2003)Genetic evidence that relative synaptic efficacy biases the outcome ofsynaptic competition. Nature 424:430 – 434. CrossRef Medline
Chedotal A, Sotelo C (1992) Early development of olivocerebellar projec-tions in the fetal rat using CGRP immunocytochemistry. Eur J Neurosci4:1159 –1179. CrossRef Medline
Chen C, Regehr WG (2000) Developmental remodeling of the retino-geniculate synapse. Neuron 28:955–966. CrossRef Medline
Colman H, Nabekura J, Lichtman JW (1997) Alterations in synapticstrength preceding axon withdrawal. Science 275:356 –361. CrossRefMedline
Denk W, Horstmann H (2004) Serial block-face scanning electron micros-copy to reconstruct three-dimensional tissue nanostructure. PLoS Biol2:e329. CrossRef Medline
Ehret G (1976) Development of absolute auditory thresholds in the housemouse (Mus musculus). J Am Audiol Soc 1:179 –184. Medline
Favero M, Busetto G, Cangiano A (2012) Spike timing plays a key role insynapse elimination at the neuromuscular junction. Proc Natl Acad SciU S A 109:E1667–E1675. CrossRef Medline
Ford MC, Grothe B, Klug A (2009) Fenestration of the calyx of Held occurssequentially along the tonotopic axis, is influenced by afferent activity,and facilitates glutamate clearance. J Comp Neurol 514:92–106. CrossRefMedline
Forsythe ID, Barnes-Davies M (1993) The binaural auditory pathway: excit-atory amino acid receptors mediate dual timecourse excitatory postsyn-aptic currents in the rat medial nucleus of the trapezoid body. Proc BiolSci 251:151–157. CrossRef Medline
Friauf E, Ostwald J (1988) Divergent projections of physiologically charac-terized rat ventral cochlear nucleus neurons as shown by intra-axonalinjection of horseradish peroxidase. Exp Brain Res 73:263–284. Medline
Futai K, Okada M, Matsuyama K, Takahashi T (2001) High-fidelity trans-mission acquired via a developmental decrease in NMDA receptor ex-pression at an auditory synapse. J Neurosci 21:3342–3349. Medline
Hashimoto K, Ichikawa R, Kitamura K, Watanabe M, Kano M (2009)Translocation of a “winner” climbing fiber to the Purkinje cell dendriteand subsequent elimination of “losers” from the soma in developing cer-ebellum. Neuron 63:106 –118. CrossRef Medline
Hoffpauir BK, Grimes JL, Mathers PH, Spirou GA (2006) Synaptogenesis ofthe calyx of Held: rapid onset of function and one-to-one morphologicalinnervation. J Neurosci 26:5511–5523. CrossRef Medline
Hoffpauir BK, Kolson DR, Mathers PH, Spirou GA (2010) Maturation ofsynaptic partners: functional phenotype and synaptic organization tunedin synchrony. J Physiol 588:4365– 4385. CrossRef Medline
Hollander M, Wolfe D (1999) Nonparametric statistical methods, 2nd ed.New York: Wiley.
Hong YK, Chen C (2011) Wiring and rewiring of the retinogeniculate syn-apse. Curr Opin Neurobiol 21:228 –237. CrossRef Medline
Hooks BM, Chen C (2006) Distinct roles for spontaneous and visual activityin remodeling of the retinogeniculate synapse. Neuron 52:281–291.CrossRef Medline
Hsieh CY, Nakamura PA, Luk SO, Miko IJ, Henkemeyer M, Cramer KS(2010) Ephrin-B reverse signaling is required for formation of strictlycontralateral auditory brainstem pathways. J Neurosci 30:9840 –9849.CrossRef Medline
Kamiya K, Takahashi K, Kitamura K, Momoi T, Yoshikawa Y (2001) Mito-sis and apoptosis in postnatal auditory system of the C3H/He strain. BrainRes 901:296 –302. CrossRef Medline
Kandler K, Friauf E (1993) Pre- and postnatal development of efferent con-nections of the cochlear nucleus in the rat. J Comp Neurol 328:161–184.CrossRef Medline
Kano M, Hashimoto K (2012) Activity-dependent maturation of climbingfiber to Purkinje cell synapses during postnatal cerebellar development.Cerebellum 11:449 – 450. CrossRef Medline
12968 • J. Neurosci., August 7, 2013 • 33(32):12954 –12969 Holcomb et al. • Synaptic Competition during Calyx of Held Development
Kasthuri N, Lichtman JW (2003) The role of neuronal identity in synapticcompetition. Nature 424:426 – 430. CrossRef Medline
Kleinfeld D, Bharioke A, Blinder P, Bock DD, Briggman KL, Chklovskii DB,Denk W, Helmstaedter M, Kaufhold JP, Lee WC, Meyer HS, Micheva KD,Oberlaender M, Prohaska S, Reid RC, Smith SJ, Takemura S, Tsai PS,Sakmann B (2011) Large-scale automated histology in the pursuit ofconnectomes. J Neurosci 31:16125–16138. CrossRef Medline
Kuwabara N, DiCaprio RA, Zook JM (1991) Afferents to the medial nucleusof the trapezoid body and their collateral projections. J Comp Neurol314:684 –706. CrossRef
Luo L, O’Leary DD (2005) Axon retraction and degeneration in develop-ment and disease. Annu Rev Neurosci 28:127–156. CrossRef Medline
Marrs GS, Spirou GA (2012) Embryonic assembly of auditory circuits: spi-ral ganglion and brainstem. J Physiol 590:2391–2408. Medline
Mattox DE, Neises GR, Gulley RL (1982) A freeze-fracture study of the mat-uration of synapses in the anteroventral cochlear nucleus of the develop-ing rat. Anat Rec 204:281–287. CrossRef Medline
Morest D (1968) The growth of synaptic endings in the mammalian brain: astudy of the calyces of the trapezoid body. Anat Embryol 127:201–220.CrossRef
Nakamura PA, Hsieh CY, Cramer KS (2012) EphB signaling regulates targetinnervation in the developing and deafferented auditory brainstem. DevNeurobiol 72:1243–1255. CrossRef Medline
Ohtsuki G, Hirano T (2008) Bidirectional plasticity at developing climbingfiber–Purkinje neuron synapses. Eur J Neurosci 28:2393–2400. CrossRefMedline
Peters A, Palay S, Webster H (1991) The fine structure of the nervous sys-tem: neurons and their supporting cells, 3rd ed. New York: Oxford UP.
Pologruto TA, Sabatini BL, Svoboda K (2003) ScanImage: flexible softwarefor operating laser scanning microscopes. Biomed Eng Online 2:13.CrossRef Medline
Purves D, Lichtman J (1980) Elimination of synapses in the developing ner-vous system. Science 210:153–157. CrossRef Medline
Rodríguez-Contreras A, de Lange RP, Lucassen PJ, Borst JG (2006) Branch-ing of calyceal afferents during postnatal development in the rat auditorybrainstem. J Comp Neurol 496:214 –228. CrossRef Medline
Rodríguez-Contreras A, van Hoeve JS, Habets RL, Locher H, Borst JG (2008)Dynamic development of the calyx of Held synapse. Proc Natl Acad SciU S A 105:5603–5608. CrossRef Medline
Romand R, Ehret G (1990) Development of tonotopy in the inferior collicu-lus. I. Electrophysiological mapping in house mice. Brain Res Dev BrainRes 54:221–234. CrossRef Medline
Rowland KC, Irby NK, Spirou GA (2000) Specialized synapse-associatedstructures within the calyx of Held. J Neurosci 20:9135–9144. Medline
Rusu SI, Borst JG (2011) Developmental changes in intrinsic excitability ofprincipal neurons in the rat medial nucleus of the trapezoid body. DevNeurobiol 71:284 –295. CrossRef Medline
Seung S (2012) Connectome: how the brain’s wiring makes us who we are,1st ed. Boston: Houghton Mifflin Harcourt.
Smith PH, Joris PX, Carney LH, Yin TC (1991) Projections of physiologi-
cally characterized globular bushy cell axons from the cochlear nucleus ofthe cat. J Comp Neurol 304:387– 407. CrossRef Medline
Sonntag M, Englitz B, Kopp-Scheinpflug C, Rubsamen R (2009) Early post-natal development of spontaneous and acoustically evoked discharge ac-tivity of principal cells of the medial nucleus of the trapezoid body: an invivo study in mice. J Neurosci 29:9510 –9520. CrossRef Medline
Spirou GA, Brownell WE, Zidanic M (1990) Recordings from cat trapezoidbody and HRP labeling of globular bushy cell axons. J Neurophysiol 63:1169 –1190. Medline
Sugihara I (2005) Microzonal projection and climbing fiber remodeling insingle olivocerebellar axons of newborn rats at postnatal days 4 –7.J Comp Neurol 487:93–106. CrossRef Medline
Tapia JC, Wylie JD, Kasthuri N, Hayworth KJ, Schalek R, Berger DR, Guati-mosim C, Seung HS, Lichtman JW (2012) Pervasive synaptic branchremoval in the mammalian neuromuscular system at birth. Neuron 74:816 – 829. CrossRef Medline
Tritsch NX, Bergles DE (2010) Developmental regulation of spontaneousactivity in the mammalian cochlea. J Neurosci 30:1539 –1550. CrossRefMedline
Tritsch NX, Rodríguez-Contreras A, Crins TT, Wang HC, Borst JG, BerglesDE (2010) Calcium action potentials in hair cells pattern auditory neu-ron activity before hearing onset. Nat Neurosci 13:1050 –1052. CrossRefMedline
Turney SG, Lichtman JW (2012) Reversing the outcome of synapse elimi-nation at developing neuromuscular junctions in vivo: evidence for syn-aptic competition and its mechanism. PLoS Biol 10:e1001352. CrossRefMedline
Vaughn JE (1989) Fine structure of synaptogenesis in the vertebrate centralnervous system. Synapse 3:255–285. CrossRef Medline
Walsh MK, Lichtman JW (2003) In vivo time-lapse imaging of synaptictakeover associated with naturally occurring synapse elimination. Neu-ron 37:67–73. CrossRef Medline
Warr WB (1972) Fiber degeneration following lesions in the multipolar andglobular cell areas in the ventral cochlear nucleus of the cat. Brain Res40:247–270. CrossRef Medline
Watanabe M, Kano M (2011) Climbing fiber synapse elimination in cere-bellar Purkinje cells. Eur J Neurosci 34:1697–1710. CrossRef Medline
Wilke SA, Antonios JK, Bushong EA, Badkoobehi A, Malek E, Hwang M,Terada M, Ellisman MH, Ghosh A (2013) Deconstructing complexity:serial block-face electron microscopic analysis of the hippocampal mossyfiber synapse. J Neurosci 33:507–522. CrossRef Medline
Wu H, Xiong WC, Mei L (2010) To build a synapse: signaling pathways inneuromuscular junction assembly. Development 137:1017–1033.CrossRef Medline
Yang S, Adhikari S, Dobbala M, Adusumilli S, Rowley JD, Ganikhanov F,Zhang L, Marrs G, Wysolmerski R, Spirou G (2013) Multi-color ultra-fast laser platform for nonlinear optical imaging based on independentlytunable optical parametric oscillators. Appl Phys B. Advance online pub-lication. Retrieved March 4, 2013. doi:10.1007/s00340-013-5381-x.CrossRef
Holcomb et al. • Synaptic Competition during Calyx of Held Development J. Neurosci., August 7, 2013 • 33(32):12954 –12969 • 12969