Services in global value chains: from inputs to value-creating ...
29
1 Services in global value chains: from inputs to value-creating activities Sébastien Miroudot, OECD Preliminary draft, 4 March 2016 1. Introduction While nearly two-thirds of all economic activity is made up of services, trade in services represents a small share of world trade according to balance of payments data, between one fifth and one quarter. With a value-added approach, services account however for a larger share of world exports, almost 50% according to the TiVA database. Value added trade statistics are useful to reveal the true importance of services inputs in trade but cannot fully capture all services activities and particularly the ones provided in-house within manufacturing firms. Moreover, services are exported not only by services firms but also by manufacturing firms (Kelle, 2013). Manufacturing firms often export R&D services, particularly to their affiliates, together with other headquarter services. But there are also increasingly exports of services that are bundled with material goods (e.g. installation, maintenance and repair services). Through this process, known as “servitization”, firms create more value and try to accompany the existing product all along its life cycle (Vandermerwe and Rada, 1988). More recently, the role of services as value-creating activities has been even more emphasised in what is described as “service science” (Demirkan et al., 2011), an interdisciplinary approach aimed at understanding the complex interactions between people, technology and organisations when services are provided. The starting point is that services involve the deployment of knowledge, skills and competences that one person or organisation has in order to create value for another, often done as a single customised job involving substantial input from the customer. Services lead to higher value creation. Against this backdrop, this chapter contributes to a better understanding of the role of services in GVCs by providing new data and analysis highlighting that services are activities creating value, with important implications for developing and emerging economies. Section 2 describes the data and methodology used to assess the prevalence of services in value chains, relying on input-
-
Upload
khangminh22 -
Category
Documents
-
view
3 -
download
0
Transcript of Services in global value chains: from inputs to value-creating ...

1
Services in global value chains: from inputs to value-creating activities
Sébastien Miroudot, OECD
Preliminary draft, 4 March 2016
1. Introduction
While nearly two-thirds of all economic activity is made up of services, trade in services
represents a small share of world trade according to balance of payments data, between one fifth
and one quarter. With a value-added approach, services account however for a larger share of world
exports, almost 50% according to the TiVA database. Value added trade statistics are useful to reveal
the true importance of services inputs in trade but cannot fully capture all services activities and
particularly the ones provided in-house within manufacturing firms.
Moreover, services are exported not only by services firms but also by manufacturing firms
(Kelle, 2013). Manufacturing firms often export R&D services, particularly to their affiliates, together
with other headquarter services. But there are also increasingly exports of services that are bundled
with material goods (e.g. installation, maintenance and repair services). Through this process, known
as “servitization”, firms create more value and try to accompany the existing product all along its life
cycle (Vandermerwe and Rada, 1988).
More recently, the role of services as value-creating activities has been even more
emphasised in what is described as “service science” (Demirkan et al., 2011), an interdisciplinary
approach aimed at understanding the complex interactions between people, technology and
organisations when services are provided. The starting point is that services involve the deployment
of knowledge, skills and competences that one person or organisation has in order to create value
for another, often done as a single customised job involving substantial input from the customer.
Services lead to higher value creation.
Against this backdrop, this chapter contributes to a better understanding of the role of
services in GVCs by providing new data and analysis highlighting that services are activities creating
value, with important implications for developing and emerging economies. Section 2 describes the
data and methodology used to assess the prevalence of services in value chains, relying on input-
2
output data but also a large collection of occupational data from labour force surveys. Section 3
discusses the role of services in GVCs, reviewing the main results from the existing literature and
identifying some gaps where new analysis is needed. Section 4 then provides new indicators and
describes some trends observed between 1995 and 2011, complementing the value-added trade
analysis of services in value chains with new dimensions such as insourced services. In Section 5, the
traditional value chain analysis is revisited to add business functions describing more accurately the
role of services in manufacturing value chains and in services value chains, using empirical evidence.
Section 6 concludes and identifies the most important policies that can promote services as value-
creating activities, particularly in developing countries.
2. Data and methodology
In order to analyse the role of services in global value chains, this chapter relies on inter-
country input-output data from the OECD-WTO Trade in Value Added (TiVA) project, complemented
with occupational data at the industry level.
Measuring the contribution of services to gross exports and final demand
The starting point for the analysis of the role of services in global value chains is the
decomposition of value-added in exports according to the industry of origin. Building on the work of
Hummels et al. (2001), Koopman et al. (2014) were the first to propose a decomposition of gross
exports based on an inter-country input-output table. They do not look specifically at the industry of
origin of value-added but their matrix algebra allows such decomposition. Foster-McGregor and
Stehrer (2013), as well as Los et al. (2016), have provided alternative formulas in what is now a
growing literature on trade in value-added. In this paper, we rely on the calculations done within the
TiVA project where several indicators have been created to account for services value-added in trade
(OECD, 2013).
The main indicator is the total value added of the services sector embodied in gross exports
(by industry), as a percentage of total exports. It is calculated as:
𝑆𝐸𝑅𝑉_𝑉𝐴𝐺𝑅𝑐,𝑝,𝑖 = ∑ 𝑉𝑝,𝑗(𝐵𝑝,𝑐)𝑗𝑖𝑗∈𝑆 𝐸𝑋𝐺𝑅𝑐,𝑝,𝑖/∑ 𝐸𝑋𝐺𝑅𝑐,𝑝,𝑖𝑝 (1)
where 𝑉𝑝,𝑗is a vector of the value added share of service industry j in partner country p (which
can be foreign or domestic), B is the global Leontief inverse of the inter-country input-output matrix
(𝐵 = (𝐼 − 𝐴)−1 with (𝐵𝑝,𝑐)𝑗𝑖 the ji-th element of 𝐵𝑝,𝑐) and 𝐸𝑋𝐺𝑅𝑐,𝑝,𝑖 is a vector of gross exports
from country c to country p for any given industry i (where 𝑐 ≠ 𝑝). ∑ 𝐸𝑋𝐺𝑅𝑐,𝑝,𝑖𝑝 are total exports for
country c and industry i.

3
The services content of gross exports can then be decomposed into a domestic and foreign
part, and the domestic part further decomposed into the direct domestic service industry value
added content of gross exports (i.e. services VA from the exporting industry), the indirect domestic
services content of gross exports (i.e. services VA from other domestic industries) and the re-
imported domestic services value added content of gross exports (i.e. domestic services VA found in
imported intermediate inputs). See OECD (2013) for the formulas.
A similar approach can lead to the measurement of services value added embodied in foreign
final demand:
𝑆𝐸𝑅𝑉_𝑉𝐴𝐹𝐷𝑐,𝑝,𝑖 = ∑ 𝑉𝑝,𝑗(𝐵𝑝,𝑐)𝑗𝑖𝑗∈𝑆 𝐸𝑋𝐺𝑅𝐹𝑐,𝑝,𝑖/∑ 𝐸𝑋𝐺𝑅𝐹𝑐,𝑝,𝑖𝑝 (2)
where 𝑆𝐸𝑅𝑉_𝑉𝐴𝐹𝐷𝑐,𝑝,𝑖 represents the share of services VA in final demand of country c that
is sourced from partner p for any given sector i. The formula is the same as in equation (1) except
that gross exports are replaced by a vector of final demand in country c (𝐸𝑋𝐺𝑅𝐹𝑐,𝑝,𝑖). Looking at
value-added in final demand rather than exports is the approach followed by Johnson and Noguera
(2012). It answers a different question as compared to equation (1) which is about tracing value-
added in gross exports. From equation (2), one can measure how much services VA is contained in
the consumption of country c.
Both equations (1) and (2) provide detailed results by country, partner and industry of
destination -the exporting industry in equation (1), the industry of final consumption in equation (2).
The results are aggregated over services industries j, j being the industry of origin with 𝑗 ∈ 𝑆 (the
group of all services industries). Services industries in TiVA start with ISIC 45 (construction) and
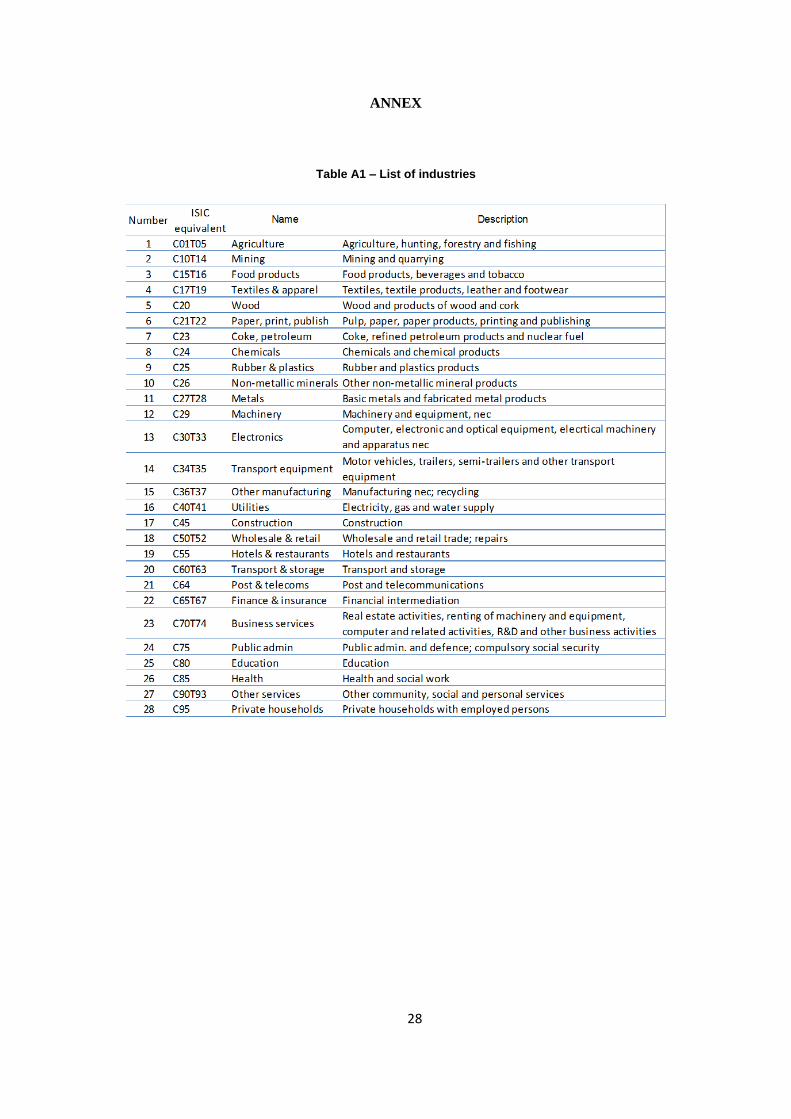
include all industries up to ISIC 95 (private households with employed persons). Table A1 in the
Annex provides the full list of industries used in the chapter, with services sectors corresponding to
industry 17 to industry 28.
The TiVA database is useful to reveal the true importance of services inputs in trade but
cannot fully capture all services activities and particularly the ones provided in-house within
manufacturing firms. This is why additional data are then used to identify more services activities
within manufacturing output.
Identifying business functions to derive services value-added within manufacturing output
The business function is a new statistical unit of analysis proposed in the GVC literature to
capture trends that are difficult to analyse with current statistics (Sturgeon et al., 2013). The starting
point is the analysis of the value chain by Michael Porter (1985) and the distinction between the

4
primary or core activity of the firm (its operations) and a number of intangible support functions
such as R&D, sales, marketing or IT services. These functions are the ones that tend to be outsourced
or offshored and that are behind the fragmentation of production. The analysis of production
through these business functions also highlights the role of services in the creation of value.
Statistics on business functions have started to be collected at the firm-level in the context of
national surveys such as the 2010 National Organizations Survey in the US (Brown et al., 2014) or
EUROSTAT ad-hoc survey on the international sourcing of business functions by enterprises (Nielsen,
2008). These surveys have confirmed that outsourcing and offshoring take place at the level of
business functions rather than individual tasks. One can hope that in the future this type of
information will be more systematically collected by statistical agencies. In the meantime, another
approach has been suggested to identify business functions (Timmer et al., 2015) by relying on
occupational data from labour force surveys. This approach is the one that is followed in this chapter,
but at a more disaggregated level than previously proposed.
The database will be further developed and is at a preliminary stage. It includes occupations
data for 37 countries over the period 1995-2013 (but the year coverage varies across countries). The
sources and the classifications are reported in Table 1.
Table 1. Sources for occupational data by industry
With the exception of the OES survey in the United States, all these labour force surveys rely
on an industry classification derived from ISIC (Rev. 3 or Rev. 4). The conversion to the list of 28
industries found in table A1 is straightforward. In the case of the United States, the data are first
converted to ISIC using the concordance tables provided by the Census Bureau. When it comes to
Source Year coverage Country coverage Data
Eurostat Labour Force Survey (EU LFS) 1995-2013
28 EU countries,
Iceland, Norway,
Switzerland and
Turkey
NACE Rev. 1/Rev. 2, 2-digit
ISCO 88/08, 3-digit
Labour Force, Australia 1997-2011 AustraliaANZSIC 2006, 3-digit
ANZSCO 2006, 2-digit
National Sample Survey (NSS)2000, 2006, 2008,
2010, 2012India
NIC 1998/2004/2008, 2-digit
NCO 1968/2004, 3-digit
Occupational Employment Statistics
(OES) Survey1997-2014 United States
SIC/NAICS, 3-digit
SOC 2000/2010, 6-digit
Pesquisa Nacional por Amostra de
Domicílios (PNAD)2001-2012 Brazil
ISIC Rev.3/Rev.4, 2-digit
National classification of
occupations, 3-digit
Population Census1995, 2000, 2005,
2010Japan
ISIC Rev.3/Rev.4, 2-digit
National classification of
occupations, 3-digit
5
occupations, the classifications are too different across countries to use a single classification.
Instead, we have built specific concordance tables between each classification and a typology of
business functions. This approach should improve the comparability of data across countries. For
example, managers are classified in a very different way in the US SOC classification and the
international ISCO classification. It may be difficult to assess the number of US managers for each
ISCO category (and vice-versa) but all managers belong to the same business function
(“management, administration and back office”). Differences in classifications of occupations do not
generally affect the type of business function.
The typology of business functions used in the analysis is detailed in Table 2. The first
business function corresponds to the core or primary activity of the firm in relation to its industry
code. Typically, it includes occupations directly related to the production process in this industry. For
example, “food processing workers” are part of the core activity of firms involved in food processing.
Some managers are kept within the primary business function when their work is really part of the
production process. Examples include: ‘production managers in agriculture, forestry and fisheries’,
‘professional services managers’ and ‘hotel and restaurant managers’.
All the other business functions are support activities (or secondary business functions) and
can be regarded as services activities (because they would be classified as services when outsourced).
Their role is to support the core activity of the firm. Some essential support functions are “transport,
logistics and distribution”, the activities related to procurement (the sourcing of inputs) and the
delivery of goods and services to customers, as well as “marketing, sales and after-sales service”, a
business function including all the activities related to market research, marketing, advertising and
selling. Customer services, repair and maintenance services are also included in this business
function (under the heading “after-sales service”). These activities are also easily identified in the list
of occupations.
The only difficulty when using the occupational data is to distinguish between the pre-
production and post-production activities related to logistics. Ideally we would like to distinguish the
procurement of inputs from the distribution and logistics activities that are post-production. But the
workers moving the goods or in charge of organising these activities tend to be in similar
occupations. Therefore, they are all included in the “transport, logistics and distribution” business
function.

6
Table 2. Typology of business functions in value chains
Source: Based on Nielsen and Sturgeon (2014).
There is then a group of more horizontal support activities, including ‘IT services and software
support functions’, ‘management, administration and back-office support functions’ (from the
secretaries to the top managers, but excluding managers dedicated to more specific business
functions), ‘R&D, engineering and related technical services’ (in particular certification and technical
No. Business function Definition Examples of occupations (ISCO 2008)
1Operations/Core business
functions
The core/primary business function of
the firm. Generally the production of
goods or services intended for the
market or third-parties.
Food processing and related trades
workers; Wood processing and
papermaking plant operators;
Assemblers; Garment and related
trades workers.
2
Transport, logistics and
distribution support
functions
A support function that includes activities
related to procurement, transportation,
warehousing and the delivery of goods
and services to customers.
Material-recording and transport
clerks; Heavy truck and bus drivers;
Transport and storage labourers.
3
Marketing, sales, after
sales service support
function
A support function focusing on market
analysis, advertising, selling, retail
management, as well as customer
services (including help desks and call
centres).
Sales, marketing and development
managers; Sales, marketing and
public relations professionals;
Cashiers and ticket clerks; Client
information workers.
4IT services and software
support functions
Activities related to data processing,
software development and the provision
of ICT services.
Software and applications developers
and analysts; Database and network
professionals; Information and
communications technology
technicians.
5
Management,
administration, and back-
office support functions
Activities associated with the
administration of the firm, including
legal, finance, accounting and human
resources management.
Managing directors and chief
executives; General office clerks;
Administrative and specialised
secretaries.
6
R&D, engineering and
related technical services
and R&D support functions
This support function includes activities
related to experimental development,
research, design, engineering and related
technical consultancy, technical testing,
analysis and certification.
Mathematicians, actuaries and
statisticians; Architects, planners,
surveyors and designers; Engineering
professionals; Life science
technicians and related associate
professionals; Ship and aircraft
controllers and technicians.
7 Other business functions
Activities related to maintenance and
repair, security, as well as other activities
not belonging to specific firm-level
business functions. Also includes
education and training.
Domestic, hotel and office cleaners
and helpers; Protective services
workers; Machinery mechanics and
repairers; Armed forces officers;
legislators and senior officials;
religious professionals; Secondary
education teachers.

7
testing). The distinction between engineers and workers involved in R&D and design is not always
straightforward and therefore the two are grouped. Researchers are more involved in science,
mathematics, architecture and design (with no reference to a specific industry), while engineers
have an occupation more related to specific industries and specific technical tasks.
It is important to understand that these business functions are part of the “value chain”
defined at the level of the firm, as in the seminal work by Porter (1985). When we talk about GVCs,
the “value chain” is describing a global production process where many firms are involved and each
firm participating in the GVC may have its own “local” value chain where the business functions
described in Table 2 are relevant. The concepts are similar and the “macro” and “micro” value chains
overlap (in particular when a single firm owns the whole global value chain) but one should keep in
mind that a firm producing an input upstream (from a GVC perspective) has R&D, logistics,
marketing and support activities the same way as a firm downstream (producing final goods for
example). The “mix” of business functions is however likely to be different. Firms involved in final
production will have more staff in charge of after-sales services and marketing as opposed to firms
involved mostly in R&D and design activities. But since we aggregate occupations across industries
(and lose the perspective of the firm), the business functions inferred from occupations can still tell
us something about GVCs.
Moreover, the assumption in this work is that we can associate each occupation (at the 3-digit
level in the International Standard Classification of Occupations) with a business function. So far, the
description of each occupation has been used to decide which business function was relevant but
the work could be refined by looking at the information on the task content, such as provided in the
O*NET database from the U.S. Bureau of Labor Statistics or through the OECD PIAAC survey. Another
refinement would be to adapt the classification industry by industry, in particular because the
secondary activities become ‘core’ in sectors that are dedicated to their production. This is why in
Section 5 the value chain framework is complemented with two other frameworks that are more
suited to the analysis of services industries, with a different list of business functions.
3. The role of services in GVCs: not only inputs but much more
The role of services in trade has often been overlooked and it is rather recently that the
emphasis has been put on services trade liberalisation as a major potential source of economic gains
(Francois and Hoekman, 2010). With the literature on global value chains, a new impetus has been
given to services as important inputs in any type of value chain, including manufacturing activities.
8
Services as links in the value chain
From Adam Smith to the latest growth theories, the division of labour has been at the heart of
explanations of productivity growth. GVCs are just the next level in the international division of
labour. They have contributed to the upward shift in productivity observed from the mid-1990s to
the mid-2000s. Trade, and not just the ICT revolution, has increased growth (Feenstra et al., 2013).
In this process, the first role that was identified for services in the value chain is the role they
play in linking manufacturing activities across countries. In order to manage production processes
that are geographically split, companies need services such as transport, communication, logistics,
finance, etc. (Jones and Kierzkowski, 2001). Without these service links, there would be no global
value chain.
Services as inputs for manufacturing activities
But services are not just the “glue” in global value chains (Low, 2013). There are important
services inputs that go beyond linking activities across countries. For example, any value chain starts
with some R&D, design and engineering activities that are service inputs when outsourced. At the
other end of the value chain are also found other services such as marketing and distribution that
are per se important production stages and not just links in the value chain. Therefore, the service
links can be seen as part of a broader category of services inputs that are not only support functions
to enable the value chain but also important inputs in key stages of production.
Some of these service inputs are horizontal in the sense that they are needed by any type of
company in any value chain, while others are specific to certain value chains in the manufacturing
sector. For example, Gereffi and Fernandez-Stark (2010) discuss in detail GVCs in business services
by explicitly distinguishing between horizontal activities (e.g. business consulting, market
intelligence, legal services, accounting, training, marketing and sales, etc.) and vertical activities
(e.g. investment research in the finance sector, risk management for insurance services, industrial
engineering for specific manufacturing sectors, clinical tests in the health and pharmaceutical
industry, etc.).
It is now acknowledged that most services are tradable and that potential welfare gains from
trade liberalisation in services are as high as in the manufacturing sector (Gervais and Jensen, 2013).
Trade theory has evolved to add to the classic framework explaining trade in goods new theories
explaining trade in tasks (Grossman and Rossi-Hansberg, 2008; Baldwin and Robert-Nicoud, 2010).

9
Trade in tasks accounts for the fact that not only final goods are traded but also intermediate goods
and services through offshoring.
An important result from this literature is that trade in tasks leads to productivity with an
effect analogous to factor-augmenting technological change, thus highlighting that services are also
adding value through trade. Growth theories have also emphasised that trade in intermediate goods
and services improves the allocation of capital and labour across sectors and countries (Jones, 2011).
While services embodied in manufacturing goods are only ‘indirectly’ traded, the attention
was recently drawn on some of the policy implications and in particular how they are impacted by
trade rules on goods (Miroudot et al., 2013; Cernat and Kutlina-Dimitrova, 2014).
In-house services
When services are inputs in the production process and supplied by other firms, one can rely
on input-output tables to identify the role they play in manufacturing output or exports (Francois
and Woerz, 2008; Nordås, 2008). However, there is also a ‘servicification’ inside manufacturing firms
which is more difficult to assess. Firms also develop in-house their R&D activities or their IT capacity,
as well as a variety of support services that can help them to become more efficient and also to
export. Using Swedish firm-level data, Lodefalk (2014) shows for example that raising the proportion
of services in in-house production yields higher export intensity on average.
It is therefore important to consider services supplied in-house to have a full assessment of
the impact of services on trade and value creation, especially having in mind the fact that the
comparability of services outsourcing across countries might be affected by statistical conventions in
the construction of input-output tables. For example, countries for which data are collected at the
enterprise level and countries for which data are at the establishment level will not report similar
levels of outsourcing. There is more in-house provision of services when the unit is the enterprise
and when different establishments are involved in the manufacturing and service activities.
Bundles of goods and services
Moreover, firms producing goods are increasingly selling them together with services. These
services are generally needed for the customer to make use of the product. For example, machines
are exported with installation, engineering, maintenance and repair services. There is an export
contract that covers both goods and services as part of an integrated system or solution.
10
This type of export challenges existing trade rules that are generally different for goods and
services. If the service cannot be provided, the customer will not buy the good. Some services are
simply ‘indispensable’ (National Board of Trade, 2014). Services bundled with goods are either
needed at the same time the good is exported (e.g. installation services) or at a later stage as part of
the normal operation of the good (maintenance services) or a malfunction (repair services). There
might not always be a domestic alternative for these services and the bundle is generally proposed
as a cost-saving solution for the customer.
Services as value-creating activities
The fact that by bundling goods and services companies create more value highlights that
services are increasingly seen as “value adding activities”. This result is highlighted in the recent
literature suggesting looking at services as part of a ‘service science’ (Dermirkan et al., 2011). The
term ‘service science’ was first introduced by IBM and was then relabelled ‘Service Science,
Management and Engineering’ (SSME). It is now promoted within an industry consortium called the
‘Service Research and Innovation Institute’ (SRII) to which all major IT companies belong.
Services are behind enterprise innovation at several levels. R&D and design activities at the
beginning of the value chain are service inputs. Even if R&D is conducted in-house, it is also through
services (training, education) that the necessary human capital is maintained. Skill improvement, and
likewise consulting services and other types of business services, can increase the productivity of
firms at any stage in the value chain. Another type of innovation is product innovation; more and
more firms are developing their value added by bundling goods and services, as previously
mentioned. Instead of selling products, firms sell solutions.
A key feature of servitization strategies is a strong customer centricity. Customers are not just
provided with products but broader more tailored ‘solutions’. Customer services have become an
integral part of firm strategies when it comes to add value. Interactions between producers and
customers lead to higher levels of customization and these tailored solutions also enhance
productivity and contribute to growth.
A related debate is how to measure productivity in services and whether technological change
is properly captured when output is immaterial (Grassano and Savona, 2014). There is a general
impression that productivity is lower in the case of services, a concern when economies (and trade)
move towards services. But part of the problem may be that productivity is not adequately
measured when the specificities of services are not taken into account. The analysis of services as

11
value-creating activities is also about highlighting the role of services as potential drivers of
economic growth.
4. New evidence on the role of services in global value chains
The previous Section has identified different roles for services in GVCs. With the release of
different sets of inter-country input-output tables and the emergence of a new literature on GVCs,
some of these roles can be empirically illustrated and data analysed. This section first reviews some
indicators from the OECD-WTO TiVA database that are useful to characterise the role of services as
inputs in value chains. The analysis then proceeds with business functions, as described in Section 2,
to highlight the role of in-house services and to put the emphasis on services as value-creating
activities.
Figure 1. Share of services in exports, 2011
Source: TiVA database 2015.
Rising services shares in exports
An important result from the trade in value-added literature is that services account for a
much bigger share of exports when looking at flows in value-added terms. As can be seen in Figure 1,
moving from a share calculated in gross terms to a value-added share significantly increases the
contribution of services to trade. In 2011, 49% of the value added in world gross exports originates
in the services sector. This is the consequence of the fragmentation of production and the essential
role of services in linking activities that are geographically dispersed in GVCs. Many services are
traded embodied in goods.
0%
20%
40%
60%
80%
100%
CH
LM
EX
VN
MN
OR
KO
RR
OU
MY
SC
HN
RU
ST
HA
ZA
FC
AN
AU
SS
VK
CZ
EP
HL
BR
AB
GR
JP
ND
EU
HU
NP
OL
SV
NT
UR
FIN
ITA
US
AC
RI
AU
TN
ZL
IND
PR
TIS
LE
SP
SW
EE
ST
LT
UIS
RLV
AC
HE
FR
AG
BR
GR
CD
NK
BE
LIR
LN
LD
LU
X
Share in value-added terms OECD average (value-added terms) Share in gross terms
12
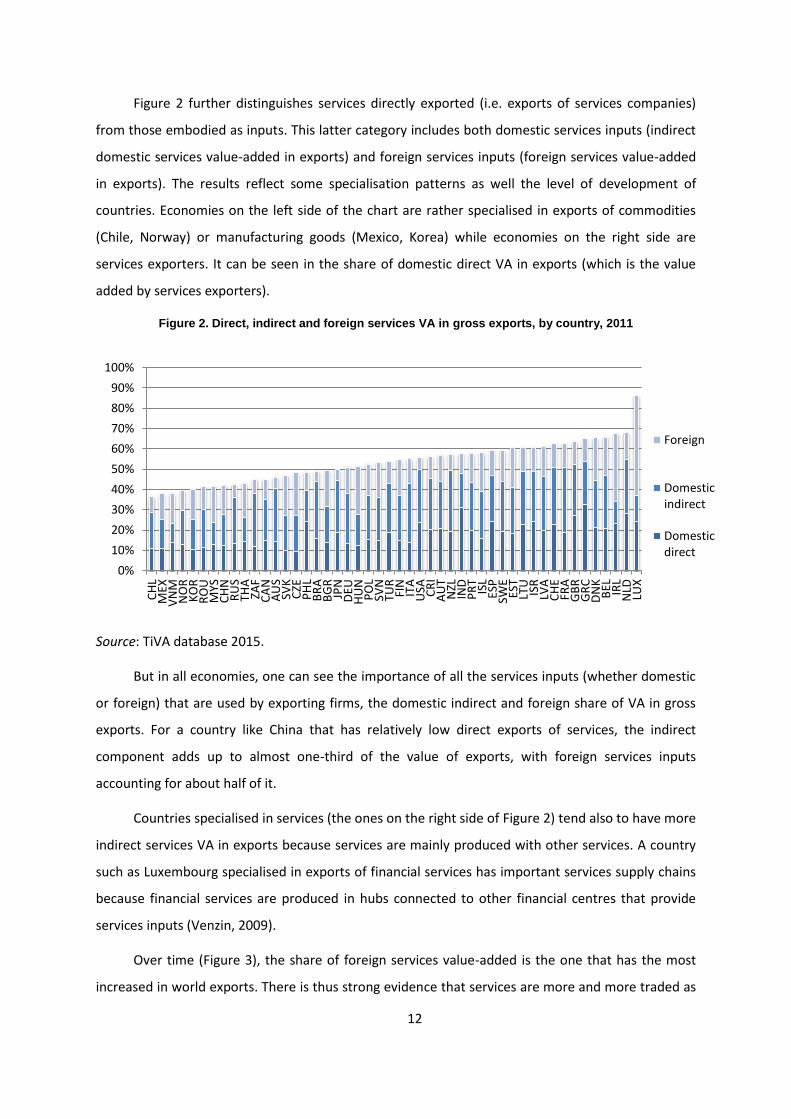
Figure 2 further distinguishes services directly exported (i.e. exports of services companies)
from those embodied as inputs. This latter category includes both domestic services inputs (indirect
domestic services value-added in exports) and foreign services inputs (foreign services value-added
in exports). The results reflect some specialisation patterns as well the level of development of
countries. Economies on the left side of the chart are rather specialised in exports of commodities
(Chile, Norway) or manufacturing goods (Mexico, Korea) while economies on the right side are
services exporters. It can be seen in the share of domestic direct VA in exports (which is the value
added by services exporters).
Figure 2. Direct, indirect and foreign services VA in gross exports, by country, 2011
Source: TiVA database 2015.
But in all economies, one can see the importance of all the services inputs (whether domestic
or foreign) that are used by exporting firms, the domestic indirect and foreign share of VA in gross
exports. For a country like China that has relatively low direct exports of services, the indirect
component adds up to almost one-third of the value of exports, with foreign services inputs
accounting for about half of it.
Countries specialised in services (the ones on the right side of Figure 2) tend also to have more
indirect services VA in exports because services are mainly produced with other services. A country
such as Luxembourg specialised in exports of financial services has important services supply chains
because financial services are produced in hubs connected to other financial centres that provide
services inputs (Venzin, 2009).
Over time (Figure 3), the share of foreign services value-added is the one that has the most
increased in world exports. There is thus strong evidence that services are more and more traded as
0%
10%
20%
30%
40%
50%
60%
70%
80%
90%
100%
CH
LM
EXV
NM
NO
RK
OR
RO
UM
YSC
HN
RU
STH
AZA
FC
AN
AU
SSV
KC
ZEP
HL
BR
AB
GR
JPN
DEU
HU
NP
OL
SVN
TUR
FIN
ITA
USA CR
IA
UT
NZL
IND
PR
TIS
LES
PSW
EES
TLT
UIS
RLV
AC
HE
FRA
GB
RG
RC
DN
KB
EL IRL
NLD
LUX
Foreign
Domesticindirect
Domesticdirect

13
inputs in GVCs. The domestic services value chains have also expanded as seen from the increase in
the domestic indirect share of world gross exports, but more recently services offshoring has shifted
some of this indirect services VA towards foreign suppliers.
Figure 3. Direct, indirect and foreign services VA in world gross exports, mio USD, 1995-2011
Source: TiVA database 2015.
Turning now to the type of services embodied in exports of goods, Figure 4 provides a
decomposition by industry of origin. In manufacturing industries, the share of services VA goes as
high as 38.4% for chemicals and motor vehicles. It is lower for mining (10.5%) but this result is driven
by exporters that rely on large state-owned enterprises that provide most services in-house. For a
country like Australia (where this is not the case), the share is more in line with other manufacturing
industries (23.7%).
Figure 4. Services VA in world gross exports, by manufacturing industry, 2011
Source: TiVA database 2015.
-
2,000
4,000
6,000
8,000
10,000
1995 2000 2005 2008 2009 2010 2011
Foreign
Domestic indirect
Domestic direct
0%
10%
20%
30%
40%
50%
60%Distribution Transport Finance Business services Other
14
Similar patterns are observed in manufacturing industries in terms of the composition of
services VA. Distribution represents about a third of services inputs in manufacturing exports at the
same level as business services (that include telecoms services, computer services, professional
services, R&D services, consulting, advertising and marketing services, technical testing services,
environmental services). The last third is split between transport, finance and other services (a
category covering construction, hotels & restaurants, government services, health and education,
entertainment and audio-visual services).
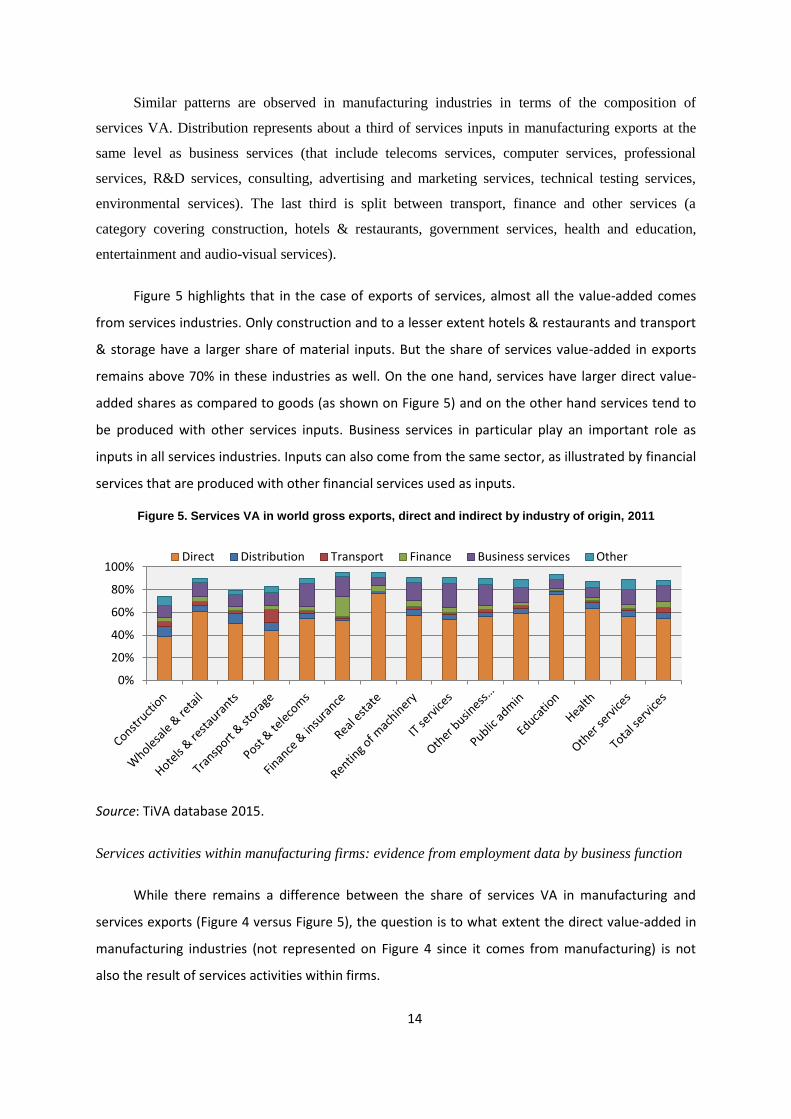
Figure 5 highlights that in the case of exports of services, almost all the value-added comes
from services industries. Only construction and to a lesser extent hotels & restaurants and transport
& storage have a larger share of material inputs. But the share of services value-added in exports
remains above 70% in these industries as well. On the one hand, services have larger direct value-
added shares as compared to goods (as shown on Figure 5) and on the other hand services tend to
be produced with other services inputs. Business services in particular play an important role as
inputs in all services industries. Inputs can also come from the same sector, as illustrated by financial
services that are produced with other financial services used as inputs.
Figure 5. Services VA in world gross exports, direct and indirect by industry of origin, 2011
Source: TiVA database 2015.
Services activities within manufacturing firms: evidence from employment data by business function
While there remains a difference between the share of services VA in manufacturing and
services exports (Figure 4 versus Figure 5), the question is to what extent the direct value-added in
manufacturing industries (not represented on Figure 4 since it comes from manufacturing) is not
also the result of services activities within firms.
0%
20%
40%
60%
80%
100%Direct Distribution Transport Finance Business services Other

15
To answer this question, we rely on employment data as described in Section 2.1 Figure 6 first
provides a decomposition of jobs embodied in gross manufacturing exports according to the
business functions listed in Table 2. Horizontal support activities have been aggregated in a single
category.
Figure 6. Jobs embodied in gross manufacturing exports, by business function, 2011
Source: OECD ICIO June 2015 and occupational data described in Section 2.
A striking result is that on average the core activities of manufacturing firms (i.e operations)
account for only 50% of employment across countries. Half of the employees of manufacturing firms
are in services activities. Assuming that wages are higher in these services activities, the share of
value-added in services should be higher than what the employment figures suggest on figure 6.
Some differences are observed across countries. The sample in Figure 6 does not include
many emerging economies but based on the results for Brazil, India or Turkey, a higher share of
employment is found in operations for these economies. Different patterns also emerge for
countries that are ‘headquarter economies’. In Switzerland or Luxembourg, the share of operations
is rather low and other business functions and in particular horizontal support activities (that include
management and back-office services) account for a larger share of employment. Some economies
are also more involved in R&D and engineering activities as opposed to others. Finland for example
1 At this stage, the analysis relies on employment data but the value-added it accounts for will be added in the
next iteration of the chapter. It requires matching the employment figures with wage data, an on-
going exercise at OECD.
0%
10%
20%
30%
40%
50%
60%
70%
80%
90%
100%
AU
TB
ELB
GR
BR
AC
HE
CZE
DEU
DN
KES
PES
TFI
NFR
AG
BR
GR
CH
UN
IND
IRL
ISL
ITA
JPN
KO
RLT
ULU
XLV
AN
LDN
OR
PO
LP
RT
RO
USV
KSV
NSW
ETU
RU
SA
Horizontal supportactivities
Marketing, sales andafter-sales services
Transport, logisticsand distribution
Operations
R&D, engineering andrelated technicalservices
16
has a larger share of employment in this business function. More generally, differences across
industries also explain the cross-country variation. Figure 7 below provides the same data
aggregated by industry.
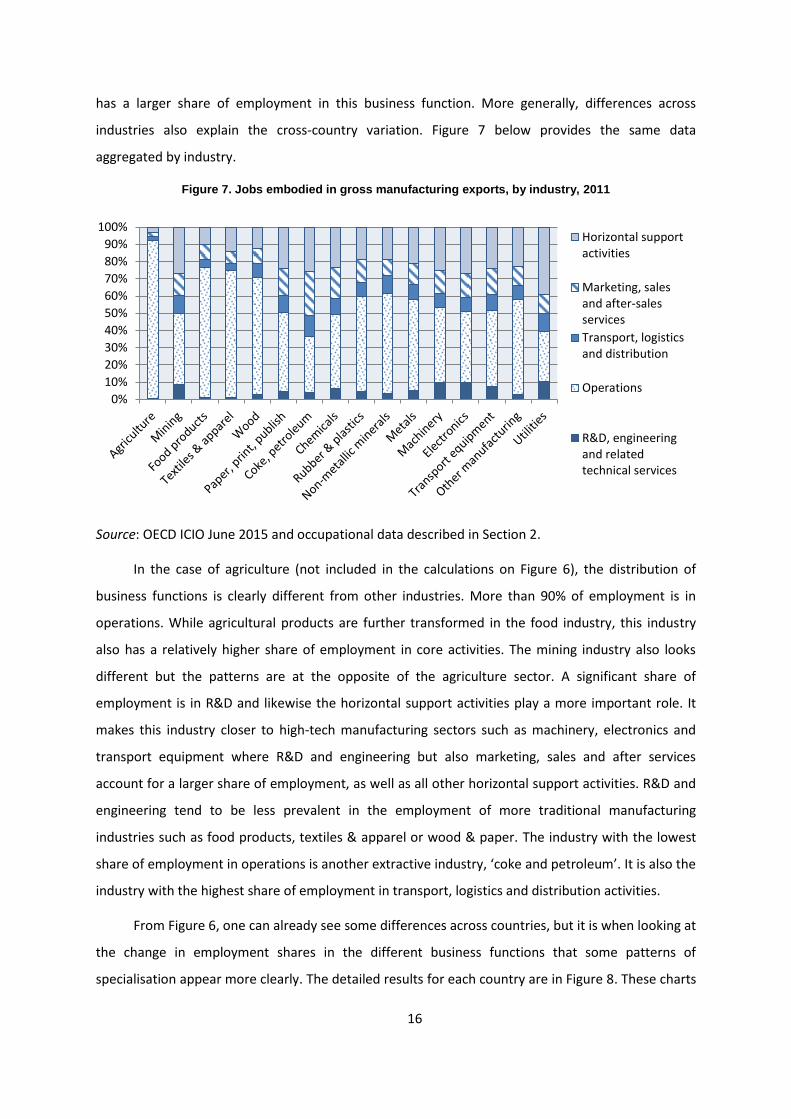
Figure 7. Jobs embodied in gross manufacturing exports, by industry, 2011
Source: OECD ICIO June 2015 and occupational data described in Section 2.
In the case of agriculture (not included in the calculations on Figure 6), the distribution of
business functions is clearly different from other industries. More than 90% of employment is in
operations. While agricultural products are further transformed in the food industry, this industry
also has a relatively higher share of employment in core activities. The mining industry also looks
different but the patterns are at the opposite of the agriculture sector. A significant share of
employment is in R&D and likewise the horizontal support activities play a more important role. It
makes this industry closer to high-tech manufacturing sectors such as machinery, electronics and
transport equipment where R&D and engineering but also marketing, sales and after services
account for a larger share of employment, as well as all other horizontal support activities. R&D and
engineering tend to be less prevalent in the employment of more traditional manufacturing
industries such as food products, textiles & apparel or wood & paper. The industry with the lowest
share of employment in operations is another extractive industry, ‘coke and petroleum’. It is also the
industry with the highest share of employment in transport, logistics and distribution activities.
From Figure 6, one can already see some differences across countries, but it is when looking at
the change in employment shares in the different business functions that some patterns of
specialisation appear more clearly. The detailed results for each country are in Figure 8. These charts
0%
10%
20%
30%
40%
50%
60%
70%
80%
90%
100%Horizontal supportactivities
Marketing, salesand after-salesservices
Transport, logisticsand distribution
Operations
R&D, engineeringand relatedtechnical services

17
are an empirical representation of the famous “smile curve” mentioned in the GVC literature
(Baldwin, 2012). There is a “smile” when the occupations embodied in exports have moved from
operations (the middle of the curve and of the value chain) to R&D, engineering and related
technical services upstream (on the left of the chart) and to transport, logistics, distribution,
marketing, sales and after-sales services downstream (on the right). Support activities are
represented as a straight line on these charts since they contribute to all production stages along the
value chain.
A “smile” is observed in almost all countries. The number of jobs embodied in exports and
corresponding to the core operations of firms has generally decreased between 2000 and 2011. It
means that there are fewer workers in charge of processing, manufacturing and assembling the
goods that are exported. The jobs lost in operations are replaced by jobs either upstream (pre-
production) or downstream (post-production) in the value chain. This is an empirical verification of
the ‘servicification’ of manufacturing. It should be noted that what is shown for exports on the
charts of Figure 8 would be the same for output.2
Upstream are the “R&D, engineering and related technical services” activities. This business
function has only slightly increased. The number of occupations related to R&D and engineering has
increased by less than 5 percentage points in all the countries included in Figure 8. There is even a
slight decrease in Belgium, Bulgaria, the Czech Republic and the Slovak Republic. The activities where
the number of jobs embodied in exports has increased are rather the ones located downstream
(post-production). Relatively high positive percentage changes are observed for ‘transport and
logistics’ and for most countries the values are even higher for ‘marketing and sales’ (a business
function including customer services).
2 A limitation in the analysis is that the same production function applies for exports and output. The OECD
ICIO has heterogeneous data for China and Mexico where exporting firms (and processing firms)
have a different production function (and use a different mix of inputs) as compared to firms selling
only on the domestic market. But these two countries are not in the business function database at this
stage.

18
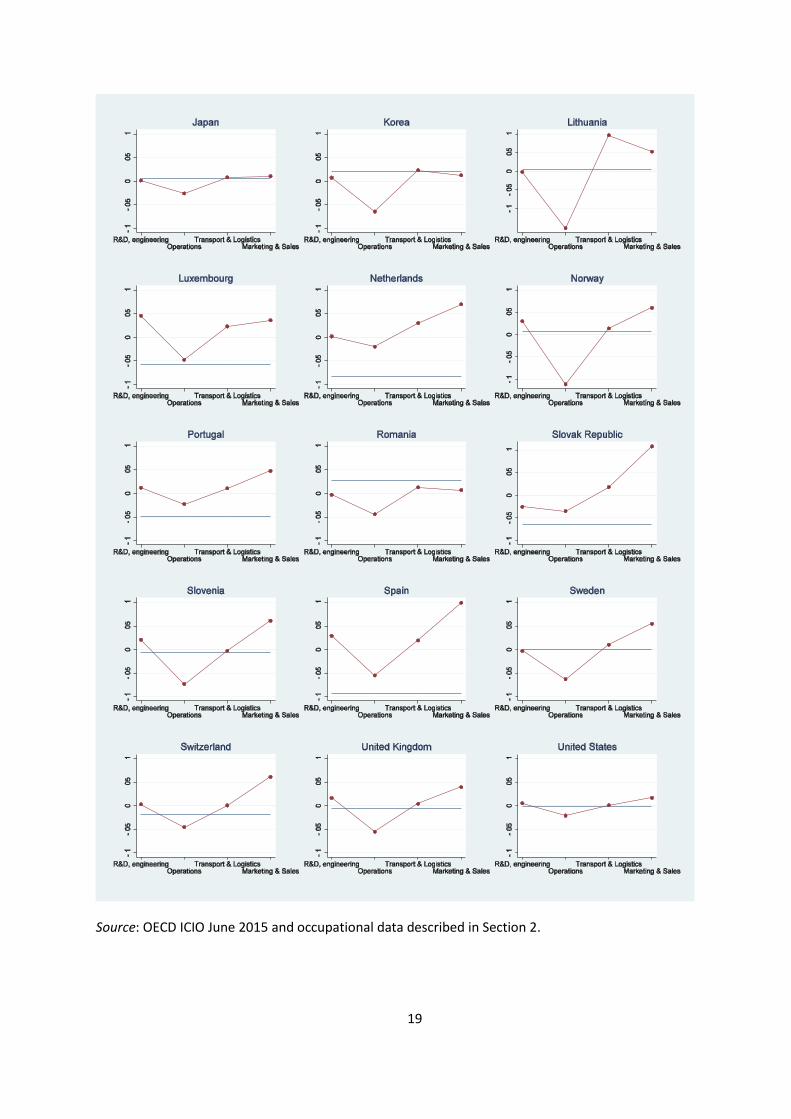
Figure 8. Change in employment embodied in manufacturing exports, by business function, 2000/2011
19
Source: OECD ICIO June 2015 and occupational data described in Section 2.
20
Among the 30 countries of Figure 8, 22 follow the pattern of a “full smile”. In India, Korea,
Lithuania and Romania, ‘marketing and sales’ has increased less than ‘transport and logistics’, but
otherwise the smile pattern is preserved. In Bulgaria and the Czech Republic, this is on the other side
of the smile that the results are inverted; ‘R&D, engineering’ has increased less than ‘operations’.
Belgium and Ireland are the only economies with a different pattern with respect to ‘operations’.
More jobs are found in this business function, while less people work in ‘R&D, engineering’. Ireland
has even the full opposite of the smile. This result could be related to services offshoring as Ireland is
also the country with the highest foreign services content in its exports in 2011 (Figure 2). A country
using more outsourced services and less insourced services would be expected to have a relatively
higher share of employment in operations as it is observed for Ireland.
But leaving aside the case of Ireland, the smile curve is rather verified when looking at
occupations within industries. In addition, Figure 8 offers another interesting finding with respect to
“horizontal support activities” (the straight line in each chart). While there tends to be a common
pattern across countries, for R&D, engineering, operations, transport, logistics, marketing and sales,
the results are very different for the support activities (IT services, back-office services, repair and
maintenance activities). Some countries, such as India, seem to have specialised in such business
functions, with an important increase in the share of support activities in exports. On the contrary,
countries such as Austria, Ireland or Spain seem to have outsourced abroad a significant share of
these business functions. This result is in line with the literature on offshore services (Gereffi and
Fernandez-Stark, 2010) highlighting that such horizontal business services are increasingly traded.
Lastly, it should be kept in mind that the “smile curve” is only verified for the change in
employment (or the change in value-added). In terms of levels, there is still an inverse U-shaped
curve with pre- and post-production support activities accounting for a lower share of employment
or value-added as compared to operations. This result holds for most manufacturing industries as
highlighted in Figure 7.
5. Services in GVCs: chains, networks and shops
The fragmentation of production is not only taking place in manufacturing industries, but also
in services. De Backer and Miroudot (2013) indicate that the length of value chains and the use of
foreign inputs have increased in several service industries, such as financial services and business
services. Rather than a linear value chain, these services are produced through a network of
activities in what looks more like a “spider” than a “snake” (Baldwin and Venables, 2010).

21
Going beyond the “snakes” and the “spiders”, there are indeed important differences in the
way value is created in manufacturing and service industries. It was already noticed by Stabell and
Fjelstad (1998) in a paper proposing to refine the seminal work of Michael Porter (1985) at the origin
of the analysis of “value chains”.
Beyond value chains, the ‘facilitated user networks’ and the ‘solution shops’
According to Stabell and Fjelstad, the value chain is well suited to describe industries where
raw materials are transformed and value is added to more processed products in a sequential way
culminating in the final product. The primary activities described by Porter, such as “inbound
logistics”, “operations”, “outbound logistics”, “marketing and sales” and “service”, apply to this
model where value is created by transforming inputs into products. Some service industries, such as
construction and food services can fit into this model. But this is not the case of most services, for
which two additional types of value creation are suggested.
The first one is the “facilitated user network” where value is created by linking customers. In
the case of insurance services, for example, the value comes from the fact that there is a large group
of insured people who share a risk and pay for the losses of a few. Banking services are also based
on a network linking borrowers and lenders. There are then many network services based on a
physical network, such as telecommunications and transport, where the value comes from the link
offered by the infrastructure. In a “facilitated user network”, the core business functions are
different and look more like “network promotion and contract management”, “service provisioning”
and “infrastructure operation”.
The second model of value creation more adapted to describe value creation in certain
services industries is the “solution shop”. Value is created by solving customer problems. The value
shops involve experts and professionals and the primary activities are: “problem-finding and
acquisition”, “problem-solving”, “choice”, “execution” and “control and evaluation”. While standard
processes are required for value chains, tailored solutions are the objective in solution shops.
More than in other models, the value created tends to be disconnected from the costs. For
example, in the case of medical services, the “solution” is the cure for the patient and the value is
related to the successful solution found (in this case the success of the treatment). Professional
services, consultancy services, engineering services, R&D services are all examples of value shops.
Not only value creation differs across chains, networks and shops but also the main business
functions and the regulations that matter are likely to be different. For example, the existence of a

22
network in the case of facilitated user networks can lead to market imperfections and specific
regulations to address them, in particular competition regulations that are less relevant for the
solution shops or the value chains. Regulations for movement of people are more important for
solution shops as trade is mostly through the movement of experts and professionals. The analysis
of value creation can translate into different policy implications.
Some empirical evidence on the 3 types of value creation models
The paper by Stabell and Fjeldstad (1998) already includes criteria that can be used to identify
value chains, facilitated user networks and solution shops among TiVA industries. Table A.2 in the
Annex provides an initial correspondence that can be improved. This correspondence is used in
Figure 9 below to highlight the shift from employment in value chains to solution shops in the
countries for which data are available.
Figure 9. Employment by type of value creation model, 2000 and 2011
Source: OECD ICIO June 2015 and occupational data described in Section 2.
There are also patterns of specialisation as can be seen on Figure 10. This time the typology of
Table A.2 is applied to the matrix of value-added by industry of origin. The percentage change
between 2000 and 2011 is shown for the three types of value creation models. As on Figure 9, the
increase in value added created as part of shops can be seen. But not all countries are moving in this
direction. Australia or Chile, for example, are specialising in the mining industry which is a type of
“value chain”. There are also interesting differences with respect to “facilitated user networks”.
Some countries seem to rely less on the industries classified as such, while others have increased
their share of export value-added in these industries.
0%
10%
20%
30%
40%
50%
60%
70%
80%
90%
100%
2000 2011
Pe
rce
nta
ge o
f e
mp
loym
en
t
Value chains Facilitated user networks Solution shops

23
Figure 10. Change in the origin of VA in gross exports , % points, by country, 2000/2011
Source: TiVA database 2015 and Table A.2.
6. Concluding remarks
This chapter provides new evidence on the role of services in global value chains, not only as
the ‘glue’ linking activities across countries but also as value-creating activities. All indicators point in
the same direction: services have an increasing share in exports, whether as products directly
exported, as inputs embodied in exports of goods and other services or as activities within
manufacturing firms. The ‘servicification’ of global value chains is an important trend in the two last
decades and an on-going process even as the expansion of GVCs seems to slowdown.
From the TiVA statistics, it was already emphasised that in value-added terms, services
account for half of world trade. A new stylised fact from this chapter is that also within
manufacturing firms, services activities account for at least half of value creation in exports.
This has important policy implications, particularly for developing countries where regulations
on services are sometimes more restrictive (Borchert et al., 2012) and where there is still an
important policy agenda for improving the efficiency of the services sector. From the sheer size of
services in GVCs, it is evident that any improvement in the income generated by the participation of
developing countries in international production networks has to do with services reforms. The fact
that most services are traded as inputs suggests that this is first and foremost a domestic agenda
where trade, investment and competition policies can help to improve the competitiveness and
efficiency of the provision of services to domestic exporters and MNEs.
-0.15
-0.1
-0.05
0
0.05
0.1
0.15
AU
SA
UT
BEL
BG
RB
RA
CA
NC
HE
CH
LC
HN
CR
IC
ZED
EUD
NK
ESP
EST
FIN
FRA
GB
RG
RC
HU
NIN
DIR
LIS
LIS
RIT
AJP
NK
OR
LTU
LUX
LVA
MEX
MYS
NLD
NO
RN
ZLP
HL
PO
LP
RT
RO
UR
US
SVK
SVN
SWE
THA
TUR
USA
VN
MZA
F
Chains Networks Shops

24
The prevalence of services activities within firms also suggests looking at whether services
outsourcing or offshoring should be facilitated and is not blocked by restrictive policies. There is an
economic rationale in keeping some services activities in-house, particularly when they are
complementary with the core activities of the firm. For example, the literature has recently put the
emphasis on the benefits of co-location for R&D and manufacturing activities. What regulators and
policymakers should ensure is that the choice between out-sourcing and in-sourcing is based on
economic reasons and not distorted by policies.
Future research should focus on the relationship between the ‘servicification’ of
manufacturing and productivity. It is quite challenging to measure productivity in services (Grassano
and Savona, 2014) but still more empirical evidence is needed on the productivity gains and the way
services are not just accounting for a larger share of value-added but also providing more value with
fewer inputs, thus increasing welfare and income.
25
REFERENCES
Borchert, I., B. Gootiiz and A. Mattoo (2012), “Policy Barriers to International Trade in Services.
Evidence from a New Database.”, World Bank Policy Research Paper, No. 6109, The World
Bank, Washington D.C.
Brown, C., T. Sturgeon and J. Lane (2014), “Using a business function framework to examine
outsourcing and offshoring by US organizations”, IRLE Working Paper, No. 121-14,
http://irle.berkeley.edu/workingpapers/121-14.pdf.
Cernat, L. and Z. Kutlina-Dimitrova (2014), “Thinking in a box: a mode 5 ‘approach’ to service
trade”, DG Trade Chief Economist Notes, Issue 1.
De Backer, K. and S. Miroudot (2013), “Mapping global value chains”, OECD Trade Policy Papers,
No. 159, OECD Publishing, Paris, http://dx.doi.org/10.1787/5k3v1trgnbr4-en.
Demirkan, H., J. Spohrer and V. Krishna (eds) (2011), The Science of Service Systems, Springer,
New York.
Francois, J. and B. Hoekman (2010), “Services trade and policy”, Journal of Economic Literature, pp.
642-692. http://dx.doi.org/10.1257/jel.48.3.642.
Francois, J. and J. Woerz (2008), “Producer services, manufacturing linkages, and trade”. Journal of
Industry, Competition and Trade, Vol. 8/3, pp. 199–229.
Gervais, A. and B. Jensen (2013), “The Tradability of Services: Geographic Concentration and Trade
Costs”, NBER Working Papers, No. 19759, National Bureau of Economic Research.
Grassano, N. and M. Savona (2014), “Productivity in services twenty years on. A review of
conceptual and measurement issues and a way forward”, Working Paper Series, SWPS 2014-01,
University of Sussex.
Grossman, G. and E. Rossi-Hansberg (2008), “Trading Tasks: A Simple Theory of Offshoring”,
American Economic Review, Vol. 98/5, pp. 1978-1997, http://dx.doi.org/10.1257/aer.98.5.1978.
Hummels, D., J. Ishii and K.-M. Yi (2001), “The Nature and Growth of Vertical Specialization in
World Trade”, Journal of International Economics, Vol. 54/1, pp. 75-96.
26
Johnson, R. and G. Noguera (2012),“Accounting for Intermediates: Production Sharing and Trade in
Value Added”, Journal of International Economics, Vol. 86/2, pp. 224-236,
http://dx.doi.org/10.1016/j.jinteco.2011.10.003.
Koopman, R., Z. Wang and S.-J. Wei (2014), “Tracing Value-Added and Double Counting in Gross
Exports”, American Economic Review, Vol. 104/2, pp. 459-494, http://dx.doi.org/
10.1257/aer.104.2.459.
Kelle, M. (2013), “Crossing Industry Borders: German Manufacturers as Services Exporters”, The
World Economy, Vol. 36/12, pp. 1494-1515. http://dx.doi.org/10.1111/twec.12111.
Lanz, R., S. Miroudot and H. Nordås (2011), “Trade in Tasks”, OECD Trade Policy Papers, No. 117,
OECD Publishing, Paris, http://dx.doi.org/10.1787/5kg6v2hkvmmw-en.
Lodefalk, M. (2014), “The role of services for manufacturing firm exports”, Review of World
Economics, Vol. 150/1, pp. 59-82, http://dx.doi.org/10.1007/s10290-013-0171-4.
Lodefalk, M. (2015), “Servicification of Manufacturing Firms Makes Divides in Trade Policy-Making
Antiquated”, Working Paper, No. 1/2015, Örebro University School of Business.
Low, P. (2013), “The role of services in global value chains”, Real Sector Working Paper, Fung
Global Institute.
Miroudot, S., D. Rouzet and F. Spinelli (2013), “Trade policy implications of global value chains:
case studies”, OECD Trade Policy Papers, No. 161, OECD Publishing, Paris,
http://dx.doi.org/10.1787/5k3tpt2t0zs1-en.
National Board of Trade (2012), “Everybody is in Services - The Impact of Servicification in
Manufacturing on Trade and Trade Policy”, National Board of Trade, Sweden.
National Board of Trade (2014), “Making Green Trade Happen – Environmental Goods and
Indispensable Services”, National Board of Trade, Sweden.
Nielsen, P. B. (ed.) (2008), International Sourcing: Moving Business Functions Abroad. Statistics
Denmark, www.dst.dk/publ/InterSourcing
Nielsen, P.B. and T. Sturgeon (2014), “Using Business Functions to Measure International Trade and
Economic Globalization”, paper prepared for the International Conference on Trade and
Economic Globalization, 29 September – 1 October 2014, Aguascalientes, Mexico.

27
Nordås, H. (2008), “The Impact of Services Trade Liberalisation on Trade in Non-Agricultural
Products”, OECD Trade Policy Papers, No. 81, OECD Publishing,
http://dx.doi.org/10.1787/227107117401.
OECD (2013), Interconnected Economies. Benefiting from Global Value Chains, OECD Publishing,
Paris, http://dx.doi.org/10.1787/9789264189560-en.
Stabell, C. and Ø. Fjeldstad (1998), “Configuring value for competitive advantage: on chains, shops,
and networks”, Strategic Management Journal, Vol. 19, pp. 413-437.
Sturgeon, T., P. B. Nielsen, G. Linden, G. Gereffi and C. Brown (2013), “Direct Measurement of
Global Value Chains: Collecting Product- and Firm-Level Statistics on Value Added and
Business Function Outsourcing and Offshoring”, in A. Mattoo, Z. Wang and S.-J. Wei (eds),
Trade in Value Added. Developing New Measures of Cross-Border Trade, CEPR and The
World Bank, pp. 291 321.
Timmer, M., R. Stehrer and G. de Vries (2015), “Occupations in Global Value Chains: Patterns of
International Specialisation”, TAD/TC/WP(2014)18/FINAL.
Vandermerwe, S. and J. Rada (1988), “Servitization of business: Adding value by adding services”,
European Management Journal, Vol. 6/4, pp. 314-324.
Venzin, M. (2009), Building an international financial services firm: how successful firms design and
execute cross-border strategies, Oxford University Press, London.
28
ANNEX
Table A1 – List of industries

29
Table A2 – Mapping of chains, networks and shops
ISIC Code Industry Value creation
01T05 Agriculture, hunting, forestry and fishing chain
10T14 Mining and quarrying chain
15T16 Food products, beverages and tobacco chain
17T19 Textiles, textile products, leather and footwear chain
20 Wood and products of wood and cork chain
21T22 Pulp, paper products, printing and publishing chain
23 Coke, refined petroleum products and nuclear fuel chain
24 Chemicals and chemical products chain
25 Rubber and plastics products chain
26 Other non-metallic mineral products chain
27T28 Basic and fabricated metals chain
29 Machinery and equipment, nec chain
30T33 Computer, Electronic and electrical equipment chain
34T35 Motor vehicles and other transport equipment chain
36T37 Manufacturing nec; recycling chain
40T41 Electricity, gas and water supply network
45 Construction chain
50T52 Wholesale and retail trade network
55 Hotels and restaurants chain
60T63 Transport and storage network
64 Post and telecommunications network
65T67 Financial intermediation network
70T74 Other business services shop
75 Public admin. and defense shop
80 Education shop
85 Health and social work shop
90T93 Other community, social and personal services shop
95 Private households with employed persons shop