Chapter 10: An Investment Perspective on Global Value Chains
26
Korea, India, and China— Investing outward helped digital firms develop and compete globally MAXIMILIAN PHILIP ELTGEN, YAN LIU, AND VICTOR STEENBERGEN Chapter 10
-
Upload
khangminh22 -
Category
Documents
-
view
4 -
download
0
Transcript of Chapter 10: An Investment Perspective on Global Value Chains
Korea, India, and China—Investing outward helped digital firms develop and compete globally
MAXIMILIAN PHILIP ELTGEN, YAN LIU, AND VICTOR STEENBERGEN
Chapter 10

Summary
This case study highlights the integration and upgrading in the digital economy global value
chain (GVC) in three countries—the Republic of Korea, India, and China. It shows that two
elements are critical to a country’s participation in the high-value-added segments of the digi-
tal economy GVC: outward foreign direct investment (OFDI) and human capital and research
and development (R&D) capacity. First, all three countries tapped into their own large pools of
graduates in science, technology, engineering, and math (STEM) areas and successfully estab-
lished domestic industries. Then leading domestic companies, pushed by competitive pres-
sure from foreign investors when inward FDI was liberalized, invested overseas to explore
new markets and compete internationally. Korea and China also invested determinedly in
R&D and provided proactive government support for OFDI using a combination of financial
and fiscal measures, provision of information, development assistance programs, and inter-
national investment agreements, in addition to the overall liberalization of OFDI regulations.
India established software technology parks and provided software export credit and credit
guarantees. Some firms from Korea, India, and China managed to expand and have become
significant players in certain segments of the digital economy GVC.
The digital economy global value chain
Introduction to the digital economy global value chain
There is no universally accepted definition of the digital economy. However, a general distinc-
tion is made between narrow and broad definitions of the term. Narrow definitions refer only
to the information and communication technology (ICT) sector, which includes telecommuni-
cations, the internet, information technology (IT) services, computer hardware, and software
(Zhang and Chen 2019). The broad definitions refer to the digital economy as “the entirety of
sectors that operate using Internet Protocol–enabled communications and networks,” irrespec-
tive of which network they use and for what purpose (Lovelock 2018, 6).
For this case study, the digital economy is conceptualized as a GVC made up of various pro-
duction segments that enable firms to store, collect, interpret, organize, transmit, and exchange

326 AN INVESTMENT PERSPECTIVE ON GLOBAL VALUE CHAINS
data (figure 10.1). The firms in this GVC can be broadly divided into ICT goods firms
and ICT services firms. Three main market segments make up the ICT goods part
of the digital economy GVC: servers, IT components, and IT devices. ICT services
include software, IT services, and telecommunications and infrastructure services
(Frederick, Bamber, and Cho 2018). Such ICT services also include four digital ser-
vices segments: internet platforms, e-commerce, digital content, and digital solutions
(UNCTAD 2017).
Some companies that have integrated themselves into the digital economy GVC
were established decades ago as electronics hardware or operating software firms.
To upgrade within the GVC, these firms needed to build their digital portfolios of
intellectual property and domain expertise. They grew organically by spending rel-
atively high shares of their revenue on R&D (PwC 2018). Mergers and acquisitions
and investment in start-ups (venture capital investment) are also common growth
methods (Frederick, Bamber, and Cho 2018).
However, the digital economy GVC is mainly characterized by new types of firms
and new sources of revenue. The agents of change are a combination of start-ups that
provide new digital technologies, suppliers that embrace new opportunities to move
up the value chain, and customers who are not just on the receiving end of a product
or service but actively co-creating it (UNCTAD 2017). Revenue sources, especially in
the consumer segments, are often closely tied to advertising. For example, Google and
FIGURE 10.1 The digital economy global value chain
Sources: Adapted from Frederick, Bamber, and Cho (2018) and UNCTAD (2017).Note: BPS = business process solutions; BPO = business process outsourcing; IaaS = Infrastructure as a Service; IC = integrated circuit; ICT = information an communication technology; PaaS = Platform as a Service.
Telecommunications Internet serviceproviders
IT devices(computers, phones)
Operating software
Electronicsmanufacturing
Software (operating)
Local data collection anduse Apple, Inc., Microsoft, Inc.
Apple, Inc., Dell, Inc.,Lenovo, Inc., Samsung, Inc.
AT&T, Inc., Huawei, Inc.,Verizon, Inc.
Role Broad segment Specific segment Firm examples
Database software
IT services
Data storage software(middleware)
IT consulting, BPS, BPOData services(data interpretation,organization, management and transmission)
Accenture, Inc., IBM, Inc.,Infosys, Ltd.
GE, Inc., Oracle, Inc.,Siemens, Inc.
Digital services(electronic deliveryof information across multiple platforms and devices)
Internet platforms
Digital media, games,information, and data
E-payments, cloud(IaaS, PaaS)
Search engines,social networks
Internet retailers,other e-commerce
Facebook, Inc., Google, Inc.,Tencent, Inc.
AWS, Inc., Google, Inc.,Microsoft, Inc., PayPal, Inc.
Amazon, Inc., Alibaba, Inc.,TripAdvisor, Inc.
HBO, Inc., Netflix, Inc.,Tencent, Inc.
Application software Software Citrix, Salesforce, SAP, SAS
Digital solutions
E-commerce
Digital content
Data storageServers Data storage hardware HPE, Inc., IBM, Inc.
IT components(chips, sensors) IC firms (fab and fabless) Intel, Inc., Qualcomm, Inc.,
Samsung, Inc.
ICTServices
ICTGoods

KOREA, INDIA, AND CHINA CASE STUDY 327
Facebook earn most of their revenue from targeted advertising using user-created
data (83 percent and 99 percent, respectively) (Wallach 2020).
The United States is the dominant player in the digital economy GVC. Of the top
100 digital multinational corporations (MNCs) by sales or operating revenues, two-
thirds are US firms, 23 are European, and 4 are Japanese (UNCTAD 2017). For ICT
MNCs, the picture is more heterogeneous: whereas the United States leads with 21, a
larger number of firms are from East Asia: Japan (15); Taiwan, China (14); China (6);
India (5); and Korea (4) (UNCTAD 2017).
The roles of Korea, India, and China in the digital economy global value chain
Korea is a leading player in the ICT hardware segment of the digital economy GVC,
focusing on four key activities. The first is semiconductors, which accounted for
7.8 percent of its gross domestic product (GDP) and 17.3 percent of its exports in
2019.1 Korea is home to Samsung Electronics and SK hynix; these two companies
held 73 percent of the global dynamic random-access memory and 44 percent of the
NAND flash memory markets (US ITA 2020). The second relates to wireless commu-
nications devices, for which Samsung Electronics and LG Electronics hold 13.3 per-
cent and 8.7 percent of global 5G patents, respectively, making Korea the top country
in 5G patents (Statista 2020). Third is flat panel displays, with LG Display alone enjoy-
ing a global market share of 27 percent in 2019 (Statista 2020). The fourth sector
is consumer electronics. Korea is a global leader in televisions, handsets, and other
consumer electronics components through Samsung Electronics, LG Electronics, and
LG Display.
India is a leading player in the IT services segment of the digital economy GVC. In
fiscal year 2019/20, India’s IT and business process management (BPM) industry rev-
enue was about US$191 billion, about 7.4 percent of India’s GDP. More than 77 per-
cent of the revenues derived from export (US$141 billion), accounting for 55 percent
of global BPM market share (IBEF 2021). India’s BPM industry is expected to grow to
between US$205 billion and US$250 billion by 2025 according to McKinsey Global
Institute estimates (MGI 2019b). In recent years, India has also become an important
center for the industrial internet of things (IIoT).2 All major global industrial firms
with IIoT platforms are present in India and collaborating with major Indian IT firms
to build applications for their platforms (Frederick, Bamber, and Cho 2018).
China is a leading player across a range of segments of the digital economy GVC.
The first is ICT hardware. China accounts for 32 percent of global ICT goods exports
(Zhang and Chen 2019). It produces 90 percent of the global supply of personal com-
puters, 90 percent of mobile phones, and 70 percent of televisions (MGI 2019a). In
recent years, China has also become a leader in drone manufacturing. Dajiang, one
of China’s leading companies in the industry, accounts for 50 percent of the drone
market in North America (Zhang and Chen 2019). The second segment is financial
technology, in which China accounts for more than 70 percent of global valuations.
Alipay and WeChat Pay, two popular third-party payment applications, are increas-
ingly expanding overseas and are now accepted at physical retailers in 28 countries
(Zhang and Chen 2019). A third area relates to e-commerce. China accounts for
more than 40 percent of the global e-commerce market, up from 1 percent about a

328 AN INVESTMENT PERSPECTIVE ON GLOBAL VALUE CHAINS
decade ago. Some Chinese e-commerce companies, especially Alibaba, are venturing
abroad (MGI 2017). The fourth area involves internet platforms and digital content.
Although most of China’s digital content firms are still domestically oriented, a small
number have become global lead firms, such as Tencent in the video game industry
(Casanova and Miroux 2019). The video platform TikTok has become one of the most
popular social media applications in the world, reaching more than 2 billion down-
loads as of April 2020 (Leskin 2020).
The development of Korea’s digital economy global value chain
Korea’s early electronics industry developed in the 1960s and 1970s through a
combination of proactive government support and partnerships with foreign firms
(Lim 2016). During this period, the major products Korea produced included con-
sumer products and the localization of noncore components. Total ICT goods exports
increased from US$3.5 million in 1966 to US$1.8 billion in 1979.
Starting in the 1980s, the country’s priorities shifted from consumer electronics to
the ICT sector. The government dramatically scaled up innovation capacity for ICT
by investing 3 percent of Korea Telecom’s revenues in R&D. It provided key infra-
structure for informatization and e-government, and worked with the private sector
to identify and promote new engines of growth. As a result, Korea developed an
early lead in key digital infrastructure, developing a digital switching system in 1982
and 64K digital random-access memory in 1983 (third in the world, after the United
States and Japan). Korean firms diversified their products and developed core compo-
nents and materials. They continued to pursue a fast follower-innovator strategy and
aggressively invested in R&D and volume production.
Joint efforts by the government and the private sector helped elevate Korea’s elec-
tronics industry to world-class status by investing in core competencies and quality
improvement. During this phase, ICT goods exports grew from US$2 billion in 1980
to almost US$190 billion in 2017. The country’s ICT services exports also expanded
rapidly, rising from US$3 billion to US$10 billion between 1980 and 2000, and then
to almost US$50 billion by 2017. Combining goods and services, ICT exports grew
from 11 percent of Korea’s total exports in 1980 to 18 percent in 2017 (figure 10.2).
Building human capital and research and development capacity
A focus on higher education was an important pillar of Korea’s rise in the digital econ-
omy, with considerable investment in human capital development by the Korean
government. Korean households simultaneously devoted much of their resources to
education, thereby fueling a drastic expansion in school enrollment. The country’s
tertiary gross enrollment ratio increased from less than 7 percent in 1971 to 95 per-
cent by 2015, and the number of students in higher education jumped from 201,000
to 3.3 million over the same period (Mani and Trines 2018; UIS 2021).
As soon as Korea formulated its electronics industry promotion strategy in 1968, the
government also began establishing and reinforcing electronics-related departments

KOREA, INDIA, AND CHINA CASE STUDY 329
at universities. The Korea Advanced Institute of Science was created in 1973 to pro-
duce top-quality scientists and engineers. The government also enacted the Support
of Specific Research Institutes Act, under which it provided public funding to specific
research institutes and joint management bodies. These institutes and joint manage-
ment bodies were, in turn, required to give priority to R&D and technical support
requests from the government.
Korea also established industry-specific research institutes to drive innovation in
the electronics industry. The Korea Electronics Technology Institute, the Korea Electric
Research and Testing Institute, and the Korea Electronics and Telecommunications
Research Institute were established in 1976. The Korea Electronics Technology
Institute greatly expanded R&D activities in computer and semiconductor fields, and
the other two organizations made significant contributions to the development of
electronic communications equipment (Lim 2016).
The Korean government urged the country’s large industrial groups, known as
chaebols, to invest heavily in R&D with a focus on applied technologies, while shield-
ing them from competition by restricting FDI inflows in the early stages of develop-
ment (Dayton 2020; Nicolas, Thomsen, and Bang 2013). Chaebols such as Samsung
Electronics and LG Electronics engaged in numerous corporate-academic collabora-
tions to conduct cutting-edge research and apply frontier knowledge in their prod-
ucts. As a result, Korea’s R&D expenditure as a share of GDP was 4.8 percent in 2018,
second only to Israel at 4.9 percent.3 This expenditure was also exceptionally high rel-
ative to the country’s income level. Korea’s systematic attention to and high spending
on R&D has been a crucial factor in creating an innovative economy and enabling its
success in the electronics industry (Dayton 2020).
The role of outward foreign direct investment
Korea’s policy approach to OFDI has evolved strategically over time, reflecting the
needs of its economy at different stages of development. The export boom in the
FIGURE 10.2 The Republic of Korea’s information and communication technology goods and services exports
Source: World Bank calculations based on Atlas for Economic Complexity data.Note: ICT goods are defined as Standard International Trade Classification codes 75–77. ICT services include information technology and communication services. ICT = information and communication technology.
0
5
10
15
20
0
50
100
150
200
1980 1983 1986 1989 1992 1995 1998 2001 2004 2007 2010 2013 2016
Expo
rt s
hare
(%
)
US$
, bill
ion
ICT goods exports (left scale) ICT services exports (left scale) ICT share of exports (right scale)

330 AN INVESTMENT PERSPECTIVE ON GLOBAL VALUE CHAINS
1980s encouraged OFDI liberalization, but active OFDI promotion only began in
the 1990s. Korea’s membership in the Organisation for Economic Co-operation and
Development in 1996 prompted free capital movements and led to liberalization of
both inbound and outbound FDI. In the late 1990s, the Korean government began to
actively promote OFDI, with even more proactive policies following the global finan-
cial crisis of the late 2000s. The government provides three types of OFDI support:
financial support, information provision, and overseas investment services:
1. Financial support is mainly provided by the Export-Import Bank of Korea through
loans to firms investing abroad. The loans cover up to 80 percent of total capi-
tal invested abroad (or 90 percent for small and medium enterprises). The Korea
Export Insurance Corporation provides export credit insurance and helps firms
abroad that suffer from expropriation, war, breach of contract, and risk associated
with remittance transactions.
2. Information provision comes from the Ministry of Economy and Finance, which runs
an overseas direct investment information network website and provides infor-
mation on host countries’ FDI procedures and investment-related features and on
Korean overseas companies. The Ministry of Economy and Finance and the Korea
Overseas Investment Information System also run several websites to share OFDI
information and provide consulting services for Korean firms interested in invest-
ing abroad (Kim and Rhee 2009).
3. Overseas investment services come from the Korea Trade-Investment Promotion
Agency (KOTRA). KOTRA provides comprehensive supportive services; it helps
Korean firms expand their business in overseas markets, spreads foreign market
information, and offers business consulting services. The government also encour-
ages cooperation among Korean firms to form Korean business associations abroad
and to build regional co-logistics centers to be shared among Korean firms (Nicolas,
Thomsen, and Bang 2013).
Korean firms invested abroad for a variety of reasons. Firms faced a saturated
domestic market and intense competition in industries such as electrical appliances,
which placed pressure on firms to go abroad for higher profits. Firms report that
OFDI was preferred over exports to reduce transaction costs in foreign markets (Kim
and Rhee 2009). In addition, operating closer to overseas customers was seen to help
firms respond quickly to consumer needs and to access design facilities. For example,
Samsung Electronics built design centers in China, Italy, Japan, the United Kingdom,
and the United States to cater to local market tastes. Finally, concerns about increasing
labor costs at home led some Korean firms to invest abroad (Fung, Garcia-Herrero,
and Siu 2009; Nicolas 2003).
As a result of both government support and business need, Korea’s total stock of
OFDI grew rapidly, from US$25 billion in 2000 to US$384 billion in 2018 (figure 10.3,
panel a). A sizable share of this OFDI is in ICT goods, ICT services, and scientific
R&D—growing from US$43 billion in 2014 to US$73 billion in 2018. The majority
of OFDI is in ICT goods, but a growing share is in ICT services (figure 10.3, panel b).
Overall, OFDI played a crucial role in Korea’s advancement in the digital economy
GVC (Nicolas 2003).

KOREA, INDIA, AND CHINA CASE STUDY 331
The development of India’s digital economy global value chain
The rise of India’s ICT sector is generally considered to have started in 1988, when
the government established software technology parks in 39 locations. At each park
the government provided IT and telecommunications infrastructure, tax benefits,
and satellite uplinks, as well as import certifications and market analysis to foreign
investors (Couto and Fernandez-Stark 2019). After India’s 1991 balance of pay-
ments crisis, the government abolished industrial licensing, removed entry barriers,
created exemptions from corporate taxes, liberalized trade, and devalued the rupee,
among other measures. In addition, software exports by MNCs registered with the
Department of Electronics were provided with export promotion benefits, such as
export shipment credit and credit guarantees, similar to those given to manufacturing
exporters (Kathuria 2010).
India’s integration into the digital economy GVC accelerated in the 1990s when the
country began to provide simple IT support services to global clients, particularly in
the United States. From about US$50 million in exports in the late 1980s, the indus-
try grew by 50–60 percent annually in the mid- and late 1990s (Bhatnagar 2006),
reaching US$10 billion in 2000. Since then, growth has been even more pronounced,
shooting up to US$130 billion in 2017. At the same time, ICT goods exports increased,
rising from US$1 billion in 2000 to US$9 billion in 2017. In total, exports from the
digital economy sectors grew from less than 5 percent of India’s total exports in the
1980s to about 15 percent in 2017 (figure 10.4).
Years of significant investment in IT higher education have endowed India with
a large number of well-trained, low-cost, English-speaking software professionals.
0
50
100
150
200
250
300
350
400
1985
1988 19
9119
9419
9720
0020
0320
0620
0920
1220
1520
18
Tota
l OFD
I sto
ck (
US$
, bill
ion)
40 43 4961 65
24
5
66
0.5 0.55.9
0.71.0
18 1720 20 19
0
5
10
15
20
0
20
40
60
80
100
2014 2015 2016 2017 2018
Shar
e of
OFD
I (%
)
OFD
I sto
ck in
ICT
(US$
, bill
ion)
ICT goods (left scale)
a. Total OFDI stock, 1985–2018 b. OFDI stock in the digital economy, 2014–18
Scientific R&D (left scale)ICT services (left scale)ICT share of OFDI (right scale)
FIGURE 10.3 Outward foreign direct investment in the Republic of Korea
Source: World Bank calculations using Organisation for Economic Co-operation and Development foreign direct investment statistics.Note: ICT = information and communication technology; OFDI = outward foreign direct investment; R&D = research and development.

332 AN INVESTMENT PERSPECTIVE ON GLOBAL VALUE CHAINS
This cadre of professionals proved highly opportune when the IT boom in the late
1990s resulted in a huge shortage of suitable personnel, which had been exacerbated
by the Y2K problem.4 India’s software engineers were thus available on short notice
to execute short-term projects and lower-end jobs such as coding and data conversion
(Fernandez-Stark, Bamber, and Gereffi 2011).
As a result, MNCs were eager to set up IT, BPM, and R&D centers in India, which in
turn benefited local companies through linkages and spillovers (Couto and Fernandez-
Stark 2019). Driven by high-quality talent, synergies with traditional sourcing opera-
tions in the area, and lower operating costs, India’s IT services sector emerged as one
of the leading global players across all segments in the late 2000s.
In addition, a number of Indian IT professionals who had worked in the United
States returned to India, bringing with them managerial expertise and good business
connections, and successfully created their own IT firms. These firms have evolved
into India’s well-known leading firms such as TCS, Infosys, and Wipro (Fernandez-
Stark, Bamber, and Gereffi 2011). Notably, foreign ownership of software operations
in India was quite small—in 2010, fewer than one-fifth of Indian software companies
were majority foreign-owned (Kathuria 2010).
Having developed experience in dealing with complex IT systems, several Indian
companies became internationally competitive and opened offices abroad, offering a
wider range of services, such as executing large and complex projects involving integra-
tion, IT strategy, and end-to-end solutions (Jalote and Natarajan 2019). Leading firms,
now MNCs themselves, were quick to realize that demand for low-end services had lim-
ited value added; they thus diversified into other domains such as insurance, finance,
and customer support, as well as R&D offshoring (Couto and Fernandez-Stark 2019).
In recent years, India has become a hub for technologies related to IIoT and
Industry 4.0. More than 1,250 global companies have set up their own centers across
all industries, and are starting to drive digital engineering work from their Indian
development centers (Jalote and Natarajan 2019). The country is home to the largest
IIoT labs for several firms outside of their home countries, including Siemens, SAP,
and Bosch (Frederick, Bamber, and Cho 2018). For example, Bosch has 15,500 R&D
0
5
10
15
0
50
100
150
1980 1983 1986 1989 1992 1995 1998 2001 2004 2007 2010 2013 2016
Expo
rt s
hare
(%
)
US$
, bill
ion
ICT goods exports (left scale) ICT services exports (left scale) ICT share of exports (right scale)
FIGURE 10.4 India’s information and communication technology goods and services exports
Source: World Bank calculations based on Atlas for Economic Complexity data. Note: ICT goods are defined as Standard International Trade Classification codes 75–77. ICT services include information technology and communication services. ICT = information and communication technology.

KOREA, INDIA, AND CHINA CASE STUDY 333
associates in India, which makes it the largest R&D campus outside of Germany, with
22 percent of its R&D employee count; the campus is focused on developing data
mining and software solutions (Bosch 2019).
Building human capital and research and development capacity
Beginning in the 1960s, the Indian government’s public investments in technical edu-
cation provided the foundation for the growth of the IT industry. In collaboration
with leading universities in the United States, the government created a series of elite
institutes for higher education in engineering and management, which proved pivotal
in developing a large, well-trained pool of engineers and management personnel. In
addition, the government eased policies regarding the ability to establish private edu-
cation institutions to help fill the skills gap. It also helped create and expand computer
science departments in existing engineering colleges and introduced quality-control
systems for engineering colleges and other IT-training institutions (Bhatnagar 2006).
By 1997 India had set up more than 600 institutions for degree qualification in
engineering and another 1,135 institutions granting engineering diplomas. By 1999
the higher technical education system produced more than 250,000 scientists and
technologists a year, including more than 10,000 doctorates awarded in various dis-
ciplines (Kumar 2014).
The Indian government also facilitated India’s brain gain during the 2000s.
Expatriates who had been living in the United Kingdom and the United States were
returning to India, attracted by high salaries and entrepreneurship opportunities, but
only enabled by the lifting of restrictions related to visas, investment, and the pur-
chase of property by Indian nationals who were citizens of other countries (Couto and
Fernandez-Stark 2019).
R&D has been gaining in importance to India’s participation in the digital economy
GVC as the country continues to upgrade and compete in knowledge-intensive services.
R&D expenditure by both private Indian firms and the government has traditionally
been low in India compared with other countries, and has been dominated by the gov-
ernment (Kumar 2014). As of 2018, Japan’s and China’s R&D spending of 3.3 percent
and 2.2 percent of GDP clearly outranked India’s 0.6 percent. This spending difference
can be at least partly explained by the country’s service focus, as opposed to a product
focus, which would require greater investment in R&D (Bhatnagar 2006).
However, although the relatively low investment in R&D was not a significant
impediment early on, the IT industry’s shift toward the adoption of new technolo-
gies such as artificial intelligence, automation, and cloud computing, among others,
is making R&D an increasingly important factor for the competitiveness of Indian
firms (CTIER 2016). Because of India’s comparatively low public R&D spending, the
country will continue to rely on foreign R&D for the bulk of cutting-edge innova-
tion, given the gap between indigenous and multinational innovation (Branstetter,
Glennon, and Jensen 2019).
The role of OFDI
Starting in 1992, India’s government gradually liberalized its formerly restric-
tive OFDI policy regime, with the aim of achieving technological upgrading and

334 AN INVESTMENT PERSPECTIVE ON GLOBAL VALUE CHAINS
internationalization of leading Indian companies (Pedersen 2010). Liberalization
measures included instituting automatic approval procedures, removing the prohibi-
tion on majority ownership of foreign entities, and gradually increasing the amount
of OFDI allowed under the automatic route to 100 percent of a company’s net worth
in 2004 and subsequently to 400 percent today (Kathuria 2010). All of these mea-
sures, coupled with the opening up of and hence the increased competition in Indian
domestic markets,5 as well as the liberalization of trade and investment regimes in
overseas markets, led Indian firms to expand abroad (Sauvant and Pradhan 2010).
OFDI from India increased significantly after 2000 (figure 10.5, panel a). ICT com-
panies took a strong lead in OFDI after having developed competitive advantages
such as the knowledge and skills gained as an outsourcing destination for several
years and the exposure to intense competition. OFDI in ICT increased steeply, from
US$743 million in 1990–99 to US$10.1 billion in 2000–09, which further rose to
US$43.6 billion, or 26 percent of the total India OFDI, in the following five-year
period (figure 10.5, panel b). This performance marks the industry as the most glo-
balized and internationalized sector in India (Pradhan 2017).
OFDI has allowed Indian IT firms to access new markets, skills, and technologies,
and to enlarge the global scale and scope of their operations. Indian companies pre-
dominantly established greenfield subsidiaries in other countries to provide services
on site closer to the customer and to seek out new business opportunities (Couto and
Fernandez-Stark 2019). In addition, Indian firms had also been aggressively acquir-
ing overseas strategic assets (Pradhan 2007). For example, Wipro in 2007 acquired
the US-based business process outsourcing company Infocrossing for US$600 million,
one of the largest acquisitions by an Indian company in the United States at the time,
to obtain Infocrossing’s five data centers in the United States to be able to become a
full-service company (Ruet 2010).
0
20
40
60
80
100
120
140
160
180
1980
−89
1990−9
9
2000−0
9
2010
−14
1980
−89
1990−9
9
2000−0
9
2010
−14
US$
, bill
ion
0 0.7 10
44
5
22
16
26
0
5
10
15
20
25
30
0
10
20
30
40
50
60
Shar
e of
OFD
I (%
)
US$
, bill
ion
OFDI in ICT services (left scale)
b. Cumulative OFDI flows in ICT servicesa. Total cumulative OFDI flows
ICT services as share of OFDI (right scale)
FIGURE 10.5 Outward foreign direct investment in India, 1980–2014
Source: World Bank calculations based on Pradhan 2017.Note: ICT services include information technology and communication services. ICT = information and communication technology; OFDI = outward foreign direct investment.
KOREA, INDIA, AND CHINA CASE STUDY 335
The majority of overseas investments by Indian IT services companies were in
developed countries (close to 70 percent), with the United Kingdom and the United
States being the two major hosts (Pradhan 2007). Because of the nature of software—
requiring effective integration between different types of services and involving trade
secrecy and protected data—almost all investments were majority owned (Pradhan
2007).
More recently, Indian IT companies have been investing in new technologies to
expand to new lines of business and to new markets. Based on CBInsights’ analysis of
51 acquisitions by major Indian IT companies between 2012 and 2017, acquisitions
are particularly prominent in companies working in data management (18 percent),
the internet of things (10 percent), cybersecurity (10 percent), artificial intelligence
(8 percent), and payment and invoicing (6 percent) (CBInsights 2017). Indian com-
panies tend to acquire rather than make venture capital investments, with the excep-
tion of Wipro and Infosys, which, in addition to making acquisitions, have also been
active venture capital investors and built their own corporate venture capital arms
(Frederick, Bamber, and Cho 2018).
The development of China’s digital economy global value chain
China’s journey entering and upgrading in the digital economy GVC began in the
1980s, when it successfully attracted export-oriented FDI through incentives and
infrastructure provision, often using special economic zones. This strategy allowed
it to develop a competitive ICT hardware industry focused on low-skilled and low-
value-added components and parts assembly (Ning 2009). The technology, knowl-
edge, and market access that foreign MNCs brought to China, with the assistance of
government policies, helped upgrade the competitiveness of domestic firms by trans-
ferring technology through joint ventures, forward and backward linkages, spillovers,
competition effects, industrial structure expansion, and labor spin-offs (Chen 2018).
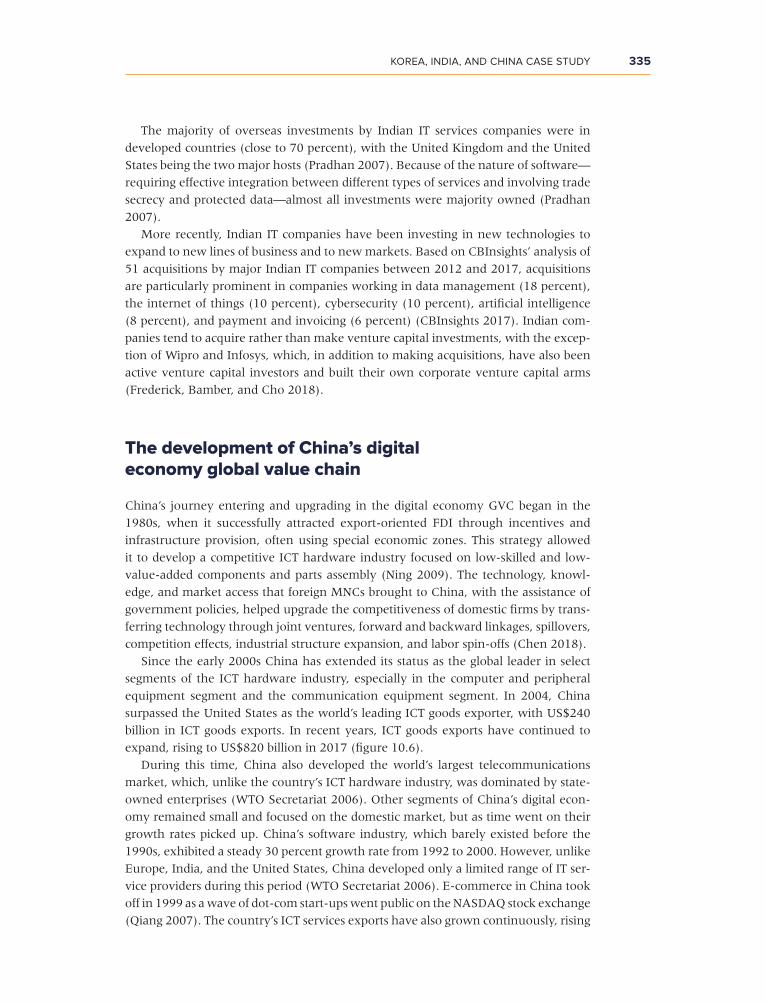
Since the early 2000s China has extended its status as the global leader in select
segments of the ICT hardware industry, especially in the computer and peripheral
equipment segment and the communication equipment segment. In 2004, China
surpassed the United States as the world’s leading ICT goods exporter, with US$240
billion in ICT goods exports. In recent years, ICT goods exports have continued to
expand, rising to US$820 billion in 2017 (figure 10.6).
During this time, China also developed the world’s largest telecommunications
market, which, unlike the country’s ICT hardware industry, was dominated by state-
owned enterprises (WTO Secretariat 2006). Other segments of China’s digital econ-
omy remained small and focused on the domestic market, but as time went on their
growth rates picked up. China’s software industry, which barely existed before the
1990s, exhibited a steady 30 percent growth rate from 1992 to 2000. However, unlike
Europe, India, and the United States, China developed only a limited range of IT ser-
vice providers during this period (WTO Secretariat 2006). E-commerce in China took
off in 1999 as a wave of dot-com start-ups went public on the NASDAQ stock exchange
(Qiang 2007). The country’s ICT services exports have also grown continuously, rising

336 AN INVESTMENT PERSPECTIVE ON GLOBAL VALUE CHAINS
from about US$59 billion in 2000 to US$130 billion in 2017. Concurrently, China
saw a significant rise in ICT exports, growing from less than 1 percent in the 1980s
to 11 percent in 1996, and still rising at almost 20 percent of total Chinese exports
(figure 10.6).
The rise of China’s digital economy firms can be explained by both structural and
policy factors. The relevant structural factors include China’s market size (McCarthy
2020), growth in digital adoption, inefficiencies in traditional sectors (MGI 2017), and
strong manufacturing base. Chinese policy makers at various levels of government
have adopted a combination of measures aimed at supporting its domestic digital
firms. On the one hand, Chinese authorities gave domestic digital firms space to exper-
iment and innovate in its large domestic market under low levels of regulation (MGI
2017), learning and upgrading their capacity gradually before they could compete at
the frontier. On the other hand, foreign firms are perceived to have disadvantages in
China, including limited market access, insufficient intellectual property protection
and enforcement, internet control and censorship, and subsidies for Chinese firms
(Ferracane and Lee-Makiyama 2017; USTR 2018). Although this protection provided
domestic firms with a first-mover advantage, it may have been counterproductive.
Jiang et al. (2018), for example, find that Chinese technology spillovers were largest
in sectors that were more open, and positive technology externalities were dampened
in industries with many prohibitions on types of foreign investment.
Building human capital and research and development capacity
Building on earlier reforms, in the mid-2000s the Chinese government, using a wide
array of policy instruments, set out to build an enterprise-centered technology inno-
vation system that would make China one of the world’s leading R&D hubs.
Under the 2006 Medium- to Long-Term Plan for the Development of Science and
Technology, Chinese policy makers set out to (a) build an innovating-based economy
0
5
10
15
20
0
250
500
750
1,000
1980 1983 1986 1989 1992 1995 1998 2001 2004 2007 2010 2013 2016
Expo
rt s
hare
(%
)
US$
, bill
ion
ICT goods exports (left scale) ICT goods exports (left scale) ICT share of exports (right scale)
FIGURE 10.6 China’s information and communication technology goods and services exports
Source: World Bank calculations based on Atlas for Economic Complexity data. Note: ICT goods are defined as Standard International Trade Classification codes 75–77. ICT services include information technology and communication services. ICT = information and communication technology.

KOREA, INDIA, AND CHINA CASE STUDY 337
by fostering indigenous innovation capacity, (b) foster an enterprise-centered technol-
ogy innovation system and enhance the innovation capabilities of Chinese firms, and
(c) achieve major breakthroughs in targeted strategic areas of technological develop-
ment and basic research (OECD 2007). The plan committed China to achieving four
broad objectives by 2020: allocating 2.5 percent of GDP to R&D, sourcing 60 percent
of growth from the contribution of scientific and technological progress, basing 70
percent of production on homegrown technologies, and raising the share of strategic
and emerging industries to 15 percent of GDP (Chen and Naughton 2016).
To further these objectives, the Chinese government has introduced more than
170 policies supporting science, technology, and innovation (STI) since 2011. These
policies span socioeconomic objectives (productivity, diversification, human capital,
entrepreneurship, and inclusion) and STI objectives (research excellence, technology
transfer, and R&D and non-R&D innovation). They also use a wide range of instru-
ments, including fiscal incentives, grants, loan guarantees, vouchers, equity, public
procurement, technology extension services, incubators, accelerators, competitive
grants and prizes, science and technology parks, and collaboration networks. The
approach seems to favor financial instruments over regulatory, advisory, and other
types of support, suggesting that the main market failure that the authorities seek to
address is the lack of funding and access to finance. The Chinese government’s volume
of support for business R&D is close to the Organisation for Economic Co-operation
and Development median, much higher than what China’s level of income would
suggest. Tax incentives account for about half of the total value of the support (OECD
2017).
Complementing China’s large and growing expenditure on R&D are investments
in the development of human resources in science and technology. Students in sci-
ence and engineering (S&E) account for about half of all bachelor’s degrees awarded
in China, and in 2014 Chinese S&E graduates numbered almost 1.5 million—more
than the combined total of S&E graduates in the United States and the eight European
Union countries with the highest number of S&E bachelor and doctoral degrees
awarded that year. In addition, more than 3,000 of these graduates received doctor-
ates, more than in the United States and three times more than in India. Training at
western and Japanese research institutions, and the connections forged there, have
contributed greatly to the quality of China’s research human capital. Today, China is a
global innovation hub, boasting among the world’s highest numbers for STI spending
and patent applications (World Bank Group 2020).
These advances helped enable Chinese firms to become outward investors in the
first place, and they also enabled Chinese firms and the Chinese economy more
broadly to benefit from OFDI, as several studies have confirmed (Huang and Zhang
2017; Li et al. 2016).
The role of outward foreign direct investment
In the 1980s and 1990s, OFDI played a limited role in the development of China’s
digital economy. Until the mid-1980s, only state-owned enterprises were allowed
to invest abroad, and case-by-case approval was required for all investment. The
government then partially extended the right to apply for permission to invest

338 AN INVESTMENT PERSPECTIVE ON GLOBAL VALUE CHAINS
abroad (OECD 2008). Until the late 1990s, however, controls on financial outflows
remained tight in response to the state’s losses from speculative investments in real
estate and stock markets in the early 1990s, and to prevent capital flight during the
East Asian financial crisis (Wang and Gao 2019). China’s average total OFDI flows
from 1992 to 1999 remained low at US$2.7 billion (Wang and Gao 2019).
In 2000, the Chinese government began to embrace the liberalization and promo-
tion of outward investment as a development strategy. With the 10th Five-Year Plan
on Economic and Social Development, China formalized its “Going Out” strategy, list-
ing OFDI as one of the four key thrusts that would enable the Chinese economy “to
adjust itself to the globalization trend” (Sauvant and Chen 2013). In a number of sub-
sequent pronouncements and policy documents, the government further elaborated
this strategy and repurposed its OFDI policy and regulatory frameworks in light of
two objectives: to help Chinese firms become more competitive internationally, and
to assist the country in its development efforts by using OFDI to achieve economic
restructuring. In pursuit of these objectives, China’s regulatory framework for OFDI
has moved “from restricting, to facilitating, to supporting, and finally to encouraging
OFDI” (Sauvant and Chen 2013, 1).
Following its “Going Out” strategy, China has incrementally streamlined and lib-
eralized its OFDI regulations. It gradually simplified approval procedures and doc-
umentation requirements, decentralized authority from national regulators to their
provincial counterparts (MOFCOM 2004; NDRC 2004), and gradually loosened
restrictions on the use of foreign exchange for OFDI. To that end, the government
abolished compulsory repatriation of overseas profits, and in 2006 eliminated the
long-imposed quota of US$5 billion per year on foreign exchange allocated to OFDI
(OECD 2008). Importantly, under the 2014 Catalogue of Investment Projects Subject
to the Approval of Government, the general framework for OFDI was changed from
an approval-based system to a recording system (World Bank Group 2020). In that
same year, the regulatory framework for OFDI matured to embrace corporate social
responsibility when investing abroad, such as minimizing the environmental and
social impacts of investment on host economies (Perea and Stephenson 2018).
In addition to liberalizing its OFDI regulations, the Chinese government has directly
supported and encouraged OFDI. Sauvant and Chen (2013) identify five ways in
which the Chinese government supports OFDI (box 10.1).
OFDI flows from China rose from less than US$2 billion in 2000 to US$146 billion
in 2015. In 2016, Chinese OFDI flows reached two milestones: they became the sec-
ond highest in the world, after those from the United States, and they overtook FDI
flows into China for the first time (Perea and Stephenson 2018). The digital economy
makes up an important share of the total increase in OFDI. Manufacturing OFDI (led
by ICT-related products) rose from US$2 billion in 2005 to US$30 billion in 2017
(figure 10.7, panel a). Similarly, OFDI for ICT services and R&D grew from less than
US$30 million in 2005 to a high of US$23 billion in 2016 (figure 10.7, panel b). Not
only has OFDI in ICT goods and services expanded rapidly, but it has also exceeded
20 percent of total OFDI every year since 2015 (sum of panels a and b in figure 10.7).
Government support proved to be an important factor in China’s rising OFDI flows.
In a 2011 survey of Chinese outward investors conducted by the China Council for the
Promotion of International Trade, 55 percent of firms identified China’s “Going Out”

KOREA, INDIA, AND CHINA CASE STUDY 339
BOX 10.1 Chinese government support for outward foreign direct investment
The Chinese government supports outward foreign direct investment (OFDI) through a number of measures:
• Financial and fiscal measures. The Export-Import Bank of China and other state-owned commer-cial banks support OFDI by offering low lending rates, flexible terms, and a fast approval process for OFDI projects. In 2003, a Special Fund of Lending for Investment Overseas was established to extend special financial services (including discounted lending rates) to large-scale business groups possessing sufficient capital, technology, management skills, and brands to invest abroad (CDB and EXIM 2006). Another fund established by the Chinese Ministry of Finance and the Ministry of Com-merce (MOFCOM) provides direct subsidies to OFDI projects that, among other criteria, build for-eign research and development centers (Ministry of Finance and MOFCOM 2012). A number of tax incentives to support OFDI were granted by the State Taxation Administration, including a special corporate income tax rate for high-technology enterprises (reduced from 25 percent to 15 percent) (STA 2011). In addition, a new foreign exchange policy was introduced in 2011 that allows Chinese firms to directly use yuan to invest abroad if certain conditions are met (PBC 2011).
• Provision of information. MOFCOM, the National Development and Reform Commission, and the Ministry of Foreign Affairs jointly publish an annual OFDI Guidebook that lists current investment opportunities by country, industry, and project. MOFCOM also provides information through its global commercial consulate offices and offers services such as the collection of information and statistics and decision-making support (MOFCOM 2020).
• Development assistance programs. Since 2006, the Chinese government has assisted in the con-struction of foreign economic and trade cooperation zones. These zones are designed to provide developed infrastructure to the firms operating within them, and they are mostly focused on export processing and scientific and technological projects.
• International investment agreements (IIAs). Since China began its IIA program in 1982, the coun-try has signed more IIAs (146) than any other country except Germany (which has signed 201).a During this time, China’s approach toward IIAs has undergone significant shifts. In its IIAs signed from 1982 to 1998, China limited substantive protections and access to investor-state dispute resolution, reflecting China’s status during that time as a predominantly capital-importing coun-try (Sauvant and Nolan 2015). In its IIAs signed between 1998 and 2008, China’s consent to arbitration was often broadened given that its interest in protecting its investments abroad had increased (Sauvant and Nolan 2015). In IIAs signed subsequently, China developed a more bal-anced approach, both tightening admissibility requirements for investors’ claims and increasing levels of substantive investment protection. The country’s focus became to ensure that Chinese state-owned enterprises’ investments were protected while also allowing sufficient regulatory flexibility (Sauvant and Nolan 2015).
• Political risk insurance. Chinese outward investors, and the institutions that finance their invest-ment, may receive investment protection from the China Export & Credit Insurance Corporation (Sinosure). Sinosure offers insurance against the loss of capital and earnings abroad caused by several types of political risk, including expropriation, restrictions on the transfer and conversion of funds, damage from war, inability to operate because of war, and breach of contract.
Source: Based on Sauvant and Chen 2013 and Sauvant and Nolan 2015.a. UNCTAD (United Nations Conference on Trade and Development), 2020, Investment Policy Hub (https://investmentpolicy.unctad.org).

340 AN INVESTMENT PERSPECTIVE ON GLOBAL VALUE CHAINS
strategy as an important or very important factor in their decisions to invest abroad; in
fact, they considered it more important than almost all other factors influencing OFDI
decision-making (CCPIT 2012). A large majority, 74 percent, of respondents said that
they had benefited from the government’s OFDI policies. Moreover, a substantial
amount of OFDI was financed by the government. Gallagher and Irwin (2014) esti-
mate the total amount of OFDI financing provided by the China Development Bank
and the Export-Import Bank of China at US$140 billion from 2002 to 2012, amount-
ing to at least 30 percent of China’s total OFDI.
OFDI has allowed Chinese firms to enter and upgrade in various segments of the
digital economy GVC. It has also contributed to structural changes in China’s econ-
omy through its home-country effects. Both outward investors and other firms in
the digital sector have benefited from OFDI through a number of channels, including
direct knowledge transfers (of technology, production techniques, and management
0
10
20
0
0
10
20
30
40a. China’s OFDI flows in manufacturing
b. China's OFDI flows in ICT services and R&D
2005 2006 2007 2008 2009 2010 2011 2012 2013 2014 2015 2016 2017 2018
Shar
e o
f to
tal O
FDI (
per
cent
)
US$
, bill
ion
OFDI in manufacturing (left scale) Share of total OFDI (right scale)
–3
2
7
12
5
10
15
20
25
2005 2006 2007 2008 2009 2010 2011 2012 2013 2014 2015 2016 2017 2018
Shar
e of
tota
l OFD
I (pe
rcen
t)
US$
, bill
ion
OFDI in scientific research and technical services (left scale)OFDI in information, software, and IT services (left scale)
Share of total OFDI (right scale)
FIGURE 10.7 Outward foreign investment in China, 2005–18
Source: Statistical Bulletin of China's Outward Foreign Direct Investment (several editions, 2006–18) (http://cdi.cnki.net/Titles/SingleNJ?NJCode=N2017120333). Note: ICT = information and communication technology; IT = information technology; OFDI = outward foreign direct investment; R&D = research and development.

KOREA, INDIA, AND CHINA CASE STUDY 341
skills), indirect knowledge transfers from related firms (including reverse spillover
effects from developed to developing markets), labor mobility, competition effects,
and scale and scope effects. A number of studies find positive home-country effects in
economy-wide productivity (Zhao, Liu, and Zhao 2010), growth (Liu and Lu 2011),
employment (Cozza, Rabellotti, and Sanfilippo 2015), exports (Wang and Zhang
2010), and innovation (Chen, Li, and Shapiro 2012; Chen and Tang 2014; Fu, Hou,
and Liu 2018; Li et al. 2016; Mao and Xu 2014 ).
A comparison of the three countries
This case study highlights the critical role of human capital—building absorptive
capacity and indigenous innovation—in entering and upgrading along the digi-
tal economy GVC. The digital economy is one of the most knowledge-intensive
sectors and is therefore greatly dependent on the level of technological capabili-
ties. Investment in higher education in the STEM areas is critical. The examples of
Korea, India, and China show that such investment in building a large skills pool
is strategic, establishes the foundation, and helps give domestic firms a competitive
edge in this GVC.
The three countries also seem to have motivated actors and technologies from both
domestic and foreign markets to innovate in specific segments in the digital economy
GVC. Although there are many commonalities in the three countries’ experiences (for
example, using inward FDI to jumpstart the industry, liberalizing OFDI to help lead-
ing domestic firms internationalize, and investing in human capital), distinct features
shaped each country’s path (table 10.1). Korea and China adopted more selective
inward FDI policies and engaged in proactive OFDI promotion, whereas the Indian
government was more hands-off with regard to OFDI. Korea spent most aggressively
on R&D and achieved leading positions in several ICT goods segments. China also has
relatively high R&D expenditure and is becoming a top player in multiple segments
in both ICT goods and services. India currently invests less in R&D, partly because it
specializes in ICT services that are less technology intensive, such as business pro-
cess management. These differing experiences show again that the usefulness of the
various approaches is partly based on GVC characteristics and partly on the general
capacity that exists within local firms.
Conclusion
For countries aiming to stimulate their participation in the digital economy GVC,
this case study suggests that governments should first and foremost invest in their
country’s human capital. The digital economy is one of the most knowledge-inten-
sive sectors and is therefore greatly dependent on technological skills. Investment in
tertiary education in the STEM areas is critical and will take time. The examples of
Korea, India, and China show that such investment in building a large skills pool has,
over time, established the knowledge skills foundation that gave domestic firms a
competitive edge in this GVC.

342 AN INVESTMENT PERSPECTIVE ON GLOBAL VALUE CHAINS
TABLE 10.1 Comparison of the three countries’ approaches
Republic of Korea India China
Leading GVC segments
ICT goods (semiconductors, wireless communication devices, flat panel displays, consumer electronics)
ICT services (business process management)
Both ICT goods (personal computers, mobile phones, televisions, drones) and ICT services (fintech, e-commerce, internet platforms, digital content)
Building human capital
• Large public and private investments heavily expanded the tertiary education enrollment rate
• Government established various electronics-related departments at universities
• Creation of multiple scientific research institutions focused on ICT goods– and ICT services–related R&D
• Public investment in technical education since the 1960s
• Creation of a series of elite institutes for higher education and management together with leading US universities
• Relaxed regulations on private education institutions to fill the skills gap
• Expanded computer science departments in universities
• Introduced IT training institutions
• Large investments in the development of human resources in science and technology
• Half of all bachelor's degrees in China awarded to students in science and engineering
R&D investment
• Government urged chaebols to invest heavily in R&D in ICT goods
• Chaebols engaged in numerous corporate-academic collaborations and invested in advanced countries to obtain cutting-edge technologies
• Second-highest R&D expenditure relative to GDP (4.8%) in the world
• Relatively low R&D investment (0.6% of GDP)
• R&D dominated by government • Low R&D partly because of its
services focus, which requires less investment in R&D than do ICT goods
• Established various research institutions since the 1950s
• Adopted a wide range of policies to support science, technology, and innovation, including fiscal incentives, grants, loan guarantees, vouchers, equity, public procurement, science and technology parks, and collaboration networks
• Relatively high R&D expenditure as a share of GDP (2.2%)
Inward FDI policies
• Selective promotion of inward FDI as part of overall industrial policy
• Restricted FDI inflows in ICT goods initially to protect domestic firms
• FDI not major engine of ICT goods industry but helped strengthen local firms’ technological capacity
• The Liberalization, Privatization, and Globalization reforms in 1991 opened Indian economy to FDI
• IT, BPO, computer software and hardware, telecommunications were top FDI-receiving sectors
• Inward FDI instrumental in developing India's ICT services industry
• Liberalized FDI regulations since 1980s
• Selective promotion of FDI in manufacturing and export-oriented industries
• Large influx of FDI since the 1980s helped China develop a competitive ICT goods industry
Outward FDI policies
Proactive government promotion of OFDI since 1990s, with a range of financial support measures, information provision, and overseas investment services
Relatively hands-off, gradually liberalized OFDI policies since 1992 to help technological upgrading and domestic firms’ internationalization
Liberalized OFDI in 2000, and encouraged OFDI through financial and fiscal measures, provision of information, development assistance programs, international investment agreements, and political risk insurance
Source: World Bank.Note: BPO = business process outsourcing; FDI = foreign direct investment; fintech = financial technology; GVC = global value chain; ICT = information and communication technology; IT = information technology; OFDI = outward foreign direct investment; R&D = research and development.

KOREA, INDIA, AND CHINA CASE STUDY 343
Proactive government support in R&D may also be needed to help domestic firms
develop the necessary technology to engage in the digital economy. Through a wide
array of policy instruments, particularly financial instruments, both Korea and China
helped build the production and innovation capacity of local firms and enabled
them to become leading R&D hubs. These support measures initially helped young
digital economy firms better understand and absorb existing technologies in their
sector. Over time, such R&D efforts also prepared the more competitive domestic
firms to internationalize and make the transition into outward investors and MNCs
themselves.6
This case study further shows that OFDI is an internationalization channel for the
most competitive domestic firms. All three countries demonstrate a strong, positive
link between rising OFDI and exports of ICT goods and services. Leading domestic
firms chose to invest overseas (often in high-income countries using mergers and
acquisitions and venture capital) to acquire strategic assets such as R&D and pro-
prietary technology, globally recognized brand names, and established customer
networks and sales channels. In parallel, they also invested in developing countries
(commonly via greenfield FDI) to establish production facilities. Korean firms, for
example, invested heavily in the United States to obtain advanced technology, and
invested in low-cost countries to manufacture and sell their products (Kim, Driffield,
and Love 2018). This approach helped the more productive domestic firms further
develop their technological capabilities, expand their production networks and mar-
kets, and compete on a global scale.
For governments seeking to stimulate OFDI, liberalizing outward investment reg-
ulations is an essential first step. In all three countries, a boom in outward investment
was preceded by the liberalization of OFDI rules. Yet, according to the International
Monetary Fund’s Annual Report on Exchange Arrangements and Exchange
Restrictions database, 86 out of 192 countries had controls in place on OFDI in 2018
(IMF 2019). These controls are most commonplace in developing countries—58 per-
cent of developing countries still control OFDI, whereas only 21 percent of high-in-
come countries do so.
In addition, as shown for Korea and China, OFDI can be supported using a com-
bination of financial and fiscal measures, the provision of information, develop-
ment assistance programs, and international investment agreements. This combined
approach of investing in building human capital, R&D, and supporting OFDI has
helped Korea, India, and China become leading players in segments of the digital
economy GVC.
Finally, similar to the other case studies in this report, the three countries’ experi-
ences also highlight the crucial role of inward FDI and more broadly the interactions
with MNCs. In all three cases, MNCs were attracted by a number of tools, includ-
ing the provision of infrastructure and incentives (for example, software technol-
ogy parks in India). Technology, know-how, and market access that foreign MNCs
brought to the three countries helped upgrade the competitiveness of domestic firms.
The domestic firms then developed and accumulated knowledge about foreign mar-
kets and built networks and linkages before venturing abroad. Moreover, the types
of investments the countries attracted in the digital economy GVC progressed over
time from low-value-added goods production to high-value-added services and R&D,
often performed in collaboration with local firms or research institutes.
344 AN INVESTMENT PERSPECTIVE ON GLOBAL VALUE CHAINS
Notes
1. Ministry of Trade, Industry and Energy, https://www.trade.gov/country-commercial-guides/south-korea-information-and-communication-technology.
2. IIoT refers to the use of smart sensors attached to physical devices and real-time analytics to enhance manufacturing and industrial processes. IIoT falls across a number of segments of the digital economy GVC, including components, software, cloud systems, and IT services.
3. Based on World Bank World Development Indicators. 4. The Y2K problem was a computer flaw, or bug, that may have caused problems when
dealing with dates beyond December 31, 1999. Global demand for IT professionals increased because of the need to remedy this issue.
5. The measures included removal of the restrictions on the growth of firms (such as the Foreign Exchange Regulation Act), the removal of the licensing regime, the dismantling of product reservation systems for publicly owned and small and medium enterprises, facilitation measures for foreign firms, and a massive reduction in import duties (Pradhan and Sauvant 2010).
6. The World Development Report (World Bank 2020) similarly emphasizes the importance of investment in R&D and human capital as a prerequisite for participation in knowledge-intensive GVCs such as the digital economy.
References
Bosch. 2019. “2019 Annual Report: Innovation for Times of Transition.” Bosch, Stuttgart, Germany. https://assets.bosch.com/media/global/bosch_group/our_figures/pdf/bosch-an-nual-report-2019.pdf.
Bhatnagar, S. 2006. “India’s Software Industry.” In Technology, Adaptation, and Exports: How Some Developing Countries Got It Right, edited by V. Chandra, 54–56. Washington, DC: World Bank.
Branstetter, L. G., B. Glennon, and J. B. Jensen. 2019. “The IT Revolution and the Globalization of R&D.” NBER Working Paper 24707, National Bureau of Economic Research, Cambridge, MA. https://www.journals.uchicago.edu/doi/pdf/10.1086/699931.
Casanova, L., and A. Miroux. 2019. “Tencent: An Innovative Tech Giant.” In The Era of Chinese Multinationals: Competing for Global Dominance, 179–202. London: Academic Press.
CBInsights. 2017. “India’s IT Giants Are Investing and Acquiring to Catch up with Trends in Cloud, AI, and Automation.” CBInsights Research Briefs. https://www.cbinsights.com/research/india-it-investments-acquisitions/.
CCPIT (China Council for the Promotion of International Trade). 2012. “Survey on Chinese Enterprises’ Outbound Investment and Operation.” CCPIT, Beijing. http://www.ccpit.org/docs/2012-08-03/2012_haiwaitouzi_diaochabaogao.pdf.
CDB (China Development Bank) and EXIM (Export-Import Bank of China). 2006. “CDB and EXIM Enhance Their Financial and Insurance Support for Key Investment Projects Overseas Encouraged by the State.” CDB 2006 No. 11 Order, CDB and EXIM, Beijing.
Chen, C. 2018. “The Liberalization of FDI Policies and the Impacts of FDI on China’s Economic Development.” In China’s 40 Years of Reform and Development: 1978–2018, edited by Ross Garnaut, Ligang Song, and Cai Fang, 595–618. Canberra: Australian National University Press.
Chen, L., and B. Naughton. 2016. “An Institutionalized Policy-Making Mechanism: China’s Return to Techno-Industrial Policy.” Research Policy 45 (10): 2138–52.
Chen, V. Z., J. Li, and D. M. Shapiro. 2012. “International Reverse Spillover Effects on Parent Firms: Evidences from Emerging Market MNEs in Developed Markets.” European Management Journal 30 (3): 204–18.
Chen, W., and H. Tang. 2014. “The Dragon Is Flying West: Micro-Level Evidence of Chinese Outward Direct Investment.” Asian Development Review 31 (2): 109–40.

KOREA, INDIA, AND CHINA CASE STUDY 345
Couto, V., and K. Fernandez-Stark. 2019. “Pakistan in the Offshore Services Global Value Chain.” Duke University Global Value Chains Center, Durham, NC. https://gvcc.duke.edu/wp-content/uploads/PakistanOffshoreServicesGVC.pdf.
Cozza, C., R. Rabellotti, and M. Sanfilippo. 2015. “The Impact of Outward FDI on the Performance of Chinese Firms.” China Economic Review 36 (December): 42–57.
CTIER (Centre for Technology Innovation and Economic Research). 2016. “Indian IT Industry: Future Competitiveness Demands Increased R&D Spending.” CTIER Brief 02, CTIER, Maharashtra, India. http://www.ctier.org/pdf-event/2016-10-CTIER-Brief-IT%20Industry .pdf.
Dayton, L. 2020. “How South Korea Made Itself a Global Innovation Leader.” Nature 581: S54–S57.
Fernandez-Stark, K., P. Bamber, and G. Gereffi. 2011. “The Offshore Services Value Chain: Upgrading Trajectories in Developing Countries.” International Journal of Technological Learning, Innovation and Development 4 (1–3): 206–34.
Ferracane, M. F., and H. Lee-Makiyama. 2017. “China’s Technology Protectionism and Its Non-Negotiable Rationales.” ECIPE Trade Working Paper 2/2017, European Centre for International Political Economy, Brussels.
Frederick, S., P. Bamber, and J. Cho. 2018. “The Digital Economy, Global Value Chains and Asia.” Joint report, Duke University Global Value Chains Center and Korea Institute for Industrial Economics and Trade, Durham NC. https://gvcc.duke.edu/wp-content/uploads/DigitalEconomyGVCsAsia2018.pdf.
Fu, X., J. Hou, and X. Liu. 2018. “Unpacking the Relationship between Outward Direct Investment and Innovation Performance: Evidence from Chinese Firms.” World Development 102: 111–23.
Fung, K. C., A. Garcia-Herrero, and A. Siu. 2009. “A Comparative Empirical Examination of Outward Foreign Direct Investment from Four Asian Economies: People’s Republic of China; Japan; Republic of Korea; and Taipei, China.” Asian Development Review 26 (2): 86–101.
Gallagher, K. P., and A. Irwin. 2014. “Exporting National Champions: China’s Outward Foreign Direct Investment Finance in Comparative Perspective.” China & World Economy 22 (6): 1–21.
Huang, Y., and Y. Zhang. 2017. “How Does Outward Foreign Direct Investment Enhance Firm Productivity? A Heterogeneous Empirical Analysis from Chinese Manufacturing.” China Economic Review 44 (July): 1–15.
IBEF (India Brand Equity Foundation). 2021. “IT & BPM Industry in India.” https://www.ibef .org/industry/information-technology-india.aspx.
IMF (International Monetary Fund). 2019. Annual Report on Exchange Arrangements and Exchange Restrictions 2018. Washington, DC: International Monetary Fund. https://www.imf.org/en /Publications/Annual-Report-on-Exchange-Arrangements -and -Exchange -Restrictions /Issues/2019/04/24/Annual-Report-on-Exchange-Arrangements-and-Exchange -Restrictions-2018-46162.
Jalote, P., and P. Natarajan. 2019. “The Growth and Evolution of India’s Software Industry.” Communications of the ACM 62 (11): 64–69.
Jiang, K., W. Keller, L. D. Qiu, and W. Ridley. 2018. “International Joint Ventures and Internal vs. External Technology Transfer: Evidence from China.” NBER Working Paper 24455, National Bureau of Economic Research, Cambridge, MA.
Kathuria, V. 2010. “Outward Investment by Indian Pharmaceutical and Software Multinational Enterprises: Are the Factors Different?” In The Rise of Indian Multinationals, edited by Jaya Prakash Pradhan, Karl P. Sauvant, Ayesha Chatterjee, and Brian Harley, 167–85. New York: Palgrave Macmillan.
Kim, J., and D. K. Rhee. 2009. “Trends and Determinants of Korean Outward FDI.” Copenhagen Journal of Asian Studies 27 (1): 126–54.
Kim, J.-Y., N. Driffield, and J. H. Love. 2018. “The Location of Technology Sourcing FDI: South Korean Investment in the US.” Paper presented at the 6th Copenhagen Conference on “Emerging Multinationals: Outward Investment from Emerging Economies.” Copenhagen, Denmark, October 11–12.

346 AN INVESTMENT PERSPECTIVE ON GLOBAL VALUE CHAINS
Kumar, N. 2014. “National Innovation Systems and the Indian Software Industry Development.” In Innovation in India: Combining Economic Growth with Inclusive Development, edited by S. Ramani, 143–85. Cambridge: Cambridge University Press. doi:10.1017/CBO9781139794640.006.
Leskin, P. 2020. “TikTok Surpasses 2 Billion Downloads and Sets a Record for App Installs in a Single Quarter.” Business Insider, April 30, 2020. https://www.businessinsider.com/tiktok-app-2-billion-downloads-record-setting-q1-sensor-tower-2020-4?r=DE&IR=T.
Li, J., R. Strange, L. Ning, and D. Sutherland. 2016. “Outward Foreign Direct Investment and Domestic Innovation Performance: Evidence from China.” International Business Review 25 (5): 1010–19.
Lim, W. 2016. The Development of Korea’s Electronics Industry during Its Formative Years (1966–1979). Sejong, Korea: KDI School of Public Policy and Management, Ministry of Strategy and Finance.
Liu, H., and J. Lu. 2011. “The Home-Employment Effect of FDI from Developing Countries: In the Case of China.” Journal of Chinese Economic and Foreign Trade Studies 4 (3): 173–82.
Lovelock, P. 2018. “Framing Policies for the Digital Economy: Towards Policy Frameworks in the Asia-Pacific.” UNDP Global Centre for Public Service Excellence, Singapore.
Mani, D., and S. Trines. 2018. “Education in South Korea,” World Education News + Review (WENR), October 16, 2018. https://wenr.wes.org/2018/10/education-in-south-korea.
Mao, Q. L., and J. Y. Xu. 2014. “Effects of China’s Outward FDI on Employees’ Income: An Empirical Study Based on Propensity Score Matching.” Journal of International Trade 11.
McCarthy, Niall. 2020. “98% of Chinese Internet Users Are Mobile.” Statista, August 24, 2020. https://www.statista.com/chart/15202/the-number-of-internet-users-in-china/.
MGI (McKinsey Global Institute). 2017. “Digital China: Powering the Economy to Global Competitiveness.” McKinsey & Company.
MGI (McKinsey Global Institute). 2019a. “China and the World: Inside the Dynamics of a Changing Relationship.” McKinsey & Company.
MGI (McKinsey Global Institute). 2019b. “Digital India: Technology to Transform a Connected Nation.” McKinsey Global Institute. https://www.mckinsey.com/~/media/McKinsey/Business%20Functions/McKinsey%20Digital/Our%20Insights/Digital%20India%20Technology%20to%20transform%20a%20connected%20nation/MGI-Digital-India-Report-April-2019.pdf.
Ministry of Finance and MOFCOM (Ministry of Commerce of China). 2012. “Announcement for Application for 2012 Special Fund of International Economic and Technological Cooperation.” Ministry of Finance and MOFCOM, Beijing. http://www.mofcom.gov.cn/aar-ticle/cwgongzuo/huiyjl/201207/20120708225224.html.
MOFCOM (Ministry of Commerce of China). 2004. “Provisions on the Examination and Approval of Investment to Run Enterprises Abroad.” MOFCOM, Beijing. http://www .asian-lii.org/cn/legis/cen/laws/poteaaoitrea831/.
MOFCOM (Ministry of Commerce of China). 2020. “Global Investment and Cooperation Information Service System.” MOFCOM, Beijing. http://femhzs.mofcom.gov.cn/fecpmvc/pages/fem/CorpJWList.html.
NDRC (National Development and Reform Commission). 2004. “Interim Administrative Measures for Approving Investment Projects Overseas.” NDRC, Beijing.
Nicolas, F. 2003. “FDI as a Factor of Economic Restructuring: The Case of South Korea.” In International Trade, Capital Flows and Economic Development in East Asia: The Challenge in the 21st Century, edited by A. Bende-Nabende. London: Ashgate.
Nicolas, F., S. Thomsen, and M. H. Bang. 2013. “Lessons from Investment Policy Reform in Korea.” Working Paper on International Investment 2013/02, OECD Publishing, Paris. http://dx.doi.org/10.1787/5k4376zqcpf1-en.
Ning, L. 2009. “China’s Leadership in the World ICT Industry: A Successful Story of Its ‘Attracting-in’ and ‘Walking-out’ Strategy for the Development of High-Tech Industries?” Pacific Affairs 82 (1): 67–91.
OECD (Organisation for Economic Co-operation and Development). 2007. “OECD Reviews of Innovation Policy: China.” Synthesis Report, OECD Publishing, Paris.

KOREA, INDIA, AND CHINA CASE STUDY 347
OECD (Organisation for Economic Co-operation and Development). 2008. OECD Investment Policy Reviews—China 2008: Encouraging Responsible Business Conduct. Paris: OECD Publishing.
OECD (Organisation for Economic Co-operation and Development). 2017. OECD Economic Surveys: China. Paris: OECD Publishing.
PBC (People’s Bank of China). 2011. “Interim Administrative Measures on Investment Overseas Settlement Accounts in Renminbi [PBC 2011 No. 1 Order].” PBC, Beijing.
Pedersen, J. D. 2010. “Political Factors behind the Rise of Indian Multinational Enterprises: An Essay in Political Economy.” In The Rise of Indian Multinationals, edited by Jaya Prakash Pradhan, Karl P. Sauvant, Ayesha Chatterjee, and Brian Harley, 57–77. New York: Palgrave Macmillan.
Perea, J. R., and M. Stephenson. 2018. “Outward FDI from Developing Countries.” In Global Investment Competitiveness Report 2017/2018: Foreign Investor Perspectives and Policy Implications, 101–34. Washington, DC: World Bank Group.
Pradhan, J. P. 2007. “National Innovation System and the Emergence of Indian Information and Software Technology Multinationals.” ISID Working Paper 2007/09, Institute for Studies in Industrial Development, New Delhi. https://papers.ssrn.com/sol3/papers .cfm?abstract_id=1515648.
Pradhan, J. P. 2017. “Indian Outward FDI: A Review of Recent Developments.” Transnational Corporations 24 (2): 43–70. doi:10.18356/32864c71-en.
Pradhan, J. P., and K. P. Sauvant. 2010. “Introduction: The Rise of Indian Multinational Enterprises: Revisiting Key Issues.” In The Rise of Indian Multinationals, edited by Jaya Prakash Pradhan, Karl P. Sauvant, Ayesha Chatterjee, and Brian Harley, 1–23. New York: Palgrave Macmillan.
PwC (PricewaterhouseCoopers). 2018. “The 2017 Global Innovation 1000 Study: Investigating Trends at the World’s 1000 Largest Corporate R&D Spenders.” PwC.
Qiang, C. Z.-W. 2007. China’s Information Revolution: Managing the Economic and Social Transformation. Washington, DC: World Bank.
Ruet, J. 2010. “When a Great Industry Globalizes: Indian Conglomerates Pioneering New Trends in Industrial Globalization.” In The Rise of Indian Multinationals, edited by Jaya Prakash Pradhan, Karl P. Sauvant, Ayesha Chatterjee, and Brian Harley, 79–110. New York: Palgrave Macmillan.
Sauvant, K. P., and V. Z. Chen. 2013. “China’s Outward Foreign Direct Investment: Salient Features, Drivers and Its Institutional Framework.” Unpublished. https://papers.ssrn.com/sol3/papers.cfm?abstract_id=3217852.
Sauvant, K. P., and M. D. Nolan. 2015. “China’s Outward Foreign Direct Investment and International Investment Law.” Journal of International Economic Law 18 (4): 893–934.
STA (State Taxation Administration). 2011. “Circular on the Reduction and Exemption of Revenues from Oil and Gas Extraction Projects Overseas by Chinese Enterprises.” STA 2011 No. 23 Order, STA, Beijing.
Statista. 2020. “LG Display Panels Global Market Share 2013–2019.” https://www.statista .com/statistics/679773/lg-display-panel-market-share-south-korea/.
UIS (UNESCO Institute for Statistics). 2021. UNESCO Institute for Statistics, Data Centre. http://data.uis.unesco.org/.
UNCTAD (United Nations Conference on Trade and Development). 2017. World Investment Report 2017: Investment and the Digital Economy. Geneva: United Nations.
US ITA (United States International Trade Administration). 2020. “South Korea – Country Commercial Guide: Information and Communication Technology.” US ITA, Department of Commerce, Washington, DC. https://www.trade.gov/country-commercial-guides/south-korea-information-and-communication-technology.
USTR (United States Office of the US Trade Representative). 2018. “Findings of the Investigation into China’s Acts, Policies and Practices Related to Technology Transfer, Intellectual Property, and Innovation Under Section 301 of the Trade Act of 1974.” USTR, Washington, DC.
Wallach, Omri. 2020. “How Big Tech Makes Their Billions.” Visual Capitalist, July 6, 2020. https://www.visualcapitalist.com/how-big-tech-makes-their-billions-2020/.

348 AN INVESTMENT PERSPECTIVE ON GLOBAL VALUE CHAINS
Wang, B., and K. Gao. 2019. “Forty Years Development of China’s Outward Foreign Direct Investment: Retrospect and the Challenges Ahead.” China & World Economy 27 (3): 1–24.
Wang, G. Z., and Y. Zhang. 2010. “Research on the Impact of Outward Foreign Direct Investment on Trade Competitiveness.” Paper prepared for 2010 International Conference on Machine Learning and Cybernetics, July 11–14.
World Bank. 2020. World Development Report 2020: Trade for Development in the Age of Global Value Chains. Washington, DC: World Bank.
World Bank Group. 2020. “Promoting Innovation in China: Lessons from International Good Practice.” FCI Insight, World Bank Group, Washington, DC. http://documents1.worldbank.org/curated/en/571611587708038991/pdf/Promoting-Innovation-in-China-Lessons-from-International-Good-Practice.pdf.
WTO (World Trade Organization) Secretariat. 2006. “Trade Policy Review – Report by the Secretariat: People’s Republic of China.” WT/TPR/S/161/Rev.1, WTO, Geneva.
Zhang, L., and S. Chen. 2019. “China’s Digital Economy: Opportunities and Risks.” Working Paper 19/16, International Monetary Fund, Washington, DC.
Zhao, Wei, Ling Liu, and Ting Zhao. 2010. “The Contribution of Outward Direct Investment to Productivity Changes within China, 1991–2007.” Journal of International Management 16 (2): 2121–30.