Strengthening value chains as an industrial policy instrument
360
Strengthening value chains as an industrial policy instrument Methodology and experience of ECLAC in Central America RAMÓN PADILLA PÉREZ Editor Economic Development
-
Upload
khangminh22 -
Category
Documents
-
view
0 -
download
0
Transcript of Strengthening value chains as an industrial policy instrument

123 Strengthening value chains as an industrial policy instrumentMethodology and experienceof ECLAC in Central America
RAMÓN PADILLA PÉREZEditor
Econ
omic
Dev
elop
men
t

Strengthening value chains as an industrial policy instrumentMethodology and experience of ECLAC in Central America
Ramón Padilla Pérez
Editor
Economic Commission for Latin America and the Caribbean (ECLAC)
Santiago, Chile, July 2014

ECLAC Books
Alicia Bárcena Executive Secretary
Antonio Prado Deputy Executive Secretary
Hugo E. Beteta Chief, ECLAC subregional headquarters in Mexico
Ricardo Pérez Chief, Publications and Web Services Division
123
This book was edited by Ramón Padilla Pérez, Economics Affairs Officer in the International Trade and Industry Unit of the ECLAC subregional headquarters in Mexico and coordinator of the project on the integration of agro-industrial SMEs into global value chains in Central America. The project was overseen by Jorge Mario Martínez Piva, Chief of the International Trade and Industry Unit of the subregional headquarters, who also supervised the preparation of this book. Nahuel Oddone, a staff member of the Unit, played a key role in the substantive implementation of the project.
The following staff members of the ECLAC subregional headquarters in Mexico worked on the chapters of this book: Jennifer Alvarado, Bruno Antunes, Martha Cordero, Jorge Mario Martínez Piva, Nahuel Oddone, Ramón Padilla Pérez and Mario A. Ricardo. Consultants Claudia Beltrán, Claudia Monge and Alexander Rayo also participated.
ECLAC wishes to express its gratitude to the German Agency for International Cooperation for financial support provided for the implementation of the project.
The boundaries and names shown on the maps presented in this book do not imply official endorsement or acceptance by the United Nations.
Cover design: María Luisa Avaria
United Nations publicationISBN 978-92-1-121840-4eISBN 978-92-1-056529-5Sales No. E.14.II.G.9LC/G.2606-PCopyright © United Nations, 2014All rights reservedPrinted at United Nations, Santiago, Chile
Applications for the right to reproduce this work are welcomed and should be sent to the Secretary of the Publications Board, United Nations Headquarters, New York, N.Y. 10017, United States. Member States and the governmental institutions may reproduce this work without prior authorization, but are requested to mention the source and inform the United Nations of such reproduction.

Contents
List of acronyms ................................................................................................. 13
Foreword ............................................................................................................. 19
Introduction ........................................................................................................ 23
Chapter I The revival of industrial policy ........................................................................ 31
A. Introduction .................................................................................... 31B. What is industrial policy? ............................................................. 33
1. Passive horizontal policies ...................................................... 362. Active horizontal policies to address market failures ......... 363. Structural-change policies that strengthen existing
comparative advantages .......................................................... 374. Structural change policies that seek to create new
comparative advantages .......................................................... 38C. Why is an industrial policy necessary? ....................................... 42D. Successful experiences in industrial policy ................................ 45
1. Experiences in the eighteenth and nineteenth centuries .... 452. The East Asian countries ......................................................... 473. Industrial policy in the twenty-first century ........................ 52
E. Spaces for industrial policies in the international context ....... 571. Tariffs, para-tariffs, quotas and nontariff barriers ............... 572. Export subsidies ........................................................................ 573. Trade-related investment measures ....................................... 584. Intellectual property rights ..................................................... 58

4 ECLAC
F. Industrial policy tools .................................................................... 601. Attraction of FDI ....................................................................... 602. Policies to support MSMEs .................................................... 613. Science, technology and innovation policies ........................ 62
G. Conclusions ..................................................................................... 65
Bibliography ........................................................................................................ 66
Chapter II Methodology of the ECLAC-GIZ project for the design of value chain strengthening strategies .......................................................... 71
A. Introduction ..................................................................................... 71B. Value chains and their importance for public policy ................ 73
1. What are value chains? ............................................................ 732. Which are the key players in a value chain? ......................... 743. What types of value chain exist? ............................................. 754. Why is it important to study the governance
of a value chain? ....................................................................... 765. Why is the value chain approach relevant? ......................... 786. Strengthening of relations between the public
and private sectors ................................................................... 81C. Methodology for strengthening value chains ............................ 82D. Preparation of the diagnostic study for value
chain strengthening........................................................................ 841. Mapping of value chain participants ..................................... 852. Analysis of competitiveness, costs and margins .................. 873. Analysis of market and standards ......................................... 884. Analysis of governance and links .......................................... 895. Analysis of resources, productivity
and environmental sustainability .......................................... 916. Analysis and projection of economic
and employment benefits ........................................................ 92E. Analysis of best practices .............................................................. 93
1. The best practice research process ......................................... 942. Extrapolation ............................................................................. 963. Interpretation of the results ..................................................... 98
F. Design of strategies ........................................................................ 99G. Conclusions ................................................................................... 101
Bibliography ...................................................................................................... 102
Chapter III Stakeholder dialogues for building joint public-private development strategies ......................................................... 105
A. Introduction ................................................................................... 105

Strengthening value chains… 5
1. Guide for organizing and managing stakeholder dialogues ............................................................ 107
2. Using the guide ....................................................................... 1073. The importance of managing stakeholder dialogue .......... 1084. Participating in a stakeholder dialogue
and selecting actors ................................................................ 108B. Conceptual framework ................................................................ 109
1. Stakeholder dialogues ............................................................ 1092. Expectable outcomes .............................................................. 1093. Types of stakeholder dialogues ............................................ 1104. What stakeholder dialogue is for ..........................................111
C. Stakeholder dialogue phases ......................................................111D. Success and risk factors ............................................................... 115
1. Success factors ......................................................................... 1162. Risk factors .............................................................................. 118
E. Ideal profile of a stakeholder dialogue leader ......................... 121F. Organizing and managing stakeholder dialogue .................... 122
1. Phase 1: exploring and engaging ......................................... 1232. Phase 2: building and formalizing ....................................... 1293. Phase 3: implementing and evaluating ............................... 1354. Phase 4: developing further, replicating
or institutionalizing ................................................................ 138G. Capitalizing on and transferring best practices ....................... 140H. Conclusions and final recommendations .................................. 142
Useful links ........................................................................................................ 145
Bibliography ..................................................................................................... 146
Chapter IV The shrimp aquaculture chain in El Salvador .............................................. 147
A. Introduction ................................................................................... 147
Part I The shrimp aquaculture chain: characteristics, potential and constraints ................................................................................. 148
B. Diagnostic assessment of the shrimp aquaculture chain ......................................................................... 1481. General features of shrimp farming .................................... 1492. Trend and characteristics of shrimp farming
in El Salvador .......................................................................... 1523. Technical analysis of the production system ...................... 156
C. Identification of the chain’s participants and products .......... 1581. Equipment and input suppliers ........................................... 1582. Shrimp farmers ....................................................................... 1613. Processors ................................................................................. 162

6 ECLAC
4. Farmgate intermediaries ........................................................ 1645. Wholesalers ............................................................................. 1656. Retailers .................................................................................... 1657. Consumers ............................................................................... 1658. Support institutions ................................................................ 166
D. Analysis of costs, margins and competitiveness ..................... 167E. Analysis of markets and standards ........................................... 170
1. Estimation of national shrimp consumption ...................... 1702. Consumption habits ............................................................... 1723. Commercialization ................................................................ 1724. Quality and safety .................................................................. 1745. National quality system ......................................................... 1756. Analysis of governance .......................................................... 176
F. Analysis of resources, productivity and environmental sustainability .............................................. 1771. Health issues ........................................................................... 178
G. Current analysis and projection of economic and employment benefits ............................................................ 1801. Financing ................................................................................. 1812. Training in business development and aquaculture ......... 183
Part II An integrated approach to improving the shrimp aquaculture chain in El Salvador ......................................................................................... 184
H. Strategies for the shrimp aquaculture chain ............................. 184I. Recommendations for overcoming systemic constraints ....... 185
1. Consolidate interagency coordination ................................ 1852. Revitalize the Aquaculture Roundtable .............................. 1873. Restructure “La Tiendona”.................................................... 1874. Strengthen the domestic market and export capacity ....... 188
J. Recommendations for each link ................................................. 1891. Biosafety programme and the application of good
aquaculture practices ............................................................. 1892. Product handling and quality ............................................... 1903. Entrepreneurship among producers, processors
and marketers.......................................................................... 191K. Summary of constraints and good practices
or recommendations .................................................................... 191L. Five programmes for upgrading the shrimp
aquaculture chain ......................................................................... 1971. Programme 1: innovation, good practices
and eco-efficiency ................................................................... 1972. Programme 2: quality and safety in the chain .................... 2003. Programme 3: combat shrimp contraband ......................... 201

Strengthening value chains… 7
4. Programme 4: marketing and intermediation in the chain .............................................................................. 201
5. Programme 5: chain governance .......................................... 2036. Costs, timeframe and impact of the strategies ................... 204
M. Conclusions ................................................................................... 205
Bibliography ..................................................................................................... 206
Chapter V The synthetic fibre-sports apparel value chain in El Salvador .............................................................................. 209
A. Introduction .................................................................................. 209B. Diagnostic study ........................................................................... 210
1. Description of the value chain .............................................. 2102. Innovation ................................................................................ 2183. Education and training .......................................................... 2194. Energy ...................................................................................... 2215. Environmental sustainability ................................................ 2246. Distribution ............................................................................. 2267. Commercialization ................................................................. 2288. Governance and networks ................................................... 2329. Incorporation of SMEs ........................................................... 23310. Summary of constraints and opportunities ........................ 234
C. Strategies ....................................................................................... 2351. Innovation ................................................................................ 2352. Education and training .......................................................... 2383. Energy ...................................................................................... 2394. Environmental sustainability ................................................ 2405. Distribution ............................................................................. 2426. Commercialization ................................................................. 2447. Networks ................................................................................. 2468. Incorporation of SMEs ........................................................... 2479. Interventions ........................................................................... 248
D. Conclusions ................................................................................... 249
Bibliography ..................................................................................................... 250
Chapter VI Non-traditional export vegetable chain in Guatemala ............................... 253
A. Introduction .................................................................................. 253B. Identification of the value chain ................................................ 254
1. Description of the chain ......................................................... 2572. Inputs........................................................................................ 2623. Firms that participate in each link ....................................... 2644. Geographical distribution of the value chain ..................... 265

8 ECLAC
5. Job creation .............................................................................. 2666. Exports and market access .................................................... 268
C. Requirements and standards ...................................................... 272D. Costs and competitiveness .......................................................... 277E. Institutional structure .................................................................. 282F. Governance of the chain .............................................................. 285G. Financing ....................................................................................... 286H. Innovation ..................................................................................... 287I. Environmental protection ........................................................... 289J. Main constraints identified and
strategies recommended ............................................................. 290K. Conclusions ................................................................................... 298
Bibliography ..................................................................................................... 299
Chapter VII The wood-products value chain of the forestry concessions of Petén, Guatemala ......................................................................................... 301
A. Introduction .................................................................................. 301B. General features of the forestry situation
in Guatemala ................................................................................. 302C. The Guatemalan forestry industry ............................................ 306D. The Petén forestry-concessions model ...................................... 309E. Identification of the value-chain’s products, services
and participants ............................................................................ 3121. Description of the chain ......................................................... 3122. Chain participants .................................................................. 318
F. Costs, margins and competitiveness ......................................... 325G. Markets .......................................................................................... 328H. Governance ................................................................................... 329I. Environmental sustainability ..................................................... 329J. Constraints affecting the value chain ........................................ 330K. Strategies for improving the value chain .................................. 333
1. Programme 1: research, innovation and marketing of products from the Petén forestry concessions wood-products value chain .................................................. 333
2. Programme 2: technical-vocational training ....................... 3353. Programme 3: strengthening of the chain’s suppliers ....... 3364. Programme 4: production processes
and quality certifications ....................................................... 3375. Programme 5: strengthening of the community
forest service enterprise (FORESCOM) ............................... 3396. Programme 6: value-chain governance ............................... 340
L. Conclusions ................................................................................... 342Bibliography ..................................................................................................... 343

Strengthening value chains… 9
Chapter VIII Comparative analysis of value chain strengthening processes and final remarks ............................................................................................. 345
A. Value chains as a key element of inclusive industrial policy............................................................................ 345
B. Best practices and lessons learned ............................................. 348C. Main features of the advisory process
in El Salvador and Guatemala .................................................... 350D. Strategy commonalities ............................................................... 352E. Lines of research ........................................................................... 353
Bibliography ..................................................................................................... 354
ECLAC recent publications ............................................................................ 355
Tables
I.1 Types of industrial policy ...................................................................... 40I.2 Latin America (selected countries) and the Republic of Korea:
growth of output and labour productivity, 1965-2010 ...................... 44I.3 East Asian countries: industrial policy tools ....................................... 48I.4 East Asia (selected countries): growth of GDP
and per capita GDP, 1960-2012, and Human Development Index, 1980-2012 ............................................................. 48
I.5 East Asian countries: exports according to technological intensity, selected years .......................................................................... 49
I.6 East Asian countries and selected developed countries: R&D expenditure as a percentage of GDP, selected years ................ 50
I.7 United States: national manufacturing strengthening plan, 2009 ........................................................................ 53
I.8 Brazil: industrial policy instruments ................................................... 56I.9 Four areas of public policies to support MSMEs ............................... 62I.10 Instruments of public science, technology
and innovation policies .......................................................................... 64II.1 Types of value chain governance and their key characteristics ....... 77II.2 Key elements of a SWOT analysis ........................................................ 93II.3 Information that needs to be systemized
to extrapolate practices .......................................................................... 96II.4 Proposal of thematic areas for an analysis of best practices
in value chains ......................................................................................... 97III.1 Characteristics and forms of stakeholder dialogues........................ 110III.2 Verifying phase 1: exploring and engaging ...................................... 113III.3 Verifying phase 2: building and formalizing .................................... 114III.4 Verifying phase 3: implementing and evaluating ............................ 114III.5 Verifying phase 4: developing further, replicating
or institutionalizing .............................................................................. 115III.6 Success and risk factors........................................................................ 116

10 ECLAC
III. 7 Types of stakeholder dialogue actors ................................................. 125III.8 Interview outline ................................................................................... 126III.9 Checklist for assessing fact-finding results ....................................... 127III.10 Planning phase pointers ...................................................................... 132III.11 Self-assessment checklist ..................................................................... 133III.12 Must-haves ............................................................................................ 135III.13 Types of monitoring ............................................................................. 137III.14 Questions for systematization ............................................................ 140III.15 Questions for capitalization ............................................................... 141III.16 Factors to consider in stakeholder dialogue best practices ............ 141III.17 Intensity of the factors to consider in stakeholder
dialogue good practices ...................................................................... 142IV.1 Characteristics of microenterprise and small-business
aquaculture applicable to shrimp farming in El Salvador .............. 150IV.2 Central America: aquaculture production, subregional
and by country, 2000-2010 ................................................................... 151IV.3 El Salvador: fishery and aquaculture production, 2002-2012 ........ 154IV.4 El Salvador: geographical distribution of shrimp
farming operations ............................................................................... 154IV.5 El Salvador: technical characteristics of production systems ......... 156IV.6 Financial analysis of a semi-intensive shrimp farming
project, 2013 ........................................................................................... 168IV.7 El Salvador: estimation of per capita shrimp
consumption, 2002-2012 ...................................................................... 171IV.8 Summary of constraints and good practices in the shrimp
aquaculture chain ................................................................................. 192V.1 El Salvador: number of enterprises
by category, 2005 and 2011 .................................................................. 216V.2 United States: domestic market share of the main exporters
of synthetic-fibre sports apparel, 2005-2012 ..................................... 229V.3 El Salvador: yarn, fabric and garment exports,
by destination country, 2012 ............................................................... 230VI.1 Guatemala: harvested area and number of farms
devoted to each crop, 2002-2003 ........................................................ 255VI.2 Requirements of GLOBALG.A.P. on the fulfilment of good
agricultural practices and good manufacturing practices .............. 273VI.3 Guatemala: comparison of costs, income and profitability
of traditional and non-traditional products ...................................... 278VI.4 Constraints existing in the chain ........................................................ 291VII.1 Extent of forest cover by region, 1990-2010 ....................................... 302VII.2 Central America: forest areas, 1990-2010 ........................................... 303VII.3 Central America: wood production, commercialization
and consumption, 2010 ........................................................................ 303VII.4 Guatemala: forestry-sector firms listed in the National
Forestry Register ................................................................................... 306

Strengthening value chains… 11
VII.5 Guatemala: registered forestry-sector enterprises by department, 2013 ............................................................................. 307
VII.6 Guatemala: value of forestry-product exports, 2006-2012 .............. 308VII.7 Classification of forestry concessions in Petén, 2013 ...................... 311VII.8 Most representative species of Petén ................................................. 313VII.9 Products and services of the chain ..................................................... 317VII.10 Organizations affiliated to FORESCOM ............................................ 317VII.11 Estimated production costs ................................................................. 327VII.12 Estimated average sale price ............................................................... 327
Figures
I.1 Latin America, China and the Republic of Korea: per capita GDP relative to the United States, 1950-2010 ................... 43
II.1 Matrix of costs, times applied and relative impacts ........................ 101III.1 Assessment of fact-finding results ..................................................... 128IV.1 Central America: aquaculture production, subregional
and by country, 2000-2010 .................................................................. 151IV.2 El Salvador: trend of apparent shrimp
consumption, 2002-2012 ....................................................................... 171IV.3 Matrix of relative costs, implementation time and impact ............. 204V.1 El Salvador: employment in the textile and apparel
sectors, 2007-2012 .................................................................................. 216V.2 El Salvador: average monthly wages in the textile
and apparel sectors, 2007-2012 ............................................................ 217V.3 El Salvador: industrial electricity tariffs, 2007-2012 ......................... 221V.4 Central America: industrial electricity tariffs
as of 30 June 2012 .................................................................................. 222V.5 El Salvador: yarn, fabric and garment exports, 2005-2012.............. 228VI.1 Guatemala: harvested area by type of crop,
1980, 1990, 2000 and 2011 ..................................................................... 254VI.2 Guatemala: minimum daily agricultural wage in nominal
and real terms, 2005-2012 .................................................................... 267VI.3 United States: imports of non-traditional vegetables
produced by Guatemala, 1990-2012 ................................................... 269VI.4 Guatemala: number of retentions of non-traditional exports
vegetables in United States customs, 2002-2013 ............................... 276VI.5 Guatemala: maritime freight charges applicable by the
Central America Discussion Agreement (CADA) to exporters of peas, 2004-2012 ........................................................... 280
VI.6 Guatemala: unit price of export peas, 2002-2013 ............................. 281VI.7 Matrix of relative costs and effects .................................................... 298VII.1 Guatemala: forestry-industry exports
by destination country, 2012 ............................................................... 308VII.2 Matrix of effects, implementation periods and relative costs ........ 342

12 ECLAC
BoxesI.1 The development of the electronics industry
in the Republic of Korea ........................................................................ 51
DiagramsI.1 The scope of industrial policy ............................................................... 35II.1 Methodology for strengthening value chains ..................................... 82II.2 Diagnostic study of value chains .......................................................... 84II.3 Process of identifying needs for improvement
and best practice research ...................................................................... 95II.4 Strategy preparation process ................................................................. 99III.1 Dialogic change model ......................................................................... 112III.2 Phases of stakeholder dialogue .......................................................... 123III.3 Actor influence-interest grid ............................................................... 125III.4 Formula for boosting actor confidence .............................................. 139IV.1 El Salvador: weaknesses of the shrimp aquaculture chain ............ 157IV.2 El Salvador: the shrimp aquaculture value chain ............................ 158IV.3 Structured links in the shrimp value chain based
on “La Tiendona” .................................................................................. 176V.1 El Salvador: major links to the main production activities
in the synthetic fibre-sports apparel value chain ............................ 214V.2 Environmental aspects of the synthetic fibre-sports
apparel value chain .............................................................................. 225V.3 El Salvador: constraints and opportunities in the synthetic
fibre-sports apparel value chain ......................................................... 234V.4 Relevant factors for making decisions on interventions in
the synthetic fibre-sports apparel value chain .................................. 249VI.1 Guatemala: links of the non-traditional export
vegetable chain ...................................................................................... 257VI.2 Guatemala: length of growing seasons ............................................. 259VI.3 Guatemala: flow chart of processing in the third link
of the chain ............................................................................................. 261VII.1 Links of the Petén forestry concessions wood-products
value chain ............................................................................................ 314VII.2 Processing link ...................................................................................... 315VII.3 General scheme of the chain and its participants ............................ 318
MapsIV.1 El Salvador: map of shrimp farming projects ................................... 155V.1 El Salvador: geographical distribution of companies
in the main production activities of the synthetic fibre cluster, 2011 ................................................................................... 212
VI.1 Guatemala: non-traditional export vegetable cultivation zones ................................................................................... 256
VII.1 Maya Biosphere Reserve and forestry concessions in Petén .......... 312
List of acronyms
AACID Andalusian Agency for International Cooperation for Development
ABC Brazilian Cooperation AgencyACOFOP Petén Forestry Communities AssociationADEPESCA Association for the Development of Fisheries and
Aquaculture (El Salvador)AECID Spanish Agency for International Development CooperationAGEXPORT Guatemalan Exporters’ AssociationAGREQUIMA Agricultural Chemical Association of GuatemalaANDAH National Aquaculture Association of HondurasAPHIS Animal and Plant Health Inspection Service of
the United StatesARP Petén Reforestation AssociationASI Salvadoran Industry AssociationASTM American Society for Testing and Materials ATC Agreement on Textiles and ClothingBANDESAL El Salvador Development BankBCR Central Reserve Bank (El Salvador)BFA El Salvador Agricultural Development BankBNDES Brazilian National Economic and Social Development Bank BRC British Retail Consortium BRICS Brazil, Russia, India, China and South AfricaCADA Central America Discussion Agreement

14 ECLAC
CAMTEX Chamber of the Textile, Clothing and Free Zones of El Salvador
CATIE Tropical Agricultural Research and Higher Education Centre
CBP United States Customs and Border ProtectionCEDPA Centre for Development and Population ActivitiesCENDEPESCA Directorate General of Fisheries and Aquaculture
of El Salvador CIAD Food and Development Research Centre (Mexico)CIBNOR Northwestern Centre of Biological Research (Mexico)CIEX Import-export processing center (CIEX) (El Salvador)CIF Cost, insurance and freightCIFACIL Intra-Association Commission for Trade Facilitation
(El Salvador)CIM Metrology Research Centre of El SalvadorCIMMYT International Maize and Wheat Improvement CentreCITES Convention on International Trade in Endangered Species
of Wild Fauna and Flora CLI Collective Leadership Institute COMTRADE United Nations Commodity Trade Statistics DatabaseCNC National Quality Council of El SalvadorCNE National Energy Council (El Salvador)CONADEA National Agricultural Development Council (Guatemala)CONAMYPE National Microenterprise and Small Business
Commission of El Salvador CONAP National Council for Protected Areas of GuatemalaCONPRODA Agricultural Production Council of GuatemalaCOPESCAALC Commission for Inland Fisheries of Latin America
and the Caribbean DACE Foreign Trade Administration DANIDA Danish International Development AgencyDIGEGR Department of Geographic, Strategic and Risk
Management Information DIGESTYC Department of Statistics and Censuses (El Salvador) DIPLAN Department of Education Planning of GuatemalaDIPRONA Nature Protection Division of GuatemalaDRAM Dynamic Random Access MemoryDR-CAFTA The Dominican Republic –Central America– United States
Free Trade Agreement ECA Costa Rican Accreditation Entity

Strengthening value chains… 15
ECLAC Economic Commission for Latin America and the CaribbeanEMA Mexican Accreditation EntityENCA Central National School of Agriculture (Guatemala)EPA Environmental Protection Agency of the United States FAMPE Brazilian Microenterprise and Small Business
Guarantee Fund FAO Food and Agriculture Organization of the United Nations FDI Foreign direct investmentFEPADE El Salvador Business Fund for Education DevelopmentFINEP National Studies and Project Finance Agency of BrazilFONDEPRO El Salvador Productive Development FundFSC Forest Stewardship CouncilFSG Salvadoran Guarantees Fund FUNDE Salvadoran National Development Foundation FUNDEMAS Salvadoran Business Foundation for Social Action FUSADES Salvadoran Economic and Social Development FoundationGATT General Agreement on Tariffs and Trade GDP Gross domestic productGIZ German Agency for International CooperationGREMIAGRO Association of Agricultural Input Manufacturers
of GuatemalaGSP Generalized System of PreferencesHACCP Hazard Analysis and Critical Control PointsHDI Human Development Index ICCO Interchurch Organisation for Development Cooperation,
The NetherlandsICDF International Cooperation Development Fund (ICDF)ICT Information and communications technologyICTA Agricultural Science and Technology Institute
of GuatemalaIDB Inter-American Development BankIFAD International Fund for Agricultural DevelopmentIICA Inter-American Institute for Cooperation on AgricultureINAB National Forests Institute (Guatemala)INE National Institute of Statistics (Guatemala)INFOPESCA Centre for Marketing Information and Advisory Services
for Fishery Products in Latin America and the Caribbean INSAFORP Salvadoran Training Institute INTECAP Technical Institute for Training and Productivity
(Guatemala)

16 ECLAC
ISO International Organization for Standardization ISSS Salvadoran Social Security Institute JICA Japan International Cooperation AgencyKfW German Development Bank MEP Manufacturing Extension PartnershipMERCOSUR Southern Common Market MT Metric tonsNAFTA North American Free Trade AgreementNGO Non-governmental organizationNOM Mexican Official StandardsOAS Organization of American StatesOCAI Observatory of Customs Control for United States importsOECD Organization for Economic Cooperation and DevelopmentOIE World Organisation for Animal HealthOIRSA International Regional Organization for Plant
and Animal HealthOSA Salvadoran Accreditation Agency OSARTEC Salvadoran Technical Regulation AgencyOSN Salvadoran Standardization Agency OSPESCA Fisheries and Aquaculture Sector Organization of
the Central American IsthmusOTT Office of Technology Transfer PAF The Family Farming and Rural Entrepreneurship Plan
for El Salvador’s Food and Nutritional Security PINFOR National Forestry Incentives ProgrammePINPEP Forestry Incentives Programme for Owners of Small Land
Areas Suitable for Forestry or AgroforestryPIPAA Integrated Agricultural and Environmental Protection
Programme (Guatemala)POY Partially oriented yarnPROESA Export and Investment Promotion Agency of El SalvadorPROGER Employment and Income Creation ProgrammePRONACOM National Competitiveness Programme (Guatemala) R&D Research and developmentRBM Maya Biosphere ReserveSEBRAE Brazilian Micro and Small Business Support ServiceSELA Latin American and Caribbean Economic SystemSENASA Agricultural Health Service of HondurasSENASICA National Agri-food Health, Safety and Quality Service SICA Central American Integration System

Strengthening value chains… 17
SIECA Central American Economic Integration Secretariat SIEPAC Electricity Interconnection System for the Countries
of Central AmericaSIFGUA Guatemalan Forestry Information SystemSIGET General Superintendence of Electricity
and Telecommunications SMEs Small and medium-sized enterprisesSNIIM National Markets Information and Integration System TEU Twenty-foot equivalent unitTPP Trans-Pacific Partnership TRIMs Agreement on Trade-Related Investment MeasuresTRIPS Trade-Related Aspects of Intellectual Property RightsUNAM National Autonomous University of MexicoUNESCO United Nations Educational, Scientific
and Cultural OrganizationUNIDO United Nations Industrial Development OrganizationUNU United Nations UniversityUSAID United States Agency for International Development USDA United States Department of AgricultureUSPTO United States Patent and Trademark Office WCO World Customs OrganizationWRAP Worldwide Responsible Accredited Production WSSV White Spot Syndrome Virus WTO World Trade Organization


Foreword
In 2012, ECLAC proposed to the governments of the region a new integrated approach to development, which identified equality as the objective, structural change as the way forward and public policy as the instrument. Structural change entails reallocating the economy’s resources towards activities or sectors that provide greater value added or are more technology- or knowledge-intensive.
In this approach, the State has a central role to play in coordinating policies in various fields and, in particular, macroeconomic, industrial, social and environmental policies. ECLAC has also stated its conviction that social issues depend on variables that are not confined to the social sphere. Structural heterogeneity and the persistent differences in productivity levels (between and within sectors and enterprises) form a rigid core from which inequality permeates throughout society, exacerbating gaps in capabilities and opportunities.
Industrial policy needs a State that promotes capacity-building and competitiveness in existing sectors with a clear potential for specialization and incorporation of technological progress and fosters diversification of the production structure by creating or consolidating new high-productivity and more environmentally efficient sectors. Boosting the productivity of micro-, small and medium-sized enterprises is a key element in this regard (ECLAC, 2012).
In recent years, ECLAC has received official requests from governments in the region for technical assistance for designing and implementing industrial policies. In response, the Commission has

20 ECLAC
developed and applied a methodology based on value chains, which has enabled it to identify targeted intervention strategies, with clear, coordinated lines of action.
Value chains can be strengthened by supporting all their stakeholders, especially small producers, which in turn helps to close structural gaps. In 2013, ECLAC worked jointly with governments and the private sector in Central America to study and design strategies for four value chains: shrimp farming and synthetic fibres sportswear in El Salvador and vegetables and fine woods in Guatemala. Small producers play a central role in these chains, which include cooperatives formed by ex-combatants of civil wars, small farmers’ cooperatives and cooperatives that operate sustainable forest concessions.
This book sums up the technical assistance work conducted in these two countries and systematizes the methodology used to disseminate it and facilitate its replication. Within a relatively short space of time (eight months on average), the technical assistance provided by ECLAC led to the launch of specific public initiatives for strengthening value chains, with the support of government officials at the highest level.
There are two distinctive elements to the Commission’s work, as set out here. First, it is based on a participatory methodology. At all phases of the process, work is conducted jointly by local government officials, ECLAC and, sometimes, business organizations. The assessments, search for best practices and preparation of strategies are continuously enriched by local experts from the public and private sectors. The main outcomes, at both the analytical and the proposal phases, are validated and fine-tuned in discussion forums or stakeholder dialogues, i.e. meetings between representatives of the links in the chain and public and private support organizations. The result is a set of strategies that represent the consensus reached by the main stakeholders and which, consequently, receive their support when it comes to implementation.
Secondly and closely linked to the above, the ECLAC methodology also advances local capacity-building. The thorough involvement of public officials, together with the organization of training workshops, facilitates knowledge transfer and absorption, so that governments can replicate the exercise for other value chains without further technical assistance from ECLAC.
Industrial policymaking is gaining ground increasingly across the region. The participatory methodology for forging stronger value chains is yielding rapid and effective results, enabling the design of targeted, integrated strategies by which to systematize and prioritize public-private

Strengthening value chains… 21
actions geared towards structural change. The work of ECLAC with the countries in the region in this area is ongoing and it is hoped that it will make a significant contribution to more sustainable development with equality.
Alicia Bárcena Executive Secretary
Economic Commission for Latin America and the Caribbean (ECLAC)


IntroductionRamón Padilla Pérez
Over the last two decades, Central America radically retargeted its economic growth strategy with a view to boosting export growth, attracting foreign investment and reducing the State’s role in the economy. The model applied helped to reduce inflation, attract investment from multinational enterprises, encourage the expansion of regional conglomerates, diversify the export basket and support a higher level of social spending. Nonetheless, it also led to inadequate and volatile output growth, a low level of domestic investment, widening external deficits and vulnerability to food-price, energy and liquidity shocks. In the social domain, it fuelled an increase in precarious employment, immigration, informality and high and persistent levels of poverty and inequality, with limited capacity to withstand and recover from natural disasters. All of this has served as a drag on the production transformation process in the subregion in these years.
In this scenario, and amid increasing international recognition of the need for a more active State in the wake of the global financial crisis of 2008-2009, the Central American countries have recently taken steps to design and implement a new industrial policy.
El Salvador and Guatemala provide two representative examples of this new approach in Central America. In 2011, El Salvador’s public and private sectors designed an industrial policy plan for the period 2011-2024, which aimed to promote competitive restructuring in the manufacturing sector. This involved close integration with the other sectors of the economy and the incorporation of a major technological innovation component, while also stimulating stronger productive linkages with

24 ECLAC
small and medium-sized enterprises (SMEs) and fostering the creation of quality jobs (Ministry of Economy, El Salvador, 2011). In Guatemala, the country’s renewed 2012-2021 National Competitiveness Agenda sets objectives that include actions to increase national value-added; promote investment, research and development; and establish strategic partnerships in the public and private sectors, academia and civil society, with a view to boosting competitiveness (PRONACOM, 2012).
The Economic Commission for Latin America and the Caribbean (ECLAC) has received various official requests from governments in the subregion to provide technical assistance in designing and implementing their industrial or productive development policies. The initial aim of this volume is to disseminate ECLAC’s experience in providing technical support to those governments for value-chain strengthening in 2013. A second objective is to systemize the methodology developed by ECLAC to identify the constraints facing the value chains analysed, and to design public policies and participatory strategies to increase their competitiveness, based on greater innovation, increased national value added, and the creation of quality jobs, while at the same time ensuring sustainability. The technical assistance provided to these two countries was implemented through the project “Integration of agribusiness SMEs into global value chains in Central America”, which received funding from the German International Cooperation Agency (GIZ).
ECLAC visualizes economic and social development as requiring major structural changes in the region’s countries, to change the composition of production and employment and alter the pattern of international integration. This structural change, conceived as the transition towards activities and sectors that are more dynamic and more intensive in technological knowledge, requires a new integrated set of public policies with a focus on equality. The fact that market forces alone tend to entrench prevailing structures makes industrial policy a key element both of this new approach and of the renewed equation between State, private sector and society being proposed by ECLAC (ECLAC, 2012).
The value chain strengthening methodology is a very useful tool for the design and implementation of a focused industrial policy to promote structural change. Moreover, the strengthening of value chains makes it possible to reduce Central America’s characteristic structural heterogeneity, which can be seen in the wide productivity and profitability gaps that exist between micro-, small and medium-sized enterprises (MSMEs) as compared to large firms, between those serving the national market and export enterprises, and in the differences among production sectors.

Strengthening value chains… 25
At the microeconomic level, value chain strengthening can generate diverse benefits, such as productivity gains stemming from greater innovation in processes and products; employment growth and a larger number of high-quality jobs; the consolidation of forward and backward productive linkages; the inclusion of micro- and small enterprises producing goods and services in value chains; and a strengthening of export capacity among local businesses and their resulting integration into global value chains.
The approach adopted by ECLAC in providing technical support to Central American countries has three distinct elements. Firstly, the constraints or bottlenecks that hinder greater development of the value chain are identified, and participatory strategies based on international best practices are designed to overcome them. This is a targeted and focused exercise that produces rapid results, in terms of public policy design and the formation of public and private commitments (the average time needed to complete the process for a chain has typically been eight months).
The value chain encompasses the entire range of activities needed to take a product or service from the design stage, through the various phases of production, to its delivery to consumers and final disposal after use (Kaplinsky and Morris, 2002). Each phase —design, production of the good or service, transport of the merchandise, consumption and disposal— is generally referred to as a link. The constraints are analysed for each link and also for the value chain as a whole to identify those which have a systemic effect.
Secondly, the approach promotes transparency and participatory decision-making. A key element of the methodology is the organization of dialogue mechanisms, or roundtables, to validate the stages of the process. These bring together the key participants in the value chain, to obtain feedback on the diagnostic study and strategies, forge consensus on its current condition and the bottlenecks it faces, and generate a collective commitment to strengthen it.
Thirdly, knowledge is transferred and capacities are created among civil servants for the purpose of replicating the process. All stages of the process are applied in conjunction with local government officials, which enhances it and allows the methodology to be transferred for replication in other value chains without ECLAC support.
Chapter I of this volume provides a more detailed discussion of the revival of industrial policy in recent years. Its authors, ECLAC staff members Ramón Padilla Pérez and Jennifer Alvarado, start by considering the concept of industrial policy and the tools available to

26 ECLAC
it. They propose four approaches that frame the design of this policy: (i) passive horizontal policies; (ii) active horizontal policies that seek to correct market failures; (iii) structural change policies that strengthen existing comparative advantages; and (iv) structural change policies that create new comparative advantages. Each of these approaches is closely associated with specific schools of economic thought (neoclassical, evolutionist, structuralist and neo-Schumpeterian). The authors describe successful national experiences, both past and present, which show that industrial policy was used by today’s developed countries in their industrialization processes, and that the governments of both developed and developing countries are currently investing heavily in production restructuring. A section is devoted to analysing the spaces that remain open for industrial policy after the signing of bilateral and multilateral agreements on trade, foreign direct investment and intellectual property. The first chapter thus examines the context in which public policies to strengthen value chains operate.
The methodology developed by ECLAC for strengthening value chains in El Salvador and Guatemala is described in chapter II, drawing on lessons learned in the technical assistance provided earlier by ECLAC to the Governments of Argentina and Uruguay. The characteristics of the processes implemented in the two Central American countries required further development of the methodology, its enhancement with value chain methodologies of GIZ (value links) and of the United Nations Industrial Development Organization (UNIDO), and its adaptation to the specific conditions prevailing the subregion. The authors of this chapter, Nahuel Oddone, Ramón Padilla Pérez and Bruno Antunes, the ECLAC staff members who led and participated actively in the technical assistance processes in the subregion, discuss the importance and usefulness of the value chain approach for policymaking, and they provide a detailed description of the six main steps in this methodology: identification of meta-objectives, chain selection, preparation of the diagnostic study, analysis of international best practices, design of strategies and launch.
Chapter III systemizes the methodology further and sets forth guidelines for organizing the dialogue spaces. Its author, ECLAC consultant Alexander Rayo, offers a conceptual framework and practical information on how to organize and manage dialogues for constructing and strengthening public and private development strategies. These forums create favourable conditions for engaging stakeholders, whose structured and guided participation in a process with defined objectives and deadlines clearly contributes to the formulation of public policies and joint public-private sector strategies. This chapter describes the conceptual elements that frame the dialogue spaces and addresses the following issues in particular: how to select the stakeholders; the types of dialogue

Strengthening value chains… 27
forums that exist and what can be expected from them; factors of success and risk; the phases of organization and management of the dialogue mechanism; and the practical tools available at each stage of the process.
The experience of the cases developed in El Salvador is summarized in the two following chapters. Nahuel Oddone and Claudia Beltrán, ECLAC officer and consultant, respectively, present a diagnostic and discuss international best practices and strategies for upgrading a primary sector chain, namely shrimp farming. The specific feature of this chain stems from the fact that it is concentrated in the coastal-marine zone of this country and consists mainly of cooperatives formed by former combatants in the country’s armed conflict in the 1980s. The diagnostic study identifies a number of constraints characteristic of the chain, both systemic and those affecting individual stakeholders. These include a lack of quality and safety in the management of production, scant access to financing, reliance on external suppliers, unfair competition in the form of contraband, and weaknesses in generating a successful export supply. The strategies proposed by the authors focus on the creation of a biosafety programme that addresses quality and safety standards; the design of technologies to improve access to market information; and the creation of an aquaculture innovation centre to provide support to chain participants. As is the case in the three other empirical chapters, this one includes a full listing of programmes, strategies and lines of action, with the aim of demonstrating the usefulness of the methodology for designing systemic and targeted interventions.
In chapter V, Bruno Antunes and Claudia Monge, ECLAC staff member and consultant, respectively, describe the experience of the synthetic fibres sportswear chain in El Salvador. The textile and garment sectors between them account for about 25% of the country’s industrial value added and over half of its paid employment; and both are strongly oriented towards the external market and are located mainly in the metropolitan area of San Salvador. The principal bottlenecks jointly faced by the three links in the chain (fibre, fabric and garment making) are the high cost of energy, lack of skilled staff and insufficient functional innovation (the physical characteristics of the garments) to compete on international markets. The key strategies proposed by the authors to strengthen the chain involve creating a textile innovation and technological development centre, generating a supply of specialized technical workers, and diversifying the energy matrix.
Chapters VI and VII summarize the experience of the cases studied in Guatemala. In chapter VI, ECLAC staff member Martha Cordero describes the value chain of non-traditional export vegetables (peas, broccoli, courgette (calabacín), green beans (ejote), baby carrot and baby

28 ECLAC
corn (elotín)). The chain is confined to the departments of the country’s central altiplano, and its main link, the actual cultivation, is sustained by small-scale farmers. The chain is almost entirely oriented towards the international gastronomy market, which has very strict quality requirements. The key constraints are the chain’s heavy reliance on foreign inputs, including laboratory services and audits to certify product quality; the weak organization of each link in the chain and between them; and the lack of legal certainty as to land tenure, which discourages medium- and long-term investment in items such as irrigation systems. The strategies proposed aim to promote the production of national inputs that would help reduce the costs of the chain, strengthen associativeness within each link and between them, and promote extension and maintenance of the irrigation system.
In chapter VII, ECLAC staff member Mario A. Ricardo discusses the value chain involving timber products obtained from the forestry concessions of the Department of Petén in Guatemala. This chain encompasses 11 forestry concessions, nine of which are community-owned and two are private, located within the Maya Biosphere Reserve. The diagnostic study identifies various constraints including poor articulation between the chain and the rest of the country’s forestry sector, its lack of competitiveness owing to costs, technological obsolescence, and the low skills level of the workforce, compounded by the generation of huge volumes of production with little value added. Different strategies are proposed to address these problems, aimed basically at raising the productivity of the value chain, diversifying production, and increasing its value added, while strengthening its articulation with the rest of the national forestry industry.
Chapters IV, VI and VII analyse and develop industrial policy proposals for the primary sector, thereby highlighting these policies’ current broad scope. This is a new production development policy which, as is clearly shown in the strategies for the manufacturing sector studied (chapter V), is geared towards enhancing value added in key production links and increasing productivity.
Lastly, in chapter VIII, ECLAC staff members Jorge Mario Martínez Piva, Nahuel Oddone and Ramón Padilla Pérez offer a comparative analysis of the four value chain strengthening processes and offer final remarks. While the ECLAC methodology defines the key steps for formulating public policies and creating joint public-private sector strategies, it needs to be adapted to the characteristics and needs of each country and chain. While ECLAC offers technical assistance to national governments, each government generally adjusts the process in line with the available human and financial resources, the relations that exist with the private sector, the

Strengthening value chains… 29
need to fulfil certain political timeframes, or the desire to complement other public-policy design and implementation processes.
From a conceptual standpoint, comparing value chains horizontally yields useful lessons for policymaking, relating, for example, to the role played by intermediaries in each chain and how this can be regulated; the influence of the chain’s specific characteristics on the possibilities for participation by microenterprises and small businesses producing goods and services; and how chain governance restricts or opens up terrains for public-policy formulation aimed at increasing national value added.


Chapter I
The revival of industrial policyRamón Padilla Pérez
Jennifer Alvarado1
A. Introduction
The revival of industrial policies in Latin America in recent years has ocourred amid a growing consensus on their importance for long-term and inclusive economic development. The 2008-2009 international financial crisis put the role of an active State back on the map, by showing that market forces alone do not lead to sustainable economic growth with social development and equality (ECLAC, 2010).
After more than two decades of wide-ranging structural reforms, long-term economic growth rates in the region’s countries remain modest, with few exceptions; and total factor productivity, which is closely related to technological progress and innovation, makes a very small contribution (Maloney and Perry, 2005). Similarly, the persistence in most Latin American countries of export models based on natural resources, or on the availability of cheap labour, has fuelled debate over how industrial policy can unleash processes to make comparative advantages more dynamic in sectors where innovation plays a leading role (Hausmann and Klinger, 2007).
1 The authors wish to thank Jorge Mario Martínez Piva for valuable comments made on a preliminary version of this chapter.

32 ECLAC
The new industrial policy is unfolding in a different international and national scenario than what prevailed in the 1960s and 1970s. The current context is characterized by the predominance of trade liberalization strategies, large foreign investment flows and the proliferation of bilateral and multilateral trade agreements that restrict the public-policy tools available to promote productive development.
Industrial policy is a key element of the structural change that the Economic Commission for Latin America and the Caribbean (ECLAC) has proposed to the countries of the region in recent years. The document Structural Change for Equality: An integrated Approach to Development, published by ECLAC for its thirty-fourth session in 2012, stressed the need to move towards structural change that articulates development through the implementation of a new integrated set of public policies targeting equality, in which industrial policy plays a key role (ECLAC, 2012).
Over the last few years ECLAC has provided technical support to several of the region’s countries in designing participatory strategies to strengthen value chains. These strategies are a very useful tool for implementing industrial policies, since they make it possible to identify specific and targeted intervention actions. Chapter II of this volume describes the ECLAC methodology for strengthening value chains, while chapters IV to VII summarize support processes in El Salvador and Guatemala.
The aim of this chapter is to discuss the ECLAC view of the scope and instruments of a new industrial policy designed for the twenty-first century, which frames the value chain strengthening strategy.
While industrial or production development policy has been a permanent feature in ECLAC thinking, it has constantly adapted to the different political and economic contexts through which Latin American and Caribbean countries have passed in the last six decades, in line with the trends and global evolution of economic and development thought.2
This chapter is organized in seven sections, including this introduction. Section B analyses the concept of industrial policy, along with its scope and the tools available to it. Section C discusses the need for industrial policy for long-term economic and social development; and section D presents a historical account of national economic development experiences, based to considerable degree on industrial development policies. Section E reviews the spaces that remain available for this type of policy in the context of multilateral and bilateral trade agreements; and section F describes three examples of industrial policy instruments that
2 For a description of ECLAC thinking on productive development, see, for example, Bielchowsky, Izam and Mulder (2011) and Cordera (2009).

Strengthening value chains… 33
pursue an integrated and systemic approach, consistent with the ECLAC vision, before ending with conclusions in section G.
B. What is industrial policy?
The concept of industrial policy has evolved, as its objective and scope have responded to the prevailing economic, social and political context. In general, industrial policy involves government intervention in industry to organize and modify the production structure and productive arrangements. This volume adopts a more specific definition by visualizing industrial policy as a dynamic process in which the government applies a number of instruments to promote and strengthen specific activities or economic agents, in accordance with national development priorities.3 According to this view, the earliest signs of industrial policy since the emergence of the nation state date back to Great Britain in the eighteenth century and to Germany, the United States and Japan in the nineteenth and early twentieth centuries (Peres and Primi, 2009).
Industrial policy is not confined to measures targeting the secondary sector of the economy, but also encompasses those aimed at the development of services and primary activities. For this reason, it is also often known as production development policy. Its impact depends on the public policy makers’ design, application and evaluation capacity, and the scope of the instruments used to attain the proposed objective (Peres and Primi, 2009).
The concept embraces a wide array of policies, ranging from those supporting infant industries, to trade policies and those that create the legal and economic environment in which firms operate. The various instruments can be grouped in the following six categories:4
(i) Science, technology and innovation policies. The objective of these policies is to increase national capacities to use, absorb, modify and generate scientific and technological knowledge, and to stimulate innovation activities in the organizations that make up innovation systems. Examples of public instruments to support these policies include: contestable funds, tax breaks,
3 See Chang (2003), Peres and Primi (2009) and Bianchi and Labory (2011) for complementary definitions of industrial policy.
4 The economic literature classifies the instruments or areas of industrial policy in various ways. For example, Lall (1993) proposes a classification centred on the factors that are decisive for industrial and technological development and the market failures being faced. According to this classification, there are six determinants of industrial and technological development which, in turn, give rise to six types of policies to correct the market failures that could arise: incentives, skills, information and technical support, financing and technological policies.

34 ECLAC
subsidized loans, postgraduate scholarships, incentives for collaboration between universities and research centres, and support for high-technology incubators (Padilla Pérez, Gaudin and Rodríguez, 2013).
(ii) Education and training policies. These involve active public initiatives to raise the general quality of the education system and promote technical training to build high-level skills, with the aim of forming qualified human resources that boost economic growth (Cimoli, Dosi and Stiglitz, 2009).
(iii) Trade policies. These policies are decisive for establishing the level of international competition and international-market access faced by domestic firms. Instruments include multilateral and bilateral free trade agreements, the liberalization of foreign direct investment (FDI) inflows, and export promotion schemes (free zones and maquila, among others). As described in greater detail below, international agreements set rules governing the use of export subsidies, the treatment of FDI and agreements on intellectual property protection. The historical experience of Latin American countries, in contrast to that of the so-called “Asian tigers”, shows that protectionist policies are not effective for developing a national industry, unless combined with export-promotion policies and the strengthening of technological capacities.
(iv) Policies to promote selected industries. This group includes policies with specific intervention goals in strategic sectors, industries or firms. The most widely used instruments are: concessional loans, tax incentives, government subsidies to selected sectors, and public procurement. They also include instruments to promote productive articulation in industrial clusters. This type of policy highlights one element of industrial policy: the selection of sectors.
(v) Competitiveness policies. These aim to foster a business-friendly environment by creating economic signals and incentives that promote greater competitiveness among market participants. A wide variety of instruments are used in these policies: tax and financial incentives, the development of efficient regulations, a competitive real exchange rate, and regulatory adjustment (Peres, 2006).
(vi) Competition policies. These consist of antitrust and competition policies, along with laws that aim to underpin the proper functioning of the market and thus ensure efficient resource allocation (ECLAC, 2012). The underlying instrument in this

Strengthening value chains… 35
type of policy is the law, which may be either generic or organic.5 Policies in this category include antitrust and free competition laws applicable to public services, usury and investment. They cover all instruments that affect the functioning and structure of markets and competition, including a number of trade-policy tools such as anti-dumping practices, countervailing measures and safeguards (Hernández and Schatan, 2002).
On the theoretical and conceptual level, the role and scope of industrial policy in the national development agenda depends on the school of economic thought to which it owes allegiance. The neoclassical (orthodox) school argues that industrial policy is unnecessary (or “not necessary”), because the free market automatically allocates resources optimally, so state intervention is only justified to correct market failures. In contrast, the various strands of the heterodox school agree on the need for state intervention to define the path of industrial development, based on a recognition that the different productive activities have differentiated effects on economic development. Industrial policies can be placed in the following four categories: passive horizontal policies, active horizontal policies, policies for structural change without challenging comparative advantages, and policies that seek to generate new comparative advantages (see diagram I.1).
Diagram I.1 The scope of industrial policy
Structural-change policies that seek to create new comparative advantages
Structural-change policies to strengthen existing comparative advantages
Active horizontal policies focused on correcting market failures
Passive horizontal policies: No industrial policy
Source: Prepared by the authors.
5 Organic laws include the Constitution; whereas generic laws include commercial codes or laws that govern the functioning of private companies and the behaviour of shareholders; the Civil Code; laws on fair competition; and consumer protection laws (Hernández and Schatan, 2002, p.19).

36 ECLAC
1. Passive horizontal policies
The neoclassical school argues that the market automatically allocates resources efficiently; for this reason, passive horizontal policies are instruments that theoretically do not discriminate between sectors or generate market distortions.
From this point of view, what is needed are policies that enhance competitiveness, such as a stable macroeconomy, guarantees on contract performance, facilities to start up new businesses, protection for investments and infrastructure building (such as roads, electricity and water, among other items).6 Trade policies and FDI attraction policies, which are horizontal or passive by nature, are also included in this category, since they involve actions of generalized unilateral liberalization, and the signing of bilateral or multilateral agreements that do not discriminate or protect specific sectors. This approach can also be seen in measures to attract FDI by opening up to foreign capital, based on the belief that the country’s comparative advantages or macroeconomic conditions are sufficient to secure direct investment, without the need for intervention during the setup process or in relation to the local-development impact of its future operations (ECLAC, 2007).
2. Active horizontal policies to address market failures
Under the neoclassical economic paradigm, market failures occur when the market is unable to allocate resources optimally, in which case government intervention is justified. There are various types of market failure, such as imperfect information, externalities, imperfect competition and public goods (Buigues and Sekkat, 2009; Kosacoff and Ramos, 1999). Imperfect information reflects the existence of incomplete information or uncertainty. Externalities relate to the benefit (positive externality) or cost (negative externality) of an economic activity that affects parties that are not direct participants in the respective economic process. Imperfect competition creates situations (including economies of scale) that obstruct the entry of potential new producers, to the detriment of consumers. Public goods correspond to economic activities that a private agent has no incentive to undertake, since the benefits are broadly distributed throughout society and cannot be adequately captured by the agent that bears the cost of their production.
Public support for research and development (R&D) is justified in this approach by the existence of externalities and the public-good nature of knowledge. The instruments used include subsidies for private R&D activities, the promotion of joint R&D projects (making it possible to
6 This is the approach adopted in the World Bank’s annual Doing Business report (further information in: espanol.doingbusiness.org/).

Strengthening value chains… 37
internalize externalities), subsidies for the formation of specialized human resources, and intellectual property protection (Kosacoff and Ramos, 1999).
Another group of instruments involves support for the organization of activities and the implementation of mechanisms to correct problems of imperfect information, such as: trade fairs and meetings to bring together potential suppliers and purchasers (supply and demand); business directories containing information on products and services supplied and demanded; and seminars and conferences on issues of general interest for the productive sector in question (quality, certification and market access, among others).
Policies to help small and medium-sized enterprises (SMEs) gain access to credit are also justified owing to the presence of information asymmetries and divergences between the social and private cost of the funds that tend to characterize financial markets. One of the most widely used instruments in this regard are public guarantee programmes. Competition policies are also included in this second area.
3. Structural-change policies that strengthen existing comparative advantages
Structural change is defined as the move towards higher-productivity activities and sectors that are more intensive in technological knowledge (ECLAC, 2012). Of the two approaches based on structural change, this one considers that the transformation needs to target productive activities that are more closely related to comparative advantages that stem from the existing structure of factor endowments (Lin, 2012). Unlike horizontal approaches, this one recognizes the need for the government to play an active role in the economy to promote economic and social development.
Consequently, industrial policy needs to promote a production development strategy that makes the most of existing comparative advantages. To that end, government actions can focus on the following four areas: (i) providing information on new industries, consistent with the comparative advantages, which, in turn, are determined by changes in the factor endowment structure; (ii) coordinating investments in related industries and improving infrastructure; (iii) subsidizing activities that generate externalities in the upgrading and structural-change process;7 and (iv) promoting the development of new industries through business incubation or the attraction of FDI (Lin, 2012).
7 In this volume, “upgrading” is defined as the process whereby a country, sector or firm shifts towards activities that are more intensive in technological knowledge. Humphrey and Schmitz (2002) identify four types of upgrading: product, process, functional and inter-sectoral.

38 ECLAC
4. Structural change policies that seek to create new comparative advantages
This fourth approach recognizes that the existing comparative advantages form the basis for a structural-change strategy, but they need to be challenged to achieve an upgrading process. The approach is characterized by its pragmatism and the fact that it attaches significant importance to empirical evidence. There are abundant examples of countries that fail to move along on the development path because they have specialized in industries or activities that reflect a composition of productive factors such as cheap labour and natural resources. In contrast, and as illustrated by the Nokia corporation in Finland and the electronics industry in the Republic of Korea, development sometimes requires making long-term “bets” and investments to create new industries (Chang, 2012).
This approach stresses the need to look beyond market failures, recognizing that the government has an important role to play in creating and strengthening productive sectors and capacities, challenging what market signals suggest or promote. For this reason, governments are expected to make a special effort to participate in the new technological paradigms, such as biotechnology and information and communication technologies (ECLAC, 2008).
While this integrated approach puts industrial policy at the centre, it needs to be complemented by other types of policies (macroeconomic, social and labour market), to bring about the structural change needed to set off a virtuous process of development and social cohesion (ECLAC, 2012). The industrial policy tools used in this approach combine and integrate the six areas listed above. These policies are characterized by the adoption of systemic and integrating visions that acknowledge various schools of heterodox economic thought. Two illustrative examples are the concepts of systemic competitiveness and innovation systems.
The concept of systemic competitiveness envisions four ingredients for successful industrial development: (i) the “meta” level, which includes consensuses and social commitments on the need for greater industrial development, together with the ability of the various players to jointly formulate visions and strategies that underpin policy implementation; (ii) the “macro” level, which requires a stable macroeconomic climate and certainty, including foreign trade and FDI attraction policies; (iii) the “meso” level, which encompasses specific institutions and policies to strengthen industries and enhance the technological and economic environment in which they operate (financing, training, R&D and others); and (iv) the “micro” level, which needs firms with technological capacities, and networks of firms that collaborate to strengthen their competitiveness (Altenburg, Hillebrand and Meyer-Stamer, 1998).

Strengthening value chains… 39
The conceptual framework of innovation systems is founded on the evolutionist and neo-Schumpeterian schools. These systems frame relations within and between organizations, institutions and socioeconomic structures that determine the speed and direction of innovation and the construction of technological capacities (Lundvall and others, 2009). This fourth industrial policy approach accords a systemic dimension to innovation and recognizes the need to coordinate and articulate a development strategy with firms, academia and other system participants (Cimoli, Ferraz and Primi, 2007).
The classification of industrial policy approaches described above does not mean that there is a pure version in each case; no linear and rigid division can be made between them. Usually, countries choose the instruments that are best adapted to their development strategy, but normally without adhering strictly to one of the four approaches described. In Latin America, even in the 1980s and 1990s when the “Washington Consensus” exerted its greatest influence, industrial policies continued to be implemented that went beyond the passive horizontal type, such as measures to support SMEs and to promote science, technology and innovation. Moreover, support continued to be given to strategic sectors (mining, the automotive industry, software and oil among others), or to export-oriented productive activities (selective policies).
Table I.1 summarizes the wide variety of industrial policy tools available to governments. Moving down the table, the range of tools expands. In other words, structural-change policies also have both passive horizontal policy tools and active ones, although the approach and degree of integration with a national development strategy varies.
Nonetheless, criticisms of industrial policy persist, adducing, among other reasons, so-called government failures, which occur when decision-makers put their own interests, or those of the group, ahead of the interests of the community (Bianchi and Labory, 2011). Objections to industrial policy are mainly practical and refer to its implementation. Naudé (2010) distinguishes arguments that stress information challenges or constraints, from those that focus on rent-seeking and corruption, as the two most common objections to the design and application of an active industrial policy. The first of these considers the existence of market failures to be insufficient reason for state intervention in the economy, and that governments lack the information and experience needed to appropriately conduct an industrial policy. In the second case, it is claimed that rent-seeking and corruption may spawn policies aimed at protecting specific firms, activities or assets, the production of which is unprofitable, thereby responding to private interests.

40 ECLAC
Table I.1 Types of industrial policy
Type of policy Objectives Instruments Predominant school
Passive horizontal
No discrimination between activities
Competitiveness policies:• Stable macroeconomic environment • Guarantees for contract compliance • Ease of opening new businesses • Protection of investments and
infrastructure building Trade and FDI attraction policies:• Generalized unilateral liberalization actions • Signing of bilateral or multilateral agreements
that do not single out or protect specific sectors
• Openness to foreign capital
Orthodox: neoclassical
Active horizontal
Correction of market failures
Policies to promote scientific and technological development and innovation:• Direct support for private sector R&D activities • Promotion of joint R&D projects aimed at
internalizing externalities Policies to develop human resources and business training:• Financing to develop specialized
human resources • Public programmes to update competencesPolicies to support SMEs and microenterprises:
Policies to improve access to credit
Policies to correct problems arising from imperfect information• Organization of events, trade fairs
and meetings • Business directories • Seminars and conferences
Protection of intellectual property rights
Structural- change policies without challenging comparative advantages
Promotion of development strategies based on existing comparative advantages
Policies of direct government action:• Provide information on new industries,
consistent with existing comparative advantages
• Coordinate investments in related industries and improve infrastructure
• Direct fiscal subsidies • Untargeted tax exemptions • Directed credit at subsidized interest rates• Catalyze the development of new industries
through incubation and/or the attraction of FDI.• Foreign trade tariffs
Heterodox: evolutionist, structuralist, neo-Schumpeterian
Structural- change policies that create new comparative advantages
Alter and challenge comparative advantages
The industrial policy tools used under this approach combine all of the above with tools of direct government intervention involving financing, tax incentives, public investment and public procurement, among others. Under this approach, industrial policy needs to be in harmony with macroeconomic, social and labour-market policies to achieve the desired structural change.
Source: Prepared by the authors.

Strengthening value chains… 41
Section D of this chapter provides a summary of successful past experiences and also of recent active industrial policies and their results. The evidence shows that if the State plays an active role that is well-defined and justified (with controls and periodic evaluations, and subject to voter approval), then intervention is better than not having an industrial policy.
Like many other economic policies, industrial policy should be seen as a process of discovery, in which the private sector and government learn about the costs and opportunities of engaging in strategic coordination processes, which necessarily involve trial and error (Rodrik, 2004). Over the last three years, ECLAC has provided countries in the region with technical assistance to implement industrial policy, using an approach based on strengthening value chains. This methodology aims to identify the bottlenecks faced by selected value chains, as a starting point for designing targeted public policies and forging public-private agreements to overcome them (see chapter II).
Three further points need to be made to clarify the concept of industrial policy. Firstly, the correct instrumentation of industrial policy needs to be accompanied by institutional development, consensus among the different stakeholders, and coordination with other economic policies. The ECLAC vision of structural change makes equality8 the normative pillar around which the various long-term policies need to be integrated. This integrated vision recognizes the interdependence of the economic, political and social elements in achieving development with equality; and it stresses three courses of action: industrial policy, macroeconomic policy and social and employment policies (ECLAC, 2012). Macroeconomic policy supports structural change by creating an environment that fosters production and employment growth on a sustained basis over the long term, combined with stable macro-prices (interest rate, exchange rate, wages). This needs to be complemented by social and employment policies to correct inequality, by redistributing income and improving the functioning of the labour market, to generate a sustained increase in better-quality jobs and with higher productivity (ECLAC, 2012).
Secondly, it is essential that industrial policy pay attention to the specific needs and capacities of sectors and regions. The economic literature gives broad recognition to the importance of local industrial development under the concepts of cluster or industrial district (Saxenian, 1990; Schmitz, 1995; Llisterri and Pietrobelli, 2011). Several geographical factors
8 “Unlike the idea of equity, equality involves not only closing opportunity gaps but also a firm commitment by the State to redistribute the fruits of development, to achieve greater balance in the distribution of production factors and how they appropriate productivity gains, to define a normative framework spelling out social rights and calling for fiscal covenants based on the universality of rights and to be more willing to think not only in terms of thresholds but also in terms of ceilings” (ECLAC, 2012, p. 14).

42 ECLAC
also affect business competitiveness, such as the characteristics of local institutions and organizations, subnational culture and social habits, the informal environment for knowledge creation and transmission, and local public policies (Park, 2002). There are also different dynamics, particularly technological ones, in industrial sectors (Pavitt, 1984; Robson, Townsend and Pavitt, 1988; Cohen, Nelson and Walsh, 2002). For these reasons, specific instruments are needed that are targeted on selected sectors, together with policies that address the specific features of subnational regions (Stezano and Padilla Pérez, 2013).
Thirdly, the formulation of an industrial policy for small economies needs to start from the specific characteristics of the countries classified as such.9 Four characteristics can be identified which, without being exclusive to small economies, are generally applicable to them and should be considered in policy design: (i) limited natural resources; (ii) a small domestic market, which leads to a greater propensity for trade openness owing to the low level of domestic demand; (iii) lack of capacity to achieve economies of scale in infrastructure and R&D projects; and (iv) weak individual bargaining power in the international arena.
C. Why is an industrial policy necessary?
The revival of industrial policy is not a passing fashion or a mere repositioning of an existing ideological current. The empirical evidence clearly shows its importance and usefulness, which can be summarized in the following three arguments.
The first is that the macroeconomic stability and export development achieved by most Latin American countries over the last three decades have been insufficient to generate sustainable and inclusive economic growth. As much as 91.7% of the region’s population lives in countries where per capita GDP grew by less than 2% between 1980 and 2012; and 32.0% live in countries where this growth was less than 1% (ECLAC, 2013). Figure I.1 shows that, as a result of this dynamic, the per capita GDP gap between the United States and the Latin American average widened in the period 1950-2000. In contrast, the Republic of Korea and China, which have both implemented active industrial policies, as discussed below, have made significant progress in catching up with the United States on this indicator.
9 The parameters used to classify an economy as small are not homogeneous, and conventions tend to be used. For example, according to Mata (2009), in 1996, the Trade Unit of the Organization of American States (OAS) decided that the size of an economy could be measured by combining the number of inhabitants of a country with its per capita gross domestic product (GDP).

Strengthening value chains… 43
Figure I.1 Latin America, China and the Republic of Korea: per capita GDP
relative to the United States, 1950-2010(Percentages)
0
10
20
30
40
50
60
70
1950
1952
1954
1956
1958
1960
1962
1964
1966
1968
1970
1972
1974
1976
1978
1980
1982
1984
1986
1988
1990
1992
1994
1996
1998
2000
2002
2004
2006
2008
2010
Latin America Latin America in 1900 China Republic of Korea
Source: Economic Commission for Latin America and the Caribbean (ECLAC), Economic Survey of Latin America and the Caribbean, 2013 (LC/G.2574-P), Santiago, Chile, 2013, p. 75.
The region’s economic performance in this regard is explained by its growth model based mainly on exploiting natural resources, and geographical proximity and/or low-cost labour, which has fuelled growth in exports and production, but with scant value added and dependent on low wages. This illustrates the need for an active industrial policy to strengthen productive linkages and build national capacities to participate in more technology-intensive activities, which are usually associated with better employment conditions.
Closely related to this model is the persistent income inequality observed in the countries of the region: in Latin America, the wealthiest 10% of the population receive 32% of total income, while the poorest 40% receive just 15% (ECLAC, 2013). Nonetheless, there has been a reduction, albeit insufficient, in the prevalence of poverty and indigence: in 2011, 29.4% of the region’s population was living in poverty, and 11.5% in conditions of indigence (ECLAC, 2013).
The second factor explaining the importance of industrial policy concerns long-term economic growth, which requires sustained increases in productivity. In the 1990s, the productivity gap between Latin America and the developed countries widened as a result of the region’s slow rate of economic growth. In the first decade of the new millennium, thanks to a growth surge between 2004 and 2008, Latin America raised its annual rate of increase in labour productivity to 1.1%, which enabled it to slightly narrow

44 ECLAC
the gap with respect to the countries of the Organization for Economic Cooperation and Development (OECD). Nonetheless, the gap with respect to East Asian countries widened in the same period, since these countries grew much faster (ECLAC, 2013). Table I.2 shows the huge difference in labour productivity growth between the Republic of Korea and the largest Latin American economies, particularly in the 1980s and 1990s.
Table I.2 Latin America (selected countries) and the Republic of Korea: growth of output
and labour productivity, 1965-2010 a
(Average annual growth rates)
Country Period GDP Employment Productivity
Argentina
1965-1975 4.2 1.28 2.651976-1981 1.52 1.84 -0.291982-1990 -0.9 2.34 -3.191991-2001 3.86 1.29 2.532002-2010 5.56 3.51 1.92
Brazil
1965-1981 7.22 3.6 3.771982-1992 1.99 3.73 -1.681993-1998 3.33 1.71 1.61999-2010 3.38 1.93 1.45
Chile
1965-1973 2.96 1.35 1.911974-1981 4.03 0.87 3.241982-1985 0.25 2.39 -2.071986-1998 7.28 3.29 3.881999-2010 3.43 1.08 2.33
Mexico
1965-1981 6.69 4.69 1.831982-1994 1.87 3.46 -1.551995-2000 3.51 2.72 0.732001-2010 1.81 1.18 0.62
Republic of Korea
1965-1980 8.2 3.64 4.711981-1990 8.74 2.84 5.761991-2000 6.19 1.61 4.462001-2010 4.16 1.35 2.77
Source: Economic Commission for Latin America and the Caribbean (ECLAC), Structural Change for Equality: An Integrated Approach to Development. Summary (LC/G.2524(SES.34/4)), Santiago, Chile, 2012, p. 42.
a The periods defined vary from country to country and are based on the main shocks and policy changes occurring in each case.
Deep structural change allowing for upgrading towards more productive sectors or activities, requires an active industrial policy, since policies aimed merely at correcting market failures, or those of a horizontal type, have proven insufficient.
The third factor to be taken into account in relation to the importance of industrial policy is that both developed countries and developing
Strengthening value chains… 45
countries from other regions have applied, and continue to apply, active industrial policies, as discussed in the next section of this chapter. While their experiences suggest the importance and usefulness of such policies for achieving long-term economic and social development based on structural change, Latin American countries compete on international markets precisely with the countries that have more active policies, thereby putting the region’s productive sector at a disadvantage.
D. Successful experiences in industrial policy
This section provides a brief historical summary of public intervention in industrial development, as a driver of economic and social growth. It first describes representative examples from the eighteenth and nineteenth centuries, particularly Great Britain, Germany, the United States and Japan. It then describes the experience of the “Asian tigers” —Hong Kong (Special Administrative Region of China), the Republic of Korea, Singapore and Taiwan Province of China— in the twentieth century. It concludes by considering the recent revival of a central role for industrial policy in Europe and the United States, and also in emerging economies such as Brazil and China.
1. Experiences in the eighteenth and nineteenth centuries
The industrial revolution that Great Britain underwent in the eighteenth century played a key role in consolidating a new way of conceiving productive relations both outside and inside each country. Various studies have noted that the industrial revolution was the outcome of an long process of applying policies that recognized the importance of public intervention for the country’s development and the expansion of national wealth.10 British politicians implemented measures to foster technological development, the creation of institutions,11 the promotion of investment in manufacturing, and protection of the economy with the aim of nurturing industry and thereby promoting national development.
The distinctive feature of the industrial revolution was technological change, which the British government actively promoted by encouraging the inflow of technology and the creation of partnerships to disseminate knowledge, while preventing domestic innovations from flowing out of the country (Crafts, 1996). The course followed by the economy led to an increase in exports of industrially processed raw materials, to the
10 See, for example Crafts (1996), Freeman (1982) and Peres and Primi (2009).11 Judicial and legislative institutions (laws, commercial code, patents); institutions that
supply public goods, and institutions that carry out economic activities (banks, stock markets, commercial companies) (Zamagni, 2001).

46 ECLAC
detriment of the exports of unprocessed raw materials, and it fuelled stable growth over the period 1760-1914.
Industrialization processes in Germany, the United States and Japan were influenced by the ideas of the German economist Friedrich List, whose main thesis viewed the learning process achieved by acquiring, using and generating technologies as the driver of development (Di Maio, 2009). The main strategies proposed by List include the following:12
(i) Human capital plays an important role in the country’s productivity.
(ii) Manufacturing is the key driver of output and productivity growth; it generates employment and solves balance of payments problems. Investment in this sector stimulates the development of the economy as a whole.
(iii) Activities and sectors characterized by increasing returns should be selected.
(iv) An interventionist economic policy is needed to promote long-term development through various instruments, such as the creation of temporary monopolies to protect progress in certain key areas (the patent system for example); tax incentives for priority activities; quotas, tariffs and taxes to penalize the exportation of raw materials; and financial support at below market rates to invest in production.
The German government played an active role in building a national industry by helping to finance and construct transport infrastructure, mainly railroads. It also developed the education system and promoted scientific research by forming more complex industries and new branches of production. This led to the consolidation of the chemical and electrical engineering industry internationally (Aparicio, 2013; Freeman, 1982).
The intensity of the industrialization process in the United States, which began in the mid-nineteenth century, was driven by the following factors in particular: an expanding population, which grew from roughly 23 million inhabitants in 1850 to 106 million by 1920; a tremendous abundance of natural resources; development of the education system and knowledge applied to industry; and trade policy and the protection of industry (Aparicio, 2013). The federal government applied similar measures to those adopted by the British government, and followed List’s principles relating to state intervention through investment in knowledge,
12 See Peres and Primi (2009).

Strengthening value chains… 47
protection of markets, intellectual property rights and subsidies, among other instruments (Naudé, 2010).
In Japan, the success of the industrial development process was based on the country’s initial characteristics and conditions; economic and social reforms; a large domestic market; a literacy rate similar to those of developed countries and an established business and commercial class (Aquino, 2000). The Japanese government played a leading role in the construction and consolidation of a national industry, participating directly in the formation of transport and communication infrastructure; the establishment of important state-owned enterprises that were later sold for development by the private sector; the creation of the iron and steel industry; the expansion of education; the creation of institutions; the development of science and technology; professional interchange with western countries and the formation of national business groups.
2. The East Asian countries
In the second half of the twentieth century, the Asian “tigers” or “dragons” —Hong Kong (Special Administrative Region of China), the Republic of Korea, Singapore and Taiwan Province of China— experienced rapid economic development in terms of production growth, poverty reduction, and engagement with international markets. While academic debates have continued to rage over the determinants of their achievements, historical analysis highlights the application of integrated industrial policies, supported by sound macroeconomic management and strong institutional development.13
The industrial policy objectives of the Asian tigers targeted the development of technological capacities, export promotion and the building of capacity to manufacture intermediate goods (Stiglitz, 1996). The development process required active government participation in the application of various industrial policy tools, combined with correct economic management (Stiglitz, 1996).
The industrial policy tools varied from country to country, centred on common issues such as active government intervention in education, the importance of technology, export promotion, the share of foreign investment, public-private partnerships, cooperation between entrepreneurs and workers, and competition (Stiglitz, 1996). Table I.3 lists the wide variety of industrial policy tools used by the Asian countries in the 1960s, 1970s and 1980s.
13 Evans (1996) stresses the role played by institutions in East Asian countries in giving leadership to the process of structural change.

48 ECLAC
Table I.3 East Asian countries: industrial policy tools
Tools
Macroeconomic stability Trade barriers Price controls Support for basic education Policies to promote education and training Creation of development banks (preferential and subsidized loans)Creation of capital markets Construction of forward and backward productive linkages Infrastructure strengthening Export promotion Creation of scientific and research centres Training of scientists and engineers Incentives for R&D activities in firms Joint R&D activities between the government and firms Facilitation of technology transfer
Source: Prepared by the authors.
Industrial development allowed economic progress to be made in East Asia, particularly in terms of high GDP growth rates and improvements in the economic and social welfare of its inhabitants. Table I.4 shows average GDP growth rates and the levels of the human development index (HDI) of Hong Kong (Special Administrative Region of China), the Republic of Korea and Singapore in the second half of the twentieth century. As can be seen, average growth in the subregion fluctuated between 6% and 9.9% per year in the period 1960-2000, which, in conjunction with the application of economic and social policies, enabled these “Asian tigers” to join the high-HDI group.
Table I.4 East Asia (selected countries): growth of GDP and per capita GDP,
1960-2012, and Human Development Index, 1980-2012(Percentages and levels)
Average growth rate Human Development Index 1960-1969
1970-1979
1980-1989
1990-1999
2000-2012 1980 1990 2000 2012
Hong Kong (Special Administrative Region of China)GDP a 9.00 6.72 3.95 4.72 0.712 0.788 0.815 0.906GDP per capita a 6.35 5.46 2.35 3.98Republic of KoreaGDP a 8.20 7.24 8.73 6.08 4.74 0.640 0.749 0.839 0.909GDP per capita a 5.62 5.35 7.46 5.11 4.10SingaporeGDP a 9.99 9.05 7.74 7.15 6.32 0.756 0.826 0.895GDP per capita a 7.47 7.41 5.26 4.20 3.42
Source: Prepared by the authors on the basis of data from World Bank, World Development Indicators and the United Nations Development Programme (UNDP), Human Development Report, various years.
a United States dollars at constant 2005 prices.

Strengthening value chains… 49
In relation to structural change, or the move towards activities and sectors of higher technology intensity and more buoyant productivity growth, Hong Kong (Special Administrative Region of China), the Republic of Korea and Singapore transformed the sector composition of their exports in the twentieth century, and evolved from a structure dominated by primary products and natural resources to one dominated by high-technology goods (see table I.5).
Table I.5 East Asian countries: exports according to technological
intensity, selected years(Percentages)
Hong Kong (Special Administrative Region of China) 1978 1980 1990 2000 2012
Primary goods 4.1 3.9 2.6 1.4 1.2Manufactures based on natural resources 8.2 7.5 8.7 6.4 6.7
Low-tech manufactures 57.1 51.8 47.9 39.7 16.8
Medium-tech manufactures 19.9 24.2 22.3 20.7 16.3
High-tech manufactures 9.2 10.4 16.8 30.6 48.0
Others 1.6 2.3 1.8 1.3 11.0
Republic of Korea 1976 1980 1990 2000 2012
Primary goods 7.1 5.7 2.9 1.2 0.7Manufactures based on natural resources 14.7 12.2 7.3 12.3 19.5
Low-tech manufactures 52.2 45.0 38.2 16.4 9.1
Medium-tech manufactures 15.3 27.2 30.3 33.2 43.3
High-tech manufactures 10.2 9.7 20.7 35.8 26.5
Others 0.6 0.3 0.6 1.1 0.8
Singapore 1979 1980 1990 2000 2012
Primary goods 16.3 13.6 4.3 1.4 0.8Manufactures based on natural resources 35.2 39.0 26.8 12.7 26.7
Low-tech manufactures 8.7 7.6 8.9 6.4 5.3
Medium-tech manufactures 17.1 18.1 21.7 16.8 20.3
High-tech manufactures 15.4 14.1 36.3 58.8 37.4
Others 7.3 7.6 2.0 3.9 9.5
Source: Prepared by the authors on the basis of Economic Commission for Latin America and the Caribbean (ECLAC), Interactive graphic system of international trade trends (SIGCI Plus), 2013 [online] http://www.eclac.org/comercio/ecdata2/.
The transformation of the export structure of the “Asian tigers” has gone hand in hand with the development of endogenous innovation capacities and increasing global technological leadership in

50 ECLAC
the electronics industry. Table I.6 shows the vigorous growth of R&D investment as a percentage of GDP in selected East Asian countries between 1980 and 2012. The largest change occurred in the Republic of Korea which raised its R&D investment from 0.57% of GDP in 1980 to 4.03% in 2012. The number of patents granted by the United States Patent and Trademark Office (USPTO) also grew rapidly in this period. The Republic of Korea has overtaken Germany, the United States and Japan in terms of R&D investment as a percentage of GDP, and it is catching up with Germany in terms of patents granted by the USPTO. Box I.1 summarizes the impressive development of technological and productive capacities achieved by the electronics industry in the Republic of Korea in the space of a few decades
Table I.6 East Asian countries and selected developed countries: R&D expenditure
as a percentage of GDP, selected years(Percentages and amount)
Country
Expenditure on research and development as a
percentage of GDP
Number of patents granted by the USPTO a
1980 1990 2000 2012 1980 1990 2000 2012
Hong Kong (Special Administrative Region of China)
0.40 b 0.50 0.80 c 27 52 176 532
Republic of Korea 0.57 1.88 2.30 4.03 8 225 3 314 13 233
Singapore 0.30 d 0.94 1.85 2.23 3 12 218 810
Taiwan (Province of China) 1.72 e 1.94 3.02 66 732 4 670 10 646
United States 2.32 2.77 2.71 2.77 37 350 47 391 85 068 121 026
Germany 2.35 d 2.59 f 2.47 2.88 5 782 7 614 10 235 13 835
Japan 2.19 3.03 3.00 3.39 7 124 19 525 31 295 50 677
Source: Prepared by the authors on the basis of Organization for Economic Cooperation and Development (OECD), Science, Technology and R&D Statistics, 2013 [online] http://www.oecd-ilibrary.org/science-and-technology/data/oecd-science-technology-and-r-d-statistics_strd-data-en; World Bank, World Development Indicators [online database] http://data.worldbank.org/news/new-suite-of-world-development-Indicators-products-now-available; United Nations Educational, Scientific and Cultural Organization (UNESCO) (2013), Statistical Yearbook, http://stats.uis.unesco.org/unesco/tableviewer/document.aspx?ReportId=143, and United States Patent and Trademark Office (USPTO), Patents by Country, State and Year [online] http://www.uspto.gov/web/offices/ac/ido/oeip/taf/cst_all.htm.
a United States Patent and Trademark Office.b 1998.c 2009.d 1981.e 1995.f 1991.

Strengthening value chains… 51
Box I.1 The development of the electronics industry in the Republic of Korea
The assembly-line production of radios launched the development of the Korean electronics industry in 1958. In its early years, the industry remained in an incipient stage in which most of the necessary parts were imported from United States, Europe and Japan (Kim and Lee, 2002; Bark 1991).
In the mid-1960s, however, the government promoted FDI with the aim of developing a national electronics industry. This allowed corporations such as Komy, Fairchild and Sgnetics, IBM, Motorola and Control Data to set up subsidiaries in the country, which facilitated progress towards the assembly of more sophisticated products. In 1966, the government launched a five-year plan to promote the electronics industry, targeting import substitution and export growth. The plan entailed active government participation through preferential loans and restrictions on the entry of imported products —measures that favoured the production of basic electronics goods (radios and transistors) by national enterprises (Kim and Lee, 2002).
The rapid growth of the industry in the 1970s and 1980s, as a result of stronger international demand, firstly enabled small and medium-sized enterprises to enter the market to focus on labour- intensive activities; and, secondly, it allowed for upgrading towards the production of more sophisticated and more complex products, such as television sets, video cassette players, microwave ovens and personal computers. Nonetheless, despite rapid growth in this period, the enterprises in question lacked endogenous technological capacities, and R&D activities were concentrated in a small number of large firms (Kim and Lee, 2002).
In the 1990s several developments combined to mark a turning point in the Korean electronics industry: (i) wage growth in the manufacturing sector; (ii) elimination of most of the entry barriers imposed by the government pre-1989; (iii) a change in demand that led to a reduction in the output of television sets and radios and the start of the production of new products (cellphones and personal computers); (iv) the shift in demand led to the introduction of new products characterized by miniaturization and digitization, which required technological innovations (Kim and Lee, 2002).
Since the 1990s, the country’s strategy has focused on maintaining the production and manufacture of electronics goods and their components, supported by innovation in terms of new technologies. The government’s priority has been to develop endogenous technological capacities and create world-class industrial infrastructure through four channels (WTEC, 1997):
(i) Provide a legislative basis for the growth of the high-technology industry through various measures: national banking regulations, low-interest loans, tax incentives, and duty-free import of selected capital goods.
(ii) Promote human resources formation and R&D for the high-technology industry by providing direct financial support to public and non-profit entities, universities and other educational institutions. This type of assistance is generally provided through cost-sharing partnerships in new products or technology development.

52 ECLAC
(iii) Funds for infrastructure development and the construction of “science parks”.
(iv) Promote the development of a sophisticated technoculture in the country through government leadership in cooperation with industry, the education system and communications media.
The country is currently the key player in the global electronics industry chain since it is responsible for half of world production of dynamic random access memory (DRAM), two thirds of the manufacture of NAND-type flash memory and 70% of the supply of tablet screens. In addition, the Korean firm Samsung is the global leader in the production of smart phones and related apparatus; while LG Electronics, also Korean, is ranked sixth in both categories. Between them, the two companies account for over 30% of the market for mobile phones and smart phones (IHS Inc., 2013).
Source: Prepared by the authors on the basis of Y. Kim and B. Lee, “Patterns of technological learning among the strategic groups in the Korean Electronic Parts Industry”, Research Policy, vol. 31, May 2002; T. Bark, The Korean Consumer Electronics Indrustry. Reaction to Antidumping Actions, Trade Policy Working Papers, Washington, D.C., World Bank, October 1991; and World Technology Evaluation Center, “Report on The Korean Electronic Industry. Executive Summary”, 1997 [online] http://www.wtec.org/loyola/kei/welcome.htm.
3. Industrial policy in the twenty-first century
The new industrial policy has gained ascendancy in a different international and national scenario than that which prevailed in the 1960s and 1970s, now characterized by the predominance of free trade and the circulation of large flows of goods, services and capital. The United States and several European countries have adopted new instruments and announced programmes to help strengthen their national industries, while various developing countries have increased government support for industrial development. Three cases representing these experiences are described in the following paragraphs.
(a) United States
Historically, industrial policy in the United States has been developed in close relation with the military sphere and has been aimed at stimulating competition and innovation, in addition to promoting education and human capital formation (Buigues and Sekkat, 2009). Although the official discourse of the United States government has repeatedly denied public intervention, several significant industrial development support measures have been put into practice in recent years.
For example, to cope with the recent crisis in the United States economy, the federal government provided a very large bailout package for the automotive industry. In 2008 and 2009, General Motors and Chrysler received US$ 65 billion from the administrations of Presidents George W. Bush and Barack Obama (Pollin and Baker, 2009).
Box I.1 (concluded)

Strengthening value chains… 53
In 2009, President Obama set forth a plan with objectives and instruments that aims to strengthen national manufacturing as a way to create jobs and meet the challenges of the twenty-first century (Executive Office of the President of the United States, 2009). Table I.7 summarizes the objectives and the key actions.
Table I.7 United States: national manufacturing strengthening plan, 2009
(Selected elements)
Objectives Actions1. Provide workers
with the opportunity to obtain the skills necessary to be highly productive
• Invest in high-quality job training • Provide training and tutoring to entrepreneurs • Expand education and training support to unemployed workers • Make a historic investment in college affordability • Improve America’s math and science education • Expand high-quality early education
2. Invest in the creation of new technologies and business practices
Basic research and leading-edge technologies • Double the R&D budgets of key science agencies • Improve coordination of manufacturing related R&D • Explore new options to foster innovations and technological breakthroughs • Make the research and experimentation tax credit permanent• Spur innovation in manufacturing • Protect intellectual property rights Diffusion of technologies and best practices • Streamline and enhance delivery of government services to businesses • Create an Office of Innovation and Entrepreneurship and a National
Advisory Council on Innovation in the Department of Commerce3. Develop stable and
efficient capital markets for business investment
• Provide access to capital for new businesses • Ensure access to capital to exporters • Expand access to financing for producers facing economic hardship
4. Help communities and workers transition to a better future
• Halt plant closures• Support the creation of competitive communities by promoting regional
innovation clusters • Target assistance for manufacturers and workers in the automotive industry
5. Invest in advanced transportation infrastructure
• Invest in roads, bridges and mass transport • Modernize the electric grid • Fulfil a new transportation vision with high-speed rail • Expand access to broadband • Support research for the next-generation of information and
communications technology6. Inshore market
access and a level playing field
• Strengthen trade agreements • Promote exports • Encourage trade financing • Support small business investment in emerging markets and
the developing world • Review export control regulations
7. Improve the business climate, especially the manufacturing
• Get the economy growing again to expand aggregate demand and create jobs
• Replace tax breaks for overseas investment with tax cuts to businesses creating jobs in America
• Pass comprehensive energy and climate legislation that will jumpstart the American clean energy sector
Source: Prepared by the authors on the basis of Executive Office of the President of the United States, A Framework for Revitalizing American Manufacturing, Washington, D.C., December 2009 [online] http://www.whitehouse.gov/sites/default/files/microsites/20091216-maunfacturing-framework.pdf.
54 ECLAC
In 2013, President Obama announced a second plan (a continuation of the previous one) recognizing the importance of manufacturing industry in the country’s growth and in the creation of well-paid jobs. The plan’s objective is to promote investments in manufacturing industry, clean energy, infrastructure and education. Under the programme, measures would be implemented to generate a business climate that promotes employment through worker training and infrastructure building. In the employment sphere, the plan aims for education and training to provide United States citizens with the skills needed for global competition, through public-private partnerships. In the case of manufacturing industry, the goal is to revitalize it through a three-point plan: “(i) partnering with businesses and communities to invest in American-made technologies and American workers to a network of new manufacturing innovation Institutes; (ii) ending tax breaks to ship jobs overseas and making the United States more competitive; and (iii) bringing jobs back and [...] attracting investment to the United States.” (The White House, 2013, p. 2).
In addition to continuing to fulfil the commitments made in 2009, the United States government has proposed an investment of US$ 1 billion in 2013 to create a network of institutes and factories devoted to technological innovation (The White House, 2013).
(b) China
Ever since the 1980s the Chinese government has been developing a strategy that combines a centrally planned economy (in transition) and the market economy, in which state enterprises play an essential role. This means that the Chinese government continues to act as the main driver of this Asian country’s economic system (UNIDO/UNU, 2012).
Public investment in infrastructure and loans at preferential interest rates have been the key elements of the Chinese strategy. The government has also promoted the creation of national champions (large nationally owned enterprises that internationalize their operations), basically in the high-technology industries; and it has put special emphasis on attracting FDI (Dorn and Cloutier, 2013). The latter has been used by the government to promote technology transfer and the development of endogenous capacities. At the start of the trade liberalization process, the Chinese government did not allow foreign ownership in a variety of industries, so the only way for foreign firms to penetrate the Chinese market was through a joint venture. This enabled foreign firms to benefit from government policies, while domestic enterprises absorbed foreign technology through observation, imitation and learning (UNIDO/UNU, 2012).
Careful management of foreign trade has facilitated the industrialization process in two complementary ways. Firstly, trade liberalization made

Strengthening value chains… 55
it possible to import cheap technology, which was essential for the industrialization process; and secondly, the opening up of the economy helped exporters, with government support, to sell a large proportion of the national productive surplus in foreign markets (UNIDO/UNU, 2012).
The Chinese government has traditionally supported a selected group of sectors. Its 12th annual plan, covering the period 2011-2015, puts special emphasis on cotton production, the textile industry, biochemical products, capital goods, electrical appliances, the footwear industry, innovation in green technology, the oil industry, steel production, and power generators.
(c) Brazil
The industrial policy currently being implemented in Brazil promotes internationalization through goods and services exports and the attraction of FDI. It also stresses technological improvement and capacity-building for development as ways to increase competitiveness, both in the manufacturing sector and in services (UNIDO/UNU, 2012).
The key features of the policy include long-term planning, encouraging the creation of highly innovative national champions, such as Embraer and Petrobras. Unlike other Latin American countries, Brazil’s R&D budget has increased considerably; and there has also been a strong financial commitment from development banks. At the same time, the country has invested in institutional strengthening, which has allowed partnerships to be formed between the government, the private sector and social stakeholders to execute programmes (Devlin and Moguillansky, 2012).
As part of its technological development and foreign trade plans, Brazil is promoting a sector-based strategy that includes four knowledge-intensive activities: production of semiconductors, software, pharmaceutical products and medicines, and capital goods. In terms of its productive development policy (PDP 2008-2010), the Brazilian government implemented measures to diversify the productive structure and increase productivity and exports, with an emphasis on innovation. The current development plan (Plano Brasil Maior, 2011-2014) includes horizontal measures for infrastructure development, the strengthening of productive chains and diversification of exports with higher value-added. This plan consists of six technological programmes, seven programmes targeted on leading sectors, and 12 industrial competitiveness programmes. The fulfilment of Brazil’s industrial policy objectives has been based on specific instruments, including capital injections and support for technological innovation (see table I.8).

56 ECLAC
Table I.8 Brazil: industrial policy instruments
Financing (i) Brazilian National Economic and Social Development Bank (BNDES) and products for micro-small and medium-sized enterprises (MSMEs)
Central lending institution for SMEs.Its instruments include the BNDES card (a pre-approved credit line targeting National SMEs with a limit of R$ 1 million).The BNDES also offers alternatives sources of financing for exports and sector development programmes (software, the shipbuilding industry, telecommunications, aeronautics).In 2012, BNDES disbursements totalled R$ 156 billion (roughly US$ 80 billion).
(ii) Brazilian Microenterprise and Small Business Support Service (SEBRAE)
Endeavors to provide “solutions” to facilitate access to financing for smaller firms: information on existing lending programmes and credit lines, consulting services for financial diagnostic assessments and project building. Also participates in the Brazilian Microenterprise and Small Business Guarantee Fund (FAMPE) and promotes the creation of guarantee companies with the aim of offering alternatives for collateralizing business loans.
(iii) Brazilian National Studies and Project Finance Agency (FINEP), Brazilian Employment and Income Creation Programme (PROGER)
Executes lending programmes for smaller firms
Technological innovation
(i) Funds for business R&D From 1999 to 2012, a total of 16 funds were created to support research and development activities: 14 sector funds in strategic sectors and two cross-cutting funds. The funds that delivered most resources were the cross-cutting funds (infrastructure and promotion of cooperation in science and industry) and those of the oil, energy and telecommunication sectors. Funds to support science, technology and innovation activities manage substantial amounts of resources and promote co-participation by firms, universities, state governments and research centres in the planning of projects and the management of the funds.
(ii) Local productive clusters (APLs) and SEBRAE
APLs are clusters of economic agents operating in a local area that has a concentration of specific productive activities. They bring together specialized firms, with a heavy presence of SMEs in the same productive sector. Cluster participants include suppliers and institutions that support productive development, with training, skill development, and technical assistance activities, and financing.
Source: Prepared by the authors on the basis of United Nations Industrial Development Organization (UNIDO)/United Nations University (UNU) (2012), Structural Change, Poverty Reduction and Industrial Policy in the BRICS, Vienna; and R. Devlin and G. Moguillansky, “What’s new in the new industrial policy in Latin America?”, Policy Research Working Paper, Nº 6191, Washington, D.C., World Bank, 2012.

Strengthening value chains… 57
E. Spaces for industrial policies in the international context
The industrial policies implemented over the last several decades (centuries even, in some cases) by countries that are now developed and have an internationally competitive industry, as described in the previous section, are constrained by the agreements signed under the World Trade Organization (WTO), and by the multilateral and bilateral treaties signed in the last three decades. Nonetheless, there is still plenty of room to implement industrial policies, although changes in the international scenario restrict the field of action and consequently call for greater creativity when designing new instruments.
The agreements signed in the WTO framework limit the space for industrial policy in four main areas.
1. Tariffs, para-tariffs, quotas and nontariff barriers
The General Agreement on Tariffs and Trade (GATT), now administered by the World Trade Organization (WTO), requires member countries to reduce import tariffs to agreed the maximum levels, although certain industrial products and primary goods are not subject to these maxima. Also restricted are “para-tariffs”, in other words specific taxes on imports or royalties that have a similar effect to a tariff, such as taxes on foreign currency transactions and domestic taxes on imports. The use of quantitative import restrictions is also prohibited, along with regulations governing rules of origin, customs procedures, sanitary and phytosanitary measures, and other measures that potentially represent non-tariff barriers.14
2. Export subsidies
The WTO Agreement on Subsidies and Countervailing Measures bans subsidies aimed exclusively at export promotion; and it specifies rules on the use of countervailing measures in cases where a national industry is damaged as a result of production subsidies in third countries. Annex 1 of this Agreement contains a list of prohibited export subsidies, such as foreign-exchange and drawback schemes or any similar practice that results in a bonus to exports; partial or total exemption from direct and indirect taxes or social contributions, specifically related to exports; and the granting of export credits at subsidized rates.
Nonetheless, the Agreement permits subsidies to promote R&D activities and higher education, under certain conditions, along with assistance for deprived regions; and it also allows support to be provided to upgrade facilities to meet new official environmental requirements.
14 See Hoekman, Mattoo and English (2002) for further information on non-tariff barriers and para-tariffs.

58 ECLAC
3. Trade-related investment measures
The Agreement on Trade-Related Investment Measures (TRIMS) requires member countries to eliminate trade-related performance requirements; and it prohibits rules constraining the activities of multinational enterprises in terms of purchasing domestic inputs or importing inputs. It requires member countries to treat foreign direct investment (FDI) no less favourably than investments financed with domestic capital.
4. Intellectual property rights
The Agreement on Trade-Related Aspects of International Property Rights (TRIPS) specifies the minimum standards of protection that each WTO member country has to guarantee in the main areas of intellectual property; and it defines the procedures and actions that must be available to the owners to uphold such rights (Watal, 2002). The main areas considered are patents, trademarks, industrial designs and geographical indications. The signing of this Agreement requires significant changes in domestic laws and the strengthening of institutions to enforce it.
Multilateral and bilateral trade agreements have further restricted the scope of action of industrial policy. For example, in the negotiation of bilateral trade agreements the United States has exerted pressure for tighter restrictions in the areas of investment regulation, intellectual property protection and the capital account (Rodrik, 2004).
The North American Free Trade Agreement (NAFTA), for instance, imposes restrictions that go beyond those agreed upon in the WTO framework. In the area of investments, it is forbidden to impose or enforce any of the following requirements on an investment or on an investor: (i) exporting a pre-defined amount or percentage of merchandise or services; (ii) achieving a certain level or percentage of national content; (iii) purchasing, using or maintaining a preferential agreement on merchandise produced or services provided in its territory; (iv) linking the volume or value of imports to the volume or value of exports in any way, or to the amount of foreign exchange inflows associated with the investment in question; (v) restricting sales of merchandise or services that the investment in question produces or provides in its territory, by relating such sales in any way to the volume or value of exports or foreign exchange earnings; (vi) transferring technology; or (vii) acting as the exclusive supplier of the merchandise it produces or the services it provides in a specific region or in the world market (Rodrik, 2004). NAFTA also prevents the refunding of tariffs and the postponement of customs measures, exemption from customs duties and restrictions on exports and imports (Mercado, 2010).

Strengthening value chains… 59
The Free Trade Agreement between the United States, Central America and the Dominican Republic (DR-CAFTA) also intensifies and expands restrictions on the implementation of an industrial policy in various areas, including stricter agreements on the use and appropriation of intellectual property, and on the observance of the corresponding rights. Moreover, in the sphere of public procurement, which tends to be a powerful tool for promoting national industry, the DR-CAFTA Agreement stipulates that governments cannot grant less favourable treatment to a locally established supplier merely on the basis of its degree of association or foreign ownership.
Despite these restrictions, there is a lot of room for industrial policies to be applied, as noted above. Based on the classification of instruments described in this chapter, there are possibilities in all areas of industrial policy:
(i) Science, technology and innovation policies. The Agreement on Subsidies and Countervailing Measures allows direct support for R&D activities. Tax incentives for innovation, post-graduate scholarships, incentives for collaboration by universities and research centres, and support for high technology incubators, among other tools, are not restricted in any trade agreement.
(ii) Education and skill development policies. There are no restrictions on policies for human resource formation at any level, which is an essential factor in structural change.
(iii) Trade policies. The use of protectionist instruments is heavily restricted under the new international scenario; but exports can be promoted and FDI attracted through a wide variety of innovative tools that do not contravene any agreement signed, as described later in this chapter. It is very important that trade policies be integrated into, and coordinated with, a national development strategy.
(iv) Measures to promote selected industries. Countries can select industries which, in their opinion, make a specific contribution to the national development strategy, owing to their capacity to create jobs, increase exports, generate productive linkages, and engage MSMEs, among others. There are four factors to take into account in policy-making: firstly, the incentives must not be linked to export criteria or conditions, nor make distinctions based on the origin of the capital; secondly, the rules of trade agreements are more relaxed in the field of services, and so there is more potential for industrial policies in that area; a third aspect is that public support for industrial restructuring with environmental criteria is not restricted; and, lastly, most countries in the region can use public procurement as a tool of industrial policy.

60 ECLAC
(v) Competitiveness policies. The creation of a business-friendly environment by generating economic signals and incentives that motivate agents to be competitive is possibly the area with greatest potential for industrial policies, because this process is characterized by strengthening the functioning of markets.
(vi) Competition policies. As is the case with competitiveness, there are no major restrictions on implementing policies that seek to strengthen competition in markets.
F. Industrial policy tools
This section describes three industrial policy tools as examples that promote structural change with a systemic and integrating approach: (a) attraction of FDI; (b) SME support policies; and (c) science, technology and innovation policies. Public action to strengthen value chains can use the instruments described here, in conjunction with others, particularly those targeting the last two policy types mentioned.
1. Attraction of FDI
There is consensus on the positive impact that FDI can have on the growth and development of the receiving country, for which it offers the following potential benefits: (i) it is a source of external financing; (ii) if it is applied to “greenfield” projects, it will make it possible to increase production and employment in the receiving economy; (iii) if, in addition, it is targeted on foreign markets, it will have a positive effect by increasing exports; and (iv) through productive linkages with the local economy, it can boost production and employment, in addition to fostering technology transfer, human resource training and local business development (Padilla Pérez and Martínez Piva, 2009; Machinea and Vera, 2006; UNCTAD, 2002; ECLAC, 2004). Nonetheless, the economic literature also studies the potential negative effects of FDI, such as the disappearance of national producers, repatriated capital, and tight control over technology (Moran, 2000; Agosín and Machado, 2005).
Recognition of the potential benefits of FDI has influenced the design of policies to attract this type of investment, the complexity of which reflects the objective being pursued by countries in attempting to attract it (Gligo, 2007), and the focus of their development policies, particularly industrial policy. In its 2006 edition of Foreign Direct Investment in Latin America and the Caribbean, ECLAC distinguishes three types of public policy to attract FDI: passive policies, active policies and integrated policies (ECLAC, 2007).
Passive policies are limited to the establishment of institutional frameworks that facilitate FDI inflows. They do not reflect a lack of interest in FDI, or the presence of restrictions, but the government

Strengthening value chains… 61
considers that the existing macroeconomic conditions, institutional framework, business climate and comparative advantages (domestic or nearby markets, existing natural and human resources) are sufficient to attract this type of investment; and it does not see the need to intervene significantly in the process. This type of FDI attraction scheme is not necessarily integrated with the country’s productive development policy, and its success is measured basically by the size of the investment.
Active policies need government participation to create conditions to attract investments that are consistent with the selected objectives of the national development strategy. Governments define the type of investment that is appropriate for achieving the desired benefits; and the conditions needed to attract it are created, insofar as this is within the country’s possibilities. Policies are designed to attract quality investments with potential to generate significant benefits for the receiving economy, in terms of technology transfer, job creation and the formation of productive linkages, among others. To implement this type of policy, countries often set up an investment promotion agency, and they undertake activities to achieve the proposed objectives: tax and financial incentives to attract investment, measures to facilitate the investment (such as an improvement in the regulatory framework), and selective policies to increase the country’s competitiveness (such as infrastructure or the formation of specialized human resources). A country can also prioritize a certain category of investment or give it preference over others, for which it implements specific measures, known as targeting strategies.
Integrated policies require government leadership to complement and reconcile the country’s investment-attraction and development policies, insofar as there are coincidences between the national development objectives and firms’ requirements to maximize the benefits of FDI. In other words, it is possible to exploit conditions that make a country attractive for investors and also take maximum advantage of the potential benefits of FDI. The policies adopted aim not only to attract foreign direct investment but also to create conditions that make the most of its benefits, for example through strategies to strengthen productive linkages and increase technology absorption.
In short, all three types of public policy described encourage FDI inflows; but the third of those mentioned is more conducive to a path of structural change, given its integration and complementation with a national development strategy.
2. Policies to support MSMEs
MSME-support policies have been present to a greater or lesser extent throughout recent decades, despite the changes in the orientation of industrial policy; and they recognize the importance of micro, small and

62 ECLAC
medium-scale economic agents in creating jobs and contributing to output, but also the difficulties they face in increasing productivity and exporting.
The first decade of the twenty-first century marked a turning point in the type of policies used to promote MSMEs, as recognition emerged of the preponderant role these enterprises play in structural change in Latin American economies, through four processes: (i) their contribution to productivity growth; (ii) their complementation of the economies of scale of large firms; (iii) their key role in articulating productive clusters; and (iv) their support for social inclusion by raising the incomes of entrepreneurs and improving employment conditions for workers, thereby reducing their vulnerability (OECD and ECLAC, 2012).
The instrumentation of more integrated policies, which need to be articulated with the national development strategy, means that support for MSMEs needs to be provided from various complementary perspectives. Table I.9 summarizes four intervention areas for supporting this enterprise category, and lists the main instruments available to governments.
Table I.9 Four areas of public policies to support MSMEs
Areas Instruments
Policies on access to financing Public financial institutions Credit programmes Guarantee funds and companiesEarly-stage financing and venture capital
Policies on modernization and technological innovation
Development of local suppliers of transnational enterprises Sector programmes Business R&D funds Technological funds Technological innovation centres
Policies on productive articulation: industrial agglomerations and clusters
Development of business networks Promotion of cluster competitiveness Local productive systems
Policies on access to new markets and foreign trade facilitation
Export promotion Trade policy and export initiatives International trade financing
Source: Federico Stezano (2013), “Políticas para la inserción de las microempresas and las pequeñas and medianas empresas en cadenas globales de valor en América Latina”, Estudios y Perspectivas Series, No. 146 (LC/MEX/L.1106), Mexico City, ECLAC subregional headquarters in Mexico.
3. Science, technology and innovation policies
Science, technology and innovation policies have also been present over the last few decades in various guises, although the model and the instruments used have changed significantly.

Strengthening value chains… 63
During the import-substitution period in Latin America, a linear approach prevailed in the supply of science, technology and innovation policies. The public sector plays a major role in this model, by identifying priorities for innovation and direct interventions in science and technology activities. The public sector creates a solid institutional infrastructure that turns government agencies, large firms and state universities into key players, promoters of innovation, suppliers of technology and disseminators of knowledge (Cimoli, Ferraz and Primi, 2007).
The linear demand model or approach spread across the region in the 1980s and 1990s in the context of trade-openness policies, liberalization and state downsizing. This approach is characterized by the key role played by private-sector agents and the market in promoting and defining the major technology and innovation strategies. The public sector’s role is limited to correcting market failures between private agents; and it fulfils an articulating and management function, leaving private initiative as the protagonist in promoting innovation (Cimoli, Ferraz and Primi, 2007).
In contrast, policies defined as non-linear or co-evolutionary are not based exclusively on private-sector demand for technology or on the supply of technology by the public sector. Instead they accord a systemic dimension to innovation, in which interactions between the participants in the innovation system determine the technological strategy to be implemented. The government plays a key role in coordinating and articulating the systemic strategy with firms and academia, with no stakeholder in particular assuming leadership of the system (Cimoli, Ferraz and Primi, 2007).
Within a non-linear approach, governments can deploy a wide range of actions and instruments to promote science, technology and innovation, which can be classified in three groups (see table I.10). The first concerns construction of the institutional framework for promoting these three activities, which includes the formation of public agencies such as secretariats, councils and ministries; the preparation of strategic plans; the establishment of mechanisms for coordination among the various areas of government; the definition of a framework for protecting intellectual property, and the application of standardization and quality policies.
The second field of action and instruments involves financing. Public support can be provided through tax incentives specifically targeting R&D activities, or those that can feasibly be used indirectly for this purpose. Support can also be given through direct government subsidies, via contestable funds with or without capacity to distinguish priority sectors or regions. Other available instruments are public guarantees, loans at preferential interest rates, public venture-capital funds and financial support for the commercial exploitation of innovations.

64 ECLAC
Table I.10 Instruments of public science, technology and innovation policies
Institutional framework Science, technology and innovation plans
Evaluation of science, technology and innovation programmes
Technology forecast exercises
Protection of intellectual property
Public programmes and organizations at the regional and sector levels
Mechanisms for coordinating the various public institutions responsible for science, technology and innovation policiesStrategies to promote science, technology and innovation education
Standardization, metrology, accreditation and quality policies
Public procurement policies
Financing Tax incentives
Direct subsidies
Guarantee programmes
Financing under preferential conditions
Venture-capital funds
Funds for the commercialization of innovations
Interaction and dissemination
Promotion of collaborative research between the public and private sectors
Support for exchanges between universities and firms
Promotion of researcher mobility
Support for the creation of technology transfer offices
Scientific and technological parks
Bridge organizations
Dissemination of the importance and usefulness of science, technology and innovationBusiness incubators
Source: Ramón Padilla Pérez, Yannick Gaudin and Patricia Rodríguez, “Sistemas de innovación”, Sistemas de innovación en Centroamérica. Fortalecimiento a través de la integración regional, ECLAC books, No. 118 (LC/G.2559-P), Ramón Padilla Pérez (ed.), Santiago, Chile, 2013, p. 39.
The third group of actions and instruments aims to foster greater interaction between system players and to disseminate technological knowledge. To promote collaboration, programmes can be created that encourage joint research between the public and private sectors, exchange between universities and firms, and mobility among researchers. Governments can also promote interaction by creating Technology Transfer Offices (TTOs) in universities, which facilitate interaction with the private sector and commercialization of the technological knowledge generated in them, and also through the formation of scientific and technological parks using public funds. Another instrument consists of initiatives to publicize the usefulness of science, technology and innovation through seminars, conferences and other activities aimed at fostering a culture of innovation among entrepreneurs and students (Padilla Pérez, Gaudin and Rodríguez, 2013).

Strengthening value chains… 65
G. Conclusions
One of the consequences of the 2008-2009 international financial and economic crisis has been a reawakening of interest in industrial policy, in both theoretical-conceptual and practical terms. Developed and developing countries alike have implemented new strategies that go beyond the horizontal or market-failures approach; and they have committed huge amounts of financial resources to this endeavour. The governments of Latin American countries have also participated, to a greater or lesser extent, in this process of change in national and regional productive development strategies.
The revival of industrial policy is occurring in a new international scenario, constrained by multilateral and bilateral international trade agreements, but where there is still room to implement a wide variety of instruments. Modern industrial policy sees the state as an entity that articulates and promotes development, rather than merely controlling the main economic activities. The integrated industrial policy approach proposed in this chapter advocates structural change based on upgrading towards activities and sectors of higher productivity and greater technological intensity. In the ECLAC vision, the main objective of this transformation is to achieve economic and social development with equality.
Industrial policy has been ever-present in the decades since World War II. In the 1980s and 1990s, different approaches and instruments were adopted, but direct and indirect support for selected sectors (such as manufacturing and exports), the financing of business R&D, and technical and financial assistance to MSMEs were permanent features. Official discourse notwithstanding, even the United States and European countries, which have advocated no government intervention in economic activities, have actually provided major support to industries that are crucial to their economies (for example, aeronautics and the automotive industry). In contrast, the Asian countries have adopted a more pragmatic approach by implementing broad-scope industrial policies.
The revival of industrial policy in Latin America also coincides with a climate of greater pragmatism. Economic performance in recent decades has been insufficient both in terms of growth and in reducing poverty and inequality; and the empirical evidence shows the need for an active and integrated industrial policy to achieve deep structural change.
This chapter has summarized the main theoretical and conceptual elements of industrial policy, and has put forward empirical evidence of its importance for structural change. The application of these concepts, in conjunction with the lessons that can be drawn from experiences in other regions, represent just one input in supporting the task facing the

66 ECLAC
countries of the region: the design and application of policies that are consistent with the economic, social and productive scenario. The chapter has also described the context in which policies to strengthen value chains operate, which is discussed further in the following chapters.
Bibliography
Agosín, Manuel and Roberto Machado (2005), “Foreign investment in developing countries: does it crowd in domestic investment?”, Oxford Development Studies, vol. 33, No. 2, Taylor & Francis.
Altenburg, Tilman, Wolfgang Hillebrand and Jörg Meyer-Stamer (1998), “Building systemic competitiveness”, Reports and Working Papers, No. 3/1998, Berlin, German Development Institute.
Aparicio, Abraham (2013), “Historia económica mundial siglos XVII-XIX: Revoluciones burguesas y procesos de industrialización”, Economía Informa, No. 378, January-February.
Aquino, Carlos (2000), Introducción a la economía asiática, Lima, National University of San Marcos, Faculty of Economic Sciences.
Bark, Taeho (1991), “The Korean consumer electronics industry. Reaction to antidumping actions”, Policy Research Working Paper Series, No. 781, Washington, D.C., World Bank, October.
Bianchi, Patrizio and Sandrine Labory (2011), Industrial Policy after the Crisis: Seizing the Future, Cheltenham, Edward Elgar.
Bielschowsky, Ricardo, Miguel Izam and Nanno Mulder (2011), “Dos estudios de la evolución del pensamiento de la CEPAL sobre la diversificación productiva y la inserción internacional (1949-2008)”, Comercio Internacional series, No. 112 (LC/L.3415), Santiago, Chile, Economic Commission for Latin America and the Caribbean (ECLAC).
Buigues, Pierre-André and Khalid Sekkat (2009), Industrial Policy in Europe, Japan and the USA: Amounts, Mechanisms and Effectiveness, Basingstoke, Palgrave Macmillan.
Chang, Ha-Joon (2012), “Debate: should industrial policy in developing countries conform to comparative advantage or defy it?”, New Structural Economics. A Framework for Rethinking Development and Policy, Justin Yifu Lin, Washington, D.C., World Bank.
___(2003), Globalization, Economic Development and the Role of the State, London, Zed Books.
Cimoli, Mario, Giovanni Dosi and Joseph E. Stiglitz (2009), Industrial Policy and Development: The Political Economy of Capabilities Accumulation, Oxford, Oxford University Press.
Cimoli, Mario, João Carlos Ferraz and Annalisa Primi (2005), “Science and technology policies in open economies: the case of Latin America and the Caribbean”, Desarrollo Productivo series, No. 165 (LC/L.2404), Santiago, Chile, Economic Commission for Latin America and the Caribbean (ECLAC). E.05.II.G.151.
Cohen, W.M., R. Nelson and J. Walsh (2002), “Links and impacts: the influence of public research on industrial R&D”, Management Science, vol. 48, No. 1, Hanover, Maryland, INFORMS.

Strengthening value chains… 67
Cordera, Rolando (2009), “Sobre la ecuación pendiente de América Latina: Una revisión de las ideas de la “orden cepalina del desarrollo””, Globalización, conocimiento y desarrollo, Jorge Basave and Miguel A. Rivera (coords.), National Autonomous University of Mexico, March.
Crafts, Nicholas F. (1996), “The first industrial revolution: a guided tour for growth economists”, The American Economic Review, vol. 86, No. 2, Nashville, Tennessee, American Economic Association.
Devlin, Robert and Graciela Moguillansky (2013), “What’s new in the new industrial policy in Latin America?”, Policy Research Working Paper, No. 6191, Washington, D.C., World Bank.
Di Maio, Michele (2009), “Industrial policies in developing countries: history and perspectives”, Industrial Policy and Development: The Political Economy of Capabilities Accumulation, Mario Cimoli, Giovanni Dosi and Joseph E. Stiglitz, New York, Oxford University Press.
Dorn, Joseph W. and Christopher Cloutier (2013), Report on Chinese Industrial Policies, King & Spalding.
ECLAC (Economic Commission for Latin America and the Caribbean) (2013), Economic Survey of Latin America and the Caribbean 2013 (LC/G.2574-P), Santiago, Chile. United Nations publication, Sales No. E.13.II.G.3.
___(2012), Structural Change for Equality: An Integrated Approach to Development. Summary (LC/G.2525(SES.34/4)), Santiago, Chile.
___(2010), Time for Equality: Closing Gaps, Opening Trails. Summary (LC/G.2433(SES.33/4)), Santiago, Chile.
___(2008), Structural Change and Productivity Growth, 20 Years Later: Old Problems, New Opportunities. Summary (LC/G.2368(SES.32/4)), Santiago, Chile.
___(2007), Foreign Investment in Latin America and the Caribbean 2006 (LC/G.2336-P), Santiago, Chile. United Nations publication, Sales No. E.07.II.G.32.
___(2004), Productive development in open economies (LC/G.2234(SES.30/3)), Santiago, Chile.
Evans, P. (1996), “El Estado como problema y como solución”, Desarrollo Económico, vol. 35, No. 140, Buenos Aires, Institute of Economic and Social Development (IDES).
Executive Office of the President of the United States (2009), A Framework for Revitalizing American Manufacturing, Washington, D.C., December [online] http://www.whitehouse.gov/sites/default/files/microsites/20091216-maunfacturing -framework.pdf.
Freeman, C. (1982), “Technological infrastructure and international competitiveness”, Industrial and Corporate Change, vol. 13, No. 3, Oxford University Press.
Gligo, Nicolo (2007), “Políticas activas para atraer inversión extranjera directa en América Latina y el Caribe”, Desarrollo Productivo series, No. 175 (LC/L.2667-P), Santiago, Chile, Economic Commission for Latin America and the Caribbean (ECLAC). United Nations publication, Sales No. S.07.II.G.18.
Hausmann, Ricardo and Bailey Klinger (2007), “The structure of the product space and the evolution of comparative advantage”, CID Working Paper, No. 146, Center for International Development, Harvard University, April.
Hernández, René A. and Claudia Schatan (2002), “Políticas de competencia y de regulación en el Istmo Centroamericano”, Estudios y Perspectivas series, No. 11 (LC/MEX/L.544/E), Mexico City, ECLAC subregional headquarters in Mexico. United Nations publication, Sales No. S.02.II.G.17.

68 ECLAC
Hoekman, B., A. Mattoo and P. English (eds.) (2002), Development, Trade, and the WTO, Washington, D.C., World Bank.
Humphrey, J. and H. Schmitz (2002), “How does insertion in global value chains affect upgrading in industrial clusters?”, Regional Studies, vol. 36, No. 9, Taylor & Francis.
IHS Inc. (Electronics & Media Market Intelligence) (2013), “Disruption in Korean Production Could Have Catastrophic Impact on Global Electronics Business”, Press Release, April [online] http://www.isuppli.com/Memory-and-Storage/News/Pages/Disruption-in-Korean-Production-Could-Have-Catastrophic-Impact-on-Global-Electronics-Business.aspx.
Kim, Youngbae and Byungheon Lee (2002), “Patterns of technological learning among the strategic groups in the Korean electronic parts industry”, Research Policy, vol. 31, No. 4, Amsterdam, Elsevier, May.
Kosacoff, Bernardo and Adrián Ramos (1999), “The industrial policy debate”, CEPAL Review, No. 68 (LC/G.2039-P), Santiago, Chile, Economic Commission for Latin America and the Caribbean (ECLAC).
Lall, Sanjaya (1993), “Understanding technology development”, Development and Change, vol. 24, No. 4, Wiley.
Lin, Justin Yifu (2012), New Structural Economics. A Framework for Rethinking Development and Policy, Washington, D.C., World Bank.
Llisterri, J. and C. Pietrobelli (eds.) (2011), Los sistemas regionales de innovación en América Latina, Washington, D.C., Inter-American Development Bank.
Lundvall, B.A. and others (2009), Handbook of Innovation Systems and Developing Countries, London, Edward Elgar Publishing.
Machinea, J.L. and C. Vera (2006), “Comercio, inversión directa y políticas productivas”, Informes y Estudios Especiales series, No. 16 (LC/L.2469-P), Santiago, Chile, Economic Commission for Latin America and the Caribbean (ECLAC). United Nations publication, Sales No. S.05.II.G.216.
Maloney, William and Guillermo Perry (2005), “Towards an efficient innovation policy in Latin America”, CEPAL Review, No. 87 (LC/G.2287-P), Santiago, Chile, Economic Commission for Latin America and the Caribbean (ECLAC).
Mata, Héctor (2009), “Comercio internacional y desempeño económico. Indicadores seleccionados para economías pequeñas” (LC/MEX/L.928), Mexico City, ECLAC subregional headquarters in Mexico.
Mercado, Alfonso (2010), “Los compromisos adquiridos en acuerdos de libre comercio bilaterales y multilaterales y los espacios para una política industrial en México y Centroamérica” (LC/MEX/L.999), Mexico City, ECLAC subregional headquarters in Mexico.
Moran, T. (2000), Inversión extranjera directa y desarrollo: Nueva agenda política para países en vías de desarrollo y economías en transición, Oxford University Press.
Naudé, Wim (2010), “Industrial policy: old and new Issues”, WIDER Working Paper, No. 106, Helsinki, World Institute for Development Economics Research (WIDER), September.
OECD (Organisation for Economic Cooperation and Development) (2013), “Science, Technology and R&D Statistics” [online] http://www.oecd-ilibrary.org/science-and-technology/data/oecd-science-technology-and-r-d-statistics_strd-data-en.
OECD/ECLAC (Organisation for Economic Cooperation and Development/Economic Commission for Latin America and the Caribbean) (2012), Perspectivas económicas de América Latina 2013. Políticas de PYMES para el cambio estructural, Paris, OECD Development Centre.
Strengthening value chains… 69
Padilla Pérez, R. and J. Martínez-Piva (2009), “Export growth, foreign direct investment and technological capability building under the maquila model: winding roads, few intersections”, Science and Public Policy, vol. 36, No. 4, Oxford University Press.
Padilla Pérez, Ramón, Yannick Gaudin and Patricia Rodríguez (2013), “Sistemas de innovación”, Sistemas de innovación en Centroamérica. Fortalecimiento a través de la integración regional, Libros de la CEPAL, No. 118 (LC/G.2559-P), R. Padilla Pérez (ed.), Santiago, Chile, Economic Commission for Latin America and the Caribbean (ECLAC). United Nations publication, Sales No. S.13.II.G.18.
Park, S.O. (2002), “Innovation systems, networks, and the knowledge-based economy in Korea”, Regions, Globalization and the Knowledge-Based Economy, J. Dunning (ed.), Oxford University Press.
Pavitt, K. (1984), “Sectoral patterns of technical change: towards a taxonomy and a theory”, Research Policy, vol. 13, No. 6, Amsterdam, Elsevier.
Peres, Wilson (2006), “The slow comeback of industrial policies in Latin America and the Caribbean”, CEPAL Review, No. 88 (LC/G.2289-P/E), Santiago, Chile, Economic Commission for Latin America and the Caribbean (ECLAC).
Peres, Wilson and Annalisa Primi (2009), “Theory and practice of industrial policy: evidence from the Latin American experience”, Desarrollo Productivo series, No. 187 (LC/L.3013-P), Santiago, Chile, Economic Commission for Latin America and the Caribbean (ECLAC). United Nations publication, Sales No. E.09.II.G.34.
Pollin, Robert and Dean Baker (2009), “Public investment, industrial policy and U.S. economic renewal”, Working Paper Series, No. 211, Washington, D.C., Political Economy Research Institute, Center for Economic and Policy Research, December.
Robson, M., J. Townsend and K. Pavitt (1988), “Sectoral patterns of production and use of innovation in the U.K.: 1943-1983”, Research Policy, vol. 17, No. 1, Amsterdam, Elsevier.
Rodrik, Dani (2004), “Industrial policy for the twenty-first century”, Working Papers Series, No. rwp04-047, John F. Kennedy School of Government, Harvard University.
Saxenian, A. (1990), “Regional networks and the resurgence of Silicon Valley”, California Management Review, vol. 33, No. 1.
Schmitz, H. (1995), “Collective efficiency: growth path for small-scale industry”, Journal of Development Studies, vol. 31, No. 4, Taylor & Francis.
Stezano, Federico (2013), “Políticas para la inserción de las microempresas y las pequeñas y medianas empresas en cadenas globales de valor en América Latina”, Estudios y Perspectivas series, No. 146 (LC/MEX/L.1106), Mexico City, ECLAC subregional headquarters in Mexico.
Stezano, Federico and Ramón Padilla Pérez (2013), “Governance and coordination between federal and state-level innovation and competitiveness policies in Mexico”, Technical Note, No. 512, Washington, D.C., Inter-American Development Bank (IDB).
Stiglitz, Joseph E. (1996), “Some lessons from the East Asian miracle”, World Bank Research Observer, vol. 11, No. 2, Oxford University Press.
The White House (2013), “Fact Sheet: The President’s Plan to Make America a Magnet for Jobs by Investing in Manufacturing”, Office of the Press Secretary, February [online] http://www.whitehouse.gov/the-press-office/2013/02/13/fact-sheet-president-s-plan-make-america-magnet-jobs-investing-manufactu.

70 ECLAC
UNCTAD (United Nations Conference on Trade and Development) (2002), World Investment Report 2002: Transnational Corporations and Export Competitiveness (UNCTAD/WIR/2002), Geneva. United Nations publication, Sales No. E.02.II.D.4.
UNDP (United Nations Development Programme) (2013), “Human Development Reports” [online] http://www.undp.org/content/undp/en/home/librarypage/hdr/.
UNESCO (United Nations Educational, Scientific and Cultural Organization) (2013), “Statistical Yearbook” [online] http://stats.uis.unesco.org/unesco/tableviewer/document.aspx?ReportId=143.
UNIDO/UNU (United Nations Industrial Development Organization/United Nations University) (2012), Structural Change, Poverty Reduction and Industrial Policy in the BRICS, Vienna.
USPTO (United States Patent and Trademark Office) (2013), “Patents by country, state, and year” [online] http://www.uspto.gov/web/offices/ac/ido/oeip/taf/cst_all.htm.
Watal, Jayashree (2002), “Implementing the TRIPS Agreement”, Development, Trade, and the WTO, B. Hoekman, A. Mattoo and P. English (eds.), Washington, D.C., World Bank.
World Bank (2013), “World Development Indicators” [online] http://data.worldbank.org/news/new-suite-of-world-development-Indicators-products-now-available.
WTEC (World Technology Evaluation Center) (1997), “WTEC Report on The Korean Electronics Industry. Executive Summary” [online] http://www.wtec.org/loyola/kei/welcome.htm.
Zamagni, Vera (2001), Historia económica de la Europa contemporánea: de la Revolución Industrial a la integración contemporánea, Crítica, January.

Chapter II
Methodology of the ECLAC-GIZ project for the design of value chain
strengthening strategiesNahuel Oddone
Ramón Padilla PérezBruno Antunes
A. Introduction
This chapter describes the methodology used to strengthen value chains in Central America, as developed by the ECLAC subregional headquarters in Mexico. The methodology is based on previous work done by ECLAC in Buenos Aires,1 and on a systemization of the tools used by the Commission in various processes of technical support provided to countries in the Central American subregion. The chapter focuses particularly on the stages of diagnosis, analysis of best practices and preparation of strategies.
Recent years have seen a revival of the importance of industrial policies in Latin America, together with increasing interest in striking a new balance between state, market and society (ECLAC, 2012), as analysed in chapter I of this volume. This reawakening of interest has highlighted the role of innovation and human-capital strengthening in closing the technological gap with respect to the more developed economies; creating more job opportunities; increasing the value-added of local production; preventing the re-primarization of exports and production duality (where
1 ECLAC worked with the Ministry of Industry of the Argentine Republic on the diagnostic study, analysis of policies and generation of spaces for debate on issues including production development, job creation and social inclusion. Work was done with 11 production chains drawn from the 13 included in the 2020 Industrial Strategic Plan launched by the Argentine government in October 2011. The volume compiled by Stumpo and Rivas (2013) reports the key outcomes of this process.

72 ECLAC
technologically modern and internationally competitive firms coexist with others that are more backward and of lower productivity); and strengthening the linkage between export performance and economic growth, based on an increase in business productivity in general, and in that of micro, small and medium-sized enterprises (MSMEs) in particular.
Latin America’s production and export structures are generally not oriented towards the most dynamic production sectors, or those of high technological content (Cimoli, 2005; Hausmann and others, 2005; Kosacoff and López, 2008). ECLAC has highlighted the importance of structural change in achieving economic and social development with equality —a change that is understood as a transition towards activities and sectors that achieve more dynamic productivity gains and make more intensive use of technological knowledge (ECLAC, 2012).
The design of participatory strategies to strengthen value chains is a very useful tool for implementing industrial policies, because it makes it possible to identify specific and targeted intervention actions.
More active participation in national, regional and global value chains would enable local firms to increase their productivity and upgrade their contribution in the international division of labour that currently prevails in the world economy (Kosacoff and López, 2008). At the microeconomic level, value chain strengthening would produce several benefits, such as the forging of new relations between entrepreneurs, better-quality production (for example, optimization of the sustainable use of certain raw materials or resources), increases in competitiveness2 and the export capacity of firms,3 and additional financing for business projects and local economic development by the private and public sectors.
Value chain strengthening that involves integrating local producers into regional and global value chains has a significant impact in terms of improving their economic and social conditions and enhancing the immediate environment.
The methodology described in this chapter, the application of which was supported financially by the German International Cooperation
2 Competitiveness can be defied in many ways. This interpretation used in this chapter follows Fajnzylber (1990), for whom authentic competitiveness is achieved through a series of productivity increases, requiring continuous technical progress, greater product differentiation, the incorporation of technological innovations, the introduction of new forms of business organization and the linkage of production chains, to enhance the efficiency of the production cycle.
3 Participation by local firms in global value chains helps to invigorate competitiveness, because the firms have to face more exacting demand (the process of learning by exporting); and it can also stimulate the development of new learning processes stemming from the relations established with other agents in the chain (the process of learning by interacting) (Kosacoff and López, 2008).

Strengthening value chains… 73
Agency (GIZ), is inherently participatory, involving the creation of dialogue mechanisms. The results of the various stages of the process are presented and debated at meetings held with the main stakeholders in each value chain, which makes it possible to significantly enrich the process, strengthen commitments, facilitate agreements, and promote more transparent decision-making. The articulation of the public and private sectors enables stakeholders to access more demanding markets, stimulates closer linkage between institutions involved in research and development (R&D) activities, and strengthens relations with entities that provide services and inputs.
The chapter is organized in five sections including this introduction. Section B presents a conceptual approach to value chains and their importance for policymaking; and section C describes the six stages of the methodology used in the ECLAC-GIZ project on strengthening value chains in Central America. Section D describes the elements needed to prepare diagnostic studies focused on identifying constraints and opportunities; and section E discusses the process of analysing best practices in the value chain, in relation to the constraints and opportunities that emerge from the diagnostic assessment. Section F concludes the chapter by setting out the central issues that need to be considered when preparing value chain strengthening strategies.
B. Value chains and their importance for public policy
1. What are value chains?
Irrespective of their size, all firms participate in at least one local value chain; even a subsistence farmer purchases inputs (seeds, tools, fertilizers and so forth), which entails interaction with other links in the chain. Firms that export, whether directly or indirectly, also participate in regional or global value chains.
A value chain encompasses the whole range of activities needed for a product or service to move through the different stages of production, from its original design through to its delivery to consumers and final disposal after use (Kaplinsky and Morris, 2002). Each of the stages —conception and design, production of the good or service, transport of the merchandise, consumption and handling, and final recycling— are generally referred to as links. The number of links comprising a value chain varies greatly according to the type of industry and the activities or links in the chain that can be undertaken by one or several firms (Kaplinsky, 2000).
Global value chains are the outcome of a new pattern of production based on production de-localization linked to dynamic final markets, which may be national (located in urban centres), regional (neighbouring countries) or global (the main consumption markets).
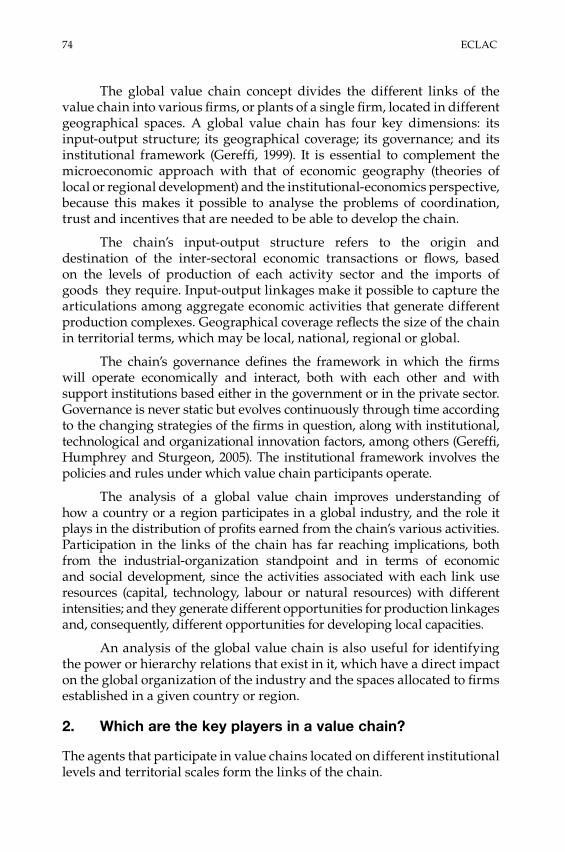
74 ECLAC
The global value chain concept divides the different links of the value chain into various firms, or plants of a single firm, located in different geographical spaces. A global value chain has four key dimensions: its input-output structure; its geographical coverage; its governance; and its institutional framework (Gereffi, 1999). It is essential to complement the microeconomic approach with that of economic geography (theories of local or regional development) and the institutional-economics perspective, because this makes it possible to analyse the problems of coordination, trust and incentives that are needed to be able to develop the chain.
The chain’s input-output structure refers to the origin and destination of the inter-sectoral economic transactions or flows, based on the levels of production of each activity sector and the imports of goods they require. Input-output linkages make it possible to capture the articulations among aggregate economic activities that generate different production complexes. Geographical coverage reflects the size of the chain in territorial terms, which may be local, national, regional or global.
The chain’s governance defines the framework in which the firms will operate economically and interact, both with each other and with support institutions based either in the government or in the private sector. Governance is never static but evolves continuously through time according to the changing strategies of the firms in question, along with institutional, technological and organizational innovation factors, among others (Gereffi, Humphrey and Sturgeon, 2005). The institutional framework involves the policies and rules under which value chain participants operate.
The analysis of a global value chain improves understanding of how a country or a region participates in a global industry, and the role it plays in the distribution of profits earned from the chain’s various activities. Participation in the links of the chain has far reaching implications, both from the industrial-organization standpoint and in terms of economic and social development, since the activities associated with each link use resources (capital, technology, labour or natural resources) with different intensities; and they generate different opportunities for production linkages and, consequently, different opportunities for developing local capacities.
An analysis of the global value chain is also useful for identifying the power or hierarchy relations that exist in it, which have a direct impact on the global organization of the industry and the spaces allocated to firms established in a given country or region.
2. Which are the key players in a value chain?
The agents that participate in value chains located on different institutional levels and territorial scales form the links of the chain.

Strengthening value chains… 75
The value chain’s key actors participate directly in the provision of inputs, production, processing, transport and marketing, and are therefore firms forming part of the links. Public and private suppliers of services support the chain’s operations, including packaging and handling, certification and financial support, except where other chain participants undertake those activities.
Government agencies, industrial associations, universities and international organizations, among other entities, provide support activities and interventions to strengthen the value chain, such as specific training actions in relation to production and dealing with international quality standards, the supply of market information, and advice on business planning.
These agents carry out their actions in an international setting that encompasses the regulatory framework, national and subnational policies, trade regimes, interventions in the market, the infrastructure of the territory in question and available information sources —all of which affect the performance of value chains.
3. What types of value chain exist?
Value chains can be classified under various criteria, of which four are presented below, illustrating the diversity and complexity of the chains4.
(i) By number of actors: each value chain is distinguished by its number of participants. For example, actors in automotive-industry value chains need to purchase numerous different products or intermediate goods, which they obtain from an extensive network of suppliers. In other chains, such as herbs and spices, while there may be many different producers, they all provide a similar type of product. In contrast, in the mining value chain there are often only a few suppliers.
(ii) By the agents that determine its governance: an initial distinction can be made between value chains that are buyer-driven, and those which are supplier driven. There are also other forms of governance, for example those with very loosely coordinated governance structures, commercial structures based on the market, intensely coordinated or vertically integrated (Gereffi, 1994).
(iii) By its operation: national value chains, in which the products are only sold in the country in which they are produced, can be distinguished from regional and global value chains where the product is processed and marketed in different countries.
(iv) By the degree of product processing: some products, such as fresh fruit, only require a few processing steps in the value
4 See UNIDO (2009a and 2009b) for further details.

76 ECLAC
chains, whereas others, such as cotton, may pass through many stages. The degree of processing is also closely related to the sophistication of the technology used. Some value chains only use traditional knowledge (such as certain craft products), whereas others use leading-edge technologies (the semiconductor industry for example).
4. Why is it important to study the governance of a value chain?
Studying the governance of value chains makes it possible to analyse the mechanisms, processes and rules through which firms relate economically with each other, and with the government and other stakeholders. The study of value chain governance seeks to identify the factors that determine the behaviour of chain participants, based on the types of links and relations that are established between them, in conjunction with the explicit and tacit rules under which they operate.
When analysing the governance of a value chain, it is helpful to ask a number of questions, for example in relation to the structure on which agents act, and which members exert the greatest power and influence; how the incentive system operates; what regulations are imposed on members of the chain; what effect do social and cultural conditions have in relation to forms and types of production; and what impact do they have on the generation and transfer of new technologies.
The analyses conducted by Gereffi, Humphrey and Sturgeon (2005) distinguish five types of value chain governance, which differ according to a trilogy of attributes: the complexity of the information and knowledge needed to complete a transaction according to product and process specifications; the degree to which this information and knowledge can be codified and thus be efficiently transmitted without the need for a specific investment by the parties to the transaction; and the capacities of current and potential suppliers in relation to the requirements of the transaction. The authors recognize the following types of governance: (i) markets, where firms and individuals buy and sell products with little interaction apart from the exchange of goods and services; (ii) modular value chains, in which the suppliers make products or provide services to meet customer specifications; (iii) relational value chains, in which a relatively small group of localized firms interact and share knowledge intensively, with support from partners in the global value chain; (iv) “captive” value chains, where small-scale producers tend to be dependent on large buyers, which in turn maintain a high level of oversight and control; and (v) hierarchical value chains, characterized by vertical integration, in other words by “transactions” that take place within a single firm and its subsidiaries and which have a dominant type of governance (see table II.1).

Strengthening value chains… 77
Tabl
e II.
1 Ty
pes
of v
alue
cha
in g
over
nanc
e an
d th
eir k
ey c
hara
cter
istic
s
Type
of
gove
rnan
ceC
hara
cter
istic
sC
ompl
exity
of
the
trans
actio
nsA
bilit
y to
cod
ify
trans
actio
ns
Cap
aciti
es in
th
e su
pplie
r ba
se
Deg
ree
of e
xplic
it co
ordi
natio
n an
d po
wer
as
ymm
etrie
s
Mar
kets
Mar
ket l
inks
are
not
nec
essa
rily
trans
itory
, as
tend
s to
be
the
case
in
“ove
r-th
e-co
unte
r” m
arke
ts (w
here
pur
chas
es a
re p
aid
for i
mm
edia
tely
in
cas
h); b
ut th
ey c
an b
e re
peat
ed th
roug
h tim
e w
ith re
curr
ent
trans
actio
ns. T
he k
ey fe
atur
e is
that
the
cost
s of
sw
itchi
ng to
new
pa
rtne
rs a
re lo
w fo
r bot
h pa
rtie
s.
Low
Hig
hH
igh
Low
Mod
ular
va
lue
chai
nsS
uppl
iers
pro
duce
pro
duct
s to
mee
t det
aile
d cu
stom
er s
peci
ficat
ions
. N
onet
hele
ss, w
hen
they
pro
vide
“tur
nkey
” ser
vice
s, s
uppl
iers
take
re
spon
sibi
lity
for t
he s
kills
sur
roun
ding
pro
cess
tech
nolo
gies
, use
ge
neric
mac
hine
ry th
at li
mits
the
inve
stm
ents
on
the
trans
actio
n, a
nd
unde
rtak
e ca
pita
l exp
endi
ture
for c
ompo
nent
s on
the
cu
stom
er’s
beh
alf.
Hig
hH
igh
Hig
h
Rel
atio
nal
valu
e ch
ains
Net
wor
ks th
at in
volv
e co
mpl
ex in
tera
ctio
ns b
etw
een
selle
rs a
nd
buye
rs, w
hich
tend
to c
reat
e m
utua
l dep
ende
ncie
s an
d hi
gh le
vels
of
good
s sp
ecifi
catio
n. T
hat c
ompl
exity
is m
anag
ed th
roug
h re
puta
tion,
th
e fa
mily
, or e
thni
c lin
ks.
Hig
hLo
wH
igh
“Cap
tive”
va
lue
chai
nsIn
thes
e ne
twor
ks, s
mal
l-sca
le s
uppl
iers
rely
on
the
trans
actio
ns o
f la
rge
buye
rs; a
nd, a
s th
ey fa
ce h
igh
cost
s of
cha
nge,
they
are
cap
tive.
Th
ese
netw
orks
are
cha
ract
eriz
ed b
y a
high
leve
l of m
onito
ring
and
cont
rol b
y th
e le
ader
ent
erpr
ises
.
Hig
hH
igh
Low
Hie
rarc
hica
l va
lue
chai
nsFo
rm o
f gov
erna
nce
char
acte
rized
by
vert
ical
inte
grat
ion
and
man
agem
ent c
ontro
l, fro
m m
anag
ers
to s
ubor
dina
tes,
or f
rom
pa
rent
com
pani
es to
sub
sidi
arie
s or
affi
liate
s.H
igh
Low
Low
Hig
h
So
urce
: Fe
der
ico
Ste
zano
, “P
olíti
cas
par
a la
ins
erci
ón d
e la
s m
icro
emp
resa
s an
d l
as p
eque
ñas
and
med
iana
s em
pre
sas
en c
aden
as g
lob
ales
de
valo
r en
Am
éric
a La
tina”
, E
stud
ios
and
Per
spec
tivas
ser
ies,
No.
146
(LC
/L.3
700)
, M
exic
o C
ity,
EC
LAC
sub
regi
onal
hea
dq
uart
ers
in M
exic
o, 2
013,
on
the
bas
is o
f G
eref
fi an
d
othe
rs (2
005)
.

78 ECLAC
5. Why is the value chain approach relevant?
In the search for structural change in Latin America that promotes development with equity (ECLAC, 2012), value chain strengthening makes it possible to diversify production and expand participation in the most knowledge-intensive segments of the production structure or where demand is growing fastest.5 At the same time, it tends to reduce the structural heterogeneity that is characteristic of Latin American economies, through a type of spillover effect caused by the integration and addition of new links and services in a chain.6
ECLAC views structural change as stemming from the interaction of two interrelated forces: (i) innovation, broadly defined as the emergence of new activities and the way they are implemented; and, in particular, the learning needed to effectively exploit their opportunities in the economy; and (ii) the links that cause an innovation or learning in an activity to generate innovations in other complementary activities (ECLAC, 2013a). The combination of learning and linkages explains the existence of dynamic economies of specialization and scale, which are decisive for increases in productivity, competitiveness and employment at the aggregate level (ECLAC, 2013a).
One of the main objectives of supporting value chains is to take advantage of their potential to increase productivity (generation of economies of scale, access to new technologies and information, and MSME strengthening), and to consolidate the relationship between export expansion and economic growth,7 which should result in more and better jobs, higher wages and better conditions (social development).8
As a factor promoting virtuous structural change, participation in value chains creates new sectors or activities (either in or between links)
5 The combination of these two types of efficiency in the production structure is referred to as dynamic efficiency, because it generates higher rates of growth in productivity, innovation and employment (ECLAC, 2012).
6 ECLAC defines the term “structural heterogeneity” as the co-existence in a single economy of sectors and firms that are highly productive with a relatively heavy presence of low-productivity sectors and firms (ECLAC, 2012).
7 Numerous studies, several of them done by ECLAC, examine the weakness of the link between export performance and economic growth in the Central American subregion. The main reasons adduced to explain this phenomenon include, firstly, the lack of production linkages between local enterprises and large, mainly transnational, exporting firms; and, secondly, the low technological complexity of the production processes undertaken in the subregion, even when these form part of industries that are considered high-tech (Padilla Pérez and others, 2008; ECLAC, 2008).
8 Various authors, such as Rossi (2013) and Barrientos, Gereffi and Rossi (2011), have analysed the impact of value chain strengthening, particularly their integration into global chains, in the so-called social and economic upgrading of producers and their immediate economic surroundings.
Strengthening value chains… 79
which absorb the reserve of workers in jobs that aim to be more productive, of better quality, and higher paid. This seeks to break the link that exists between structural heterogeneity and income inequality in the labour market. Clearly, to ascertain whether stimulating value chains contributes to structural change, it is necessary to analyse how productivity and employment levels change through time.
The most important benefits to be obtained from the participation by firms in value chains are as follows: (i) the preservation and strengthening of the industrial fabric; (ii) job creation; (iii) the promotion of business productivity and competitiveness; (iv) the integration of MSMEs in new value-creating productive processes;9 (v) the attraction of new capital and implementation of new investments;10 (vi) the creation of horizontal networks11 or supply networks;12 (vii) an increase in tax revenue; and (viii) an improvement in the relation between the public and private sectors aimed at generating local production systems based on conglomerates.
Nonetheless, these benefits are not the spontaneous and immediate outcome of the process of integrating into value chains (whether local, regional or global); they require various factors to be functioning adequately, such as the system of relations between agents, support institutions, spaces for appropriating value-added and, in general, the governance of the chain. For this reason, policies to support value chains need to create conditions to ensure a successful integration for the production agents facing the greatest constraints.
Deepening existing production linkages and stimulating the formation of new ones, combined with the incorporation of technological innovations, makes it possible to upgrade to more complex activities within the global value chain (ECLAC, 2013a). Possibilities for upgrading depend on the type of governance that characterizes the chain, and also on the local techno-economic factors required by firms to be able to develop. There are six factors to consider: (i) macroeconomic and institutional stability; (ii) current public policies and the incentive system; (iii) the availability of human resources; (iv) the existence of other consolidated
9 MSMEs benefit from the generation of global value chains through: (i) greater bargaining power with customers and suppliers; (ii) better access to technology, financing and marketing systems; (iii) the creation of economies of scale through joint purchasing; (iv) collaboration between firms (equipment hire) and the “nationalization” of the production procedure; (v) a reduction in direct and indirect costs; and (vi) general improvements in management and marketing processes.
10 On this point, see López and Ramos (2010).11 The organization and development of horizontal business networks is understood as the
process of building trust between the people that lead similar firms (in size and production activity), with a view to undertaking joint actions that contribute to their competitive growth.
12 These seek to maintain formal and informal communication between the customer firm and its suppliers, along with integrated development of the capacities of the supplier firms.

80 ECLAC
clusters; (v) technological capacities and their absorption by domestic firms; and (vi) the functioning of national innovation systems and the availability of infrastructure (Humphrey and Schmitz, 2002; Gereffi, Humphrey and Sturgeon, 2005; Giuliani, Pietrobelli and Rabellotti, 2005; Morrison, Pietrobelli and Rabellotti, 2006; Kosacoff and López, 2008).
Value chain analysis allows for detailed research into the value-creation processes that take place in each link, and the relation between them and the structure of the chain, even though they may belong to different sectors. Unlike the sector approach, the study of chains makes it possible to analyse agents, links and processes more closely, with a view to identifying the constraints and opportunities for their development, including their internationalization. The proposed methodology makes it possible to more clearly and precisely analyse the opportunities that exist for greater integration of domestic value-added and the strengthening of process and product innovation.
The value chain approach is intrinsically systemic and integrated, with capacity to generate valuable sources of information for decision-making on industrial policy, increasing value-added, and inter-sectoral and territorial articulations aimed at reducing social and territorial asymmetries. It is also a fundamental tool of technical analysis for policy decisions regarding the incorporation of new agents into production processes, the promotion of specialization and diversification, the creation of sources of employment, and the reduction of productive heterogeneity, territorial asymmetries and inequality in Latin America and the Caribbean.
The value chain strengthening methodology has at least four benefits in the process of formulating public policies:
(i) It makes it possible to identify constraints and opportunities at the micro level, which are the basis for designing specific lines of strategy to strengthen all participants. The value chain approach offers detailed information on the participants in each link, and the relations between them, thereby making it easier to target public resources.
(ii) The methodology aims to forge partnerships or agreements between the public and private sectors for strengthening the chain. Using a participatory methodology and public dialogue mechanisms, the aim is to reach consensuses enabling different actors in the chain to commit to the process.
(iii) The stakeholder dialogues allow for discussion of the diagnostic assessments and strategies, which strengthens the legitimacy and transparency of public policymaking.

Strengthening value chains… 81
(iv) The technical support provided to governments by ECLAC during the process allows for the designed methodology to be transferred and additional capacities to be developed in civil servants to replicate the exercise in other chains.
6. Strengthening of relations between the public and private sectors
An effective strategy for strengthening value chains involves the formation of public-private partnerships. Processes of this type contribute to the alignment of targets and programmes and the forging of commitments among all stakeholders. This type of partnership has been considered from the ECLAC standpoint as a strategic articulation for development (Devlin and Moguillansky, 2010).
When the public and private sectors work together they can increase capacity to overcome the constraints that hold back the upgrading of production activity, innovation and exports (ECLAC, 2008). Such collaboration enables the public and private sectors to define and implement a production development agenda. In this, private-sector agents usually participate as advisers in the design, execution, monitoring and evaluation of public policies and programmes, legislation, regulations and technical specifications related to production development (ECLAC, 2008).
A key element in the value chain strengthening methodology is the construction of stakeholder dialogues between chain participants, and between them and the support organizations. Such spaces constitute a process of communication and cooperation among the different actors that are relevant to a given topic and who need to collaborate for their mutual development and for the development of the relational system to which they belong (identification of solutions and their application).
A stakeholder dialogue mechanism provides the opportunity for conversation around a well-defined objective to identify and implement solutions that are not achievable individually. Stakeholder dialogues offer a platform for collaboration in the exchange of ideas and fluid application of courses of action. They may also be viewed as mechanisms for public policy consultation or suggestions.
The methodology proposes the organization of roundtables, convened by the organized public and private sectors and involving the various actors in the value chain, to validate and enhance the strategy-design process. The dialogue enhances the analysis and formulation of strategies, while promoting transparency and the participants’ commitment to the process.13
13 Dialogue spaces are discussed in greater detail in chapter III of this volume.

82 ECLAC
C. Methodology for strengthening value chains
Diagram II.1 provides a synthetic representation of the methodology for analysing a value chain and for identifying specific actions to strengthen it.
Diagram II.1 Methodology for strengthening value chains
2. Selection of chains 3. Diagnosis
1. Definition of meta-objectives
5. Preparation
of strategies 6. Launch4. Best practices
Intervention in value chains
Stakeholder dialogues
Source: Prepared by the authors.
The first step in the methodology involves defining meta-objectives, which are the ultimate economic and social development aims being pursued by chain strengthening. They need to be aligned with the national development plan and relevant public policies, such as industrial and science, technology and innovation policies. Examples of meta-objectives include increasing employment and raising real wages, expanding exports, increasing participation by MSMEs and technological change.
The second step consists of chain selection, which defines the chains on which the priority actions of the public and private sectors will be targeted. The selection criteria need to be consistent with the meta-objectives —the potential of the chain to help reduce poverty, contribute to national or regional growth, job creation, export growth and the integration of MSMEs, among others. Other criteria related to strategic policies can also be considered, such as local or regional development and the reduction of asymmetries.
The methodology for defining meta-objectives and for selecting the chains is flexible and depends on a variety of elements: the role played by the government and the private sector in the process; the framework in which the process unfolds (execution of co-operation funds or international loans, joint public-private sector initiatives, or the application of public development programmes); the level of development of the chain, and the fluidity of relations between the government and firms, among others. This definition can be formulated through the public-private sector roundtables, or else merely emerge as an outcome of policy decision-making.

Strengthening value chains… 83
Chain selection uses both quantitative and qualitative criteria. In the first case, a matrix can be constructed which, for example, measures the contribution made by each chain in terms of employment, exports, value-added, and the incorporation of SMEs. Exercises can also be undertaken using input-output tables to estimate the production linkages of each chain. The second case involves the goal to develop specific territories or sectors, and address the needs of vulnerable groups.
The third step consists of the preparation of diagnostic studies. This exercise aims at carefully identifying constraints and opportunities in three key areas: within each segment of the chain; the real and potential links of each segment, and new strategic players that it would be essential to bring into the segments of the chain.
The first roundtable is organized at this stage of the process, to discuss the diagnostic study. This mechanism serves to endorse the commitment of the main stakeholders of the chain and their support organizations, most of which were interviewed in preparing the diagnostic study. The roundtable is expected to last no longer than three hours, with the aim of ensuring the participation and ongoing commitment of key persons in the chain. Following a brief presentation of the diagnostic study, participants are given the chance to make comments to enrich the analysis, ensure that the constraints and opportunities identified have been relevant, and to make sure no one is left out.
The fourth step is the analysis of international best practices. These provide a benchmark for measuring the distance that separates the value chain being studied from a similar value chain in other countries, and to draw lessons from those experiences when designing the strategies.
The fifth step consists of preparing strategies to overcome the constraints and exploit the opportunities identified in the diagnostic studies. The value chain methodology makes it possible to identify micro-level actions to strengthen the links and the chain as a whole. These are specific strategy lines, which ideally would identify responsible entities, timeframes and resources. Merely proposing to strengthen specialized human resources is insufficient; it is also crucial to identify the areas and the organizations with capacity to do so, along with the methodology, the resources and the deadlines.
The second roundtable is held at this point to discuss strategies. As in the first roundtable, the aim is to enhance the process and obtain a commitment from all participants in terms of the actions each will undertake to develop the chain.
The sixth step is the launch of the chain strengthening strategy. This should be a participatory event with media coverage, in which representatives of the links of the chain are convened and the commitments

84 ECLAC
assumed are announced. This activity helps to strengthen the consensus among the chain participants and serves as a demonstration to other chains wishing to embark upon a similar process.
Although outside the scope of the methodology being presented in this chapter, the next step involves intervention in the value chains by implementing the strategy lines. As in the six previous stages, the methodology here is based on consensus and joint public-private sector actions.
The methodology of the diagnostic study is described in the following section, with special emphasis on identifying and typifying each link, and characterizing the constraints and opportunities in the value chains.
D. Preparation of the diagnostic study for value chain strengthening
The methodology for the study of value chains described below summarizes ECLAC’s experience in various processes of providing technical support to governments in the region, and draws on the elements of the “value links” methodologies developed by GIZ,14 and the United Nations Industrial Development Organization (UNIDO).
Diagram II.2 Diagnostic study of value chains
Economic and market analysis
Estructuralanalysis
Environmentalanalysis
Forecast analysis
1. Mapping of participants across the chain
2. Costs, margins and competitiveness 4. Governance
and links
5. Resources, productivity and environmental sustainability
6. Economic and employment benefits
3. Markets and standards
Source: Prepared by the authors on the basis of German Agency for International Development (GIZ) “ValueLinks Manual: The Methodology of Value Chain Promotion”, 2007 [online] http://www2.gtz.de/wbf/4tDx9kw63gma/ValueLinks_Manual.pdf and United Nations Industrial Development Organization (UNIDO), Value Chain Diagnostics for Industrial Development. Building blocks for a holistic and rapid analytical tool, Vienna, 2009.
The issues and questions discussed below constitute a methodological guide, which, as such, can be adapted to the national level
14 See GIZ (2007).
Strengthening value chains… 85
and to each value chain, depending on the contexts being studied and the objectives of the research.
The guide starts by assuming there is broad access to information on the chain under study. Nonetheless, in practice there could be limitations on information availability, which would require the guide to be adapted. It is highly recommendable to cover all elements of this guide, since they are needed to preserve the systemic approach of the study and ensure that all possible areas of constraints and opportunities in the functioning of the chain have been examined. The diagnostic stages include six areas, which are described below.
1. Mapping of value chain participants
Mapping is a technique that helps identify the different participants in a value chain, along with their functions and levels of power, and their interdependencies. It makes it possible to recognize which participants and relations need to be studied within the links, what information needs to be obtained and where the fieldwork will be done.
There are no unique or systematic criteria for defining the boundaries of the chain. It is advisable to start from an analysis of the chain’s production core, in other words the participant or participants that produce the main good or service of the process. For example, in the automotive chain, the core consists of the final assembly plants, whereas in an aquaculture chain, the core consists of the fish or mollusc farmers.
Having defined the boundaries, it is necessary to identify backward linkages (for example, inputs) and forward linkages (such as processing and marketing). These links could be with economic agents that provide goods or services.
A minimum list of questions to identify participants and links would include the following:
(i) What is (are) the core(s) of the manufacturing processes15 in the value chain?
(ii) What are the main links in the value chain (backward and forward linkages in terms of goods and services)?
(iii) What is each link’s share in the chain’s total value added?
(iv) What are the main characteristics of the products or services of each link, particularly the factors of production used and the life cycle?16
15 The production processes that are considered decisive in the chain. 16 The term “life cycle” refers to the marketable life of a product or service, taking account of
technological evolution and the level of innovation associated with the sector.

86 ECLAC
(v) How has the structure of the chain evolved over the last five years? Have new participants emerged or others disappeared, has the chain’s governance been altered?
(vi) Have significant investments been made over the last five years in the links of the chain (asset purchase and investment in infrastructure, among other things)?
(vii) What firm size (large, medium, small or micro) is most frequent in each link of the chain?
(viii) What is the origin of the capital in each link (prevalence of domestic or foreign firms)?
(ix) How rapidly do firms arise and disappear in each link of the chain?
(x) How are the participants and links of the chain distributed geographically in the country and elsewhere?
In terms of the employment generated by the chain, the key questions are the following:
(i) How much employment (number of permanent and temporary workers) does each link in the value chain generate, and how is this distributed across the firms in each link?
(ii) What type of employment is generated in the chain, distinguishing skilled and unskilled, by gender and education level?
(iii) What has been the trend of employment in each link of the chain over the last five years?
(iv) What is the average wage offered in each link?
(v) What has been the trend of the average wages offered in the last five years at each level?
In terms of the foreign trade in which the chain participates, the key questions to be answered are as follows:
(i) How much of the value chain’s final product was exported in the last three years (if more than one link exports a final or intermediate good, consider the exports of each one)?
(ii) What is the chain’s share (final product) in the main destination markets (export competitiveness)?
(iii) How has external demand for the final product of the chain evolved? Has demand for the final product of the chain increased or decreased over the last five years?

Strengthening value chains… 87
(iv) In links that have required imports, what has been the trend of those imports over the last five years, and where have they come from?
(v) Are similar or substitute products to those produced by the chain being imported? If so, what countries do they come from?
2. Analysis of competitiveness, costs and margins
This subsection aims to identify the comparative advantages that distinguish each link of the chain, particularly the factors that underpin its competitiveness and capacity to add value. It also identifies the weaknesses that restrict its capacity to compete on local and international markets. The analysis of cost and margins17 of the producers and firms that participate in the value chain provides information that is useful for detecting potential comparative advantages and weaknesses in each link.
Competitiveness is a concept that measures the capacity of firms to add value to their activities, compared to that of its competitors and partners. At the enterprise level, competitiveness is related to profitability, productivity, costs, value-added, market share, exports, technological innovation and product quality, among other factors (McFetridge, 1995).
To analyse the competitiveness, costs and margins of the links of the value chain, the key questions to be considered are:
(i) What are the key factors affecting the competitiveness of the links of the value chain? In other words, what strategy or comparative advantage do they compete on (technical or market knowledge, low labour costs, geographical location, network participation, access to natural resources, among other factors)?
(ii) What endogenous factors (human resources, technological and production capacities, and capital), and exogenous factors (regulations, entry barriers and insufficient supply of financing), restrict the competitiveness of each link of the chain?
(iii) What are the average production costs in each link of the chain?
(iv) What are the average profit margins in each link of the chain?
(v) What barriers do the links of the chain face in obtaining financing (lack of collateral, high interest rates, absence of suitable financial instruments, shortage of funds in the formal financial sector)?
17 The margin, also referred to as profit, refers to the revenue that a value chain participant receives, minus its total costs.

88 ECLAC
(vi) What are the cost of entering the chain, such as the investment and operating expenses needed to start up the business?
It might be difficult to obtain the information needed to answer the questions in this subsection, because it may not be available or may be considered highly sensitive by producers. If this is the case, an alternative to obtaining information in monetary units would be to estimate percentages or relative share.
3. Analysis of market and standards
This subsection reviews the characteristics of the chain’s participation in markets and the marketing channels and standards that need to be fulfilled to maintain an effective presence in those markets.
A market analysis helps in developing strategic overviews of marketing alternatives that can be implemented by various chain participants or by the chain as a whole, in the short, medium and long terms. The product and market growth matrix is often used to identify the firms and marketing alternatives of value chain participants (Ansoff, 1957).18 After listing the various products and market opportunities, the alternatives that characterize current and potential markets for the products of the chain are assessed.
The following are the basic questions to be formulated in relation to the market analysis of the value chain:
(i) Who are the value chain’s main customers (national and international)?
(ii) What are the customers’ main characteristics in terms of purchasing power, geographical location, habits and customs, and sociodemographic elements?
(iii) What are the current and projected trends for consumption of the chain’s products in the main destination markets?
(iv) Who are the chain main’s competitors (national and international)?
(v) What are the competitors’ characteristics in terms of origin of capital, technological and production capacities, and market share, among others?
(vi) What strategies have been developed by competitors to access new markets?
18 The Ansoff matrix (product- market matrix or growth vector) has four growth alternatives for firms that consist of confronting existing products and services and new ones with existing and new markets. This is a marketing tool that was created by Igor Ansoff and published for the first time in his article on diversification strategies (Ansoff, 1957).

Strengthening value chains… 89
(vii) Does the chain benefit from international trade agreements (tariffs, quotas and others)?
(viii) What tariff conditions are applicable to the chain’s main products?
In terms of the requirements and standards of the value chain’s market, the main questions are as follows:
(i) What quality standards do the value chain’s products have to fulfil?
(ii) What national and/or international standards and parameters govern the production and marketing of the chain’s main products?
(iii) Are chain participants aware of the need to satisfy rules, regulations and standards?
4. Analysis of governance and links
This subsection considers the system of coordination, regulation and control that contributes to the generation of value-added in the value chain. Governance refers to the formal and informal agreements that exist among participants, as the outcome of a matrix of functions relating to the activities undertaken by each link, the number of buyers and sellers operating, market-entry barriers, the nature of the trade, and the partnerships between participants in the different links.
The interactions in a value chain can be classified by their vertical and horizontal links. The former concern the relations between participants in the various links of the chain, while the latter reflect relations between participants in a given link. The analysis of interactions in the value chain not only makes it possible to identify how participants relate to each other (within the links), but also reveals the reasons for those links, including the incentives and whether or not they are beneficial. Practical experience has highlighted the fact that setting the price of the product is crucial in the analysis of certain governance systems, mainly in rural value chains.
Research is also undertaken into the formal and informal links that characterize the chain for the exchange of goods, services, information and knowledge. It is important to study how these links, or their absence, contribute to the chain’s competitiveness, and to ascertain whether they have changed in recent years. Public institutions and policies play a key role in the functioning of the chain, so they are also analysed in this subsection.
The following are the key questions on governance elements (structure of the value chain):

90 ECLAC
(i) How is the value chain structured (dominated by buyers, suppliers, intermediaries, others)?
(ii) Who are the chain’s dominant players?
(iii) What type of power relations do the dominant players exercise (suppliers, purchase, knowledge, network access, price setting and standards)?
(iv) What is the nature of the formal and informal relations of the participants in the links (vertical and horizontal)? How frequently do these interactions occur, and with what quality?
(v) What impact do these (explicit and implicit) rules and regulations have on the members of the chain and their performance?
(vi) If the value chain is internationalized, is it integrated into global networks?
(vii) How are the global networks in which the value chain participates organized?
In terms of factors related to the links, the following are the main questions:
(i) Is there vertical integration19 or horizontal integration20 in the value chain? And do industrial and specialization groupings and clusters operate in the chain?
(ii) What communication and information-exchange practices are commonly used in the chain?
(iii) What level of mutual trust do participants have in each link and in the chain?
With regard to factors related to government institutions and incentives of the chain, the following key questions are proposed:
(i) What are the main public organizations that participate in or support the value chain?
(ii) What type of incentives and support measures, including fiscal ones, exist for the value chain?
19 Partnership between groups of firms that supply a similar product or service (they belong to the same link of the value chain), which could co-operate in certain activities despite competing for a market. An example of this type of integration is the grouping of small firms in the garment-making sector, which preserve their individuality and serve their particular markets. Nonetheless, they cooperate together via the grouping, to purchase inputs and fulfil orders that exceed the capacities of each firm individually.
20 Partnership between firms belonging to different links in the value chain.

Strengthening value chains… 91
(iii) In particular, are there incentives for research, cooperation programmes, product design, or the incorporation of new technologies?
(iv) Is there institutional support to gain access to more and better conditions of financing?
The fundamental questions to be formulated on factors related to marketing and distribution in the value chain are as follows:
(i) What are the characteristics of the commercial links in the chain? (for example, is the producer also responsible for marketing?)
(ii) What are the characteristics of the logistics links, in other words what costs are involved and who covers them? (for example, is the producer also responsible for transport?)
(iii) What mode of transport is used to commercialize the chain’s products and services?
(iv) Are there any marketing and distribution barriers (costs, availability, infrastructure, among others)?
The key questions relating to the factors and strategic links in the value chain for innovation are as follows:
(i) Are formal and informal research, development and innovation activities undertaken in the links of the value chain?
(ii) What are the main sources of knowledge in each of the links of the chain (universities, research centres, consultancies, recruitment of specialized human resources, among others)?
(iii) What mechanisms exist for the transfer of knowledge and technologies in and to the links of the chain?
(iv) Is there a supply of technical and/or higher education focused on the chain?
5. Analysis of resources, productivity and environmental sustainability
Cleaner production and environmental sustainability have become two of the key challenges of value chains. In addition to the national and international standards that need to be fulfilled, consumers are increasingly concerned about the socioenvironmental sustainability of how the goods they consume are produced.
This subsection studies the standards and practices that contribute to environmental sustainability and stewardship, and how these practices contribute positively or negatively to the chain’s competitiveness.

92 ECLAC
When analysing environmental issues for the development of value chains, the most frequent questions concern the following issues:
(i) Do the value chain’s production and processing activities have negative environmental impacts?
(ii) What sources of energy are used and how efficiently is energy used in the different links of the chain?
(iii) What method of water management is used in the different links of the chain?
(iv) What type and quantity of chemical products are used in the different processes of the chain?
(v) What residues are generated in the different links and how are they managed?
(vi) Do the links’ production processes generate greenhouse gases or other emissions?
(vii) What other potential sources of pollution are recognized (acidification and eutrophication, for example)?
6. Analysis and projection of economic and employment benefits
It is important to distinguish the current situation of the value chain from the future scenario after its development and upgrading. Although the present is relevant for the diagnostic studies, the potential development of the chain also needs to be considered.
This final subsection prepares a forward-looking analysis, emphasizing benefits related to the achievement of meta-objectives such as job creation, export growth, the incorporation of SMEs, reduction of territorial asymmetries, and a higher level of innovation, among others.
Lastly, it is useful to perform an analysis of strengths, weaknesses, opportunities and threats (SWOT analysis) for the value chain. This method, which is frequently used in defining a strategic plan, provides information for implementing actions. The appropriate questions to be posed in this regard are as follows:
(i) What are the strengths of each link in the value chain?
(ii) What are the weaknesses of each link?
(iii) What opportunities does each link have?
(iv) What are the threats facing each link?
Table II.2 summarizes the key elements of a SWOT analysis.

Strengthening value chains… 93
Table II.2 Key elements of a SWOT analysis
Strengths Opportunities• Internal, within the chain • The chain’s capacities (distinctive, giving
it advantages)• Potential for increase
• External to the chain • Positive, favourable and exploitable factors • The source of comparative advantages
and strengthening • Potential for exploitation
Weaknesses Threats• Internal, within the chain • Unfavourable position in relation to the
“competition”, owing to a lack of resources, skills, and deficiencies in activities
• Potential for reduction
• External to the chain • Undermine the permanency of the value
chain (economic, social, technological and political factors)
• Potential for neutralization
Source: Prepared by the authors.
The forward-looking analysis includes the following main questions for the development of the value chain:
(i) What target populations would benefit from the promotion and strengthening of the value chain?
(ii) What employment would be generated in each link of the chain?
(iii) What changes in employment conditions could be achieved as a result of the upgrading of the chain?
(iv) How would MSME participation in the activities of the different links of the value chain be stimulated?
(v) How would the chain’s competitiveness be strengthened?
(vi) How would its integration into global value chains be improved?
E. Analysis of best practices
The diagnostic study provides central information on the current situation of a given value chain, namely the constraints it faces and the opportunities that are open to it. It represents an initial step towards the definition of strategies for overcoming or minimizing the constraints and taking advantage of the opportunities, with a view to achieving the meta-objectives defined for the value chain’s development. While necessary for defining actions and policies, the identification of constraints and opportunities is insufficient in itself. Designing strategies based on the characterization of the value chain also requires knowledge of the most appropriate, efficient and effective courses of action to fulfil the objectives.

94 ECLAC
Consideration of other realities makes it possible to identify experiences and draw lessons for improving the case being analysed. For example, a solution aimed at eliminating a constraint in the value chain could be implemented more efficiently by exploiting, in an appropriate way, a successful response to the same issue in another country or region.
Best practice research may be defined as the selective observation of a set of experiences in different contexts, to derive more generalizable principles (Overman and Boyd, 1994). This is a structured process that differs from informal exercises of seeking and describing successful practices.
It should be noted that this methodology does not make a literal use of the word “best” in the term “best practices”. An analysis of a given set of practices cannot guarantee that there are not better practices elsewhere; so there is no absolute certainty as to whether the practice to be exploited really is the “best”. Owing to this lack of universality, some authors prefer to use the term “good practices”. However, as a good practice in one situation might be inappropriate in another context, other authors prefer to use the term “intelligent practices” (Bardach, 2000). This is a broader concept and less committed to rankings. In contrast, other authors argue that one should seek what really is the best practice and use methodologies to ensure its identification (Bretschneider, Marc-Aurele and Wu, 2005).
Notwithstanding the lack of consensus on definitions, this chapter examines how best practice research is understood in the value chain strengthening methodology and, hence, how its results can be interpreted and exploited.
1. The best practice research process
First and foremost, it is necessary to understand the situation in which the best practice is to be applied. This initial step entails recognizing the aspects that need to be improved, including the constraints to be resolved and the opportunities to be exploited, which presupposes knowledge of the objectives to be achieved.
The specification of what needs to be improved is obtained through the diagnostic study, which means investigating practices with potential for overcoming or minimizing the constraints and exploiting the opportunities in the situation under analysis.
A qualitative approach can be used to identify the best practices, under the criterion of targeting search efforts on practices that have the potential to improve the situation being analysed, and characteristics that make them effective and sustainable. This is consistent with the definition of a good practice as having the capacity to cause real changes in the desired direction, if there is an innovative, replicable and sustainable approach (Rhi-Sausi, Conato and Lamela, 2011).

Strengthening value chains… 95
One can also advocate a quantitative approach to identify potential best practices, with a view to promoting greater rigour in the process. Bretschneider, Marc-Aurele and Wu (2005) suggest statistical techniques for analysing and identifying the best practice, based on the fulfilment of conditions such as the universality of the practices considered and the possibility of comparing them. These authors gauge the success of the practice by its results and have chosen to elect the best practice as the one that makes it possible to obtain the highest level of production.
It is worth noting the difficulties involved in satisfying these conditions and in the measurement scale used. It may prove impossible to ensure the universal nature of the practices being considered. If restrictions are imposed on the universe under consideration, it may be more feasible to fulfil these criteria; but then it becomes harder to transpose the practices identified to the situation to be improved. It should be noted that not all practices produce easily measurable results.
There may be particular characteristics that render the solution inapplicable without prior adaptation. Accordingly, the objective is not to apply the same solution, but to identify the principles that underlie the response used. In other words, it is necessary to understand and explain what causes the success of the practice identified, thereby making it possible to evaluate its applicability and the potential need for adaptation (see diagram II.3).
Diagram II.3 Process of identifying needs for improvement and best practice research
Applicable
Yes
Yes
No
No
Diagnostic study
Best practice research
Situation under analysis
Identification of objectives
Recognition of constraints and opportunities
Identification of improvement
needs
Identification of the practice
Adaptable
Explanation of the success of the practice /
identification of underlying principles
Selective observation of practices
Source: Prepared by the authors.

96 ECLAC
The transposition of the identified practice is commonly known as extrapolation and can have several interpretations. There is a wide margin for adaptation to the needs of the situation being analysed, since the essential thing is to exploit the principles that explain the success of the practice identified and how they can be recreated in other cases.
2. Extrapolation
The process of best practice research, and particularly the explanation of the success of the practices observed, can be done informally or through structured schemes. Under the value chain strengthening methodology, a formal critical analysis of the observed practices can make it easier to adapt them to the situation to be improved.21
As a first step, it is useful to list the constraints and opportunities and match them with the practices observed in other situations (see table II.3), recording the main objective of each practice and the mechanisms it uses, whether to minimize or eliminate constraints or to exploit opportunities. Identifying these mechanisms is fundamental for detecting the success of the practice in the situation in which it was used; and it forms part of the information needed to deduce the underlying principles to be considered or recreated.
Table II.3 Information that needs to be systemized to extrapolate practices
Needs for improvement in the situation analysed
Identification of the observed practice
Description of the observed practice
Results of the observed practice
Context of the observed practice
Make a list of constraints to be minimized or eliminated and opportunities to exploit.
In each observed practice the main objective needs to be identified.
The mechanisms used to improve the situation in which each practice is undertaken need to be identified.
Make a list of the results of each practice, including a sensitivity analysis and a record of side-effects.
Description of the situation in which the practice was observed, and other contextual factors that are relevant for adapting it to the situation being analysed.
Source: Prepared by the authors on the basis of E. Ongaro, “A protocol for the extrapolation of ‘best’ practices”: how to draw lessons from one experience to improve public management in another situation” [online] http://epsa2009.eu/files/Symposium/An%20approach%20to%20the%20extrapolation %20of%20practices_EOngaro.pdf.
The results achieved in each practice should be listed and a sensitivity analysis performed. The latter, by simulating changes in some of the components of the practice, is highly relevant for deciding what needs to be adapted. It is also useful to include information on the side effects produced when the practice is applied.
21 The extrapolation is performed using the protocol developed by Edoardo Ongaro, with a number of adaptations. This builds on the concepts of best practice research proposed by Bardach (1994, 2000 and 2004) and Ongaro (2009).

Strengthening value chains… 97
Other information that is crucial for identifying the principles underlying the practice and how it can be adapted, is the description of the context in which it was observed, which should include a definition of the situation (see table II.3). This information makes it possible, for example, to assess the extent to which the practice can be applied independently of context, or whether there is any condition in the scenario that needs to be replicated for the practice to have the expected success.
Gaining a detailed knowledge of the underlying principles in each practice and the context in which they were observed makes it possible to deduce the factors of success in each case. This information can be used to determine the extent to which the mechanisms identified are applicable to the situation to be improved, or the amount of adaptation needed to make them usable. Table II.4 sets out a group of thematic areas for the analysis of best practices in value chains.
Table II.4 Proposal of thematic areas for an analysis of best practices in value chains
Thematic area Derivations
Structure
Characteristics of the value chain, including its linkages and integration and support services.Characteristics of the value chain’s products and services, with their life cycle, positioning, production factors, productivity and technology used.Characteristics of the firms such as type, dynamics, geographical distribution, formality and origin of capital.
Governance
Networks, including their types, level of insertion and barriers to their development.Dominant coordination mechanisms (vertical or horizontal), formality of relations and trust.Communication (information exchange and channels).
CompetitivenessCritical points (strengths and weaknesses).Entry barriers and economies of scale.Requirements (customers, regulations and standards).
Innovation
Types of innovation (product, process, organization and commercialization).Research and development activities.Sources and mechanisms for transferring technological knowledge.Institutional framework.
Context services
Commercialization and distribution (marketing channels, logistics, infrastructure and trade facilitation).Business climate, financing, public-private partnerships and incentives.Energy (type, price and quality).Environmental sustainability (resources needed, environmental aspects and impacts and cleaner production).
International integration
Exports and imports (dynamic and destinations). Trade agreements (tariffs and rules of origin).
Human resources
Employment (dynamics, distribution and quality). Education and training (level of education, education and training mechanisms, capacity recognition).Gender issues and vulnerable groups.
Source: Prepared by the authors.

98 ECLAC
3. Interpretation of the results
While an analysis of best practices makes it possible to obtain significant specific advantages, there are also empirical risks that can affect the interpretation of its results.
Firstly, information on the practices may not be easily available. In particular, practices that aim to improve the performance of economic agents in the private sector may be considered confidential or privileged information. Moreover, even if information is not restricted in this way, the fact that it is not recorded or not disseminated, can create significant barriers to its use in the analysis of successful measures. In this framework, there are still many opportunities for improving knowledge management in relation to best practice research. The recording of the practice stimulates its codification and formalization, which in turn facilitates its knowledge, dissemination and potential replication (Rhi-Sausi, Conato and Lamela, 2011).
The counterparties involved in the situation to be improved also need to be receptive to changes arising from the application of the principles underlying the observed practices.
The context analysis needs to pay special attention to the development level of the country in which the practice was observed, since this is a key factor affecting its successful transposition to the situation to be improved (Veselý, 2011). If a measure that was applied in a much more advanced value chain and in a more favourable context is to be extrapolated to another less developed situation, careful context analysis will be needed to identify the underlying factors of success and determine any adaptation needs.
The practice may also be multidimensional and complex, without any clear identification of the different factors of success or adaptation needs to align it to the reality in which it is to be applied.
It is essential to evaluate the implementation and results of the actions that may be transposed when following up an analysis of best practices. This makes it possible to identify whether it is important to apply additional adaptation measures to contribute effectively to the predefined goals, such as the meta-objectives, and to improve the process of analysis and extrapolation of best practices.
The ECLAC-GIZ project methodology includes best practice research as one of the inputs for proposing strategies to overcome the constraints and take advantage of the opportunities in the value chains analysed.
Best practice research is an input that ECLAC considers along with other sources of information to overcome the constraints in value chains

Strengthening value chains… 99
and stimulate the process of production change in the economies of Latin America and the Caribbean.
F. Design of strategies
This subsection outlines the general issues that need to be considered when preparing the strategies. Firstly, as the strategies were designed to address the constraints and opportunities identified in the diagnostic study and may be based on the best practices investigated (see diagram II.4), it is crucial to understand that it may not always be possible to find such practices. In that case, the design of solutions to overcome the constraints will arise from a more in-depth analysis and creativity in the design of proposals and recommendations.
Diagram II.4 Strategy preparation process
Programme 1
Programme 2
Programme 3
Programme 4
Programme 5
Strategy 1.1
Strategy 1.2
Strategy 1.3
Strategy 1.4
Lines of action
Lines of action
Lines of action
Lines of action
Best practices
Con
stra
ints
Source: Prepared by the authors.
A second consideration is that the strategies are organized by programmes, which are the broad topics on which the intervention to strengthen the chain is planned and systemized. The strategies provide the guidelines for choosing actions that are appropriate for such strengthening.

100 ECLAC
Thirdly, there is no maximum or minimum number of strategies for each programme, or lines of action for each strategy. Existing needs and capacities in the chain are the basis for defining the scope and depth of the necessary actions.
A fourth issue is that the strategies should target all stakeholders in the chain and not just the public sector. Accordingly, the strategies list the actions that each participant needs to undertake to strengthen the chain, and they are underpinned by the consensuses and agreements that have been forged in the roundtables.
As the programmes identify the intervention area, their titles need to be expressed in general terms, such as: “Strengthening of chain producers’ innovation capacities”. In contrast, the strategies identify more specific actions contained in the programme, for example: “Increase resources available for contracting skilled staff”, or “Develop closer relations between firms and specialized research centres”.
The lines of action materialize and specify the activities to be undertaken to fulfil the strategies.
For example, a line of action might be defined as: “Create an exchange program for university and business researchers on preselected issues that are of central importance for the development of the chain”.
The strategic planning offered by this methodology lays sound foundations and systemizes the intervention in the value chains. Nonetheless, to make the strategies and lines of action operational, it is necessary to maintain the work of planning and forging agreements to define persons responsible, timeframes, performance indicators and financial resources in greater detail.
Lastly, figure II.1 provides a tool that could be useful for a government when prioritizing the application of the designed strategies, according to their relative cost, time needed for implementation and impact. This stage of the process does not require precise information on costs and execution times. It is an input of orientation used to facilitate the decision-making process, depending on political will, financial resources and the timeframes available for its execution.

Strengthening value chains… 101
Figure II.1 Matrix of costs, times applied and relative impacts
$ $ $
Impact
Impl
emen
tatio
n pe
riod
1
2
High
Short
Short
Long
4
7
8
3
Relative costs
5 6
9
10
$$
Source: Prepared by the authors.
G. Conclusions
This chapter synthesizes the methodology used in the ECLAC-GIZ project for strengthening value chains in the Central American subregion. As exemplified in the following chapters of this volume, it is a very useful tool for designing public-private strategies and, from the government point of view, for implementing specific industrial-policy actions.
The methodology focuses on identifying the obstacles or constraints faced by participants in the various links of value chains, and in the chain as a whole, to increase their competitiveness. It pays special attention to improving productivity, increasing value-added, growing international market share and creating employment, among other issues. Once the constraints have been identified, a search is made for international best practices, which are fundamental inputs for strategy design.

102 ECLAC
Participation by value chain stakeholders in the different stages of the process helps in devising strategies to overcome the obstacles identified, agreed upon between the public and private sectors. The diagnostic study and the strategies are validated with the leading value chain participants; and a roadmap is prepared for the implementation of public-private actions aimed at resolving the constraints faced by the chain. Lastly, the methodology provides a tool that is useful for the government when prioritizing the implementation of the designed strategies, according to their relative costs, timeframe and impact.
Bibliography
Ansoff, Igor (1957), “Strategies for diversification”, Harvard Business Review, vol. 35, No. 5, September-Harvard Business Publishing, October.
Bardach, Eugene (2004), “Presidential address. The extrapolation problem: how can we learn from the experience of others?”, Journal of Policy Analysis and Management, vol. 23, No. 2, Association for Public Policy Analysis and Management.
___ (2000), A Practical Guide for Policy Analysis. The Eightfold Path to More Effective Problem Solving, Washington, D.C., Chatham House Publishers.
___ (1994), “Comment: the problem of “best practice” research”, Journal of Policy Analysis and Management, vol. 13, No. 2, Association for Public Policy Analysis and Management.
Barrientos, Stephanie, Gary Gereffi and Arianna Rossi (2011), “Economic and social upgrading in global production networks: a new paradigm for a changing world”, International Labour Review, vol. 150, No. 3-4, Geneva, International Labour Organization.
Bretschneider, Stuart, Frederick J. Marc-Aurele and Jiannan Wu (2005), “Best practices research: a methodological guide for the perplexed”, Journal of Public Administration Research and Theory, vol. 15, No. 2, Oxford University Press.
Cimoli, Mario (ed.) (2005), “Heterogeneidad estructural, asimetrías tecnológicas y crecimiento en América Latina”, Santiago, Chile, Economic Commission for Latin America and the Caribbean (ECLAC)/Inter-American Development Bank (IDB).
Devlin, Robert and Graciela Moguillansky (2010), “Alianzas público-privadas para una nueva visión estratégica del desarrollo”, Libros de la CEPAL, No. 108 (LC/G.2426-P), Santiago, Chile, Economic Commission for Latin America and the Caribbean (ECLAC). United Nations publication, Sales No. S.09.II.G.152.
ECLAC (Economic Commission for Latin America and the Caribbean) (2013a), “Lineamientos estratégicos para el desarrollo industrial en Argentina. Documento de base”, Buenos Aires, unpublished.
___ (2013b), “Comercio y desarrollo inclusivo: Los caminos del comercio internacional y la integración hacia la igualdad”, Santiago, unpublished.
___ (2012), Structural Change for Equality: An Integrated Approach to Development (LC/G.2524(SES.34/4)), Santiago, Chile.
___ (2010), Time for Equality: Closing Gaps, Opening Trails (LC/G.2432(SES.33/3)), Santiago, Chile.

Strengthening value chains… 103
___ (2008), Structural Change and Productivity Growth, 20 Years Later: Old Problems, New Opportunities. Summary (LC/G.2368(SES.32/4)), Santiago, Chile.
Fajnzylber, Fernando (1990), “Industrialization in Latin America: from the ‘black box’ to the ‘empty box’: a comparison of contemporary industrialization patterns”, Cuadernos de la CEPAL series, No. 60 (LC/G.1534/Rev.1-P), Santiago, Chile. United Nations publication, Sales No. E.89.II.G.5.
Gereffi, Gary (1999), “International trade and industrial upgrading in the apparel commodity chain”, Journal of International Economics, vol. 48, No. 1, Amsterdam, Elsevier.
___ (1994), “The organisation of buyer-driven global commodity chains: how U.S. Retailers shape overseas production networks”, Commodity Chains and Global Capitalism, G. Gereffi and M. Korzeniewicz (eds.), Westport, Praeger.
Gereffi, Gary, John Humphrey and Timothy Sturgeon (2005), “The governance of global value chains”, Review of International Political Economy, vol. 12, No. 1, London, Routledge.
Giuliani, Elisa, Carlo Pietrobelli and Roberta Rabellotti (2005), “Upgrading in global value chains: lessons from Latin American clusters”, World Development, vol. 33, No. 4, Amsterdam, Elsevier.
GIZ (German Agency for International Development) (2007), ValueLinks Manual: The Methodology of Value Chain Promotion [online] http://www2.gtz.de/wbf/4tDx9kw63gma/ValueLinks_Manual.pdf.
Haussmann, Ricardo, Dani Rodrik and Andrés Velasco (2005), “Growth diagnostics”, The Washington Consensus Reconsidered: Towards a New Global Governance, J. Stiglitz and N. Serra (eds.), New York, Oxford University Press.
Humphrey, John and Hubert Schmitz (2002), “How does insertion in global value chains affect upgrading in industrial clusters?”, Regional Studies, vol. 36, No. 9, Taylor & Francis.
Kaplinsky, Raphael (2000), “Globalisation and unequalisation: what can be learned from value chain analysis?”, Journal of Development Studies, vol. 37, No. 2, Taylor & Francis.
Kaplinsky, Raphael and Mike Morris (2002), A Handbook for Value Chain Research, Brighton, Institute of Development Studies.
Kosacoff, Bernardo and Andrés López (2008), “América Latina y las cadenas globales de valor: Debilidades y potencialidades”, Revista globalización, competitividad y gobernabilidad, vol. 2, No. 1, Washington, D.C., Georgetown University.
López, Andrés and Daniela Ramos (2010), “Inversión extranjera directa y cadenas globales de valor en la industria y servicios”, La Argentina ante la nueva internacionalización de la producción. Crisis y oportunidades, B. Kosacoff and R. Mercado (eds.), Buenos Aires, Economic Commission for Latin America and the Caribbean (ECLAC)/United Nations Development Programme (UNDP).
McFetridge, Donald (1995), “Competitiveness: concepts and measures”, Occasional Paper, No. 5, Ottawa, Industry Canada.
Morrison, Andrea, Carlo Pietrobelli and Roberta Rabellotti (2006), “Global value chains and technological capabilities: a framework to study industrial innovation in developing countries”, KITeS Working Papers, No. 192, Milano, Universita’ Bocconi.
Ongaro, Edoardo (2009), “A protocol for the extrapolation of ‘best’ practices”: how to draw lessons from one experience to improve public management in

104 ECLAC
another situation” [online] http://epsa2009.eu/files/Symposium/An%20approach%20to%20the%20extrapolation%20of%20practices_EOngaro.pdf.
Overman, Sam and Kathy J. Boyd (1994), “Best practice research and postbureaucratic reform”, The Journal of Public Administration Research and Theory, vol. 4, No. 1.
Padilla Pérez, Ramón and others (2008), “Evolución reciente y retos de la industria manufacturera de exportación en Centroamérica, México y República Dominicana: Una perspectiva regional y sectorial” (LC/MEX/L.839), Mexico City, ECLAC subregional headquarters in Mexico.
Rhi Sausi, José Luis, Darío Conato and Myriam Lamela (2011), Capitalización de buenas prácticas para la cohesión social, Rosario, URBAL III Program.
Rossi, Arianna (2013), “Does economic upgrading lead to social upgrading in global production networks? Evidence from Morocco”, World Development, vol. 46, Ámsterdam, Elsevier.
Stezano, Federico (2013), “Políticas para la inserción de las microempresas y las pequeñas y medianas empresas en cadenas globales de valor en América Latina”, Estudios y Perspectivas series, No. 146 (LC/MEX/L.1106), Mexico City, ECLAC subregional headquarters in Mexico.
Stumpo, Giovanni and Diego Rivas (2013) (comps.), “La industria argentina frente a los nuevos desafíos y oportunidades del siglo XXI” (LC/R.3637), Santiago, Chile, Economic Commission for Latin America and the Caribbean (ECLAC).
UNIDO (United Nations Industrial Development Organization) (2009a), “Value chain diagnostics for industrial development. Building blocks for a holistic and rapid analytical tool”, UNIDO Working Paper, Vienna.
___ (2009b), Developing a Value Chain Diagnostics Tool for Common Practice at UNIDO. Expert Group Meeting Report, Vienna [online] http://www.unido.org/fileadmin/user_media/Services/IFI/Event/EGM_VC/UNIDO_Value_Chain_EGM_Report.pdf.
Veselý, Arnost (2011), “Theory and methodology of best practice research: a critical review of the current state”, Central European Journal of Public Policy, vol. 5, No. 2, December.

Chapter III
Stakeholder dialogues for building joint public-private development strategies
Alexander Rayo1
A. Introduction
“If you want to go fast, go alone. But if you want to go far, travel in company.” Anonymous
Dialogue among key stakeholders in society is becoming ever more relevant and necessary for designing comprehensive, sustainable initiatives. Social and economic structures are so intertwined that the actions taken by some actors can impact on others. Something similar happens with institutions: it is unlikely that one of them, unassisted by others, could tackle the complex issues of today.
Dialogue —a universal tool used by the world’s oldest civilizations— can be used in any thematic area (economic, social or environmental, for example) by similar and dissimilar groups alike.
1 This chapter is based on observation and concepts developed by other authors, as well as hands-on experience gained in a number of sustainable development programmes and projects. The author would therefore like to express his appreciation and thanks to all of the authors and institutions cited. He also would like to thank the German Agency for International Cooperation (GIZ), the Collective Leadership Institute (CLI) and the Economic Commission for Latin America and the Caribbean (ECLAC), in particular its International Trade and Integration Division, for the practical experience they have gained and capitalized on.

106 ECLAC
Multi-stakeholder dialogue is a powerful tool for public policy design and implementation. Stakeholder dialogues can be consultative (short-term) or cooperative (medium- or long-term or permanent). The first type can serve as a valuable bridge for consultation, validation and input for policymaking. The second type (known as a working group), thanks to its more permanent nature, allows for moving on to the implementation phase.
Harnessing the power of effective dialogue can be very helpful for improving relations between government and the private sector, and the relations of both with academia. This tool also provides the opportunity to build or strengthen partnerships between companies and industries so as to improve production linkages and thus boost business competitiveness.
Launching stakeholder dialogue helps to foster public-private partnerships and joint projects, both by bringing actors closer and through collective solution-building.2 In other words, working in stakeholder dialogues facilitates stakeholder affinity, joint policymaking and innovative and effective actions that benefit all.
Despite these benefits, dialogue is not a common practice. And sometimes stakeholder dialogues may drag on and yield no results. This can lead to discouragement and disintegration, sometimes because of exogenous conditions and sometimes because of limited knowledge of the rationale, methodology and work needed for successful, productive dialogues.
This chapter aims to provide a technical, methodological and practical frame of reference for organizing effective stakeholder dialogue in the public and private sectors. Such processes are an essential part of the methodology toolkit for strengthening value chains (see chapter II) and were discussed in the four case histories set out in chapters IV to VII.
With the structure and features of a methodological guide, this chapter is broken into eight sections including this introduction. Section B lays out the conceptual framework for stakeholder dialogues; section C explains the phases. Success and risk factors are explained in section D. The ideal profile for stakeholder dialogue leaders is described in section E. Section F spells out the stages involved in organizing and managing stakeholder dialogues. Section G looks at capitalizing on and transferring best practices. The final section of the chapter, section H, sets out conclusions and closing reflections.
2 ECLAC has analyzed the positive impact of public-private partnerships in export development and promotion of innovation. In this regard, see Devlin and Moguillansky (2010).

Strengthening value chains… 107
1. Guide for organizing and managing stakeholder dialogues
This chapter can serve as a methodological guide that gathers conceptual elements and lessons learned from launching and conducting stakeholder dialogues in Latin America. It sets out best practices for creating and managing effective stakeholder dialogues.
The guide is intended for government officials and agencies, representatives of private sector unions, associations of municipalities, nongovernmental organizations, international cooperation agencies and, in general, all those interested in starting a stakeholder dialogue or enhancing the effectiveness of an existing one (working groups, committees and councils).
The contents of this guide draw, in part, on the experience of the Economic Commission for Latin America and the Caribbean (ECLAC) and the German Agency for International Cooperation (GIZ), through the Sustainable Economic Development in Central America (DESCA) programme. Another part is based on the concepts developed by the Collective Leadership Institute (CLI).
2. Using the guide
There are no one-size-fits-all formulas or standard models for stakeholder dialogues, which are usually complex and involve persons with multiple interests and backgrounds. Each experience is unique and must be tailored in order to be successful. That is why this chapter provides guidance and useful, practical advice on how to organize and manage stakeholder dialogues, based on success stories.
As noted above, this guide describes the process of creating and managing a stakeholder dialogue. The sequence may be followed as described or, if appropriate, adjusted or changed to ensure that the objectives are reached.
Each stakeholder dialogue has its own context, specificities, actors (natural and legal persons), challenges and benefits. As a result, in addition to having a sequence of phases, it is essential to know what incentives are needed to consolidate each phase and move on to the next.
Readers who have already initiated a dialogue may also find useful advice in this chapter. Dialogue is a cyclical process. Achieving common goals is what is important, so ways of relating and working can be resumed or changed. During the process, for example, actors can see that they need to fine-tune their organization or timeline for action. Any corrective measures should be taken within the process with all of the actors, even if

108 ECLAC
that means backtracking or performing tasks that should have been done earlier. Being at an advanced stage does not mean that it is impossible to go back and make corrections that will be useful later on.
3. The importance of managing stakeholder dialogue
Humans are social beings, so dialogue is a tool that contributes to success in a variety of spheres, be they political, business or community. Similarly, dialogue with multiple actors is a tool that helps to achieve both individual and collective objectives (institutional, sectoral, national and regional).
Working in stakeholder dialogues may, depending on the nature of the case, garner support from a group so that ideas, proposals and concerns become more robust and achievable, or, through collective thinking and objectivity, build a new idea and act on it in order to maximize the scope of the interests and benefits involved.
Effective, sustainable solutions for the complex issues of today require consulting diverse actors across multiple sectors, thereby involving a number of institutions operating at different levels. These are solutions arising from governance strategies along two dimensions: horizontal (multiple actors) and vertical (multiple levels).
Improving the competitiveness of a small or medium-sized enterprise does not yield noticeable improvements in macroeconomic indicators. However, making an entire sector or value chain more competitive can mean a substantial boost to a country’s economy. Stakeholder dialogues further the identification, enrichment and implementation of development policies and permanent partnerships between industry, government and academia.
When actors work together in stakeholder dialogues, human and financial resources are used more efficiently. And working with multiple actors in these dialogues contributes to the quality, transparency, credibility and sustainability of the decisions made and the courses of action chosen.
4. Participating in a stakeholder dialogue and selecting actors
Three factors are particularly critical in the selection of actors to participate in a stakeholder dialogue: the objective to be achieved, the level where they will work (international, regional, national or local) and the nature of the dialogue, which can be consultative (near-term) or cooperative (medium-term, long-term or permanent). Participating actors should be directly related to the variables selected.

Strengthening value chains… 109
A stakeholder dialogue must be inclusive, so it must be open to participation by the range of actors involved in the target sphere (a specified number or limit for participants cannot be set up front).
Knowledge of the context, relevant information found in documents, suggestions from colleagues and experts, and interviews with actors will make it easier to approach the stakeholders identified. Only after assessing whether potential stakeholders are related to the chosen variables can attention turn to asking if they wish to participate.
As the process advances, participants can suggest or invite other actors to join the stakeholder dialogue because they have discovered the dialogue and are interested.
B. Conceptual framework
1. Stakeholder dialogues
For the purposes of this chapter, stakeholder dialogues are building blocks for communication and cooperation among relevant actors in an issue who must work together for mutual development and for development of the relational system to which they belong (identify solutions and implement actions).
Dialogue entails pooling the capabilities, resources, ideas and perspectives brought by the actors, facilitating the search for solutions that, on an individual basis, would not be found or would not be feasible.
Dialogue means that no position is conclusive unless there is a general consensus: ideas or new agreements and approaches can thus emerge from discussions during a working session. This is a methodology that seeks to establish a model for thinking together where all involved can openly voice their opinion and collaborate.
A stakeholder dialogue should be structured as a work process and have a common goal that all of the actors share. Work must be based on a search for consensus and on joint design and implementation of actions.
2. Expectable outcomes
First, a stakeholder dialogue should provide the opportunity to talk and to move towards a well-defined objective in order to identify and implement solutions that are not achievable individually.
A stakeholder dialogue provides a collaborative platform for an exchange of ideas and the smooth implementation of courses of action. It could even be seen as a forum for consultation or for making public policy

110 ECLAC
suggestions. In and of itself, a dialogue can even be representational, depending on its nature.
Although stakeholder dialogues are a means for identifying and implementing solutions, they are often (when they become permanent) an outcome in their own right because they turn into a forum for ongoing consultation and prove their sustainability.
3. Types of stakeholder dialogues
According to the level or scope of work, the types of dialogue are (i) international, (ii) regional, (iii) national, (iv) sectoral, and (v) local.
The level at which the dialogue is to take place should be chosen on the basis of the desired impact or target issue. In general terms, dialogues may be consultative or cooperative (Görg and others, 2011).
Each situation that arises should be addressed with the right actors at the appropriate level. The consultation or issue must be properly delimited, and the agenda (including date and time) must be well planned in order to contribute to the success of the initiative.
Table III.1 Characteristics and forms of stakeholder dialogues
Consultative dialogue Cooperative dialogue
CharacteristicsActors contribute their expertise, viewpoints and experience. Initiators of the dialogue are usually responsible for subsequent implementation of recommendations and conclusions.
The focus is on cooperation among actors, who bear joint responsibility for actively putting a solution or measures into practice. The greater the focus on implementation, the greater the willingness to cooperate and to assume responsibility for results.
Subcategories(i) One-off consultation.(ii) Series of consultations.(iii) Institutionalized consultation.(iv) Multi-stakeholder platform for exchange.
(i) Multi-actor initiative.(ii) Multi-actor platform for implementation.(iii) Key actor partnerships.
Examples(i) Socialization and consultation on a new
public policy.(ii) Multiple consultations on a new policy
targeting different sectors separately or in different geographical areas.
(iii) Annual public review of a university’s academic plan.
(iv) Virtual trade platforms.
(i) Coffee Council (coffee entrepreneurs working on their brand of origin).
(ii) Innovation roundtables (public, private and academic sectors cooperating to promote innovation).
(iii) Consortiums of laboratories for export.
Source: Prepared by the author, on the basis of German Agency for International Cooperation (GIZ), Stakeholder Dialogues Manual, German Agency for International Cooperation (GIZ)/Collective Leadership Institute (CLI), 2011 [online] http://www.collectiveleadership.com/fileadmin/user_upload/Downloads/publications/SD-Manual_EN_021111_Download.pdf.

Strengthening value chains… 111
When a cooperative stakeholder dialogue is on the way to becoming permanent, the actors can decide to organize it and give it a name, such as council, board, commission, committee or platform.
4. What stakeholder dialogue is for
Because they are cross-cutting, stakeholder dialogues are very useful for addressing common problems or needs and for jointly seeking solutions. This approach is becoming ever more widespread, so specific methodologies are being developed in spheres as diverse as climate change, environmental management, food security, citizen security, value chains, urban development, land use planning and public consultations.
This approach is particularly helpful when an initiative can be implemented only with the support of various groups of actors and decision-makers, or when it requires acceptance or validation by interest groups with regard to a position and the goal is to change the situation or the framework conditions.
Before initiating or promoting a stakeholder dialogue it is advisable to test the waters or study the potential so as to determine the best approach and the stakeholders’ position. Tools for such fact-finding will be discussed later.
C. Stakeholder dialogue phases
The Collective Leadership Institute (CLI) developed the dialogic change model based on experience with and expertise in dialogue. This model explains what should be taken into consideration to foster result-oriented dialogue.
The dialogic change model also provides structured guidance for planning and highlights the details that could derail a process or enable it to succeed (CLI, 2011). This system consists of four phases as described below.
(i) Phase 1. Exploring and engaging: Essentially, this is fact-finding. This is the time to explore the context and where the key players stand on the issue. It assumes knowledge of the actors, external factors and dynamics of the system, and it involves meeting and exchanging ideas with experts in the field. At this stage the implementer team for change should be identified and created.

112 ECLAC
Diagram III.1 Dialogic change model
PHASE 3Implementing and evaluating PHASE 4
Developing further, replicating or
institutionalizing
PHASE 2Building and formalizing
PHASE 1Exploring
and engaging
Establish feedback mechanismsCreate results and
celebrate success
Ensure transparency and communication
Consolidate agreements
and structures
Plan the future together
Clarify common goals and resources
Build a container for change
Understand the context
Clarify the idea dialogically and prove resonance
Establish governance and learning
systems
Build next level container
Create structures for replicating or institutionalizing
Source: Collective Leadership Institute (CLI), “The Dialogic Change Model”, 2011 [online] http://collective leadership.com/en/skills/dialogic-change-model.html.
(ii) Phase 2. Building and formalizing: The focus of this phase is to establish relationships of trust and interest in the goal that the stakeholder dialogue will pursue. The effort here is on strengthening the collaborative system, getting the actors to commit to change and conducting joint strategic planning.
(iii) Phase 3. Implementing and evaluating: Work begins on implementing the measures that have been agreed and planned. It is important to bear in mind that implementation and evaluation are essential to keep the group cohesive and keep the dialogue moving. The greatest difficulties and complexities of the process surface in this third phase and require more attention from the start because it is here that delays, breaches, criticisms and communication avoidance can arise. The foundation built in earlier phases is very important for weathering potential crises, and they help to organize lessons-learned sessions with the entire group.
(iv) Phase 4. Developing further, replicating or institutionalizing: After a stakeholder dialogue has achieved the results envisaged at the

Strengthening value chains… 113
beginning, questions about its continuity arise. Should work on the issue continue at a similar level or a more ambitious one? Is it necessary to continue with the same actors or bring in new ones? Should the outline of work stay the same or is broader action needed? Another question is whether this process, its approach and its structure can be replicated or might be useful for others. The answers to these questions must come from the collective intelligence of the actors in the process. Whatever their decision, at this stage the challenge is to maintain enthusiasm.
How long each phase takes can vary considerably depending on the level at which the work is conducted, the type of dialogue sought (consultative or cooperative, one-off consultation or permanent forum), the issues involved, the actors and the progress made at each stage. The first phase for consultative dialogue could take a few days, with the entire process lasting perhaps a month. The first phase of cooperative dialogue at the regional level can, according to the dialogic change model, take between several months in an initial cycle and one or two years.
There is no estimating the duration of each phase because the situation and the rate of progress determine how long each phase and the entire process will take. In any case, there should be no moving on to the next phase without ensuring proper implementation of the objectives for the previous one as well as ownership by actors. There are checklists that help to decide if a stage needs more time or whether to move on to the next one (see tables III.2, III.3, III.4 and III.5).
Table III.2 Verifying phase 1: exploring and engaging
Goal Understand the context, get to know the actors and their viewpoints, hold preparatory talks and win allies for kick-off.
What to do Gather and analyze documentation, conduct interviews and meetings and request third-party opinions.
Expected outcomes Lay the groundwork for trust and commitment.Identify an implementer team or “container”.Receive actor feedback.
Key questions Have all of the relevant stakeholders in this issue been identified?Are there other relevant actors who would like to participate?Is there sufficient understanding of the context?Have the requisite resources and time been evaluated?Is the implementer team robust enough?
Source: Prepared by the author, on the basis of Collective Leadership Institute (CLI), “Stakeholder Dialogues”, 2011 [online] http://collectiveleadership.com/en/what-we-do/capacity-building-programs/ open-courses/working-with-stakeholder-dialogues.html.

114 ECLAC
Table III.3 Verifying phase 2: building and formalizing
Goal Clarify common goals, determine the necessary resources and who will provide them, build commitment, conduct strategic planning and establish structures for coordination.
What to do Hold meetings and workshops with actors for reaching agreements.
Expected outcomes Clarification of the goal, modus operandi and structure for the stakeholder dialogue.Agreements for collaboration and operation.Strategic planning (what will be done).Structures or agreements for implementation.
Key questions Do all actors have a clear understanding of the objective of the process?Is there a complete framework for the stakeholder dialogue to be effective and for implementing measures?Have enough resources been committed to ensure successful action?Has there been realistic planning?Is everything ready for taking action?
Source: Prepared by the author, on the basis of Collective Leadership Institute (CLI), “Stakeholder Dialogues”, 2011 [online] http://collectiveleadership.com/en/what-we-do/capacity-building-programs/ open-courses/working-with-stakeholder-dialogues.html.
Table III.4 Verifying phase 3: implementing and evaluating
Goal Implement the actions agreed or planned.
What to do Support the structures created for implementation. Capitalize on the partnership agreements and the groundwork for trust laid in previous phases. During implementation, explore more and more extensive partnerships to achieve the goals. Monitor progress, provide and seek group support when and where necessary.
Expected outcomes Actions taken.Implementation reports.Socialization and feedback.
Key questions Were the structures, rules and forms of communication effective?Was the phase evaluated and lessons learned identified?Were the lessons learned put into action?Were the results properly socialized and celebrated?Could implementation be called successful?
Source: Prepared by the author, on the basis of Collective Leadership Institute (CLI), “Stakeholder Dialogues”, 2011 [online] http://collectiveleadership.com/en/what-we-do/capacity-building-programs/ open-courses/working-with-stakeholder-dialogues.html.

Strengthening value chains… 115
Table III.5 Verifying phase 4: developing further, replicating or institutionalizing
Goal Build the next level of dialogue, broaden or replicate the experience, form lasting structures.
What to do Document, analyze and socialize the ideas inherent to this phase and discuss them with the group in an open forum or in a workshop format.
Expected outcomes Agreements on potential continuity and under what format.In the event of continuing and expanding the process, identify the next implementer team.Review and improve steering structures.Identify the steps to be taken.
Key questions Has there been sufficient in-depth analysis of any expansion of the process?Has the new situation been analyzed?Have new key actors been identified and brought in for expanding the process? Have the strategies been evaluated and fine-tuned?Has a system for learning and evaluation been designed?
Source: Prepared by the author, on the basis of Collective Leadership Institute (CLI), “Stakeholder Dialogues”, 2011 [online] http://collectiveleadership.com/en/what-we-do/capacity-building-programs/ open-courses/working-with-stakeholder-dialogues.html.
D. Success and risk factors
Some success and risk factors that have been brought to light by experience and are very useful for improving processes and stakeholder dialogue are set out below. Because these processes bring together diverse individuals and characters, certain risk factors can arise earlier or later. By contrast, success factors can appear by themselves or might need encouragement.
Prudence is called for in implementing these factors. Investing too much energy in researching information on a factor or encouraging another can lead to stress or to straying from the main objective. A basic (rational) level of attention is sufficient to cover success and risk factors.
For example, there must be a basic level of knowledge about the actors: knowing who they are and what their main interests, motivations and general characteristics are. It is impossible to know everything, but it is essential to have some basic notions before the process begins.
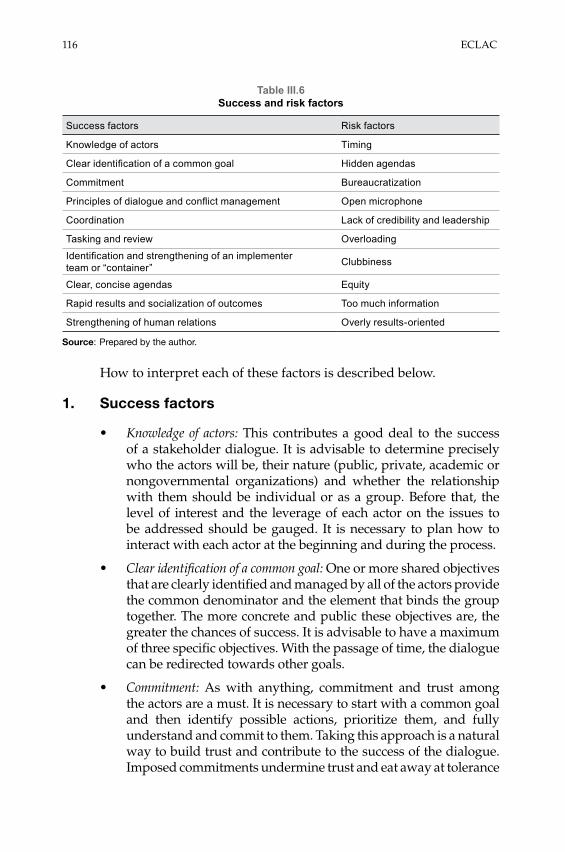
116 ECLAC
Table III.6 Success and risk factors
Success factors Risk factors
Knowledge of actors Timing
Clear identification of a common goal Hidden agendas
Commitment Bureaucratization
Principles of dialogue and conflict management Open microphone
Coordination Lack of credibility and leadership
Tasking and review Overloading
Identification and strengthening of an implementer team or “container” Clubbiness
Clear, concise agendas Equity
Rapid results and socialization of outcomes Too much information
Strengthening of human relations Overly results-oriented
Source: Prepared by the author.
How to interpret each of these factors is described below.
1. Success factors
• Knowledge of actors: This contributes a good deal to the success of a stakeholder dialogue. It is advisable to determine precisely who the actors will be, their nature (public, private, academic or nongovernmental organizations) and whether the relationship with them should be individual or as a group. Before that, the level of interest and the leverage of each actor on the issues to be addressed should be gauged. It is necessary to plan how to interact with each actor at the beginning and during the process.
• Clear identification of a common goal: One or more shared objectives that are clearly identified and managed by all of the actors provide the common denominator and the element that binds the group together. The more concrete and public these objectives are, the greater the chances of success. It is advisable to have a maximum of three specific objectives. With the passage of time, the dialogue can be redirected towards other goals.
• Commitment: As with anything, commitment and trust among the actors are a must. It is necessary to start with a common goal and then identify possible actions, prioritize them, and fully understand and commit to them. Taking this approach is a natural way to build trust and contribute to the success of the dialogue. Imposed commitments undermine trust and eat away at tolerance

Strengthening value chains… 117
among actors. If the participants use shared standards and the actors invest in trustworthy reputations, success and continuity of the dialogue will be more likely (Ostrom, 1990).
• Principles of dialogue and conflict management: Each member of a stakeholder dialogue must master the following essential principles for good communication: (i) listen; (ii) respect; (iii) reflect and (iv) voice.
Moderators and participants in a stakeholder dialogue should also bear in mind the principles of conflict resolution set out below.3
• Think before reacting• Listen carefully• Ensure a fair process• Attack the problem, not the people• Accept responsibility• Use direct communication• Identify interests• Focus on common solutions (everybody wins)
Following these basic principles furthers communication and group cohesiveness with a view to a common purpose.
• Coordination: A practical coordination structure that facilitates activities and is in line with the spirit of the dialogue helps to energize the process. A stakeholder dialogue coordinator should not be charged with all of the work and is neither the boss nor the secretary. Instead, the coordinator steers the process through the steps so the group can make the decisions needed to achieve the goals. When a dialogue is permanent, coordination can be rotating or operate on another basis that the group deems appropriate.
• Tasking and review: Starting with the first official encounter, there must be assignments that are easy to carry out and useful for the objective or the process. It is wise to monitor these tasks and indicate whether or not they are completed. The first commitments met, however small, have a very positive impact on mutual trust and spirit within the group.
• Identification and strengthening of an implementer team or “container” to manage the process: Before setting up a dialogue, or early in the process, it is necessary to identify and establish closer ties with
3 See [online] http://inter-mediacion.com.

118 ECLAC
institutions that can help enhance, drive and create conditions for success in the stakeholder dialogue. An implementer team of two or three institutions that are determined and committed to a goal is sufficient inspiration for many other actors.
• Clear, concise agendas: If the agenda is clear and makes efficient use of time, participants will always know what to do and will feel valued because this will show the importance of meeting and how much everyone’s time is appreciated.
• Rapid results and socialization of outcomes: All of the actors want rapid results, and these must be sought, made easy to understand and disclosed, especially at the beginning, in order to gain confidence and support. The socialization of results should be a practice and a work cycle entailing agreement, planning, implementation and disclosure. Many dialogues are dismissed as unproductive, even by the actors themselves, because of failure to report progress.
• Strengthening of human relations: At any stage of a dialogue it is very productive to encourage rapprochement in order to strengthen human relations. Early on, this can favour rapprochement; in an intermediate stage it can provide a fresh boost of enthusiasm. Later on, it can consolidate working relationships. These opportunities may arise through group dynamics, planning workshops, social gatherings and celebration of results, among other activities.
2. Risk factors
• Timing: Sometimes, stakeholder dialogues do not gain acceptance because they are not launched at the right time. It is necessary to make sure that most of the actors are available, particularly the most relevant ones. A sound assessment and a proper analysis of the situation and the actors’ schedule are crucial for selecting the right time. Research on other initiatives will help to avoid competition and wasted resources.
• Hidden agendas: Some actors might want to participate in the dialogue because they see it as a means to other ends. Care should be taken to keep these interests from negatively impacting achievement of the group’s common goal or the smooth flow of dialogue. It is not possible to identify all those who have hidden agendas; what is essential is to be aware of them and ensure that they are secondary issues in the stakeholder dialogue. If hidden
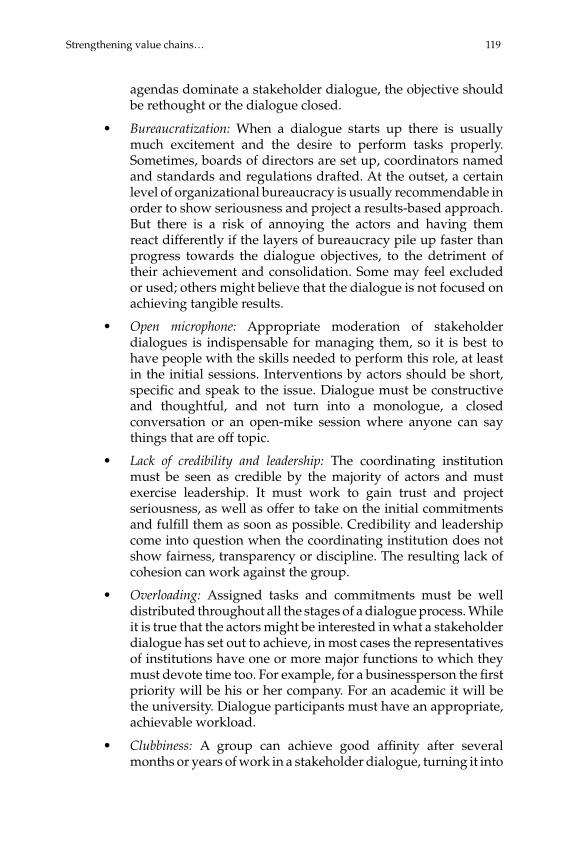
Strengthening value chains… 119
agendas dominate a stakeholder dialogue, the objective should be rethought or the dialogue closed.
• Bureaucratization: When a dialogue starts up there is usually much excitement and the desire to perform tasks properly. Sometimes, boards of directors are set up, coordinators named and standards and regulations drafted. At the outset, a certain level of organizational bureaucracy is usually recommendable in order to show seriousness and project a results-based approach. But there is a risk of annoying the actors and having them react differently if the layers of bureaucracy pile up faster than progress towards the dialogue objectives, to the detriment of their achievement and consolidation. Some may feel excluded or used; others might believe that the dialogue is not focused on achieving tangible results.
• Open microphone: Appropriate moderation of stakeholder dialogues is indispensable for managing them, so it is best to have people with the skills needed to perform this role, at least in the initial sessions. Interventions by actors should be short, specific and speak to the issue. Dialogue must be constructive and thoughtful, and not turn into a monologue, a closed conversation or an open-mike session where anyone can say things that are off topic.
• Lack of credibility and leadership: The coordinating institution must be seen as credible by the majority of actors and must exercise leadership. It must work to gain trust and project seriousness, as well as offer to take on the initial commitments and fulfill them as soon as possible. Credibility and leadership come into question when the coordinating institution does not show fairness, transparency or discipline. The resulting lack of cohesion can work against the group.
• Overloading: Assigned tasks and commitments must be well distributed throughout all the stages of a dialogue process. While it is true that the actors might be interested in what a stakeholder dialogue has set out to achieve, in most cases the representatives of institutions have one or more major functions to which they must devote time too. For example, for a businessperson the first priority will be his or her company. For an academic it will be the university. Dialogue participants must have an appropriate, achievable workload.
• Clubbiness: A group can achieve good affinity after several months or years of work in a stakeholder dialogue, turning it into

120 ECLAC
a social forum and thus adversely affecting its effectiveness. The recommendation for avoiding this distortion and maximizing the affinity created is to always keep the above-mentioned success factors in mind: clear identification of a common goal, commitment, mastery of the principles of dialogue, and tasking and revision.
• Equity: Although equity in the usual sense is a value, it is important to be aware of situations that could arise and facilitate or damage the process. For reflection and constructive thinking, all the members have an equal right to express themselves, but how to proceed when opinions differ within the group and a decision has to be taken? The member who contributed and commits the most, back up with facts and resources, to the objectives of the forum must have decision power for the good of the dialogue space and its process.
• Too much information: Working or dialogue sessions are often very productive, reaching agreements for actors to take on tasks, but meeting follow-up is nil or ineffective. When the outcome of a meeting is not communicated effectively before the next session, dialogues tend to stall. It is very important to effectively establish and manage communication between sessions, monitor and maintain the linkage. Too much communication in a stakeholder dialogue can saturate or bore the actors, so the key lies in the right degree of communication in order to report significant and urgent items. And bilateral communications should be differentiated from those addressed to the entire group.
• Overly results-oriented: Work should always be goal-oriented, and it should be recognized when certain activities have no impact. Actions taken should not be overstated because this will work against the stakeholder dialogue. There is a need for objectivity in assessing whether the actions undertaken truly lead to the expected results.
Each process can have particularities that work for or against an initiative. The elements set out above can appear just as described or differ slightly. In any case, alertness and balance must be maintained to ensure that the stakeholder dialogue is efficient and productive.

Strengthening value chains… 121
E. Ideal profile of a stakeholder dialogue leader
At the beginning of a multi-actor dialogue, the implementer or implementers must have a very clear idea of where to steer the process and show that they have the tools and skills needed to instill certainty among participants.
The leader of a stakeholder dialogue is not the same as the captain of a vessel, because instead of issuing orders he or she should propose actions. If the leader does not convey trust in the process by means of knowledge and mastery of the methodologies needed, he or she runs the risk of actor “mutiny” or desertion. To avoid this, it is important that the implementer or, preferably, implementers, have the following capacities:
(i) Moderating: A command of moderating skills and techniques is extremely useful when working in stakeholder dialogues. The goal of moderating is to facilitate constructive and objective communication in order to reach agreement on the envisioned objective. The implementers do not have to be the moderators, but it is recommended that they do play this role at the beginning of the process in order to set a style. It is also advisable for the implementers, as well as the key players, to take classes to enhance their moderating skills, because this will enable them to better manage the stakeholder dialogue and facilitate achievement of the objectives. An external moderator can be brought in on special occasions such as a launch or planning workshops.
(ii) Stakeholder dialogue management: Prior knowledge of the process, concepts and tools involved in a stakeholder dialogue provides the strength necessary to generate trust within and outside the process.
(iii) Planning: Skills and knowledge of logistical, basic financial and project planning are very useful throughout the process, from fact-finding to implementation of actions. This ability makes it possible to guide the group and build trust.
(iv) Knowledge of the issue: The implementer does not need to be an expert on all the issues to be addressed in a stakeholder dialogue, but it is important to have general and basic knowledge of certain matters.
(v) Conflict management: Sometimes, conflicts of a different nature (communication, upstaging, misunderstandings) come to the
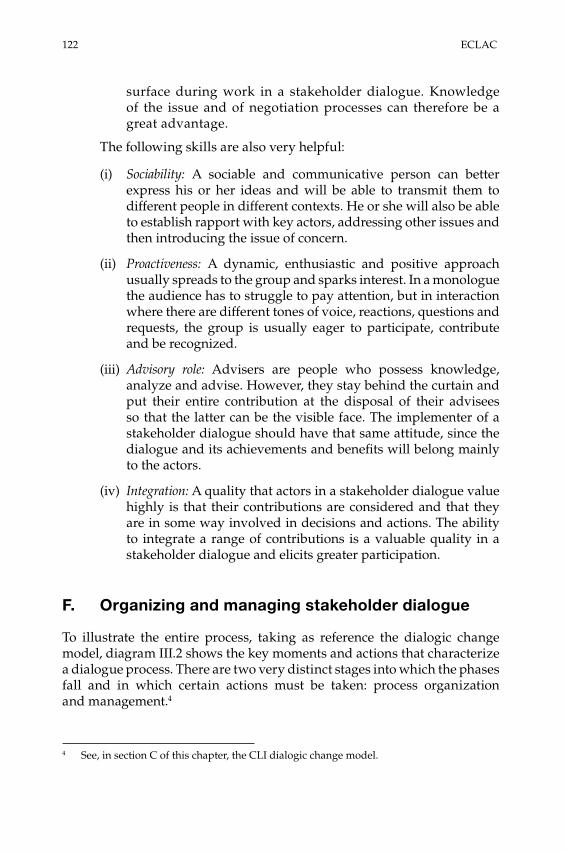
122 ECLAC
surface during work in a stakeholder dialogue. Knowledge of the issue and of negotiation processes can therefore be a great advantage.
The following skills are also very helpful:
(i) Sociability: A sociable and communicative person can better express his or her ideas and will be able to transmit them to different people in different contexts. He or she will also be able to establish rapport with key actors, addressing other issues and then introducing the issue of concern.
(ii) Proactiveness: A dynamic, enthusiastic and positive approach usually spreads to the group and sparks interest. In a monologue the audience has to struggle to pay attention, but in interaction where there are different tones of voice, reactions, questions and requests, the group is usually eager to participate, contribute and be recognized.
(iii) Advisory role: Advisers are people who possess knowledge, analyze and advise. However, they stay behind the curtain and put their entire contribution at the disposal of their advisees so that the latter can be the visible face. The implementer of a stakeholder dialogue should have that same attitude, since the dialogue and its achievements and benefits will belong mainly to the actors.
(iv) Integration: A quality that actors in a stakeholder dialogue value highly is that their contributions are considered and that they are in some way involved in decisions and actions. The ability to integrate a range of contributions is a valuable quality in a stakeholder dialogue and elicits greater participation.
F. Organizing and managing stakeholder dialogue
To illustrate the entire process, taking as reference the dialogic change model, diagram III.2 shows the key moments and actions that characterize a dialogue process. There are two very distinct stages into which the phases fall and in which certain actions must be taken: process organization and management.4
4 See, in section C of this chapter, the CLI dialogic change model.

Strengthening value chains… 123
Diagram III.2 Phases of stakeholder dialogue
Managing the dialogue
Organizing the dialogue
Phase 1: Exploring and engaging
Phase 2: Building and formalizing
Phase 3: Implementing and evaluating
Fact-finding
Verification
Initial socialization
Socialization meeting
Capacity building
Workshop or working sessions to identify objectives and first activities
Strategic planning workshop or sessions
Implementation and partnership search
Socialization and celebrating results
Developing structures for implementation
Follow-up and support for implementation structures
Monitoring and reporting progress and difficulties
Phase 4: Developing further, replicating or institutionalizing
Workshop or session for evaluating the experience
Reflection and decision-making for continuity
Preparing for continuity
Source: Prepared by the author, on the basis of Collective Leadership Institute (CLI), “Stakeholder Dialogues”, 2011 [online] http://collectiveleadership.com/en/what-we-do/capacity-building-programs/ open-courses/working-with-stakeholder-dialogues.html.
Each of the actions is described below, along with suggestions and strategies.
1. Phase 1: exploring and engaging
The first phase in organizing a stakeholder dialogue is exploring and engaging. Pre-dialogue exploring entails becoming as familiar as possible with the context, the actors and the issue to be addressed, guided by the precepts of the common good and win-win negotiation. In addition to deeper exploration, this first phase creates resonance among actors.
(a) Fact-finding
The first step in the fact-finding process involves a review of statistics, reports and key documents on the issue. It is not necessary to be

124 ECLAC
an expert in the field or to be up to date on all the details —just the most relevant aspects.
A good second step is to consult with colleagues, experts and technicians working on or associated with the issue in question, seeking their views with regard to the launch of a stakeholder dialogue, what actors they suggest, and any other details or opinions they may provide. It is highly advisable to have several technical references so as to identify majority opinions and diverse viewpoints. This will yield better preparation for interviews with relevant stakeholders and for potential workshops.
The people in the implementer team may think they have a lot of information on the issue to be dealt with in the stakeholder dialogue, but it is important to consult with colleagues and other experts in the same field or fields. A range of interests and opinions come into play in stakeholder dialogues, so familiarity with the context from different angles will be very useful.
Before the interviews and during the dialogue, the actors should be identified and treated in accordance with how important they are for the process objectives. There are very influential and relevant actors who are of great interest for a given issue. Obviously, they should receive a good deal of attention and be involved as much as possible. On the other hand, there may be actors who, even though they are involved in an issue, are of very little interest or influence. Less effort should be spent on them.
In intermediate cases there will be some actors can be of considerable interest but have very little influence. Not as much attention should be paid to them because they are natural and immediate allies and will cooperate in the process. Or there may be actors with considerable influence who are of little interest. They must be informed without overwhelming them and, with compelling arguments, be invited to participate without insisting too much.
Diagram III.3 provides a snapshot of the potential relationships between levels of influence and interest among actors.
To manage fact-finding and the rest of the process, as soon as the actors are identified based on their origin, overall interests and benefits sought, it must be determined how they will be treated in order to stimulate the stakeholder dialogue.
Interviews with key actors make up the third step of the fact-finding process. There is no need to interview all the key actors in a particular issue, but it is important to interview a significant, stratified sample. It is not advisable to meet with actors without having gone through the previous phases, which serve as preparation. These interviews should not seem like a survey but rather be more of a conversation or a loosely structured interview.
Table III.8 sets out a helpful guideline for interviews.

Strengthening value chains… 125
Diagram III.3 Actor influence-interest grid
Low HighInterest
Low
Hig
h
Influ
ence
Actors whose commitment is essential
Actors who can support implementation
Seek issues and opportunitiesto spark the greatest interest
Keep satisfied - Spend time but
not too much time. - Do not bore with
too much information.
Monitoring- Minimum effort.- Do not bore with
too much information.
Consult attentively- Work hard.- Maximum effort.
Keep informed- Establish constant
communication.- Ensure involvement.
Source: Prepared by the author, on the basis of Collective Leadership Institute (CLI), “Stakeholder Dialogues”, 2011 [online] http://collectiveleadership.com/en/what-we-do/capacity-building-programs/ open-courses/working-with-stakeholder-dialogues.html.
Table III. 7 Types of stakeholder dialogue actors
Type of actor Mission Benefits Risks CommentsPublic Establish laws,
regulations and policies to promote and ensure compliance for the sustainable development of society.
Opportunity to establish broad- based platforms for information and consultation.Improve efficiency in policy development and implementation.
Threat of loss of reputation and credibility in the event of non- compliance.
Opportunity to lay groundwork for collaboration between the public and private sectors.
Private Produce economic benefits.
Relationships to improve the business climate.Establish good reputation and relations with other actors.
Danger of not creating better business conditions.Shortage of time to handle multiple activities.
Generally, private actors are the most interested in succeeding.
Civil society Ensure fulfillment of human, social, economic and environmental rights.
Influence the public and private sectors. Additional opportunities for the defence of its goals and the implementation of joint initiatives.
Internal conflicts concerning support for other initiatives. Potential loss of funding.
The civil society group participating in the initiative should have goals that are closely related to the stakeholder dialogue subject.
Academia Promote and provide education to strengthen development. Research. Engage (outreach).
Depending on the type of dialogue, could gain representation, leverage and financial management. Relations with the private sector.
Potential loss of exclusivity for an initiative.Overload of demands from other sectors.
Academic institutions may be public or private. This can change their motivations somewhat, depending on the subject to be addressed.
Source: Prepared by the author, on the basis of Collective Leadership Institute (CLI), “Stakeholder Dialogues”, 2011 [online] http://collectiveleadership.com/en/what-we-do/capacity-building-programs/ open-courses/working-with-stakeholder-dialogues.html.

126 ECLAC
Table III.8 Interview outline
Interview outline(No more than one hour)
IntroductionsIntroduce the participantsReason for the visit (brief and specific, preferably in writing)
EqualizationDiscuss the issue (using information from experts, colleagues, officials or others).Talk about the task or what the potential strategies seek to achieve.
Understanding the actor’s positionWhat actions has the actor taken to promote dialogue on the issue? What activities has it undertaken or is planning to undertake in the short and medium term?Describe Has the actor had partners?Were there obstacles? What were they?
Socialization of the idea of a stakeholder dialogueExplain the concept of stakeholder dialogue and how it works, as well as the benefits it can bring for the system and for the actor’s institution. If known, mention a few examples and outcomes.
Ownership Do you think that your institution would benefit from a stakeholder dialogue? If your institution were to participate, how would it do so? What benefits could it obtain?What other actors should be included in designing the process?
EffectivenessWhat opportunities for working together do you see for the future?What would be the best way to set up the process?
ClosingWill your institution participate in this dialogue or platform?What could it contribute?Socialization of the next steps.Obtaining direct contact information.
Source: Prepared by the author.
After completing these first three steps of the fact-finding process, an initial assessment of the findings is in order (see table III.9).
If the vast majority of responses to the checklist in table III.9 score 4, 5 or 6, there is a favourable scenario for going ahead with a stakeholder dialogue. If there are any very low scores (1 or 2), it is necessary to verify whether the criterion in question can be changed by the implementers or initiators. Whenever possible, it is worthwhile to invest in improving the context conditions for a dialogue.
If a number of criteria score low (1, 2 or 3) and this cannot be improved, it might be better to wait for a while and assess the desirability of continuing with the exercise.

Strengthening value chains… 127
Table III.9 Checklist for assessing fact-finding results a
Is there a need for a stakeholder dialogue? 6 5 4 3 2 1
In order to implement the project, broad acceptance by various stakeholder groups within the project environment is required.
Implementation of the project affects various stakeholder groups, who therefore have to be consulted.
Implementation of the project calls for the active participation of diverse stakeholder groups.
Cooperation with other actors should go beyond the mere provision of information by the initiator/implementer.
Is the time right? 6 5 4 3 2 1
The key actors are convinced of the need for change.
Conflicts between the stakeholders to be involved are not so pronounced that participation in a joint stakeholder dialogue is utterly impossible.
Most of the key stakeholders for the dialogue trust in the competence of the people initiating or implementing the stakeholder dialogue.
Participation in the stakeholder dialogue does not present any disadvantages or risks to the stakeholders to be involved.
Are the necessary resources available for conducting the stakeholder dialogue?
6 5 4 3 2 1
The initiator team has sufficient time, human and financial resources.
The initiator team has sufficient expertise to conduct a stakeholder dialogue.
The initiator team already has adequate contacts with the relevant stakeholder groups.
The dialogue approach is supported by the key decision-makers at the initiator and partner institutions.
Does the initiator/implementer team have the competence and willingness to conduct the dialogue?
6 5 4 3 2 1
The initiator team is willing and able to jointly steer a complex process that may not always go according to plan.
All initiators are willing to respect other standpoints and divergent opinions and to allow innovative, jointly elaborated solutions to be reached.
The initiators are open to changing their own standpoints or adjusting their objectives.
The initiators are willing to assume leadership within a jointly designed process.
Source: Christian Görg and others, Stakeholder Dialogues Manual, German Agency for International Cooperation (GIZ)/Collective Leadership Institute (CLI), 2011 [online] http://www.collectiveleadership.com/fileadmin/user_upload/Downloads/publications/SD-Manual_EN_021111_Download.pdf.
a Scoring: 6, Completely true; 5, Largely true; 4, True to some extent; 3, False to some extent; 2, Largely false; 1, Completely false.

128 ECLAC
Assessment findings may be illustrated. In Figure III.1, in a random assessment, the scores are as follows: need for dialogue, 6; right timing, 4; requisite resources, 2; and competence and willingness, 5.
Figure III.1 Assessment of fact-finding results
Need for dialogue 6 Right time 4 Requisite resources 2 Competence and willingness 5
0123456
Right time
Requisite resources
Competence and willingness
Need for dialogue
Source: Prepared by the author.
These tools are very useful for reflection. But they are not the only relevant component. Good judgement and common sense are also essential for decision-making.
(b) Verification
Verification is not always necessary, but the initial assessment could show there is no strong conviction of the need to move forward with the process. In this case it is advisable let some time go by and then repeat the second and third steps of the fact-finding process (consulting with experts, and interviews with key stakeholders).
During verification it is essential to clear up any doubts concerning the key success factors for participatory construction. The situation must be made clear to the people being consulted or interviewed, so they will know what this new meeting is for: to keep the process moving in the right direction, without leaving any inconclusive or unclear components.
Verification interviews should be brief and have something for the participants (for example, proving a bit of useful information that the interviewee did not know).
It is also important for verification to cover a broad cross-section of stakeholders, in order to validate the views of those interviewed and

Strengthening value chains… 129
compare their statements. There is no set number of consultations and interviews to be conducted during verification; the goal is to dispel any doubts in order to make the right decision.
(c) Initial socialization
If fact-finding and verification confirm that all is in place for continuing, the next step is initial socialization. Depending on the case or the actor, there may be a meeting, formal written communication, an e-mail or a telephone conversation to report on progress and prospects. Then it will be time to convene a formal meeting of all stakeholders. This first call is critical; the implementers should sign a short letter reporting on the situation, citing topics to be addressed, outlining the goals of the initiative and convening a stakeholder meeting.
2. Phase 2: building and formalizing
After exploring and engaging, it is time to lay the groundwork for stakeholder dialogue, through building and formalizing. In broad terms, this phase will formally socialize the initiative, request the delegation of sector representatives, formalize the common goal of the process, establish how it will operate and plan the work.
(a) Socialization meeting
The first gathering of all stakeholders is the socialization meeting. Moderating skills are much needed at this meeting, because it is vital to project a climate of trust and ensure a forum for building and reflection where it is possible to listen and to be heard. It is also essential to be direct, set out clear ideas and reach tangible agreements. At this meeting, stakeholders can ask questions and develop or fine-tune their approach, focus and proposals in order to generate further contributions, provide lead time or, at worst, give up on the initiative and abandon the process.
If the decision is to go forward with the process, it is recommended that the principals of each institution sign a letter accrediting the person who will represent it at the stakeholder dialogue. This measure helps ensure stakeholder seriousness and accountability.
The essential items to be addressed at the socialization meeting are as follows:
(i) Customized introduction of each participant.(ii) Socialization of the objective of the meeting and the background.(iii) Equalization of the available information (communicate findings
or relevant case histories).

130 ECLAC
(iv) Guided reflection (questions and answers).(v) Establishment of agreements.
This first meeting should not exceed two hours. When it is over, the first public step will have been taken. From then on, the process will depend on stakeholder commitment and performance.
(b) Workshop or working sessions to identify objectives and first activities
After the first meeting it is important to keep sparking interest and, if the conditions are ripe, to be proactive. If the actors agreed to immediately start work on a stakeholder dialogue and show a high degree of readiness, they should promptly be offered the necessary support and guidance. At a subsequent meeting it is advisable to work on identifying common goals that all are willing to support.
Another important issue to consider is what can be done right away, such as deciding when and how to hold a strategic planning meeting or workshop.5 Each session should have its own agenda, with result-oriented items.
There are many business, military and government definitions of strategic planning. However, for a stakeholder dialogue the best one is “an orderly reflection on the desired future” (Aramayo, 2006). Strategic planning is “an exercise to clarify what an organization seeks to achieve and how it plans to do so” (CEDPA, 2004) in an ever-changing environment with multiple actors.
According to Ander-Egg (1995), the following main distinctions can be made concerning strategic planning:
(i) The actor who plans is immersed in the reality being planned, is part of it and coexists with other social actors that are, in a way, also planning.
(ii) This is essentially a people problem.(iii) The focus is on the rationale of achievement.(iv) Policy and involvement of social actors are very important.(v) The focus of planning is to steer the process. It does not
crystallize in a plan, but rather there is continuous monitoring of the political, economic and social environment.
(vi) Objectives are defined by social consensus among the social stakeholders involved.
5 In this regard, see chapter IV hereof.

Strengthening value chains… 131
(vii) Actors involved in planning do not control the reality being planned.
(c) Capacity building
After agreeing to begin the process and holding the first meetings, a sizeable contribution to furthering the dialogue is the potential for improving stakeholder communication capacities. This may be done made through training in moderating or facilitating, making them better communicators and intermediaries in a dialogue process. Training like this is very useful because it allows for:
(i) Mastering the principles of dialogue and strengthening human relations: two success factors that help to achieve the objectives of the stakeholder dialogue.
(ii) Building trust: by taking such actions, the actors show the willingness and drive behind an initiative. This encourages new support from a number of actors.
(iii) Taking the first joint action: this is the first opportunity for actors to work as a team on organizing, setting a date and convening an activity. It is the first example of their practical coordination within the stakeholder dialogue setting.
Dialogue implementers must have moderating skills, and it is advisable that they have a proper command of stakeholder dialogue management before launching the process. For the other actors, training in stakeholder dialogue management would be advisable but not strictly necessary.
(d) Strategic planning workshop or meetings
Strategic planning workshops or meetings are key to the process. Unfortunately, many initiatives stall out after reaching this point with a very good level of commitment and an excellent workshop where they analyze and specify what they want and how they will achieve it, only to see little or virtually no implementation.
Table III.10 sets out some pointers for contributing to the success of the process through the planning stage.

132 ECLAC
Table III.10 Planning phase pointers
Plan realistically It is better not to be ambitious at the beginning. Plan according to the resources available.
Don’t overplan At the beginning, highly structured and detailed planning is unnecessary. It is best to keep things simple to achieve success and build trust. Planning can be more ambitious and specific later on.
Have the right actors It is difficult to hold a planning workshop without the presence of decision-makers or when the latter have not given their representatives some room for manoeuvre. Otherwise, planning can be quite ineffective.
Manage time well The planning workshop or meetings should have been well prepared. All of the appropriate teaching materials should be available, and everything that could be done beforehand must be ready for the workshop as in proposal form in order to save time. Take care to avoid dumping prewritten material on the actors, so they won’t feel that they are being manipulated. They will value the freedom to propose strategies or courses of action.
Bring in an outside moderator
Where possible, it is good to have an outside moderator with planning skills and general knowledge of the issue. An external agent allows for greater neutrality and helps all of the actors to concentrate on contributing to joint planning.
Source: Prepared by the author.
Once there is a strategic plan reviewed and validated by the actors, it must be followed, referred to and, above all, complied with.
(i) Agenda for the strategic planning workshop or meetingsThe points on the minimum agenda for the strategic planning
workshop or meetings should be:
• Validation of the dialogue objective (if this has not yet been done).
• Construction of definitions (shared conceptualization, for example “what do you understand by … ”).
• Identification of activities and subactivities to carry out, specifying deadlines, responsibilities and resources.
The steps set out in the following paragraphs concerning dialogue self-assessment and the development of implementation structures are optional and can be performed during or after strategic planning. If they are included, self-assessment should be the first item on the agenda and development of structures the last item.

Strengthening value chains… 133
(ii) Dialogue self-assessment toolThis measurement is subjective in nature; the need for it depends
on how mature the process is. The implementer team may use this tool at the beginning of strategic planning or later. Self- evaluation of dialogues may also be used somewhat regularly to document difficulties and make changes when necessary.
The requirement for implementation of this tool is that a prudential amount of time must have elapsed since launching the process, in order to have enough records or working time for self-assessment. Another requirement is that the implementer team deems it necessary.
The outcome of the self-assessment could serve as a starting point for a process of learning, improvement, group cohesion and search for management for success.
Dialogue self-assessment can be implemented in two ways: first, using the checklist and assessing each question and then averaging the responses or calculating the mode for each criterion; second, assigning an intuitive value to the criteria (as deemed appropriate for each criterion without answering the checklist questions). The tool can be used individually or in a group, for subsequent aggregation and socialization.
Before implementing this instrument, the actors must understand and tailor the criteria in each case.
Scores of 5 or 6 mean that the criterion level is good. Scores of 4, 3, 2 or 1 mean that this factor should be improved. Scores of 4 will require a deeper look or reflection to determine what is happening.
Table III.11 below presents the dialogue self-assessment questionnaire; table III.12 describes the key factors for self-assessment.
Table III.11 Self-assessment checklist a
Leadership and sponsorship 6 5 4 3 2 1There is a strong and committed core group that represents the participating stakeholders.High-ranking and influential people support the stakeholder dialogue.Next to the core group, there are enough participants who identify with the initiative.The top management of the participating institutions identifies with the initiative.Cohesion and relationship management 6 5 4 3 2 1Stakeholders have enough time to form relationships with each other. The people involved are able to meet in a mutual spirit of respect and acceptance.A communicative and inspiring exchange takes place.Relationships between the participating stakeholders and the institutions they represent are given adequate attention.

134 ECLAC
Goal and process clarity 6 5 4 3 2 1
The contribution of the stakeholder dialogue to the shared goal is clear to all participating stakeholders.
Process design and participation patterns are transparent and reliable.
Knowledge and competence 6 5 4 3 2 1
All stakeholders have the required knowledge and competencies.
Capacity development for implementing stakeholder dialogues has been built into the process design.
Sufficient resources are available for the stakeholder dialogue.
Credibility 6 5 4 3 2 1
Initiators, the core group and/or implementers have a sufficient mandate and are trusted by all participating stakeholders.
All relevant stakeholders are sufficiently and adequately represented within the stakeholder dialogue.
Decision-making processes are transparent and are jointly agreed on by stakeholders wherever possible.
Inclusiveness 6 5 4 3 2 1
Weak stakeholder groups are adequately integrated into the process. The stakeholder dialogue and the associated meetings and workshops are designed and held in such a way that all participating stakeholders have a sufficient say and are heard.
There is an agreed procedure for dealing with criticism and complaints. Critical voices are either involved or, at least, good relationships are maintained with critics.
Stakeholders with a high degree of influence have become sufficiently enthused by and integrated into the stakeholder dialogue initiative.
Ownership 6 5 4 3 2 1
The relevance of goals and results is regularly reviewed with all relevant stakeholders.
All stakeholders have the same right to contribute their viewpoint and/or are equally entitled to make decisions. Decisions are reached by consensus.
The core group ensures that the contributions of the various stakeholders are sufficiently acknowledged.
Delivery and outcome orientation 6 5 4 3 2 1
Stakeholder meetings are designed such that participants can work out solutions together. The meetings are concluded by an overview of results and of the next steps to be taken.
The institutions of the participating stakeholders implement joint decisions.
All participants are familiar with the various roles and with the steering and implementing structures.
The participating stakeholders have agreed on the form of progress review and of monitoring.
Regular progress reviews are performed.
Source: Christian Görg and others, Stakeholder Dialogues Manual, German Agency for International Cooperation (GIZ)/Collective Leadership Institute (CLI), 2011 [online] http://www.collectiveleadership.com/fileadmin/user_upload/Downloads/publications/SD-Manual_EN_021111_Download.pdf.
a Scoring: 6, Completely true; 5, Largely true; 4, True to some extent; 3, False to some extent; 2, Largely false; 1, Completely false.
Table III.11 (concluded)

Strengthening value chains… 135
Table III.12 Must-haves
Leadership and sponsorship: Most institutions are hierarchically structured, with “bosses”. Although there are different degrees of influence in stakeholder dialogues, there is no subordinate ranking. Leadership is therefore understood to be the ability to promote a process with joint responsibility for achieving results.
Cohesion and relationship management: The degree of actor cohesion makes a crucial contribution to the dialogue’s success. If the participating stakeholders show little identification with the dialogue, its impact will also be low. Stakeholders will not implement the results of the dialogue and introduce them at their institutions. The process will become more vulnerable to external influence.
Goal and process clarity: People engage when they can see the bigger picture. All participants have to be aware of the next steps. Clarity about the goal and its interdependence with the process are crucial for building trust.
Knowledge and competence: The ability to work and think together constructively depends to a large extent on participating stakeholder knowledge and competence.
Credibility: Stakeholder dialogues must be credible if they are to achieve impact. Credibility refers to a number of factors, including reputation, neutrality, transparency and integration. The more credible the stakeholder dialogue, the more likely stakeholders are to identify with the goal and the process.
Inclusiveness: Stakeholder dialogues that exclude key actor groups lose their credibility and create mistrust. Involving a wide range of weaker stakeholders makes stakeholder dialogue more credible and builds internal and external trust.
Ownership: People implement what they have helped to shape. If stakeholders are not allowed to promote their interests and their viewpoints are not included, they will withdraw from the dialogue process.
Delivery and outcome orientation: If stakeholders get the impression that an initiative is not really geared to implementation or their recommendations are not actually being used, they show little commitment and will probably withdraw from the dialogue process.
Source: Christian Görg and others, Stakeholder Dialogues Manual, German Agency for International Cooperation (GIZ)/Collective Leadership Institute (CLI), 2011 [online] http://www.collectiveleadership.com/fileadmin/user_upload/Downloads/publications/SD-Manual_EN_021111_Download.pdf.
(iii) Develop implementation mechanismsDevelopment of implementation mechanisms consists of encouraging
stakeholders to organize on the basis of affinity and interests in order to take action. Because of past experience, implementation mechanisms tend to be identified as best practices for strengthening stakeholder dialogue. For example, actors can form committees or teams of related actors committed to a specific task, or groups for carrying out other activities for which they have expertise.
This practice is used whenever there are multiple activities to be carried out in the strategic planning process. It can be undertaken during the planning phase or immediately thereafter.
3. Phase 3: implementing and evaluating
Implementation and evaluation is an integral part of stakeholder dialogue management. Set out below are practices and pointers to ensure

136 ECLAC
implementation and to keep the group focused. The outcomes of the dialogue process will emerge during this phase, so special attention is required. While it is true that commitment, capacity and accountability are directly related to the actors and each process in particular, it is important to stay close to and support the stakeholders.
(a) Monitoring and supporting implementation mechanisms
Process follow-up must be in a tone of collaboration and sharing information as colleagues or travel companions, because there are no relationships of subordination in stakeholder dialogues. It is good to discuss progress with other participants in the process, in order to foster a sense of confidence, camaraderie and healthy competition among the participants.
(b) Monitoring and reporting on progress and difficulties
As in many other spheres, monitoring the implementation of activities and measuring results achieved require specific tools.
Bringing monitoring into stakeholder dialogue is more difficult than in an institution. Sometimes there is lack of interest because there is no pressure from a boss. There may even be some aversion to this practice because the stakeholders do not want to feel pressured by monitoring. Or the stakeholders might have different approaches and simply cannot agree on how the process should work.
Stakeholder dialogue monitoring should therefore be as simple and practical as possible. Until the group is consolidated it is not a good idea to introduce monitoring because it can be perceived as a form of pressure, additional work or a sign of distrust. It is essential to define and agree on the monitoring mechanism and identify who will be in charge of it. Here, going behind the group’s back will make progress impossible.
Table III.13 describe the types of monitoring and the key questions to ask. They can be tailored to begin to implement a simple monitoring system. One way of doing this is with the self-assessment tool.6
Monitoring shows how close the goal is and provides the basis for adjustments where necessary. For this reason, information on monitoring should be socialized by all of the actors; discussions can be held where necessary in order to make adjustments accordingly.
6 See table III.11.

Strengthening value chains… 137
Table III.13 Types of monitoring
Monitoring Description Key questions
Activities and results Designed to track agreed activities and results achieved. The idea is to compare what was planned with what has and is being done.
Has what was agreed during planning been done?Is what was planned and done leading to the desired results?
Impact Looks at whether the stakeholder dialogue and its results achieve the goals that were set.
What impacts or benefits has the stakeholder dialogue had for the participating institutions and other actors?To what extent has the stakeholder dialogue achieved or made progress towards its goals?To what extent has the stakeholder dialogue helped to achieve the goals set at the beginning?
Process Examines whether the process is leading to the anticipated results and making a major contribution to joint responsibility for success.
Which strategies for engagement processes were successful?Did the process work smoothly?What should be done to improve the process?
Source: Prepared by the author, on the basis of Christian Görg and others, Stakeholder Dialogues Manual, German Agency for International Cooperation (GIZ)/Collective Leadership Institute (CLI), 2011 [online] http://www.collectiveleadership.com/fileadmin/user_upload/Downloads/publications/SD-Manual _EN_021111_Download.pdf.
(c) Implementation and partner search
To implement actions and build partnerships it is necessary to continue to support and monitor the actors. These are two key factors for success. It is often appropriate to insist and to encourage actors to help them reach the goal.
During implementation it is always possible to identify new actors and build new partnerships that can further an activity or strengthen the dialogue process.
New partners should be introduced at a plenary session of the stakeholder dialogue so as to ensure acceptance by the entire team.
(d) Socialization and celebrating results
In daily life, when someone reaches an important goal there is usually a celebration. Something similar can happen if an institution meets a core objective. And if a person or a group stands out among its peers, standard procedure calls for recognizing it. Similarly, it would be good to reward and recognize the efforts of a stakeholder team that worked and achieved its goals. This practice further promotes cohesion and group

138 ECLAC
spirit and paves the way for achieving broader objectives, replicating the experience or moving on with the dialogue process.
The socialization of progress should be an ongoing task, but celebration is not. Nor does it have to be put off until the end of the activity. Celebration is in order whenever enough has been achieved to deserve recognition. The boost of enthusiasm and energy that comes from recognition of progress can help to motivate the group to stay the course or go even farther.
Celebration can be any social activity. What is important is that it be a group activity and that it be clear that it is in honour of the progress made.
4. Phase 4: developing further, replicating or institutionalizing
The stage involving further development, replication or institutionalization is the last phase of stakeholder dialogue management and the end of the entire process. At this point, the desired results should have been achieved, the group should be consolidated and the experience evaluated in order to decide whether wind it up or continue in a similar or expanded format.
(a) Workshop or meeting to evaluate the process
At the end of a planning period or upon reaching a stakeholder dialogue goal, the process should close with an assessment. This marks completion of a chapter and leaves the door open for the next step, bolstered by the experience gained by all stakeholders and with the potential for additions.
There are different ways to approach a workshop or meeting to assess the experience. It is valid to look at factors that range from the process itself to activities, stakeholders, lessons learned and achievement of goals. Information and thoughts on this final stage can be very useful in the future for the same process or for others.
(b) Reflection and making decisions for continuity
Although it can be done at a later stage, during the assessment phase it is a good idea to think about continuity, or at least to agree for the actors to carry out their respective consultations and to determine when to discuss this matter.
During this reflection and decision-making stage, the basic questions that the stakeholders participating in the dialogue should answer concerning the continuity of the process are as follows:
(i) Is there a desire to continue?
(ii) Is it possible to continue?

Strengthening value chains… 139
(iii) Should work continue in the same way with similar goals? How will the work be structured? Will there be another opportunity for strategic planning?
(iv) Are there enough partners? Are they the right ones?(v) What will change?
(c) Preparing for continuity
The first thing is to define exactly what and how to launch the continuing dialogue, on the basis of experience and the reflections emerging from previous discussions. The initial steps outlined at the beginning of this guide are useful here as well, because much of the advice can apply to an expanded or renewed process.
A key aspect to weigh when the group is nearing a decision to expand the goals or the focus of a stakeholder dialogue is whether new stakeholders taking part in the continuing dialogue should or could be higher up in the hierarchical structure of their institutions. If the idea is to expand the stakeholder dialogue, it might be necessary to have actors who have more leverage or are at a different level than the current ones, and for their institutions to make greater commitments to the process and its activities.
Consultative stakeholder dialogues usually trend towards cooperative or permanent ones, with growing commitment on the part of the actors and institutions represented. Levels of commitment can be in the form of assistance, collaboration on activities and shared human or financial resources.
The implementers or facilitators must be alert to growing levels of commitment on the part of the actors in a stakeholder dialogue. Most of all they need a good mix of confidence, results and impact in the actors involved and senior managers of the institutions represented.
The formula in diagram III.4 synthesizes the process. Increasing actor commitment hinges on greater confidence, plus the sum of good outcomes from the stakeholder dialogue, plus the leverage that the implementer team and all of the participants in the dialogue may have within and outside their institutions.
Diagram III.4 Formula for boosting actor confidence
∆ Actor commitment ≈ ∆ Confidence + ∑ Results + Leverage
Increased commitment on the part of the actors
Will be approximately equivalent to
the increase in confidence, plus all results, plus the influence that the actors have within and
outside their institutions.
In other words:
Source: Prepared by the author.

140 ECLAC
G. Capitalizing on and transferring best practices
Success stories can be a useful reference for the next project. Giving an account of the process, the approach and all the particulars will make it easier to learn from and capitalize on the experience in order to enrich future initiatives. Systematizing and capitalizing on experience lays the groundwork for future transfer processes.
Systematization is a task involving regularly generating and putting together secondary information (reports, aide-memoires and other documents) along with primary information (interviews with participants, self-assessments, notes from workshops with actors or other people who were directly involved) that helps to retell the story and learn from it. In other words, systematization produces new conceptual knowledge that will be useful in future processes (Varela, 2006).
“The goal of capitalization is not to apply a theoretical concept to reality, but to launch a process of theoretical and practical knowledge among the actors involved in order to help bring about real change in the desired direction” (RHI-Sausi, Conato and Lamela, 2011).
Table III.14 provides a guide to questions that help to organize the information and more clearly explain the experience.
Table III.14 Questions for systematization
Initial situation During the process Current situation Lessons learned
What was the situation before the process began?
How was the process conducted? What were the steps involved?
What achievements emerging from the process impact your institution and others?
Who should have been more involved in the process?
What was the position of the institution prior to the experience?
What enabling and constraining factors existed at the start?
How would you describe the current state of affairs in comparison with the beginning?
What aspects of the process would you have liked to be different?
Had you taken other actions to generate change? What happened?
Why did you participate in this process? What do you believe your role was?
What were the perceived changes during this experience?
What outside factors impacted positively or negatively on the experience?
How did you feel at the beginning of the experience?
How did the experience contribute to the achievement of your organization’s goals?
What changes were there in your capacities and those of your organization?
What success factors do you see for you and for others?
How good was knowledge of and coordination with other organizations before the experience?
Was there coordination? How would you rate it? What did other actors and their organizations contribute?
How much progress did the process achieve?
Were there mistakes? What were they? How can they be avoided?
Source: Oscar Jara, Para sistematizar experiencias: Una propuesta teórica y práctica, Lima, Red Alforja, 2005.

Strengthening value chains… 141
The information obtained while systematizing the experience will provide the basis for answering the questions related to the capitalization process, which aims at identifying best practices and reflecting on how to improve future processes (see table III.15).
Table III.15 Questions for capitalization
(i) To what extent did the stakeholder dialogue turn into a best practice?
(ii) If best practices were generated, are they consistent with public policies in place at the local level?
(iii) Are there signs of real change thanks to best practices carried forward?
(iv) What are the conditions needed for the best practices identified to be adopted and succeed elsewhere?
(v) In some territories, are best practices emerging in other contexts adopted or replicated? Does the same implementer team refer to other processes?
Source: Prepared by the author, on the basis of the module on capitalizing on best practices for social cohesion under the URB-AL III Programme of the European Commission.
Table III.16 sets out factors that can be the basis for analyzing the process or the best practices identified during it.
Table III.16 Factors to consider in stakeholder dialogue best practices
Institutional innovation
(a) Product innovation (new institutions)(b) Process innovation (new organizational systems)
Territorial governance(a) Vertical(b) Horizontal
Citizen participation
Generation of public-private partnerships
Human resources training
Significant increase in employability
Source: Prepared by the author, on the basis of the module on capitalizing on best practices for social cohesion under the URB-AL III Programme of the European Commission.
Based on these factors it is possible to determine how much influence a best practice has, better gauge the impact of the process in general and in particular, identify shifting objectives, in order to get the most out of the process (see table III.17).

142 ECLAC
Table III.17 Intensity of the factors to consider in stakeholder dialogue good practices
Factors identified for consideration in stakeholder dialogue good practices
Very weak
0
Weak1
Normal2
Strong3
Very strong
4
Institutional innovation
Product innovation (new institutions)
Process innovation (new organizational systems)
Territorial governanceVertical governance
Horizontal governance
Citizen participation
Generation of public-private partnerships
Human resources training
Significant increase in employability
Source: Prepared by the author, on the basis of the module on capitalizing on best practices for social cohesion under the URB-AL III Programme of the European Commission.
H. Conclusions and final recommendationsThis chapter provides a conceptual framework and practical information for organizing and managing stakeholder dialogue, aimed at building public and private sector strategies. In a multi-stakeholder dialogue, processes may change after initial planning. But form as part of a dialogue is crucial for a successful process because it ensures that fact-finding, the choice of actors and the type of dialogue will be appropriate and it identifies the shared goal of the stakeholders, the implementer team, the nature of the process and how to proceed. All these elements lay the groundwork for the stakeholder dialogue and will shape its future.
During implementation, after the training and planning stages, the stakeholder dialogue could lose momentum due to lack of interest or because the results that the actors want are not being achieved. In response to this situation, this chapter contains recommendations on organizational readiness and planning for stakeholder dialogue. These recommendations, and following the processes as set out in the guide, can help to minimize risk situations.
A stakeholder dialogue with a goal shared by all actors, that operates in a structured manner and has a clear horizon of work is more

Strengthening value chains… 143
likely to succeed than another one without these characteristics. Dialogues can lead to interactions that in turn lead to public-private partnerships, partnerships between academia and the private sector, or partnerships between public agencies that are not always coordinated. This allows for better identification, discussion and implementation of public policies and economic and social development strategies.
The tools described in this chapter have been tested with successful results in other countries and provide a valuable guide for implementer team work and decision-making as to the direction to be taken by the stakeholder dialogue. But the specificities of each case require that the implementers always take care to examine actor behaviour and the stakeholder dialogue in order to implement measures and create new tools if necessary.
Tips and tools based on practice have been set out in a structured manner, in accordance with the order needed for organizing and managing stakeholder dialogue. The following are some final recommendations.
Stakeholder dialogue. Stakeholder dialogue is not a highly planned process where most of the internal and external variables are under control. The planning horizon may depart from the original idea and design; this does not necessarily mean that there were mistakes. This is a stakeholder-driven process, so it is not completely mapped out or controlled entirely by the facilitator.
Common sense. In major decisions, in the small details and in meetings with all the actors or with the implementer team, confidence in knowledge of the context and in the actors is a must. It may sometimes be tempting to seek more comprehensive results or plan multiple activities owing to the positive initial conditions, but it is necessary to objectively assess the best approach.
Patience. The process involves people with different paradigms (because of their history, interests, sector and other factors), so in some processes the groups come to own the dialogue and its content more quickly. In others, it takes more time. It is also likely that certain processes promptly show achievements, while others take longer. A little patience accompanied by support can help put the process on more autonomous footing.
Individuals. The actors are people; they have individual traits such as humour, aspirations, motivations and judgement. Bearing this in mind at all times will make it easier to work with them and will foster a better relationship. A group may be composed of individuals ranging from ones who are willing, active and positive, to others who are skeptical, negative and ill-tempered. In the face of extreme behaviours it is best to put in place strategies to help maintain group harmony. Negative individuals who say

144 ECLAC
“no” to everything should be asked to explain why, to propose something and to take responsibility for it with support from others. Enthusiastic individuals can be spoken with in private, congratulated and asked for assistance in involving and motivating other actors.
Conflict management. At times, stakeholder dialogue can resemble a negotiating process where there are different positions and actors who do not want to compromise on certain interests. On other occasions there can be misunderstandings or discord at a personal level, so the ability to properly manage such conflict situations is essential. The search for middle ground, the prioritization of interests and transparency help to minimize and control conflict within the group. These are skills that the group notices and learns quickly.
Constructive approach and win-win strategy. From initial planning by the implementers, to interviews with key actors, to process launch and management, all the way through to completion, following a constructive rationale and a win-win strategy can help to build conviction and partnerships. Knowing in advance what an actor and his or her institution aspire to, and how stakeholder dialogue can further those objectives, also contributes to building partnerships.
Stakeholder dialogue is a powerful tool for the design and implementation of public policies that enjoy the consensus and commitment of the private sector, but also of various actors who demand or supply goods and services to enterprises (universities, chambers of industry and research centres, among others). The involvement of such actors in the various phases of policy development brings their capacities and needs into the mix and strengthens their ownership of and commitment to the strategies designed.

Strengthening value chains… 145
Useful links
America Speakswww.americaspeaks.org
Association for Conflict Resolutionwww.acresolution.org
Collective Leadership Institutewww.collectiveleadership.com
Conflict Resolution Information Source (CRinfo)www.crinfo.org
Democratic Dialogue Networkwww.democraticdialoguenetwork.org
Global Knowledge Partnershipwww.globalkowledge.org
Ideas and Tools for Community Changewww.everyday-democracy.org/en/index.htm
Leader to Leader Institutewww.drukerinstitute.com
One World Trustwww.oneworldtrust.org Sustainable Development Gatewaywww.sdgateway.net/topics/265.htm
Synergoswww.synergos.org
The Program on Intergroup Relationswww.igr.umich.edu/
The Co-Intelligence Institutewww.co-intelligence.org

146 ECLAC
BibliographyAnder Egg, Ezequiel (1995), Introducción a la planificación, Buenos Aires, Lumen.Aramayo, Orión (2006), Manual de planificación estratégica, Santiago, Chile,
Communication and Image Institute, University of Chile. Bendaña, Ernesto (2007), “Presentación: La articulación productiva y la importancia
de las redes empresariales horizontales”, United Nations Industrial Development Organization (UNIDO).
CEDPA (Centre for Development and Population Activities) (2004), Planificación estratégica: Un enfoque de indagación, Washington, D.C.
CLI (Collective Leadership Institute) (2011), “Working with Stakeholder Dialogues” [online] http://collectiveleadership.com/en/skills/dialogic-change-model.html.
Devlin, Robert and Graciela Moguillansky (2010), “Alianzas público-privadas para una nueva visión estratégica del desarrollo”, Libros de la CEPAL, No. 108 (LC/G.2426-P), Santiago, Chile, Economic Commission for Latin America and the Caribbean (ECLAC). United Nations publication, Sales No. S.09.II.G.152.
Görg, Christian and others (2011), Stakeholder Dialogues Manual, German Agency for International Cooperation (GIZ)/Collective Leadership Institute (CLI) [online] http://www.collectiveleadership.com/fileadmin/user_upload/Downloads/publications/SD-Manual_EN_021111_Download.pdf.
Jara, Oscar (2005), Para sistematizar experiencias: Una propuesta teórica y práctica, Lima, Red Alforja.
Ostrom, Elinor (1990), El gobierno de los bienes comunes. La evolución de las instituciones de acción colectiva, Mexico City, National Autonomous University of Mexico/Fondo de Cultura Económica (FCE).
Rayo, Alexander (2012), Fact Sheet: Technical Roundtable of Innovation, German Agency for International Cooperation (GIZ).
Rhi-Sausi, José Luis, Darío Conato and Myriam Lamela (2011), “Capitalización de buenas prácticas para la cohesión social”, Programa URB-AL III, European Commission.
Sandoval, Tessa and Ligia Orantes (2011), Creación mesas técnicas de innovación experiencia Honduras y Guatemala, German Agency for International Cooperation (GIZ).
Varela, Ruth (2006), Guía didáctica para sistematizar experiencias, German Agency for International Cooperation (GIZ).

Chapter IV
The shrimp aquaculture chain in El Salvador
Nahuel Oddone Claudia Stella Beltrán T.
A. Introduction
This chapter is an output of technical collaboration between the Ministry of Economy of El Salvador and the ECLAC subregional headquarters in Mexico, in response to the desire expressed by the Government of El Salvador to strengthen its industrial policy and significantly improve a number of value chains through a process of upgrading.
The value-chain strengthening methodology requires a diagnostic assessment to be made of constraints, and the participants, links and relations in the chain to be systemized to identify the obstacles that the chain-upgrading process is likely to confront.1
The chapter is divided into 13 sections, including this introduction. Part I (sections B to G) describes the shrimp aquaculture chain, and section B makes a diagnostic assessment of the chain. Section C describes the participants in this activity and the sector’s products; section D analyses the costs and profit margins with which this product line operates and the factors that determine its competitiveness; section E reviews the shrimp market in El Salvador, in terms of consumption, marketing, quality and safety, along with the governance of the chain, among other aspects; section F describes health issues, and the risks of diseases and harmful species that could be mitigated with good aquaculture practices; and
1 See chapter II of this volume.

148 ECLAC
section G projects the profits and economic and employment benefits for the chain’s main stakeholders, and also considers its financing problems.
Part II of this chapter (sections H to M) discusses proposals aimed at upgrading the shrimp cultivation chain using an integrated approach. Section H reviews strategies for the development of the shrimp farming activity and serves as an introduction to this part of the chapter. Section I describes a set of recommendations for addressing the systemic constraints faced by this production chain; section J formulates recommendations for each link in the chain; and section K provides a summary of constraints, good practices and recommendations. Section L then describes five programmes with 13 strategies for upgrading the shrimp aquaculture chain; and the chapter ends with conclusions in section M, which recapitulates the key aspects described in the text and highlights the importance of securing participation, commitment and support from all stakeholders in the production chain to further develop El Salvador’s aquaculture sector.
Part I
The shrimp aquaculture chain: characteristics, potential and constraints
B. Diagnostic assessment of the shrimp aquaculture chain2
The shrimp aquaculture value chain was chosen as the focus of various initiatives and of this case study for its potential to generate employment and promote regional development in El Salvador’s coastal zone, within the framework of the Marine Coastal Zone Integrated and Sustainable Development Strategy; and also because of the social recognition given by the national government to a group of producers who had participated in the armed conflict of the 1980s.
Strengthening the shrimp aquaculture chain in El Salvador could help reduce poverty in the coastal zone, improve the food security of its inhabitants, create poles of attraction for investment, reduce territorial asymmetries, help to expand the domestic market and, as the case may be, increase export capacity.
2 For a full version of the diagnostic study, see Oddone and Beltrán (2013) [online] http://www.eclac.cl/publicaciones/xml9/52059/Diagnosticodelacadena.pdf.

Strengthening value chains… 149
1. General features of shrimp farming
Shrimp farming in El Salvador is currently a small-scale activity. Although it is a high-cost business requiring substantial levels of investment, it has potential to be very profitable if good production practices are applied and business management skills are developed.
Shrimp cultivation in El Salvador is done mainly in cooperatives, mostly comprising former combatants and retired military personnel who participated in the armed conflict in the 1980s, along with a few independent producers. All of them can be classified in the micro, small and medium-sized enterprise (MSME) segment. The latter, as defined by the Commission for Inland Fisheries and Aquaculture of Latin America and the Caribbean (COPESCAALC), a statutory body of the Food and Agriculture Organization of the United Nations (FAO), consists of aquaculture practiced for commercial purposes, which generates paid employment, has a high technical level and does not exceed the thresholds defined for small businesses in each country.
Aquaculture in microenterprise and small businesses is poorly developed and needs support to raise its competitiveness and ensure its sustainability. Owing to a lack of resources, producers in this segment are unable to guarantee the quality and safety of their product, comply with the regulatory framework, gain access to credit, apply technological improvements, maintain efficient management, achieve a profitable level of productivity, gain logistical self-sufficiency, and access market information, among other factors (Rodríguez Vázquez, 2013).
Aquaculture currently accounts for 50% of the total volume of fish and seafood produced for human consumption worldwide, and its output is expected to surpass that of beef, pork and poultry in the coming decade (FAO, 2012). The sector is one of the most dynamic global food suppliers, having grown by 8.8% per year on average over the last three decades.
In 2010, global aquaculture production reached a level of 60 million tonnes, with an estimated value of US$ 119 billion. Nonetheless, its performance has been cyclical, with periods of boom followed by phases of contraction (Rodríguez Vázquez, 2013), caused by a number of factors that contribute to the sector’s weak horizontal and vertical governance (World Bank, 2011).

150 ECLAC
Table IV.1 Characteristics of microenterprise and small-business aquaculture applicable
to shrimp farming in El Salvador
Activity Characteristics of management
Infrastructure Machine-built tanks.Pumping equipment and, in some cases, aeration equipment.May or may not have product processing and canning facilities.
Hydraulic management Tidal replacement of water in extensive farm units, although this practice is inadvisable.Water replacement relying 5% to 10% on pumping depending on the growth stage of the shrimp.
Seed In semi-intensive and improved extensive aquaculture operations, seed produced by private laboratories or by the Directorate General of Fisheries and Aquaculture of El Salvador (CENDEPESCA). Purchased or subsidized.In extensive farms: seed captured in the natural environment.
Feed In semi-intensive and improved-extensive farms: feed with 35% to 25% protein content, depending on the growth stage of the shrimp.In extensive farms: natural feed.
Labour Members of cooperatives and external employees.
Productivity Two to four harvests per year.
Post-harvest Tank-side sale of live shrimp.No processing or value-added.No procedures to control product handling in the intermediation stage.Frequent failings in the cold chain while the product is being transported from harvest to the final consumer.
Source: Prepared by the authors, on the basis of Alejandro Flores Nava, “Diagnóstico de la acuicultura de recursos limitados y de la acuicultura de la micro y pequeña empresa en América Latina”, Acuicultura en América Latina series, No. 7, Santiago, Chile, Food and Agriculture Organization of the United Nations (FAO), December 2012.
In Latin America and the Caribbean, aquaculture has grown vigorously over the last two decades, with output rising from 191,000 tonnes in 1990 to 1,920,000 tonnes in 2010. The Latin American share of total world production grew from 1.5% to 3.2% in the same period, and the number of Latin American and Caribbean producers more than tripled, from 69,000 to 248,000. At the subregional level, Central American fishery and aquaculture production volumes averaged 422,210 tonnes per year from 2000 to 2010. Despite the sustained decline in fishing (-36%), this segment still accounts 80% of total production, thanks particularly to catches of anchovy and herring in Panama, and of tuna and scale fish in Costa Rica and Panama. Central American aquaculture grew by 198% during the last decade, producing an annual average of 81,565 tonnes in 2010, of which 65% corresponds to cultivated shrimp, 34% to tilapia and 1% to trout, cobia and oysters (Beltrán, 2013).

Strengthening value chains… 151
Figure IV.1 Central America: aquaculture production, subregional and by country, 2000-2010
(Tonnes)
0
20 000
40 000
60 000
80 000
100 000
120 000
140 000
2000 2001 2002 2003 2004 2005 2006 2007 2008 2009 2010
Costa RicaEl Salvador
GuatemalaHonduras
NicaraguaPanama
Regional totalLinear (regional total)
Source: Claudia Beltrán, Contribución de la pesca y la acuicultura a la seguridad alimentaria y el ingreso familiar en Centroamérica, Rome, Food and Agriculture Organization of the United Nations (FAO), 2013.
Shrimp is one of the fastest-growing commodities on national and international markets given its commercial value and sustained demand, despite periods of economic crisis or recession. Apart from Latin America, shrimp cultivation is practised in Asia, which is the world’s largest producing region, and also in Africa. With the exception of El Salvador, shrimp farming in Central America is done on an industrial scale, through commercial links with small-scale aquaculture operators in a number of countries.
Table IV.2 Central America: aquaculture production, subregional and by country, 2000-2010
(Tonnes)
2000 2002 2004 2006 2008 2010 Period total
Percentage share
Belize 3 637 4 354 11 065 7 235 2 280 4 286 a 65 487 10.06Costa Rica 1 300 4 102 5 081 5 730 5 269 3 216 46 096 7.09El Salvador 196 372 435 336 219 394 3 570 0.55Guatemala 1 492 5 400 3 964 8 436 17 883 15 944 95 854 14.74Honduras 12 041 18 149 27 748 35 811 17 803 22 273 258 475 39.74Nicaragua 5 422 6 102 7 849 10 860 14 690 16 587 112 322 17.26Panama 1 292 4 768 6 520 9 317 7 788 6 105 68 672 10.55Total 25 380 43 247 62 662 77 725 65 932 66 839 650 475 100
Source: Prepared by the authors, on the basis of C. Beltrán, Contribución de la pesca y la acuicultura a la seguridad alimentaria y el ingreso familiar en Centroamérica, Rome, Food and Agriculture Organization of the United Nations (FAO), 2013 and statistics provided by the respective countries.
a Estimate.

152 ECLAC
2. Trend and characteristics of shrimp farming in El Salvador
Shrimp farming in El Salvador began in 1982 under an international co-operation programme sponsored by United States Agency for International Development (USAID) and implemented by the Salvadoran Economic and Social Development Foundation (FUSADES). Up to 1998, marine shrimp was the most widely cultivated species, and the activity developed rapidly. The potential area was estimated at roughly 4,000 ha, and seed was even exported to Honduras, Guatemala and Nicaragua. Larvae from the natural environment were used for cultivation, but hurricane Mitch devastated the activity and set back its process of expansion.
In 2003, shrimp farming declined still further. Seed production was abandoned, and just 10% of industrial producers were able to import seed from Guatemala, while supply to medium-sized aquaculture operators came to depend on the Directorate-General of Fishery and Aquaculture Development of El Salvador (CENDEPESCA). The sector suffered the consequences of the white spot syndrome virus,3 exports came to a halt and producers turned their attention to the domestic market. Small-scale shrimp cultivation embarked upon a new expansion after this crisis, coinciding with the total or partial replacement of salt production in the land areas awarded to beneficiaries of the 1992 Peace Accords.
Shrimp are obtained in two ways: marine fishing and farming. In both cases, the most important species is the white-leg shrimp (Litopenaeus vannamei), although fishing also exploits two other white shrimp species (Penaeus stylirostris and Penaeus occidentalis), the tití shrimp or camaroncillo (Trachipenaeus similis pacificus and Xiphopenaeus riveti, respectively), along with the brown shrimp (Penaeus californiensis) and red shrimp (Penaeus brevirostris).
According to CENDEPESCA, from 2002 to 2012, marine and inshore fishing accounted for 91% of total production, with aquaculture producing the remaining 9%. Fishing decreased by 0.1% between 2002 and 2012,4 while aquaculture maintained its rapid growth trend (499% in the period), driven more by tilapia production than by shrimp. Although aquaculture grew at a vertiginous pace, small and medium-scale tilapia and shrimp farming is significantly under- recorded, so the contribution made by these segments
3 This virus causes white spots to appear in the infected specimens. First detected in Taiwan Province of China in 1992, it has wiped out between 80% and 100% of several crops in Asia, Latin America and North America.
4 Tuna fishing, which accounts for 42.5% of total fishery production, remained relatively stable, whereas small-scale sea fishing grew by 21%.
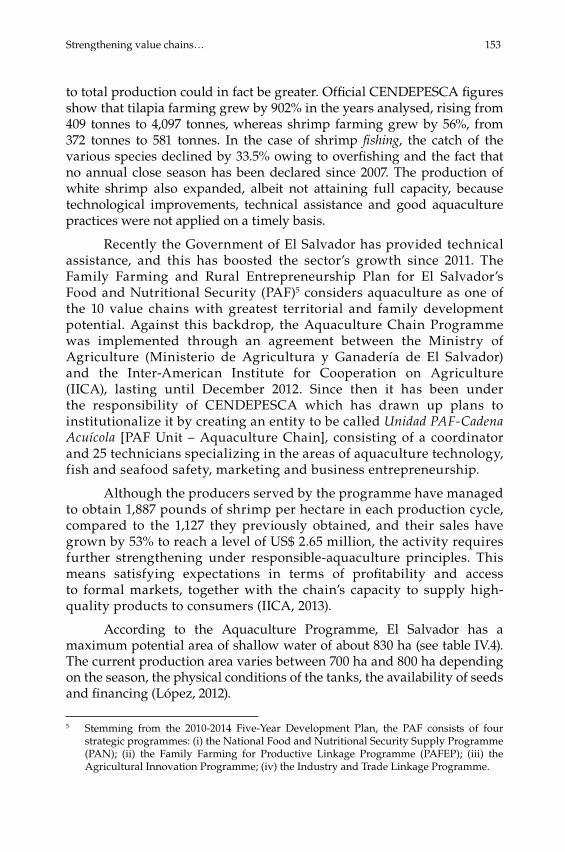
Strengthening value chains… 153
to total production could in fact be greater. Official CENDEPESCA figures show that tilapia farming grew by 902% in the years analysed, rising from 409 tonnes to 4,097 tonnes, whereas shrimp farming grew by 56%, from 372 tonnes to 581 tonnes. In the case of shrimp fishing, the catch of the various species declined by 33.5% owing to overfishing and the fact that no annual close season has been declared since 2007. The production of white shrimp also expanded, albeit not attaining full capacity, because technological improvements, technical assistance and good aquaculture practices were not applied on a timely basis.
Recently the Government of El Salvador has provided technical assistance, and this has boosted the sector’s growth since 2011. The Family Farming and Rural Entrepreneurship Plan for El Salvador’s Food and Nutritional Security (PAF)5 considers aquaculture as one of the 10 value chains with greatest territorial and family development potential. Against this backdrop, the Aquaculture Chain Programme was implemented through an agreement between the Ministry of Agriculture (Ministerio de Agricultura y Ganadería de El Salvador) and the Inter-American Institute for Cooperation on Agriculture (IICA), lasting until December 2012. Since then it has been under the responsibility of CENDEPESCA which has drawn up plans to institutionalize it by creating an entity to be called Unidad PAF-Cadena Acuícola [PAF Unit – Aquaculture Chain], consisting of a coordinator and 25 technicians specializing in the areas of aquaculture technology, fish and seafood safety, marketing and business entrepreneurship.
Although the producers served by the programme have managed to obtain 1,887 pounds of shrimp per hectare in each production cycle, compared to the 1,127 they previously obtained, and their sales have grown by 53% to reach a level of US$ 2.65 million, the activity requires further strengthening under responsible-aquaculture principles. This means satisfying expectations in terms of profitability and access to formal markets, together with the chain’s capacity to supply high-quality products to consumers (IICA, 2013).
According to the Aquaculture Programme, El Salvador has a maximum potential area of shallow water of about 830 ha (see table IV.4). The current production area varies between 700 ha and 800 ha depending on the season, the physical conditions of the tanks, the availability of seeds and financing (López, 2012).
5 Stemming from the 2010-2014 Five-Year Development Plan, the PAF consists of four strategic programmes: (i) the National Food and Nutritional Security Supply Programme (PAN); (ii) the Family Farming for Productive Linkage Programme (PAFEP); (iii) the Agricultural Innovation Programme; (iv) the Industry and Trade Linkage Programme.

154 ECLAC
Table IV.3 El Salvador: fishery and aquaculture production, 2002-2012
(Tonnes)
2002 2004 2006 2008 2010 2012 Total period
Percentage share
Industrial fishing 16 811 15 305 17 247 24 394 15 367 14 564 188 241 47.5
Shrimp 380 260 195 210 215 213 2 877 0.7
Tití shrimp (camaroncillo) 872 562 429 851 815 620 7 385 1.9
Incidental fauna 400 262 351 386 499 289 4 170 1.1
Squat lobster (langostilla) 247 598 778 287 0 0 4 564 1.2
Tuna (trawl net) 14 800 13 599 15 443 22 616 13 791 13 394 168 672 42.5
Long-line fishing 112 24 51 44 47 48 573 0.1
Small-scale marine fishing 12 007 11 132 12 684 14 102 14 457 14 545 146 855 37.0
Inshore fishing 2 664 2 205 2 033 2 267 2 326 2 340 25 798 6.5
Aquaculture 781 2 219 3 078 4 199 4 488 4 678 35 718 9.0
Marine shrimp 372 435 336 219 394 581 4 359 1.1
Tilapia 409 1 784 2 742 3 980 4 094 4 097 31 359 7.9
Total 32 263 30 861 35 042 44 962 36 638 36 127 396 612 100
Annual growth rate 4.1% 15.7% 7.3% -14.9% 0.8%
Source: Directorate General of Fishery and Aquaculture Development of El Salvador (CENDEPESCA), 2013.
Table IV.4 El Salvador: geographical distribution of shrimp farming operations
Department ZoneMaximum potential
cultivation area (hectares)
Departmental share (percentages)
Usulután Bahía de Jiquilisco, 493 59.3
Usulután and Jucuarán 230 27.6
La Paz San Luis La Herradura, 16 1.9
Zacatecoluca 65 7.8
Sonsonate 20 2.4
La Unión 8 1.0
Total 832 100
Source: Prepared by the authors, on the basis of the Aquaculture Chain Programme and FUNDE.
El Salvador’s shrimp farmers consist mostly of former combatants and retired military personnel. Under the Chapultepec Peace Accords

Strengthening value chains… 155
of 1992,6 they obtained land areas to produce salt, but this business ceased to be attractive when the product started to be imported from Mexico. Taking advantage of the fact that shrimp grew naturally in the saltpans, around 1996 the European Union started to support the development of extensive shrimp cultivation. The activity also attracted a small number of independent producers.
The shrimp aquaculture activity is carried on in mangrove areas along the coast. El Salvador has adopted measures to protect these ecosystems, one of the effects of which has been to restrict the authorization of the new permits to expand shrimp farming zones. In May 2012, the National Ecosystems and Landscape Restoration Programme was launched with the aim of restoring and conserving critical ecosystems such as mangroves, forests and wetlands, and to prevent the sea causing damage to persons, crops and infrastructure during extreme weather events (MARN, 2013). The shrimp cultivation zones that have been prioritized are Bahía de Jiquilisco,7 Jaltepeque, Bahía de La Unión, El Tamarindo, Cuco-Esterón, Santa Clara, San Diego-El Amatal, Barra Salada, Acajutla, Metalío, Barra de Santiago, El Zapote and Garita Palmera at the mouth of the Paz river (see map IV.1).
Map IV.1 El Salvador: map of shrimp farming projects
Airport
PortTaxi
Sonsonate La Libertad
Ahuachapan Cuscatlan
La Paz
San Salvador
SanVicente
La UniónSanMiguel
Cabañas
Chalatenango
Santa MaríaEreguayquinEreguayquin
Concepción Batres
San Agustín OzatlanTecoluca
SantaAna
Morazan
Usulatan
Usulatan
San Dionisio
Puerto El Triunfo
JiquiliscoSanta María
Concepción Batres
San Agustín OzatlanTecoluca
Usulatan
San Dionisio
Puerto El Triunfo
Jiquilisco
El Amarillo
Puerto de CutucoPuerto
El Triunfo
Aeropuerto Internacional de El Salvador
Aeropuerto de Llopango
Puertode la
Libertad
Puerto de Acajutla
La Hachadura
Las Chinamas
San Cristobal
AnguiatuEl Poy
Source: Ministry of Environment and Natural Resources (MARN) of El Salvador, “Los bosques salados, prioridad del Programme Nacional de Restauración de Ecosistemas”, San Salvador, March 2013.
Note: Areas circled in blue: protected mangroves. Areas circled in red: mangroves under threat.
6 Chapter V, paragraph 2 (b) discusses land areas that are state-owned but not currently forest reserves. Under the 1992 Chapultepec Peace Accords, the various programmes implemented by the Salvadoran government to transfer state-owned agricultural land give preference to former combatants from both sides who voluntarily apply for land, who are of peasant farming origin and are landless.
7 On 31 October 2005, this was declared a Ramsar site, under the Convention on Wetlands of International Importance, Especially Waterfowl Habitat.
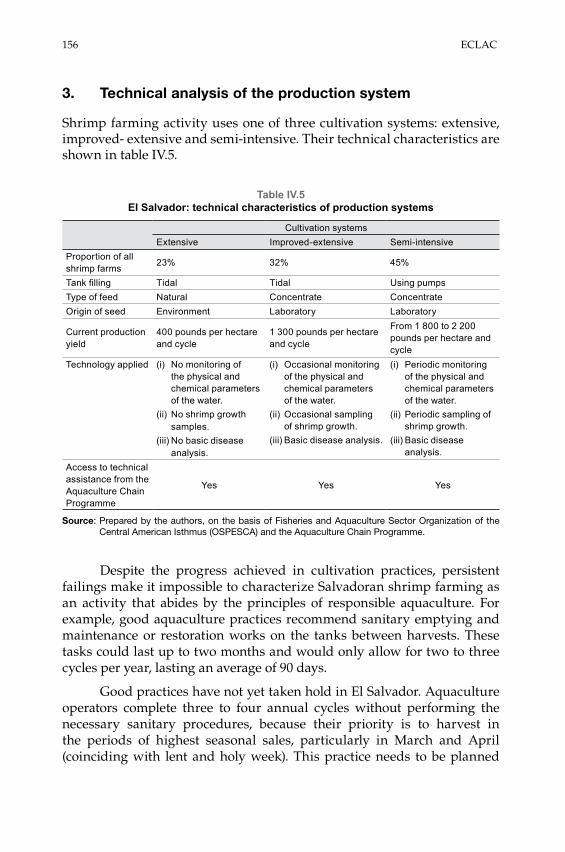
156 ECLAC
3. Technical analysis of the production system
Shrimp farming activity uses one of three cultivation systems: extensive, improved- extensive and semi-intensive. Their technical characteristics are shown in table IV.5.
Table IV.5 El Salvador: technical characteristics of production systems
Cultivation systemsExtensive Improved-extensive Semi-intensive
Proportion of all shrimp farms 23% 32% 45%
Tank filling Tidal Tidal Using pumpsType of feed Natural Concentrate ConcentrateOrigin of seed Environment Laboratory Laboratory
Current production yield
400 pounds per hectare and cycle
1 300 pounds per hectare and cycle
From 1 800 to 2 200 pounds per hectare and cycle
Technology applied (i) No monitoring of the physical and chemical parameters of the water.
(ii) No shrimp growth samples.
(iii) No basic disease analysis.
(i) Occasional monitoring of the physical and chemical parameters of the water.
(ii) Occasional sampling of shrimp growth.
(iii) Basic disease analysis.
(i) Periodic monitoring of the physical and chemical parameters of the water.
(ii) Periodic sampling of shrimp growth.
(iii) Basic disease analysis.
Access to technical assistance from the Aquaculture Chain Programme
Yes Yes Yes
Source: Prepared by the authors, on the basis of Fisheries and Aquaculture Sector Organization of the Central American Isthmus (OSPESCA) and the Aquaculture Chain Programme.
Despite the progress achieved in cultivation practices, persistent failings make it impossible to characterize Salvadoran shrimp farming as an activity that abides by the principles of responsible aquaculture. For example, good aquaculture practices recommend sanitary emptying and maintenance or restoration works on the tanks between harvests. These tasks could last up to two months and would only allow for two to three cycles per year, lasting an average of 90 days.
Good practices have not yet taken hold in El Salvador. Aquaculture operators complete three to four annual cycles without performing the necessary sanitary procedures, because their priority is to harvest in the periods of highest seasonal sales, particularly in March and April (coinciding with lent and holy week). This practice needs to be planned

Strengthening value chains… 157
and coordinated with a larger number of cooperatives, with a view to obtaining graduated production that maintains supply at attractive prices throughout the year. This would also help to make biosafety measures more effective and improve the programming of seeding processes, particularly during the summer, where lack of rainfall increases the salinity of the water and slows down growth.
Good practices are also not applied in post-harvest management, particularly in terms of maintaining the cold chain. Intermediaries normally use isothermal boxes containing ice in blocks to transport and preserve the shrimp until it is sold; but as time passes this becomes ice-cold water. This procedure does not guarantee a uniform distribution of temperature, the refrigeration process is slow and allows microbes to reproduce when ice crystals form and break the fibres of the product, generating a rubbery texture, which is wrinkled and unpleasant to the taste. The best practice is to use flake ice because this does not melt quickly, can be uniformly distributed, does not produce a mixture of water with the shrimps’ own fluids, and improves refrigeration.
Diagram IV.1 El Salvador: weaknesses of the shrimp aquaculture chain
Errors and inefficiency in
production systems
Late access to technical assistance
and technology transfer
Low investment capacity
High control of farm gate
intermediariesa
Scant development
of management and commercial
skillsLow
profitability
High vulnerability to
pathologies and invasive
species
Modest harvests without constant
periodicity
Source: Prepared by the authors, on the basis of J. López, Caracterización de la cadena productiva de acuicultura (camarón de mar), Ministry of Agriculture and Livestock of El Salvador/Inter-American Institute for Cooperation on Agriculture (IICA), San Salvador, 2007.
a Farm gate intermediaries (intermediarios en borda) are traders who purchase the cultivated shrimp directly from the producer.

158 ECLAC
C. Identification of the chain’s participants and products
The value-chain concept refers to the set of stakeholders who participate in processes of machinery, equipment and input supply; production, transport, distribution, marketing and consumption. The aim is to understand how the stakeholders add value in the production process, considering all of the relations that are generated in each phase and between them, together with the institutional support services that affect their functioning and competitiveness.
In Diagram IV.2 the continuous lines represent the direct relations between the links of the chain, whereas the dotted lines connect indirect stakeholders. The central link is identified first, namely the shrimp farmers; and then orward and backward linkages are recognised from that point. The main backward linkage consists of equipment and input suppliers, while the main forward linkage consists of the farmgate intermediaries, from which it is possible to link to a series of traders, wholesalers or retailers, ending with the final consumer.
Diagram IV.2 El Salvador: the shrimp aquaculture value chain
Equipment and input suppliers
National and international cooperation
partners
Shrimp farmers
Farm gate intermediariesa
Retailers and street vendors
Final consumerSupermarkets,
restaurants, hotels and institutions
Wholesalers “La Tiendona”
Shrimp processors
Source: Prepared by the authors.a Farm gate intermediaries (intermediarios en borda) are traders who purchase the cultivated shrimp
directly from the producer.
1. Equipment and input suppliers
As aquaculture production in El Salvador is relatively small-scale, equipment and input suppliers cannot plan their sales over the medium
Strengthening value chains… 159
term. This has discouraged businesses involving the direct representatives of the leading manufacturing or marketing firms from setting up in the country. The equipment most widely used in the shrimp farming activity includes the following:
(i) Motor-driven pumps and aerators in the tanks for filling, replacing and oxygenating the water.
(ii) pH-meter, oximeter and salinometer to measure the physical and chemical parameters of the water.
(iii) Feeders, fishing nets and boats to feed and harvest the farmed shrimp.
Some small domestic firms import equipment and inputs from the United States when buyers place an order, or from Asian countries when larger volumes are involved. Payment is usually made in cash in the case of small transactions, or in two instalments for larger volumes (40% with the order and 60% on delivery). Imports have to be specially ordered owing to the cost of maintaining inventories of machinery and equipment with a slow sales turnover, and because rapid technological evolution raises the risk of accumulating obsolete equipment. These imports tend to face lower barriers than chemical products and feed (particularly the brine shrimp (artemia salina) used in seed production), the entry of which requires approval from the Ministry of Agriculture.
National and international cooperation partners make the largest equipment purchases; and suppliers usually grant these entities credit on the basis of their institutional backing; in contrast aquaculture operators who lack collateral or sufficient borrowing capacity do not receive the same treatment. Some suppliers provide technical assistance for equipment operation and maintenance, to prevent damage from occurring that could result in guarantee claims or replacement. The interviews held for this study revealed an additional problem for national distributors, namely the entry of contraband equipment and materials from Honduras, which is often produced informally and thus represents unfair competition.
The most important inputs are seeds (post-larval shrimp), concentrated feed (pienso), microalgae, brine shrimp (artemia salina), chemicals (tetracycline and neguvon, among others), chemical and other fertilizers (superphosphate 12-24-12 and urea, among others), along with lime, sand, filters, wood, and fuel and lubricants for the motor pumps and vehicles. These inputs are generally paid for in cash, and there are direct representatives of the manufacturers in the country. While most come from the United States, Guatemala, Honduras and Nicaragua, the microalgae are obtained from Taiwan Province of China.

160 ECLAC
The feed concentrate and seed operation is described in detail in the following paragraphs, in view of its major effect on the shrimp aquaculture cost structure and production process.
• Feed concentrate: The Salvadoran market represents 5% of the sales of direct distributors in Central America and, according to the suppliers, generates a profit margin of about 8%. Feed concentrate represents 50-60% of production costs for the shrimp farmers. The useful life of the feed containing 35% protein is three months, while feed with 25% protein lasts eight months, depending on storage practices.
In El Salvador there is one distribution firm that represents two producers and provides technical assistance to buyers. The Aquaculture Chain Programme has enabled producers to improve the use and conservation of the feed, but problems persist in terms of inefficiency and under-registration of the doses administered, which cause unnecessary consumption and raise production costs. To achieve economies of scale in transport costs, some cooperatives purchase feed jointly. Its price is raised about three times a year, by about around 0.5% each time, depending on importation charges and the international prices of maize and soybean.
• Seed: Seed is produced in four laboratories: Los Cóbanos, which belongs to CENDEPESCA and receives technical and financial assistance from the International Development Cooperation Fund of Taiwan Province of China (ICDF), and three private laboratories. Seed production is based on the Nauplius,8 currently imported from the certified MAYASAL laboratory in Guatemala. The authorized private laboratories that carry out the maturation process9 sometimes use imported Nauplius or else they produce them in El Salvador with their own breeding stock; but the country does not have capacity to produce its own disease-free genetic lines.
CENDEPESCA’s Los Cóbanos laboratory operates with adequate quality standards; its installed capacity is 12-15 million post larvae per cycle of 22-25 days (it is currently using 37% of its capacity); and it charges lower prices than private laboratories
8 Nauplius is the name given to the first larval stage of the shrimp and is obtained from the egg produced in the laboratory. The nauplio turns into zoeas, and these in turn into mysis, before becoming post larvae.
9 Not all producers have the infrastructure needed to carry out the maturation process, so they buy the Nauplius (imported from Guatemala or Honduras) and produce post larvae from them.

Strengthening value chains… 161
because it does not charge value-added tax (VAT);10 it does not provide technical assistance, however. It is located in an isolated zone and does not deliver to the farms, so the survival of the seed depends on the transport conditions provided by the buyers, although an extra 10% is usually added to the volume purchased to compensate for mortality.
One of the private laboratories has attained disease-free certification and undertakes the maturation process; it is located in the cultivation zone, is easily accessible, provides technical assistance and delivers seeds to the farms, thus reducing mortality caused by bad transport conditions. Another laboratory offers credit, but the opinions obtained suggest its quality standards are lower than those of its competitors. The third laboratory is not yet certified. The frequency of renewal of the broodstock (padrotes) and updating of technical staff could be improved.
Seed producers face the same difficulties as feed suppliers: problems in planning production volumes and harvest dates. They have to work with short-term orders since the nauplius-to-post larva growth cycle lasts no longer than 12 days.
2. Shrimp farmers
This link comprises the cooperatives and small-scale producers established in the coastal zone of Usulután, La Paz, Sonsonate and La Unión. The 800 ha of shallow water available for shrimp farming are exploited by about 44 cooperatives involving roughly 1,500 people, according to the Aquaculture Chain Programme. There is an average of two employees for every 5 ha, working 24-hour shifts, with responsibility for surveillance and feeding in the tanks.
Not all cooperatives have concession rights to engage in shrimp farming. A start has been made on streamlining this procedure, thanks to the work of the Ministry of Agriculture and the Ministry of the Environment and Natural Resources, both of El Salvador, which began in 2011. The concessions procedure is one of the main obstacles, since holding an environmental permit is an essential pre-requisite for obtaining the cultivation permit. The difficulty arose because the regulations to the General Law on the Organization and Promotion of Fishery Activities (2007) made authorization for aquaculture dependent obtaining an environmental permit issued by the competent authority.
10 The Los Cóbanos sale price is US$ 4,000 per million post larvae, whereas private laboratories sell at US$ 4,500 per million. The difference in price is accounted for by VAT.

162 ECLAC
The Ministry of the Environment and Natural Resources has proposed a management plan with standard terms of reference, which the producers implement with assistance from contracted consultants, paying a flat fee of US$ 300 for the service. The format must include information on the project and the environmental strategy plan to repair the impact caused to the ecosystem.
Once the plan has been approved, the Ministry of the Environment and Natural Resources issues the environmental permit, which includes mitigation obligations. Subsequently, producers submit the application for concession rights, which costs between US$ 400 and US$ 1,600, depending on the number of hectares and the project’s production system. The concession right costs US$ 5 per year per hectare and is granted by this Ministry. Having obtained the concession permit, the holders must put their tax situation in order with the Ministry of Finance. Once these requirements have been satisfied, the shrimp farmer may apply to CENDEPESCA for authorization for reproduction and/or cultivation, pursuant to the regulations of the General Law on the Organization and Promotion of Fishery and Aquaculture Activities.
Expanding the activity depends on several factors: legalization of the cultivation operations; the application of biosafety programmes; maintenance and repair of cultivation infrastructure; technical upgrading of production systems; improvement of the seed and an increase in the number of shrimp stocked per square metre; development of the processing and transportation links; association and articulation among producers; the organization of marketing and improvement of the support infrastructure (paving of roads between farms and highways; and the extension of public utilities networks, including energy, piped water supply, and sewerage).
In 2012, the Shrimp Farmers Association of El Salvador was set up, encompassing cooperatives from the region of Jiquilisco, which accounts 81% of the country’s shrimp aquaculture production, and includes socially vulnerable women and young people for whom this activity provides a source of employment.
3. Processors
Although fish and seafood processing plants exist in El Salvador, this link does not form part of the shrimp aquaculture chain, since the processing plants generally do not process shrimp farmed in the country. The product is sold to farm gate intermediaries, generally whole and fresh, without processing or any value-added
The shrimp extracted from the tank is handled carefully to conserve its cold chain. Many intermediaries are unaware of good handling

Strengthening value chains… 163
practices and have their own ideas about quality which diverge from international standards. Some intermediaries cook part of the production because parboiled shrimp is used to prepare ceviches and rice dishes, and is highly appreciated by low-income families.
Although the product preferred on the market is whole shrimp, in this industry value-added relates to any process other than decapitation. Other highly valued presentations include the following:
• Individually quick frozen shell-on (IQF)11
• Peeled
• Peeled tail-on
• Peeled and de-veined (“P&D”)
• Peeled and de-veined tail-on
• Peeled and de-veined, individually quick frozen shell-on
• Peeled and de-veined tail-on, individually quick frozen shell-on (“IQF P&D tail-on”)
• Boiled and peeled
• Boiled, peeled and de-veined, individually quick frozen shell-on
• Boiled, peeled and de-veined tail-on
• Butterfly (peeled and de-veined tail-on, and a small cut to slightly flatten the shrimp)
• Round (peeled and de-veined tail-on)
• Western cut (deep butterfly cut that flattens the shrimp).
According to CENDEPESCA, there are eight fish and seafood processing plants operating in El Salvador. The interviews held for this chapter revealed that some plants process shrimp to bypass the domestic market and export to the United States; but this uses shrimp cultivated in Honduras (between 90% and 95%), and the remaining 5% to 10% is sourced from fished shrimp in El Salvador.
Processors that work with Honduran 14 g shrimp purchase at prices ranging from US$ 1.35 to US$ 1.50 per pound, with a processing and packaging cost of US$ 0.60 per pound. The final price will depend on the target market. To export pre-cooked shrimp to United States, the price is set at US$ 4 per pound, but it is more profitable to sell the product whole
11 Most professional chefs agree that the individually quick-frozen shell-on (IQF) presentation has the best quality, because it seals in the shrimp’s flavour, colour and nutritional properties and reduces the risk of damage caused by drastic temperature changes.

164 ECLAC
and fresh to wholesalers at the “La Tiendona” market for US$ 3 per pound, thereby saving transport costs and avoiding export procedures.
The low price of Honduran shrimp reflects the lower cost of inputs in that country and a number of production subsidies (Beltrán, 2011). Honduran shrimp sold in El Salvador consists of the fraction of output that does not meet the requirements for exporting to the United States or Europe. Cases have been detected of shrimp with Infectious Hypodermal and Hematopoietic Necrosis Virus (IHHNV), a disease subject to mandatory reporting and the cause of dwarfism.
In the roundtables held it was claimed that in 2008, an estimated 2,273 tonnes of shrimp was entering El Salvador as contraband every year. As the apparent demand in this country between 2008 and 2012 was 3,220 tonnes per year, contraband shrimp could account for 41% of all shrimp sold in the country.
4. Farmgate intermediaries
The farm gate traders, known as “intermediarios en borda”, buy directly from the producer and are one of the key players in the aquaculture shrimp chain, They have access to markets; they set the prices and define modes of payment for the producers, often without modifying the product in any way; and they set the base price that will be used by other chain participants.
As the transport link has also not developed independently it was not included in diagram IV.2. There are no firms offering the service with refrigerated trucks (thermoking), or properly managed isothermal boxes that are capable of keeping temperature constant. Apart from the industrial fishery and aquaculture firms that use refrigerated trucks, the intermediaries usually transport the product in pickup trucks, generally without cooling equipment, sometimes without the right amount and type of ice, and even without isothermal boxes.
Although there are standards regulating the transportation of fish and seafood products, control and surveillance measures need to be strengthened to verify compliance. Article 79 of the regulations to the General Law on the Organization and Promotion of Fishery and Aquaculture Activities requires wholesale traders and exporters to carry the transport document issued by CENDEPESCA, along with documents identifying the product’s origin. Imported shrimp products must also be accompanied by the zoosanitary policy and certificate issued by the country of origin. These regulations are applied to legalized traders; but handling, transportation and conservation infringements are mostly committed by the intermediaries and formal and informal retailers.

Strengthening value chains… 165
Part of the contraband entering the country from Honduras originates from theft in the producing farms. To avoid this, in mid-2009 the National Association of Aquaculture Honduras (ANDAH) reached an agreement with the National Agricultural Health Service (SENASA) to co-finance the hiring of inspectors to verify the origin of the products, through a safe conduct certificate or transport document, which the inspectors request from the shrimp transporters (Beltrán, 2011). It would be worth considering the possibility of negotiating an agreement or producing a joint document to strengthen cooperation on the prevention of contraband.
5. Wholesalers
The traders who buy shrimp from the farm gate intermediaries are wholesalers. Most of them operate in the “La Tiendona” municipal market, the main supply centre for the capital San Salvador, from which food products are distributed to the rest of the country. The shrimp sold in “La Tiendona” is also sold directly to the final consumer, and enters the informal retail circuits that supply other businesses and travelling vendors. It is also purchased by formal traders such as supermarkets, fishmongers, restaurants, hotels and others.
6. Retailers
Retailers are traders who sell fresh and precooked shrimp in other cities. They raise the price of the product but do not necessarily add value. It is hard to estimate how many intermediaries or retailers participate in the marketing chain; in some cases there are two (farm gate intermediary and retailer); in other cases three (farm gate intermediary, the “La Tiendona” wholesaler, and retailer). After this, the number of retailers may increase by two or three more.
The formal intermediation chain is shorter and safer, because the participating traders generally observe good conservation and handling practices. In contrast, throughout the informal marketing chain there is a higher risk of deterioration as a result of incorrect handling practices in the cold chain.
7. Consumers
Household purchase decisions depend, among other factors, on the extent to which price prevails over quality or vice versa, and ease of access to sales points.
Consumers have their own ideas about quality. Some believe that vendors cover fish and seafood products with ice to conceal its
166 ECLAC
deterioration. This would partly explain why certain vendors ignore quality standards. These beliefs and the purchasers’ lack of stringent requirements, encourage negligence among many traders.
The market study on the farmed white-leg shrimp (Estudio de mercado de camarón blanco de cultivo), conducted by the National Microenterprise and Small Business Commission of El Salvador (CONAMYPE, 2012), describes the factors governing choice of vendor:
• Freshness and good colour, aroma and cleanliness of the product. To verify freshness, some purchasers require a refrigeration temperature below 5°C, although the ideal is to conserve it at 4°C.
• Favourable prices and credit payments of up to 15 days, with the option of returning unsold or damage products.
• Uniform cut of units, exact weight without mixing good-quality and deteriorated products.
• Constant supply and fulfilment of orders.
• Good personal presentation of vendors.
• Only 47% of the buyer firms require documentation from the seller (invoices and tax voucher) and very few demand the health record and business permit.
As the vendors do not satisfy quality requirements, 76% of those interviewed by CONAMYPE would be willing to change their supplier. This means that if the domestic consumer is not very demanding, suppliers making the best offer could improve their market position. Of buyers willing to change their supplier, 91% would prefer to be supplied at their business premises, and just 9% would choose to deal directly with the producers to verify quality, choose the shrimp by sizes, and obtain better prices.
8. Support institutions
The main institutions are:
• The Ministry of Agriculture of El Salvador, which issues and governs fishery and aquaculture policy and ensures that sector policies respond to the aims of the national development Plans.
• The Directorate General of Fishery and Aquaculture Activity Development of El Salvador (CENDEPESCA), which is responsible for implementing the sector policy of the Ministry of Agriculture.
• The Livestock Directorate of the Ministry of Agriculture, which is responsible for implementing aquaculture health programmes.

Strengthening value chains… 167
• The Ministry of the Environment and Natural Resources of El Salvador, which assists producers, issues environmental permits and execute actions to improve aquaculture ecosystems.
• The Ministry of Health of El Salvador and the country’s mayoralties, which are responsible for the inspection, control and oversight of the safety of the products sold in the country’s commercial establishments, and for preventing and controlling food-transmitted diseases.
• The National Microenterprise and Small Business Commission of El Salvador (CONAMYPE), which promotes SME entrepreneurship and supports the formalization of their activities.
• El Salvador Development Bank (BANDESAL), El Salvador Agricultural Development Bank (BFA) and other financial institutions seek credit alternatives for microenterprise and small-business aquaculture producers.
Given the territorial specifics of the chain, it is essential to move towards greater decentralization of support institutions, as CONAMYPE has already done.
D. Analysis of costs, margins and competitiveness
There is no accurate information on costs and profit margins in the shrimp aquaculture chain. Some representatives of the cooperatives recognize their lack of financial and marketing know-how to set prices without depending on the intermediaries, with whom they make verbal contracts. Some intermediaries do not fulfil the obligation to pay amounts owed to producers against delivery or within a maximum of five days; and some even take the product without returning to pay for it.
Co-operative members were asked about their cost structure and income in the production phase. The information obtained was complemented with data from the equipment suppliers and technical information from experts in the field. The coordinator of the Aquaculture Chain Programme provided data on costs in the three production modalities. A comparison of this information with that obtained from the producers showed that the figures are relatively similar. A financial analysis is now made of a semi-intensive cultivation operation, which is representative of 45% of projects currently running in farms.12
12 To compare this with the extensive and improved-extensive systems, see Oddone and Beltrán (2013) [online] http://www.eclac.cl/publicaciones/xml9/52059/Diagnosticodelacadena.pdf.

168 ECLAC
Table IV.6 Financial analysis of a semi-intensive shrimp farming project, 2013
(United States dollars at current prices)
Semi-intensive cultivation of 4 ha. Production of 1 980 pounds per hectare. Harvesting of shrimp of 12 grams weight. Survival rate of 75% and seeding density of 10 post larvae per m2
Stage Item Quantity Unit price Total investment
Useful life (years)
Inve
stm
ent i
n m
achi
nery
, equ
ipm
ent
and
infra
stru
ctur
e
Construction of tanks (value per hectare) 4 13 500 54 000 10
Sluice gates (2 per tank: 1 entry, 1 exit) 2 3 000 6 000 5Pumping station 1 10 000 10 000 5Motor-driven 20-inch pump (household type installed in El Salvador) 1 25 000 25 000 5
Oxímeter 1 1 600 1 600 2pH-meter 1 360 360 2Salinometer 1 250 250 2Vehicle (pick-up truck) 1 22 000 22 000 5Boat (without motor for the tanks) 1 1 200 1 200 5Fishing nets (atarrayas) 6 75 450 1Storehouse (with three compartments) 1 6 500 6 500 20Value of investments in infrastructure and equipment 127 360
Cos
ts o
f the
cul
tivat
ion
phas
e
Item Quantity per hectare Unit price Cost per
4 haDuration of the cultivation cycle 90 days for harvesting 12 g shrimp
Seed (postlarvae from laboratory) 100 000 4.75 per thousand 1 900
Feed concentrate (35% proteins) for 30 days 7 quintales a 46 1 288
Feed concentrate (25% proteins): 60 days and feeders
16 quintales a 39 2 496
Other inputs: fertilizers, lime, nets, filters, among others
Total value for 1 ha 146 584
Remuneration of permanent employees
1 foreman, 1 security guard, 1 vendor
$ 10 per day’s work 2 700
Remuneration of harvest workers 0.24 per pound 475
Transport of final products Intermediary’s responsibility because the sale is made at the farm gate
Administration and sales expenses Calculation not performedCurrent costs in the cultivation stage 9 443.20
Pro
cess
ing
Cost per type of product
Cost per pound
Final processing
cost
Processing cost per pound of whole shrimp
6 336 pounds 0.00 0
Process cost per pound of pre-cooked shrimp
1 584 pounds 0.60 950
Current costs in the processing stage 7 920 pounds 950

Strengthening value chains… 169
Table IV.6 (concluded)C
omm
erci
aliz
atio
n of
who
le,
fresh
shr
imp
Whole and fresh shrimp for
sale
Unit price per pound
Total value
Profit margin
Price of initial sale (shrimp farmer) 6 336 pounds 1.80 11 405 51.0%
Price of sale to wholesaler (intermediary)
6 336 pounds 3.50 22 176 94.4%
Price of sale in “La Tiendona” (wholesaler)
6 336 pounds 5.00 31 680 42.9%
Price of sale in supermarkets 6 336 pounds 6.50 41 184 30.0%
Price of sale in restaurants and hotels 6 336 pounds 10.00 63 360 100.0%
Com
mer
cial
izat
ion
of
prec
ooke
d sh
rimp
Precooked shrimp for
sale
Unit price per pound
Total value
Profit margin
relative to production
cost
Price of initial sale (shrimp farmer) 1 584 pounds 1.80 2 851 51.0%
Price of sale to wholesaler (intermediary)
1 584 pounds 4.00 6 336 122.2%
Price of sale in “La Tiendona” (wholesaler)
1 584 pounds 6.50 10 296 62.5%
Source: Prepared by the authors, on the basis of information from the Aquaculture Chain Programme.a In El Salvador 1 quintal is equivalent to 46 kg.
A comparative analysis of the three systems produces the following results:
• The highest profit margin is obtained in the marketing phase. Considering that the intermediation chain involves three to six people and that each one marks up the price by at least US$ 0.25 per pound, it can be concluded that with an average price of US$ 1.80 per pound in the initial sale, producers turn a profit of 30% to 50% (except in the case of extensive cultivation, which has lower costs but also smaller output and less sustainability), whereas the profits of commercial operators vary from 94% in “La Tiendona” to 456% in hotels and restaurants.
• Under current conditions, the production costs of semi-intensive farms are 35% higher than those of improved-extensive cultivations, but this increase is partially compensated for by a profit margin that is 18% higher, since the production volume is also 53% larger.
• The higher profit margin in extensive aquaculture operations is explained by the fact that no significant investments are made in biosafety, infrastructure, machinery, equipment and inputs, so they are more vulnerable to diseases, and their sustainability through time is fragile.

170 ECLAC
E. Analysis of markets and standards
1. Estimation of national shrimp consumption
The most recent calculation made of the per capita consumption of fishery and aquaculture products in Central America was performed by FAO (2012). From 2000 to 2010, the regional average was 9.1 kg per person per year, with Panama and Costa Rica reporting with the highest indices (23.3 and 12.6 kg per person per year, respectively), followed by El Salvador, Guatemala, Honduras and Nicaragua. Consumption in El Salvador was 6.6 kg per person per year, with a higher level of 11.83 kg recorded in 2009, owing to variations in production, imports and exports rather than changes in consumption habits.13
The trend of imports seems to be the component that best reflects the tastes and needs of domestic demand. El Salvador’s largest imports come from Costa Rica, the United States, Honduras, Guatemala and Nicaragua (between 2000 and 2010, total imports grew by 198%, with fresh and chilled products (+747%) more dynamic than value-added products (9%).
As it is impossible to separately calculate the consumption of farmed shrimp because it reaches the consumer together with the fished variety, national consumption from both production systems is estimated. Using production statistics published by CENDEPESCA and foreign trade statistics published by the Central Reserve Bank of El Salvador (BCR), an indicator of consumption per person for the period 2002-2012 is shown in table IV.7.
Table IV.7 shows that shrimp represents just 6.4% of overall consumption of fish and seafood products in El Salvador. The indicator encompasses a wide variety of products that compete with shrimp, which could elicit higher demand depending on their price or abundance or the season of the year. The rising trend in shrimp consumption in this country came to a halt in 2009, as shown in figure IV.2, which was prepared from table IV.7. Consumption grew by 744% from 2002 to 2009; but in the next three years it apparently dropped by -45%. Nonetheless, it is possible that real consumption has not fallen off as sharply as suggested by the official statistics, because changes in consumer preferences have not been noticed.
13 The calculation of the consumption of fishery and aquaculture products only includes fish and shellfish. It excludes industrial products such as fish flour and oil, live animals, skins, husks and shells of fish, crustaceans and molluscs used for industrial, pharmaceutical or cosmetic purposes.

Strengthening value chains… 171
Table IV.7 El Salvador: estimation of per capita shrimp consumption, 2002-2012
(Kilogrammes per person per year)
YearDomestic production
(1) (kg)
Imports (2)(kg)
Exports (3)(kg)
Apparent consumption
(1)+(2)-(3)(kg)
Potential consumer population
(5-80 years old)
Per capita consumption
(kg per person per year)
2002 1 624 000 298 603 1 275 080 647 523 5 199 154 0.12
2004 1 257 000 671 190 672 771 1 255 419 5 293 843 0.24
2006 960 000 1 630 072 189 048 2 401 024 5 369 674 0.45
2008 1 280 000 990 471 72 747 2 197 724 5 426 306 0.41
2010 1 424 000 3 013 870 401 822 4 036 048 5 481 808 0.74
2012 1 414 000 863 865 57 269 2 220 596 5 481 808 0.41
Period average 0.42
Source: Directorate General of Fishery and Aquaculture Development of El Salvador (CENDEPESCA) of El Salvador for data on production; Central Reserve Bank of El Salvador (BCR) for exports and imports; General Directorate of Statistics and Census (DIGESTYC) of El Salvador for population census; Food and Agriculture Organization of the United Nations (FAO) and C. Beltrán, Plan estratégico para el desarrollo de la acuicultura comercial en la República de El Salvador, San Salvador, FUNDES, 2012.
Figure IV.2 El Salvador: trend of apparent shrimp consumption, 2002-2012
0
1 000
2 000
3 000
4 000
5 000
6 000
2002 2003 2004 2005 2006 2007 2008 2009 2010 2011 2012
Thou
sand
s of
kg
Source: Prepared by the authors.
The figures show that during the period under analysis, imported shrimp supplied 56.3% of apparent demand, thereby indicating that national production is insufficient to satisfy domestic needs.

172 ECLAC
The 2012 CONAMYPE study showed 79% of demand concentrated in the central zone of the country, where the main urban centres are located, followed by the eastern zone (19%) and the western zone (2%).
2. Consumption habits
According to the report on fish and seafood consumption habits and preferences, produced by the project to improve domestic markets for fishery and aquaculture products in El Salvador (FAO/CENDEPESCA), the most popular products are marine fish, particularly snapper (pargo), sea bass (corvina) and bream (dorado), and freshwater fish such as farmed tilapia, catfish (bagre) and rainbow bass (guapote). In the seafood category, the preferences are for shrimp and (fished) camaroncillo, followed by concha clam, jaiba and cangrejo crab, and squid, which are eaten on special occasions or at the weekend. In recent years, demand has emerged for squid cooked in breadcrumbs, which is served in restaurants and fast food chains. Nonetheless, red meat and chicken remain the main source of animal protein for Salvadoran people, heavily influenced by their prices (Alfaro, 2011).
3. Commercialization
The weakness of most shrimp farmers’ marketing and managerial capacities helps to strengthen the position of brokers and commercial agents. The average time elapsing between the shrimp being harvested and reaching the final consumer is two to three days, involving an intermediation chain of three to five people. The exposure and handling of the product puts its freshness and safety at risk.
Consumers are considered demanding buyers, although their purchases are heavily influenced by price. This enables some vendors to offer substandard products mixed with others of high quality. In contrast, formal commercial outlets (supermarkets, restaurants, hotels, banquet halls and others) target consumers of medium and high purchasing power.
The present diagnostic study received collaboration from two commercial outlets: a farm gate intermediary and a wholesaler from “La Tiendona”. Their opinions on the marketing of farmed shrimp, which could be generalizable, are described in the following paragraphs.
The farm gate intermediary has had no training in sales, customer service, or the processing or quality control of fish and seafood products; nor has she attended training or technical assistance programmes. She started to do business with shrimp farmers in 2007, and receives the product on credit without making a downpayment, through agreements based on trust and timely fulfilment of payments.

Strengthening value chains… 173
She visits the producers (preferably semi-intensive farmers because they have a larger volume) and has a stall at “La Tiendona”, where she sells shrimp both wholesale and retail. She avoids doing business with restaurants and supermarkets, because they take up to 30 days to pay, are more demanding in relation to quality, and deduct the value of damaged products.
During the shrimp harvests, she visits the farms two or three times a week. On each journey she purchases 23 quintales (equivalent to 1.04 tonnes). This means she handles 2 to 3 tonnes of whole and fresh shrimp per week, which she sells under two modalities: 70% in “La Tiendona” and 30% door-to-door in the neighbourhoods of San Salvador and surrounding areas.
In the case of whole and fresh shrimp, the pattern of costs and incomes during the intermediation process has been as follows: the initial price ranges from US$ 1.16 to US$ 2 per pound, depending on whether it is winter or summer, which represents US$ 4,140 in income for the cooperative for 2,300 pounds of shrimp. The intermediary’s cost per journey to the farm total US$ 130, distributed as follows: US$ 30 per day’s work to three workers, US$ 30 in fuel and US$ 70 for ice. The door-to-door vendors (generally medium- and low-income housewives) purchase the shrimp from the intermediary at US$ 2.10 per pound, thereby earning US$ 1470 per 700 pounds, marketed through this channel. The door-to-door vendors sell the shrimp at US$ 250 per pound to households and small shops. Their income for 140 pounds of shrimp amounts to US$ 350, excluding the cost of transport, ice, and refrigerators. The intermediary sells the remaining 1,600 pounds at US$ 2.50 per pound in La Tiendona, and obtains income of US$ 4000, before deducting the respective costs. The first intermediary can earn up to US$ 5,970 from the direct and door-to-door sale of 2,300 pounds of whole fresh shrimp per day, with the following costs: US$ 4,140 to purchase the product, plus US$ 130 in transport and the payment of the day labourers. His profit margin is 39.8%, equivalent to US$ 1,700 per journey.
The only product with some degree of processing is precooked (parboiled) shrimp. The shrimp is not cooked in a processing plant, but in the intermediary’s own home, using her own equipment. The sale price is US$ 3.50 per pound, and the profit margin is 94% on the farm gate purchase price.
The intermediary owns a pickup truck without refrigeration facilities, so she has to use portable refrigerators with blocks of ice. In her opinion, the product maintains its quality and she says he has not suffered losses as a result of deterioration or decomposition. She claims it is unprofitable to sell peeled shrimp because the price only rises by US$ 0.10 per pound; and, in any event, buyers prefer shrimp with the shell on.

174 ECLAC
Wholesaler in “La Tiendona”: most of the shrimp sold in this market comes from Honduras and is bought by local intermediaries.14 The most important customers are retailers who operate nationwide. The main buyers of raw shrimp are restaurants, while community canteens and housewives buy precooked shrimp.
The wholesaler buys whole shrimp, raw at US$ 3.25 per pound, and precooked at US$ 5.25 per pound; and when selling them he marks the price up by at least US$ 0.25. Fished shrimp fetches a price US$ 0.50 to US$ 0.75 higher than farmed shrimp, because its sea taste is more concentrated, the shell is harder, and it is better appreciated by specialized buyers; household buyers do not notice the difference, however.
The interviewee admitted that many wholesalers and their employees operate the cold chain badly, and they are not concerned about maintaining quality but selling their whole stock as quickly as possible. Health inspectors make weekly visits and normally make confiscations.
Shrimp is a product with a high price-elasticity, and any upward or downward price movement has an immediate effect on its consumption. As the intermediation chain is long and quality is suboptimal, it is impossible to offer products of lower price and better quality under current conditions.
4. Quality and safety
Shrimp exporters have to meet strict quality and safety standards imposed by the United States, Europe or Mexico; but domestic suppliers often sell substandard products, particularly in popular markets and in door-to-door sales. Health inspections are carried out at formal sales points, but the inspectors do not have information on the traceability of the product and do not know how it was handled throughout the chain.
The Ministry of Health of El Salvador publishes the manuals Procedures and instruments for the protection and hygiene of food products (MINSAL, 2004) and Handling of food products, a didactic guide for technical personnel (MINSAL, 2012), which includes a section on how to recognize shrimp quality. Both are obligatory bibliographic references for the inspectors. There are weaknesses in the Ministry of Health and in the Mayoralty of San Salvador for applying standards of food quality, health and safety. Nonetheless, minimal progress has been made in terms of consumer education on quality in fish and seafood products.
“La Tiendona”, which is a nerve centre in the sale of fish and seafood products, suffers from serious problems of salubrity, overcrowded stalls,
14 A fraction of the product could be contraband.

Strengthening value chains… 175
bad handling of products, and inadequate management of the cold chain. The research revealed the need to strengthen coordination between the Ministries of Health and of Agriculture, the Mayoralty of San Salvador and the Consumer Ombudsperson; clarify the jurisdiction of each mechanism in the control, surveillance and application of good handling and management practices in the cold chain, and in training inspectors; and campaigns for the prevention and control of food-borne diseases.
Several San Salvador vendors violate quality and safety standards because they are notified in advance of the days and times of inspection, so they arrange their display stall to pass the controls. After the inspectors have left, they put the substandard product back or mix it with good-quality products. If the inspector identifies deteriorated products, he orders the vendor to withdraw them, warning that a recurrence of the offence will result in confiscation. Some traders resist these controls, and, as the inspectors lack of policing authority, they risk a negative reaction, so they have asked to be accompanied by the civil national police.
The San Salvador inspection body has only eight agents covering “La Tiendona”, the central market and several small markets in outlying boroughs and neighbourhoods. Their responsibility includes inspecting all types of perishable food, including prepared and canned, the provision of sanitary installations, management of pests and fumigation needs. There are also problems outside their jurisdiction, such as inadequate sanitary conditions in “La Tiendona”, which has very old infrastructure and is too small for the number of sales points it accommodates.
5. National quality system
The Law Creating the Salvadoran System for Quality was regulated by Decree 133 of 2012. This forms the basis for improving the quality of goods and services, and is applicable to production and marketing, and also standardization, technical regulation, accreditation, metrology and conformity-assessment activities.
This law created the National Quality Council (CNC) as the public institution responsible for formulating and directing the National Quality Policy and for coordinating the agencies of the quality system. The law also created the Salvadoran Standardization Agency (OSN), the Salvadoran Accreditation Agency (OSA), the Metrology Research Centre (CIM) and the Salvadoran Technical Regulation Agency (OSARTEC).
The competencies of the OSN are particularly important, because one of the weaknesses of the fishery and aquaculture sector is its lack of technical standards to regulate the production, processing and marketing of fish and seafood products. This agency has not issued specific quality

176 ECLAC
standards for fish or seafood products, but the regulations imposed by other countries on the production and processing of fresh, chilled and processed shrimp are being evaluated.
6. Analysis of governance
The intermediaries play a fundamental role in the chain, given their power to set prices and define the payment conditions for the producer; and they form the basis of the prices in force at “La Tiendona”. Although they play an important role in the market, other participants question their legitimacy. They represent a link in the chain that incorporates little value added, and the justification for the profits they earn fuels continuous conflict.
To avert potential conflict in the generation (shrimp farmers) and appropriation (intermediaries) of that value, training programmes need to be designed for the intermediaries on handling post-harvest production and on product quality and safety.
Starting with the intermediaries, the value chain can have split into different branches. “La Tiendona” is a link in itself, which, as a supply and distribution centre is a generator of new price-setting modalities. This is where the final links of the chain are created nationally (see diagram IV.3), but not including product processing.
Diagram IV.3 Structured links in the shrimp value chain based on “La Tiendona”
"La Tiendona"
Final consumers
Retailers and door-to-door vendors
Supermarkets and fishmongers in municipal markets
Restaurants, hotels, ceviche bars and banquet halls
Institutional market (hospitals, schools, Armed Forces,
business events, etc.)
Source: Prepared by the authors.
It is worth considering the absent processing link, given its capacity to create greater value added for the domestic market and for export. The fulfilment of stricter processing and sanitary and phytosanitary standards is mandatory for the export market.

Strengthening value chains… 177
Shrimp farmers have recognized the need to cooperate with each other through a trade association; and in March 2012, with support from FUNDE, the El Salvador Shrimp Farmers Association was created, encompassing 22 of the 32 cooperatives that are active in Bahía de Jiquilisco. Subsequently, some of these cooperatives joined the Fisheries and Aquaculture Development Association of El Salvador, created in March 2013 with the aim of achieving greater participation in sector decisions and grouping together industrial and small-scale producers, along with traders.
The organizational drive of the producers underscores the need to improve dialogue and coordination among chain participants; and it also strengthens spaces for dialogue between public and private stakeholders. To meet this need, the Aquaculture Chain Programme set up the Aquaculture Technical Roundtable.
F. Analysis of resources, productivity and environmental sustainability
For El Salvador to move towards a more productive and environmentally friendly economy, it needs to develop industrial, scientific and technological capacities and stimulate innovation to raise its systemic competitiveness. Improving the sustainable exploitation of shrimp through sustainable cultivation systems and with investment in innovation, biosafety and technology, would make it possible to increase production and competitiveness. For these reasons, it would be better if all shrimp farming operations were semi-intensive, although good aquaculture practices still need to be applied even under this system.
Shrimp farming remains highly vulnerable to natural disasters. The most recent case was tropical depression Doce-E, which occurred in October 2011 and affected some 340 ha of shrimp farms, causing damage to the tanks and allowing the animals to escape into the wild, while also damaging communication roads and surrounding land areas.
Owing to their location along the coast, shrimp farms are highly exposed to winds, cold fronts, abundant rainfall and intense droughts. This is compounded by insufficient reforestation and actions to protect water flows in the upper Lempa River watershed. In the conservation zones, mangrove areas have not been adequately restored, nor have contingency plans been put in place or mitigation works implemented. Schemes involving over-exploitation of resources and extensive and semi-intensive cultivation can cause long-term environmental harm, unless the necessary adaptation and mitigation measures are adopted.

178 ECLAC
1. Health issues
Animal health and the diagnosis of economically significant diseases and quarantine pests15 fall under the jurisdiction of the Livestock Directorate of the Ministry of Agriculture of El Salvador. Diseases that are certifiable and could be notifiable are listed in the Aquatic Animal Health Code of the World Organization for Animal Health (OIE) and are grounds for export restrictions. Certifiable diseases are those which the country must report to the OIE, whereas notifiable diseases do not necessarily have to be reported, but they affect producers and occur as a result of bad crop management. El Salvador does not have sufficient personnel or equipment to diagnose them. It would be necessary to design and aquaculture health and safety programme, increase the number of newly trained professional and technical personnel, and adapt laboratories, technology and both economic and logistical resources.
The Aquaculture Health Programme of the Ministry of Agriculture of El Salvador was created in 2002 as a response to the requirements imposed by the European Union on imported fish and seafood products. In the case of shrimp farming, activities need to be targeted on seed production laboratories, which are the points most heavily exposed to diseases; and stricter recording of survival rates and animal growth is needed, from the post-larva phase through to harvest. Another health risk, as yet not evaluated, concerns the heavy metal and residue load in the water.
FAO and the International Regional Organization for Plant and Animal Health (OIRSA) have published guidelines on good aquaculture practices. Despite the urgent need to adopt them, compliance is voluntary, not only in the growing and harvest stages, but also in the processing, conservation, transport and marketing phases. In El Salvador there are no regulations forcing producers to apply these good practices; and awareness of their importance needs to be improved, because some producers see them as a hindrance to the activity, since they are assumed to entail a cost increase.
The scant coordination that exists among the aquaculture authorities is likely to foster this situation, particularly considering that the Livestock Directorate of the Ministry of Agriculture of El Salvador, the mayoralty of San Salvador and the Ministry of Health do not have enough inspectors or support instruments to regularly oversee sales outlets and apply the appropriate corrective measures.
15 According to FAO: “Pest of potential economic importance to the area endangered thereby and not yet present there, or present but not widely distributed and being officially controlled” see [online] http://www.fao.org/docrep/010/ai384e/AI384E01.htm.

Strengthening value chains… 179
(a) Current and potential risks for disease outbreaks
Shrimp farming has been ravaged by diseases that threaten its sustainability; and these can be spread to other countries through the shrimp trade, currents and other natural phenomena.16 An example of this is the current case of China, which, according to FAO, in 2010 lost 1.7 million tonnes of shrimp to natural disasters, diseases and pollution, while disease outbreaks in shrimp tanks practically wiped out the industry in Mozambique.
In 2009, early-mortality syndrome emerged as a new threat, and has now caused losses of up to 100% in shrimp farms in China (2009), Viet Nam (2010), Malaysia (2011) and Thailand (2012) (OIRSA, 2013). For this reason, producer countries such as Ecuador, Honduras, Mexico, Nicaragua, Panama and the Dominican Republic have temporarily suspended imports of Peneido shrimp, both live and in different forms of presentation, originating from that region. The transmitter vector for early mortality syndrome is a bacteriophage17 that affects the Penaeus monodon and Penaeus vannamei shrimp species, causing massive mortality of up to 100% during the first 20 to 30 days of cultivation in the fattening stage.
(b) Harmful species
Another latent threat in the country is the presence of the Callianassa shrimp (Lepidophthalmus bocourti), commonly known as ghost shrimp, a crustacean that inhabits the mangrove swamps. This species has no commercial use for human consumption purposes, although it might be edible, and it is only used as bait for sport fishing.
The Callianassa shrimp reaches the shrimp farms on its travels through wetland areas, forming tunnels that damage the linings and banks of the shrimp tanks and water systems, until they colonize them completely. In the case of marine shrimp, Callianassa is a pathogen vector, and also a competitor for space and food. Its proliferation reduces production and the volume of water in the tanks.
In April 2013, the Technical Mission of Taiwan Province of China in El Salvador asked OSPESCA for technical assistance to deal with this problem in a cooperative located in Jucuarán (Usulután), which has been suffering from a Callianassa invasion since 2009. The cooperative uses the semi-intensive cultivation system, but not all its tanks have a pumping station, and other good practices may not have been implemented. This explains its greater vulnerability, in conjunction with the fact that this
16 Diseases suffered by white-leg shrimp include white-spot syndrome (which appeared in Taiwan Province of China in 1992); yellowhead disease (Thailand and India in 1992); and the Taura syndrome (Ecuador in 1993). Yellowhead disease is the only one of these that has not appeared in Latin America.
17 A virus that infects the Vibrio parahaemolyticus bacteria, which the shrimp ingests in its food.

180 ECLAC
invasion has been going on for considerable time, despite a previous application of treatment by the aquaculture chain. According to OSPESCA, rehabilitating this shrimp farm would cost about US$ 58,000.
(c) Good aquaculture practices
The lack of good aquaculture practices and eco-efficiency and biosafety strategies is one of the greatest weaknesses of Salvadoran shrimp farming. The use of unfiltered seawater heightens the risk of contamination by bacteria, fungi and oil spills.
Without a biosafety and eco-efficiency programme, the sector will find it hard to take advantage of the benefits of technical assistance, technology transfer, and the move towards a semi-intensive form of aquaculture. A disease outbreak could force producers to abandon the activity, as happened in the 1990s with the Taura syndrome and white-spot virus, which caused losses of up to 80% and in some cases 100%. The present threat may even be greater if one considers that only 45% of cultivations operate under the semi-intensive system; whereas extensive and improved-extensive farming, which account for the other 55% of projects, are considerably more vulnerable to diseases and invasions by undesirable species.
Minimum and initial biosafety measures should focus on strengthening diagnostic capacities and disease prevention and control strategies that minimize the risks of pathogens being introduced into cultivation systems (biosafety); and on developing eco-efficient management strategies to promote the use of inputs, make the cultivations more profitable and reduce the environmental impact (CIBNOR, 2011).
G. Current analysis and projection of economic and employment benefits
The financial analysis presented in the section on costs, margins and competitiveness shows that Salvadoran shrimp farming could apparently earn good profit margins for producers (42% on average in semi-intensive and improved-extensive cultivations, excluding amortization of investments in infrastructure, machinery and equipment); but in reality there are various factors that distort this indicator and cause profits to be lower in practice.
The profit margins of 51% in semi-intensive cultivations and 33% in improved-extensive cultivations, both with 4 ha in production, were calculated in terms of sales revenue and variable costs per production cycle (seeds, food concentrates, inputs, remunerations and administrative and sales expenses). If the estimation also took account of investment in

Strengthening value chains… 181
infrastructure and equipment (US$ 127,360 in semi-intensive cultivations and US$ 81,510 in improved-extensive cultivations), amortized over 10 years and with three annual harvests, the result would be losses of -17% and -23%, respectively. This is without including financial expenses in respect of any loans obtained or contributions from national and international cooperation.
Most of the shrimp farms belong to cooperatives of 40 to 50 people each, and the profits are distributed among the members, irrespective of whether they actually work on the cultivations. Under current conditions, in the case of semi-intensive cultivation, each partner would obtain US$ 44 every four months, or US$ 132 per year —an amount that in practice does not represent an attractive income for this segment. Although profit-sharing benefits all members under a cooperative scheme, arrangements in an SME model would need to be altered to distribute the profits between partners and investors; but this model does not seem feasible in the short run and would require the partners’ agreement.
An obstacle when estimating real costs and profits is the fact that, thanks to the technical assistance received from the Aquaculture Chain Programme since 2011, and from other national and international cooperation programmes, several cooperatives receive subsidized seeds and feed concentrate, along with certain equipment and infrastructure upgrading. Under such conditions, the profits of semi-intensive farms could run as high as 280%, which would mean US$ 510 per year per person. With a view to mitigating the scale of losses for producers when these supports come to an end, it would be advisable to start preparing them for financial self-sufficiency.
1. Financing
A key constraint in small-scale projects is the difficulty of obtaining formal financing, mainly because of a lack of real collateral. The Salvadoran government has created credit lines accessible to aquaculture producers through BANDESAL and BFA. The functions of BANDESAL include training programmes, advice and technical support to increase and improve the firms’ access to financing, competitiveness and productivity, and to manage the guarantee funds. Of the five credit lines offered by first-tier banks to the agriculture sector, two of them include aquaculture, although in practice only the first would be applicable to shrimp farmers at the present time:
• Formation of agricultural capital: this finances the purchase of machinery and equipment, including working vehicles.18
18 In this credit line there is experience with tilapia producers where the aim was to build nursery (pre-cria) tanks and purchase machinery.

182 ECLAC
• Intensive and protected agriculture: suitable for intensive or advanced cultivations that require land, fixed assets, working capital, training, specialized studies and the hiring of experts. Under current conditions it is unlikely that there are shrimp producers eligible for this credit line.
Two other BANDESAL credit lines that could be applicable to aquaculture farmers set up as cooperatives or firms are:
• Promotion of business partnerships: this line finances investments by groups of firms in partnerships organized under a specific legal format. The credit line includes construction, expansion and remodelling of properties, the purchase of machinery and equipment, and structural working capital.
• Promotion of technological innovation: this credit line finances the application of industrial designs, processes for technological improvements, modernization or other types of technological upgrading. It includes the incorporation of technologies, adaptation or improvements in production processes, the obtaining of, implementation and improvements to obtain certifications and employee training.
Aquaculture is not included in credit lines for the agriculture sector; but the “Transport in production activities” credit line for individuals and legal entities requiring new or used vehicles for their production activities could finance the procurement of trucks with refrigeration facilities (thermoking), or at least vehicles equipped with properly refrigerated isothermal boxes. BANDESAL performs the technical and financial evaluation and helps applicants to draw up their business plan. As of December 2013, no credits or complementary guarantees have been awarded for shrimp farming projects.
The Salvadoran Guarantees Fund (FSG), created by the national government to facilitate access to credit for MSMEs, finances good projects that do not have sufficient collateral to qualify for commercial credit. Using FSG resources, BANDESAL extends complementary guarantees to small-scale producers, thereby enabling them to access credit at lower risk to the banks. Aquaculture projects can receive complementary guarantees from the FSG for up to 70% of the loan amount; and the remaining 30% must be backed by the applicant with its own collateral, generally real property or equipment other than that acquired with the loan. Credit subjects are generally formal MSMEs with annual sales up to US$ 7 million, who have at least two years of credit experience and present a business plan that is economically and technically validated by the bank’s sector specialists, following the respective field visit.

Strengthening value chains… 183
Lastly, the “CrecES MIPYME” programme for MSMEs targets individual firms and those operating in partnerships, cooperatives and producer associations. Its partners are three Salvadoran ministries (Ministry of Agriculture, Ministry of the Environment and Natural Resources, and Ministry of Tourism), in conjunction with CONAMYPE, BANDESAL, BFA, Banco Hipotecario, the El Salvador Export and Investment Promotion Agency (PROESA) and the El Salvador Productive Development Fund (FONDEPRO), among others. The programme seeks to strengthen business competitiveness through financial assistance, the provision of support to prepare credit applications, linkages with specialized technical assistance, pre- and post-investment support, measurement of growth and subsequent results. It has national coverage, focusing particularly on the special development zones (territorios de progreso) and the coastal area, in strategic economic sectors and production chains prioritized by the Ministry of Economy and the Ministry of Agriculture. The support facilities for SMEs19 are located in the 11 CONAMYPE centres across the country, while the Ministry of Economy will attend to medium-sized firms.
2. Training in business development and aquaculture
The National Microenterprise and Small-Business Commission of El Salvador (CONAMYPE) is the national authority that supports SME development. In a relationship of synergy with the Aquaculture Chain Programme and the Salvadoran National Development Foundation (FUNDE), since 2011 the commission has supported 80 cooperatives from Jiquilisco, through business-training workshops, studies of the aforementioned market and the creation of a mark of origin for the region’s farmed shrimp. According to versions obtained in the interviews held for this chapter, before intervention by the Aquaculture Chain Programme and CONAMYPE, the producers were dispersed and lacked a partnership mentality; interpersonal relations were not optimal and there was competition. The current situation is different, and progress has been made in designing production and joint sales strategies.
Thanks to support provided by CENDEPESCA, the Inter-American Institute for Cooperation on Agriculture (IICA) and other agencies, five cooperatives formed the San Hilario-El Zompopero Supply and Multiple Services Centre, which makes joint purchases of inputs and plans to sell their products without the involvement of intermediaries. Nonetheless, intermediaries are not expected to disappear from the chain because they
19 In financial terms, the MSME category encompasses firms with sales of below US$ 1 million per year, whereas medium-size enterprises are those with sales of up to US$ 7 million per year.

184 ECLAC
will continue to market output volumes that cannot be sold directly and rapidly through the formal channels.
The producers have already developed relations with two national supermarket chains and one restaurant chain, but have not finalized deals owing to weaknesses in terms of quality control, transport and product handling. To overcome these shortcomings, a processing plant, a cold chamber, a scale-ice plant and a refrigerator truck (thermoking) have been included in their business plan.
Producers are planning direct entry in the national market and standardization of the sale price irrespective of the time of year; and they are preparing to participate in trade fairs, business roadshows and municipal markets. FUNDE has organized two business roadshows with the cooperatives of Sisiguayo in San Salvador and San Miguel to develop relations between producers and the owners of restaurants and supermarkets. Conversations have begun with a number of intermediaries.
In terms of aquaculture training, the Specialized School of Engineering ITCA-FEPADE (Central American Technological Institute and the El Salvador Business Fund for Education Development, respectively) offers a two-year aquaculture technician course. This was created by the Ministry of Education as part of the National Education Plan 2021, the purpose of which is to align secondary technical education and higher technological education with the country’s production needs. The curriculum includes knowledge of the aquaculture cycle in general, with business management as a crosscutting theme, although the main emphasis is on shrimp, tilapia and mollusc cultivation. The Usulután Technical Institute also offers a vocational Technical Bachelor Degree, in which several of the sons and daughters of members of the Bahía de Jiquilisco cooperative have enrolled, with a view to becoming technical assistants on their farms and contributing to generational handover.
Part II
An integrated approach to improving the shrimp aquaculture chain in El Salvador
H. Strategies for the shrimp aquaculture chain
The results of the diagnostic study show that the chain needs a number of systemic supports, together with specific actions in each link of the chain to overcome constraints. The recommendations and good practices in aquaculture proposed by ECLAC use an integrated approach that

Strengthening value chains… 185
encompass all links of the chain, taking advantage of complementarity with other strategies such as the Aquaculture Chain Programme. During the work, the ECLAC team was supported by the Ministries of Economy and of Agriculture, along with the Directorate General of Fishery and Aquaculture Development of El Salvador, with which it worked to coordinate actions to support the entire chain and avoid the risk of duplication of tasks.
The recommendations for overcoming the systemic constraints are presented in the following three sections, focusing on inter-agency coordination to improve chain governance, the revival of public and private dialogue in the Aquaculture Technical Roundtable, and restructuring of the “La Tiendona” wholesale market. In addition, specific recommendations for each link have been organized in three groups: biosafety and the application of good aquaculture practices in the provision of inputs and in the cultivation phase; the handling and quality of shrimp during processing, transportation, marketing and consumption; and lastly, strategies to strengthen entrepreneurship among producers, processors and traders.
I. Recommendations for overcoming systemic constraints
1. Consolidate interagency coordination
A crosscutting need in the shrimp aquaculture chain is interagency coordination and the strengthening of the role of support institutions. The work plan proposed for making headway in this direction includes the following topics.
• Formulate and implement and biosafety programme in farms and in the seed production laboratories. The Livestock Directorate of the Ministry of Agriculture of El Salvador is responsible for implementing the Aquaculture Health Programme. It currently has inadequate human, technical and logistical resources for serving the needs of shrimp farmers and for preparing a national biosafety programme. It would be useful if the Ministry of Agriculture could coordinate its actions with those of CENDEPESCA, and at the same time with the Ministry of the Environment and Natural Resources, and the local authorities, aquaculture operators and seed producers, who would be responsible for executing the biosafety measures. The Aquaculture Roundtable is a formal space for designing and reaching agreement on the biosafety programme. It would be advisable to consider requesting technical assistance from OIRSA

186 ECLAC
or from the Fishery and Aquaculture Sector Organization of the Central American Isthmus (OSPESCA), in the framework of the Regional Strategy for Aquaculture Development in countries of the Central American Integration System (SICA).
• Improve product quality and safety. The authorities could consider the following initiatives in this regard:
– Creation of an interagency action plans to facilitate partnerships and help coordinate actions between the national and municipal authorities. The Ministry of Economy could lead this endeavour.
– Clarification of the competencies of each authority in terms of control, surveillance and application of good aquaculture practices, along with management of the cold chain in the production, transport, processing and marketing phases.
– Dissemination among the authorities of the regulations, procedures and requirements to be fulfilled by users for the production, transport, processing and marketing of national and imported fish and seafood products.
– Organization of training and updating programmes for employees responsible for the inspection of fish and seafood products in processing plants, formal and informal sales outlets, and along highways.
– Organization of awareness-raising campaigns for consumers on the importance of demanding safe fish and seafood products and how to recognize them in sales outlets. This could include campaigns for the prevention and control of food-borne diseases, targeting consumers, producers, processors, vendors and business owners.
On this point, it could be useful to draw on the experience of German cooperation in applying the “CALIDENA” experience —a participatory analysis system for improving the quality of processes and products in the value chain. CALIDENA —an acronym formed from the concept of quality (calidad), leadership (liderazgo), ideas and chain (cadena)— was developed through technical cooperation from the German Institute of Metrology to support quality infrastructure based on participatory methods developed throughout the value chain, with support from the participants in the different links.
• Create and promote an aquaculture research and technology centre. This could serve the aquaculture and fisheries sector and include a line of research in shrimp farming. Particularly important

Strengthening value chains… 187
is the production of genetically enhanced seeds and periodic renewal of broodstock, along with the development of new feed concentrates; and the technical, economic and social validation of technologies for diversifying aquaculture and increasing the production of fish and seafood products for the national and export markets.
• Reduce contraband and control its impact. It is important to have accurate knowledge of the volume of contraband shrimp arriving from Honduras and other countries; and a plan should be devised to prevent and combat contraband including the transport of aquaculture equipment and inputs.
2. Revitalize the Aquaculture Roundtable
The Aquaculture Roundtable is an interagency mechanism created in 2011 by the Aquaculture Chain Programme, to facilitate dialogue on national aquaculture between the public and private sectors. Some proposals for the composition of the roundtable that could help to improve its functioning are set out below.
• The Ministries of Agriculture and Economy could coordinate the roundtable. The Ministry of Agriculture has experience in improving shrimp production, whereas the Ministry of Economy has a track record on issues such as solving transport, marketing and contraband problems.
• Meetings of the roundtable based on an annual plan of the Ministries of Agriculture and the Economy. The plan could be prepared on the basis of the diagnostic studies and in response to requests from the other sectors. The meetings of the roundtable would thus address predefined issues and would be in a position to monitor the tasks agreed upon and evaluate their results.
• It would be advisable to review the composition of the Aquaculture Technical Roundtable. Probably it is not necessary to convene all members for every meeting, but to convene according to their relevance to the issues to be addressed.
3. Restructure “La Tiendona”
The physical space of the “La Tiendona” market displays problems of salubrity, overcrowding and bad management of products and the cold chain. Consequently, the recommendation is to rebuild the infrastructure or relocate it elsewhere, and to hold quality and safety training workshops for traders and employees.

188 ECLAC
To ensure that the restructuring of the fishery and seafood product area is successful, technical assistance could be requested for training and awareness-raising, to cover issues such as business ethics, the causes and effects of diseases transmitted by food products, and the legal and commercial consequences of failing to comply with health regulations.
The Food and Agriculture Organization (FAO), together with the Centre for Marketing Information and Advisory Services for Fishery Products in Latin America and the Caribbean (INFOPESCA) and the Japan International Cooperation Agency (JICA) have experience on these issues and have executed projects in Latin America with results that would bear reviewing. By way of example, through technical cooperation with JICA, the Ministry of Trade and Industries of Panama and the Municipality of Panama City modernized the fishery product distribution system in that country by improving the unloading process and conditions for handling seafood products under strict sanitary control procedures.
4. Strengthen the domestic market and export capacity
Although the producers and national authorities have taken steps to legalize cultivations, as a requirement for accessing formal markets, in terms of skill development cooperative groups need to strengthen their managerial, marketing, sales and customer service strategies. It would also be useful to assure buyers permanent and high-quality supply. As almost no shrimp farm is individually in a position to supply with a pre-defined periodicity, it would be useful for the Aquaculture Chain Programme to agree upon a staggered production programme with the cooperatives.
The benefits of staggered production include making it possible to consolidate long-term commercial relations with relatively stable and higher prices than those set by farm gate intermediaries, facilitate the effectiveness of the biosafety programme and seeding with adequate densities according to the time of year, based on prior commercial commitments.
When greater experience has been acquired on the domestic market, it could be the moment to help shrimp farmers create export capacity, backed by the El Salvador Export and Investment Promotion Agency (PROESA), to avoid the risk of starting to export without an adequate knowledge of foreign trade.
The creation of a brand that abides by the principles of responsible aquaculture and encourages buyer loyalty based on environmental principles, could promote market positioning.

Strengthening value chains… 189
J. Recommendations for each link
1. Biosafety programme and the application of good aquaculture practices
Good aquaculture practices are based on the principles of responsible development of this activity and are voluntary.20 For that reason, the “Manual of Good Management Practices for the Cultivation of White Leg Shrimp Penaeus vannamei” (OIRSA and OSPESCA, 2010) should be widely circulated.
Since January 2013, OIRSA has been implementing the Regional Aquaculture Health Programme, which includes regional dissemination of the manual of good practices; and it has also been helping countries prevent the propagation of early mortality syndrome. This manual could be complemented by the “Manual on Good Practices of Shrimp Aquaculture Production for Food Safety”, commissioned by the National Agrifood Health, Safety and Quality Service of Mexico (SENASICA) and by the Food and Development Research Centre of Mexico (CIAD).
A biosafety programme could also reduce the impact of invasive species such as Callianassa. To determine the number of farms potentially affected by this or other diseases, it would be advisable to perform health and diagnostic studies, apply preventive treatments, and the standardize protocols of good aquaculture practices in the farms, particularly in those close to mangrove swamps and those using tide-filled tanks, although this procedure is inadequate and needs to be supported by pumping.
In terms of eco-efficiency and disease prevention, FAO has proposed implementing the following minimum measures:
• Purchase the post-larval shrimp used for repopulation from accredited vendors. These should be accompanied by health certificates and be subjected to prior temporary quarantine.
• Use high-quality feed and avoid environmental stress, to keep different populations healthy.
• Maintain salubrity in the tank areas, and closely monitor the young shrimp and notify the authorities of the appearance of any disease.
• Periodic provision of a fallow period for the aquaculture tanks should be part of routine health control programmes, because it has been shown that this practice can interrupt pathogen life cycles.
20 Code of conduct for responsible fisheries (FAO, 1995), [online] www.fao.org/fishery/code/en.

190 ECLAC
Technical assistance in applying the measures mentioned in the different manuals is mainly the responsibility of the Ministry of Agriculture of El Salvador, through its Aquaculture Health Area, and CENDEPESCA, which are also jointly responsible for implementing the Aquaculture Chain Programme. Nonetheless the success of these actions also depends crucially on the commitment of shrimp farmers themselves. In the application of these measures, technical assistance can be obtained from OIRSA, OSPESCA or the Meso-American Cooperation Programme signed by the countries of the Central American Integration System (SICA) and Mexico.
2. Product handling and quality
Persons involved in the handling of the shrimp from harvest through to its consumption must apply good handling practices, particularly because shrimp is a highly perishable product and its contamination can be a health danger. Currently, errors are committed in both formal and informal sales points, although they are more serious in the latter.
Winning over consumer preferences requires differentiating fresh shrimp, despite the fact that this, without greater value-added, is highly appreciated in domestic and international markets. As not everybody has the knowledge needed to recognize quality and safety, education campaigns are needed to recognize these characteristics in fish and seafood products, along with the need to prioritize quality over price, targeting consumers, salespeople and producers.
Cold-chain management is one of the greatest weaknesses. Often commercial operators use ice in blocks, which, on melting, leads to contamination of the shrimp and does not guarantee adequate refrigeration. This should be replaced with scaled ice, which is more efficient and lasts longer. It is essential that the ice is produced exclusively with water of a quality equivalent to drinking water, or clean seawater, which is free from extraneous substances (FAO, 2009). International cooperation could help upgrade a scale-ice factory for fish and seafood products.
One of the main difficulties for the beneficiaries of cooperation programmes that have donated supply centres and cold structures has been the high consumption of electricity required to operate ice plants. It would therefore be advisable to consider installing alternative energy sources, because this could be an excellent combination for increasing production at accessible costs while ensuring quality thanks to the maintenance of the cold chain.
Work also needs to be done with the intermediaries, who generally use isothermal boxes with frozen water to transport and conserve the shrimp. This practice is also inappropriate because it fails to distribute the

Strengthening value chains… 191
temperature uniformly, the refrigeration process is slow and it encourages microbial reproduction. While the system continues to be used, it is advisable to use flake ice, which is longer lasting, covers the product adequately and keeps the temperature within the range of 0 °C and 4 °C. Should this be impossible, it is suggested as a last resort to use ice blocks produced with drinking water and broken up into small pieces with clean and disinfected tools. Similarly, business opportunities could be provided to potential investors interested in acquiring refrigerated trucks (thermoking), to provide transport for aquaculture operators and traders.
It will also be necessary to establish regulations requiring good handling of seafood products, including sanctions for contravention.
3. Entrepreneurship among producers, processors and marketers
CONAMYPE has been working with the cooperatives to strengthen their business capacities —an activity in which international cooperation could also collaborate. A case that would be interesting to explore as an example concerns the Brazilian Microenterprise and Small Business Support services (SEBRAE), which has implemented SME-support projects in the countries of the Southern Common Market (MERCOSUR) and other Latin American and Caribbean countries to promote entrepreneurship and an associative business culture. In El Salvador, it would be useful to analyse this possibility, which could be accessed in the framework of the strategic partnership that exists in the joint El Salvador-Brazil Technical Cooperation Commission, channelled through the Brazilian Cooperation Agency (ABC).
Consideration could also be given to the experience of FUNDES, which from 2009 to 2012 implemented the programme “Economic development with a territorial approach in the South West Zone of El Salvador: Aquaculture and Tourism”, financed by the Inter-American Development Bank (IDB), the Multilateral Investment Fund (MIF) and Italian Development Cooperation. This project benefited 24 tilapia-aquaculture producers and 23 new entrepreneurs by improving their technical and business skills; and other activities were also undertaken to support the national aquaculture sector, including the creation of a web portal transferred to CENDEPESCA.
K. Summary of constraints and good practices or recommendations
Table IV.8 provides a summary of the constraints and best practices and selected recommendations for improving the shrimp aquaculture chain in El Salvador.
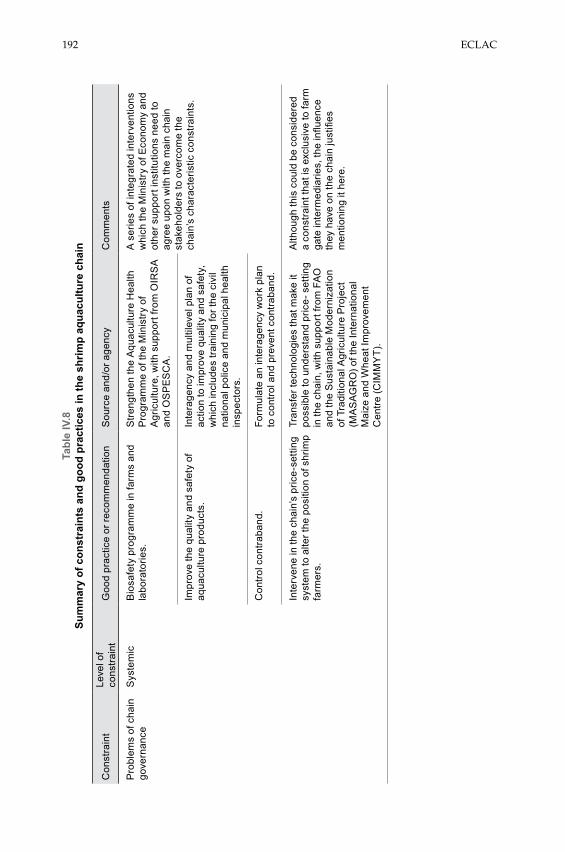
192 ECLAC
Tabl
e IV
.8
Sum
mar
y of
con
stra
ints
and
goo
d pr
actic
es in
the
shrim
p aq
uacu
lture
cha
in
Con
stra
int
Leve
l of
cons
train
tG
ood
prac
tice
or re
com
men
datio
nS
ourc
e an
d/or
age
ncy
Com
men
ts
Pro
blem
s of
cha
in
gove
rnan
ce
Sys
tem
icB
iosa
fety
pro
gram
me
in fa
rms
and
labo
rato
ries.
Stre
ngth
en th
e A
quac
ultu
re H
ealth
P
rogr
amm
e of
the
Min
istr
y of
A
gric
ultu
re, w
ith s
uppo
rt fro
m O
IRS
A
and
OS
PE
SC
A.
A s
erie
s of
inte
grat
ed in
terv
entio
ns
whi
ch th
e M
inis
try
of E
cono
my
and
othe
r sup
port
inst
itutio
ns n
eed
to
agre
e up
on w
ith th
e m
ain
chai
n st
akeh
olde
rs to
ove
rcom
e th
e ch
ain’
s ch
arac
teris
tic c
onst
rain
ts.
Impr
ove
the
qual
ity a
nd s
afet
y of
aq
uacu
lture
pro
duct
s.In
tera
genc
y an
d m
ultil
evel
pla
n of
ac
tion
to im
prov
e qu
ality
and
saf
ety,
w
hich
incl
udes
trai
ning
for t
he c
ivil
natio
nal p
olic
e an
d m
unic
ipal
hea
lth
insp
ecto
rs.
Con
trol c
ontra
band
.Fo
rmul
ate
an in
tera
genc
y w
ork
plan
to
con
trol a
nd p
reve
nt c
ontra
band
.
Inte
rven
e in
the
chai
n’s
pric
e-se
tting
sy
stem
to a
lter t
he p
ositi
on o
f shr
imp
farm
ers.
Tran
sfer
tech
nolo
gies
that
mak
e it
poss
ible
to u
nder
stan
d pr
ice-
set
ting
in th
e ch
ain,
with
sup
port
from
FAO
an
d th
e S
usta
inab
le M
oder
niza
tion
of T
radi
tiona
l Agr
icul
ture
Pro
ject
(M
AS
AGR
O) o
f the
Inte
rnat
iona
l M
aize
and
Whe
at Im
prov
emen
t C
entre
(CIM
MY
T).
Alth
ough
this
cou
ld b
e co
nsid
ered
a
cons
train
t tha
t is
excl
usiv
e to
farm
ga
te in
term
edia
ries,
the
influ
ence
th
ey h
ave
on th
e ch
ain
just
ifies
m
entio
ning
it h
ere.

Strengthening value chains… 193
Con
stra
int
Leve
l of
cons
train
tG
ood
prac
tice
or re
com
men
datio
nS
ourc
e an
d/or
age
ncy
Com
men
ts
Wea
knes
s of
th
e A
quac
ultu
re
Tech
nica
l R
ound
tabl
e
Sys
tem
icE
xpan
d th
e sp
ace
for d
ialo
gue
and
cons
ensu
s am
ong
the
publ
ic a
nd
priv
ate
sect
ors.
Stre
ngth
en th
e in
tera
genc
y co
ordi
natio
n of
the
Min
istr
y of
A
gric
ultu
re a
nd th
e M
inis
try
of
Eco
nom
y as
art
icul
ator
s in
the
Aqu
acul
ture
Tec
hnic
al R
ound
tabl
e an
d en
titie
s re
spon
sibl
e fo
r fo
rmul
atin
g th
e an
nual
wor
k pl
an
and
mon
itorin
g th
e ac
tiviti
es a
gree
d up
on a
nd ta
sks
assi
gned
.
The
Min
istr
y of
Agr
icul
ture
sh
ould
con
tinue
wor
king
with
the
prod
uctio
n lin
k an
d th
e aq
uacu
lture
he
alth
com
pone
nt w
hile
the
Min
istr
y of
Eco
nom
y fo
cuse
s on
the
mar
ketin
g, tr
ansp
ort a
nd s
trate
gy
links
, to
enco
urag
e di
alog
ue
betw
een
the
publ
ic a
nd p
rivat
e se
ctor
s, a
nd e
xper
ienc
e ac
quire
d w
ith E
CLA
C.
Abs
ence
of
a bi
osaf
ety
prog
ram
me
and
appl
icat
ion
of
good
pra
ctic
es
in a
quac
ultu
re
Inpu
t sup
ply
and
prod
uctio
n lin
ksE
xpan
d th
e di
ssem
inat
ion
and
appl
icat
ion
of m
anua
ls o
n go
od
aqua
cultu
re p
ract
ices
as
oblig
ator
y st
anda
rds.
Act
ive
part
icip
atio
n is
requ
ired
from
the
Min
istr
y of
A
gric
ultu
re th
roug
h C
EN
DE
PE
SC
A
and
the
Aqu
acul
ture
Hea
lth
Pro
gram
me
of th
e Li
vest
ock
Dire
ctor
ate
toge
ther
with
sup
port
from
the
Min
istr
y of
the
Env
ironm
ent
and
Nat
ural
Res
ourc
es a
nd th
e M
inis
try
of H
ealth
.
OIR
SA
Reg
iona
l Aqu
acul
ture
H
ealth
Pro
gram
me.
Ens
ure
the
long
-term
sus
tain
abili
ty
of s
hrim
p cu
ltiva
tion
and
redu
ce it
s vu
lner
abili
ty to
dis
ease
s, in
vasi
ve
spec
ies
and
the
impa
ct o
f nat
ural
ph
enom
ena.
Spe
cial
ized
tech
nica
l as
sist
ance
is n
eede
d to
ens
ure
the
appl
icat
ion
of g
ood
aqua
cultu
re
prac
tices
by
the
prod
ucer
s.
OS
PE
SC
A A
quac
ultu
re
Dev
elop
men
t Stra
tegy
.
Mes
o-A
mer
ican
coo
pera
tion
prog
ram
me
of S
ICA
and
Mex
ico
fo
r the
fish
ery
and
aqua
cultu
re
valu
e ch
ains
.
Res
earc
h in
stitu
tions
in M
exic
o su
ch a
s th
e Fo
od a
nd D
evel
opm
ent
Res
earc
h C
entre
(CIA
D),
the
Nor
th
Wes
tern
Bio
logi
cal R
esea
rch
Cen
tre
(CIB
NO
R),
and
the
Nat
iona
l Agr
ifood
H
ealth
, Saf
ety
and
Qua
lity
Ser
vice
(S
EN
AS
ICA)
.
Tab
le IV
.8 (c
ont
inue
d)

194 ECLACTa
ble
IV.8
(co
ntin
ued
)
Con
stra
int
Leve
l of
cons
train
tG
ood
prac
tice
or re
com
men
datio
nS
ourc
e an
d/or
age
ncy
Com
men
ts
Inco
rrec
t han
dlin
g an
d lo
w q
ualit
y of
fin
al p
rodu
cts
Pro
cess
ing,
tra
nspo
rt,
mar
ketin
g an
d co
nsum
ptio
n lin
ks.
Trai
ning
for p
rodu
cers
and
trad
ers
in
good
shr
imp
hand
ling
prac
tices
.FA
O a
nd th
e C
entre
for M
arke
ting
Info
rmat
ion
and
Adv
isor
y S
ervi
ces
for F
ishe
ry P
rodu
cts
in
Latin
Am
eric
an a
nd C
arib
bean
(IN
FOP
ES
CA)
to p
rovi
de tr
aini
ng a
nd
tech
nica
l ass
ista
nce
to p
rodu
cers
an
d m
arke
ters
.
To e
nabl
e th
e S
alva
dora
n co
nsum
er to
hav
e ac
cess
to
best
-qua
lity
shrim
p w
ithou
t ris
k to
th
eir h
ealth
.
Inve
stig
ate
alte
rnat
ive
ener
gy
sour
ces
to m
ake
ice
plan
ts a
nd
supp
ly c
entre
s su
stai
nabl
e.
Par
tner
ship
in e
nerg
y an
d en
viro
nmen
t with
Cen
tral A
mer
ica
to
prom
ote
rene
wab
le e
nerg
y so
urce
s.
Use
of e
cono
mic
ene
rgy
sour
ces
for i
ce p
rodu
ctio
n.
Impr
ove
the
stoc
k of
equ
ipm
ent f
or
the
trans
port
and
cons
erva
tion
of
fishe
ry a
nd a
quac
ultu
re p
rodu
cts.
Inte
rnat
iona
l coo
pera
tion
to u
pgra
de
the
trans
port
link
and
know
ledg
e of
app
ropr
iate
and
acc
essi
ble
tech
nolo
gies
for t
herm
o-re
frige
ratio
n.
Tran
sfer
of r
efrig
erat
ion
tech
nolo
gies
and
tran
spor
t with
re
frige
rate
d tru
cks
(ther
mok
ing)
.
Incl
ude
farm
gat
e in
term
edia
ries
in th
e te
chni
cal a
ssis
tanc
e pr
ogra
mm
es a
s pa
rt of
thei
r ta
rget
pop
ulat
ion.
Des
ign
a pr
opos
al fo
r inc
orpo
ratin
g in
term
edia
ries
in c
oope
ratio
n pr
ogra
mm
es m
ainl
y fo
r the
ir pr
ice-
setti
ng ro
le (F
AO a
nd E
CLA
C).
The
pres
ence
of i
nter
med
iary
is
nor
mal
in v
alue
cha
ins.
N
onet
hele
ss, t
hey
have
not
pa
rtic
ipat
ed in
gov
erna
nce
or
coop
erat
ion
stra
tegi
es w
hen
desi
gnin
g in
terv
entio
ns to
reso
lve
the
cons
train
ts fa
cing
the
chai
ns.
Trai
n ch
ain
stak
ehol
ders
on
qual
ity
and
safe
ty a
nd th
e ris
ks o
f foo
d-bo
rne
dise
ases
. Pro
mot
e th
e cu
lture
of
qua
lity
and
fulfi
lmen
t of s
tand
ards
of
exc
elle
nce.
The
inst
itutio
ns th
at c
ompr
ise
the
Nat
iona
l Qua
lity
Ser
vice
cou
ld
requ
est t
echn
ical
ass
ista
nce
from
the
Ger
man
Inte
rnat
iona
l Coo
pera
tion
Age
ncy
(GIZ
) to
hold
an
initi
al
CA
LID
EN
A w
orks
hop
(qua
lity,
le
ader
ship
, ide
as, c
hain
).
CA
LID
EN
A w
as d
evel
oped
by
the
Ger
man
Met
rolo
gy In
stitu
te to
su
ppor
t the
dev
elop
men
t of q
ualit
y in
frast
ruct
ure.

Strengthening value chains… 195Ta
ble
IV.8
(co
ntin
ued
)
Con
stra
int
Leve
l of
cons
train
tG
ood
prac
tice
or re
com
men
datio
nS
ourc
e an
d/or
age
ncy
Com
men
ts
Lack
of
entre
pren
eurs
hip
Pro
duct
ion,
pr
oces
sing
and
m
arke
ting
links
.
Sup
port
shrim
p fa
rmin
g co
oper
ativ
es in
thei
r tra
nsiti
on
tow
ards
bus
ines
s m
odel
s al
low
ing
for a
hig
her p
rofit
mar
gin
with
out
losi
ng th
e so
cial
vis
ion
of s
uppo
rt
for m
embe
rs.
Join
t El S
alva
dor-
Bra
zil S
outh
-Sou
th
coop
erat
ion
com
mis
sion
, to
draw
on
the
expe
rienc
es o
f the
Bra
zilia
n M
icro
ente
rpris
e an
d S
mal
l-Bus
ines
s S
uppo
rt S
ervi
ce (S
EB
RA
E) a
nd th
e B
razi
lian
Coo
pera
tion
Age
ncy
(AB
C).
The
follo
win
g ch
arac
teris
tic
SE
BR
AE
line
s of
sup
port
coul
d be
con
side
red:
(a) t
rain
ing
of
tech
nici
ans,
ent
repr
eneu
rs,
empl
oyer
s, m
ultip
liers
and
pub
lic-
and
priv
ate-
sec
tor m
anag
ers;
and
(b
) sup
port
for a
nd d
evel
opm
ent o
f bu
sine
ss c
oope
ratio
n pr
ojec
t fo
r SM
Es.
Stre
ngth
en b
usin
ess
train
ing
and
entre
pren
eurs
hip
to fo
rmal
ize
busi
ness
es.
Upg
rade
the
wor
k an
d ex
perie
nce
of
CO
NA
MY
PE
as
a na
tiona
l ins
titut
ion
to s
uppo
rt th
e de
velo
pmen
t of
MS
ME
s.
In 2
012,
CO
NA
MY
PE
wor
ked
with
coo
pera
tives
thro
ugh
busi
ness
trai
ning
wor
ksho
ps a
nd
the
unde
rtak
ing
of th
e m
arke
t st
udy
for c
ultiv
ated
whi
te s
hrim
p (C
ON
AM
YP
E, 2
012)
.
Hel
p co
oper
ativ
es im
prov
e th
eir
yiel
ds th
roug
h bu
sine
ss tr
aini
ng,
and
redu
cing
thei
r rel
ianc
e on
in
term
edia
ries.
Pro
mot
e en
trepr
eneu
rshi
p in
sec
tors
th
at c
ompl
emen
t shr
imp
farm
ing.
Cap
italiz
e on
the
expe
rienc
e of
the
FUN
DE
/IDB
/MIF
pro
ject
ent
itled
“E
cono
mic
Dev
elop
men
t with
a
Terr
itoria
l App
roac
h in
Sou
th
Wes
tern
El S
alva
dor:
Aqu
acul
ture
an
d To
uris
m”.
App
rova
l of a
pro
ject
de
sign
ed b
y th
e M
inis
try
of T
ouris
m
(MIT
UR
) for
tour
ism
dev
elop
men
t in
the
La L
iber
tad
Mar
ine
zone
in
clud
ing
fishi
ng c
omm
uniti
es.
Lear
n fro
m th
e en
trepr
eneu
rial
expe
rienc
es d
evel
oped
with
tila
pia
culti
vato
rs a
nd fi
sher
men
, and
ev
alua
te th
e po
ssib
ility
of d
esig
ning
to
uris
m p
roje
cts
linke
d to
sh
rimp
farm
s.

196 ECLACTa
ble
IV.8
(co
nclu
ded
)
Con
stra
int
Leve
l of
cons
train
tG
ood
prac
tice
or re
com
men
datio
nS
ourc
e an
d/or
age
ncy
Com
men
ts
Ove
rcro
wdi
ng,
lack
of h
ygie
ne
and
unsa
fe
cond
ition
s in
“L
a Ti
endo
na”
Sys
tem
ic, w
ith
emph
asis
on
the
mar
ketin
g an
d co
nsum
ptio
n lin
ks.
Rem
odel
or r
eloc
ate
the
fish
and
seaf
ood
area
of “
La T
iend
ona”
and
te
ach
good
food
han
dlin
g pr
actic
es.
Rev
iew
the
expe
rienc
e of
Pan
ama
City
in c
reat
ing
the
seaf
ood
mar
ket,
whi
ch w
as s
uppo
rted
by
JIC
A in
199
3 an
d 19
94, a
nd th
e pr
opos
al m
ade
by
this
age
ncy
for t
he p
ort o
f La
Libe
rtad
in
El S
alva
dor.
Avoi
d ov
ercr
owdi
ng in
fish
and
se
afoo
d sa
les
outle
ts a
nd p
rom
ote
the
fulfi
lmen
t of h
andl
ing,
hyg
iene
an
d sa
fety
sta
ndar
ds. I
mpr
ove
the
qual
ity a
nd p
rese
ntat
ion
of fi
sh a
nd
seaf
ood
prod
ucts
to b
e so
ld o
n th
e do
mes
tic m
arke
t.D
esig
n a
proj
ect t
o re
loca
te “L
a Ti
endo
na” u
nder
the
ausp
ices
of t
he
Min
istr
y of
Pub
lic W
orks
, Tra
nspo
rt,
Hou
sing
and
Urb
an D
evel
opm
ent,
and
the
May
oral
ty o
f San
Sal
vado
r.
Rev
iew
FAO
and
INFO
PE
SC
A
expe
rienc
e in
the
proj
ect t
o im
prov
e do
mes
tic m
arke
ts o
f fish
ery
prod
ucts
in
cer
tain
cou
ntrie
s of
Lat
in A
mer
ica
and
the
Car
ibbe
an.
Enc
oura
ge v
endo
rs a
nd c
onsu
mer
s to
be
mor
e de
man
ding
in te
rms
of th
e sa
fety
of fi
sher
y an
d aq
uacu
lture
pro
duct
s.
Lack
of s
uppl
y fo
r the
dom
estic
m
arke
t and
exp
ort
capa
city
Sys
tem
ic w
ith
emph
asis
on
the
prod
uctio
n an
d m
arke
ting
link.
Dev
elop
men
t of m
anag
eria
l and
co
mm
erci
al s
kills
, lea
rnin
g of
pr
actic
al s
ales
stra
tegi
es in
the
mar
ket a
nd p
rom
otio
n of
shr
imp
cons
umpt
ion.
With
the
Aqu
acul
ture
Cha
in
Pro
gram
me,
gen
erat
e st
agge
red
prod
uctio
n fo
r the
dom
estic
mar
ket.
Pro
mot
ion
of th
e co
nsum
ptio
n of
sh
rimp
as a
qua
lity
prod
uct a
t fa
ir pr
ices
.
Par
tner
ship
bet
wee
n pr
oduc
ers,
m
arke
ters
, res
taur
ants
and
the
gove
rnm
ent t
o pr
omot
e do
mes
tic
cons
umpt
ion.
Pos
ition
ing
in th
e do
mes
tic m
arke
t ba
sed
on th
e de
velo
pmen
t of s
ales
st
rate
gies
in a
ccor
danc
e w
ith
Sal
vado
ran
cultu
re.
PR
OE
SA
Ste
p-by
-Ste
p E
xpor
t P
rogr
amm
e (E
xpor
tar p
aso
a pa
so).
Acq
uire
Exp
ort e
xper
ienc
e.
So
urce
: P
rep
ared
by
the
auth
ors.

Strengthening value chains… 197
L. Five programmes for upgrading the shrimp aquaculture chain
The programmes described below incorporate the analysis of best practices with a view to addressing the constraints identified during the diagnostic stage; in other words, the recommendations consider successful situations observed in the shrimp chain in other countries. In addition to the main result of the diagnostic study, programmes that include strategies and lines of action were validated and enhanced at the dialogue roundtables.21
As noted in chapter II of this volume, the value-chain strengthening methodology allows for the microanalysis of constraints, along with the design of specific and targeted strategies for upgrading. For this reason, the list of strategies and lines of action is presented below to illustrate the usefulness of the methodology for implementing industrial policies.
1. Programme 1: innovation, good practices and eco-efficiency
Target public: Input suppliers, shrimp farmers and public support institutions.
One of the most serious threats faced by the value chain stems from its failure to apply good cultivation, eco-efficiency strategies or biosafety practices to prevent outbreaks of diseases caused by pathogens (bacteria and fungi) or invasive species.
Strategy 1: Formulate and implement a biosafety programme and the application of good aquaculture practices both on the farms and in the seed-producing laboratories, as agreed upon at the aquaculture technical roundtable.
Lines of action:• Formulate a biosafety programme and incorporate good
aquaculture practices with the participation and agreement of all roundtable participants.
• Coordinate actions in the Aquaculture Chain Programme to pool efforts and avoid duplication of activities with those that are ongoing or planned by the Ministry of Agriculture.
• Request technical assistance and support from OIRSA and OSPESCA.
• Assist and collaborate with the public sector in its control, verification and inspection functions.
21 On this point, see chapters II and III of this volume.

198 ECLAC
Strategy 2: Improve public-sector capacities (Ministry of Agriculture and Ministry of the Environment and Natural Resources, and municipalities) in terms of control, verification and inspection of the fulfilment of minimal security standards in the maturation laboratories and fish farms.
Lines of action:• Increase investment in infrastructure for the control and
formation of human resources to meet biosafety needs.• Verify that shrimp farmers are implementing protocol-based
sanitary emptying of the tanks after each harvest.• Verify that the shrimp farmers, irrespective of their cultivation
system, use laboratory- produced seeds and prohibit the use of seed captured in the natural environment.
• Undertake inspections to ensure that shrimp farmers use a pumping system to fill the tanks that makes it possible to filter the water and prevent the entry of extraneous organisms from the natural environment.
• Verify that shrimp farmers do not engage in bad management practices that compromise the eco-efficiency of their cultivations and their biosafety.
Strategy 3: Strengthen the capacities of the Livestock Directorate of the Ministry of Agriculture, the Directorate-General of Fishery and Aquaculture Development and the Ministry of the Environment and Natural Resources in terms of prevention, diagnosis and control of diseases, to minimize the risk of pathogens and invasive species entering the cultivation systems.
Lines of action:• Systemize information on epidemiological threats.• Develop a pathogen-monitoring system for the cultivations.• Construct an early-warning system against potential threats of
environmental pollution or the emergence of new pathogenic threats.• Create management and training instruments for chain
participants with an internal verification format for the larvae-producing laboratories, a health management plan for shrimp farmers and a transport protocol for the intermediaries.
Strategy 4: Prepare an eco-efficient management proposal to promote the planned use of inputs, improve the profitability of cultivations and reduce environmental impacts, incorporating business-profitability and socioenvironmental-sustainability criteria.
Lines of action:• Analyse the quality of inputs used in fish farming with the aim
of evaluating their economic and environmental performance in the chain.

Strengthening value chains… 199
• Specify minimal contents for preparing the input eco-efficiency plan.
• Assist each cooperative in hiring a professional with specific experience (engineer and biologist or an aquaculture technical expert, among others) to provide technical assistance to producers and control the cultivation areas.
Strategy 5: Create a research and technology centre capable of serving the entire aquaculture and fisheries sector, including a line of work on research and sustainable development of shrimp aquaculture, focused on the innovation of production systems, to the benefit of producers, consumers and the environment.
Lines of action:• Define the centre’s governance and financing model through
dialogue between the government and private sector.• Define the activities and services that the centre could develop,
either on its own initiative or in response to demand.• Include the following in the centre’s main functions:
– Analyse and systemize market information to ensure the centre’s activities and services help strengthen the chain and the sectors.
– Foster links with networks of research centres to strengthen the exchange of information, knowledge and processes, and with academia, including internships and research activities by academics working on issues that are relevant to the sector.
– Create a network of specialists from various disciplines to promote the sector’s growth and development, based on programmes of information and formation of technology transfers for aquaculture operators and fishing communities, other workers and technical personnel.
– Design and apply sector-level research plans focused on the genetic improvement of the most important species such as shrimp and tilapia.
– Participate in the design of technical standards for aquaculture and fishing activities.
2. Programme 2: quality and safety in the chain
Target public: Processors (if they work with local production) together with farm gate intermediaries, transporters, wholesale and retail traders, final consumers and public support institutions.
The lack of quality and safety in the value chain could be considered a basic systemic constraint. An integrated response is needed which encompasses all links and improves articulations among the participants.

200 ECLAC
Strategy 6: Raise awareness among chain participants on importance of conserving the quality and safety of shrimp cultivated and sold at the farm gate.
Lines of action:• Hold training workshops for chain participants to raise
awareness of the importance of conserving quality and safety throughout the product life cycle.
• Encourage actions to promote quality services for the value chain to increase the competitiveness of shrimp farmers.
• Restructure “La Tiendona” to improve supply, conservation and sale conditions.
Strategy 7: Propose to the El Salvador National Quality Council (CNC) the generation of technical standards in line with international requirements, and prepare a system for shrimp farming.
Lines of action:• Create technical standards to regulate shrimp production,
processing and marketing.• Create a certification system for chain participants making it possible
to enhance the quality of shrimp produced and, where possible, promote participation by Salvadoran service MSMEs in that system.
• Formulate a shrimp aquaculture traceability programme, which encompasses the chain’s entire production cycle.
• Set up and aquaculture quality laboratory that is capable of providing services and technical assistance to the entire sector.
Strategy 8: Create the “El Salvador Shrimp” brand, based on certification of its origin and the production processes undertaken in the farms.
Lines of action: • Create and disseminate the “El Salvador Shrimp” brand using a
participatory process. • Design a logo and develop easily identifiable slogans to
distinguish the brand in the market.• Identify a public- and private-sector group consisting of
professionals who design, coordinate and supervise the development of domestic and external communication aimed at nurturing the reputation of the brand.
3. Programme 3: combat shrimp contraband
Target public: Public support institutions.Contraband inputs (equipment and materials, often produced on an
informal basis) and shrimps constitute de facto unfair competition for local production.

Strengthening value chains… 201
Strategy 9: Design and apply, on a coordinated basis, a national plan for preventing and combating contraband.
Lines of action: • Design a national plan for preventing and combating
contraband that can be articulated with other existing Central American plans and, in particular, with Honduras, the country from which a large volume of contraband shrimp arriving in El Salvador apparently originates. This plan should include coordination with the General Customs Directorate, the Civil National Police, the Navy, the Ministry of Health and municipal governments, among other actors.
• Prepare work, training and awareness strategies targeting workers in processing plants, along with local traders and consumers, on the health risks and harmful economic effects caused by trade in contraband shrimp.
• Increase the number of, and provide training to, control agents assigned to the country’s border areas, roads, ports and strategic beaches, on the standards and procedures stipulated to prevent contraband shrimp trade
4. Programme 4: marketing and intermediation in the chain
Target public: Farm gate intermediaries and traders.
Farm gate intermediaries are traders that purchase shrimp from the producers. They are a key participants in terms of price setting and post-harvest production management.
Strategy 10: Improve conditions for handling and transporting the shrimp from harvest to sale, fulfilling safety and quality standards during the process.
Lines of action:• Create a programme of good shrimp handling practices for
farm gate intermediaries and other traders.• Inculcate in traders the importance of fulfilling sanitary
and phytosanitary standards for handling fish and seafood products, both during transport of the merchandise and in its display for sale. Design strategies to verify fulfilment of the standards and apply sanctions as necessary.
• Increase the number of intermediaries that use flake ice and refrigerated trucks (thermoking); otherwise, at minimum, expand the use of pre-chilled isothermal boxes loaded with ice

202 ECLAC
in blocks, which has been crushed with thoroughly disinfected implements.
• Construct in a strategic zone agreed upon with the shrimp farmers, a flake ice plant and a cold store to maintain stocks of shrimp throughout the year, based on coordination between the public and private sectors.
• Evaluate the feasibility of using alternative energy sources for the operation of the supply centres, ice plants and sales outlets for fish and seafood products, to reduce production, processing and marketing costs, and to ensure the maintenance of the cold chain.
Strategy 11: Generate a pricing information system to make the information of the intermediation chain more transparent, and obtain fair prices for producers and traders.
Lines of action:
• Design a software program that makes it possible to track the pricing cycle. Information and communication technologies, specifically mobile phones, could help shrimp farmers gain access to current prices on the domestic and international market.
• Use mobile phones and other complementary media for disseminating of prices, to inform shrimp farmers and other chain participants of the formation of prices on the national and international market.
5. Programme 5: chain governance
Target public: Public support institutions and shrimp farmers.
Improve the governance of the chain based on training interventions using new technologies, and new forms of coordination and interagency networking.
Strategy 12: Train shrimp farmers on the business development and management based on new information and communication technologies.
Lines of action:• Formulate an interdisciplinary training programme to create
and strengthen skills among participants in the production, processing and marketing links.
• Strengthen cooperatives in terms of business management and promote the use of information and communication technologies to contribute to the economic planning of production.

Strengthening value chains… 203
• Create a mobile service that supports the activities of shrimp farmers, sending them weather information, specific market data with emphasis on price setting, and information on good shrimp cultivation and handling practices, based on text messages.22
• Institutionalize a market intelligence scheme to obtain information on trends in the shrimp trade nationally, regionally, and worldwide, to make the most of the competitive advantages and react on a timely basis to changes that threaten the development of the activity.
• In conjunction with BANDESAL, design strategies to make it easier for shrimp farmers and transporters to access formal credit, and to analyse other sources of financing alternatives that have proven successful with aquaculture, fishery and/or aquaculture producers.
Strategy 13: Provide incentives for dialogue, coordination of the public and private sectors, and network operations, by incorporating new strategic partners another support institutions that have not yet become involved.
Lines of action:
• Upgrade the role of the Aquaculture Technical Roundtable, to improve dialogue and the coordination of actions of all chain participants. Inclusion of the Ministry of the Economy is important, given its capacities in the shrimp chain and experience of managing public- and private-sector spaces in other areas of the Salvadoran economy. Incorporate other support institutions from the national government, as the group deems necessary.
• Design a register system for shrimp farmers, along with evaluation mechanisms that make it possible to measure the results of policy tools in terms of strengthening capacities and in actions financed to overcome constraints.
• Forge partnerships with other institutions or support organizations for the sector, such as OSPESCA, OIRSA, FAO, INFOPESCA, the Aquaculture Network of the Americas, and the Global Aquaculture Alliance, among others.
6. Costs, timeframe and impact of the strategies
Figure IV.3 illustrates an analytical tool for prioritizing the implementation of the strategies designed in accordance with their relative cost, timeframe
22 The “MasAgro Móvil” system applied in Mexico by the CIMMYT, is an example of this.

204 ECLAC
and impact. This input aims to provide guidance to facilitate decision-making, in accordance with the political will, natural resources and timeframes available. Initially, this figure was prepared by the authors in conjunction with public officials related to the chain; and it was later presented at the second roundtable, for enhancement and adaptation by chain participants, according to their needs and knowledge.
Figure IV.3 Matrix of relative costs, implementation time and impact
$ $ $Impact
Impl
emen
tatio
n pe
riod
1
2
11
HighLowShort
Long
4
6
7
8
9
10
3 12
13
Relative costs
5
$
Source: Prepared by the author.
Note:Strategy 1: Biosafety programme for farms and seed-production laboratories, agreed upon at the Aquaculture Technical Roundtable. Strategy 2: Improve public sector capacities in terms of control, verification and inspection of the fulfilment of safety standards in maturation laboratories and in shrimp farms. Strategy 3: Strengthen capacities for the prevention, diagnosis and control of diseases caused by the introduction of pathogens and invasive species.Strategy 4: Proposal for eco-efficient management that promotes the planned use of inputs improves the profitability of the cultivations and reduces environmental impacts.Strategy 5: Create an Aquaculture Research and Technology Centre.Strategy 6: Raise awareness among chain participants of the importance of conserving the quality and safety of shrimp farmed and sold at farm gate.Strategy 7: Propose to the El Salvador National Quality Council the generation of technical standards aligned with international requirements, and prepare a quality system for shrimp farming.Strategy 8: Create an El Salvador shrimp brand.Strategy 9: National plan to prevent and combat shrimp contraband.Strategy 10: Improve shrimp handling and transporting conditions.Strategy 11: Price information system. Strategy 12: Train shrimp farmers in business development and management.Strategy 13: Dialogue and coordination of public and private actors and network activities with new strategic partners.
Strengthening value chains… 205
M. Conclusions
The process through which ECLAC has provided support to strengthen the shrimp aquaculture chain in El Salvador reflects the importance of the approach designed as a tool of inclusive industrial policy.
The private support which this process also received suggests that a fundamental strategy for designing an innovative production policy requires the public sector to convene discussion, and forge agreement on industrial-policy issues.
The results obtained in this value chain, and the ongoing work of the Ministry of Economy show that the diagnostic assessment and strategies proposed have become major inputs for the design of public policies. Under the El Salvador Productive Development Fund (FONDEPRO), four projects have been financed to enable shrimp farmers to create their own centres and start shrimp processing in a plant located in the country’s marine coastal zone. The Ministry of Economy is currently also preparing a project to present to international co-operation with the aim of improving systems of conservation and cold transportation, involving the acquisition of refrigerated trucks (thermoking). On quality issues, this Ministry is expected to request technical assistance from German cooperation to improve quality infrastructure throughout the chain.
One of the concerns is access to credit and alternative forms of financing, suited to various factors: the dynamic of the sector; territorial development based on the articulation of cooperatives present in the producing zones; and relations with strategic innovation factors and the development of skills and abilities; the services infrastructure, and social responsibility of private stakeholders vis-à-vis domestic and international consumers.
Apart from the strategies and lines of action proposed and described in this chapter, it is essential to have commitment and support from all participants in the chain, in both the public and private sectors, so that the constraints currently faced by the chain can be overcome jointly and on a consensual basis. Such agreements should also enable shrimp farmers to become self-sustainable, by developing responsible aquaculture production systems and achieving higher rates of profitability, with intermediaries transporting quality shrimp in hygienic and safe conditions, and consumers able to obtain a quality product at a fair price.

206 ECLAC
Bibliography
Alfaro, J. (2011), Estudio de mercado para la comercialización de tilapia, San Salvador, National Foundation for Development (FUNDE).
Anríquez, G. (2006), “Governance and rural public expenditures in Latin America”, Working Papers, No. 07-01, Rome, Food and Agriculture Organization of the United Nations (FAO).
BCR (Central Reserve Bank) (2013), “Estadísticas de exportaciones e importaciones de camarón, 2002-2012”, San Salvador.
Beltrán, C. (2013), Contribución de la pesca y la acuicultura a la seguridad alimentaria y el ingreso familiar en Centroamérica, Rome, Food and Agriculture Organization of the United Nations (FAO).
(2012), Plan estratégico para el desarrollo de la acuicultura comercial en la República de El Salvador, San Salvador, National Foundation for Development (FUNDE).
(2011), Value-Chain Analysis of International Fish Trade and Food Security in the Republic of Honduras. Final Report, Rome, Food and Agriculture Organization of the United Nations (FAO).
CENDEPESCA (Fisheries and Aquaculture Development Centre) (2012), Sistema del registro nacional de pesca y acuicultura, San Salvador.
(2008), Manual de buenas prácticas de manejo de productos pesqueros, San Salvador. CIBNOR (Centro de Investigaciones Biológicas del Noroeste S.C.) (2011), Bioseguridad
y ecoeficiencia en el cultivo de camarón, La Paz.CONAMYPE (National Commission for Micro- and Small Enterprises) (2012),
Estudio de mercado de camarón blanco de cultivo, San Salvador. ECLAC (Economic Commission for Latin America and the Caribbean) (2012),
Structural Change for Equality: An Integrated Approach to Development (LC/G.2524 (SES.34/3)), Santiago, Chile.
(2010), Time for Equality: Closing Gaps, Opening Trails. Summary (LC/G.2433 (SES.33/4)), Santiago, Chile.
ECLAC/FAO/IICA (Economic Commission for Latin America and the Caribbean/Food and Agriculture Organization of the United Nations/Inter-American Institute for Cooperation on Agriculture) (2011), Perspectivas de la agricultura y del desarrollo rural en las Américas: Una mirada hacia América Latina y el Caribe 2011-2012, San Jose.
ECLAC/OECD (Economic Commission for Latin America and the Caribbean/Organisation for Economic Cooperation and Development) (2011), Perspectivas económicas de América Latina 2012. Transformación del Estado para el desarrollo (LC/G.2501), Paris, OECD Publishing.
El Salvador (2011), “Ley de creación del sistema salvadoreño para la calidad”, San Salvador.
(2007), “Reglamento de la Ley general de ordenación y promoción de pesca y acuicultura”, San Salvador.
(2001), “Ley general de ordenación y promoción de pesca y acuicultura”, San Salvador.
FAO (Food and Agriculture Organization of the United Nations) (n/d-a), National Aquaculture Sector Overview. El Salvador, Santiago, Chile.
(n/d-b), Resumen informativo sobre la pesca por países. El Salvador, Santiago, Chile. (2013), FAO and Family Farming. The Case of El Salvador, Santiago, Chile.

Strengthening value chains… 207
(2012), The State of World Fisheries and Aquaculture 2012), Rome. (2010), “Informe del taller para el diagnóstico y seguimiento de la acuicultura
de pequeña escala y recursos limitados en América Latina”, Acuicultura en América Latina series, Asunción.
(2009), Code of Practice for Fish and Fishery Products, Rome. (2007), Manual de control de calidad de los productos de la acuicultura, Lima. (2006), Business Partnerships in Agrifood Chains, Santiago, Chile. (2005), Guía de buenas prácticas de manufactura y aseguramiento de calidad para la
empresa pesquera, Bogota. (1995), Code of Conduct for Responsible Fisheries, Rome.FAO/CENDEPESCA (Food and Agriculture Organization of the United Nations/
Fisheries and Aquaculture Development Centre) (2010), Manual de buenas prácticas higiénico-sanitarias de productos pesqueros y acuícolas de El Salvador, San Salvador.
FAO/CFC (Food and Agriculture Organization of the United Nations/Common Fund for Commodities) (2001), Desarrollo de productos pesqueros de valor agregado, Lima.
FAO/INFOPESCA (Food and Agriculture Organization of the United Nations/Centre for Marketing Information and Advisory Services for Fishery Products in Latin America and the Caribbean) (2013), Manual de calidad y procesamiento para venta minorista de pescado, Lima.
Flores Nava, A. (2012), “Diagnóstico de la acuicultura de recursos limitados y de la acuicultura de la micro y pequeña empresa en América Latina”, Acuicultura en América Latina series, No. 7, Santiago, Chile, Food and Agriculture Organization of the United Nations (FAO).
Graham J., W. Johnston and F. Nicholson (1992), Ice in Fisheries, Rome, Food and Agriculture Organization of the United Nations.
IICA (Inter-American Institute for Cooperation on Agriculture) (2013), “Agricultura de El Salvador resurge con el PAF”, IICA Conexión, San Jose, 11 May.
López, J. (2012), Caracterización de la cadena productiva de acuicultura (camarón de mar), San Salvador, Ministry of Agriculture and Livestock/Inter-American Institute for Cooperation on Agriculture (IICA).
MAG (Ministry of Agriculture and Livestock) (2011), Plan de agricultura familiar y emprendedurismo rural para la seguridad alimentaria y nutricional, San Salvador.
MARN (Ministry of Environment and Natural Resources) (2013), “Los bosques salados, prioridad del Programa Nacional de Restauración de Ecosistemas”, San Salvador, March.
MINSAL (Ministry of Health) (2012), Manipulación de alimento: Guía didáctica para personal técnico, San Salvador.
(2004), Procedimientos e instrumentos para la protección e higiene de los alimentos, San Salvador.
Oddone, N. and C. Beltrán (2013), “Diagnóstico de la cadena de camarón de cultivo en El Salvador” (LC/MEX/L.1137), Mexico City, ECLAC subregional headquarters in Mexico/German Agency for International Cooperation (GIZ).
Oddone, N., R. Padilla and B. Antunes (2013), “Metodología del proyecto CEPAL-GIZ para el diseño de estrategias de fortalecimiento de cadenas de valor. Nota técnica”, Mexico City, ECLAC subregional headquarters in Mexico.
OIRSA (International Regional Organization for Plant and Animal Health) (2013),

208 ECLAC
“Notificación: Pérdidas significativas está ocasionando una nueva enfermedad ‘EMS/AHPNS’ en camarones cultivados en Asia”, San Salvador, January.
OIRSA/OSPESCA (International Regional Organization for Plant and Animal Health/Fisheries and Aquaculture Sector Organization of the Central American Isthmus) (2010), Manual de buenas prácticas de manejo para el cultivo del camarón blanco Penaeus vannamei, Panama City.
OLDEPESCA (Latin American Fisheries Development Organization) (2009), La acuicultura y sus desafíos, Lima.
Osorio Gómez, J. (2009), Informe final sobre hábitos y preferencias de consumo de productos pesqueros y acuícolas, San Salvador, Food and Agriculture Organization of the United Nations/ Fisheries and Aquaculture Development Centre (CENDEPESCA).
OSPESCA/SICA (Fisheries and Aquaculture Sector Organization of the Central American Isthmus/Central American Integration System) (2012a), Encuesta estructural de la pesca artesanal y la acuicultura en Centroamérica 2009-2011, San Salvador.
(2012b), Estrategia regional para el desarrollo de la acuicultura en los países del Sistema de la Integración Centroamericana (SICA), San Salvador.
Rodríguez Vázquez, H. (2013), Acuicultura de pequeña escala y recursos limitados en América Latina y el Caribe: hacia un enfoque integral de políticas públicas, Santiago, Chile, Food and Agriculture Organization of the United Nations (FAO).
Rodríguez Vázquez, H. and N. Oddone (2013), “Contribución de la acuicultura de recursos limitados y de micro y pequeña empresa a la seguridad alimentaria y al ingreso familiar en América Latina y el Caribe”, Santiago, Chile, Food and Agriculture Organization of the United Nations, inédito.
World Bank (2011), The Global Program on Fisheries: Strategic Vision for Fisheries and Aquaculture, Washington, D.C.

Chapter V
The synthetic fibre-sports apparel value chain in El Salvador
Bruno Antunes and Claudia Monge
A. Introduction
The synthetic fibre-sports apparel value chain operates in the garment and textile sectors, which have historically been very important for El Salvador. This value chain stands out because of product differentiation and the effort made by its participants to shift to a higher-value-added full-package approach. This value chain, which is highly external-market oriented, has developed in an environment that has benefited from proximity to the United States (its main market) and the provisions of the Dominican Republic-Central America-United States Free Trade Agreement (DR-CAFTA).
Both sectors have seen exports trend up between 2008 and 2012, but this value chain’s export performance is facing a major challenge in the form of the potential expansion of the Trans-Pacific Partnership (TPP) and currency appreciation against the United States dollar. In this setting, El Salvador needs to continue to strengthen this value chain and its export capacity.
This chapter sets out the results of applying the methodology for strengthening value chains, as described in chapter II, in order to increase value added, facilitate access to customers and markets, build on and enhance the cluster’s potential to the fullest and, in particular, incorporate small and medium-sized enterprises (SMEs) into the value chain activities. SME insertion strengthens the ties between export performance and a country’s economic growth, in addition to having a positive impact on

210 ECLAC
employment generation and on reducing structural heterogeneity in the economy (ECLAC, 2010b).
The first part of this chapter examines constraints and opportunities, not only those in each activity in the value chain but also those that impact the performance of the value chain as a whole.1 Based on this diagnostic study, the second part describes production development strategies and policies aimed at overcoming constraints and capitalizing on opportunities. The proposals put forth emerged from dialogue roundtables2 and exchanges of views with public and private sector counterparts and with experts from ECLAC. It is also based on best practice analysis of experiences in other countries where the context is comparable.
B. Diagnostic study
The analysis set out herein is the outcome of technical collaboration between the Ministry of Economy of El Salvador (MINEC), the Salvadoran Association of Industrialists (ASI) and ECLAC subregional headquarters in Mexico. It responds to the interest of the Government of El Salvador in strengthening its industrial policy and substantially improving selected value chains.
The synthetic fibre-sports apparel value chain was chosen because of its significant contribution to national development objectives defined by the Ministry of Economy of El Salvador: growing exports, boosting value added and creating jobs.
According to information from the most recent economic census results available, the textile and apparel sectors account for some 25% of El Salvador’s industrial value added and more than half of paid manufacturing jobs (DIGESTYC, 2005a). Within these sectors, synthetic fibre product sales have surged in recent years, exhibiting high growth rates. The synthetic fibre-sports apparel value chain is of particular interest because the value added of its products tends to be higher than that of other textile and garment value chains.
1. Description of the value chain
After the old system of textiles and clothing quotas under the Multifibre Arrangement was liberalized in 2005 and following full implementation of the World Trade Organization (WTO) Agreement on Textiles and Clothing (ATC), the textiles and apparel industry in the countries of Central
1 See Antunes and Monge (2013) for a detailed description of the diagnosis of this value chain. 2 Chapter III explains the organization of dialogue roundtables.

Strengthening value chains… 211
America, and of Latin America in general, saw a sharp decline in exports to the United States market. This was due mainly to the cost advantages offered by some countries in other regions, especially China.
As a result, China’s share of textile imports by the United States climbed steadily, turning China into the main supplier of textile and garment products. The Central American countries sought to consolidate a vertical integration strategy and shift from simple garment manufacturing activities to an integrated (full-package) industry encompassing spinning mills to advanced garment manufacture. The idea was to set the industry apart from its competitors, including some Asian countries, and move beyond traditional maquila activities.
These efforts on the part of the Central American countries were boosted by the signing and entry into force of DR-CAFTA, which granted favourable access to the United States market, including preferential tariff treatment and “yarn forward” rules of origin. Under these rules, clothing manufactured with fabric made with yarn produced in any of the countries of Central America or the Dominican Republic now has duty-free access to the United States market. Furthermore, the allowable percentage of non-originating materials (those from third countries) used in products that can be traded within the framework of the treaty was raised from 7% to 10%. There is also a short-supply list that allows garments listed in chapters 61, 62 and 63 of the Harmonized System to incorporate textile components that, regardless of their origin, the DR-CAFTA signatory countries cannot produce, keeping the tariff benefits under the treaty (MINEC, n.d.).
In this context, reconversion of the industry in order to offer a full package was complemented by implementation of just-in-time3 and speed to market4 manufacturing practices for fashion-sensitive and seasonal items. It was also complemented by improved business management and changes in some production processes. These strategies, combined with a drive to attract investment in the first links of the chain (production of yarn and fabric), enabled the development of a cluster of synthetic fibre goods producers in El Salvador. Their operations are concentrated in the central and western areas of the country, mainly in the departments of La Libertad and San Salvador; some companies are located in the departments of Santa Ana in the west and La Paz in the central area (see map V.1).
3 The term “just in time” refers to a system to meet actual demand from clients instead of expected demand, which reduces the cost of carrying inventories.
4 The expression “speed to market” refers to the time between receipt of the order by the supplier and delivery to the client and, where applicable, delivery to the retail sale unit.

212 ECLAC
Map V.1 El Salvador: geographical distribution of companies in the main
production activities of the synthetic fibre cluster, 2011
Garments: 2Accessories: 1
Yarn: 2Fabric: 1Garments: 5Accessories: 3
Yarn: 1Fabric: 3Garments: 6
Fabric: 1Garments: 1
Ahuachapán Cabañas
Chalatenango
Cuscatlán
La PazLa Unión
Morazán
San Miguel
San Salvador
San Vicente
Santa Ana
Sonsonate
Usulután
La Libertad
Source: Prepared by the authors, on the basis of Department of Statistics and Census (DIGESTYC)/Ministry of Economy of El Salvador, Directory of economic units 2011-2012, San Salvador, 2011, and map of Central America http://slideshop.com/PowerPoint-Central-America [online].
The first investments in this value chain were in CS Central America (Korean-owned), which produces textured nylon and polyester yarn, and in George C. Moore (United States-owned), which specializes in elastics and stretch fabrics. Both have been operating in El Salvador since 2006. The former made an initial investment of US$ 6 million, and another of US$ 40 million in May 2012. Several other companies set up operations in 2006: Korean-owned Youngone, specializing in winter clothing and sports apparel under the Patagonia, Timberland, Dillard’s and The North Face brands, among others; and Swiss-owned Swisstex El Salvador, which dyes and finishes high-quality knitted fabrics for clients such as Puma, Reebok, Adidas, Under Armour and New Balance.
Brazilian-owned Pettenati Centro América (Brazil’s most important textile firm, producing synthetic circular knitted fabrics) started up operations in 2008. Among its clients are well-known brands such as Nike, Puma, Adidas, Reebok and Land’s End. Pettenati Centro América’s initial US$ 50 million investment in El Salvador bolstered the operations of related companies manufacturing yarn and accessories that already had facilities there. It also increased the draw for new investment in related areas of synthetic fibre value chains (such as the production of yarn, fabric, accessories and garments). This company’s investment in El Salvador thus helped to consolidate the industry’s conversion from simple transformation activities with few linkages to a cluster with high potential.

Strengthening value chains… 213
In 2009, two textile industry entrepreneurs partnered to turn Textile Opico SA de CV (already operating in El Salvador) into TexOps, a knitted garment manufacturer with world-class clients such as Nike, Adidas, Under Armour, Levi’s, GAP, Reebok, Soffe, Dallas Cowboys, Dick’s Sporting Goods and Academy Sports. In 2010, Unifi Central America (United States-owned) began operating in El Salvador, supplying multifilament polyester and textured nylon yarns to the synthetic fibre cluster in El Salvador and the rest of the region. Other investments were in Apparel Production Services and ProDept, both United States-owned.
Together, these companies make up the synthetic fibre cluster, grouping more than 25 firms that operate in different production and support activities. According to the National Investment Office of the Ministry of Economy of El Salvador, these companies have invested US$ 170 million since 2006 and more than US$ 25 million in new investments have already been announced.
El Salvador’s synthetic fibre cluster groups sports apparel manufacturers in the synthetic fibre-sports apparel value chain, as well as companies that produce other types of products, such as winter clothing.5 Be that as it may, this value chain is not a subgroup of the synthetic fibre cluster. It has intersectoral characteristics with activities, including the provision of support services, which do not fall into that cluster.
In El Salvador, this value chain begins with manufacturing yarn, mainly from polyester and polyamide polymers such as nylon (an intermediate industrial product made by extrusion6 and texturing7). In El Salvador, the raw materials (thermoplastic polyester and polyethylene terephthalate or PET) are imported from the United States and Asian countries such as China. This is because the local supply is quite limited and does not meet the required quality, purity and cleanness standards. Manufacturing synthetic fibre yarns for the domestic market and for export requires chemicals and other inputs as well.
The raw material for synthetic-fibre fabric for the domestic market and for export is domestic or imported yarn. In El Salvador, this intermediate activity specializes in manufacturing synthetic circular knitted and warp knitted stretch fabrics with blends of Spandex, nylon and polyester. Processing is in keeping with the characteristics of the
5 For reasons related to data availability, the information set out herein is for the synthetic fibre cluster or the synthetic fibre-sports apparel value chain, as indicated throughout the chapter.
6 Extrusion is an automated manufacturing process consisting of heat-melting and pumping polymers to obtain a continuous filament or polyester partially oriented yarn (POY) that is subsequently textured.
7 Extruded POY is heat-set and mechanically false-twisted. Texturing is a process that changes the surface structure of continuous-filament yarns to give them a looped look and add bulk, softness and pliability.

214 ECLAC
yarns used, the methods followed and the machinery used, as well as specifications for application and finishing of the final product. Most of these products are for making clothing, while a significant proportion is sold to the footwear sector and other industries that use textiles, such as the automotive industry. On the domestic market, the textile sector is very closely linked to the apparel industry.
The garment-making activities at the end of the synthetic fibre-sports apparel value chain feature labour-intensive processes, including pre-production (product development), production (planning, computerized pattern cutting), laboratory tests (quality control), printing (screen printing), pre-assembly, assembly and finishing (accessories and other items). These activities use fabrics and other components and accessories to produce apparel intended mainly for export, especially to the United States, although they are sold on the domestic market as well (see diagram V.1).
Diagram V.1 El Salvador: major links to the main production activities
in the synthetic fibre-sports apparel value chain
Importing raw materials
Yarn manufacturing
Exporting yarn
Chemicals and other inputs
Fabric manufacturing
Chemicals and other inputs
Importing yarn
Exporting fabric
Importing fabric
Exporting sports apparel
Components and accessories
Design
Local marketImporting sports apparel
Energy
Cross-cutting services and inputs
External market Main production activities
Inputs
Transport and distribution
Machinery and equipment
Public services
Financial services
Education and training
Environmental services
Garment manufacturing
Source: Prepared by the authors.

Strengthening value chains… 215
The synthetic fibre-sports apparel value chain produces differentiated articles that compete in higher-value-added segments. Companies in the sports apparel manufacturing activities in El Salvador have already incorporated printing and graphic art design, which account for part of the value-added of design activities. But defining the functional characteristics of the products (which are also a component of the high value-added of design) is still in the hands of the major international brands.
According to the methodology applied in the ECLAC-German Agency for International Cooperation (GIZ) project, support services are, in addition to the main production activities (manufacturing yarn, fabric and apparel), a central part of the value chain and can be key factors for competitiveness. The diagnostic study highlights some cross-cutting services, including public services, education and training, support for innovation, energy supply, transport and distribution and environmental services. A number of these services were taken into account in mapping the value chain because they are related to some of the constraints and strategies identified in this chapter.
With regard to the distribution of companies along the production activities in the synthetic fibre cluster, the majority (54%) are in garment manufacturing activities; 19% are in fabric manufacturing. Some 12% and 15%, respectively, are in yarn and accessories manufacturing. This distribution is in line with the typical use of production factors in each of these activities. Yarn and fabric manufacturing, which are capital-intensive because they require substantial investment in machinery and equipment, are characterized by entry barriers. In contrast, garment-making is not capital-intensive, thus allowing the entry of more companies with smaller investments and encouraging the participation of domestic entrepreneurs and SMEs.
The concentration of garment-making companies is even more marked when looking at the total for the country, which includes the synthetic fibre cluster described in the preceding paragraph, as well as the other subsectors. In El Salvador’s textile sector, the number of yarn manufacturing companies decreased between 2005 and 2011 while the number of textile producers rose. Garment-makers have seen robust growth; they are mostly microenterprises (DIGESTYC, 2005b and 2011) that in many cases are still informal (see table V.1). The garment manufacturing sector accounts for a far higher proportion of jobs than the textile sector, although between 2007 and 2012 the number of workers declined in garment-manufacturing enterprises and increased in textile sector enterprises (see figure V.1). The shrinking employment figures in garment manufacturing activities could also be associated with an increase in the number of microenterprises, where the proportion of informal jobs is higher than at larger companies.

216 ECLAC
Table V.1 El Salvador: number of enterprises by category, 2005 and 2011 a
Total Microenterprises Small enterprises
Medium-sized enterprises
Large companies
2005 2011 2005 2011 2005 2011 2005 2011 2005 2011
Yarn 9 2 1 0 2 0 1 1 5 1
Fabric 8 13 2 6 0 2 0 1 6 4
Garments 231 610 75 503 35 44 12 9 109 54
Source: Prepared by the authors, on the basis of Department of Statistics and Census (DIGESTYC)/Ministry of Economy of El Salvador, Directory of economic units 2011-2012, San Salvador, 2011.
a Classed according to number of employees.
Figure V.1 El Salvador: employment in the textile and apparel sectors, 2007-2012
(Number of jobs)
0
20 000
40 000
60 000
80 000
2007 2008 2009 2010 2011 2012
Textile sector Apparel sector
Source: Prepared by the authors, on the basis of data from the Salvadoran Social Security Institute (ISSS).
Nominal wages rose in both sectors over the same period, by about 20% in the textile industry and about 30% in the apparel sector (see figure V.2). Notably, efforts to develop the participants of this value chain, along with subsequent job creation, have a positive impact on employment according to gender. In yarn and apparel manufacturing activities, female employees account for as much as 60%; in the fabric manufacturing activities the figure is around 50%.

Strengthening value chains… 217
Figure V.2 El Salvador: average monthly wages in the textile
and apparel sectors, 2007-2012(Dollars)
Textile sector Apparel sector
0
100
200
300
400
500
2007 2008 2009 2010 2011 2012
Source: Prepared by the authors, on the basis of data from the Salvadoran Social Security Institute (ISSS).
Activities in the value chain, from manufacturing synthetic yarn to garment-making, are subject to the free trade zone and inward processing regime. Recent updates of pertinent legislation have brought compliance with WTO provisions and imparted clarity to all economic agents as to the rules that apply to this crucial issue for this value chain’s competiveness. The regime grants, among other things, exemptions from income and municipal taxes. The exemption period is longer for activities outside the metropolitan area, in order to encourage regional development. Moreover, companies must meet certain conditions relating to amounts invested and number of permanent jobs.
El Salvador also has finance mechanisms for development including funding for the manufacturing sector and guarantees for production activities, namely in working capital, capital formation, innovation, technology development, environmental retrofit and certification. The Ministry of Economy operates a production development fund designed to provide non-reimbursable cofinancing to micro, small and medium-sized enterprises (MSMEs) for quality, productivity, cleaner production, innovation and technology, production chains and partnerships, market development and entrepreneurship. A number of the economic agents in the synthetic fibre-sports apparel value chain are companies that have already attained a certain scale of production, because of their specialization and application of the technology required for manufacturing the differentiated products in the value chain. Their links to international parent companies are also relevant in this regard. Such enterprises have access to financing from international banks and through their parent companies.
218 ECLAC
2. Innovation
Companies in El Salvador’s value chain compete on quality and, to a lesser extent, on price. The competitiveness of the value chain’s participants is linked not only to the permanent quest for operational efficiency, but also to constant product evolution. The latter is essential to maintain product differentiation, satisfy and anticipate constant and growing client demands, and sometimes create new needs.
Economic agents need conditions that allow them to continue working towards product innovation. Moreover, in the sports apparel manufacturing activities the development of products with new functional and physical features, including look and feel, could be crucial in that it might help El Salvador attract an activity that generates high value added and is at present the preserve of major international sports apparel brands. This could also lead to the creation of high value-added proprietary brands. Innovation efforts can provide access to new market niches where competitiveness does not depend so much on scale or cost. This is essential for El Salvador’s textile and apparel sectors.
Implementing a strategy for boosting product innovation efforts, under the innovation systems model, requires four components that are linked to each other and interact in the context of a particular institutional framework: business, government, academia and research centres and other institutions (Padilla Pérez, 2013).
In the case of El Salvador, companies that manufacture yarn or fabric follow heterogeneous strategies for new product development. There are companies that have defined, measurable goals for testing products with new features. Others seek to do so, albeit in a less structured manner. A number of them have benefited from investments in their parent companies targeting this kind of innovation. Apparel manufacturing companies engage in graphic design for apparel printing but tend to not handle the development of products with new functional features. Yarn and fabric manufacturers usually work closely with their suppliers and customers on creating new products. Fabric manufacturers also work directly with major international sports apparel brands in order to continue to develop products with the features that the apparel manufacturers need. Companies in these activities have not identified opportunities to work with their competitors in El Salvador —that is, companies operating in the same activities in the value chain— in order to develop products with added features.
The government can contribute to the promotion of science, technology and innovation, either by financing and coordinating relevant activities or by building institutions, laws and policies related to these matters (Padilla Pérez, 2013). Among the government measures already taken are the National Strategic Plan for Innovation, Science and Technology, intellectual

Strengthening value chains… 219
property protection laws and agencies and regional science, technology and innovation incentive programmes. There are also non-reimbursable cofinancing mechanisms, as well as guarantees for innovation-oriented investments. El Salvador also has a legal framework providing incentives for the private sector to participate in research activities, provided they are carried out in free trade zones (El Salvador, 2013).
Academia is working with businesses on education in areas relevant to the value chain activities. Trade associations in the sector, such as the Chamber of the Textile, Clothing and Free Zones of El Salvador (CAMTEX) promote the development of know-how, for which it also draws on specialized consultancies.
Measures have been taken (and should be stepped up) to align the efforts of businesses, government, academia and other institutions, thus strengthening the innovation systems model and promoing the development of new processes and products with potential for greater value added. Strategies to foster innovation are not sufficiently linked to training, metrology, laboratory testing, quality control and management and certification services. The organization of the synthetic fibre-sports apparel value chain according to a production cluster model with good, albeit heterogeneous, linkages between businesses and ongoing product development activities, is a good starting point for the coordination efforts that are necessary.
3. Education and training
Proper human resources preparedness is reflected in product quality because it makes for differentiated products that then gain acceptance in markets like the United States. And a quality labour force can lower the cost of inefficient operations.
In the yarn and apparel production activities (which are capital- and machinery-intensive), specialized personnel can account for more than 20% of the total number of workers. These employees should have higher or technical education in mechanics, chemistry, industrial engineering, electrical and other areas. In the garment-making activities (which is labour-intensive) this need is smaller. But bringing product graphic design and patternmaking into these activities in accordance with the specialization and differentiation described above, pushes the proportion of specialized personnel up to more than 10% of the total workforce. They should have higher or technical education in graphic arts, patternmaking or industrial engineering.
The supply of people with a higher education is regarded as sufficient to meet the value chain’s needs, but businesses agree that it is difficult to find workers with specialized non-post-secondary technical education. Owing to the distinctive characteristics of the chain, this is compounded by the difficulty of finding people with specific expertise in

220 ECLAC
this area, leading companies to make additional investments in employee training through continuing education, on-the-job training or training provided by the parent company.
As to the challenge that the shortage of workers with specialized non-post-secondary technical education poses for businesses, the Ministry of Education has developed the MEGATEC education model for phased technical and technological learning. Programme participants may choose to combine two levels of education in their studies: mid-level technical training (requiring part of the number of years of study) and complete higher education (up to the total number of years). The flexibility to obtain a recognized mid-level technical qualification, by completing part of the number of years of study, reflects a strategy to create jobs, increase productivity and improve social conditions. Implementation is coordinated with the private sector to ensure that the curriculum effectively leads to professional labour-market insertion. One of the educational establishments following this phased education model is the Specialized School of Engineering (ITCA-FEPADE), which provides training in facilities located close to those of companies in the synthetic fiber cluster and has successfully established links with some of them. MEGATEC has not overcome all of the difficulties that businesses face in hiring workers with specialized mid-level studies, but it should be assessed and strengthened with a view to expanding its reach.
The Chamber of the Textile, Clothing and Free Zones of El Salvador (CAMTEX) and the Salvadoran Training Institute (INSAFORP) offer training programmes in areas that are relevant for the value chain activities. The design of these programmes hinges not only on an up-front analysis of the needs and problems of the activities the training addresses, but also on the analysis of current trends in processes and potential areas for improvement in business competitiveness. CAMTEX participates in needs assessment, while INSAFORP develops programmes of study whose courses are taught by specialists from a number of institutions. Training programmes in dyeing, colourimetry and garment-making, including patternmaking, are already in the works. Training in business management, official procedures and formalities, production and maintenance techniques, quality, product development and water treatment, among others, is up and running.
Businesses have welcomed these training activities, confirming that they are a good fit with their operations and that there is a need to bolster employee training. Be that as it may, the synthetic fibre-sports apparel value chain has not made full use of INSAFORP services, perhaps because the time INSAFORP requires to assess needs and to develop programmes makes it more expeditious to send workers for training outside El Salvador. In addition, there are not enough education and training programmes to put all workers in a position to perform well in the value chain activities.

Strengthening value chains… 221
4. Energy
Yarn and fabric manufacturing is electrical energy-intensive while the sports apparel manufacturing subsector is less so. Nevertheless, because the activities in the value chain are so close together, the cost of electric power is a key factor for all the economic agents in the value chain. This calls for looking at costs and identifying ways to optimize them.
Energy consumption, mainly in the transformation of raw materials for manufacturing yarn, accounted for 60% of costs in 2012. The percentage is much lower in yarn texturing (about 11% of the total in 2012), in fabric manufacturing (approximately 14%) and in garment-making (12%) because their production processes are more labour-intensive and less machinery-intensive.
Electricity accounts for such a high portion of the cost structure of the synthetic fibre-sports apparel value chain not only because companies operate on a full-package model and invest heavily in automated processes, which require substantial equipment and machinery, but also because of the price of electricity in El Salvador. Industrial electricity tariffs increased between 2007 and 2012, from about 10 US cents per kWh to close to 20 US cents per kWh (see figure V.3) (ECLAC, 2010a, 2011a, 2012).
Figure V.3 El Salvador: industrial electricity tariffs, 2007-2012 ª
(US cents/kWh)
0
10
20
30
2007 2008 2009 2010 2011 2012
15 000 kWh, 41 kW 50 000 kWh, 137 kW 100 000 kWh, 274 kW930 000 kWh, 2500 kW1 488 000 kWh, 4000 kW
Source: Prepared by the authors, on the basis of Economic Commission for Latin America and the Caribbean (ECLAC), Centroamérica: estadísticas del subsector eléctrico, 2011 (LC/MEX/L.1088), Mexico City, ECLAC subregional headquarters in Mexico, December 2012; Centroamérica: estadísticas del subsector eléctrico, 2010 (LC/MEX/L.1039), Mexico City, ECLAC subregional headquarters in Mexico, October 2011; Centroamérica: Estadísticas del subsector eléctrico, 2009 (LC/MEX/L.976), Mexico City, ECLAC subregional headquarters in Mexico, November 2010.
ª Tariffs as of 30 June of each year.

222 ECLAC
The comparative analysis of industrial electricity tariffs in the countries of Central America does not indicate that El Salvador is in a clearly unfavourable position (see figure V.4). However, the rising price of electricity in recent years, and the fact that electricity costs make up a significant portion of the cost structure of companies in yarn and fabric manufacturing activities, highlight the importance of recognizing energy consumption as one of the key factors for competitiveness of manufacturing activities in general and of the synthetic fibre-sports apparel value chain in particular.
Figure V.4 Central America: industrial electricity tariffs as of 30 June 2012
(US cents/kWh)
Costa RicaEl Salvador
GuatemalaHonduras
NicaraguaPanama
0
10
20
30
15 000 kWh, 41 kW
50 000 kWh,137 kW
100 000 kWh,274 kW
930 000 kWh,2500 kW
1 488 000 kWh,4000 kW
Source: Prepared by the authors, on the basis of Economic Commission for Latin America and the Caribbean (ECLAC), Centroamérica: estadísticas del subsector eléctrico, 2011 (LC/MEX/L.1088), Mexico City, ECLAC subregional headquarters in Mexico, December 2012; Centroamérica: estadísticas del subsector eléctrico, 2010 (LC/MEX/L.1039), Mexico City, ECLAC subregional headquarters in Mexico, October 2011; Centroamérica: Estadísticas del subsector eléctrico, 2009 (LC/MEX/L.976), Mexico City, ECLAC Subregional Headquarters in Mexico, November 2010.
The General Superintendence of Electricity and Telecommunications (SIGET) reviews and approves tariffs on El Salvador’s regulated market. Among the factors considered in setting rates are energy production costs, the price at which generators sell energy, and regulated fees for transmission, transformation and distribution services. The largest portion of the cost structure is in generation, so expanding generation capacity would contribute significantly to reducing its cost. According to statistics from the National Energy Council (CNE), thermal generation accounted for 41% of the energy matrix in 2012, followed by hydropower with 31% and geothermal with 24%. This matrix is not diversified enough to reduce the risk of price volatility for any given source. Furthermore,

Strengthening value chains… 223
the sustainability of the system has not been enhanced by incorporating renewable sources such as solar energy, whose cost of generation has declined in recent years. A call for tenders to supply an additional 350 MW is therefore expected this year; bunker fuel may not be used to generate it. Because of the scale of operations and the sources it will use (natural gas and coal), the planned new plant will generate energy substantially more cheaply than the existing thermoelectric power plants. It is important to realize that three to four years can elapse between tender award and supplying energy.
Economic actors have not joined forces to make purchases on a larger scale, which in an unregulated free market could mean greater leverage for negotiating energy and power prices on the term and spot markets. Besides, there has been no investment in modernizing load-management systems, which would make it easier to assess combined demand and contract only the energy and power needed. As for access to a new supply of electricity, the major consumers of energy in El Salvador will, in the coming years, have access to the Regional Electricity Market (MER) through the Central American Electrical Interconnection System (SIEPAC).
The cost of distribution services can be substantial as well. In some cases, economic agents can opt for a direct connection to the high-voltage transmission network (115 kV) and bear the costs that this entails, namely those relating to substations and transformers. This alternative is more viable for large companies or medium-sized ones in close geographical proximity, such as those operating in industrial parks. In El Salvador, this option is less attractive because of the transmission network voltage (115 kV) and the lack of sub-transmission voltage levels to facilitate access.8
Opportunities are being wasted that could be seized if energy efficiency legislation were enacted. For this reason, the National Energy Council (CNE), with support from ECLAC, drafted an energy efficiency bill that is currently in the socialization and discussion stage. The bill could be submitted to the legislature in the coming months; enactment would make El Salvador the third Central American country to adopt such provisions.9 Among other points, the bill provides for energy consumption reduction targets, requires compliance by the public sector and identifies priority activities, including manufacturing. The legislation will promote the adoption of energy efficiency plans, whose objectives should include tracking consumption and setting mandatory reduction targets. According to the council’s Director of Energy Efficiency, investments designed to reduce consumption would be eligible for fiscal incentives. The council
8 69 kV in Guatemala and Nicaragua.9 Costa Rica enacted energy efficiency regulations in 1994; Panama did so in 2012.

224 ECLAC
is already promoting training in energy efficiency for businesses and consultants, who can become certified in order to support implementation of ISO 50001: 2011 on energy management systems, published by the International Organization for Standardization (ISO). José Simeón Cañas Central American University (UCA) launched a course in energy efficiency; the Salvadoran Association of Industrialists (ASI) provided training in industrial energy efficiency. The National Energy Council also encourages the adoption of measures for efficient energy use in the public sector and the incorporation of energy efficiency criteria in public procurement, which could have a multiplier effect.
Self-generation of electricity is an option that could be considered in the context of energy management by economic agents, although it is generally small in scale and, therefore, can often have a negative return on investment. According to information provided by the National Energy Council, there is already a legal framework for these options, and there are fiscal incentives for the purchase of equipment for self-generation using renewable sources.
5. Environmental sustainability
Assessment of the interactions between value chain components and the environment is crucial for designing strategies for managing them. In turn, managing these interactions enables economic agents to operate sustainably, not only for the environment but also in terms of competitive advantages. The environmental benefits from these strategies are clear, and there is growing awareness that competitiveness can be enhanced through better interaction with the environment because reduces vulnerability to the risks associated with resource availability and price and to the potential costs attributed to the environmental impact of economic activities. Improving environmental performance can also facilitate compliance with international standards and the provisions of some trade agreements. Furthermore, it can mitigate the risk of environmental emergencies that can also endanger workers and impact corporate reputation and brand image.
One of the methodologies used for evaluating the interaction between value chains activities and the environment is to assess their environmental aspects and impacts, in particular their level of significance. Implementing this methodology could lead to the conclusion that the synthetic fibre-sports apparel value chain has relatively well-identified and manageable environmental impacts (see diagram V.2). The fabric manufacturing activities can sometimes pose more substantial environmental issues while many yarn and garment manufacturing processes have impacts that can be adequately managed.

Strengthening value chains… 225
Diagram V.2 Environmental aspects of the synthetic fibre-sports
apparel value chain
Yarn manufacture
Fabric manufacture
Garment-making
Use
PET
Yarn
Fabric
Sports apparel
Solid waste (sports apparel)
Solid waste
Solid waste
Solid wasteEffluents
Effluents
Noise
NoiseEmissions
Energy
Energy
Energy
Water
Water
Chemicals
Chemicals
Source: Prepared by the authors.
Companies can handle waste management themselves or outsource it to specialized providers. The value chain is not taking advantage of the potential benefits of using specialized waste management, treatment and transport services despite the fact that they can be more cost-efficient (in terms of investments and operations) and more effective in controlling environmental impact.
Education and training in this sphere are vital complements to all of these environmental management measures. The Chamber of the Textile, Clothing and Free Zones of El Salvador has already organized some activities in this field, including action focused on micro, small- and medium-sized enterprises together with the Business Foundation for Social Action (FUNDEMAS). The Central American University has developed a programme for environmental management and industrial health and safety.
Owing to the recognized importance of environmental management and to corporate responsibility concerns, some clients and parent companies demand that businesses make an effort in this sphere. Many clients and parent companies are located outside El Salvador. In this regard, the value chain is not profiting from the benefits it could reap from certification of environmental management systems in accordance with international standards.
On the one hand, implementing a system that complies with international standards ensures adoption of robust environmental management measures. On the other hand, certification of a system pursuant to an international standard means recognition —also international— of a company’s environmental performance and may satisfy demanding clients

226 ECLAC
and parent companies. Without detracting from other similar instruments, worth mentioning are the ISO standards, particularly the ISO 14000 family (that addresses environmental management) and the Bluesign system. The latter focuses on the textile production and seeks to ensure compliance with applicable legal provisions, the use of resources in the most productive way possible and minimizing the use of hazardous inputs in order to protect health, occupational safety and the environment.
The legal framework necessary for implementing and certifying an environmental management system defines the applicable environmental requirements. In El Salvador, the Environment Act regulates environmental permits and land and water use plans and contains other environmental provisions (El Salvador, 1998). The Municipal Code includes provisions on the regulation and development of plans and programmes aimed at the preservation, restoration and rational use of natural resources (El Salvador, 1986).
Along with recognizing environmental protection incentives under this legal framework, some economic agents believe that the lead time for environmental permits impacts their operations. These processes tend to take at least a month, especially when expanding a facility is involved. Companies that, because of the nature of their operations, decide to invest in water treatment plants and need environmental impact studies face an even more demanding process. Companies may also need permits for importing chemicals. In these cases, processing may take from one day to a day and a half, depending on the time of day the invoice is submitted for an import visa.
6. Distribution
Most products in the synthetic fibre-sports apparel value chain are for export. Any discussion of the distribution process should therefore include the road transport services that collect products at the facilities of the companies in the value chain, as well as international transport services for shipping them on to their final destination.
Road transport is important not only as a part of the distribution process but also because it creates opportunities for small and medium-sized enterprises to provide support services. Interviewees reported that the efficiency and pricing of these services are acceptable and that the road infrastructure is adequate, making it easier to meet merchandise transport deadlines. Nevertheless, they noted that boosting competition between carriers and lowering the cost of insurance (which reflects security hazards) could drive down the price of these services.
While recognizing the relevance of supply chain security, interviewees indicated that the top priorities for international transport have to do with customs formalities (with a particular focus on addressing efficiency and consistency issues) and border crossings.

Strengthening value chains… 227
Some of the main concerns raised as to efficiency involve lead times, red tape and processing capacity, the latter being limited by the resources available to the Directorate General of Customs (part of the Ministry of Finance). Companies in the value chain have proposed the creation of a separate customs service for the textile and apparel sectors similar to the one in the Dominican Republic, with enhanced capacity allowing for more efficient procedures. As for lead times, customs formalities took an average of two and a half hours to three hours in 2012.10 This was identified as an important factor because it limits the ability to take advantage of business opportunities that require responsive distribution channels. As for the red tape, some of the issues mentioned were the physical inspections required, including sample checking and the destruction of defective products. Samples, because of their very nature, need to be delivered quickly. Still, interviewees mentioned cases where samples sent by overnight courier took more than 15 days to reach their destination because of demands from customs authorities.
Consistent formalities are another concern.11 To address these concerns, the Directorate General of Customs has published a standard operating procedures manual. Its objectives are avoiding discretionality, unifying customs criteria and procedures and enhancing credibility and transparency by disseminating information on the requisite formalities and documents. Some economic agents indicated that it would be useful to clarify certain provisions of the manual.
Most Salvadoran products exported to the United States follow the Atlantic route, leaving from the Puerto Cortés seaport in Honduras or Santo Tomás de Castilla in Guatemala. Border crossings are therefore crucial for commercializing the value chain’s products.12
Steps are being taken to automate and harmonize customs and border crossings formalities, in order to facilitate trade and competitiveness. Among them are the one-stop shop for foreign trade operated by the Central Reserve Bank’s import-export processing centre (CIEX), the potential creation of authorized economic operators13 and provisions
10 Some people interviewed mentioned that requests for customs services overtime need to be submitted one day in advance, which is costly. In addition, owing to the nature of the process, it is impossible to predict when overtime will be needed.
11 A number of interviewees said they were not familiar with customs procedures and had therefore requested checklists to follow. Nevertheless, the checklists received do not include all mandatory requirements, and the information required can vary from one customs station to another.
12 There is also a Pacific departure route. The comments related to border crossings also apply to imports of raw materials.
13 According to the SAFE Framework of Standards of the World Customs Organization (WCO), an authorized economic operator is a party involved in the international movement of goods, in whatever function, who complies with WCO or equivalent supply chain security standards (WCO, 2007).

228 ECLAC
concerning international transit of goods. While automation and harmonization enhance consistency and create the conditions necessary to improve efficiency, there has not been sufficient follow-up of some of these initiatives, especially the one concerning authorized economic operators.
The level of automation that could be achieved by implementing such measures is limited by processes such as physical inspection of export products and samples, as well as the destruction of products. However, such constraints should not be seen as reasons for not progressing in implementation of the measures. The potential benefits are considerable, and even physical inspections could be more efficient thanks to trade facilitation measures concerning ex ante and ex post inspection and institutional coordination.
7. Commercialization
The synthetic fibre-sports apparel value chain is very much external-market oriented. Eighty per cent of the yarn and fabrics it manufactures are for export, mainly to Central America. The garment industry is even more export-oriented: some 95% of its output goes to external markets, primarily the United States. Exports of products from all of the value chain’s activities increased between 2005 and 2012. The downswing during the international crisis impacted garment exports above all, since their main destination market is the United States, where consumption saw a sharp contraction. The impact was smaller in the case of yarn and fabric exports, which tend to target the Central American market (see figure V.5).
Figure V.5 El Salvador: yarn, fabric and garment exports, 2005-2012 a
(Thousands of dollars)
0
40 000
80 000
120 000
160 000
2005 2006 2007 2008 2009 2010 2011 2012
Yarn Fabric Garments
Source: Prepared by the authors, on the basis of information from the Ministry of Economy of El Salvador.a Garment exports refer to the lines used by companies that export sports apparel made with artificial or
synthetic fibres.

Strengthening value chains… 229
The jump in the value of synthetic-fibre sports apparel exports to the United States, in an environment dominated by competitors in Asia, enabled El Salvador to maintain a market share of 1.7% to 2.3% during 2005-2012 (see table V.2). The high point was in 2012, when El Salvador accounted for 2.3% of the exports of these products to the United States, making it the 11th largest supplier to the latter. That same year, China, Indonesia and Viet Nam (the three countries with the largest share) accounted for more than half of synthetic-fibre sports apparel exports to the United States.
Table V.2 United States: domestic market share of the main exporters
of synthetic-fibre sports apparel, 2005-2012 a b
(Percentages)
2005 2006 2007 2008 2009 2010 2011 2012Bangladesh 4.1 4.4 3.9 4.2 4.1 4.1 4.2 3.6Cambodia 1.6 2.9 3.3 3.1 2.7 2.8 3.6 3.6China 16.0 18.3 23.7 24.8 27.8 29.8 29.3 29.2El Salvador 1.7 1.8 1.7 1.8 2.0 1.9 1.7 2.3Guatemala 2.6 2.4 2.2 2.5 2.2 2.6 2.7 2.6Honduras 4.1 3.7 4.3 4.6 4.7 4.6 4.0 4.3India 3.4 2.5 1.9 1.7 1.8 1.9 2.7 3.0Indonesia 9.6 10.6 10.6 10.9 10.6 10.4 9.9 9.6Jordan 2.2 3.3 3.0 2.9 3.1 3.0 3.5 3.7Mexico 14.5 12.1 10.5 8.9 8.2 7.6 6.6 5.7Thailand 2.5 3.1 3.3 3.3 3.1 2.7 2.3 2.3Viet Nam 4.3 4.8 6.9 9.6 10.6 11.5 11.7 13.1
Source: Prepared by the authors, on the basis of data from the United States International Trade Commission.
a Garment exports refer to the lines used by companies that export sports apparel made with artificial or synthetic fibres.
b Includes the 12 countries with the highest share in 2012.
Accordingly, although the trend for these foreign trade figures has been positive, exports to the United States are threatened by the potential expansion of the Trans-Pacific Partnership14, which would allow duty-free trade between Australia, Brunei Darussalam, Canada, Chile, the United States, Malaysia, Mexico, New Zealand, Peru, Singapore and Viet Nam. The agreement includes textiles and apparel. In addition, member countries are negotiating related issues, such as customs cooperation and rules of origin. Expanding the agreement to the United States and countries that compete directly with El Salvador in garment exports, including Malaysia and Viet Nam, could eat away some of the advantages under the Dominican Republic
14 The 2005 Trans-Pacific Partnership was signed by Brunei Darussalam, Chile, New Zealand and Singapore.

230 ECLAC
—Central America— United States Free Trade Agreement (DR-CAFTA). Viet Nam has strengthened its industry and become more competitive, so that even with its products subject to high tariffs (approximately 32%) for entering the United States market, it still competes on price with Salvadoran products. Furthermore, expansion of the Trans-Pacific Partnership would lead to new investments in the textile industry in competing countries and in boosting their production capacity.
Another factor that could affect Salvadoran exports is movements of the real exchange rate; its currency is appreciating against the United States dollar. This would keep El Salvador from taking advantage of the opportunities offered by appreciation of the Chinese yuan against the United States dollar, which could indeed benefit Central American countries that export to the United States.
Salvadoran exports are not well diversified by destination. This holds a potential risk in that the garment-making sector, which is highly dependent on the United States market, can be affected by drops in consumption in the latter, as happened during the international crisis. The same can happen with yarn and fabric exports, which are concentrated in the other countries of Central America (see table V.3).
Table V.3 El Salvador: yarn, fabric and garment exports, by destination country, 2012 a
(Percentages)
Yarn Fabric Sports apparelCosta Rica 8.5 13.0 0.6Guatemala 44.0 19.8 0.1Honduras 25.2 34.1 1.3Mexico 5.4 9.2 0.0Nicaragua 3.0 9.5 0.1United States 9.0 8.4 94.9Others 5.0 6.0 3.1
Source: Prepared by the authors, on the basis of information from the Ministry of Economy of El Salvador.a Garment exports refer to the lines used by companies that export sports apparel made with artificial or
synthetic fibres.
Export diversification by destination country has many advantages but it is challenging to achieve. Geographical proximity means that the current destinations are natural markets and, in addition, some participants in the value chain feel that there is not enough demand in other Latin American countries. Moreover, exporting to other markets entails higher costs. This is compounded by the fact that a number of companies in the synthetic fibre-sports apparel value chain are part of multinational groups that assign their subsidiaries certain products and

Strengthening value chains… 231
markets. This is keeping companies in El Salvador from diversifying their exports by destination.
Participants in the value chain are making an active effort to expand their markets and retain existing clients. They therefore see no need to seek much support from the public services that promote exports, in particular the Export and Investment Promotion Agency of El Salvador (PROESA). Beyond ongoing efforts (including market intelligence studies and participation in trade fairs), there has been no in-depth exploration of the possibility of creating a country brand for El Salvador’s textile and apparel products that could serve as an umbrella for products made by the synthetic fibre-sports apparel value chain.
The connections between recognition of the quality of products and processes in the value chain and their exports have not been promoted either, beyond commercialization and country branding. This adds to the limited use of mechanisms for promoting and recognizing quality and excellence through implementation of requirement systems based on international standards and their certification. In fact, on the one hand, implementing measures in accordance with international standards would make the economic agents more efficient. On the other hand, certification of implementation would facilitate international recognition of compliance with standards issued by ISO and ASTM International (formerly known as the American Society for Testing and Materials) (SMEDA, undated) or by counterparts in the textile and garment-making sectors, whether clients or parent companies. Some companies holding international trademarks even certify employees of supplier companies so that they are qualified to rate their products and ensure compliance with client quality requirements.
Compliance with standards-based requirements (which usually spreads across a value chain through mechanisms of competition between agents in the same activity and of involvement of vendors in implementing the measures needed) is particularly important when most of the products are for export, as is the case in the synthetic fibre-sports apparel value chain.
Much of the effort to achieve product quality recognition depends on the availability of accredited metrology and laboratory services. Some participants of El Salvador’s textile and garment production chains have their own process quality control labs, but beyond independence issues, they do not have the accreditations needed to certify textile products. As a result, some companies usually turn to the textile laboratory in Guatemala, since it is the closest that is appropriately accredited and is recognized by the major international brands. Other companies use the accredited textile laboratories in their parent companies. In El Salvador, there are no accredited textile laboratories with the equipment, technology
232 ECLAC
and expertise needed to do this work in a timely fashion at an acceptable cost. This forces companies to send their products to other countries.
Constraints posed by the need for quality and excellence recognition are also a barrier for small and medium-sized enterprises seeking to enter textile and garment-making value chains. This is particularly true with the synthetic fibre-sports apparel one because of the additional requirements arising from specialization, including the requirement that the main garment-making companies have suppliers approved by the major international brands.
8. Governance and networks
Because this is a buyer-driven chain, the major international brands select their suppliers in accordance with a set of criteria, including price, quality and delivery times. For differentiated products, such as high-performance sports apparel, quality is more important than for other garments. In El Salvador, there have been instances where garment-makers have proposed designs and materials to their clients, others where fabric manufacturers have proposed products to garment-makers and others where yarn manufacturers have cooperated on development of a given product with fabric manufacturers. These vertical relationships between clients and suppliers, as well as geographical proximity among many of the Salvadoran companies in the value chain, marks El Salvador’s synthetic fibre cluster.
Deepening these connections brings obvious trade advantages and enhances efficiency by minimizing transaction costs. Having businesses with solid production and technological capacities across all of the value chain’s major production activities enables them to turn out products using inputs from the same cluster, resulting in lower costs. It also lowers indirect transaction costs, thanks to the exchange of expertise and information among participants from the different activities.
An increase in the number of providers, by increasing supply along with the potential impact of competition, would help to enhance cost- and time-effectiveness across the value chain’s production cycle and thus boost export competitiveness. With more suppliers it would be possible to better meet demand and to make production more flexible. These factors are also taken into account by major international sports apparel brands when deciding where to place orders for garments each season. This value chain densification requires companies that provide reliable, high-quality services that can compete with existing suppliers, a number of which are outside El Salvador.
The search for investment in the value chain is loosely structured. And the ability to attract new investments and build on existing ones depends on how effectively the constraints affecting the value chain (including the cost of electricity) identified in this chapter are addressed.

Strengthening value chains… 233
An integrated response resulting from a closer relationship between economic agents in the cluster tends to be more effective for addressing the constraints identified by the diagnostic study. Such a response can play a catalytic role in product development efforts, structured innovation and in the exchange of best quality and excellence practices. It can also ramp up the scale of operations, thereby helping to increase the supply of specific education and training, including specialized non-post-secondary technical education, to respond to the needs of the value chain. It can also make coordinated power purchasing possible, which in some cases would significantly reduce the cost of operations.
Outside the networks of the cluster where companies operate, a number of economic agents have links with their parent companies and, in some cases, close relationships with major clients in other countries. These connections can favour not only companies but the whole value chain as well, in the dissemination of information and in training and expanding the culture of quality and excellence.
In addition to participating in network activities, trade associations that support the value chain and some of the country’s public services could act as facilitators. The synthetic fibre-sports apparel value chain is not taking full advantage of the potential contribution of some public services and trade associations to strengthening their business networks.
9. Incorporation of SMEs
Measures aimed at cluster densification could create opportunities for SMEs to enter the value chain production activities and to provide support or knowledge-intensive services that are not subject to capital or scale requirements and promote the development of differentiated products.
There could also be opportunities for small and medium-sized garment manufacturers that are not yet part of the synthetic-fibre supply chain to use this cluster as a good starting point for making other types of garments. Manufacturing sophisticated products such as sports apparel might not be a good fit for many SMEs, but they could produce other articles using synthetic fibres. This would be a first step in their efforts to increase the value added of their output. The existence of many micro and small garment-making enterprises in the vicinity of companies in the synthetic fibre cluster could facilitate these new linkages.
These efforts require a comprehensive development strategy for suppliers and SMEs, which would help reduce the structural heterogeneity of the economy, strengthen the value chain and create jobs.

234 ECLAC
10. Summary of constraints and opportunities
The maturity of the value chain (enriched by experience with exports and access to knowledge, capital and technology through the parent companies) implies that the micro level problems that might limit competitiveness were already resolved. Summarized below are the areas with constraints and opportunities identified by a comprehensive analysis that took into account both those affecting each activity in the value chain as well as the value chain as a whole and that are therefore systemic (see diagram V.3). These constraints and opportunities, identified by the diagnostic study, have been grouped according to their nature.
Diagram V.3 El Salvador: constraints and opportunities in the synthetic
fibre-sports apparel value chain
Yarn manufacturing:• Education and training• Distribution
• Energy
•• Distribution
• Energy
Garment manufacturing:• Innovation•• Distribution• Environmental
sustainability • Environmental sustainability
• Environmental sustainability
Commercialization
Systemic factors• Networks• Incorporation of SMEs
Fabric manufacturing:
Education and training Education and training
Source: Prepared by the authors.
All factors related to value chain networks, linkages and governance, as well as the incorporation of SMEs, should be regarded as systemic opportunities. That is why diagram V.3 groups them in a category apart from the major activity groups. The rest are classed according to the spheres in which they were identified. Those related to energy are tied to the yarn- and fabric-manufacturing activities; those related to innovation are included in the garment-making activities despite their cross-cutting nature. Constraints having to do with the environment, education, training and distribution are found in all three main production activity groups of the synthetic fibre-sports apparel value chain. Constraints relating to market access are grouped in the commercialization category.
In view of the constraints and opportunities identified, proposed below is a set of production development strategies and policies aimed at strengthening the synthetic fibre-sports apparel value chain, enhancing

Strengthening value chains… 235
the value added of its products, facilitating access to customers and markets, capitalizing on production cluster potential and furthering the incorporation of SMEs.
Implementing these strategies requires coordination of public and private institutions based on joint recognition of constraints and adoption of agreements emerging from dialogue among all parties involved.
C. Strategies
This part of the chapter sets out proposals for programmes and strategies to address constraints and opportunities identified in the diagnostic study. These were validated in a national dialogue roundtable involving public sector institutions, trade associations and enterprises in the synthetic fibre-sports apparel value chain. The proposals are based primarily on an analysis of best practices seeking to make the research process more efficient by drawing on success stories and looking at the mechanisms and context that made them possible. The end goal is to systematize relevant lessons learned in order to define intervention proposals. ECLAC expertise and the information provided by public and private actors also inform proposals for strengthening the synthetic fibre-sports apparel value chain.
For each set of constraints and opportunities there is a proposed intervention programme, subdivided into one or more strategies that are in turn broken down into several lines of action. This structure is intended to facilitate proposal implementation; separating them into lines of action would make it easier to implement the option. For subsequent phases of intervention in the value chain, public and private actors should define the institutional and operational factors needed for implementation or adaptation.
As noted in chapter II hereof, the methodology chosen for strengthening value chains allows for an analysis of micro-level constraints and the design of specific, targeted strategies for increasing product value added. A detailed list of strategies and lines of action is thus laid out below, demonstrating the usefulness of the methodology for implementing industrial policies. Each of the following sections focuses on one of the programmes proposed, grouped according to areas where constraints and opportunities were identified.
1. Innovation
The purpose of the first intervention programme proposed is to foster greater value added for synthetic fibre-sports apparel value chain products as well as new product development. This programme consists of four strategies based on the principles of the innovation system model and its four components: (i) creating a centre for textile and garment innovation

236 ECLAC
and technological development; (ii) strengthening the links between economic agents and between them and trade associations; (iii) scaling up support from public institutions; and (iv) strengthening relations between business and academia.
Heterogeneous product development activities at the company level, as well as linkages based on the production cluster encompassing enterprises in the main production activities of the value chain, are a good starting point for implementing the innovation and product development proposals.
Strategy 1: Innovation and technological development centre for the textile and garment sectors
Objective: Create an innovation and technological development centre for the textile and garment sectors.
Lines of action:
• Define the governance and funding model for the centre based on dialogue between the government and the private sector.
• Define the centre’s activities and services, which could include research relevant to the textile and garment sectors both on their own initiative or in response to specific requests; promote technology and technology companies that support these sectors; and new product design and development.
• Include the following as part of the centre’s main functions:
– Gather market information on an ongoing basis to ensure harmonization of the centre’s activities and services with the strengthening of the value chain and the textile and garment sectors.
– Promote linkages with research centre networks with a view to boosting the exchange of information, know-how and processes.
– Promote the establishment of links with academia, including internships and academic research to explore issues that are relevant for the textile and garment sectors.
– Coordinate actions with an accredited laboratory with the metrological capacity for tests that are relevant for textiles and garments.
– Participate in the development of technical standards for the textile and garment sectors.
• Establish a plan for achieving the centre’s goals, which could be on a phased basis.

Strengthening value chains… 237
Strategy 2: Economic agents and trade associations
Objective: Strengthen the links between economic agents in the value chain in order to boost innovativeness.
Lines of action:
• Identify opportunities for strengthening horizontal linkages in the value chain, that is, between companies in the same activity, for them to cooperate on innovation and product development.
• Follow up and deepen vertical linkages in the value chain, that is, between suppliers and customers across activities, for them to cooperate on innovation and product development.
• Promote cooperation between companies and specific studies of the advantages that this entails, not only in terms of innovation but also in terms of education and the efficient sourcing of electricity, among other things.
• Enhance the role of the trade associations as promoters and catalysts of cooperation between enterprises.
Strategy 3: Public institutions
Objective: Strengthen support from public institutions charged with encouraging innovation.
Lines of action:
• Enhance the design, establishment and promotion of the institutions necessary to strengthen linkages among government, businesses in the value chain, trade associations and academia.
• Develop a strategic innovation plan for the textile and garment sectors.
• Follow up and strengthen laws and policies that support innovation, including the National Strategic Plan for Innovation, Science and Technology.
• Strengthen a system of science, technology and innovation indicators focused on the textile and garment sectors.
• Increase public spending on science, technology and innovation, including incentives for innovation in the textile and garment sectors.

238 ECLAC
Strategy 4: Business and academia
Objective: Tighten links between business and academia.
Lines of action:
• Reach public-private sector agreements for funding research and professional training in areas of priority for the value chain.
• Make research on technological and product development a priority.
• Create mechanisms for evaluating research and professional training initiatives.
• Complement innovation strategies with training, metrology, quality control and management and certification services.
2. Education and training
The second intervention programme is geared towards training more people to work as non-post-secondary level technical specialists in value chain activities. The programme is based on a strategy to boost the supply of education and training consistent with this objective.
Strategy 1: Education and training of non-post-secondary level technical specialists
Objective: Boost the supply of education and training for non-post-secondary level technical specialists.
Lines of action:
• Continue and expand the Education Model for Phased Technical and Technological Learning (MEGATEC), so that it provides more career tracks that are relevant to the value chain.
• Expand the links between the Salvadoran Training Institute (INSAFORP) and trade associations, to better leverage their capacity to develop courses and training tailored to the needs of the value chain.
• Promote private initiatives for developing training programmes.
• Develop training results indicators with a view to measuring impact on business productivity.
• Increase public support for the promotion of private initiative (certification of training enterprises and incentives for training).

Strengthening value chains… 239
3. Energy
The objective of the third intervention programme is to cut the cost of electricity used in the value chain activities, through public policies and business initiatives. Some of the proposed strategies seek to reduce generation and distribution costs as well as global market costs. A strategy for enhancing energy efficiency is also proposed; it could reduce business spending on electricity by changing consumption patterns.
As for generation, the proposed diversification of the energy matrix would fall to the public sector. The economic agents would develop self-generation systems. Establishing direct connections to the transmission network would seek to reduce distribution costs while the coordinated power purchasing would help cut global market costs.
Strategy 1: Energy matrix
Objective: Diversify the energy matrix.
Lines of action:
• Move forward with tenders for natural gas- or coal-fired power generation instead of bunker fuel, with a view to producing energy that is cheaper than at present (thermal power), reduce the risk of price volatility for any particular source and contribute to system sustainability.
• Assess the potential for solar power generation, bearing in mind that its cost has come down in recent years.
Strategy 2: Coordinated power procurement
Objective: Coordinated power procurement.
Lines of action:
• Organize power procurement through electricity traders. In an unregulated free market, larger-scale purchases can enhance leverage for negotiating the price of energy and power on the term and spot markets.
• Invest in upgrading load management systems, which would enable the electricity traders to contract only the energy and power necessary, possibly less than the sum of the powers that each company would have to contract individually.
Strategy 3: Direct connections to the transmission network
Objective: Establish direct connections to the transmission network.

240 ECLAC
Lines of action:
• Analyse the applicable legal framework; weigh the feasibility for businesses in geographical proximity to connect directly to the transmission network.
• Evaluate the possibility of service sharing in industrial parks.
Strategy 4: Self-generation
Objective: Promote self-generation.
Lines of action:
• Analyse the viability of shared self-generation by companies in geographical proximity.
• Examine the potential for companies to harness solar power, now that the investment recovery time frame has grown shorter.
• Evaluate the possibility of service sharing in industrial parks.
Strategy 5: Foster energy efficiency
Objective: Develop activities to promote energy efficiency.
Lines of action:
• Expedite the enactment and implementation of energy efficiency legislation. The National Energy Council of El Salvador drafted a bill with assistance from ECLAC; it is in the socialization and discussion stage.
• Promote energy efficiency plans with fiscal incentives for investments that lower consumption.
• Continue energy efficiency education and training and expand coverage.
• Monitor the impact of energy efficiency measures with appropriate indicators.
4. Environmental sustainability
The purpose of the fourth programme is to enhance business competitiveness by reducing the environmental impact of their activities. To this end, four strategies are proposed: (i) use materials of recycled PET; (ii) implement environmental management measures in general; (iii) put in place waste management measures in particular; and (iv) certify environmental management systems by international standards.

Strengthening value chains… 241
Strategy 1: Use materials of recycled PET
Objective: Promote the use of materials of recycled PET in yarn manufacturing processes.
Lines of action:
• Have government agencies concerned with environmental matters examine the feasibility of creating a national recycled material management system. This system could be funded by importers and packagers to ensure the proper collection and destination of recyclable material, including use by yarn manufacturers.
• Continue and expand education and training programmes on subjects related to the environment, particularly recycling.
Strategy 2: Environmental management
Objective: Take measures geared towards environmental management.
Lines of action:
• Continue and deepen the analysis of the environmental aspects and impacts of the activities of economic agents in the value chain. Among the factors to consider are consumption of raw materials, emissions, noise, waste and effluents.
• Strengthen coordination among public institutions responsible for defining and implementing environmental policies and production development, through targeted dialogues, to continue granting and even expand incentives for environmental management activities.
• Continue and expand education and training on subjects related to the environment, focusing on the potential for reducing costs and risks.
Strategy 3: Environmental certification
Objectives: Obtain certification of environmental management systems in accordance with international standards.
Lines of action:
• Enhance coordination of government agencies responsible for defining and implementing environmental and production development policies, through targeted dialogues, to continue granting and even expand incentives for certification of environmental management systems.
• Continue and expand education and training on subjects related to the environment, especially the requirements of legislation and standards and how they can be implemented.

242 ECLAC
• Promote competition and lower prices for consultancy services specialized in supporting the implementation and certification of environmental management systems.
Strategy 4: Waste management
Objective: Develop waste management activities.
Lines of action:
• Take inventories to identify the best management options, in terms of the environment and in terms of cost.
• Assess the potential for developing waste markets. For example, remnants from garment-making can be used as mattress filler.
• Procure specialized waste management, treatment and transport services, which may be more efficient environmentally and in terms of investment and operating costs, as well as in obtaining permits.
• Strengthen coordination among public institutions responsible for designing and implementing environmental and production development policies, in order to establish the relevant legal framework and encourage the investments that the waste management activities require.
• Assess the potential for promoting service sharing in industrial parks.
5. Distribution
The objective of the fifth programme is to facilitate exports by means of strategies targeting transport and customs formalities. It proposes a strategy for logistics chain security geared towards making transport processes more efficient, monitoring implementation of regulations concerning the international transit of goods and establishing authorized economic operators.
In relation to logistics chain security, ECLAC has stressed the importance of designing comprehensive policies based on criteria of national security, logistics and trade facilitation. It is important to promote the establishment of an effective public-private partnership to ensure efficient and timely logistics chain risk management at the lowest possible cost (ECLAC, 2011b).
Successful implementation of these strategies also depends on expanding support and enhancing institutional coordination at the national, subregional and international level. In El Salvador, the private sector is participating in discussions on the potential for contributing to achievement of these aims through the Intra-Association Commission for

Strengthening value chains… 243
Trade Facilitation, to which the Salvadoran Association of Industrialists and the Chamber of the Textile, Clothing and Free Zones of El Salvador belong.
Strategy 1: Logistics chain security
Objective: Adopt logistics chain security initiatives.
Lines of action:
• Promote coordination between public and private institutions to disseminate information and raise awareness of risks and the potential for minimizing them.
• Promote coordination between national organizations at the regional level; this is of paramount importance given the characteristics of road transport in Central America.
• Determine and classify risks in order to identify priorities for intervention.
• Invest in technology to track transport flows and in infrastructure projects (including secure parking areas) in order to minimize risks.
• Apply security criteria in recruiting and training workers at companies in the logistics chain.
• Assess the feasibility of establishing insurance that provides regional coverage, in order to eliminate cost overlap.
Strategy 2: International transit of goods
Objective: Monitor and improve the international transit of goods.
Lines of action:
• Follow up on and expand implementation of procedures to facilitate the international transit of goods.
• Analyse the possibility of restructuring the electronic processing system for data on international transit of goods, with a view to allowing updates after initial shipment, avoiding delays and reducing errors in subsequent manual updates. Examine the potential for more flexible handling of consolidated and non-consolidated shipments.
• Invest in infrastructure, including to improve the distance between parking areas, customs and border crossing points, provided that this facilitates and expedites formalities.
• Step up support and institutional coordination at the national, subregional and international levels in order to facilitate the international transit of goods.

244 ECLAC
Strategy 3: Authorized economic operators
Objective: Move ahead on establishing authorized economic operators.
Lines of action:
• Promote public-private institutional coordination at the national, subregional and international levels through targeted dialogue with a view to the efficient implementation of necessary processes.
• Improve the risk management technology systems used at customs, in order to identify means of transport used by authorized economic operators.
• Urge companies to make the investments they need to comply with the eligibility requirements for authorized economic operators.
• Follow up and expand information and training on the process for establishing authorized economic operators.
6. Commercialization
The sixth programme includes strategies for broadening access to existing markets and enabling entry into new ones. The strategies are aimed at diversifying exports by destination, stepping up export promotion activities, developing a country brand, implementing and certifying compliance with international standards and developing accredited capacity for laboratory testing of textiles and garments.
Strategy 1: Export destinations
Objective: Diversify export destinations.
Lines of action:
• Urge enterprises to gauge the potential for boosting horizontal diversification, since new product development can facilitate access to new external markets.
• Encourage enterprises to examine options for capitalizing on the opportunities arising from vertical diversification because increasing product portfolio value can facilitate access to new external markets.
• Boost diversification by destination market through implementation of innovation strategies, quality improvement, export promotion and, in general, public policies for industrial and trade facilitation.

Strengthening value chains… 245
Strategy 2: Export promotion
Objective: Step up export promotion activities.
Lines of action:
• Continue and expand trade policy and trade negotiations.
• Analyse destination market segmentation, taking into account, among other factors, that market preferences in Europe might not be the same as in the United States.
• Develop effective marketing techniques based on innovation and promoting quality.
• Follow up on and expand participation in sectoral fairs.
• Promote business missions for attracting investment and promoting trade (which ideally could contribute to market diversification), with the participation of entrepreneurs, experts and government officials. These missions should seek contact with different types of actors, such as trademark holders, wholesalers and retailers.
• Take better advantage of public services for attracting investment and promoting exports, in particular those of the Export and Investment Promotion Agency of El Salvador, including market intelligence techniques, networking, obtaining support for participation in trade fairs and missions and conducting market surveys.
Strategy 3: Country brand
Objective: Develop a country brand.
Lines of action:
• Focus on the trade objectives of the strategy, building on synergies with the other objectives such as the promotion of tourism and sport.
• Adopt clear rules on use of the country brand by economic agents for commercial purposes.
• Develop national and international communication with components of the country brand, such as images and slogans, associated with the value chain’s products, advertising and packaging.
• Include trade associations and companies in these activities, to create a close and effective link between country brand and the trade objectives of the value chain.
246 ECLAC
Strategy 4: International standards
Objective: Implement and certify compliance with international standards.
Lines of action:
• Follow up on and expand relevant government incentives.
• Follow up on and expand education and training on the requirements of international standards and on how to comply with them.
• Promote competition and lower prices for consultancy services specializing in support in this area.
• Promote mechanisms for encouraging implementation and certification of systems based on international standards, such as promotion of competition among actors in the same activity and including suppliers in compliance with requirements.
Strategy 5: Metrology
Objective: Develop accredited capacity in metrology.
Lines of action:
• Conduct market and feasibility studies to assess the relevance of setting up an accredited textile laboratory in El Salvador, with the equipment, technology and expertise for providing metrology services faster and at a lower cost than at present.
• Link the textile laboratory with networks of laboratories in order to facilitate the exchange of experience, information and know-how.
• Link the laboratory to a technology centre with synergies in promoting and exchanging information and know-how.
7. Networks
The objective of the programme is to improve the value chain’s performance through new and improved linkages between its participants. To this end, two strategies are proposed: (i) densifying the synthetic fiber-sports apparel value chain; and (ii) strengthening relationships and linkages between its economic agents.

Strengthening value chains… 247
Strategy 1: Chain densification
Objective: Densify the chain.
Lines of action:
• Follow up on and expand government efforts to attract investment, particularly those targeting suppliers, in order to save costs on importing inputs for production, among others. This requires addressing the constraints identified in the ECLAC diagnostic study.
• Encourage missions for attracting investment, with the participation of entrepreneurs, experts and government officials. Take better advantage of public services for attracting investment and promoting exports, in particular those of PROESA.
• Design public policies including legal measures and incentives that facilitate the development of local suppliers with privileged access to clients in the value chain.
Strategy 2: Governance
Objective: Improve governance of the economic agents in the value chain.
Lines of action:
• Identify opportunities for strengthening horizontal linkages in the value chain, that is, those between companies in the same activity group.
• Follow up on and deepen existing vertical linkages in the value chain, that is, those between suppliers and customers.
• Conduct specific analyses of the potential benefits of cooperation between enterprises (lower transaction costs, better product development, structured innovation, exchange of quality management practices, expansion of the supply of education and training services, coordinated power procurement and others).
• Enhance the role of trade associations as promoters and catalysts of cooperation between enterprises.
8. Incorporation of SMEs
The eighth programme aims to strengthen the synthetic fibre-sports apparel value chain by incorporating SMEs. The strategy proposed to this end includes the activities listed below and identifies options for including these companies in the value chain.

248 ECLAC
This programme is closely linked with the previous one, because SMEs can contribute to the value chain densification, including by providing support services.
Strategy 1: Incorporation of SMEs
Objective: Promote the incorporation of SMEs in the value chain.
Lines of action:
• Develop a country brand to facilitate participation of SMEs in garment manufacturing.
• Expand opportunities for insertion of SMEs in support and supply services for the value chain, including road transport services.
• Assess opportunities for participation of SMEs in the provision of specific or knowledge-intensive services that are not constrained by capital or scale requirements and that enhance the capacity to develop differentiated products.
• Assess opportunities for some SMEs to use the cluster as a starting point for manufacturing synthetic fibre garments that are less sophisticated than sports apparel but represent a first step in increasing the value added of their products.
9. Interventions
In interventions aimed at implementing these strategies, among the factors to bear in mind are, at least, the resources required, the potential contribution to strengthening the value chain and the lead times required for implementing programmes and their components. In the case of programmes to foster innovation and market access, it is necessary to factor in their substantial potential contribution to strengthening the value chain, long lead times and considerable resources required for implementation. The specialized technical education and training programme may have less of a cross-cutting impact on strengthening the value chain although implementing it can be faster and require fewer resources than others.
Identification of these factors should be based on specific subsequent analyses. Diagram V.4 illustrates a mechanism for determining priorities in implementing the strategies on the basis of cost, time frames and relative impact. This tool is designed to facilitate decision-making in accordance with the existing political will and the financial resources and time available. In an initial phase, this diagram was introduced at the second roundtable for dialogue as an illustration of the methodology, to be enriched and adapted by members of the value chain according to their needs and expertise.

Strengthening value chains… 249
Diagram V.4 Relevant factors for making decisions on interventions in the synthetic
fibre-sports apparel value chain a
$ $
Relative cost Programmes:1 – Innovation 5 – Distribution2 – Education and training 6 – Commercialization3 – Electricity 7 – Networks4 – Environment 8 – SMEs
Impact
1
2
HighLowShort
Long
4
7
8
3
5 6
Lead
tim
e
$Source: Prepared by the authors.a The diagram is for illustration purposes and does not exclude the requisite determination of relevant
factors by means of specific analyses at a later stage.
D. Conclusions
The proposed programmes, as well as the related strategies, were defined on the basis of the diagnostic study of the synthetic fibre-sports apparel value chain. The findings of this study, the constraints and opportunities identified and the programmes proposed were discussed at national roundtables for dialogue with representatives from public sector organizations, trade associations and business.
Constructive dialogue among stakeholders is essential to ensure that implementation agreements take multiple viewpoints into account, in the framework of a participatory and transparent intervention process to respond to the constraints and opportunities identified. This approach requires strong and continuing commitment on the part of participants from the public and private sectors. This process has received substantial support from both sectors. Such support recognises how important the synthetic fibre-sports apparel value chain is for El Salvador and it reflects government efforts to design public policies targeting this value chain based on participatory processes.
The strategies proposed emerge from a comprehensive approach to strengthening the value chain, taking into consideration short- and long-term activities aimed at increasing product value added, facilitating access to customers and markets and harnessing production cluster potential. Relevant interventions should contribute to achieving the objectives: boost exports, increase value added and create jobs.

250 ECLAC
The analysis outlined in this chapter is the result of a transparent and participatory methodology adopted by ECLAC to support the Government of El Salvador and the country’s private sector in designing inclusive production development policies. It is hoped that this support will enhance El Salvador’s ability to replicate the methodology in other value chains and, given the participatory nature of the overall process, to facilitate coordination with other sectoral policies.
Bibliography
Antunes, Bruno and Claudia Monge (2013), “Diagnóstico de la cadena de fibras sintéticas-ropa deportiva en El Salvador” (LC/MEX/L.1119), Mexico City, ECLAC subregional headquarters in Mexico.
DIGESTYC (Department of Statistics and Censuses)/Ministry of Economic Affairs (2011), Directorio de unidades económicas 2011-2012, San Salvador.
(2005a), VII censos económicos 2005, San Salvador. (2005b), Directorio de unidades económicas 2005, San Salvador.ECLAC (Economic Commission for Latin America and the Caribbean) (2012),
“Centroamérica: Estadísticas del subsector eléctrico, 2011” (LC/MEX/L.1088), Mexico City, ECLAC subregional headquarters in Mexico, December.
(2011a), “Centroamérica: Estadísticas del subsector eléctrico, 2010” (LC/MEX/ L.1039), Mexico City, ECLAC subregional headquarters in Mexico, October.
(2011b), “Seguridad en la cadena logística”, Santiago, Chile. (2010a), “Centroamérica: Estadísticas del subsector eléctrico, 2009” (LC/MEX/
L.976), Mexico City, ECLAC subregional headquarters in Mexico, November. (2010b), Time for Equality: Closing Gaps, Opening Trails (LC/G.2432(SES.33/3)),
Santiago, Chile. El Salvador (2013), “Ley de servicios internacionales. Decreto Nº 431”, San Salvador,
Legislative Assembly. (1998), “Ley del medio ambiente. Decreto Nº 233”, San Salvador, Legislative Assembly. (1986), “Código municipal. Decreto Nº 274”, San Salvador, Legislative Assembly.FUNDES (Foundation for Sustainable Development) (n/d), Guía de buenas prácticas
para el sector textiles, Bogota.Groover, Mikell (1997), Fundamentos de manufactura moderna, materiales, procesos y
sistemas, Mexico City, Prentice Hall.Lockuán Lavado, Fidel (2013), La industria textil y su control de calidad. Fibras textiles.MINEC (Ministry of Economic Affairs) (n/d), “La lista de escaso abasto en el marco
del DR-CAFTA y procedimientos para presentar solicitudes de incorporación de mercancías a la lista”, San Salvador [online] http://www.cafta.gob.sv/.%5Cdoc_escasoabasto%5Clea_y_procedimientos.pdf.
Padilla Pérez, Ramón (ed.) (2013), “Sistemas de innovación en Centroamérica. Fortalecimiento a través de la integración regional”, Libros de la CEPAL, No. 118 (LC/G.2559-P), Santiago, Chile, Economic Commission for Latin America and the Caribbean (ECLAC). United Nations publication, Sales No. S.13.II.G.8

Strengthening value chains… 251
Sánchez Martín, Javier Ramón (2007), “Los tejidos inteligentes y el desarrollo tecnológico de la industria textil”, Revista Técnica Industrial, No. 268, March-April [online] http://gredos.usal.es/jspui/bitstream/10366/22120/1/DIQT_Tejidosinteligentes.pdf.
SMEDA (Small and Medium Enterprises Development Authority) (n/d), Compliance with International Standards (Guidelines for Textile Industry), Islamabad, Ministry of Industries and Production.
WCO (World Customs Organization) (2007), SAFE Framework of Standards, Brussels, June.

Chapter VI
Non-traditional export vegetable chain in Guatemala
Martha Cordero1
A. Introduction
This chapter makes a diagnostic assessment of the non-traditional export vegetable chain in Guatemala and the strategies proposed to strengthen it. This chain encompasses Chinese and sweet peas, broccoli, the main varieties of courgette (zucchini), baby corn (elotín) and baby carrots. These six products are considered part of a single chain, because they are often marketed in conjunction with peas, which are the main export vegetable. The chain was selected by the Guatemalan government for its importance in creating rural employment and because of its export orientation. This diagnostic assessment involved field research in which interviews were held with representatives of the main components of the chain, including producers, exporters, and public- sector officials. Two roundtables were also organized among the participants of the chain,2 in which the constraints identified and the strategies suggested were validated.
The chapter is divided into eight parts. Section A analyses the structure of the chain and identifies and describes its four links, the relations that exist between them and the types of firm that comprise them. Section B reviews the requirements and regulations applicable to the chain, and provisions regarding entry to international markets. Section C analyses
1 The author is grateful for the collaboration and information provided by ECLAC consultant Víctor Hugo Guzmán and Ramón Flores of the Ministry of Economy of Guatemala, in preparing this document.
2 See chapter III.

254 ECLAC
the costs and factors that make the chain’s products more competitive; while section D describes the chain’s institutional structure, and sections E, F and G address aspects of governance, financing and innovation, respectively. Section H provides a brief review of the environmental protection activities undertaken in the chain, and the final section summarizes the constraints identified and lists the strategies proposed to overcome them.
B. Identification of the value chain
In the 1970s, a large part of Guatemala’s rural population started to grow non-traditional agricultural products such as peas, broccoli, ejote (French beans) and baby vegetables. Their production has enabled many peasant families to increase their incomes and attain better living standards, thanks to higher and less volatile market prices, and the expansion of demand.
In 1980, 6.3% of the country’s harvested area was devoted to non-traditional crops, and the figure had risen to almost 17% by 2011 (see figure VI.1). Nearly all of the output of these vegetables is sent to the external market. In 1986, 25% of Guatemalan exports consisted of non-traditional products,3 and by 2012, the share had grown to 72%.4
Figure VI.1 Guatemala: harvested area by type of crop, 1980, 1990, 2000 and 2011
(Percentages)
0
10
20
30
40
50
60
70
Crops for domestic consumption a Traditional export crops b
Non-traditional crops
1980
6.2810.98
15.60 16.81
1990 2000 2011
Source: Economic Commission for Latin America and the Caribbean (ECLAC), Agricultural Information System (SIAGRO), ECLAC subregional headquarters in Mexico [online] http://www.eclac.cl/bdatos/siagro.asp.
ª This category include rice, beans, maize, sorghum and wheat.b This category includes cotton, bananas, coffee, sugar cane and cardamom.
Although the cultivation of non-traditional export crops has expanded significantly in the last few years, the species considered in this
3 Rice, beans, maize, sorghum and wheat. 4 Data provided by the Bank of Guatemala.

Strengthening value chains… 255
study still represent small percentages of total agricultural exports and the area harvested. In the country as a whole, there are 18,717 farms producing these vegetables,5 equivalent to 1.5% of all farms in the country, according to the Fourth National Agricultural Census (2002-2003).
In terms of harvested area, the six vegetables in the chain occupy 5,446 ha, representing 0.55% of the national total (see table VI.1). According to a 2012 study conducted by the Guatemalan Agricultural Chemical Association (AGREQUIMA), based on information provided by the Bank of Guatemala, in 2010 an estimated 7,000 ha were devoted to the cultivation of peas, 4,062 to French beans, and 6,510 to broccoli. Although there is no information on the other vegetable crops, they are estimated to represent a very small proportion, close to 10% of total pea production. The most widely cultivated crops continue to be yellow maize, white maize and beans, which are also the most heavily consumed in the country.
Table VI.1 Guatemala: harvested area and number of farms devoted to each crop, 2002-2003
(Absolute numbers, hectares and percentages)
Crop Number of farms Percentage of farms Harvested area Percentage of areaPeas a 9 696 0.761 2 644 0.27Broccoli 3 710 0.291 1 594 0.16Courgette 137 0.011 65 0.01French beans 1 073 0.084 233 0.02Carrot b 4 098 0.322 910 0.09National total 1 273 173 1.469 980 974 0.55
Source: Prepared by the author, on the basis of National Institute of Statistics (INE), IV Censo Nacional Agropecuario, 2002-2003.
a Includes Chinese peas.b Includes carrots of all types, including baby carrots
Data from the Ministry of Agriculture and Food of Guatemala show that in 2010 pea cultivation ranked eighth among the country’s most important agricultural activities in terms of employment, behind the main traditional products (maize, coffee, sugar, beans, banana, cardamom and melon); and this activity provided employment to about 4 million day labourers per year, equivalent to 13,463 permanent jobs. Broccoli cultivation was ranked 20th in that year, occupying about 1 million farm hands, equivalent to 3,446 permanent jobs. Between them, these two activities generated 3% of permanent jobs among the country’s 28 leading agricultural activities.
The production of French beans has also become an important activity in Guatemala and a major source of foreign-exchange earnings, as also has baby-vegetable growing. A 2009 study by AGREQUIMA found that broccoli and French beans accounted for 0.3% of national gross domestic product (GDP) and 2.5% of agricultural GDP. Many farmers and export firms producing and
5 Excluding baby corn.

256 ECLAC
marketing peas also produce calabacín courgettes and, to a lesser extent, baby vegetables, which demonstrates their diversification strategy.
Nearly all baby-vegetable activities are undertaken on Guatemala’s plateau (meseta) and central altiplano, areas comprising the departments of Chimaltenango, Guatemala, Huehuetenango, Quetzaltenango, Quiché, San Marcos, Sololá, Totonicapán and sectors of Jalapa, Alta Verapaz and Baja Verapaz (see map VI.1). These are mountainous zones of variable altitude, containing different microclimates that vary from temperate to semi-cold, which makes it possible to grow various types of vegetable.6 They are also among Guatemala’s most heavily populated regions, accounting for a large percentage of rural dwellers and about 70% of the country’s total population.
Map VI.1 Guatemala: non-traditional export vegetable cultivation zones
Belize
Mexico
Honduras
El Salvador
Pacific OceanOver 50% of production
Caribbean Sea
Jutiapa
Jalapa
Guatemala
Alta Veracruz
Baja Veracruz
Quiché
San Marcos
Quetzaltenango
Guatemala
Sacatepequez
ChimaltenangoSololá
Source: Prepared by the author, on the basis of National Institute of Statistics (INE), IV Censo Nacional Agropecuario (2002-2003), and interviews conducted during on-site research.
6 Information obtained from the National Institute of Seismology, Vulcanology, Meteorology and Hydrology (INSIVUMEH).

Strengthening value chains… 257
Nationwide, the consumption of non-traditional vegetables is minimal, because they are not among the Guatemalan people’s preferences. Only French beans are sold in small quantities on the domestic market, and peas in hotels and restaurants frequented by tourists.
1. Description of the chain
The non-traditional export vegetable chain can be divided into four links: (i) seed production; (ii) cultivation; (iii) processing, packing and exports; and (iv) commercialization (see diagram VI.1).
Diagram VI.1 Guatemala: links of the non-traditional export vegetable chain
Marketing
Broker
Processing, packing
and export
Seed producers
National firm: “Prosemillas”
Sowing and harvest
Small-scale producersExport firms
Cooperatives
Intermediaries
Cooperatives
Cultivation
Source: Prepared by the author.
The first of these links is dominated by foreign seed-producing enterprises, which invest heavily in research and innovation, and sell through import agencies on the domestic market. There is only one Guatemalan firm, Prosemillas, which sells the PAC271 seed to cultivate baby corn, both in Guatemala and abroad.
The second link tends to be in the hands of small-scale proprietor- or tenant-farmers, who clear and prepare the land, sow the seeds, tend the plants, harvest, and lastly deliver the produce to firms that process and export it. There are also peasant co-operatives and associations that work on these tasks, along with a number of vegetable processing and export firms.
The activities of the third link are often undertaken by Guatemalan firms, who are the owners or lessors of refrigeration plants in which the vegetables are selected, cleaned and packed. These enterprises also handle the procedures involved in exporting and shipping the product abroad.
258 ECLAC
Some peasant co-operatives and associations have also entered this link of the chain, processing and exporting the vegetables they produce.
The fourth link is usually operated by the broker, which fulfils the customs procedures abroad and sells the vegetables to large supermarket, hotel and restaurant chains in the importing country. Only two Guatemalan firms have entered this link, opening their own marketing offices in the United States.
Decisions on the type of vegetable to be grown, along with its quantity and quality, are generally taken in the fourth link. Foreign buyers generate demand and specify the quality conditions to be met by the product. Participants in the third link receive the specifications and transmit them to the second link.
The farmers can work in close contact with the export firms and, in some cases, with the cooperatives. As a result, the firms decide on the species, volume and quality. The producer receives payment, according to market prices, upon delivery of the product.
In an agreement, either verbal or written, it can be stipulated that the export firm will provide the farmer with inputs such as fertilizers, agrochemicals and seeds in lieu of financing, the cost of which will be deducted from the final payment. In other cases, the producer buys the necessary inputs directly, and does not receive financing from a firm or cooperative, but the exporter delivers a list of permitted inputs and the amount that can be used, to ensure that the vegetable produced satisfies the quality demanded by the importer.
The seeds, timeframes, and precautions required, vary according to the vegetable being grown. In the case of peas and French beans, the seeds used are of the open pollination type; 7 in the case of broccoli, calabacín courgettes, baby carrots and French beans, the seed is hybrid. In the first case, the seeds can be reproduced by the producer, for use in new crops. The second type can only be used once, because the seeds are reproduced in special laboratories.
Two types of peas are produced in Guatemala: Chinese and sweet. Most of the seeds of these varieties are imported, although there are creole seeds, which are adapted and resistant to pests and diseases, but of little commercial presence owing to a lack of research. Two types of French beans are produced in the country, along with one type of broccoli and three types of courgette (long green cylindrical type, and round semi-dent, in green and yellow colours). The varieties of baby carrots are
7 Seeds that can be grown at the same time as the actual crop, without the need to apply advanced technology, taking the steps needed to preserve their quality.

Strengthening value chains… 259
“baby carrot orange” and “baby carrot mix”. The baby corn (elotín) produced is of the PAC 271 variety, and is a small immature and sweet type of maize.
All of these vegetables have a short growing period, which enables the producer to sow several times a year and to alternate according to demand (see diagram VI.2). The average growing period ranges between 40 and 120 days. The vegetables can be grown throughout the year thanks to the temperate climate of the Guatemalan altiplano. Nonetheless, in the dry season8 (December to April) irrigation is needed; in the frost season, the vegetables need to be grown on slopes; and in the rainy period, protection against flooding and hurricanes needs to be provided. Most producers take advantage of the rainy season, which lasts from May to November, to produce more abundant crops.
Diagram VI.2 Guatemala: length of growing seasons
(Days)
Peas
Broccoli
Calbacín courgette
French bean
Baby corn (elotín)
Baby carrot
10 20 30 40 50 60 70 80 90 100 110 120
Source: Prepared by the author.
The vegetable crops are generally grown in open fields, except for broccoli which is usually produced in greenhouses because it is a more delicate species. Roughly 2% of sown areas have irrigation, using either spray or droplet systems, and the other 98% relies on annual rainfall, which tends to occur from June to September (INE, 2004). Nonetheless, field research shows that the proportion of irrigated land might in fact be greater, because some firms operating with European capital reported that they use irrigation systems for nearly all of their crops.
The duration of the growing season varies from one vegetable to another. Usually the farmers rely on their own experience and on the technical files delivered by the firms and cooperatives, to decide whether the crop has the volume, height and characteristics needed by the importers. Vegetables displaying any malformation, colour alteration or
8 Also referred to as “spring”, because it is characterized by high temperatures.

260 ECLAC
any damage, are generally offered cost-free to livestock breeders for use as cattle feed, provided the breeders collect from the field themselves.
The harvest can last several weeks, depending on the vegetable, the area sown and the time of year. The process is done manually and the harvested product is stored in plastic baskets, usually provided by the firms or cooperatives, which are put in the shade to prevent the produce from becoming dehydrated. In the rainy season, the baskets are covered with plastic to prevent the vegetables from rotting. There are no refrigerator chambers in the fields, so the harvested product has to be kept in those conditions until it is transported to the sales outlets or to the exporters’ or cooperatives’ supply centres.
Farmers that have not signed agreements with exporters or cooperatives sell directly in the markets, in which brokers and agents of a number of export firms also participate when they need a given volume of products to meet their sales targets. The brokers, in turn, can sell the vegetables (which were not subject to strict quality and food safety control) to the export firms or cooperatives.
Producers who do sign a sales agreement with cooperatives or exporters deliver the harvested product to the latters’ supply centres,9 where the vegetables that satisfy the required quality standards are selected, and any showing signs of damage are rejected. Some firms and cooperatives have started to use the rejected units to produce processed foods, but this is not yet a common practice.
In the supply centres, which may either form part of the processing plants or else be independent facilities, the third link of the chain is set in motion. Post-harvest management of the product is essential to keep it in good condition for as long as possible.
The operations undertaken in the processing and packing plants also vary from one case to another, although they generally follow the pattern shown in diagram VI.3. Once the product has been selected, it is sent for cleaning, and in some cases, washing.10 Broccoli and baby carrots may be cut. At this stage, the vegetables undergo rapid cooling to keep them fresh; and, in some cases, they may be vacuum-packed using a centrifuging process, to enhance their value and lengthen their life time.
At the next stage the vegetables are put in cardboard boxes covered with plastic, or else in transparent plastic containers, hermetically sealed inflated plastic bags, or in plastic boxes. For the wholesale transport of
9 These centres are located close to the production areas and their function is to concentrate the production of several small-scale producers.
10 As contact with water can speed up the deterioration of the vegetables, some are only dry-cleaned.

Strengthening value chains… 261
peas and French beans, plastic or wax boxes are used, with capacity for five or 10 pounds of vegetables. The field interviews revealed that roughly 40% of the produce is sent packed, while the remaining 60% is exported in bulk for processing in the importing country.
Diagram VI.3 Guatemala: flow chart of processing in the third link of the chain
Reception and checking of the product
Cleaned and washed Cut, sliced
Surface drying
Mixing(baby
vegetables)
Put in bags of packed
Storage
Transport to destination
market
Source: Prepared by the author.
The last stage of this link consists of storing the vegetables, usually in refrigerator chambers, for export. If chambers of this type are unavailable, the vegetables are stored in refrigerated trucks or in a room at normal temperature.
The distribution and size of the exporters’ and cooperatives’ processing plants depend on several factors. The largest firms have extensive plants divided into sections. European firms tend to subdivide them as recommended by good manufacturing practices.
Once packed, the vegetables are transported to the customs at sea or air terminals for export to the United States and countries in Europe and Central America. They are usually carried from the packaging plants to the customs in refrigerated containers. This chain uses three means of transport, air, sea and road, depending on the destination country. The products can be transported either chilled or frozen.11
Various requirements are also applicable at this stage, depending on the characteristics of the product. French beans and calabacín courgette are transported by air, because they are more delicate and spoil more easily. Peas, which are harvested in large volumes and are more resistant, are transported by sea in 40,000 pound containers.
11 This study focuses on the processing of fresh vegetables, owing to the lack of information on the freezing process, which was also not considered in the field research.

262 ECLAC
Exports to the United States mostly travel by sea and, to a lesser extent by air. The main destination ports are Miami and Everglades in the State of Florida; Newark in the North-East, and Long Beach and Los Angeles in southern California. Transport to Europe is basically by sea, the main destination ports being Rotterdam in the Netherlands and Hamburg in Germany. Shipments to other Central American countries use road transport.
The fourth link of the chain comes into operation once the product reaches the customs of the importing countries, so it is outside Guatemalan jurisdiction, apart from provisions arising from bilateral negotiations with the United States to facilitate entry of the vegetables into that country. Only two Guatemalan firms have representatives in the United States to market their products; other exporters and cooperatives have to negotiate the final product price with the broker. Firms of European origin that export to European countries also have representatives in the destination markets, to fulfil the same tasks as the broker.
The vegetables, particularly baby vegetables and broccoli, have a very short life cycle, so they must be sold by a broker to supermarkets, hotels and restaurants almost immediately after their clearance through customs. The consumer of this type of product is very demanding in terms of freshness and product quality. If the product displays marks, bruising, colour alterations or some other deterioration, the sale will not proceed, and the export firms deduct the respective costs from their payment to the producers.
2. Inputs
The inputs needed in the second link are mainly seeds, fertilizers, agrochemical products and ploughs. As noted in the previous section, two types of seeds are used, open pollination and hybrid, produced by foreign firms and purchased in Guatemala by importers and seed traders. The only exception is baby corn, for which the PAC271 seed is produced and sold by Prosemillas, the only Guatemalan producer in this segment.
The importing and trading firms fulfil the seed importation procedures. The vegetable exporters purchase directly from these firms and distribute to the producers. So called “agricultural stores” purchase the seeds from the traders or obtain contraband seeds from Honduras, and then sell them to the producers along with fertilizers and agrochemical products.12 Trading firms operating in the country include Agrosemillas, Popoyán, Seminal, Agrimak and Proseca.
12 Most of the contraband comes from Honduras, because that country does not charge an import duty on agricultural inputs, basically pesticides.

Strengthening value chains… 263
The fertilizers and agrochemicals, mostly of foreign origin, are produced and marketed in Guatemala by large transnational corporations such as BASF, Monsanto, Bayer, Makhteshim Agan, Dow AgroSciences, Rotam, Stoller and Disagro.
All of the machinery used in the chain is imported; and it is purchased from agricultural equipment dealers by the farmers, by firms that rent such equipment, or by the exporters.
In the third link of the chain, the main inputs are stainless steel tables on to which the vegetables are poured for selection and cleaning, plastic boxes for transporting the product from the field to the storage centres, weighing machines, vacuum packaging machines if it is desired to increase the value added of the product, stainless steel wash basins for the plant employees and for cleaning utensils, refrigeration chambers for conservation of vegetables before transportation, computer hardware for the management of the plants and control of the crops, washing and centrifuging machines, packing machines, and boxes or bags for packing.
As is the case in the second link, most of the inputs that are used in this stage are imported and marketed by Guatemalan firms. According to a number of the interviews held with the exporting firms, the most complex machinery is imported directly by those firms, which also hire skilled foreign staff to maintain and repair them. When defects occur, the necessary spare parts are also imported, because they cannot be obtained on the national market.
The packing material can be provided by the import firm and made specially for it with the corresponding logo. It may also be imported by exporting firms or cooperatives from El Salvador, the United States, Israel, Peru or European countries, in some cases displaying the importer’s logo. Lastly, some exporters of peas make their own packing material in Guatemala; this is very simple compared to the material imported from industrialized countries, known as “smart packing”, which lengthens the product life. According to information obtained from the field interviews, 75% of the packing material is imported.
Refrigerated transport equipment is the most important element of the fourth link. The most delicate products, of the six comprising this chain, are calabacín courgettes and baby vegetables. The vegetable that is easiest to handle and has the longest life is peas; but in all cases, the produce needs to be transported in refrigerated vans, which keep a constant temperature of 4°C to 7°C, and 95% relative humidity, to ensure that the product remains in good condition for seven to 10 days (Mérida and Yovani, 2003).
The interviews revealed that the two main shipping companies used by Guatemala’s vegetable exporters are Crowley Latin America

264 ECLAC
Services and King Ocean Services Ltd., both based in the United States. These firms are signatories of the Central America Discussion Agreement (CADA), also signed by Dole Ocean Cargo Express, Great White Fleet and Seaboard Marine. The provisions of this partnership agreement are applicable in all coastal ports in the United States, and also in Panamanian ports and those of other Central American countries. The agreement restricts the producers to using only the signatory shipping companies in the aforementioned ports, which implies a certain degree of cartelization.
The firms’ vessels call at the ports of Santo Tomás de Castilla in Guatemala and Everglades in the United States. Those of Crowley Latin America Services make the trip between those two ports three times a week, and those of King Ocean Services Ltd. make just one journey a week. The two firms use fully cellular vessels that transport refrigerated containers with a capacity greater than 170 twenty-foot equivalent unit (TEU —equivalent to the dimensions of one container).13
3. Firms that participate in each link
The seed producer in Guatemala could be considered a medium-sized enterprise since it has 55 employees. The foreign firms operating in this link are mostly large conglomerates such as Monsanto, Dupont, Syngenta, Bayer and Dow Agrosciences. All of them make large investments in, and devote many skilled staff to genetic research, with the aim of developing new enhanced vegetable varieties and varieties with specific characteristics, such as baby vegetables.
Participants in the second link of the value chain range from small-scale producers, cultivating small plots of land, to large export firms, the owners of extensive land areas, or tenant farmers. Small-scale producers often join groups consisting of seven to 100 farmers, either as cooperatives, committees, associations, or community banks (Angulo, 2007).
Farmer cooperatives are the most common form of partnership in Guatemala; and they generally provide their members with services such as financing, representation, technical assistance, training, project development, leadership training and business skill development (FAO, 2012). The two main cooperatives that produce peas, French beans and baby vegetables in Guatemala are Cooperativa Agrícola Integral Unión de Cuatro Pinos and Cooperativa Agrícola Integral Magdalena.
Some export firms also participate in this link of the chain, working their own or rented land. These firms hire labour to cultivate land and technical staff to supervise the activity. There are no statistics
13 The containers are 20ft long by 9 ft wide and 8.5 ft high, and have a capacity of 33 m³.

Strengthening value chains… 265
on the number of firms participating in this link, or on the number of partnerships, farmer groups and individual producers.
The third link involves export enterprises and the two cooperatives that participate in the previous link. The former work in close collaboration with associations and groups of peasant farmers, in a similar way to cooperatives. In many cases, they provide the farmers with financing, supply training services, and even develop social education and health programmes for the producers.
Some export firms operate, at least partially, in the open market; in other words, they rely on intermediaries that purchase their produce without requiring them to fulfil quality and safety standards. The intermediaries are independent agents that purchase vegetables from a producer on market days and then sell on to the export firms that require large volumes to satisfy external demand.
According to data from the Guatemalan Exporters Association (AGEXPORT), in 2012 there were 44 firms registered as exporters of peas and 45 exporters of French beans. Nonetheless, some of these firms are under the same ownership but registered under different names, for tax reasons in Guatemala and the customs procedures in the United States. In addition, some of the firms producing peas also grow French beans and even also baby vegetables and broccoli. As the AGEXPORT Peas and Vegetables Commission only regulates the export of peas, and also French beans at the request of the exporter, there is no information on the other vegetables studied.
The fourth link of the chain consists mainly of the brokers in external markets particularly in the United States and the United Kingdom. In the other countries of the European Union, the agents of the exporting firms are responsible for the sale and distribution of the products. Just two Guatemalan firms have offices and representatives in the United States market: Cooperativa Cuatro Pinos and Det Pon. There is no information on the number and name of the brokers, because exporters tend to keep this information confidential as part of a strategy for competing with their Guatemalan peers.
4. Geographical distribution of the value chain
Peas, French beans, broccoli, baby carrots and baby corn have to be grown in zones of moderate temperatures, ranging from 15ºC to 20ºC on average; whereas courgettes require lower temperatures of between 12ºC and 13ºC. Most of these crops are located between 1,000 and 2,000 m above sea level; and in all cases the land areas must have good drainage and an acidity level (PH or hydrogen potential) of 5.5 to 7.

266 ECLAC
Most of the growing areas are concentrated in the Department of Chimaltenango; the only exception being courgette, which is mainly grown in the Department of Sacatepéquez, since this department has adequate temperatures for its production and is closer to the processing plants.14 According to information compiled in the Fourth National Agricultural Census, 68.9% of the production of peas is concentrated in Chimaltenango, along with 56.4% of broccoli, 42.2% of French beans, and 36.1% of carrots. In the case of courgette, 69.3% of production comes from the Department of Sacatepéquez, which is also an important area for peas and French beans. The Departments of Huehuetenango, Quiché and Quetzaltenango account for a large proportion of the cultivation of broccoli, French beans and carrots, in that order.
5. Job creation
The first link in the chain provides employment for 55 Guatemalans, with a high education level, who work on seed research and development.
The production of vegetables, particularly baby vegetables, makes intensive use of labour, which is more readily available in the departments in which most of the operations in the second and third links of the chain are undertaken. According to estimates made by the National Institute of Statistics (INE) of Guatemala, 47% of the country’s population is concentrated in departments where a large proportion of the products of the chain are cultivated, except in the capital; 6% of the Guatemalan population live in Chimaltenango and Sacatepéquez, the main production centres.
The second link in the value chain generates two types of employment: permanent and temporary. The first category encompasses crop supervisors and landowners. The second consists of persons hired for sowing, weeding, and harvest. Most of the employees with permanent jobs are men, while activities that provide temporary employment are mainly done by women.15 In terms of the age of the workers, the provisions of labour laws and good agricultural practices are generally respected. Nonetheless, in family farms, it is also possible to find children and older adults working on cultivation tasks.
Ministry of Economy estimates show that, in 2010, export vegetable production was generating 18,809 jobs, of which 54% corresponded to broccoli cultivation (10,123 jobs), 35% to peas (6,590 jobs) and 11% to French
14 The time elapsing between harvest and delivery to the plants should not exceed four to six hours.
15 Seasonal employment is concentrated in collection tasks, in which hand-size and capacity for delicate handling of the product gives women a comparative advantages.

Strengthening value chains… 267
beans (2,096 jobs). There were also an estimated 35,000 producers growing baby vegetables, although, given its importance in relation to broccoli and peas, this figure should be higher. In addition, the three main crops are estimated to generate 3,442 indirect jobs (AGREQUIMA, 2012).16
The number of direct and indirect jobs created by non-traditional export vegetable cultivation has probably increased in the same proportion as the area cultivated, but there are no statistics indicating the corresponding path or current situation.
Figure VI.2 illustrates the general trend of wages in Guatemala’s agriculture sector. Nominal wages17 grew by an annual average of 8.4% between 2005 and 2012. In contrast, real wages18 only rose at an average of 2.5% per year over the same period, in other words from 38.6 quetzals per day in 2005 to 46 quetzals in 2012.
Figure VI.2 Guatemala: minimum daily agricultural wage in nominal
and real terms, 2005-2012 (Quetzals) a
0
10
20
30
40
50
60
70
80
2005 2006 2007 2008 2009 2010 2011 2012
Nominal Real
Source: Prepared by the author, on the basis of figures provided by the Central Bank of Guatemala.ª Real wages at 2005 prices.
Most workers in the second link only have primary school education, having on average completed the first to second grade of basic education. Young workers tend to have a higher level of schooling, and
16 According to employment data from the Ministry of Agriculture and Food of Guatemala, pea cultivation was the main creator of permanent jobs in 2010 (13,463), followed by broccoli (3,446). The fact that these figures differ from those released by the Ministry of Economy highlights the problems that exist in relation to statistical calculations in Guatemala.
17 In quetzals at current prices. 18 Correcting for the effect of inflation.

268 ECLAC
they are more open to the implementation of new agricultural practices proposed by agronomy engineers or technicians.
The third link generates roughly 2,500 jobs, most of which are temporary. These figures are estimates, because there are no exact figures on the number of jobs created for this link, even though it is better organized than others, at least in the case of pea producers.
This link of the chain hires professionals trained in administrative and supervision activities and in crop planning; workers are also hired to process and pack the vegetables. The professional staff represent roughly 3.3% of the human resources employed in this link and have permanent contracts. Unskilled workers account for the remaining 96.7%; and over 95 percentage points of this group are women, employed exclusively in the harvest seasons. As in the second link, women workers tend to have a basic level of education or are illiterate.
There is no further information on the employment generated in the fourth link of the chain, or on its trend or the education level of the human resources, particularly in the case of firms that have intermediaries and offices abroad.
6. Exports and market access
In terms of exports, peas are ranked first among the six products studied. In 2012, according to information from the United Nations Commodity Trade Statistics Database (COMTRADE), exports of this product totalled US$ 49 million; followed, in descending order, by exports of broccoli (US$ 44 million)19 and French beans (9 million). For the other vegetables studied, there is no information, but the amounts exported are estimated to be much smaller. The three main crops account for 1% of Guatemala’s exports and 45% of its vegetable sales to the world, included in category 07 of the Harmonized System.
Guatemala is the second-largest exporter of peas (14% of the market) worldwide, following the United States; the seventh largest exporter of broccoli, and the third largest exporter of French beans. Its main competitors in this field are the African countries, China, the United States, Mexico, Peru and a number of European countries that produce broccoli and baby vegetables.
In value terms, French beans increased their export value most in 2001-2012, by 27.9% per year on average; in order of importance, this product is followed by broccoli (18.4%) and beans (13.4%). In volume terms, French beans also display major export growth in the same period, of 9% per year on average, followed by broccoli (7.7%) and peas (6.4%).
19 This figure also includes the export of cauliflowers, which are covered by the same tariff line, including at the eight-digit level as used in Guatemala.

Strengthening value chains… 269
The main external markets for non-traditional export vegetables are the United States and the European countries; but they are also sold in some parts of Central America and in Mexico, albeit in smaller amounts. According to AGEXPORT data, peas are exported mainly to Canada and the United States (72%) and to Europe (27.6%). The same source shows that 94% of exports of French beans were absorbed by the markets of Canada and the United States, and 6% by the European market. The United States is the largest importer of broccoli produced in Guatemala (92.3%), followed by El Salvador (2.6%) and Japan (1.7%). It is estimated that calabacín courgettes and baby vegetables are also mainly exported to United States.
Of the six vegetables considered in this study, in 2012 the main product imported by the United States was broccoli (57% of the imports of the six products, although the figures are highly volatile, as shown in figure VI.3), followed by peas (40%) courgette (2.6%), baby carrots (0.7%), baby corn (0.15%) and French beans (0.12%). This highlights the relative importance of each product for Guatemala, particularly given that the United States provides the destination market that absorbs about 80% of the chain’s production.
Figure VI.3 United States: imports of non-traditional vegetables
produced by Guatemala, 1990-2012(Thousands of US dollars)
0
500
1 000
1 500
2 000
0
10 000
20 000
30 000
40 000
50 000
PeasBroccoli
Baby carrot (RH axis)French bean (RH axis)
Calabacín (RH axis)Elotin (RH axis)
1990
1991
1992
1993
1994
1995
1996
1997
1998
1999
2000
2001
2002
2003
2004
2005
2006
2007
2008
2009
2010
2011
2012
Arveja Brócoli
Mini zanahoria (eje secundario) Ejote francés (eje secundario)
Calabacín (eje secundario) Elotín (eje secundario)
Source: Prepared by the author, on the basis of Economic Commission for Latin America and the Caribbean (ECLAC), Module for the Analysis of Growth of International Commerce (Magic Plus).
Note: The right-hand (RH) axis measure exports of baby carrots, French bean, courgette, and elotín in thousands of dollars.
Guatemala is the leading supplier of peas to the United States, accounting for 46.1% of the market for that product; but its market share has decreased significantly since 1993 (66.8%). The country is also the second

270 ECLAC
largest supplier of broccoli to the United States, with a market share of 10%, whereas Mexico is the leading supplier with an 81% share. In 2012, Guatemala was the fourth largest exporter of calabacín courgettes (0.7%) after Mexico (94.3%), Canada (2.3%) and Costa Rica (0.8%). In the case of baby corn, in 2012, Guatemala was ranked eighth and accounted for 0.4% of the market; in the case of French beans, it was ninth (with a 1.2% market share) and in the case of baby carrots, it ranked third (with 12.4% of the market) after Mexico and Canada.
In relation to the European market, Guatemala is also the leading exporter of peas (a 32% share) and the fourth largest supplier of broccoli (7.6%). It is the second largest exporter of French beans (3.6%) the 13th exporter of courgette (0.45%) and the eighth supplier of carrots (0.4%); but in 2009 it only exported a very small quantity of baby corn to European countries. In this market, Guatemala’s main competitors are a several African countries (including Egypt, Kenya and Zimbabwe), China, the United States, Israel and Peru. The fastest-growing products in the period 2002-2012 were carrots (export growth averaging 122.7% per year); broccoli (87.6%), peas (9.4%) and French beans (4%). The main destination market in the European Union is the United Kingdom, which absorbs 48% of Guatemalan exports of peas, 91% of its French beans, 99% of its carrots and 90% of its broccoli.
The Central American market has also been gaining importance, particularly El Salvador for French beans (98% of the total sent to other countries of the subregion) and peas (33.7% of that total). Significant amounts of peas are also exported to Honduras (29% of the total), Costa Rica (24%) and Nicaragua (13%).
Guatemala has signed trade agreements with the main importers of its products, including the Free-Trade Agreement between the United States, Central America and the Dominican Republic (DR-CAFTA), which entered into force in 2006. It is also a signatory of the Association Agreement between Central America and the European Union which came into effect in late 2013; and it has preferential access to that market under the Trade Preferences System (TPS). Guatemala is also a member of the Central American Integration System (SICA).
These agreements allow the application of a zero tariff on vegetables from the chain under study. Exporting firms only have to fulfil requirements on health controls, rules of origin, and trade standards. Nonetheless, importers also require a certification of good agricultural practices (GAPs) and good manufacturing practices (GMPs), as a guarantee that the product has the quality demanded by consumers.
In the case of European countries, Guatemalan exporters have to prove the following: control of polluting products, control of pesticide residues, health control, and control of traceability with international
Strengthening value chains… 271
certification. In addition, product labelling must abide by European marketing standards. Exports to the United States market also require a sanitary and phytosanitary certificate, a certificate of origin and evidence of compliance with labelling regulations. According to a number of exporters, to sell the products under study in other Central American countries it is sufficient to show that national food-safety regulations have been fulfilled.
Outside these three markets, exporters have not sought other expansion possibilities or attempted to expand the range of exportable products. Although Mexico is one of the main exporters of baby vegetables, it is also a potential market, particularly in the south of the country, which is a site of major tourist activity. Among others, the State of Quintana Roo is seen as a potential market, owing to its proximity to Guatemala and the vigorous development of its tourist sector.
Guatemala signed a free-trade agreement with Mexico, which applies a zero tariff on vegetable imports. The only requirement is the presentation of a phytosanitary certificate in customs and fulfilment of Mexican Official Standards (NOMs), which are also applicable to national producers. In addition, and as is the case with United States and Europe, importers require international food safety and security certification (Casasola Arriaza, 2004).
Although there may be other alternatives, export enterprises prefer to focus on the products that sell best and on the largest markets, such as those of the United States and Europe. Although part of the production is exported to other Central American countries, few firms have explored those markets and many of them do not know how to access them. Over the last few years, attempts have been made to expand exports of other varieties of baby vegetables, but none of them has attained the scale of products such as peas and broccoli. Moreover, the Guatemalan government does not have a market-intelligence unit that provides cost-free assistance to entrepreneurs in seeking out new markets or identifying products for which demand is more dynamic.20
In their product selection, the participants in the fourth link of the chain consider numerous factors, such as the existence of attractive prices and constant demand. They also prefer those that have the greatest potential for commercialization, higher rates of profitability per cultivated area, and a low technological content, which are easy for the farmers to grow. In addition, they prioritize products that do not entail large expenses in respect of refrigerated transportation between the growing areas and the packing plant, and which provide permanent employment for peasant-farming families, requiring intensive use of labour in the sowing, growing and harvest seasons.
20 AGEXPORT has a market intelligence unit to provide paid services to its members.

272 ECLAC
C. Requirements and standards
Export vegetables are products targeting a high-income segment in the importing countries, which is characterized as being demanding. Accordingly, their production and management has to submit to strict sanitary controls. The participants in the second, third and fourth links have to take account of factors of food safety, traceability, quality, respect for the environment, sustainable use of natural resources and safety measures for the producer.
The quality and safety of the vegetables studied is assured mainly through good agricultural practices (second link) and good manufacturing practices (third link) (see table VI.2). Although there are national standards that make it possible to control and demonstrate quality and safety, the most important quality standards that have to be observed are those defined by the importers, which correspond to the aforementioned practices.
The GLOBALG.A.P. organization is responsible to certifying fulfilment of these requirements. Importers also have to obtain other certificates such as the Hazard Analysis Critical Control Points (HACCP) or the technical standards of the British Retail Consortium (BRC). The certifications that producers and exporters have to obtain are determined by their customers abroad. In general, European importers demand a larger number of certifications than those of the United States, so exporters tend to export less products to that market, viewing it as highly demanding. In contrast, the Central American markets only require certification by the Guatemalan authorities, so it is sufficient to fulfil the SICA regional regulations on exporting to countries within that subregion.
GLOBALG.A.P. is a private organization that sets standards of voluntary compliance, contained in a manual on good agricultural and manufacturing practices. Its objective is to assure the consumer that the agricultural production processes and management of their products seek to minimize the impact on the environment, restrict the use of chemical inputs and protect workers’ health and safety (CropLife Latin America, 2012). These standards are continuously updated, so the farmers and exporters meet to be permanently alert to changes.
GLOBALG.A.P. classifies vegetables according to their risk levels, and it defines the requirements to be fulfilled. Peas, broccoli, French beans, courgette, baby corn and baby carrot are classified as medium-risk vegetables, and their production is governed by the requirements listed in table VI.2. This organization has representatives throughout the world that are responsible for certification. Usually, it signs service-provision agreements with independent certification agencies that operate as audit firms. The certification of a group of producers or an individual firm is entered into the GLOBALG.A.P. database, along with any other relevant information, enabling buyers and sellers to verify the fulfilment of good practices.

Strengthening value chains… 273
Table VI.2 Requirements of GLOBALG.A.P. on the fulfilment of good agricultural practices
and good manufacturing practices
Requirement
Requirements to be fulfilled
by medium risk vegetables
Good-quality irrigation water
Good-quality water used for fumigation and processing X
Use of droplet or furrow irrigation systems, to prevent earth splashing on to the fruit XVerification of the microbiological quality of the irrigation, fumigation and processing water X
Use of treated chicken dung X
Animal-free growing area X
Minimum height of 50 cm between the ground and the fruit
Worker health protection measures X
Worker hygiene measures X
Existence of toilets and wash basins X
Continuous worker training X
Adequate application of pesticides X
Cleaning of kitchen equipment and utensils X
Products not placed directly on the ground X
Avoidance of extraneous materials in the harvested product X
Transport in good hygiene conditions X
Existence of a tracing system X
Record-keeping X
Source: CropLife Latin America, Curso para agroexportadores de frutas y hortalizas. Manual para el instructor 2012 [online] http://www.agrequima.com.gt/pdfs/manuales_cap/Manual_exportadores.pdf.
In Guatemala, the Agricultural Chemical Association (AGREQUIMA) is the only institution that has direct contact with GLOBALG.A.P., specifically with regard to the training in good agricultural practices provided by the latter; but there is no audit firm in the country that certifies the fulfilment of those practices and good manufacturing practices. Although there are public institutions such as the Integrated Agricultural and Environmental Protection Programme (PIPAA) and the Food Safety Department of the Ministry of Agriculture and Food, which certifies the fulfilment of both types of practice, their certificates are not used by exporters and producers for presentation to the importers, because they are not recognized by GLOBALG.A.P. To obtain the certification required by this organization, the firms use foreign consultants, the contracting of which imposes an additional cost in terms of transport and per diems. The nearest GLOBALG.A.P. representation offices are in Costa Rica (Costa Rican accreditation entity) and in Mexico (Mexican accreditation entity, EMA).

274 ECLAC
One of the most important audit firms with operations in Guatemala is Davis Fresh Technologies of the United States, which sends a representative to certify producer groups and packing plants every year. The firm issues an annual certificate on the application of good agricultural and manufacturing practices (Angulo, 2007).
The HCCP analysis uses a systematic approach, making it possible to identify factors that affect food safety and the security of food products and to adopt the measures necessary to control them, alongside the application of good practices. The relevant measures are adopted by the importers and by the Guatemalan government to protect public health. The analyses consider all potential hazards relating to food safety —biological, chemical and physical— through the following procedures: (i) identification of hazards at all stages of the process; (ii) establishment of critical control points; (iii) establishment of limits in relation to each of the aforementioned; (iv) institution of monitoring procedures that each critical point; (v) adoption of corrective measures relating to each critical point; (vi) development of verification procedures; and (vii) implementation of the documentation and record-keeping system (CACER, s/a)
The BRC also establishes criteria on the security and quality of food products to be applied by producers or manufacturers, based on the two sets of good practices and also on the HACCP evaluations. The Consortium imposes controls on the installations of plants, products, processes and staff, as commonly required by importers from the United Kingdom, but which have been also extended to other countries. Certification of the fulfilment of BCR controls and the implementation of hazard analysis evaluations is the responsibility of foreign audit firms, which fulfil the same function as GLOBALG.A.P.
Importers from United Kingdom, and particularly the multinational chain Tesco, can ask for the application and certification of the “Tesco Nurture” standard. Since 1992, Tesco has required its suppliers of fruit, vegetables and salad ingredients to apply the “Nature’s Choice” protocol, which includes standards on safety, quality and protection of the environment. The seven “Nature’s Choice” pillars are: rational use of plant protection products; rational use of fertilizers and manures; prevention of pollution; protection of human health; rational use of energy, water and other natural resources; recycling and reuse of materials, and conservation and improvement of flora, fauna and landscape.
As noted above, the Guatemalan authorities have minimal participation in international certification, particularly in relation to

Strengthening value chains… 275
agricultural and manufacturing practices. The Guatemalan government requires exporting firms to hold the sanitary or phytosanitary certificate issued by the Food Safety Department of the Ministry of Agriculture and Food; to register at the one-stop facility which issues an exporter identification number; to fulfil export procedures, and to have a certificate of origin. Once the firms have obtained the GLOBALG.A.P. external certification, undertaken the HACCP analyses and fulfilled the requirements of the BCR, among others, the issuance of a national certificate becomes an additional requirement, already covered by the external certification in relation to the United States and European markets.
The United States applies the National Agriculture Release Programme (NARP), which periodically analyses information compiled on imported products. If a product has not been retained for a long period (12 months or more), the central office of the Animal and Plant Health Inspection Service recommends the central office of the United States Customs and Border Protection Service, located in Washington, DC, to alter the relevant inspection protocols at the product’s entry port, to streamline its clearance.
The purpose of the programme is to facilitate trade by sending instructions to the inspectors of the Customs and Border Protection Service working at entry ports, to enable them target their work on products from countries that pose greater risks. This programme has made it possible to reduce the percentage of inspections at entry points. Nonetheless, as the instructions are not mandatory, their application depends on the judgment made by the authorities at each port, which, therefore, reserves the right to inspect shipments received, for other purposes.
Export firms whose products are not retained at United States Customs have the possibility of being issued a special certification (free from automatic detection), which means that they are not reviewed in the laboratories of the United States Environmental Protection Agency (EPA) and can therefore be sent directly to the supermarkets. This certification helps to reduce inspection costs by up to US$ 700 per container (Angulo, 2007). To receive it, the firms must not suffer retentions for pests that exceed 1% of their products.
According to information from the United States Customs and Border Protection Service, contained in the ECLAC database entitled “Observatory of customs control of imports of the United States (OCAI), peas21 are the vegetable subject to most retentions, followed by French beans and courgette (see figure VI.4). Those recording the
21 Reflecting the larger volume exported than baby vegetables; but this does not happen with broccoli for which export volumes are greater than peas.
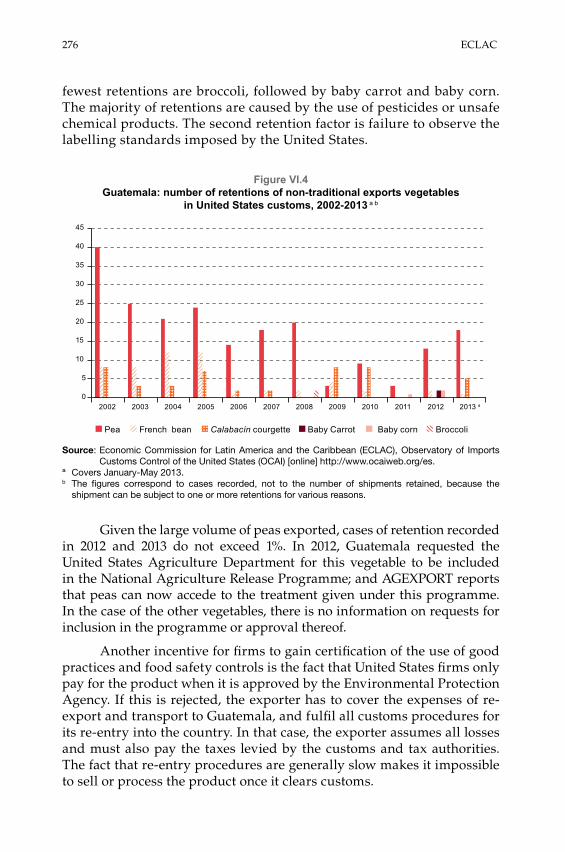
276 ECLAC
fewest retentions are broccoli, followed by baby carrot and baby corn. The majority of retentions are caused by the use of pesticides or unsafe chemical products. The second retention factor is failure to observe the labelling standards imposed by the United States.
Figure VI.4 Guatemala: number of retentions of non-traditional exports vegetables
in United States customs, 2002-2013 a b
0
5
10
15
20
25
30
35
40
45
2002 2003 2004 2005 2006 2007 2008 2009 2010 2011 2012 2013 a
Pea French bean Calabacín courgette Baby Carrot Baby corn Broccoli
Source: Economic Commission for Latin America and the Caribbean (ECLAC), Observatory of Imports Customs Control of the United States (OCAI) [online] http://www.ocaiweb.org/es.
ª Covers January-May 2013.b The figures correspond to cases recorded, not to the number of shipments retained, because the
shipment can be subject to one or more retentions for various reasons.
Given the large volume of peas exported, cases of retention recorded in 2012 and 2013 do not exceed 1%. In 2012, Guatemala requested the United States Agriculture Department for this vegetable to be included in the National Agriculture Release Programme; and AGEXPORT reports that peas can now accede to the treatment given under this programme. In the case of the other vegetables, there is no information on requests for inclusion in the programme or approval thereof.
Another incentive for firms to gain certification of the use of good practices and food safety controls is the fact that United States firms only pay for the product when it is approved by the Environmental Protection Agency. If this is rejected, the exporter has to cover the expenses of re-export and transport to Guatemala, and fulfil all customs procedures for its re-entry into the country. In that case, the exporter assumes all losses and must also pay the taxes levied by the customs and tax authorities. The fact that re-entry procedures are generally slow makes it impossible to sell or process the product once it clears customs.

Strengthening value chains… 277
Participants in the third link of the chain are aware of the importance of applying good manufacturing practices, but some producers continue to ignore good agricultural practices. When the farmers have close links with the processing firms, there are more possibilities for applying these practices, given the control exercised by those firms and the training provided to the producers. If the latter are not organized and do not have stable relations with the third link in the chain, the application of good practices is more complicated.
Applying good agricultural practices is more difficult in the second link because of its inherent economic and social conditions. As noted above, most rural producers have few resources and a low level of schooling, which explains the frequent use of ancestral agricultural practices and the need to perceive tangible and immediate gains.
D. Costs and competitiveness
Producing and marketing non-traditional exports vegetables is more profitable than growing traditional vegetables such as maize and beans. The profitability of Chinese peas and baby corn is greater than that of the latter, and non-traditional vegetables require a shorter growing time, which allows for two or more harvests of one or several products per year (see table VI.3).
When production costs, including labour, are considered, the profitability of peas and baby corn surpasses that of the other non-traditional export vegetables. Accordingly, their production continues to be more profitable, both for the producers and for the exporters.
Unlike traditional vegetables, the chain being studied has additional costs such as the purchase of special seeds, chemical products and permitted fertilizers, product cleaning and packing equipment, special packaging material and transportation in refrigerated chambers. Nonetheless, the differentiation that this provides raises their profitability, despite constraints that make the purchase of the inputs more difficult.
According to information provided by AGEXPORT, the share of imports and services22 in the total production costs of peas, varies is between 37% and 41%. In the cases of French beans, calabacín courgette, baby corn and baby carrot, the proportions are 36%, 51%, 64% and 51%, respectively. The large share of these items may reflect the fact that most of
22 Inputs include the cost of seeds, fertilizers, fungicides, insecticides, irrigation and machinery rental, among others. Services include the cost of labour.

278 ECLAC
the inputs are imported, and that the certifications and laboratory analyses have to be performed outside the country. Input costs can be reduced if the export firm buys them in large quantities, so the larger the scale of the operations the lower the costs. Although the inputs are imported, the seeds, fertilizers and chemical products are purchased on the domestic market through marketing firms, since direct importation would be more costly owing to the procedures needed for their entry into the country. The participants of the value chain compete with each other, especially in the third link, so there is no coordination mechanism for the purchase of inputs or contracting of services.
Table VI.3 Guatemala: comparison of costs, income and profitability of traditional
and non-traditional products a
(Quetzals per cuerda) b
Product Cost c Price of sale Profit ProfitabilityChinese pea 2 986.2 5 200.0 2 213.9 42%Baby corn 1 916.7 3 400.0 1 483.3 44%French bean 3 640.0 4 950.0 1 390.6 26%Black bean d 914.0 1 500.0 585.0 39%Yellow rice e 733.0 1 040.0 307.0 30%White rice e 768.5 1 140.0 371.5 33%Zucchini commander 3 467.0 4 500.0 1 033.0 23%Zucchini paty 3 937.0 4 950.0 1 013.0 20%Zucchini sumburst 3 937.0 4 950.0 1 309.6 20%
Source: Food and Agriculture Organization of the United Nations (FAO), The State of Food and Agriculture 2005, Rome, 2005 and information from Red SICTA agricultural innovation project, 2008 [online] http://infoagro.net/programmes/RedSICTA/frijol_adego.aspx.
ª Around 2012.b In Guatemala, a farmer’s production area is measured in “cuerdas”. Each cuerda is equivalent to a lot
of 32 x 32 “varas”, or 16 x 16 “varas”, depending on the production zone. c The costs include labour, from the plowing of the land through to harvest, and inputs (seeds, fertilizers,
fungicides, insecticides, and others). Both these and the sale prices refer exclusively to the second link of the chain.
d Data refer to 2008.e Data refer to 2004.
Cost competitiveness depends essentially on labour, which is abundant and cheap in Guatemala. Labour costs represent between 35% and 60% of total costs in the second link, according to AGEXPORT data; but, as small-scale farmers do not adequately record this factor of production, its cost cannot be determined accurately. According to information compiled in the field research, when the producer has a family-type microenterprise and a certain cultivable area, it tends not to take into account the labour of all family members or the profitability of their land. The producer also tends not to keep records of income and outgoings, which makes it impossible to calculate real profits.
In addition to labour, the chain has other competitiveness factors, such as climatic and territorial conditions that allow year-round production,

Strengthening value chains… 279
but which also involve risk or weakness; permanent and extended training on production- and manufacturing-related requirements, which reduce the rejection of vegetables in a proportions varying between 5% and 10%; and proximity to the main external market, which reduces transport costs and make it possible to sell a quality product.
The chain also has weaknesses that impair its competitiveness. The first of these consist of the negative aspect of its geographic location and climatic characteristics, which make Guatemala highly vulnerable to hurricanes and other extreme weather events during the rainy season,23 phenomena that can seriously damage crops or even destroy them. Moreover, the lack of an irrigation system in some agricultural operations encourages cultivation during the rainy season, which heightens the risk of crop damage or loss.
The second weak point is ignorance or rejection of quality and control standards by some producers. Although permanent and extended training is offered on good agricultural and manufacturing prices, there are still some farmers who have not received training or who refuse to apply the practices, for cultural or economic reasons. Moreover, constant changes in the certification requirements require producers and exporters to adapt rapidly, which can prove difficult in some cases. This is compounded by the existence of a network of intermediaries that do not take account of food safety and quality requirements in their purchases, which can restrict the entry of vegetables into United States by increasing the retention rate in customs, which in turn undermines the country’s image and restricts sales.
Another weakness of the chain is the high cost of transport faced by export firms. In some interviews held during the field research, exporters stated that costs in this area have risen considerably over the last few years, and even surpass those of Peru, one of the countries that compete with Guatemala in this sector despite being further away from the United States. Some of the interviewees reported that air transport can generate 45% of production costs, whereas maritime transport represents about 15%. The cost level depends on the volume exported: the larger the volume, the lower the costs. Nonetheless, as in the case of inputs, the value chain does not have a coordination mechanism that would make it possible to design and implement a strategy for negotiating transport services with the shipping companies.
A 2009 study undertaken by the National Competitiveness Programme (PRONACOM) and the Investment Promotion Agency (“Invest in Guatemala”) on the value chain of the logistics and maritime transport sector in Guatemala, tested the hypothesis that maritime freight charges are the main driver of the loss of competitiveness in Guatemala’s foreign trade. Following several analyses and surveys, however, it was concluded
23 Also known as the “winter season” since it is the period of rainfall, unlike the dry or spring season.

280 ECLAC
that freight prices are competitive and that the rates paid by Guatemalan firms are similar to those applied to their neighbouring countries. In most cases, they do not exceed those paid by entities from other countries of the region by more than 5%, and they can even be lower. The difference is only above 10% in the case of freight from the Atlantic, destined for ports on Guatemala’s Pacific coast. Guatemalan firms pay rates that are lower than the regional average for maritime transport services between Miami and domestic ports (Bazán and Lugo, 2009).
Nonetheless, an analysis of maritime transport rates in the region covered by the Central American Discussion Agreement (CADA) shows an annual average increase of 8% between 2004 and 2012, which means a rise from US$ 2,060 to US$ 3,780 per shipment (see figure VI.5). The shipping companies attribute this increase to the higher price of fuel, basically oil. The fact that vegetable exporters do not maintain a united front when negotiating and signing contracts with the CADA also facilitates the charging of higher prices.
Figure VI.5 Guatemala: maritime freight charges applicable by the Central America
Discussion Agreement (CADA) to exporters of peas, 2004-2012(US dollars)
0
500
1 000
1 500
2 000
2 500
3 000
3 500
4 000
2004 2005 2006 2008 2009 2010 2011 2012
Source: Guatemalan Exporters Association (AGEXPORT).
The fourth weak point of the chain concerns the quality and price of the products, particularly in the case of peas; and several interviewees expressed concern about the deterioration of both variables. As the seed used for cultivation of peas and French beans is of the open-pollination type, producers have started to produce them for themselves to lower costs. The producer often uses seeds from lower-quality plants for reproduction instead of those of higher quality, to be able to sell the maximum amount of the harvest to the export firm. This causes a progressive deterioration of

Strengthening value chains… 281
the quality of the peas and French beans, owing to genetic degeneration, which has an effect on the final price of these vegetables.
Seed production is not subject to any official control and does not receive any institutional support. There are also no training programmes for seed producers and marketers on the fulfilment of technical standards or on procedures and protocols related to the production of enhanced plant varieties.
The per kilo export price of peas trended downwards in the period 2008-2011, according to information reported by the Central Bank of Guatemala (see figure VI.6). In 2007, the price was US$ 1.30 per kilo, but this had fallen to US$ 1 per kilo by 2009. The price recovered only in 2012 and 2013 to a range of US$ 1.40 - US$ 1.50 per kilogram —a trend that could be linked to the international economic crisis and consequent shrinking of demand for certain products
Figure VI.6 Guatemala: unit price of export peas, 2002-2013
(US$ per kilo)
0.02002 2003 2004 2005 2006 2007 2008 2009 2010 2011 2012 2013
0.2
0.4
0.70.7 0.8
1.0 1.1
1.3
1.1
1.0 1.0
1.1
1.4
1.5
0.6
0.8
1.0
1.2
1.4
1.6
1.8
Source: Prepared by the author, on the basis of figures provided by the Central Bank of Guatemala.
Over the last two years, the prices that have fallen most are calabacín courgette (down by 90% between 2011 and 2012), baby corn (-76%), carrot (-74%) and broccoli (-16%), as indicated by the general foreign trade statistics published by the Bank of Guatemala.24 The products recording the largest increase in volumes exported and unit prices continue to be peas (fresh and chilled) and French beans.
24 Data on exports through customs and those covered by the provisions of Decree 29-89 (Law on the Promotion and Development of Export and Maquila Activity).

282 ECLAC
E. Institutional structure
The chain studied is mostly dominated by producers of the main export vegetable: peas. In 1990, the National Pea and Vegetables Committee,25 which is responsible for promoting technological development of the product and assisting the Guatemalan government with regulations applicable to its entry into the main importing markets. There are no institutions that perform similar tasks in relation to the other vegetables included in the chain studied. The activities of the National Committee could benefit all links of the chain but not systematically. Some producers and exporters of peas and baby vegetables also grow broccoli, but apparently are not fully integrated into the committee; and in some cases they are not interested in participating in activities to promote this and other vegetables, among other places in international trade fairs.
The Committee consists of representatives of the Ministry of Agriculture and Food, the Ministry of Economy and exporters affiliated to the Pea and Vegetables Committee of AGEXPORT. The Committee has been used to impose rules on production, exportation and marketing, contained in the permanent programme to regulate and promote the cultivation of Chinese peas.26 In addition, a register of exporters was created, and permanent training is provided to producers. In relation of the former, the one-stop export facility (VUPE)27 was set up, making it possible to detect firms that are not authorized by the committee but are interested in exporting this product. Training is provided with support from AGREQUIMA and the Association of Agricultural Input Manufacturers (GREMIAGRO),28 which also provides technical assistance and distributes up-to-date information material on good agricultural practices mainly to firms affiliated to AGEXPORT.
The entities of the Ministry of Agriculture and Food represented on the Committee are the Plant Health Department, the Phyto-Zoogenetic Department and the Food Safety Department. For seed imports, the first of these is based on the 2003 Register of Pests and Diseases, which does not contain up-to-date information on tests, which delays the process. Some of those interviewed in the study reported that the processing of requests
25 Committee created by Government Agreement No. 1161-90. 26 AGEXPORT created the National Pea and Vegetables Committee, with the aim of
proposing solutions to the problem raised by growing rejection of export products in the United States, and ensuring competitive development of the sector it represents.
27 In the case of French beans, the register has been created on a voluntary basis, because there is no legal framework that requires producers of other vegetables to fulfil the requirements imposed on peas.
28 This is a relatively new trade association consisting of firms that import chemical products —mainly generic ones. Although its activity is currently incipient, it is expected to become important in the field of pesticides, like AGREQUIMA.

Strengthening value chains… 283
and permits to import seeds is slow and bureaucratic, and in some cases it has taken a year to issue a permit. For that reason, entrepreneurs are forced to buy seeds on the local market, which restricts their efforts to diversify production.
One of the main components of the Plant Health Department is the Integrated Environmental and Agricultural Protection Programme (PIPAA), which inspects and certifies non-traditional export products other than the vegetables covered by this study. Nonetheless, export firms that so desire may request intervention from the programme to certify the use of good agricultural practices, although very few do so. The programme receives support from the National Phytosanitary Diagnostic Laboratory, which certifies agricultural products that are exported and imported.
The Agricultural Inputs Registration Department, also attached to the Plant Health Department, is supposed to coordinate the auditing and supervision of agricultural inputs; but it has been unable to fulfil this task owing to a lack of resources and staff. Currently, there is no entity that controls the distribution and sale of agricultural inputs, which facilitates and marketing of unregistered products, contraband, and even falsification. According to the Ministry of Agriculture and Food, just 54% of sales points are officially registered, which represents a risk for the chain as it prevents effective control of the chemical products purchased by the producers.
The Phyto-Zoogenetic Department is responsible for keeping the record of enhanced plant varieties up to date, to ensure that the seeds are certified according to technical and scientific quality standards, both national and international. The department is also short-staffed, and lacks the resources needed to control the seeds produced in the country, including those of peas and French beans.
The Food Safety Department is responsible for supervising establishments that produce safe unprocessed foods and for promoting the adoption of good agricultural and manufacturing practices, HACCP evaluations, and other food safety-related regulations. Since 2003, the department has issued a regulation on the granting of sanitary permits for the functioning of establishments, transport, and the import and export of unprocessed foods of plant origin and their by-products. Fulfilment of the provisions of this legal framework is verified annually in all links of the non-traditional export vegetables chain. The government is currently supervising some 350 firms that export fruit and vegetables; but, as it only has two professional employees working in the field, the firms in question are inspected regularly only once a year.
One of the activities undertaken by AGREQUIMA in the framework of the committee involves the provision of training on the management

284 ECLAC
of agrochemical and fertilizer products. It currently is implementing a programme on management of the use and safe handling of pesticides, recognized since 1997 by the Ministry of Agriculture and Food: the “Limpiemos nuestros campos” [Let’s clean up our fields] programme. Training and participation in the programmes run by AGREQUIMA are cost-free for producers and the exporting firms. Since 1991, AGREQUIMA has trained over 700,000 people, thereby enabling many farmers to receive the certification needed to export their products.
The Ministry is executing various programmes to promote the cultivation of vegetables in the chain under study, which are not included in the activities of the National Pea and Vegetables Committee. The Vice-Ministry of Rural Economic Development (VIDER), is charged with implementing and developing agricultural production programmes and projects in rural areas.
The Department of Geographic, Strategic and Risk Management Information (DIGEGR) monitors agricultural production and undertakes semi-detailed soil studies in the departments of Chimaltenango, Sacatepéquez, Sololá and Guatemala, where a large proportion of the production of non-traditional export vegetables takes place. Nonetheless, chain participants have not made use of these studies.
In addition, the Ministry set up the National Agricultural Development Council (CONADEA), to facilitate interaction between it and the institutions and organizations of the non-governmental agricultural sector, such as AGEXPORT or AGREQUIMA, with a view to giving orientation to public policies for the crop farming, livestock, hydrobiological and forestry sectors. The Council has been unable to fulfil the functions assigned to it, however, owing to budget cuts in public institutions.
The Ministry also created the Agricultural Production Council (CONPRODA), with responsibility for promoting the productive and commercial development of the chains, including those that produce carrots, French beans and Chinese peas. The rest of the vegetables in the chain are not considered strategic crops. Nonetheless, budget cuts and staff downsizing in the ministry have made it impossible to provide continuous support to the selected chains.
The Ministry of Public Health and Social Assistance of Guatemala has a National Health Laboratory that identifies the presence of pesticide residues in vegetables. The laboratory applies the HPLC MS/MS technique to analyse 35 elements, and it uses high-resolution chromatography of gases for the analysis of another eight; the results are delivered within five days. In the case of the first technique, the fee charged is 1,600 quetzals (US$ 205), and in the second technique, 800 quetzals or US$ 103. Although
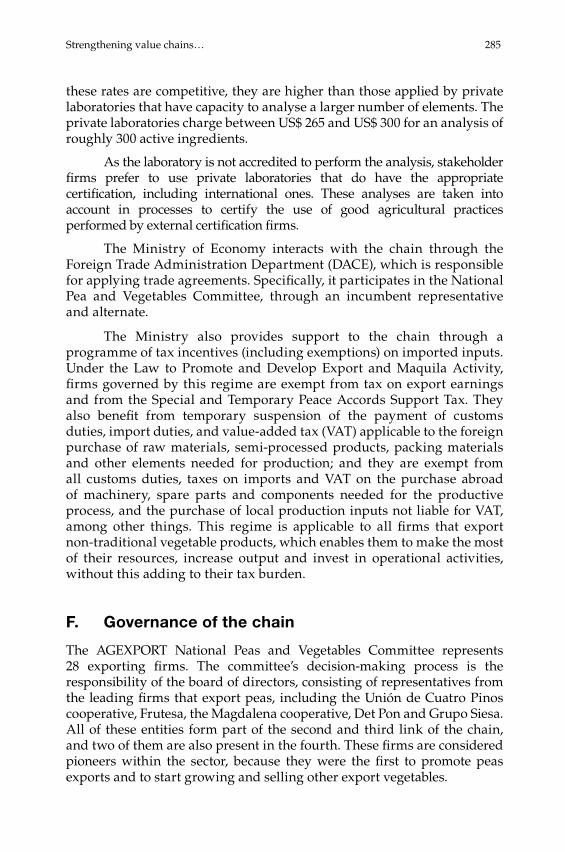
Strengthening value chains… 285
these rates are competitive, they are higher than those applied by private laboratories that have capacity to analyse a larger number of elements. The private laboratories charge between US$ 265 and US$ 300 for an analysis of roughly 300 active ingredients.
As the laboratory is not accredited to perform the analysis, stakeholder firms prefer to use private laboratories that do have the appropriate certification, including international ones. These analyses are taken into account in processes to certify the use of good agricultural practices performed by external certification firms.
The Ministry of Economy interacts with the chain through the Foreign Trade Administration Department (DACE), which is responsible for applying trade agreements. Specifically, it participates in the National Pea and Vegetables Committee, through an incumbent representative and alternate.
The Ministry also provides support to the chain through a programme of tax incentives (including exemptions) on imported inputs. Under the Law to Promote and Develop Export and Maquila Activity, firms governed by this regime are exempt from tax on export earnings and from the Special and Temporary Peace Accords Support Tax. They also benefit from temporary suspension of the payment of customs duties, import duties, and value-added tax (VAT) applicable to the foreign purchase of raw materials, semi-processed products, packing materials and other elements needed for production; and they are exempt from all customs duties, taxes on imports and VAT on the purchase abroad of machinery, spare parts and components needed for the productive process, and the purchase of local production inputs not liable for VAT, among other things. This regime is applicable to all firms that export non-traditional vegetable products, which enables them to make the most of their resources, increase output and invest in operational activities, without this adding to their tax burden.
F. Governance of the chain
The AGEXPORT National Peas and Vegetables Committee represents 28 exporting firms. The committee’s decision-making process is the responsibility of the board of directors, consisting of representatives from the leading firms that export peas, including the Unión de Cuatro Pinos cooperative, Frutesa, the Magdalena cooperative, Det Pon and Grupo Siesa. All of these entities form part of the second and third link of the chain, and two of them are also present in the fourth. These firms are considered pioneers within the sector, because they were the first to promote peas exports and to start growing and selling other export vegetables.

286 ECLAC
External sales of peas and French beans are concentrated in five firms, some of which are among the first to have started producing and exporting them. As much as 50% of the total exports of the two products come from these five firms, of the 47 registered in 2012. This degree of concentration can make decision-making difficult, because problems of rivalry arise, particularly among participants in the third link that compete with the same products and on the same markets. In fact, the components of their supply are practically identical, although some producers have invested in raising quality as a way to distinguish themselves from the others. Firms in the third link also compete to obtain the vegetables produced in the second link.
A relationship of loyalty is established between the producers and the exporting firms, in a context in which there is little or no participation by the public sector. The farmers’ loyalty largely depends on the price of sale at which the exporter succeeds in selling the product on international markets (Angulo, 2007). In some cases, the farmers do not fulfil the contractual clauses, or they deliver a smaller volume than agreed upon, which occurs particularly when market prices are trending up and they can sell their crop to another exporter. This type of conduct may be sanctioned with a gradual reduction in access to credit and the services of the export enterprise which, in the event of a lengthy non-compliance, could even result in producers that do not respect the agreements being excluded from the sowing process (Angulo, 2007). In any event, if the exporter needs a larger volume of certain products, it can apply to intermediaries.
The largest exporting firms and cooperatives usually operate social programmes to support the producers. The Det Pon enterprise has a programme to assist housewives, whom it contracts for part-time work washing, cutting or packing the vegetables. It also has a programme targeting small- scale producers, which includes technical assistance, credits, purchase guarantees and the provision of certified seeds, fertilizers, other inputs, and all necessary harvest equipment. The Unión de Cuatro Pinos cooperative also has support programmes to help producer fulfil international requirements. All of these are forms of cost-free assistance that the export firms offer to producers, in conjunction with national or international funds and programmes.
G. Financing
Producers do not find it easy to obtain credit for investment and working capital. Domestic banks require collateral, which generally cannot consist of machinery, so the farmer must make use of a real estate property. Many producers do not have ownership titles on the land they cultivate, and factoring services are inadequate owing to restrictions of their flexibility and

Strengthening value chains… 287
processing times (CBI, 2010). Moreover, in Guatemala there are no agricultural insurance policies, so when an extreme weather events occurs, the export firms that provide inputs to the producer have to absorb the consequential losses, although it can charge the farmer in subsequent harvests.
Lending institutions in Guatemala include commercial banks, saving and loan cooperatives, agricultural product export firms, non-governmental organizations, and commercial enterprises. The Ministry of Agriculture and Food also grants credits for agricultural production through the Fruit Growing Incentives Programme (PINFRUTA), Dacredito and PLAMAR, among others.
The Dacrédito banking institution provides backing to producers to make it easier for them to access the financing programme or bank loans for agricultural livestock production, tourism services and rural industries. The institution provides the following benefits: guarantee funds (up to 80% of the amount requested); subsidies to insurance premiums (70% of the total up to a maximum of 30,000 quetzals), technical assistance (up to 90% of costs) and a subsidy for carrying out a pre-investment study (up to 90% of the costs corresponding to fees).
In general, agricultural credits have declined considerably over the last few years —at an average annual rate of 4.7% between 1980 and 2010. In the chain being studied, they are frequently granted by exporting firms, which supply inputs to the producers, the costs of which are either subsequently deducted from the final payment or else paid for in advance, before the harvested product is delivered.
H. Innovation
Most of the scientific and technological research activities undertaken in Guatemala have responded to initiatives from the private agribusiness sector and have been carried out in conjunction with national institutions. These were concentrated in the 1980s, when the non-traditional export vegetables chain started to be assembled. At the present time, the activities are poorly systemized; a few firms research good agriculture and manufacturing practices, but none engage in more advanced research relating to genetic improvement or product differentiation. Owing to this and the lack of extension activities, many smallholders (minifundistas) and small firms display a very low level of technological development. Over the last few years, the public and private sectors, supported by international cooperation institutions, have started to help farmers adopt good practices (World Bank, 2010).
The Agricultural Science and Technology Institute (ICTA), founded in 1973, is one of the main Guatemalan institutions that promote the

288 ECLAC
development and transfer of technology. Nonetheless, the support received by the institute has decreased sharply owing to changes in the government structure. Initially, the ICTA provided support for research in the non-traditional export vegetable chain; but nowadays it targets the generation of genetic lines for the sector, producing seeds for basic grains such as maize and beans.
In the 1990s, ICTA carried out various activities related to pea production, including integrated crop management, training and technology transfer, and determination of the residue-free period. The institute performs evaluations on the use of white and black co-extruded polyethylene to conserve humidity and make better use of the nutrients; the use of bacilus sibtilis for biological control of the fungus fusarium oxisporum; the possibility of placing yellow sticky traps in the crops, and the application of granulated diazinon pesticide in soils to control the thrips insect (Frankliniella occidentalis). Many of these research activities have not been updated.
In 2012, the ICTA Board of Directors approved the project to reform and modernize the institute, which has been proposed by the Ministry of Agriculture and Food, with the aim of defining priority areas for research and technology transfer in the agriculture sector, adopting a new organizational and functional structure for the ICTA, and a new regulation.
The main educational institutions that undertake research on agriculture are the Agronomy Faculty of the University of San Carlos, the Environmental and Agricultural Sciences Faculty of the Rafael Landívar University and Universidad del Valle de Guatemala. These universities have not signed research agreements with the producers and exporters of the vegetables of the chain, and the people undertaking them are students on internships, or those preparing a thesis before graduating as agronomy engineers.
In some cases, private-sector higher-education institutions sign a collaboration agreement through a letter of understanding specifying the responsibilities of the parties. This link consist mainly of internships in agro-export firms undertaken by students close to graduating, as a prior requirement for graduation, in which they carry out research on various aspects of agriculture of particular importance.
Guatemala’s education institutions also provide services to the components of the chain in some of the following areas: (i) laboratory diagnostic studies on water, soils and pesticide residues; (ii) entomology, phytopathology, nematology, virology and biotechnology; (ii) geographic information systems; and (iii) market intelligence. The cost of the services is quite modest compared to the fees charged by private laboratories.

Strengthening value chains… 289
I. Environmental protection
The components of the second and third links of the chain can cause environmental pollution and damage, owing to the use of insecticides, fertilizers and other chemical products. In addition to environmental protection and the contribution to environmental sustainability provided by good agricultural and manufacturing practices, in Guatemala specific programmes are being implemented to protect workers in relation to the use of chemical agents, which at the same time strengthen the application of the two series of practices.
In collaboration with the Ministry of Agriculture and Food, AGREQUIMA is implementing two programmes to reduce pollution and protect the environment. The first of these is known as the “CampoLimpio” [Clean countryside] programme, the objective of which is to maintain a healthy and clean environment, and to safeguard health and human safety. Since 1998, AGREQUIMA has provided training to farmers on the adequate disposal of the plastic containers of chemical products, their collection and recycling —a practice that is applied on all farms in Guatemala, which has allowed farmers to gain awareness of the necessary preservation of fields and water sources in Guatemala.
In the period 1998-2001, recovered and shredded plastic was sent to the furnaces of Cementos Progreso to be used as fuel. Since 2002, the plastic has been recycled by the firm Maderplast, in which the empty cartons are transformed into plastic wood, which is used to manufacture cross-sections, boards, benches, garbage bins, panels for homes, outdoor tables and tiles, among other products. In 2009, 65% of the plastic containers of legally sold products were recycled, and between 2009 and 2012, recycling operations increased by 12%, but the percentage of total sales represented by these figures is unknown. According to AGREQUIMA data, Guatemala is ranked third worldwide in the recovery of empty containers of products used in agriculture.
The second of the AGREQUIMA environmental programmes promotes the “Biodep” ecological filter, which makes it possible to accumulate, retain, and micro-biologically degrade surplus pesticides that may spill on to the ground in areas where they are mixed. The filter also allows for safe rinsing and washing of the spraying equipment and prevents soil and water pollution. The “Biodep” product was developed in Sweden and adapted to the climatic conditions and resources available in Guatemala by AGREQUIMA, which also provides training on its use and management. There is no information on the results of the programme or an evaluation of its implementation.

290 ECLAC
J. Main constraints identified and strategies recommended
The second link of the chain shows that, although there are many institutions providing training and assistance on the application of good agricultural practices, a considerable portion of producers still do not apply them. Farmers do not have irrigation systems that enable them to raise productivity or the capacity needed to maintain them. Nonetheless, as census information is not up-to-date and that provided by government agencies can be contradictory, there are no reliable statistical data on the number of producers, or their characteristics and needs, which would make it possible to formulate plans of action applicable throughout the chain. At the institutional level, the Ministry of Agriculture and Food does not regulate or adequately supervise the sale of inputs in the first link. Lastly, the producers are not trained to record their income and expenditure and thus be able to precisely calculate their profits.
The third link also displays a failure to fulfil good manufacturing practices, albeit not as widespread as in the case of good agricultural practices. Possibly the most important omission in the application of the former in this link are shortcomings in the cold chain, which can damage the product and speed up its decomposition. Theoretically, value added could be raised in this link but, as its industrialization is minimal, a large volume of vegetables that do not meet export quality requirements goes to waste, but could be taken advantage of if processed.
Between the third and fourth link of the chain, the greatest constraints are maritime and air transport costs, which undermine the chain’s competitiveness. Customs and sanitary control procedures, which do not facilitate the expeditious re-entry of vegetables that have been rejected in the United States, are also constraints that operate between the two links. Moreover, the limited capacity of customs and sanitary control agencies makes it difficult to import agricultural inputs.
There are also constraints that affect the entire chain systemically, including: (i) heavy reliance on imported inputs; (ii) lack of national laboratories and certifying firms for the analysis of products of interest to foreign importers; (iii) lack of scientific and technological research and, in general, and best practices and technological innovations; (iv) lack of a national market to sell non-traditional export vegetables; (v) lack of government support, owing to the shortage of resources and staff; (vi) concentration of support on the cultivation of peas, to the detriment of other vegetables with good export potential; and (vii) the non-existence of an organization to undertake market-intelligence activities and provide support for seeking out new products, markets, and cultivation lands.

Strengthening value chains… 291
Table VI.4 Constraints existing in the chain
Second link Third link SystemicNon-fulfilment of good agricultural practices
Non-fulfilment of good manufacturing practices
Heavy reliance on imported inputs
Low level of coverage and maintenance of irrigation systems
Low-level incorporation of value-added
Lack of laboratories and certification firms
Inadequate regulation and supervision of the sale of inputs by the Ministry of Agriculture and Food
High maritime transport costs Nonexistence of a national market for the sale of the chain’s products
Lack of training to producers on cultivating profits
Complexity of customs procedures, which delays the importation of inputs and makes it difficult to expeditiously re-import rejected vegetables
Insufficient government support, owing to the shortage of resources and staff
Concentration of support on the production of peas
Source: Prepared by the author.
The design of the programmes presented in the following paragraphs took account of examples of the application of best practices in facing similar constraints to those identified in the diagnostic stage, so the recommendations mention successful cases recorded in other countries. As is the case with the main conclusions of the diagnostic study, the programmes that include strategies and lines of action were validated and enhanced in the roundtables (see chapters II and III, which describe the methodology applied).
As indicated in chapter II, the value-chain strengthening methodology allows for a micro-analysis of the constraints and the design of specific and targeted strategies that can be replicated on a larger scale. The following paragraphs contain a detailed listing of the strategies and lines of action envisaged, thereby illustrating the usefulness of the methodology for implementing industrial policies.
Programme 1
Objective: Expansion of the application of good agricultural practices, strengthening of laboratories and facilitation of international certification.
This programme is targeted on links two and three of the chain. It aims to reduce part of the monetary costs and shorten timeframes, to the benefit of exporters and producers; raise the quality of vegetable products, whether or not part of the chain, to the benefit of national and foreign consumers, and guarantee the quality of non-traditional vegetables.

292 ECLAC
Strategy 1: Strengthen the implementation of good agricultural practices actively, permanently, and as part of a programme.
Lines of action:
• Expand training and assistance on good agricultural and manufacturing practices, by strengthening the competent authorities (integrated agricultural and environmental protection programme of the Vice Ministry of Agricultural Health and Regulations) and with support from the private sector.
• Strengthen the supervision, inspection, and registration of agricultural inputs, particularly pesticides, under a national control plan in the country’s agricultural fields, plants, export ports, supply centres and supermarkets.
• Develop a training programme on the use of approved chemical products and the importance of food security and the fulfilment of sanitary and phytosanitary measures.
• Provide direct assistance to consultants, trainers, producer organizers, public- sector service providers, training institutes and discussion platforms of the public and private sectors.
• Permanently disseminate information to the application of information and communication technologies (ICTs) and printed material, on the chemical products that are authorized for use in the cultivation of export vegetables and other aspects of good agricultural practices.
• Develop a programme to stimulate chain participants, aimed at promoting the application of good agricultural practices, based on the example of the case of small-scale producers in the municipality of Granada (Colombia).
• Develop training programmes to help producers record their income and expenditure, to enable them to calculate their profits adequately.
Strategy 2: Create laboratories for the control of pesticides and adopt standardization measures.
Lines of action:
• Carry out a feasibility study to determine the advisability of strengthening current laboratories or creating a regional laboratory that covers the zone in which the chain’s vegetables are produced.

Strengthening value chains… 293
• Adopt measures for the standardization of current laboratories and the creation of a Central American laboratory with technical resources (materials, instruments, equipment), scientific resources (literature, access to international sources of scientific information), human resources and analytical methodologies and quality systems. Account will be taken of the joint project of the National Agri-food Health, Safety and Quality Service (SENASICA) of Mexico and the United States Food and Drug Administration (FDA), along with the example of the Normex Laboratory of Michoacán, Mexico, and its relationship with Mexico’s “Alianza para el Campo” [Partnership for the countryside] programme.
Strategy 3: Reduce the cost of certifications and keep information on the requirements imposed by the importers up-to-date.
Lines of action:
• Formulate the principles under which a national quality system should operate, complemented by a dissemination and training programme and the establishment of national regulations on good agricultural practices. It is proposed to study the Mexican certification system aligned with GLOBALG.A.P. and recognized by the largest importers from Europe and the United States.
• Adopt measures to give incentives to the establishment of an international certification office in Guatemala.
• Develop export protocols that help producers and exporters fulfil the regulations imposed by importers.
• Create a continuous updating mechanism to disseminate the requirements that producers and exporters need to fulfil.
Programme 2
Objective: Identification of best commercial practices and the granting of incentives for greater incorporation of value-added.
This programme targets the main links of the chain. In addition to the general objective, its purposes are to: raise productivity and quality, improve diversification, increase the profits of all participants, guarantee access to the importers’ markets, compile up-to-date information making it possible to implement adequate policies and programmes for the development of the chain, and expand the demand for a Guatemalan vegetable products.

294 ECLAC
Strategy 1: Create a market intelligence system to provide permanent support to the chain.
Lines of action:
• Conduct a study on the diversification of agricultural products and markets, among other things to determine current or potential capacity for the production and exportable vegetables during the harvest season; the potential demand for other non-traditional vegetables in agricultural product markets; transport alternatives and the respective costs; and the concentration of exports in agricultural product markets.
• Reactivate the link between the National Agricultural Development Council of the Ministry of Agriculture and Food, to enable it to continue providing support to the main productive chains.
• Promote the consumption of non-traditional export vegetables in Guatemala, through programmes targeting gourmet consumers and programmes to generally publicize the nutritional properties of these products.
• Develop a total-quality seal linked to the country brand. The programmes “México Produce” [Mexico produces] and “México Calidad Suprema” [Mexico supreme quality] could be studied.
Strategy 2: Carry out research for the development or improvement of crops, and control of seed reproduction.
Lines of action:
• Forge agreements with universities and institutions of technological knowledge dissemination (the Agricultural Science and Technology Institute, ICTA, and the National Council and Secretariat of Science and Technology) for the development of an innovation and technology programme.
• Create a public-private institution to allow for the functioning of a permanent agricultural research system.
• Increase the budget assigned to ICTA through a request for financing to the Central American Agricultural Council, and review its regulations.
• Develop a legal framework to allow for the reproduction of genetic material and initiate and national germplasm evaluation programme as part of a national policy.

Strengthening value chains… 295
• Train and transfer knowledge and technology, based on the conclusions of agricultural research, to the participants of the various links of the chain.
• Promote the diversification of the chain’s products, among other things providing incentives for the production of organic products and oriental vegetables.
Strategy 3: Promote the national production of inputs.
Lines of action:
• Increase the value-added of the vegetables to make them more attractive to consumers, through more thorough preparation and the use of better packaging techniques.
• Conduct a feasibility study to identify inputs that could be produced in Guatemala.
• Develop programmes of support and incentives for national production to increase the value-added of the chain’s products.
Strategy 4: Compile better information on the current status of the non-traditional export vegetables chain.
• Conduct a nationwide survey to ascertain the innovation needs existing in the chain and, on the basis thereof, prepare an agribusiness policy to address current needs in terms of technological research, information systems, human resource formation and infrastructure, among others.
• Create a data bank containing information on professionals with different specializations.
• Unify and improve the statistics of the current information sources (Ministry of Agriculture and Food, National Institute of Statistics, Ministry of the Economy), by improving the data collection system.
• Create a register of all producers of non-traditional export vegetables, with a view to developing a work programme covering best practices, incentives, assistance, training programmes and other topics of interest.
• Develop a market information and integration system. Account will be taken of the National Markets Information and Integration System (SNIIM) of the Ministry of Economy of Mexico (http://www.economia-sniim.gob.mx/nuevo/) and the information system of United States Agriculture Department.

296 ECLAC
Programme 3
Objective: Improvement of access to the irrigation system and financing services.
This programme is targeted on the second link of the chain. Its specific objectives are to extend and rehabilitate the current irrigation system, and to create financing alternatives for small-scale producers.
Strategy 1: Facilitate access to agricultural credit.
Lines of action:
• Develop the capacity of financial institutions to understand the functioning of agricultural chains and create financial instruments that are suited to their reality.
• Create a system for rating the credit background of producer organizations.
• Forge partnerships between governmental, non-governmental and private institutions to expand alternatives for access to credit to small-scale producers.
Strategy 2: Improve the irrigation system.
Lines of action:
• Promote state participation in building the public infrastructure needed to extend irrigation areas and create water storage centres and pipelines.
• Promote the integrated management of irrigation water through investment projects that facilitate the rehabilitation and development of irrigation and drainage systems, and the adoption of measures leading to more efficient use of surface and ground water.
• Conduct feasibility studies in a number of rural areas, including the techniques of wheeled irrigation (from canals), along with droplet and spray irrigation.
• Evaluate the current irrigation system with a view to rehabilitating components that have fallen into disuse owing to lack of maintenance.
Programme 4
Objective: Develop the logistical aspects of the chain.
This programme is targeted on links three and four of the chain. Its specific objective is to reduce costs and shorten the timeframes for

Strengthening value chains… 297
processes involved in the exportation, importation and re-entry of the chain’s vegetables.
Strategy 1: Reduce maritime transport costs and seek alternatives.
Lines of action:
• Develop a national strategy to be applied jointly by the government and the private sector, to identify modes of negotiation with the shipping companies. The strategy could be based on a comparative study that makes it possible to identify monopoly practices in transport, and on the signing of a commitment between exporters to jointly negotiate transport fees and services with the international shipping companies.
• Facilitate the entry of new maritime-transport service providers.
• Perform a feasibility study on alternative transport routes to those currently being used. A review will be made of the case of the “Frío Aéreo” [Cold by Air] civil association of Peru, which carries asparagus exports, among other products.
Strategy 2: Update and amend the information provided by the customs services and their procedures.
Lines of action:
• Update information on pests and diseases, based on a study to be undertaken by a technical commission consisting of representatives of the public and private sectors, universities and regional organizations.
• Change administrative procedures for re-importing products into the country and for importing inputs, by reviewing and updating methods and criteria and the creation of a special technical commission of the Ministry of Agriculture and Food and the Superintendency of Tax Administration, to deal with special cases of importation.
Figure VI.7 sets out a scheme for weighting the strategies proposed on the basis of their estimated cost, timeframes and relative effects. The horizontal axis measures the effects that the application of a given strategy would have on the chain, whereas the vertical axis shows the progression of implementation timeframes. The size of the circles illustrates the estimated cost. Specifically, strategy 5 (Research and innovation) would have wide-ranging effects on the chain, would take along time to be executed, and would require more monetary resources. The objective of this figure is to give guidance to facilitate decision-making by chain participants. Initially, it was prepared by the author in conjunction with civil servants that fulfil

298 ECLAC
activities related to the chain. Subsequently, it was circulated in the second roundtable to be enhanced and adapted by chain participants according to their needs and knowledge.
Figure VI.7 Matrix of relative costs and effects
ImpactLow High
Short
Impl
emen
tatio
n pe
riod
Long
1 2
3
4
5 6
7
89
10
11
$ $ $ $Relative costs
Strategy
Source: Prepared by the author.
K. Conclusions
In general, the non-traditional export vegetables chain is very solid and has a number of constraints that could be overcome if its participants undertook to implement the proposed strategies. The chain forms part of one of Guatemala’s most important sectors in terms of job creation; and it is also a major source of foreign exchange for the country, given its clear orientation towards the foreign market. In fact, Guatemala is one of the leading exporters of broccoli and peas to the United States market.
The chain also suffers from significant constraints that undermine its competitiveness. Most of these affect the second, and most important, link of the chain, namely cultivation. These constraints include the failure by some producers to apply good agricultural practices consistently; the nonexistence of laboratories that could issue international certification and the high cost thereof; the lack of research and innovation activities and the low value-added of the vegetables; the limited coverage of the irrigation system; shortage of financing; high transport costs; slow and bureaucratic customs procedures and heavy reliance on imported inputs. Nonetheless, one of the most important constraints affecting the entire

Strengthening value chains… 299
chain is the lack of information about it. Overcoming this constraint is one of the key steps in formulating adequate policies to avoid duplication or coverage gaps in the programmes that are implemented.
The diagnostic study of the chain and the strategies proposed were presented to its participants in the two roundtables organized in conjunction with the Ministry of Economy. In a later stage of the process, it is hoped that the Ministry will assess which lines action could support the chain, in coordination with some of its participants, and launch an implementation programme in the near future. The remaining lines of action will constitute a “roadmap” for other chain participants to adopt and implement.
At the end of this exercise, it is hoped that the non-traditional export vegetable chain and all its links, particularly the second and third, will receive the government, financial and institutional support needed to function better and thus improve its economic and social situation. Another aim is to promote greater cooperation both between and within the links, to enable them to reduce costs and increase competitiveness. Lastly, it is hoped to adopt policies and measures that benefit all products included in this chain in equal measure.
Bibliography
AGREQUIMA (Guild of Agricultural Chemical Association) (2012), Impacto social y económico del sector agrícola guatemalteco sobre la economía nacional, Guatemala City, May.
Alvarado Mérida and Hugo Yovani (2003), Planeación de la producción de ejote francés (Phaseolus vulgaris L) y calabacines con organizaciones campesinas del occidente de Guatemala, Guatemala City, Institute for Agricultural Research, San Carlos de Guatemala University, November.
Angulo, José Eduardo (2007), “Estudios de caso para análisis de financiamiento de las cadenas agrícolas de valor”, Working Paper, No. 26, San Jose, International Fund for Agricultural Development/Regional Unit of Technical Assistance (RUTA)/Rural Financial Services Support Programme (SERFIRURAL), September.
Casasola Arriaza, Carlos (2004), Factibilidad de exportación del zucchini al sector hotelero de Cancún, Quintana Roo, Estados Unidos Mexicanos, Guatemala City, Faculty of Economic Sciences, Francisco Marroquin University.
CBI (Centre for the Promotion of Imports from Developing Countries) (2010), CV22 Vegetales fuera de temporada en Guatemala. Análisis de la cadena de valor, Rotterdam, Ministry of Foreign Affairs [online] http://www.cbi.eu/download/content/Export_Value_Chain_Analysis_Off-season_vegetables_Guatemala.pdf.
CropLife Latin America (2012), Curso para agroexportadores de frutas y hortalizas. Manual para el instructor [online] http://www.agrequima.com.gt/pdfs/manuales_cap/Manual_exportadores.pdf.

300 ECLAC
FAO (Food and Agriculture Organization of the United Nations) (2012), “Guatemala”, Boletín informativo [online] http://coin.fao.org/coin-static/cms/media/14/13534442000390/boletin_fao_gt_noviembre_2012lr.pdf.
(2005), The State of Food and Agriculture, 2005, Rome.INE (National Institute of Statistics) (2008), Encuesta Nacional Agropecuaria ENA 2008,
Guatemala City. (2004), IV Censo Nacional Agropecuario, 2002-2003, Guatemala City. World Bank (2010), “Desarrollo de PyMEes en Guatemala. Facilitando el
florecimiento de 10,000 empresas”, Report, No. 54242-GT, November.

Chapter VII
The wood-products value chain of the forestry concessions
of Petén, Guatemala
Mario A. Ricardo1
A. Introduction
The word “Guatemala” comes from the Náhuatl language and means “place of many trees”; and although several centuries have passed since the land was thus named, Guatemala still has one of the largest forestry endowments in Latin America and worldwide.
Against this backdrop, the present study analyses the value chain of wood products obtained from forestry concessions in the Department of Petén, Guatemala, as part of a technical cooperation process involving that country’s Ministry of Economy and the ECLAC Subregional Headquarters in Mexico.2
To undertake this study, the ECLAC team conducted a technical visit to Guatemala on 3-7 June 2013, which included two days in Petén and allowed interviews to be held with representatives from all of the links of the value chain, and with the staff of local and national institutions directly
1 The author is grateful for collaboration from Evelyn Roxana Guiñonez Carrera and information provided to undertake this study.
2 The Ministry of Economy of Guatemala is implementing the project to strengthen the productivity of micro, small and medium-size enterprises, the main objective of which is to increase productive and competitive capacity in rural areas.

302 ECLAC
and indirectly related to the forestry sector. The visit also made it possible to compare information compiled from a consultation of available literature on the subject, produced by both national and international organizations.
In addition, and in accordance with the methodology applied to strengthen value chains (see chapter II), two roundtables were held in Guatemala City on 5 September and 8 November 2013. Participants included representatives from the public sector and from all links of the chain, thereby making it possible to validate the results of the diagnostic study and the strategy proposals that were formulated.
The opening sections of this chapter provide a general description of the forestry situation in Guatemala, its forestry industry, and the concessions model under which the chain operates. It then goes on to describe the value chain, based on an analysis of its links and stakeholders. After that, it analyses the chain’s costs, profit margins and competitiveness, along with its markets, governance and environmental sustainability. Lastly, the chapter describes the main constraints affecting the chain and proposals for programmes and strategies to eliminate or alleviate them.
B. General features of the forestry situation in Guatemala
Central America has roughly 19.5 million ha of forest distributed across its seven countries: Belize, Costa Rica, El Salvador, Guatemala, Honduras, Nicaragua and Panama.
A recent study undertaken by the Food and Agriculture Organization of the United Nations (FAO) (2011), reports that the extent of forest cover in Central America has shrunk over the last two decades, and finds that the Caribbean is the only subregion in which forest cover has been expanding (see table VII.1).
Table VII.1 Extent of forest cover by region, 1990-2010
Area (thousands of ha)
Annual average change
(thousands of ha)
Annual average rate of change
1990 2000 2010 1990-2000 2000-2010
1990-2000
2000-2010
Central America 25 717 21 980 19 499 -374 -248 -1.56% -1.19%South America 946 454 904 322 864 351 -4 213 -3 997 -0.45% -0.45%Caribbean 5 901 6 433 6 932 53 50 0.87% 0.75%Total Latin America and the Caribbean 978 072 932 735 890 782 -4 534 -4 195 -0.47% -0.46%
World total 4 168 399 4 085 063 4 032 905 -8 334 -5 216 -0.20% -0.13%
Source: Food and Agriculture Organization of the United Nations (FAO), State of the World’s Forests, 2011, Rome, 2011.

Strengthening value chains… 303
Guatemala, the Central American country with the second-largest forested area, only surpassed by Honduras, is no exception to this situation. It has roughly 3.6 million ha of coniferous, deciduous and mixed forests, covering about 34% of national territory; but, along with Honduras and Nicaragua, it reports the highest rates of deforestation in Central America, and one of the highest anywhere in the world (see table VII.2).
Table VII.2 Central America: forest areas, 1990-2010
(Thousands of hectares)Forest cover in 2010 Annual average rate of change
Forest area
Percentage of total area
Forest area per 1,000
inhabitants1990-2000 2000-2010
Belize 1 393 61% 4 628 -10 -0.6% -10 -0.7%Costa Rica 2 605 51% 576 -19 -0.8% 23 0.9%El Salvador 287 14% 47 -5 -1.3% -5 -1.4%Guatemala 3 657 34% 267 -54 -1.2% -55 -1.4%Honduras 5 192 46% 709 -174 -2.4% -120 -2.1%Nicaragua 3 114 26% 549 -70 -1.7% -70 -2.0%Panama 3 251 44% 956 -42 -1.2% -12 -0.4%Total Central America 19 499 38% 475 -374 -1.6% -248 -1.2%
Source: Food and Agriculture Organization of the United Nations (FAO), State of the World’s Forests, 2011, Rome, 2011.
The main drivers of these rapid rates of deforestation are the use of wood as firewood (essentially as cooking fuel) and for industrial purposes; compounded by fires, pests and diseases; and natural mortality (see table VII.3). Whereas Costa Rica is the region’s leading producer of round wood and sawn lumber, forest burning in Guatemala is occurring at two or three times the rates in neighbouring countries.
Table VII.3 Central America: wood production, commercialization and consumption, 2010
(Thousands of cubic meters)Firewood Industrial round wood Sawn lumber
Pro
duct
ion
Impo
rts
Exp
orts
Con
sum
ptio
n
Pro
duct
ion
Impo
rts
Exp
orts
Con
sum
ptio
n
Pro
duct
ion
Impo
rts
Exp
orts
Con
sum
ptio
n
Belize 674 0 0 674 41 4 2 43 35 7 1 41Costa Rica 3 398 0 0 3 398 1 198 21 144 1 075 1 227 39 7 1 259El Salvador 4 217 0 0 4 217 682 0 28 654 16 31 0 47Guatemala 17 319 0 0 17 319 454 6 16 444 366 25 40 351Honduras 8 617 0 1 8 616 662 5 68 599 349 47 125 271Nicaragua 6 033 1 0 6 034 93 3 0 96 54 1 3 52Panama 1 158 0 0 1 158 151 6 80 77 9 7 16 0Total Central America 41 416 1 1 41 416 3 281 45 338 2 988 2 056 157 192 2 021
Source: Food and Agriculture Organization of the United Nations (FAO), State of the World’s Forests, 2011, Rome, 2011.

304 ECLAC
A study conducted by the Rafael Landívar University3 found that the unregulated exploitation of forests to extract firewood and timber is one of the main reasons for their shrinking volume. The estimates included in the “Integrated Forest Account”, supported by case studies undertaken in various of the country’s municipalities, show that over 95% of operations involving forestry products in Guatemala take place outside the jurisdiction of the relevant national authorities.
The increase in the unregulated traffic in forestry products is explained by the following factors: (i) lack of institutional capacity to directly control deforestation; (ii) lack of effective controls on the transport of forestry products; (iii) non-existence of an effective system for issuing permits to transport forestry products; (iv) the felling and trafficking of trees based on the misuse of permits granted for family use of forestry products; and (v) the lack of an effective system for controlling the volume of timber that is processed in the industries.
All of these factors promote the illegal extraction of forestry products; and they have a direct impact on natural forests and stifle any chance of consolidating lawful units of sustainable forestry management.
To reverse this situation, several measures have been adopted in Guatemala, including the establishment of a new environmental and forestry institutional framework, the launch of the National Forestry Incentives Programme (PINFOR) and the application of the community-concessions model in the Maya Biosphere Reserve (RBM) of Petén.
In general, the institutional framework governing forestry activities in Guatemala is based on a series of legislative instruments, particularly the Forestry Law (Legislative Decree 101-96) and the Law on Protected Areas (Legislative Decree 04-89), complemented indirectly by two Environmental Protection and Improvement Laws (Legislative Decree 68-86 and Legislative Decree 90-2000), the Urban and Rural Development Councils Law (Legislative Decree 11-2002), the Municipal Code (Legislative Decree 12-2002) and the General Law on Decentralization (Legislative Decree 14-2002). Public institutions concerned directly with the forestry sector include the National Forests Institute (INAB), the National Council for Protected Areas (CONAP) and the Ministry of Environment and Natural Resources, all of which collaborate with other ministries and both national and local institutions.
The PINFOR incentives programme was launched in 1996, following the passing of the current Forestry Law (Decree 101-96), which placed it under INAB management. This programme is one of the country’s forestry-policy instruments, defining incentives such as “the stimuli that the state gives to promote reforestation and the creation and/or sustainable
3 See BANGUAT/IARNA (2009).

Strengthening value chains… 305
management of forests”. Between 1998 and December 2009, incentives amounting to more than US$ 100 million were given, and a total of 88,503 ha of forestry plantation were established in the country (INAB, 2010). Thanks to the PINFOR programme, there are currently over 100,000 ha operating under these conditions.
This programme has four specific objectives: (i) to maintain and improve sustainable forestry production, by incorporating natural forests into productive economic activity; (ii) to incorporate suitable unforested land areas into forestry activity, by creating and maintaining forestry plantations or natural regeneration areas; (iii) to generate a critical mass of forests to produce raw material for the development of the forestry industry; and (iv) to provide incentives for maintaining natural forests to provide environmental services.
In addition to PINFOR, Guatemala has implemented two other incentive programmes over the last few years. One of these is the Direct Forestry Support Pilot Programme, which forms part of the Forestry Support Programme; it is implemented by the Ministry of Agriculture and Food, and targets its actions on the upper reaches of several watersheds located in the country’s central and western altiplano. The other is the Forestry Incentives Programme for Owners of Small Land Areas Suitable for Forestry or Agroforestry (PINPEP), which is being implemented by the INAB and targets small-scale proprietors and owners of land areas smaller than the 2 ha minimum specified for PINFOR. It is also aimed at persons who hold legitimate tenure of land areas but are unable to formally certify their ownership. In addition to encouraging new plantations and the management of natural forests, these two programmes stimulate tree-growing in the framework of agroforestry systems.
Other measures adopted by the Guatemalan government for the conservation and sustainable use of forestry resources include the establishment of the community concessions model in the Maya Biosphere Reserve of Petén, as described in the following section.
In Guatemala, timber has traditionally been the main product extracted from forests,4 for use as fuel or for industrial purposes. The records maintained by INAB and CONAP show that nearly half of the timber cut annually with authorization from these institutions is destined for industry, while the other half is used as fuel. In addition to this, illicitly harvested timber (illegal felling) is estimated to represent 30%-50% of the total volume harvested per year.
4 Other non-wood products are extracted from Guatemalan forest, mainly for food, medicine or an ornamental purposes. Examples include xate leaves, chicle gum, allspice and Maya nut (nuez de ramón).

306 ECLAC
C. The Guatemalan forestry industry
Guatemala’s forestry industry is distributed throughout national territory. In the departments of Guatemala, Chimaltenango, Quetzaltenango, Alta and Baja Verapaz and El Progreso, especially in the El Rancho zone, its activities consist essentially of conifer processing.
The production of sawn lumber from tropical species is clustered in the Petén region, mainly exploiting cedar, caoba and secondary species. There are also small enterprises that specialize in the processing of high-value timbers that are very scarce in the natural forests, such as rosewood (rosul), which is highly valued on the international market. In the south of the country, the industry is based on the processing of whitewood (palo blanco).
Guatemala’s forestry industry has traditionally made little use of logs with a diameter of less than 25 cm, since these are hard to exploit to the full. In recent years, however, smaller-diameter logs have increasingly been used to produce pallets; and incentives have been given for the creation of new enterprises using specialized machinery specifically to cut this type of log
The records of the Guatemalan Forestry Information System (SIFGUA) show that there were 1,679 firms registered and active in the sector in 2013 (see tables VII. 4 and VII.5).
According to INAB data, 70% of these firms are small or medium-sized enterprises (SMEs), generating 94,600 jobs in the forestry sector and 6,000 in the export sector, thus making a total of 100,600 formal jobs.
Table VII.4 Guatemala: forestry-sector firms listed in the National Forestry Register
Firms registered and active in the National Forestry register
Forestry firms 613
Forestry deposits 622
Exporters and importers 404
Forestry service providers 5
Nurseries 28
Extractors and collectors 2
Chainsaw vendors 5
Total 1 679
Source: Forest Information System of Guatemala (SIGFUA), “Sector Forestal de Guatemala”, 2013 [online] http://www.sifgua.org.gt/Paginasweb/Sectorforesdgua.aspx.
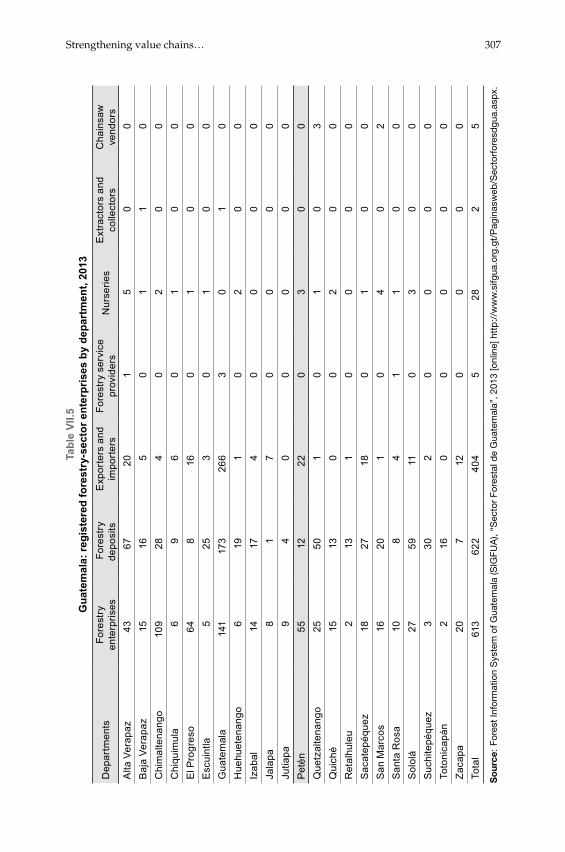
Strengthening value chains… 307
Tabl
e VI
I.5
Gua
tem
ala:
regi
ster
ed fo
rest
ry-s
ecto
r ent
erpr
ises
by
depa
rtm
ent,
2013
Dep
artm
ents
Fore
stry
en
terp
rises
For
estr
y de
posi
tsE
xpor
ters
and
im
port
ers
Fore
stry
ser
vice
pr
ovid
ers
Nur
serie
sE
xtra
ctor
s an
d co
llect
ors
Cha
insa
w
vend
ors
Alta
Ver
apaz
4367
201
50
0B
aja
Vera
paz
1516
50
11
0C
him
alte
nang
o10
928
40
20
0C
hiqu
imul
a6
96
01
00
El P
rogr
eso
648
160
10
0E
scui
ntla
525
30
10
0G
uate
mal
a14
117
326
63
01
0H
uehu
eten
ango
619
10
20
0Iz
abal
1417
40
00
0Ja
lapa
81
70
00
0Ju
tiapa
94
00
00
0P
etén
5512
220
30
0Q
uetz
alte
nang
o25
501
01
03
Qui
ché
1513
00
20
0R
etal
hule
u2
131
00
00
Sac
atep
éque
z18
2718
01
00
San
Mar
cos
1620
10
40
2S
anta
Ros
a10
84
11
00
Sol
olá
2759
110
30
0S
uchi
tepé
quez
330
20
00
0To
toni
capá
n2
160
00
00
Zaca
pa20
712
00
00
Tota
l 61
362
240
45
282
5
So
urce
: Fo
rest
Info
rmat
ion
Sys
tem
of G
uate
mal
a (S
IGFU
A),
“Sec
tor
Fore
stal
de
Gua
tem
ala”
, 201
3 [o
nlin
e] h
ttp
://w
ww
.sifg
ua.o
rg.g
t/P
agin
asw
eb/S
ecto
rfor
esd
gua.
asp
x.

308 ECLAC
Guatemala’s forestry industry mainly exports raw materials (sawn lumber), pallets, doors and furniture to the United States and other Central American countries (see table VII. 6 and figure VII.1).
Table VII.6 Guatemala: value of forestry-product exports, 2006-2012
(United States dollars)2006 2007 2008 2009 2010 2011 2012
Pallets 259 939.06 6 574 984.35 4 555 971.72 20 565 561.62 10 711 642.78 7 223 827.79 10 344 956.57 Sawn lumber 17 390 058.46 19 904 176.34 21 409 742.57 14 331 971.73 17 108 936.75 21 926 060.78 19 654 032.89
Furniture 18 723 732.16 17 295 785.96 16 235 098.96 12 238 363.65 17 706 242.56 22 314 002.84 29 525 378.46 Doors 7 138 553.22 14 943 217.00 11 033 348.16 6 767 617.10 7 257 299.67 10 564 892.71 15 510 814.86
Source: Single Export Window of Guatemala (VUPE) [online] http://portal.export.com.gt/Portal/Home.aspx?secid=161.
Figure VII.1 Guatemala: forestry-industry exports by destination country, 2012
(United States dollars)
5 000 000
10 000 000
15 000 000
20 000 000
25 000 000
El S
alva
dor
Hon
dura
sU
nite
d St
ates
Nic
arag
uaM
exic
oC
osta
Ric
aIta
lyPa
nam
aC
hina
Dom
inic
an R
ep.
Indi
a
Can
ada
Chi
le
Baha
mas
Viet
Nam
Taiw
an (P
rovi
nce
of C
hina
)Ja
pan
Gre
nada
Virg
in Is
land
sTr
inid
ad a
nd T
obag
oFr
ance
Free
zon
eSw
eden
Gua
delo
upe
Cur
açao
Uru
guay
Moz
ambi
que
Rep
ublic
of K
orea
Uni
ted
King
dom
Sing
apor
eSe
yche
lles
Arub
aBe
nin
Spai
nTa
nzan
iaBe
lize
Berm
udas
Antig
ua a
nd B
arbu
da
Vene
zuel
a (B
ol. R
ep. o
f)
Source: Single Export Window of Guatemala (VUPE) [online] http://portal.export.com.gt/Portal/Home.aspx?secid=161.
Guatemalan forestry production has grown at an average annual rate of 2% over the last decade, when it surpassed 35,000,000 m³ per year and represented roughly 1.5% of national GDP. In recent years, exports have been harmed by the international economic crisis.
Despite the importance of the forestry sector, wood-product imports exceed exports, including in the case of paper products.5 This shows that there is great potential for developing a larger-scale forestry industry
5 See Rainforest Alliance (2012).

Strengthening value chains… 309
in the country, among other reasons because there are large markets in neighbouring countries, especially Mexico, which are major importers of this type of product.6
The general level of productivity in Guatemalan forestry industry is not high; the sector operates with low levels of technology, lacks an accessible and stable supply of raw materials, and uses unskilled human resources. As a result, there is very little diversity of the products supplied, apart from the furniture industry, which accounts for less than 10% of production volume.
Guatemala’s production costs are well above those of most other timber-producing countries in the region, largely because of high transport costs caused by the poor state of road infrastructure and the distance between the forests and industries, compounded by technological factors and the small extent to which the timber is exploited in primary industry. Dalberg (2011) reports that wood production costs in Guatemala are 40% higher than in Costa Rica and 95% above those of Brazil and Chile.
There are also shortcomings in the linkage between production and marketing. Both the forestry market and the industrial market in Guatemala have weak links to domestic and international demand, so the lion’s share of exports traditionally consists of low value-added products.
D. The Petén forestry-concessions model7
Guatemala’s largest department, Petén, is located in the northern zone of the country. It borders to the east with Belize, to the north and west with Mexico and to the south with the departments of Alta Verapaz and Izabal.
Petén is estimated to contain some 300 species, of which at least 50 are suitable for timber, giving this department one of the country’s largest endowments of natural resources and forestry diversity. This invaluable wealth, mainly managed under a community-forest management model aimed at the conservation of natural resources, justifies studying the value chain of wood products obtained from the department’s forestry concessions. It also explains why the meta-objectives that have been defined point to increasing job creation in the zone, the strengthening of linkages between all links of the chain and between it and the rest of the country’s forestry sector, greater participation by SMEs related to the value chain and, hence, a positive effect on the level of exports from the chain and the country at large.
6 Ibid.7 See Ricardo (2013a), which contains the full version of the diagnostic study of the wood-
products chain of the Petén forestry concessions.

310 ECLAC
Petén covers an area of 35,854,000 km², of which 21,602.04 km² (about 60%) are in the Maya Biosphere Reserve (RBM), a zone devoted essentially to natural-forest conservation. Outside that protected area, and others officially included in the same category, various mainly agriculture- related productive activities are undertaken, such as the production of basic grains (maize and beans) and African palm, along with livestock breeding.
The RBM was established on 30 January 1990 and constitutes one of the 391 world biosphere reserves recognized in the UNESCO “Man and the Biosphere” programme. According to the international classification, it is a protected area which aims to reconcile use needs with those of conservation, by establishing zoning based on the type of interventions permitted. The RBM therefore consists of a core zone that prioritizes conservation, low-impact tourism and scientific research; and a multiple-use zone, in which there is authorization to undertake productive activities related to diversified forestry management, nature tourism, small-scale subsistence farming, and other activities that stabilize or increase forest cover. It also has a buffer zone, intended for the operation of family agro-forestry production systems, in which case the legalization of land plots is possible. The development of a network of tourism-related services is considered compatible with the RBM, but would require the establishment of basic infrastructure.
Several mechanisms applicable to the RBM and its constituent zones have been adopted. In the multiple-use zone, the main mechanism introduced consisted of concessions for the integrated management of renewable natural resources. The first of these was granted in 1994, four years after the creation of the reserve, and once the mechanism’s design and formalization phase had been completed. In the subsequent learning stage, which culminated in 1998, concession procedures were improved and their technical foundation was strengthened, so that seven years after the first, a further 13 concessions were granted, with a view to consolidating the process in the ensuing years, to bring it to full maturity.
The 14 concessions granted cover just over 530,000 ha, representing 67% of the multiple-use zone, 25% of the RBM and 4.9% of the country’s total area. Currently there are 11 concessions altogether, nine community and two private (see table VII.7 and map VII.1). Although it was impossible to obtain qualitative and quantitative information on each of the concessions, it is known that about 900 people work in them either permanently or temporarily, and roughly 8.5% of these are women.
In terms of the sustainable use of natural resources, the implementation of community forestry concessions has gained recognition worldwide as an innovative system for the management and exploitation of forests and their resources by local communities.
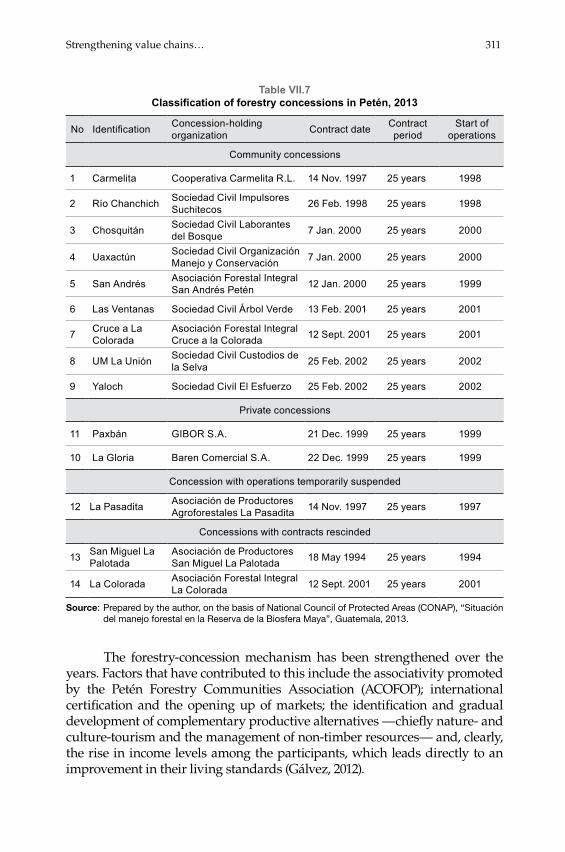
Strengthening value chains… 311
Table VII.7 Classification of forestry concessions in Petén, 2013
No Identification Concession-holding organization Contract date Contract
periodStart of
operations
Community concessions
1 Carmelita Cooperativa Carmelita R.L. 14 Nov. 1997 25 years 1998
2 Río Chanchich Sociedad Civil Impulsores Suchitecos 26 Feb. 1998 25 years 1998
3 Chosquitán Sociedad Civil Laborantes del Bosque 7 Jan. 2000 25 years 2000
4 Uaxactún Sociedad Civil Organización Manejo y Conservación 7 Jan. 2000 25 years 2000
5 San Andrés Asociación Forestal Integral San Andrés Petén 12 Jan. 2000 25 years 1999
6 Las Ventanas Sociedad Civil Árbol Verde 13 Feb. 2001 25 years 2001
7 Cruce a La Colorada
Asociación Forestal Integral Cruce a la Colorada 12 Sept. 2001 25 years 2001
8 UM La Unión Sociedad Civil Custodios de la Selva 25 Feb. 2002 25 years 2002
9 Yaloch Sociedad Civil El Esfuerzo 25 Feb. 2002 25 years 2002
Private concessions
11 Paxbán GIBOR S.A. 21 Dec. 1999 25 years 1999
10 La Gloria Baren Comercial S.A. 22 Dec. 1999 25 years 1999
Concession with operations temporarily suspended
12 La Pasadita Asociación de Productores Agroforestales La Pasadita 14 Nov. 1997 25 years 1997
Concessions with contracts rescinded
13 San Miguel La Palotada
Asociación de Productores San Miguel La Palotada 18 May 1994 25 years 1994
14 La Colorada Asociación Forestal Integral La Colorada 12 Sept. 2001 25 years 2001
Source: Prepared by the author, on the basis of National Council of Protected Areas (CONAP), “Situación del manejo forestal en la Reserva de la Biosfera Maya”, Guatemala, 2013.
The forestry-concession mechanism has been strengthened over the years. Factors that have contributed to this include the associativity promoted by the Petén Forestry Communities Association (ACOFOP); international certification and the opening up of markets; the identification and gradual development of complementary productive alternatives —chiefly nature- and culture-tourism and the management of non-timber resources— and, clearly, the rise in income levels among the participants, which leads directly to an improvement in their living standards (Gálvez, 2012).

312 ECLAC
Map VII.1 Maya Biosphere Reserve and forestry concessions in Petén
Mexico
Mexico
Mexico
Community concession
Cancelled community concessionIndustrial concession
Buffer zone
Multiple-use zone with no concessions
National park
Cultural monumentMunicipal reserve
Biotope
Sierra del Lacandón
National Park
Laguna del TigreNational Park
Buffer zone
PaxbánMirador - Río AzulNational Park
Mirador - Río AzulNational Park
San Andrés
Carmelita
La Gloria
San MiguelSan Miguel
La Colorada
Cruce a la Colorada
La Pasadita
San Andrés
Carmelita
La Colorada
Cruce a la Colorada
La PasaditaTikal
National Park
Flores
Uaxactún
LasVentanas
ChosquitánRío
ChanchichLa Unión
Yaloch
CulturalMonument
El Pilar
LasVentanas
ChosquitánRío
ChanchichLa Unión
Yaloch
Yaxhá Nakúm NaranjoNational
Park
Belize
Territorial difference pending resolution
South Petén protected areas
South Petén protected areas
N10 10 20 30 km0
Yaxhá Nakúm NaranjoNational
Park
Cultural Monument
El Pilar
Laguna del Tigre biotope - Río Escondido
Laguna del Tigre biotope - Río Escondido
Naachtún biotope - Dos Lagunas
Naachtún biotope - Dos Lagunas
Tikal
Yaxh
a biol
ogica
l corr
idor
Lagu
na de
l Tigr
e biological corridor
San Miguel la Palotada biotope - El Zotz
San Miguel la Palotada biotope - El Zotz
Source: Environmental Justice Forum of Guatemala.
Nonetheless, there are problems that need to be addressed. The organizational and business management capacity of the community concessions, their positioning and competitiveness in markets, and the diversification of the production of timber resources are issues that require further attention for this model to function optimally.
E. Identification of the value-chain’s products, services and participants
1. Description of the chain
As noted above, it is estimated that Petén has around 50 species suitable for wood production. Some of these, such as caoba and cedar, are widely known precious woods, protected by the Convention on the International Trade in Endangered Species of Wild Fauna and Flora (CITES).
Petén also has other species that are less well known, but have excellent properties making it possible to use them strategically to develop new products and markets, given that the extraction of precious woods is regulated. These include the manchiche, the Santa María tree and the pucté.

Strengthening value chains… 313
The five species mentioned constitute the source of most of the timber volume generated by the wood-product chain from the Petén forestry concessions (see table VII.8).
Table VII.8 Most representative species of Petén
Common name
Scientific name
Commercial name Characteristics of the wood Main uses
Caoba Swietenia macrophylla
Mahogany Reddish, salmon pink or yellowish when recently cut, darkening with time. Strong golden shine and very fine texture. Can easily be aired and kiln-dried, without warping. Easy to work, good final finish and highly durable.
Carpentry and cabinet-making (luxury articles), musical instruments, boats and sculptures.
Cedar Cedrella odorata
Spanishcedar
Pink to reddish-brown when recently cut, tending to red or dark reddish brown with time. Can easily be aired and oven-dried but warps slightly. Easy to work, but difficult to drill. Highly durable.
Carpentry and cabinet-making, musical instruments, boats and cigarette boxes.
Santa María
Calophyllum brasiliense
SantaMaría
Colour varying from pink to brick-red or reddish brown and yellowish. Medium and completely uniform texture. Difficult to dry in the air, and shrinks when kiln-dried. Easy to work but generally warps and splits when nailed. Medium durability.
Constructions, pallets, floors and exterior roofing.
Manchiche Lonchocarpus castilloi Standl
Guatemalan cherry
Yellowish brown or dark reddish colour, which degrades to a thick yellow. Moderately rough texture. Drying can be slow or rapid depending on the species. For satisfactory drying without excessive distortion or shrinking, the process needs to be slow. Despite its hardness, it has a smooth surface and is not hard to work, although it is difficult to nail. Highly durable.
Heavy constructions, pallets, floors, furniture parts and posts for railway lines.
Pucte Bucida buceras
Tropicalwalnut
Colour yellowish to greenish brown, with shades of olive. Medium texture with glossy longitudinal strips. Shrinks and warps on drying. Quite difficult to cut owing to its high density. Highly durable.
Highly valued for the effect of floors, post, railway line sleepers, benches and other durable objects.
Source: Prepared by the author.

314 ECLAC
Diagram VII.1 illustrates the links of the wood-production value chain of the Petén forestry concessions.
Diagram VII.1 Links of the Petén forestry concessions wood-products value chain
Processing MarketingSustainable management of the forest
Source: Prepared by the author.
The sustainable-management link encompasses all activities relating to the exploitation, recovery, protection and conservation of the natural forest. It requires prior formulation of a forestry management plan that takes account of all related activities, based on an inventory that makes it possible to analyse the structure of populations, the potential volume of wood products to be obtained, and the conditions of the ecosystem to be intervened in.
Given the wealth of Petén’s forests, sustainable-management plans are based on a system of selective felling, which takes account of factors such as the rotation cycle of the species in question (caoba and cedar have cycles of 20 to 30 years), the number of trees that can be extracted per hectare (in some cases just three trees per hectare), the minimum diameter needed for a tree to be felled (generally 60 cm) and the potential volume of extractable timber (on average 60%)
To restore the forest, is essential to prioritize natural revegetation, which entails carrying out parallel activities to ensure germination and optimal development of the trees. These include efficient thinning and pruning, timely clearing, the creation of fire-breaks and optimal control of pests and diseases.
The forest plays an important role in protecting the soil, water sources and ecological niches, so forest stewardship is a vital component of activities to promote its sustainable development. Special attention also needs to be paid to the cutting and use of roads and gaps in the forests, the transit of vehicles and machines, management of wastes of all kind and protection of fauna.
The function of forest stewards is a key element in this link of the chain. CONAP requires every concession to have a steward, otherwise the contract is rescinded; and this is also a requirement in concession-certification processes. Forest stewards direct operations and, in conjunction with the management of the concessions and the specialized professionals, they handle all forest-harvest processes. Most concessions currently have their own stewards; but those without use stewards contracted and coordinated by ACOFOP.

Strengthening value chains… 315
The processing link encompasses all activities involved in turning the logs into sawn lumber, including the following three:
• Debarking: This involves removing the bark from the round wood, using debarking tools or machetes. The process makes it possible to optimize the yield of the wood and helps maximize the useful life of the sawmill equipment.
• Sawing: Once the bark has been removed, the lumber is sawn in the concession’s sawmill production line. The different cuts that are made depend on the characteristics of the log and customer needs, and may include the use of an edger, a squaring saw, and a plank and board saw, and lastly, trimming. The final product consists of wood of different levels of quality, corresponding to the sawn lumber classification.
• Drying: The wood that emerges as the output of the sawmill is called saturated wood; its percentage humidity generally varies between 70% and 80%, and it must undergo a drying process in a ventilated space. This process makes it possible to reduce humidity to 12% or 14%, and its duration depends on the environmental conditions of the site, the season and the species. Some markets demand wood with a humidity level of 8% to 12%, which requires more costly kiln-drying processes. In general, the drying of the timber helps to prevent cracking and warping and the appearance fungi that can reduce quality.
In the processing link, it is important to distinguish between primary and secondary industry (see diagram VII.2).
Diagram VII.2 Processing link
Processing
Primary industry
Secondary industry
Includes activities in which wood products extracted directly from the forests are used as raw material. Characterized by the use of simple machinery for processing large volumes of timber and manufacturing highly standardized products.
Includes activities that add value to the products of primary industry. Involves the use of specialized machinery in industrial processes that focus mainly on the production of fine quality export products.
Source: Prepared by the author.

316 ECLAC
Primary industry predominates in Petén, while secondary industry basically consists of the two private concessions (GIBOR S.A. and Baren Comercial) and Empresa Comunitaria de Servicios del Bosque (FORESCOM), which operate under the RBM concessions model.
The industrial capacity of community concessions has grown in recent years, following the purchase of capital goods with income obtained from timber sales. Nearly all have extraction equipment and basic technology for primary processing, such as sawmills, and sawblade sharpeners and trimmers. Nonetheless, they do not have advanced technology that would enable them to add value to the timber, so they basically specialize in the industrial processing of larger-diameter logs. This is not the case in the two private concessions or FORESCOM, however, which do have a plant with technology enabling a then to add value to their production.
The leading markets for the products of primary industry are the United States and Guatemala’s neighbouring countries, particularly El Salvador, Honduras and Mexico. Part of the production is absorbed by domestic secondary industry for the manufacture of low-cost furniture, and by the construction industry which uses timber for various purposes, depending on the species.
Nonetheless, participants in domestic export-oriented secondary industry, particularly furniture- making, prefer to import the timber they need to ensure continuous supply and uniform quality, and to benefit from lower prices.
Lastly, the marketing link covers all activities related to the sale of timber and wood products produced in the previous link, both nationally and internationally.
Based on the information contained in the documents consulted and interviews held with representatives and managers of community forest concessions, it is estimated that about 80% of their production lacks value-added. In some cases, this reflects the fact that little or no activity is undertaken in the market intelligence area; and, in other cases, the fact that poor availability of working capital encourages sales of timber processed in the primary industry with low value-added at uncompetitive prices, to intermediaries who pre-finance the productive cycle. This suggests that the management practices applied are inconsistent with the purposes for which the community concessions were created.
The situation is very different in the two private concessions, because their varied high value-added products are sold both in Guatemala and abroad, and respond to market requirements.

Strengthening value chains… 317
Table VII.9 Products and services of the chain
Link Product or serviceSustainable management of the forest
Lumber
Primary industry Sawn lumberSecondary industry Value-added products (furniture, doors, pallets and floor boards,
among others)Marketing Connection of primary and secondary industries with customers
through the sale of products demanded on the market
Source: Prepared by the author.
The case of FORESCOM warrants special comment. This firm was created in 2003, as a joint venture by several RBM community concessions, with the strategic aim of consolidation through their collaboration (see table VII.10).
Table VII.10 Organizations affiliated to FORESCOM
Organization
Asociación Forestal Integral, San Andrés, Petén (AFISAP)
Cooperativa Integral de Comercialización Carmelita R.L. (“Carmelita”)
Sociedad Civil Laborantes del Bosque (“Laborantes”)
Sociedad Civil Custodios de la Selva (CUSTOSEL)
Sociedad Civil para el Desarrollo Árbol Verde (“Árbol verde”)
Sociedad Civil, Organización, Manejo y Conservación (OMYC)
Source: Empresa Comunitaria de Servicios del Bosque [online] www.forescom.com.gt.
The strategy applied in the creation of FORESCAM gave special importance to joint work involving blocks of concessions, given the small volume of certain species, to achieve economies of scale in areas such as secondary processing, management and certification.
This firm has certification from the Forest Stewardship Council (a non-governmental organization, or NGO),8 and heads the group responsible for the certification of forestry management in the concessions that are members of it. The fact that it also markets the timber produced by the communities has enabled it to identify new markets, establish connections between communities and buyers, and strengthen those that already existed.
8 The Forest Stewardship Council is an autonomous non-profit organization created in 1993, with headquarters in Bonn (Germany). Its mission is to promote the sustainable management of natural resources that provide ecological and social benefits, so its activities are mainly concerned with standardizing quality regulations worldwide.

318 ECLAC
FORESCOM has industrial equipment which enables it to incorporate high value-added to the timber it processes. The firm has moulding and planing equipment, a multiple saw, a computer numerically controlled (CNC) saw and other advanced equipment. It also has three 20,000-board- foot drying chambers, giving it much greater capacity than the other secondary industries in the zone.
Nonetheless, the firm’s capacity is underutilized; and a lack of working capital is possibly its Achilles heel. In addition, FORESCOM needs to gain the trust of the communities; and the latter, in turn, have to undertake to sell the timber they produce exclusively through FORESCOM. (Chemonics International BIOFOR, 2004). The current absence of a close strategic link between the firm and the concessions generates considerable uncertainty, which has a major financial impact and results in a loss of opportunities for all parties involved in.
2. Chain participants
The diagram below illustrates the wood-products chain and the key stakeholders linked directly or indirectly to it.
Diagram VII.3 General scheme of the chain and its participants
Other stakeholders and entities that provide support to the chain
Sustainable management of the forest
Inte
rmed
iarie
s
Primary industry
Secondary industry Customers Marketing
Input and equipment suppliers
Public organizations and others
Financial institutions
Instituciones educativas
Transport operators
Non-governmental organizations (NGOs)
Donors
Entidades certificadoras
Professional-service providers
Infrastructure-service providers
Source: Prepared by the author.
(a) Input and equipment suppliers
The chain’s main suppliers are the vendors of machinery, equipment and products used in carpentry for the finishing process.

Strengthening value chains… 319
The machinery and equipment used to process the timber is supplied by local and national suppliers, which also provide advisory and training services. These include firms of the Tecún Group, Nicol S.A., Herdom, San Roque, the Gama Group and Multisuministros Industriales Ltda. Most of these suppliers are headquartered in Guatemala City, and a few of them also have a representation in Petén. The inputs used in carpentry are generally obtained in hardware stores operating in the centre of la Flores, Petén’s departmental capital.
Most of the inputs and spare parts used by FORESCOM have to be imported from Brazil, Canada, the United States, Mexico and elsewhere, because there are no firms in Guatemala that supply the products in question with the necessary quality. This situation has a direct effect on production costs; and both the continuity of production and customer satisfaction are hampered by the fact that the delivery period can vary from 20 days to three months.
(b) Public and other organizations
Various agencies of public administration, both national and local, have dealings with the Petén wood-products chain, including the following:
The National Forest Institute (INAB), created under the Forestry Law (Decree 101-96, of 2 December 1996) as an autonomous and decentralized state entity, with its own legal status, capital and administrative autonomy. This agency is responsible for oversight issues and serves as the public agricultural sector’s competent authority on forestry matters.
The Institute’s main responsibilities include: (i) promoting and fostering the country’s forestry development through sustainable forest management; (ii) implementing forestry policies that achieve the law’s objectives; (iii) coordinating and implementing forestry development programmes, and providing incentives for and strengthening technical and professional careers in the forestry sector.
National Council for Protected Areas (CONAP), created through the Protected Areas Law (Decree 4-89). This organization, which has its own legal status, reports directly to the Office of the President of the Republic; it is responsible for the direction and coordination of the Guatemalan Protected Areas System (SIGAP), with jurisdiction throughout national territory, including Guatemala’s maritime coasts and airspace. The Council is an autonomous body, funded from an annual appropriation from the state budget, supplemented specific grants from individuals, countries, agencies and international organizations.
Its main objectives are to: (i) foster the conservation and improvement of Guatemala’s natural heritage; (ii) organize, direct

320 ECLAC
and develop the SIGAP; (iii) plan and implement a national strategy for the conservation of Guatemala’s renewable natural resources; and (iv) coordinate the management of the nation’s wild flora and fauna.
Petén Forest Communities Association (ACOFOP), created in 1997 as a non-profit organization, originally consisting of 22 organizations from 30 communities located in the multiple use zones and in the RBM buffer zone.
According to Gómez and Méndez (2007), the organization’s primary strategic goal is to promote the socioeconomic development of forest communities through the sustainable use of the forest. This objective is pursued in practice through the organization’s two main divisions: community development, which attends to strengthening social and human capital and advocacy work; and production promotion, in charge of the work related to forest management and biodiversity.
Ministries: Ministry of the Environment and Natural Resources; Ministry of Economy; and Ministry of Agriculture and Food.
In the control of activities forming part of the chain analysed in this study, other participants, in varying degrees, include the municipalities, the municipal forestry offices, the mayoralties and indigenous authorities, the Nature Protection Division (DIPRONA) of the National Civil Police, the departmental governors offices, civil society organizations and judicial bodies.
Mention should also be made of the Forestry Trade Association (Gremial Forestal) and the Forestry Cluster, although the latter only has direct links with the two private concessions. The Forestry Trade Association is a member of the Chamber of Industry and was founded in 1950 as a non-profit organization responsible for promoting the rational use of Guatemala’s forestry resources; it also acts as an information centre and provides services to its members. The Association comprises individuals or legal entities and forestry associations from the country’s various regions. Its activities include supporting its members, promoting production and exports, technology transfer, and participation in forums and the formulation of laws and regulations applicable to the sector.
The Forestry Cluster is a private forestry-sector grouping, comprising forestry workers, organizations and firms engaged in the processing and marketing of forest products, together with representatives of governmental organizations and authorities responsible for applying forestry policy. Its main function is to promote activities to raise the competitiveness of the forestry sector, under the cluster-development approach. It also strives to harmonize, guide and link forestry strategies and support their application, with a view to increasing local sales and exports of value-added products.

Strengthening value chains… 321
The cluster promotes activities to raise the competitiveness of forestry-sector enterprises, including those engaged in the production of seeds and plants, reforestation firms, primary and secondary industries, and marketing enterprises. It also helps integrate firms from related sectors and services and support.
(c) Professional-service providers
This category consists of organizations that provide professional services to the value chain in the areas of forest management, security,9 fire protection and legal advice, among others, in addition to forestry technical services. The organizations are highly varied, and all of them have to be authorized by the relevant supervisory agencies, as indicated in the preceding sections.
(d) Infrastructure-service providers
This category consists of entities that provide basic services, including port, communications and road services, either to the country or to the wider region.
Guatemala has a network of roads that connect its regions, ports and borders with Mexico and with the other Central American countries —a total of 15,187.7 km of paved roads of easy access for cargo and passenger transport. Over the last 15 years, the network has grown at a rate of 4% per year, which has involved significant improvements, including the construction of expressways and the four-lane expansion of the main highways leading to the border crossings.
In Petén the municipalities are responsible for executing infrastructure works, either directly or through subcontractor firms such as Dragados y Construcciones S.A. and Constructora Guerra, which undertake work on the main roads that link the different municipalities.
The forestry concessions are responsible for opening up access roads to the logging areas, and most of them have special equipment for this. The others contract firms such as Agrotropic and Productos de Petén.
The ports of Santo Tomás de Castilla and Barrios are 297 km from the capital, Guatemala City, while Puerto Quetzal is 98 km from the capital. There are over 30 shipping companies that provide maritime transport services to the leading ports around the world.
9 The Nature Protection Division (DIPRONA) of the National Civil Police plays a very important role in this area.

322 ECLAC
(e) Financial institutions
The fact that most concession contracts have now gone past the midpoint of their lifespan, or are close to it, creates uncertainty, because it is unknown whether the contract will be renewed. It also fuels mistrust which hinders long-term investments and restricts possibilities for gaining funding from the traditional banking sector which finances practically all working capital, infrastructure works and machinery and equipment purchase.
PINFOR has been the main source of credit for setting up forestry plantations. In addition, and under agreements between the international NGO Rainforest Alliance and the government, and in programmes such as those implemented by the Inter-American Development Bank (IDB) in conjunction with Grupo Financiero de Occidente (FIDOSA), medium-term financing mechanisms have been adopted along with technical assistance giving access to credit for the forestry sector. Nonetheless, concessions displaying a poor economic performance have slim chances of benefiting from such mechanisms.
The financial programmes mentioned above enable the concessions to access loans for investment, working capital, seed capital and the upgrading of productive infrastructure.
(f) Educational institutions
There are several educational institutions in Guatemala that train the technicians and professional workers needed in the forestry sector. The Central National School of Agriculture (ENCA) offers specialist technical courses leading to the qualifications of Forestry Expert and Technician in Conservation and Management of the Tropical Forest. University courses linked to the forestry sector include forestry engineering and engineering in renewable natural resources, which are given mainly at the Universidad San Carlos de Guatemala, the Petén Education Centre, the North-West University Centre and Universidad del Valle de Guatemala. INAB and the Agronomy Centre for Tropical Research and Education (CATIE) also offer specialized technical training courses.
Another education institution is the Technical Institute for Training and Productivity (INTECAP), which was founded in 1972 as a decentralized government agency providing training to workers, middle-managers and executives in different areas, and with a responsibility for disseminating leading-edge technologies. Nonetheless, in the case of the forestry sector, the institution has not kept at the technological forefront; and the training programmes it provides do not meet the needs of entrepreneurs because they are general and poorly specialized in processes that are crucial for the industry.
In addition, several national and international organizations support the forestry concessions through training and technical assistance; these

Strengthening value chains… 323
include including the Rainforest Alliance, the Wildlife Conservation Society, the Worldwide Fund for Nature, the International Union for Nature Conservation, ProPetén, Fundación Naturaleza para la Vida, ACOFOP, INAB and CONAP.
(g) Transport operators
A wide range of transport operators serve the Petén concessions. A study on wood-product value chains revealed the following facts about the transportation of forestry products in the zone: (i) there are at least 10 informal transport services; (ii) transport can be provided by any person involved in the production of small or large logs or sawn lumber; (iii) the transport operator is generally an independent small-scale business and; and (iv) the transport operator can also serve as intermediary between the producer and the processing chain, earning income as a vendor of the product (CATIE, 2012).
(h) Donors
International donors and cooperation agencies have had a major influence on conservation and development processes in Petén and on the constitution of the RBM; and their strategies and contributions have not only been varied, but have also evolved through time (Gómez and Méndez, 2007).
The United States Agency for International Development (USAID) has been the leading international donor, not only because of the financial support it has given to the RBM but also because of its contribution to designing the reserve’s institutional management structure. Other major donors have been the IDB and the German Development Bank (KfW). As of 2007, cumulative direct investment in the RBM exceeded US$ 92 million and came from USAID, the IDB and KfW, with counterpart funding from the Guatemalan government. In addition, the Ford Foundation invested US$ 470,000, and the Inter-Church Organization for Development Cooperation (ICCO) provided US$ 600,000 to support ACOFOP.
These figures do not represent the total amount of investments made in the zone, because other donors and foundations have also financed and continue to finance projects in Petén; but no reliable information is available on the size of their contributions (Gómez and Méndez, 2007).
(i) Non-governmental organizations (NGOs)
The role of NGOs in the RBM has changed over time. In the initial official model, these organizations were seen as supporting forestry concessions through technical cooperation. It was also stipulated that the NGOs, in conjunction with their national counterparts, would guarantee the conservation and management of forest.

324 ECLAC
Between 1993 and 2000, international NGOs devoted to environmental conservation collaborated with Guatemalan NGOs created specially to implement forestry management projects. In 2001-2004, an amended cooperation model was applied, whereby USAID channelled its support through the BIOFOR project implemented by Chemonics International.10
Broadly speaking, the change in the initial cooperation model reflected the fact that knowledge transfer was highly vertical, despite significant progress having been made in technical training. The working methodology and linkage between the NGOs and the population was heavily criticized as paternalistic and for preventing the development of community capacity for integrated forest management, administrative management and business management.
Moreover, the NGOs ended up replacing the communities in the decision-making process, competing with their management boards and restricting their access to key information. By taking charge of decision-making, these organizations also took control of the marketing of the timber, thus becoming intermediary enterprises engaged in the sale of products and services. This prevented the development of community capacity in the commercial area, because their members did not participate actively in negotiating the respective sale prices (Chemonics International BIOFOR, 2004).
There are still a large number of national and international NGOs operating in the RBM. These include the Centro Maya Association, ProPetén, the Rainforest Alliance, the Wildlife Conservation Society, the Balam Association and Fundación Naturaleza para la Vida, which have become providers of technical services to the community and private forestry concessions.
Although the work done in the RBM benefits all stakeholders, relations between community members and the NGOs are not always fluid, owing to the frictions that arose in the past and led to a change of the support model.
(j) Certification firms
In general, all firms that engage in sustainable-forestry-management activities benefit by having their production methods certified. Certification is issued in writing by an independent certification agency, indicating that the process meets the requirements demanded by certain organizations or countries to conserve biodiversity, protect the environment, guarantee product quality and improve the socioeconomic conditions of the producers. Guatemala’s forestry policy explicitly requires the government to promote certification as a mechanism to help the country’s forestry products penetrate the international market.
10 Chemonics International is an organization with activities in many countries which works with bilateral and multilateral donors and private sector entities to run capacity-building projects in developing countries. It was founded in 1975 and has its headquarters in Washington, D.C.

Strengthening value chains… 325
The Rainforest Alliance, the main organization of the Forest Stewardship Council (FSC) for certifying adequate forestry management practices, has been active in Guatemala for over 10 years. In 1989, it launched SmartWood, the first global programme of forestry certification and the first to harness market forces for forestry conservation.
FSC certification is based on an evaluation of the forestry management unit (forest or industry), and provides guarantees to the consumer that the forestry products being purchased come from forests that are being sustainably exploited. There are three types of certification: natural forest management, stewardship chain, and guidelines applied in the plantations. Thus far, the most common certification in Guatemala and throughout Central America is stewardship chain certification, which includes monitoring and certification of the process of transforming the timber from the felling of a tree in the forest through to the preparation of the final product sold to consumers on the retail or wholesale markets. By 2007, the Rainforest Alliance had certified practices applied in 478,000 ha of the RBM, representing 60% of the multiple-use zone and 23% of the total area of the reserve.
Forestry concessions are obliged to hold forest certification. The Rainforest Alliance provides support in four areas: sustainable forestry management, development of value-added products in concessions that engage in industrial activities, business management, and the marketing of forestry products
F. Costs, margins and competitiveness
When carrying out this study, it was impossible to obtain data on the costs, prices and profits of all organizations participating in the value chain; only specific data from certain concessions were available. Nonetheless, the information obtained by consulting studies done previously in Petén by other institutions, and comparing them with data obtained in the interviews held during the technical visit, revealed that transport and fuel expenses weigh most heavily on the chain’s production costs and significantly impair its competitiveness.
The entrepreneurs in the sector either provide transport directly from the forest to the primary industries, or else hire intermediaries, whose vehicle fleet in most cases is not in the best state of technical repair owing to the deterioration of the vehicles on the roads or tracks along which they travel.
Guatemala has a road network that provides several alternatives, but is inadequately maintained. This situation and the long distances that separate the forests from the industries, in many cases exceeding 100 km, significantly raise the cost of wood in the form of logs.
Transport from the primary industries to customers or points of sale is provided by the entrepreneurs, who in many cases have their own

326 ECLAC
vehicles. As happens almost throughout the forestry sector in Guatemala, transport in the area studied mostly involves trucks with a capacity of 7.5 to 10 metric tons. Freight charges vary considerably, depending above all on the age and efficiency of the vehicles. A 1999 study reported transport costs amounting to US$ 19 per metric ton, but which could fall to below US$ 13 if more efficient trucks were used. Transport is estimated to represent 25% of total production costs.
In another study performed in Petén 10 years later11 in deciduous forests, taking as a reference the planning of forestry and sawmill operations in 13 community enterprises, it was found that production costs amounted to US$ 134.08 per cubic metre and US$ 477.01 per hectare. Of these total amounts, US$ 94.15 and US$ 360.20 represented lumber extraction costs. In both cases, the latter accounted for over 70% of total production costs. Although the study does not indicate the exact share of transport in extraction costs, they have traditionally been the most significant item.
The extraction of forestry products uses both road and maritime transport, which charge very similar freight rates, so it is more economical to send products to certain Asian countries than to those of the Caribbean.
Diesel is the fuel most widely used in the concessions, which do not have electric power in the logging areas or in the sawmills.
Table VII.11 shows production costs per tablar foot (a unit of measurement equivalent to 0.00236 m³), estimated from information compiled in interviews held with the managers of several concessions and the analysis of their financial statements. As shown in the table, transport and fuel costs account for the lion’s share of variable production costs, along with labour, but the latter is considered an implicit cost of the production process.
Administrative overheads are the highest of all production costs. The cost of stewardship and certification is recorded in organizations that obtain certification on a group basis. In other cases, the cost increases by 30% approximately. Management staff costs can vary from one entity to another depending on its organizational structure.
Table VII.12 shows estimates of the average sale price per tablar foot of timber of the most representative species, classified by quality; the values are also based on information compiled in interviews held with managers and on the consultation of documents from certain concessions. This price can vary as a result of negotiations between the concessionaires and the buyers.
11 See Universidad Rafael Landívar (2009).

Strengthening value chains… 327
Table VII.11 Estimated production costs
(United States dollars)
Item Unit cost per tablar footTotal 1.520Fixed costs 0.680Stewardship and certification 0.047Management 0.445Fire control 0.134Depreciation 0.054Variable costs 0.790Formulation of the annual work plan 0.063Taxes 0.041Hire of front-loader 0.015Transport to the plants 0.125Maintenance of equipment 0.008Classification and packaging 0.001Fuels and lubricants 0.121Human resources 0.416Other 0.050Beneficial use fee and finance 0.007Contingencies and others 0.043
Source: Prepared by the author.
Table VII.12 Estimated average sale price
(United States dollars)No Species and products Unit price per tablar foot
Caoba1 Select 4.262 Common 1 1.463 Common 2 1.464 Common 3 1.465 Cuts 0.936 Reject 0.667 By-product 0.40
Cedar1 Select 2.662 Reject 0.663 By-product 0.40
Manchiche1 Select 1.602 Reject 0.663 By-product 0.40
Santa María1 Select 1.062 Reject 0.663 By-product 0.40
Pucté1 Select 1.462 Reject 0.663 By-product 0.40
Source: Prepared by the author.

328 ECLAC
Although the costs and sale prices quoted above are estimates that can vary from one concession to another, the analysis of the relation between costs and prices per tablar foot shows that the chain’s profit margins are not particularly high and that some products are not profitable at all. This in turn reveals the need for measures to reduce production costs, and to consolidate new sales strategies and optimal marketing channels to help make the chain more profitable.
G. Markets
The INAP strategy on the linkage between the forests, industry and the market correctly recognizes “the need to improve links between forest managers (production of raw materials), industry (primary and secondary, small, medium and large) and markets (national and international)”, as “a basic condition for invigorating local economies and boosting the supply of timber and non-timber resources being formed in the country” (INAB, 2012).
The weak links that exist between the three elements of the strategy is a feature of the context in which the chain operates. It is alarming that, despite the rich and varied forestry wealth existing in Petén and practically throughout Guatemala, and the application of sustainable exploitation programmes such as the concessions model in the RBM, the country’s forestry industry imports timber from neighbouring countries. This highlights the lack of solid and strategic integration between all actors involved directly or indirectly in the chain.
As noted above, a large proportion of the timber produced in most of the concessions, which is then processed in the chain’s primary industry, is sold with little value-added and at uncompetitive prices. Only part of that timber undergoes manufacturing processes in secondary industry, basically in FORESCOM, which, as also noted above, has spare processing capacity.12 Nonetheless, the demand for wood on the Guatemalan market is high, which means that its supply needs to adapt to the price, quality and volume conditions imposed by the national market, which in turn has to meet its customers’ needs.
The international market also offers possibilities for expansion of the timber chain, but the failure to apply market intelligence techniques, consistently and on a sustained basis, holds back exports and reduces the potential benefits of forestry activity for the local and national economy. This is reflected in export data for the last few years, which show that most exportable products, mainly sawn lumber and pallets, are of low value-added (see section B).
12 There were also no data on volumes produced by the chain’s primary and secondary industries.

Strengthening value chains… 329
Timber from species such as manchiche, pucté and Santa María, which are less well-known than caoba and cedar but also have excellent properties, are being marketed satisfactorily but in volumes well below their potential.
Other processes of crucial importance, both for expanding shares in current markets and for penetrating new ones, involve innovation leading to the development of new products, and the diversification of supply; but both of these are poorly developed in the community concessions. Only FORESCOM is exploring new markets and making new products in an innovative way; although activities of this type are also being carried on in the two private concessions with good results.
The key point is that Guatemala has forestry resources that are in demand nationally and internationally. So it should create mechanisms for their strategic exploitation and strengthen those that are already in place.
H. Governance
Chain governance, in terms of the capacity of one of its participants to determine, control and coordinate the activities of the others, is the weakness of the Petén forestry concessions wood-product chain. Although the organizations described above influence the value chain to a greater or lesser extent, levels of planning, coordination, monitoring and integrated control of all activities undertaken in the chain remain suboptimal. As a result of this, and compounded by weak internal links and major discoordination between the primary and secondary industry and deficient links with the rest of the Guatemalan forestry industry, intermediaries play a predominant role throughout the chain.
About 80% of the timber volume produced by primary industry is marketed through intermediaries. In many cases, these purchase a large volume of low value-added output either in advance or in the initial stages of each productive cycle; and, in some cases, they also provide transport services to the community concessions.
This arrangement calls for synergies between all chain participants in respect of its governance, through an organization that plans and controls all activities on an integrated basis, to ensure that their performance leads to genuine economic and social benefits for Petén and the country at large.
I. Environmental sustainability
The Petén forestry concessions wood-products chain is framed by the RBM community-forestry management model, which is recognized

330 ECLAC
internationally as one of the most effective ways of conserving natural resources. Nonetheless, there are conflicting opinions on the management of Petén’s forests, based mainly on environmentalist positions or reflecting points of view that focus exclusively on the economic interest represented by the zone’s forestry resources.
In the multiple-use zone of the reserve, in which the community-forestry concessions manage a large number of hectares, the positive effects on natural resource conservation are evident. A joint study performed in 2008 by USAID and the Rainforest Alliance compares the forest cover of concessions included in the RBM in 1985 with the situation existing in 2005. In 20 years, the forest cover of the territory operated by the concession only changed by 0.82%. CONAP records show that the annual rate of deforestation throughout the RBM between 2002 and 2007 was 20 times higher than in the concessions.
These figures clearly show the effects achieved by applying the concessions model. According to ACOFOP data for 2007, decreased rates of tree felling and the reduced impact of forest fires, together with the elimination of illegal settlements, are the main social and environmental achievements of community management, thanks to which family subsistence strategies are being reformulated and improved, by recognizing forests as their main natural asset.
CONAP estimates that the RBM had 118,000 inhabitants in 2012; and, according to its projections, the population of the rural communities will reach a level of 170,000 by 2020. Most of the current population is poor or extremely poor, so the forest and its products are an important means of livelihood.
Nonetheless, the current situation leaves a lot to be desired. The institutions involved in the planning and control of the activities undertaken in the concessions and throughout the RBM must continue their efforts to adopt a common vision and achieve solid sustainability. Reducing deforestation and forest fires must remain priority objectives, along with the control of tree felling and illicit trafficking in timber, the preservation of water sources and native fauna of the zone, and the prevention of pollution of all kinds, among other issues. All of these, combined with dynamics that impact the territory such as the opening up of new communication channels, drug trafficking, the advance of the agricultural frontier, the expansion of monocropping, extensive livestock breeding and oil activity, pose challenges to the environmental sustainability of the RBM, Petén and the chain analysed in this study.
J. Constraints affecting the value chain The diagnostic study of the current situation of the Petén forestry concessions’ wood-products value chain identifies various types of constraint, as listed below:

Strengthening value chains… 331
(i) (Integrated participation in the National Forestry Agenda at the regional, departmental and national levels remains suboptimal. Although various institutions have implemented and continue to implement programmes related directly or indirectly to the development of Petén and the forestry concessions wood-products chain, there is no common vision shared by all stakeholder organizations.13
(ii) There is a clear lack of articulation between the Petén forestry concessions wood- products chain and the Guatemalan forestry industry. There are various reasons for this, including the absence of a strategic framework that links them and takes account of quality, price and timeliness requirements.
(iii) There is no close linkage between the chain’s primary and secondary industries. FORESCOM, which constitutes the pillar of the community concessions’ secondary industry, has underutilized plant —mainly because of a lack of working capital and the weak strategic links that connect this firm to the community primary industry.
(iv) From the economic standpoint, the wood-products chain is uncompetitive, mainly owing to the low rate of exploitation of forestry resources, high transport costs and the shortcomings or obsolescence of the technology used in most of the community concessions.
(v) The information compiled in the review of documents on the subject and in the interviews held for this study, supported by sales estimates, suggest that about 80% of sales correspond to low value-added products at uncompetitive prices.
(vi) The workers in the concessions are relatively unskilled, and this has a negative effect on productivity growth. Moreover, the average level of technical and administrative training among employees responsible for decision-making in most of the concessions makes it hard to attain the desired level of competitiveness, since business success is directly proportional to skills, abilities, and the training of the work force as a whole.
(vii) Despite the adoption of specific product-innovation initiatives, neither innovation nor research practices are widespread throughout the chain; in fact FORESCOM and the private
13 Valuable work is currently being done by Guatemala’s Ministry of Planning and Programming (SEGEPLAN), aimed at preparing a strategic long-term development plan for the Petén zone (SEGEPLAN, 2013).

332 ECLAC
concessions are the only entities undertaking activities in this area. This shortcoming needs to be overcome, particularly with a view to processing smaller- diameter logs and improving knowledge of international trends in terms of requirements, standards, norms and the updating of production processes. Diversification based on innovation and the development of new products would have positive economic effects and help boost job creation in the zone.
(viii) Caoba has traditionally been the species most widely sold by the community concessions. Although the use of secondary species has increased in recent years, the adoption of strategic diversification measures is not yet generating the expected results.
(ix) In general, the lack of accumulated experience in market intelligence activities makes it impossible to base timber production and marketing strategies on sound knowledge of markets, customers, competitors, prices, products and trends worldwide. This situation hampers the economic growth of the chain, of Petén and of the Guatemalan forestry sector in general.
(x) In some concessions, growth is hampered by limited access to formal financing sources.
The study undertaken also revealed the existence of the systemic weaknesses listed below, which makes it hard for the chain to perform adequately:
(i) Uncertainty about the decisions that the Guatemalan government will take when the current concession periods expire is hindering the development of a joint vision and long-term strategy lines.
(ii) Although various programmes have been implemented to reduce deforestation in Petén’s forests, it is necessary to continue working proactively to that end and provide such programmes with the necessary follow-up.
(iii) (Although there has been a gradual reduction in illegal activities in the RBM since its creation, this continues to be a major impediment to the preservation of Petén’s forestry resources. Current forest-governance mechanisms do not yet guarantee the eradication of illegal activities or their reduction to minimal levels.

Strengthening value chains… 333
K. Strategies for improving the value chain14
Based on the diagnostic assessment of the value chain, validated by representatives of the public sector and all of the chain’s links in the first roundtable, and of the value-chain strengthening methodology (see chapters II and III), the following paragraphs list the strategies and programmes developed to eliminate or ease the constraints affecting the chain.
These programmes and strategies were also validated by representatives both of the public sector and of the links of the value chain in the second roundtable. They were formulated on the basis of a review and analysis of the best forestry practices, both national and international.
As noted in chapter II, the value-chain strengthening methodology makes it possible to analyse constraints at the micro level and to design specific and targeted strategies that can be replicated on a larger scale. Its usefulness for implementing industrial policies is demonstrated in the detailed list of programmes and lines of action set out below.
1. Programme 1: research, innovation and marketing of products from the Petén forestry concessions wood-products value chain
Objective: To promote research and innovation with a view to expanding the portfolios of high value-added products, improve marketing processes and increase the profitability of their productions.
Target public: Concession-holder organizations, FORESCOM, professional-service providers, educational and financial institutions linked to the chain, and government agencies.
Strategy 1: Conduct research on the organoleptic, physical and mechanical properties of the species comprising the concessions’ endowment of forestry resources, and identify new species with commercial potential.
Lines of action:
• Update the concessions’ forestry inventory, paying particular attention to the lesser-known species.
• Carry out a study, under a professional expert in timber resources, with the following aims in particular:
– Determine the organoleptic properties of the less well-known species, in other words properties related to the anatomical structure, and aesthetic aspects such as colour, grain and texture.
14 For a full discussion on this subject see Ricardo (2013a and b).
334 ECLAC
– Determine the physical and mechanical properties of the lesser-known species, in other words properties related to weight, resistance, reaction to drying, preservation, natural durability and malleability.
– Determine, according to the properties of the wood, its potential uses in the areas of construction and the manufacture of furniture and craft items, among others.
• Design criteria for selecting new species with commercial potential, based on the properties of their wood, their availability, the characteristics of the market and conditions existing in the concessions for their production.
• Hold a workshop with participation from key chain participants to select new species with commercial potential according to the established selection criteria.
• Design a kit of samples of the selected timber species, highlighting their organoleptic, physical and mechanical properties and potential uses, for promotion purposes.
Strategy 2: Increase the share of forestry-concession wood products in national and international markets using market-intelligence techniques.
Lines of action:
• Create a market-intelligence unit.
• Undertake market research, for both known and lesser-known species, to identify the requirements demanded at the nationally and internationally, market niches, potential customers, competitors, marketing channels, market profitability and other aspects.
• Design a forestry-concessions website to promote their wood products.
• Prepare printed and digital product catalogues to promote the products in the market.
• Disseminate the value-chain’s products in national and international trade fairs and business roadshows, with participation from representatives of prestigious wood-product value chains.
• Prepare a database containing full information on volumes by species, type of product, periods of availability of the species, distribution channels, prices, customers and buyers, among other things. This database would make it easier to monitor levels of commercialization of the concessions’ wood products and assist decision-making on the subject.

Strengthening value chains… 335
• Exchange experiences nationally with private-sector forestry firms, and also internationally with countries such as Brazil, Chile and Canada, to gain up-to-date knowledge of processes and procedures, technology and markets.
Strategy 3: Design and develop product prototypes and determine the financial viability of producing and marketing them.
Lines of action:
• Design prototypes of new products, prepared both with the lesser-known species and with those that have traditionally been used in the concessions, based on the market research undertaken.
• Calculate the costs and profitability of the prototypes designed, to determine the financial viability of their commercialization.
• Select the best prototypes to launch their production.
2. Programme 2: technical-vocational training
Objective: To increase the level of technical-vocational training of the work force in the Petén forestry concessions.
Target public: Concession-holder organizations, NGOs, educational and financial institutions linked to the chain and government agencies.
Strategy 1: Raise the technical and professional level of the forestry concessions’ labour force through training and technical assistance activities.
Lines of action:
• Perform a diagnostic study to evaluate the weaknesses and strengths of the concession organizations in terms of the technical level of their work force.
• Formulate a plan of action that includes training and technical-assistance modules aimed at technical upgrading of concession staff.
• Forge links with the Technical Institute of Training and Productivity for the formation and training of technicians in areas such as general carpentry, door-making, windows and furniture making, dowelling and carving, and so forth.
• Develop partnerships with universities, national NGOs and public training institutions, to update specialists’ skills according to the concessions’ needs.
• Import a training module on the standards applicable to the selection and classification of timber used in international trade

336 ECLAC
in tropical sawn wood, in accordance with the regulations on the classification of hardwoods of the National Hardwood Lumber Association in the United States, based on the clear-cuts yield system.
Strategy 2: Strengthen the capacity of the forestry concessions’ administrative staff by revising and improving administrative, accounting and financial policies and procedures.
Lines of action:
• Conduct an integrated diagnostic study of the administrative, accounting and financial policies and procedures applied in the concessions forming the value chain.
• Develop a improvements plan based on technical assistance provided by a professional expert to staff responsible for accounting and financial activity in the concessions. The system should focus on the preparation and management of cost and expenditure budgets, investment budgets, and cash and credit flow projections, among things.
• Implement training programmes for administrative staff on the use of accounting systems.
3. Programme 3: strengthening of the chain’s suppliers
Objective: To ensure the continuity of production and the fulfilment of quality requirements in the wood-products value chain, by forging new commercial links with input suppliers, and providers of infrastructure services and specialized technology.
Target public: Concession-holder organizations, input and service providers, financial institutions linked to the chain and government agencies.
Strategy 1: Forge strong commercial ties with firms that can satisfy the value chain’s annual equipment and supply needs for primary and secondary transformation processes.
Lines of action:
• Determine the annual demand for equipment, inputs and services in the concessions. This activity will be the responsibility of the managers, who will work in conjunction with staff responsible for the use and management of the industrial machinery in question. The estimation should cover a period of at least one year, because larger-volume purchases would provide an incentive to suppliers in a position to guarantee stable provision of quality supplies to meet the

Strengthening value chains… 337
chain’s needs. This planning system would also afford access to the after-sales services offered by prestigious suppliers, involving the provision of specialist technical assistance on the use of their inputs.
• Approach firms that could satisfy the concessions’ annual needs, prioritizing those specializing in the sale of chainsaws, blade sharpening equipment, mobile and portable sawmills and spare parts for sawmill equipment, and also targeting the suppliers of quality products for finishing and accessories such as varnishes, lacquers and veneers.
Strategy 2: Conduct a study on the transport system used by the forestry concessions, bearing in mind that some of them outsource the service of transporting lumber from the logging areas to the sawmills.
Lines of action:
• Research the supply of transport services existing on the market.
• Establish formal contracts for the supply of transport services with firms that genuinely guarantee competitive prices and a quality service.
• Conduct feasibility studies for the investment in transport equipment with funds obtained from bank loans.
• Design new transport strategies for the forestry concessions.
Strategy 3: Improve access routes to the forestry concessions and waste areas.
Lines of action:
• Set up strategic partnerships with the Ministry of Communications through the municipalities and development councils, to improve access roads to the forestry concessions.
• Identify, in conjunction with key value-chain participants, investment funds that could be drawn on to improve forestry concession access roads, and set up mechanisms for their effective management.
4. Programme 4: production processes and quality certifications
Objective: To raise the productivity and enhance the efficiency of wood-product production processes in the existing concession-holding organizations, in line with the quality standards demanded in the markets.

338 ECLAC
Target public: Concession-holder organizations, FORESCOM, input suppliers, NGOs, certification organizations and public-support institutions.
Strategy 1: Improve exploitation of the chain’s technological infrastructure.
Lines of action:
• Make a general diagnostic assessment of production processes in the sawmill, identify critical quality points and prepare a corrective plan action to overcome the problems identified.
• Strengthen the technical capacities of workers in the raw materials processing area, by providing training on the adequate use of machinery and corresponding equipment.
• Measure capacities for storing the chain’s products, identify mechanisms for their optimal use, and take this factor into account in production planning.
Strategy 2: Periodically update machinery and production processes.
Lines of action:
• Improve processes for blade sharpening, sawing, and drying of the raw material to fulfil the quality requirements imposed by the markets.
• Train personnel responsible for maintaining the machinery and equipment used in timber processing.
• Seek investment alternatives for the purchase of new industrial machinery with leading-edge technology, with the aim of raising productivity.
Strategy 3: Design strategies to obtain new forestry certifications for the activities of the value chain.
Although all chain organizations are currently certified by the Forest Stewardship Council, the obtaining of new certifications would make it possible to access new market niche, where certification of the management and conservation of natural resources is a source of value-added.
Lines of action:
• Develop and implement a plan for the monitoring of certification processes and the renewal of previously granted certifications.
• Provide training to concession members to enable them to obtain operating and export licences, and eliminate the non-conformities detected in previous certifications.

Strengthening value chains… 339
• Identify certifications that make it possible to access market niches that offer better prices for new product lines, made with known and lesser-known species. Such certifications would be added to those already granted by the Forest Stewardship Council.
• Determine the procedures needed to start the necessary certification processes, and their costs.
• Publish the certifications of products over the Internet and in relevant forums.
5. Programme 5: strengthening of the community forest service enterprise (FORESCOM)
Objective: To strengthen the performance of FORESCOM, by improving its technological infrastructure and linkage with community organizations, and by increasing its participation in national and international wood-product markets.
Target public: FORESCOM, concession-holder organizations, input suppliers, financial institutions and public support agencies.
Strategy 1: Expand the use of the technological capacity installed in FORESCOM.
Lines of action:
• Determine the installed capacity of the FORESCOM plant.
• Analyse the possibility of making investments to improve FORESCOM’s technological infrastructure, to enable it to increase productivity and provide better services to the components of the value chain.
Strategy 2: Establish formal productive links between FORESCOM and all forestry concessions in Petén.
Lines of action:
• Develop and implement a programme to promote the services that FORESCOM can offer to the concessions (drying, mould manufacture, group certification and others).
• Make a study of the productive needs of all forestry concessions, to serve as a basis for a FORESCOM load-capacity balance.
• Design formal instruments to regulate the productive linkages between FORESCOM and the forestry concessions.

340 ECLAC
• Improve the mechanisms through which information is shared between FORESCOM and the forestry concessions, so that both parties can plan and optimally manage their annual production.
Strategy 3: Strengthen the line of products that FORESCOM has started introducing the European market and expand its product portfolio.
Lines of action:
• Provide support as necessary to the new product lines that FORESCOM has started to introduce on the European market, and make sure the firm shares its experience in this field with the community concessions.
• Design new product lines, develop prototypes and analyse their financial viability.
6. Programme 6: value-chain governance
Objective: To strengthen the links between the participants of the wood-products value chain by developing an interagency network
Target public: Concession-holder organizations, professional-service providers, FORESCOM, ACOFOP, CONAP, INAB, the Ministry of the Economy, the Ministry of Agriculture and Food, other public support institutions and non-governmental organizations
Strategy 1: Set up the value-chain roundtable
Lines of action:
• Setup the value-chain roundtable in which all key players identified in the diagnostic study participate. This roundtable could be a continuation of the those held as part of this study.
• Define the legal foundation, regulations and statutes, governance system and strategic and operational plans of the roundtable, and set up committees as deemed necessary.
Strategy 2: Promote the adoption of the chain’s regulatory policies that make it possible to increase competitiveness.
Lines of action:
• Lobby the relevant entities of the Guatemalan government through the roundtable, to adopt policies including tax incentives for the development of new products made from lesser-known species, policies for preferential purchase of value-chain products, and other policies that help increase the value chain’s competitiveness.

Strengthening value chains… 341
• Design strategies in conjunction with the financial-services provider Grupo Financiero de Occidente or other financial entities that help arrange credit for concessions that do not yet have access to it.
Strategy 3: Foster the integration of the legal instruments governing the forestry concessions, to facilitate management and capacity-building, and to take advantage of tax incentives.
Lines of action:
• Conduct an analytical study of the different legal instruments existing in the country. The concessions operate under different corporate structures (association, civil society and others) which makes it difficult to train, standardize and use planning and control tools.
• Analyse the feasibility of adopting new corporate structures, including cooperative and federation.
Strategy 4: Create a roundtable committee to combat illegal operations.
Lines of action:
• Create a committee to combat illegal operations, involving representatives from all concessions and from the institutions that provide them with support (suppliers of professional and security services, ACOFOP, CONAP, INAB, Ministry of the Economy, the Ministry of Agriculture and Food, the Ministry of the Environment and Natural Resources, NGOs, the Ministry of the Interior (Ministerio de Gobernación) and other government agencies).
• Draft and formalize the regulations, standards and functions of the committee in relation to combating the illegal extraction and trafficking in timber, halting the advance of the agricultural frontier and other activities that endanger the conservation of the Maya Biosphere Reserve.
• Improve the scanning system or the stewardship chain by using a barcode to prevent the falsification of permits and authorizations for timber extraction.
Figure VII.2 provides a tool for assessing the proposed strategies, based on their implementation periods, impact and relative costs. This tool was used in the second roundtable by representatives of the public sector and of the links of the value chain, to jointly determine priorities in the proposed strategies, considering each one’s importance and viability.

342 ECLAC
FigureVII.2 Matrix of effects, implementation periods and relative costs
$ $ $ $Relative costs
Impl
emen
tatio
n pe
riod
6
2
4
5
Impact HighLow
Short
Long
1
3
P1-Research, innovation and marketingP2-TrainingP3-Suppliers
P4-Production and quality processesP5-FORESCOMP6-Governance
Source: Prepared by the author.
L. Conclusions
This study, based on the diagnostic assessment and strengthening of the wood products value chain of the Department of Petén, illustrates the effectiveness of the methodology developed by the ECLAC Subregional Headquarters in Mexico to strengthen value chains in Central America.
The diagnostic assessment identified different kinds of constraint affecting the value chain. The lack of articulation between the chain and the rest of the national forestry industry, discoordination between primary and secondary industries, technological shortcomings, the low skill-level of the labour force, lack of financial instruments designed for all organizations comprising the chain, poor application of research and innovation practices, and the prevalence of low value-added products are some of the factors that hamper its performance. Moreover, the weakness of linkages between all stakeholders the chain, in terms of the planning, implementation, monitoring and control of operations, make it impossible to generate the synergies needed to achieve the expected competitive level.
The formulation of strengthening programmes and strategies, based on the analysis of international best practices applicable to the forestry sector, provides the Ministry of Economy of Guatemala with a road map for planning and implementing activities that help the value chain meet international forestry-market requirements, and thus have a positive effect on the economic and social development of the Department of Petén and the country at large.

Strengthening value chains… 343
The study also provides a very useful tool for the government of Guatemala, NGOs, international cooperation organizations and other organizations involved in the Petén forestry concessions wood-products chain, to contribute to its strengthening under a systemic and integrated approach.
Bibliography
BANGUAT/IARNA (Bank of Guatemala/Institute of Agriculture, Natural Resources and Environment, Universidad Rafael Landívar) (2009), “Cuenta integrada del bosque (CIB). Sistema de Contabilidad Ambiental y Económica Integrada de Guatemala”, Serie divulgativa, No. 7, Guatemala City.
CATIE (Tropical Agricultural Research and Training Centre) (2012), “Evaluación de las condiciones para el desarrollo de un núcleo foresto-industrial en la región de Petén”, Guatemala City, unpublished.
Chemonics International BIOFOR (2004), Análisis de oferta y demanda de productos forestales de las concesiones comunitarias del Petén, Guatemala City.
CONAP (National Council of Protected Areas) (2013), “Situación del manejo forestal en la Reserva de la Biosfera Maya”, Guatemala City.
CONAP/INAB/MAGA (National Council of Protected Areas/National Institute of Forestry/ Ministry of Agriculture, Cattle and Food) (n/d), Política forestal de Guatemala, Guatemala City.
Dalberg (2011), ISDE Forestal. Análisis sectorial enfocado en oportunidades [online] http://www.mejoremosguate.org/cms/content/files/biblioteca/Estrategia_Forestal_y_muebles.pdf.
FAO (Food and Agriculture Organization of the United Nations) (2011), State of the World’s Forests, 2011, Rome.
Gálvez, J. (2012), “Concesiones forestales en Petén” [online] http://www.plazapublica.com.gt/content/concesiones-forestales-en-peten.
Gómez, Ileana and V. Ernesto Méndez (2007), El caso de la Asociación de Co-munidades Forestales de Petén (ACOFOP). Análisis de contexto, Jakarta.
INAB (National Institute of Forestry) (2012), “Estrategia de vinculación bosque–industria–mercado. Propuesta”, Guatemala City.
(2010), “Análisis retrospectivo (1997-2009) y prospectivo (2010-2033) del impacto económico del Programa de Incentivos Forestales (PINFOR) a la economía nacional” [online] http://www.sifgua.org.gt/Documentos/Otros/Cuaderno%20de%20Estudio%20economico%20del%20PINFOR.pdf.
Inversiones y Desarrollo de Centroamérica (1999), “Diagnóstico del cluster forestal”, Guatemala City.
Maas, I. and A. Solórzano (2010), “Mapeo de actores del sector forestal guatemalteco”, Guatemala City.
MINECO (Ministry of Economic Affairs) (2012), “Agenda Nacional de Competitividad”, Guatemala City.
Rafael Landívar University (2009), “Análisis costo/beneficio de las actividades de la ilegalidad en el sector forestal y una propuesta para mejorar y fortalecer los mecanismos de gestión en el INAB en función del control forestal” [online] http://www.profor.info/sites/profor.info/files/publication/Guatemala-forestfees.pdf.

344 ECLAC
Rainforest Alliance (2012), “Estudio mapeo canales regionales de comercialización de productos certificados. Resultados finales”, unpublished.
Ricardo, Mario (2013a), “Diagnóstico de la cadena de valor de productos maderables de las concesiones forestales del departamento de Petén de Guatemala”, Mexico City, ECLAC subregional headquarters in Mexico/German Agency for International Cooperation (GIZ), unpublished.
(2013b), “Estrategias y buenas prácticas para el fortalecimiento de la cadena de valor de los productos maderables de las concesiones forestales del departamento de Petén de Guatemala”, Mexico City, ECLAC subregional headquarters in Mexico/German Agency for International Cooperartion, unpublished.
SEGEPLAN (Secretariat of the National Economic Planning Council) (2013), Diagnóstico territorial de Petén. Plan de Desarrollo Integral de Petén 2032, Guatemala City.

Chapter VIII
Comparative analysis of value chain strengthening processes
and final remarks
Jorge Mario Martínez Piva Nahuel Oddone
Ramón Padilla Pérez
Set out in this closing chapter is a discussion on strengthening value chain processes in El Salvador and Guatemala, along with a comparative analysis of the chains reviewed. Section A looks at what the value chain methodology has contributed to industrial policy implementation. Section B summarizes the best practices identified and lessons learned. Section C outlines the results and highlights the findings of the diagnostic studies, as well as the strategies proposed. Section D looks at a set of strategies proposed for the four chains. Future lines of research are described in section E.
A. Value chains as a key element of inclusive industrial policy
Like all of Latin America, Central America is hampered by lagging productivity growth, widening production heterogeneity and difficulties in linking its small and medium-sized enterprises to more dynamic segments of the economy. ECLAC has argued that boosting productivity is of paramount importance for the development of countries because it is an ideal way to increase the level of income of the population. The production

346 ECLAC
sector must therefore refine its methods through innovation, and the countries must take measures to steadily raise the value added of the goods and services they produce (ECLAC, 2012; ECLAC, 2013b). Achieving structural change through activities that have a higher productivity rate, are more technological knowledge-intensive and increasingly involve small enterprises calls for active and integrated public policies. This study describes the support provided by ECLAC to El Salvador and Guatemala in designing industrial or productive development policy.
Such a policy must be put in place in the current context of open economies and multilateral and bilateral trade agreements, which limit the tools available for designing and implementing it. However, the industrial policy described herein shows that the State can take measures now to promote the development of specific activities that are not confined to the industrial sector but rather extend to the primary and service sectors. Within a general framework of respect for the principal macroeconomic equilibria and multilateral trade agreements, countries have at their disposal a wide range of tools for increasing productivity, strengthening value chains and expanding the participation of smaller enterprises.
The methodology developed under the joint project between ECLAC and the German Agency for International Cooperation (GIZ) focuses on identifying the bottlenecks and barriers that are holding back efforts to improve productivity of a number of value chain links, focused on boosting productivity not only of each link but of entire chains. This methodology made it possible to identify public-private strategies for overcoming existing obstacles through, among other things, product and process innovation, quality improvement, business capacity building and enhanced competiveness, dissemination of market information and export promotion.
The methodology also allows for a detailed analysis of bottlenecks, in close collaboration with the components of each link in the chain, including producers and other private sector actors, the Government agencies involved and academia. After bottleneck identification comes research into international best practices (benchmarks), which are essential for designing strategies to boost competitiveness. Both the assessment and the strategies are validated in conjunction with stakeholders and, if possible, a road map is drawn up for public-private action to overcome constraints and make the chain more competitive (see chapter II).
The methodology described has four major strengths. First, it allows for in-depth microeconomic analysis, both when assessing the value chain and when proposing strategies. This microeconomic approach can pinpoint bottlenecks in specific links, and it can spot missing and weak links. Sector-level assessments are too aggregated to yield this information, which is crucial in designing targeted strategies. In addition, this approach

Strengthening value chains… 347
facilitates the design of programmes for bringing small enterprises into the production process, specifically by identifying the links in which they could be inserted.
Second, the methodology makes the entire process highly participatory. A key part of the work that ECLAC conducted in El Salvador and Guatemala was the organization of stakeholder dialogues to discuss and validate the assessment and the strategies proposed. The roundtables brought together value chain components (producers, intermediaries, suppliers of inputs and services, wholesalers and retailers, among others), representatives of relevant Government agencies (such as ministries of economy, environment, education, science and technology, agriculture and health), non-governmental organizations, universities and environmental certification agencies. Roundtables provide a transparent mechanism for analysis and decision-making leading to adoption of public-private sector agreements.
As for the diagnostic studies, the stakeholder dialogues have the following objectives: (i) validate and enrich the analysis of the current situation in the chain; (ii) ensure that all constraints weighing on the chain have been considered; and (iii) verify that insignificant constraints are not included. The goals related to strategies are as follows: (i) validate and enrich strategies for strengthening the chain; (ii) maintain constructive and respectful dialogue on multiple stakeholder viewpoints; and (iii) create the necessary conditions for reaching public-private sector agreements aimed at implementing agreed strategies. Each public-private stakeholder dialogue is unique, given the different levels of representativeness of the participants in the chain. This means that this dimension of horizontal governance of the dialogue process is determined by potential agreements or conflicts within every link or among them. It is therefore important that whoever is the mediator be able to negotiate and be very familiar with the chain in order to facilitate adoption of agreements.
Third, the methodology aims to develop local capacities. Government officials were actively involved throughout the process, as were, in some cases, representatives of private organizations such as chambers of business. All of them provided information for the diagnostic studies, advised the field-study team, supported the organization of stakeholder dialogues and provided inputs for formulating strategies. Workshops were held to transfer the methodology designed by ECLAC, with a view to implementing it in future activities of the respective ministries of economy aimed at strengthening value chains. Indeed, governments have expressed their interest in new projects with ECLAC in an advisory role, with a view to entrenching the skills acquired.
Fourth, the ECLAC methodology is based on a systemic approach to industrial policy. Supporting chains does not focus exclusively, as is

348 ECLAC
often the case, on the main link (producers of final goods and services) but also on suppliers of inputs, equipment, services (quality assurance, diffusion of new technologies and transport, among others) and marketing. Strengthening the chain requires bolstering each one of the links, consolidating relations between them and enhancing the capacities of the institutions supporting them (among them, universities, research centres, chambers of business and certification agencies).
Designing public interventions in value chains is a very useful strategy that facilitates implementation of industrial and productive development policies because it can provide a strategic focus for investments aimed at overcoming constraints affecting every link, help to organize and systematize public interventions in order of priority in agreement with private sector actors and facilitate coordinated action by public entities that support the chain.
Strategies must be complemented by policy instruments in spheres such as science and technology, education and training, foreign direct investment attraction and public procurement. The real potential for strengthening or scaling up also depends on macroeconomic and institutional stability in each country, the institutional framework for economic activities, access to international markets and the existence of a supporting infrastructure.
Lastly, within the broad range of existing industrial policy instruments, the one discussed in this case does not seek to create new sectors or branches of economic activity. The approach to strengthening value chains is based on existing economic activities, seeking to support them through increased productivity, innovation, internationalization and the generation of better jobs and greater national value added. As for policies aimed at establishing new manufacturing sectors (also of great importance for structural change), an alternative approach is needed.
B. Best practices and lessons learned
International experience in the design and implementation of industrial policies in recent decades has seen many successes and failures. In the past, these policies were usually sectoral and focused on promoting exports, supporting food industries and fostering strategic sectors such as energy and transport. They sparked much criticism, precisely because they were indiscriminate. By contrast, the new industrial policies being implemented in Central America are microeconomic: they are applied at the level of individual links in the chain. It is possible to draw a number of lessons that should be taken into account for similar processes in the future.

Strengthening value chains… 349
One best practice identified during the project is active involvement of the private sector, through trade associations and chambers of business. Involvement throughout the process facilitates access to information for diagnostic reviews, makes stakeholder dialogues more representative and strengthens public-private partnerships.
Active Government participation is essential too, through a focal point with enough authority to convene other public officials and coordinate State institutions. To address bottlenecks affecting specific links it is often necessary to gather authorities from a wide range of spheres (security, customs, transport, health, environment and others).
In projects like the one described herein, the contribution of the private sector can be coordinated through the same focal point designated by the Government. It has also been sound practice to ask for support from business organizations comprising companies that are part of value chains because they have useful information, know how the chain works and are crucial for decision-making.
Public and private entities have also made substantial financial or in-kind contributions. But it is not enough that these complement the financial contribution coming from international cooperation: it is also important that a country’s organizations and individuals be involved in the process. Local support came in the form of providing logistical services such as transport for diagnostic studies (field visits), organizing stakeholder dialogues and related activities and providing or leasing places to work, among others. In some cases, to boost the participation of small producers and enterprises in the different phases of the process, they must be provided with means to send their representatives, which can be very costly. Such support is critical in value chains whose components are widely dispersed geographically, far from the capital city and other metropolitan areas.
Implementing and funding strategies for strengthening the chain benefit from synergies with other public programmes carried out with funding from domestic sources, international loans and international cooperation or private investment. The interest of public and private institutions in optimizing the use of those resources not only encourages integration into the strategy assessment and design process but also facilitates follow-up of agreements reached.
A thorough understanding of the subject industry is a must for the detailed analysis of value chains, identifying best international practices and laying out proposals for addressing bottlenecks. That is why it is very important to recruit a local expert consultant whose expertise is recognized by the components of the chain. His or her “relational capital” and knowledge facilitate the entire exercise and give it greater credibility.

350 ECLAC
The assessment and strategy design process is relatively short (eight months on average). But private entities often want it to go faster and want the public sector to commit to meeting their demands. For this reason it is a good idea to provide all of the participants with clear information as to lead times, milestones and expected outcomes. There should be an effort to avoid raising unrealistic expectations, which can lead to frustration and affect the future of the process.
Stakeholder dialogues often raise high expectations and can even lead to conflict because the participants do not often gather together, as occurs with government officials, producers, intermediaries, input suppliers, marketers and distributors. It is therefore useful to have a participatory work methodology so that participants, if they agree, can transition from a consultative (near-term) forum to a cooperative (long-term) one. It is also useful to clearly describe the objectives of the stakeholder dialogues and strictly limit interventions so that meetings do not drag on and are not used as a grandstand for individual interests or unrealistic requests. Having just two roundtables (one for validating the assessment and the other for agreeing on strategies) has proved to be a good practice. Holding more meetings might make the participants lose interest or become confused as to the duration and the steps needed to complete the process. The diagnostic and strategy design process should not be allowed to become politicized. Even if it does not, the actors involved should not be made to feel that they are caught up in a political process that has nothing to do with why they are there. Credibility is essential for private sector participation and the subsequent implementation of strategies.
C. Main features of the advisory process in El Salvador and Guatemala
The four cases studied herein exemplify the methodology applied in the joint ECLAC-GIZ project for conducting the diagnostic study, identifying best practices and designing strategies. In turn, the experience acquired throughout the stages provided useful feedback for the methodology.
The work related to the farmed-shrimp chain in El Salvador made it possible to design strategies for cooperatives located primarily along the country’s seaboard and for post-larvae laboratories, on the basis of a biosecurity and eco-efficiency program for their operations. It also highlighted the need for interventions focused on the role of intermediaries and for creating a processing link to boost the value added of the products. Identifying smuggling as one of the constraints affecting the chain led to joint action by its components and to revival of the Aquaculture Technical Committee, with the participation of the Ministry of Economy. One of the objectives of the strategies was exactly to restart the committee; as a forum

Strengthening value chains… 351
for dialogue it had the potential to become a platform for cooperation as the consultative roundtables continue.
The work related to El Salvador’s synthetic fibre-sports apparel chain sparked considerable interest in the public and private sectors. On the one hand, the textile and garment industries account for around 25% of the country’s industrial value added and more than half of its paid manufacturing jobs. On the other, sales of products made with synthetic fibres have soared in recent years. This chain is very foreign-market-oriented, exporting yarn and fabric to the other countries of Central America and garments to the United States. Given the degree of internationalization of the chain and stiff competition from Asian firms (whose position would be strengthened by entry into force of the Trans-Pacific Partnership Agreement), it was deemed necessary to develop an innovation programme to enable Salvadoran companies to compete on the strength of differentiated, high-quality, high value-added products. The programme includes establishing and operationalizing a centre for innovation and technological development in textiles and garment-making geared towards the manufacture of products with new functional features. It also calls for working on the educational profile of the technical workforce, given the importance of specialist training to provide support for a chain that can compete on a global level with quality products under the “full-package” model. There is also an urgent need to take action on the price of electricity because it accounts for a significant percentage of the total costs of companies in the chain —some 60% of the costs of some yarn operations. In addition to weighing on linkages between links in the chain, it can impact decisions on much-needed investments to further strengthen El Salvador’s synthetic fibre cluster. Also identified was the need for proposing programmes that help to improve distribution processes, including customs and border crossing formalities, marketing, export promotion, quality enhancement and scale-up of the production cluster in El Salvador.
The timber products value chain comprising forest concessions in Petén (Guatemala) is very poorly coordinated with the rest of the domestic forestry industry; internally, the primary and secondary sectors are quite disorganized. This situation, coupled with gaps in technology, obsolete machinery, poor workforce training and the dearth of innovative techniques based on market research, translates into a predominance of low value-added products and low competitiveness. It is therefore imperative to improve production processes, paying close attention to quality and the potential for higher value added. There is also a pressing need to match the supply of export products to international market requirements and standards. The current status of the chain also shows the importance of creating a forum for stakeholder dialogue aimed at reaching an agreement leading to the development of high-quality exportable product lines.
352 ECLAC
Guatemala’s chain of non-traditional vegetable exports encompasses peas, broccoli, courgettes, baby corn and baby carrots. The chain is divided into four links: seed production; growing; processing, packing and export; and marketing. The diagnostic study identified three constraints affecting the entire chain: the lack of research and innovation-oriented activities; the lack of statistical data providing a clear picture of the current status of the chain; and dependence on imported inputs. The most important constraints affecting the second link (growing) are the shortage of agricultural loans, inadequate irrigation system coverage and limited implementation of good agricultural practices (which should be extended to all farms). The absence of internationally recognized laboratories and the high cost of international certifications are constraints affecting the second and third links. And the high cost of sea transport and falling international prices for Guatemalan peas weigh primarily on the last links but affect the entire chain.
Among the proposed strategies for overcoming restrictions are establishment of a country brand to back up the quality of Guatemalan products and proper implementation of good agricultural practices. Strategies were also designed for developing new products, upgrading laboratories and taking joint action to cut transport costs.
D. Strategy commonalities
The chains assessed under the ECLAC-GIZ project have different production characteristics and dynamics. But there are at least four common strategies for strengthening them.
First are the strategies geared towards increasing the value added of production activities and processes undertaken in the subregion. Export manufacturing, represented by the synthetic fibre-sports apparel chain, tends to be concentrated in the less knowledge-intensive links. Research and development, innovation, design and marketing are generally conducted outside Central America. The processes that take place in the subregion itself are usually economies-of-scale or labour-intensive. The primary products (shrimp, non-traditional vegetables and timber) undergo little or no processing before being exported.
Secondly, and in close connection with the first strategy, the subregion’s process and product innovativeness must be enhanced. More innovation would translate into higher value added. In this context, innovation is understood in a broad and flexible sense as a series of incremental changes that make production processes more efficient, but also the development of radically new products and services.

Strengthening value chains… 353
Thirdly, in all four chains there is potential for enhancing associativity within and between their links. The benefits of greater internal associativity include economies of scale for purchasing inputs and selling products and services, accessing new technologies and tapping into joint funding for innovation. Strengthening linkages between links makes it possible to improve the products and services offered, make buying and selling more efficient and expand production, among other benefits.
Fourthly, new financing mechanisms should be established. The micro and small producers who make up the four chains face a number of difficulties in accessing credit from the formal financial system that could be devoted to working capital, investment in machinery and equipment, marketing, and product and process improvement.
E. Lines of research
A comparative analysis of value chains can identify future lines of research, not only shaping policy design but impacting economic theory (industrial organization) as well.
Intermediaries play a critical role in commodity value chains. They provide financing for producers (mainly working capital), who in turn allow them to determine pricing and grant them exclusive rights to sell output. Intermediaries provide transport for marketing products and, in some cases, technical assistance. On the other hand, they exert tight control in terms of governance and absorb a significant proportion of profits. This leads to a line of research focusing on the design of mechanisms and public policies to end excessive control by intermediaries and streamline their role in the chains. Credit mechanisms and information systems on market conditions for producers could be tapped to this end.
Micro and small enterprises face a number of barriers to participation in global manufacturing value chains, because of the many demanding requirements in terms of scale, cost, quality and lead times. The information gathered on the four chains indicates that micro and small enterprises that provide services have better prospects for participation. Therefore, it would also be useful to open a line of research into real opportunities for these enterprises and the public policies that could be designed to support their integration into national, regional and global chains.
Lastly, a third line of research is an examination of the relationship between the type of value chain governance and the space for public policy design and implementation. For example, in chains that are tightly controlled by transnational corporations, public policies aimed at promoting the inclusion of local micro and small enterprises are less effective without

354 ECLAC
support from the transnationals themselves, which need to adapt their procurement strategies and policies with a view to including local suppliers. By contrast, in chains with weak, atomised governance there is more space for public policies in such areas as associativity and the insertion of new actors.
Bibliography
ECLAC (Economic Commission for Latin America and the Caribbean) (2013a), Centroamérica y República Dominicana: Crecimiento, ciclos y transformación económica, 1990-2011 (LC/MEXL.1093), Mexico City, ECLAC subregional headquarters in Mexico.
(2013b), Comercio internacional y desarrollo inclusivo. Construyendo sinergias (LC/G.2562), Santiago, Chile, April.
(2012), Structural Change for Equality. An Integrated Approach for Development, (LC/G.2524(SES.34/3)), Santiago, Chile.
(2010), Time for equality: closing gaps, opening trails (LC/G.2432(SES.33/3)), Santiago, Chile.
(2008), Structural Change and Productivity Growth, 20 Years Later. Old Problems, New Opportunities (LC/G.2367(SES.32/3)), Santiago, Chile.
ECLAC/OECD (Economic Commission for Latin America and the Caribbean/Organization for Economic Cooperation and Development) (2012), Perspectivas económicas de América Latina 2013. Políticas de pymes para el cambio estructural (LC/G.2545), Santiago, Chile.
(2011), Perspectivas económicas de América Latina 2012. Transformación del Estado para el desarrollo (LC/G.2501), OECD Publishing.
Publicaciones recientes de la CEPAL ECLAC recent publications
Informes periódicos institucionales / Annual reportsTambién disponibles para años anteriores / Issues for previous years also available• Anuario Estadístico de América Latina y el Caribe 2013 / Statistical Yearbook for Latin America and
the Caribbean 2013, 226 p.
• Balance Preliminar de las Economías de América Latina y el Caribe 2013, 92 p. Preliminary Overview of the Economies of Latin America and the Caribbean 2013, 92 p.
• Panorama Social de América Latina, 2013, 226 p. Social Panorama of Latin America, 2013, 220 p.
• Panorama de la Inserción Internacional de América Latina y el Caribe 2013, 128 p. Latin America and the Caribbean in the World Economy 2013, 122 p.
• Estudio Económico de América Latina y el Caribe 2013, 220 p. Economic Survey of Latin America and the Caribbean 2013, 210 p.
• La Inversión Extranjera Directa en América Latina y el Caribe 2012, 152 p. Foreign Direct Investment in Latin America and the Caribbean 2012, 142 p.
Libros y documentos institucionales Institutional books and documents• Pactos para la igualdad: hacia un futuro sostenible, 2014, 340 p. Covenants for Equality: Towards a sustainable future, 2014, 330 p.
• Integración regional: hacia una estrategia de cadenas de valor inclusivas, 2014, 226 p. Regional Integration: Towards an inclusive value chain strategy, 2014, 218 p. Integração regional: por uma estratégia de cadeias de valor inclusivas, 2014, 226 p.
• Prospectiva y desarrollo: el clima de la igualdad en América Latina y el Caribe a 2020, 2013, 72 p.
• Comercio internacional y desarrollo inclusivo: construyendo sinergias, 2013, 210 p.
• Cambio estructural para la igualdad: una visión integrada del desarrollo, 2012, 330 p. Structural Change for Equality: an integrated approach to development, 2012, 308 p.
• La hora de la igualdad: brechas por cerrar, caminos por abrir, 2010, 290 p. Time for Equality: closing gaps, opening trails, 2010, 270 p. A Hora da Igualdade: Brechas por fechar, caminhos por abrir, 2010, 268 p.
Libros de la CEPAL / ECLAC books126 Planificación, prospectiva y gestión pública: reflexiones para la agenda del desarrollo, Jorge
Máttar, Daniel E. Perrotti (eds.), 2014, 250 p.
125 La crisis latinoamericana de la deuda desde la perspectiva histórica, José Antonio Ocampo, Barbara Stallings, Inés Bustillo, Helvia Velloso, Roberto Frenkel, 2014, 174 p.
www.cepal.org/publicaciones

124 La integración de las tecnologías digitales en las escuelas de América Latina y el Caribe: una mirada multidimensional, Guillermo Sunkel, Daniela Trucco, Andrés Espejo, 2014, 170 p.
123 Fortalecimiento de las cadenas de valor como instrumento de la política industrial: metodología y experiencia de la CEPAL en Centroamérica, Ramón Padilla Pérez (ed.), 2014, 390 p.
122 Cambio estructural y crecimiento en Centroamérica y la República Dominicana: un balance de dos décadas, 1990-2011, Hugo E. Beteta y Juan Carlos Moreno-Brid, 2014, 398 p.
Copublicaciones / Co-publications• Decentralization and Reform in Latin America: Improving Intergovernmental Relations, Giorgio Brosio
and Juan Pablo Jiménez (eds.), ECLAC / Edward Elgar Publishing, United Kingdom, 2012, 450 p.• Sentido de pertenencia en sociedades fragmentadas: América Latina desde una perspectiva global,
Martín Hopenhayn y Ana Sojo (comps.), CEPAL / Siglo Veintiuno, Argentina, 2011, 350 p.• Las clases medias en América Latina: retrospectiva y nuevas tendencias, Rolando Franco, Martín
Hopenhayn y Arturo León (eds.), CEPAL / Siglo XXI, México, 2010, 412 p.• Innovation and Economic Development: The Impact of Information and Communication
Technologies in Latin America, Mario Cimoli, André Hofman and Nanno Mulder, ECLAC / Edward Elgar Publishing, United Kingdom, 2010, 472 p.
Coediciones / Co-editions• Perspectivas de la agricultura y del desarrollo rural en las Américas: una mirada hacia América
Latina y el Caribe 2014, CEPAL / FAO / IICA, 2013, 220 p.• Perspectivas económicas de América Latina 2014: logística y competitividad para el desarrollo,
CEPAL/OCDE, 2013, 170 p. Latin American Economic Outlook 2014: Logistics and Competitiveness for Development, ECLAC/
OECD, 2013, 164 p.• Juventud y bono demográfico en Iberoamérica, Paulo Saad, Tim Miller, Ciro Martínez y Mauricio
Holz, CEPAL/OIJ/UNFPA, 2012, 96 p.• Perspectivas económicas de América Latina 2013: políticas de pymes para el cambio estructural,
OCDE/ CEPAL, 2012, 192 p. Latin American Economic Outlook 2013: SME Policies For Structural Change, OECD / ECLAC, 2012, 186 p.
Cuadernos de la CEPAL101 Redistribuir el cuidado: el desafío de las políticas, Coral Calderón Magaña (coord.), 2013, 460 p.101 Redistributing care: the policy challenge, Coral Calderón Magaña (coord.), 2013, 420 p.100 Construyendo autonomía: compromiso e indicadores de género, Karina Batthyáni Dighiero,
2012, 338 p.99 Si no se cuenta, no cuenta, Diane Alméras y Coral Calderón Magaña (coordinadoras), 2012, 394 p.98 Macroeconomic cooperation for uncertain times: The REDIMA experience, Rodrigo Cárcamo-Díaz,
2012,164 p. 97 El financiamiento de la infraestructura: propuestas para el desarrollo sostenible de una política
sectorial, Patricio Rozas Balbontín, José Luis Bonifaz y Gustavo Guerra-García, 2012, 414 p.
Documentos de proyecto / Project documents• La economía del cambio climático en la Argentina: primera aproximación, 2014, 240 p.• La economía del cambio climático en el Ecuador 2012, 2012, 206 p.
• Economía digital para el cambio estructural y la igualdad, 2013, 130 p The digital economy for structural change and equality, 2014, 128 p. • Estrategias de desarrollo bajo en carbono en megaciudades de América Latina, Joseluis Samaniego
y Ricardo Jordán (comps.), María Teresa Ruiz-Tagle (ed.), 2013, 184 p.• La cooperación entre América Latina y la Unión Europea: una asociación para el desarrollo, José E.
Durán Lima, Ricardo Herrera, Pierre Lebret y Myriam Echeverría, 2013, 157 p.
Cuadernos estadísticos de la CEPAL41 Los cuadros de oferta y utilización, las matrices de insumo-producto y las matrices de empleo. Solo
disponible en CD, 2013.40 América Latina y el Caribe: Índices de precios al consumidor. Serie enero de 1995 a junio de 2012.
Solo disponible en CD, 2012.
Series de la CEPAL / ECLAC SeriesAsuntos de Género / Comercio Internacional / Desarrollo Productivo / Desarrollo Territorial / Estudios Estadísticos / Estudios y Perspectivas (Bogotá, Brasilia, Buenos Aires, México, Montevideo) / Studies and Perspectives (The Caribbean, Washington) / Financiamiento del Desarrollo / Gestión Pública / Informes y Estudios Especiales / Macroeconomía del Desarrollo / Manuales / Medio Ambiente y Desarrollo / Población y Desarrollo / Política Fiscal / Políticas Sociales / Recursos Naturales e Infraestructura / Reformas Económicas / Seminarios y Conferencias.
Revista CEPAL / CEPAL ReviewLa Revista se inició en 1976, con el propósito de contribuir al examen de los problemas del desarrollo socioeconómico de la región. La Revista CEPAL se publica en español e inglés tres veces por año.CEPAL Review first appeared in 1976, its aim being to make a contribution to the study of the economic and social development problems of the region. CEPAL Review is published in Span-ish and English versions three times a year.
Observatorio demográfico / Demographic Observatory Edición bilingüe (español e inglés) que proporciona información estadística actualizada, referente a estimaciones y proyecciones de población de los países de América Latina y el Caribe. Desde 2013 el Observatorio aparece una vez al año. Bilingual publication (Spanish and English) proving up-to-date estimates and projections of the populations of the Latin American and Caribbean countries. Since 2013, the Observatory appears once a year.
Notas de poblaciónRevista especializada que publica artículos e informes acerca de las investigaciones más recientes sobre la dinámica demográfica en la región. También incluye información sobre actividades científicas y profesionales en el campo de población. La revista se publica desde 1973 y aparece dos veces al año, en junio y diciembre.Specialized journal which publishes articles and reports on recent studies of demographic dynamics in the region. Also includes information on scientific and professional activities in the field of population. Published since 1973, the journal appears twice a year in June and December.

Las publicaciones de la CEPAL están disponibles en:ECLAC Publications are available in:
www.cepal.org/publicaciones
También se pueden adquirir a través de:They can also be ordered through:
www.un.org/publications
United Nations PublicationsPO Box 960
Herndon, VA 20172USA
Tel. (1-888)254-4286 Fax (1-800)338-4550
Contacto / Contact: [email protected] / Orders: [email protected]

This publication presents the recent experience of the Economic Commission for Latin America and the Caribbean (ECLAC) in respect of industrial policy
design and technical assistance for the Governments of two Central American countries: El Salvador and Guatemala. It adopts a value chain approach to identify in detail the restrictions facing these chains, both as a whole and at each of their links. Strategies aimed at strengthening value chains are participatory (public-private) and act as a driver of structural change by boosting productivity and value added, especially among small producers.
The first chapter provides a conceptual and empirical framework by reflecting upon the gradual resurgence of industrial policymaking in Latin America and the instruments it has at its disposal. The next two chapters systematize the methodology developed during the technical assistance processes, with a view to its dissemination and reproduction. The following four chapters, which are highly empirical in content, describe the principal outcomes of the methodology’s application in order to identify restrictions and design participatory strategies. Work was carried out in close collaboration with the public and private sectors on the value chains of farmed shrimp and synthetic fibre manufacturing in El Salvador, and of non-traditional export vegetables and timber products from forest concessions in Guatemala.
ISBN 978-92-1-121840-4EISBN 978-92-1-056529-5SALES NUMBER E.14.II.G.9FIRST EDITIONCOPYRIGHT © UNITED NATIONS, 2014
BOOKS ECONOMIC COMMISSION FOR LATIN AMERICA AND THE CARIBBEAN (ECLAC)COMISIÓN ECONÓMICA PARA AMÉRICA LATINA Y EL CARIBE (CEPAL)
www.eclac.org
Strengthening value chains as an industrial policy instrumentMethodology and experienceof ECLAC in Central America
RAMÓN PADILLA PÉREZEditor
Econ
omic
Dev
elop
men
t