Vegetable value chains in Eastern Indonesia–a focus on chilli
73
project Vegetable value chains in Eastern Indonesia–a focus on chilli SADI-ACIAR research report date published October 2007 prepared by Mr Benjamin White Manager Market Development, South East Asia Department of Primary Industries, Victoria co-authors Mr Phillip Morey Morelink Pty Ltd Dr Ronnie Natawidjaja Center for Agricultural Policy and Agribusiness Studies Dr Wendy Morgan RMIT International approved by David Shearer
-
Upload
khangminh22 -
Category
Documents
-
view
0 -
download
0
Transcript of Vegetable value chains in Eastern Indonesia–a focus on chilli

- 1 -
project Vegetable value chains in Eastern Indonesia–a focus on chilli
SADI-ACIAR research report
date published October 2007
prepared by Mr Benjamin White Manager Market Development, South East Asia Department of Primary Industries, Victoria
co-authors Mr Phillip Morey Morelink Pty Ltd Dr Ronnie Natawidjaja Center for Agricultural Policy and Agribusiness Studies Dr Wendy Morgan RMIT International
approved by David Shearer

Vegetable value chains in Eastern Indonesia–a focus on chilli
- 2 -
ACIAR’s participation in the Australia–Indonesian Partnership
The Australia Indonesia Partnership (AIP), comprising $500 million in grants and $500 million in highly concessional loans over five years, was announced in January 2005. The partnership supports Indonesia’s reconstruction and development efforts, both in and beyond tsunami-affected areas. Assistance involves long-term sustained cooperation focused on economic and social development projects and Indonesia’s programs of reform and democratisation. ACIAR is committed to the partnership through the management of a component of the Smallholder Agribusiness Development Initiative (SADI), which aims to improve rural sector productivity and growth in four Eastern provinces—East Nusa Tenggara, West Nusa Tenggara, South East Sulawesi and South Sulawesi. This initiative will improve incomes and productivity for farmers and agribusiness in response to market opportunities, through a process that is underpinned by improved adaptive research and development capacity. ACIAR's role in the initiative is to strengthen province-based agricultural research and development capacity that is market and client-driven, and effectively transfers knowledge to end users. A key part of this approach is delivered through market-driven adaptive projects which are priorities for smallholders, farmer groups, agribusiness, government and other supporting agencies.
project number SMAR/2007/042
ISBN 978-1-921434-08-2
published by ACIAR GPO Box 1571 Canberra ACT 2601 Australia
This publication is published by ACIAR ABN 34 864 955 427. Care is taken to ensure the accuracy of the information contained in this publication. However ACIAR cannot accept responsibility for the accuracy or completeness of the information or opinions contained in the publication. You should make your own enquiries before making decisions concerning your interests. Reproduction in whole or in part of this publication is prohibited without prior written consent of ACIAR.

Vegetable value chains in Eastern Indonesia–a focus on chilli
- 3 -
Contents
1 Acknowledgments ....................................................................................5
2 Executive summary ..................................................................................6
3 Introduction...............................................................................................8
4 Market Demand for Fresh Vegetables.....................................................9 4.1 Market size, Composition and Growth.................................................................................9 4.2 Food consumption patterns and trends ...............................................................................9
5 Food Marketing Channels ......................................................................11 5.1 Distribution Issues..............................................................................................................11 5.2 Consumer Shopping Patterns............................................................................................11 5.3 Role and growth of the Modern Retail Stores....................................................................12
6 Indonesian Vegetable Industry and Regional Supply Channels ........14 6.1 Indonesian Vegetable Production......................................................................................14 6.2 Indonesian Vegetable Exports...........................................................................................15 6.3 Indonesian Vegetable Imports ...........................................................................................15
7 Eastern Indonesian Vegetable Industry................................................17 7.1 Overview ............................................................................................................................17 7.2 South Sulawesi ..................................................................................................................18 7.3 South East Sulawesi ..........................................................................................................21 7.4 Nusa Tenggara Barat (NTB)..............................................................................................23 7.5 Nusa Tenggara Timur (NTT) .............................................................................................23
8 Focus on the Chilli Industry...................................................................24 8.1 Supply Overview................................................................................................................24 8.2 Chilli Manufacturing – A Java Perspective ........................................................................25 8.3 Chilli Industry in South Sulawesi........................................................................................26 8.4 Supply chain comparison of Chilli in South Sulawesi, South East Sulawesi and East Java28
9 Conclusions and recommendations .....................................................36 9.1 Indonesia has a large and diverse vegetable industry ......................................................36 9.2 Chilli has low input and productivity in Eastern Indonesia.................................................36

Vegetable value chains in Eastern Indonesia–a focus on chilli
- 4 -
9.3 Processing and Value-adding Opportunities .....................................................................37 9.4 Postharvest and Cool Chain Management........................................................................37 9.5 Distribution options are plenty ...........................................................................................37 9.6 Market Development opportunities ....................................................................................38 9.7 Value Chain Analysis shows weak farmer bargaining power............................................38
10 References ..............................................................................................39
11 Appendixes .............................................................................................40 11.1 Tables on Production, Exports and Imports ......................................................................40 11.2 Farming Analysis of Small Chilli and Large Chilli in South Sulawesi and East Java ........50 11.3 Comparison of Farming Activities and Technology in South Sulawesi and East Java .....53 11.4 Summary of Small Chilli Value Chain................................................................................54 11.5 Detail of Small Chilli Value Chain ......................................................................................55 11.6 Summary of Large Chilli Value Chain................................................................................64 11.7 Detail of Large Chilli Value Chain ......................................................................................65

Vegetable value chains in Eastern Indonesia–a focus on chilli
- 5 -
1 Acknowledgments The project team would like to thank the Balai Pengkajian Teknologi Pertanian (BPTP) in South Sulawesi and South East Sulawesi for their advice and guidance on regional issues and the valuable contribution made by the staff of the Directorate General Horticulture.

Vegetable value chains in Eastern Indonesia–a focus on chilli
- 6 -
2 Executive summary Indonesia, the fourth largest market in the world with a population of 220 million in 2005, is forecast to reach almost 250 million people by 2015, making it a large food market. Consumption of fresh food is increasing and urban based consumers are becoming more health and convenience conscious. This has opened up opportunities for the modern retail sector to expand further into fresh foods, such as the offer of hydroponic and organic vegetables. Indonesia has over 17,000 islands and this provides a major challenge to distribute fresh products nationally. Most of Indonesia’s locally produced fresh vegetables (cabbage, potato and chilli) are distributed throughout Indonesia in non refrigerated transport. However, there is increased use of airfreight for select high value fresh vegetables for inter-island trading where there is shortage of local supplies. The traditional wet markets still dominate fresh food trade however there is an increasing trend of food purchases at modern retail outlets. Most supermarkets and hypermarkets in Indonesia have expanded their share of the retail market with the opening of new stores throughout major cities in Indonesia and with an increased emphasis on fresh food and higher value lines, such as hydroponic and organic vegetables. Both Matahari Hypermart and Hero supermarkets are now offering a full range of ingredient vegetables and other food items essential for Indonesian cooking. In the vegetable section, there is now a full range of chilli (five varieties), ginger, onions, garlic, pepper etc. Indonesia’s vegetable production has increased by an average of 8% per year since 2001 from 6.9 million tons to reach more than 9 million tons (excluding almost 31 million tons of mushrooms) in 2005, from almost one million hectares of land; an average yield of 9.6 tons per hectare. The main vegetables grown in Indonesia (besides mushrooms) are cabbages, chilli, potato, shallots/onions and tomato. There are 33 provinces in Indonesia that produce over 20 types of vegetables; however 85% of all vegetables are grown on the islands of Java and Sumatra. The major vegetable producing provinces are: West Java (35.6%), Central Java (13.3%), East Java (11.9%) and North Sumatra (10.3%); these four provinces account for over 70% of all vegetable production. Imported vegetables accounted for only 4% of total consumption in Indonesia in 2005. East Indonesia accounted for only 11.6% of the volume of all vegetables produced in Indonesia in 2005 yet has 16.0% of the population; this represented an average of 28.7 kg per capita compared to an average across Indonesia of 39.8 kg per capita. Therefore Eastern Indonesia is a net importer of vegetables, with supply mainly from Java. North Sulawesi (274,134 tons) and South Sulawesi (256,153 tons) are the main vegetable producing provinces in Eastern Indonesia in 2005 with 52% share of all vegetables from the 13 provinces in Eastern Indonesia. The province of South Sulawesi has a topography and climate that is suitable for vegetable production and hence grows a wide range of vegetables for local consumption and inter-island trading. South Sulawesi produces about 256,000 tons of vegetables from almost 55,000 hectares of land; an average yield of 4.7 tons per hectare. The main vegetables grown in

Vegetable value chains in Eastern Indonesia–a focus on chilli
- 7 -
South Sulawesi are: cabbage (25.4%), chilli (15.3%), yardlong bean (7.9%), leek (6.5%) and tomato (6.3%). The main issues, related to vegetable supply, for retailers in Makassar, the capital of South Sulawesi are:
• Consistency in quantity with a lack of local vegetable supply from Sulawesi, especially in the rainy season with retailers requiring to source supply from Java.
• Lower quality of local fresh produce compared to product sourced from Java. • Large price fluctuations for some vegetables like chilli.
Production of chilli in Indonesia has been increasing by an average of 20% per year since 2001 to reach over 1 million tons in 2005 from about 190,000 hectares; accounting for about 12% of vegetable production. Over 60% of chilli is produced in Java with west Java (198,000 tons) being the major source of large chilli and east Java (143,000 tons) being the major source of small chilli. There is a wide variation in yields of large and small chilli. The chilli sauce manufacturing industry is based on the island of Java (which has over 60% of all chilli production for fresh and processing) with 10 major companies and 12 manufacturing plants. A value chain analysis of four supply chains of chilli found that supply to supermarket gives the highest return to farmers. The lowest value chain is a channel to traditional markets. The major issues facing the chilli industry in South Sulawesi are:
1. Low productivity 2. Benefiting from opportunities for value adding on the farm 3. No post harvest or cold chain management 4. Market development opportunities 5. Weak farmer bargaining power
It is recommended that there is a need to link smallholders to more dynamic markets such as channels to modern retailers and the food processing industry. Technical assistant to farmers is also needed on more efficient cultivation technology to increase productivity and the application of post harvest handling.

Vegetable value chains in Eastern Indonesia–a focus on chilli
- 8 -
3 Introduction Indonesia is a large and diverse market with a population of 220 million people spread across 33 provinces1. The majority of the population and wealth is in the provinces in the western part of Indonesia. However, the Indonesian Government and international aid donor organisations are increasing their resources in the eastern provinces of Indonesia to improve the livelihoods of the local people. Many of the vegetable industries in Eastern Indonesia have production constraints, such as pest, disease, water and nutrient management. With the implementation of the Smallholder Agribusiness Development Initiative (SADI) in Eastern Indonesia, there is an opportunity to gain a greater understanding of the market-driven constraints that effect the development of the Indonesian vegetable industry. These constraints may have an affect throughout the supply chain. Competitive supply chains are focused on demand pulled cooperation (not supply pushed) and systems. According to Rijnconsult2, “Value chains are a strategic collaboration of organizations for the purpose of meeting specific market objectives over the long term and for the mutual benefit of all links of the chain”. There are many types of supply chains in operation however for a supply chain to be effective and increase value along the chain it requires coordination, customer focus and sharing of market knowledge along the chain. These issues are addressed in this report. A value chain analysis of the chilli industry was undertaken to determine the market demand issues facing the vegetable industry in Eastern Indonesia including: productivity, processing and value-adding, postharvest and cool chain management, distribution capability and market development. This report provides an overview of issues impacting on the market demand for vegetables (section 2) as well as the marketing channels that are used in the delivery of vegetables to consumers (section 3); this includes a discussion on consumer shopping patterns and the role of the modern retailers. Production, imports and exports of vegetables are discussed in section 4. Section 5 provides detailed information on the vegetable industries in Eastern Indonesia provinces of South Sulawesi, South East Sulawesi, NTB and NTT while section 6 provides an analysis of the chilli industry in Indonesia with a focus on South Sulawesi. A summary of the key issues that impact on the growth of the chilli industry are presented in section 7.
1 In 2007, there are 33 provinces in Indonesia. 2005 data quoted in the report was analysed when there were only 31 provinces. New provinces are Riau islands and West Sulawesi. 2 AFFA, Supply Chain Learning for Australian Agribusiness, 2000, page 9

Vegetable value chains in Eastern Indonesia–a focus on chilli
- 9 -
4 Market Demand for Fresh Vegetables
4.1 Market size, Composition and Growth Indonesia’s population is forecast to increase by an average of 1.3% per year over the next 10 years to reach 250 million people in 2015, making it a large market for fresh and processed vegetables. The majority of the population live on the island of Java (58%), followed by Sumatra (22%). The population of the four provinces, within the Smallholder Agribusiness Development Initiative (SADI) of Eastern Indonesia (South Sulawesi, South East Sulawesi, NTT and NTB), is 19.1 million people (almost the size of Australia) and represents 8.7% of Indonesia’s population Urbanization is becoming widespread in Indonesia with people moving to the cities for better education and employment. The urban population represents 45% of the population in 2005 and is forecast to increase to 52% in the next ten years. This provides a greater population base for the modern retailer and has ramifications for local suppliers of vegetables. Indonesia is the largest Muslim country in the world with over 88% of the population following Islam as their religion. Protestants and Catholics are the next major religious group comprising 9% of the population, followed by Hindu (2%) and Buddhist (1%). Since Muslim consumers may only consume food that meets strict halal guidelines, this makes Indonesia the largest halal food market in the world.
4.2 Food consumption patterns and trends Food still holds the major share (55% in 2004) of the average per capita expenditure of Indonesians. However, food expenditure as a percentage of total expenditure is declining, indicating that people are becoming more affluent. Table 1: Food Budget Shares for 9 Countries *
Country Beverage Breads Dairy Fats Fish Fruit & Meat Total Food Tobacco & Cereal & Oils Vegetable Expenditure
Indonesia 11.3 33.5 5.7 4.7 8.7 23.7 5.1 54.6 Philippines 11.9 29.7 6.7 1.8 14.5 11.1 14.5 48.4 Thailand 28.6 16.1 5.2 2.8 3.3 16.4 18.6 28.6 UK 47.5 8.3 6.9 1.3 2.3 12.0 12.6 16.4 Australia 25.2 13.5 9.7 1.7 3.1 18.3 16.9 15.1 Japan 23.1 22.3 4.8 0.7 17.0 12.8 7.8 14.9 Singapore 25.2 10.3 5.0 1.8 15.0 18.1 13.3 13.0 Hong Kong 17.9 9.0 3.4 3.3 19.7 11.8 22.7 10.3 USA 28.7 11.4 8.6 1.8 1.2 14.7 19.6 9.7 * Total food budget shares are per cent of total expenditure; food sub-groups shares are per cent of total food expenditure. Source: www.ers.usda.gov The majority (33%) of Indonesian food expenditure is in the category “bread & cereals” (mainly rice and noodles from wheat flour). This is followed by “fruit and vegetables” at 24% while “meat” and “dairy” consumption represents only 5% each of Indonesian daily food budget.

Vegetable value chains in Eastern Indonesia–a focus on chilli
- 10 -
Australian consumers spend a higher proportion of their food budget on meat, dairy and beverages (Table 1). Consumption of fresh food is increasing, mostly because fresh foods are more widely available and consumers are able to store at home. Consumption of vegetables has been increasing, although at a slower rate compared to other horticultural products. Better logistics makes fresh food more readily available to consumers. Urban consumers are becoming more health and convenience conscious and more aware of food safety issues. This has opened up opportunities for the modern retail sector to offer product lines such as hydroponic and organic vegetables, both of which are prepacked and supplied from specialized local producers. A major retail player in the Indonesian organic food and lifestyle business is “Healthy Choice” which started in 2002 and now has 7 retail stores with 2 more opening in 2007. Healthy Choice promotes a “new way of enjoying life to the fullest” and offers over 200 organic food items for sale with most products coming from USA, EU, Taiwan and NZ. There is increasing interest by some consumers in Indonesia about healthy lifestyles and Healthy Choice is leading the way by informing and promoting organics. Table 2: Consumption of Fresh Horticultural Products, Kg per capita
1998 2003 % change (1998 – 2003) Potatoes 9.70 10.85 11.86 Fresh Tomatoes 1.42 1.61 13.54 Green Vegetables 30.68 32.50 5.92 Citrus Fruit 2.83 3.39 19.87 Other Fruit 27.71 31.13 12.35 Source : Euromonitor from trade sources However, the increase in fresh food consumption is not as fast as the increase in ready-to-eat food and packaged food. Indonesians love to eat convenient and practical foods. Packaged foods such as bagged chips, ice creams and other snacks are often bought on impulse as part of the routine shipping at the supermarket. Frozen processed food is also gaining in popularity due to an increase in the availability of frozen foods and an increase in household ownership of refrigerators.

Vegetable value chains in Eastern Indonesia–a focus on chilli
- 11 -
5 Food Marketing Channels
5.1 Distribution Issues Indonesia provides a major challenge to distribute products nationally. Most of the distribution of local products is based around seaports and regional depots. A major distribution problem for companies is the lack of refrigeration and an inferior road distribution system. In the past, there has been a lack of infrastructure investment in Eastern Indonesia and this has resulted in problems to maintain a cold chain system for perishable products from Eastern Indonesia. A limited number of Indonesian companies operate national distribution businesses that cater for local and imported products. This involves the transportation of product from a central manufacturing/warehouse base to a number of regional depots in the main islands – Java, Sumatra, Kalimantan, Sulawesi, Bali/Lombok. Many importers and manufacturers sell to wholesalers/distributors who supply direct to retail and other customers. In Jakarta, there is a major wholesale market (Kramat Jati) for local fresh fruit and vegetables while most imported fresh horticulture produce is sold direct to wholesalers (operating outside the domestic wholesale market) who distribute to retail markets. Most of Indonesia’s locally produced fresh vegetables (cabbage, potato and chilli) are distributed throughout Indonesia in non refrigerated trucks. However, there is increased use of airfreight for select high value fresh vegetables for inter-island trading where there is shortage of local supplies. There is also some use of small refrigerated trucks by producers supplying high value vegetables to the modern retail and food service markets in Jakarta.
5.2 Consumer Shopping Patterns The traditional wet markets still dominate fresh food trade but there is a trend to shopping at modern outlets (AC Nielson, 2003). Today, Indonesians are working longer hours than before, and more married women with children are working and want convenience. Indonesia’s middle-income shoppers (approximately 30 million of the total population’s 220 million) are becoming more trend and brand conscious. Their lifestyles are changing, and part of the change is shopping in supermarkets and hypermarkets rather than wet (traditional) markets. However, more than 95% of household shoppers preferred to buy fresh meat, seafood and vegetables at traditional outlets while 21% of the shoppers preferred to buy their fresh fruit purchases at the modern retail outlets due to better displays and preservation systems and better access to imported fresh fruits (AC Nielson, 2003). Consumers, who shop at the modern retailers, are becoming more health conscious and looking for “healthy” choices.

Vegetable value chains in Eastern Indonesia–a focus on chilli
- 12 -
5.3 Role and growth of the Modern Retail Stores Most supermarkets and hypermarkets in Indonesia have expanded their share of the retail market with the opening of new stores throughout major cities in Indonesia and with an increased emphasis on fresh food. Consumer spending at modern markets has increased from about 22% in 2000 to about 30% in 2004. Retailers say they expect 17% growth in 2007 while hypermarkets and mini-markets will grow by 25%. Many retailers are likely to invest more in 2007 while some foreign retailers are planning to enter Indonesia in 2007/2008 including Metro (Europe) and Seibu (Japan). There has been a gradual increase in modern retailers opening stores in regional Indonesia to meet the increased consumer purchase power in some provinces. About half of the 33 provinces of Indonesia have witnessed investment by the modern retailer. While the majority of the modern supermarkets and hypermarkets are located in Jakarta (with 109 modern retail stores), there are now a number of modern retailers located in provinces in Eastern Indonesia; seven are located in South Sulawesi.
Carrefour French retail giant Carrefour will open more than 10 stores this year, to add to the current 28 outlets throughout the country, 19 of which are in Jakarta. Other locations include Bali, Surabaya, Makassar, Medan, Bandung, Surabaya and Palembang.
Matahari/Hypermart PT Matahari Putra Prima (the Indonesian supermarket and department store operator) plans to triple the number of stores to 207 by year 2009. After opening 12 new hypermarket stores last year, Matahari will open up to 17 stores in 2007, in addition to the 18 Matahari hypermarkets (Hypermart) throughout the country. Matahari Hypermart is placing more importance on meeting all needs of the consumer for food supply and is now offering a full range of ingredient vegetables and other food items essential for Indonesian cooking. In the vegetable section, there is now a full range of chilli (five varieties), ginger, onions, garlic, pepper etc being displayed for customers. The Hypermart has 50 registered suppliers of local fresh fruit and vegetables. All trading terms are based on a one year agreement and weekly suppliers are chosen based on a tender for the best prices. There are 3 main chilli suppliers to the Hypermart from west and east Java with supplies based on an agreed weekly price. While 65% of fruit sold by Hypermart is imported most of the vegetables are locally sourced. There are no product specifications, no food safety or HACCP issues relating to fresh vegetables. The exception is on packaged hydroponic, aeroponic and organic vegetables that specify on the packaging that the product is “pesticide free”, “chemical free” or “organic”. However, Hypermart does no testing of these products. According to Matahari, it is too difficult to implement food safety standards for local vegetable suppliers. Consumers are becoming increasingly interest in healthy choices so that “healthy” produce is growing in sales. These “healthy” choices include hydroponic, aeroponic and organic vegetables as they claim to be, amongst other things pesticide free.

Vegetable value chains in Eastern Indonesia–a focus on chilli
- 13 -
There is an average of 5% wastage on fresh vegetable across all stores but this can vary and be up to 15% at some stores for vegetables.
Hero/Giant The country's largest operator of supermarkets PT Hero Supermarket (Dairy Farm) has 241 outlets all over the country including a number of Giant hypermarkets. PT Hero Supermarket said it would open 41 new stores in 2007. Hero supermarket has operated a fresh produce distribution centre with cold storage at Cibitung for almost 10 years. Hero has detailed product specifications for all their fresh fruit and vegetables. Produce which does not meet the specification is rejected at the distribution centre. However, it is only recently that procedures on acceptance of produce are being adhered to, with wastage reduced to about 7%. Hero has one year trading terms with their suppliers but weekly supplies are based on tendered prices. Hero has two main suppliers of vegetables that buy from growers and pack in Jakarta for Hero, as per specification. The three main issues to address are produce cost, shelf life and quality. For produce from eastern Indonesia the main concern is the high cost of transport and lack of cold chain. Hero has ten A+ stores where there is an increasing interest in organic and pesticide free produce by consumers. These stores are independently checked on a monthly basis for food safety issues (meat and delicatessen sections) such as contamination. Hero offers consumers four varieties of chilli and they sell about 1 to 2 tons per week per store in the Jabotabek (greater Jakarta) region. This is up from 500 kg per week since they have increased their focus on ingredients and improved the ingredient display section.

Vegetable value chains in Eastern Indonesia–a focus on chilli
- 14 -
6 Indonesian Vegetable Industry and Regional Supply Channels
6.1 Indonesian Vegetable Production
Overview Indonesia’s vegetable production has increased by an average of 8% per year since 2001 from 6.9 million tons to reach more than 9 million tons (excluding almost 31 million tons of mushrooms) in 2005, from almost one million hectares of land with an average yield of 9.6 tons per hectare. Chilli production uses 20% of the vegetable land but only produces 12% of the total vegetable output due to low average yields. Whereas, both cabbage and potato use only 6.3% and 6.8% respectively of the vegetable land and have much higher yields resulting in large volumes of produce. The main vegetables grown in Indonesia (besides mushrooms) and their average yields (tons per hectare) are as follows: Cabbages (22.4 t/ha), Chilli (4.7 to 6.4 t/ha), Potato (16.4 t/ha), Shallot/onions (8.8 t/ha) and Tomato (12.6 t/ha). Graph 1: Vegetables, by production, in Indonesia, 2005
0
200
400
600
800
1000
1200
1400
000 T
ON
Production (Ton) 1,292,984 1,058,023 1,009,619 732,609 647,020 552,891 548,453 501,437 466,387 440,002
Cabbage Chili Potato Shallot Tomato Cucumber C.Cabbage Leek Y.Bean Carrot
Regional Supply Channels There are 33 provinces in Indonesia that produce over 20 types of vegetables; however 85% of all vegetables are grown on the islands of Java and Sumatra. The major vegetable producing provinces are: West Java (35.6%), Central Java (13.3%), East Java (11.9%) and North Sumatra (10.3%); these four provinces account for over 70% of all vegetable production. In Eastern Indonesia the provinces of North Sulawesi and South Sulawesi are the only major vegetable producers with 3.1% and 2.9% respectively of total Indonesian production.

Vegetable value chains in Eastern Indonesia–a focus on chilli
- 15 -
6.2 Indonesian Vegetable Exports In 2005, Indonesia exported 60,000 tons of vegetables worth about US$18 million; this represented only 0.2% of production. The main vegetable exports were cabbages, potato, mushroom and shallots/onions. Figure 1. Indonesia’s Exports of Selected Fresh Vegetables by Volume, 2005
Indonesia's Exports of selected Fresh Vegetables By Volume (Tonnes), 2005
58%
22%
7%
5%
4% 2% 2%Cabbages
Potatoes
Shallots
Caulif low ers
Mushrooms
Tomatoes
Other
Total: 60,676 Tonnes
6.3 Indonesian Vegetable Imports Indonesia imports a wide range of vegetables by sea and some by airfreight for supermarkets, hotels and restaurants. Indonesian vegetable imports have tripled (in value) over the last ten years to reach US$98.0 million (374,000 tons) in 2005, up from US$33.4 million (53,500 tones) in 1994. The main vegetables imported in 2005 were garlic (283,283 tons), shallots (53,071 tons) and onions (22,133 tons). These three vegetables comprised 96% of the volume and 91% of the value of Indonesia’s vegetable imports in year 2005. China is the main supplier of garlic, shallots and onions. Imported vegetables accounted for only 4% of total consumption in Indonesia in 2005.

Vegetable value chains in Eastern Indonesia–a focus on chilli
- 16 -
Figure 2. Indonesia’s Import of Selected Fresh Vegetables by Volume, 2005
Indonesia's Imports of Selected Fresh Vegetables (in tonnes), 2005
Carrots2%
Shallots14% Garlic
76%
Other2%
Onions6%
Total: 374,482 Tonnes

Vegetable value chains in Eastern Indonesia–a focus on chilli
- 17 -
7 Eastern Indonesian Vegetable Industry
7.1 Overview East Indonesia accounted for only 11.6% of the volume of all vegetables produced in Indonesia in 2005 yet has 16.0% of the population; this represented an average of 28.7 kg per capita compared to an average across Indonesia of 39.8 kg per capita. Therefore, Eastern Indonesia is a net importer of vegetables, mainly from Java. North Sulawesi (274,134 tons) and South Sulawesi (256,153 tons) are the main vegetable producing provinces in Eastern Indonesia3 in 2005 with 52% share of all vegetables from the 13 provinces in Eastern Indonesia. While there are 20 main vegetables grown in Indonesia, some of the provinces in Eastern Indonesia grow predominately one specific vegetable as follows: North Sulawesi (60% potato) NTB (52% shallot) Most of the potatoes from North Sulawesi are grown under contract to Indofood’s Fritolay for snack food. Potato farmers in North Sulawesi are paid a fix price and are provided with agronomic advice by Indofood. The potatoes are delivered by open door 20 foot container by sea to Jakarta, a journey of 5-6 days, at an agreed factory delivered price that is less than the price of potatoes from West Java. The cheaper price is due to the lower costs of land and production costs in North Sulawesi. The province of South Sulawesi has a topography and climate that is suitable for vegetable production and hence grows a wide range of vegetables for local consumption and inter-island trading. Table 3. Vegetable Production and Population by Provinces in East Indonesia, 2005
Province Production Tons
% Population Millions
% Per capita Consumption
(kg) South Sulawesi 256,153 2.9 8.5 3.9 30.1S.East Sulawesi 34,577 0.4 2.1 0.9 16.5NTT 50,413 0.6 4.1 1.9 12.3NTB 157,794 1.8 4.4 2.0 35.9Total 498,937 5.7 19.1 8.7 26.1 Other East Indonesia*
516,507 5.9 16.3 7.3 31.7
Total East Indonesia
1,015,444 11.6 35.4 16.0 28.7
Other 7,719,263 88.4 183.8 84.0 42.0Total Indonesia 8,734,707 100.0 219.2 100.0 39.8* includes 9 provinces of Papua, West Irian Jaya, Maluku, North Maluku, Gorontalo, Central Sulawesi, North Sulawesi, East
Kalimantan and South Kalimantan. Sources : BPS – Statistics Indonesia and Directorate General of Horticulture Production Development
3 Refers to 13 provinces: Papua, West Irian Jaya, Maluku, North Maluku, Gorontalo, Central Sulawesi, North Sulawesi, South Sulawesi, South East Sulawesi, East Kalimantan, South Kalimantan, NTT and NTB.

Vegetable value chains in Eastern Indonesia–a focus on chilli
- 18 -
7.2 South Sulawesi
Population The population of the province is 8.5 million people and is forecast to reach 9.1 million by 2015; an average annual increase of 1.0%. This is the seventh largest (in terms of population) province in Indonesia and the largest outside of the islands of Java and Sumatra. South Sulawesi has a land area of 62,482 km² and the provincial capital is Makassar.
Vegetable production South Sulawesi produces about 256,000 tons of vegetables from almost 55,000 hectares of land; an average yield of 4.7 tons per hectare. The main vegetables grown in South Sulawesi and their average yields (tons per hectare) are as follows:
• Cabbage (25.4%) – 23.9 t/ha • Chilli (15.3%) – 2.4 to 4.9 t/ha • Yardlong Bean (7.9%) – 3.4 t/ha • Leek (6.5%) – 8.1 t/ha • Tomato (6.3%) – 3.2 t/ha
Graph 2: Production of Vegetables, South Sulawesi Province in 2005
0
10,000
20,000
30,000
40,000
50,000
60,000
70,000
Production (Ton) 65,048 39,563 20,205 16,518 16,119 12,615 12,081 11,634 11,476 8,134
Cabbage Chili Y. Bean Leek Tomato Potato Shallot Aubergin C. Cabbage
French Bean
South Sulawesi is divided into 2 geographical and climatic areas - east and west based on the mountains in the centre. When the eastern part of South Sulawesi is raining then the western part will be dry. This offers opportunities for all year round continuous production of vegetables. There is also a divide between low land agriculture (hotter climate) and the highland where it is cooler and more suitable for vegetable production.

Vegetable value chains in Eastern Indonesia–a focus on chilli
- 19 -
Vegetable production in the province of South Sulawesi occurs mainly in the regencies of Enrekang and Gowa.
• Potato – Enrekang (50%), Gowa (31%), Tator (9.9%) and Bone (6.2%) • Cabbage – Enrekang (90%), Gowa (5.2%) and Tator (2.2%) • Big chilli – Enrekang (18%), Gowa (17.4%) & 4 regencies with about 7-8% each • Small chilli – Tator (15.9%), Gowa (11.3%) and Takalar (11.3%).
Enrekang regency is in the north of the province (about 10 hours by road) while Gowa regency is in the mountains near the capital city of Makassar (about 2 hours by road).
Case Study - Port of Makassar Makassar is one of four port authorities in Indonesia under the control of central government (Medan, Jakarta, Surabaya and Makassar). Makassar port has responsibility for eastern Indonesia (from eastern Kalimantan) and covers 18 ports. The main reefer ports are: Makassar, Bitung (near Manado), Balikpapan, Sorong (Jayapura). The transportation cost of containers (reefer or non reefer) is as follows;
• Makassar to Jakarta – 20 ft = Rp3.5 million; 40ft = Rp4.0 million • Makassar to Surabaya - 20 ft = Rp2.5 million; 40ft = Rp3.0 million
The above price does not include charges etc and is negotiable depending on demand. According to an importer the cost for a mixed refrigerated container of fruit which is sent by sea from Jakarta to Makassar is Rp 18.5 million for a 40 foot container and Rp 14.5 million for a 20 foot container. There are 281 exporters registered with Customs in Makassar; about 60 of them export produce (mainly seafood) in refrigerated containers. Cargo flow at the port of Makassar has been increasing from 6.3 million tons in 2000 to 8.9 million tons in 2004 (most of this is domestic inter island trade with only 22% being export/import). Export of produce by containers has increased from 10,682 (TEU)4 in 2000 to 12,283 (TEU) in 2006. This compares to imports of containerized produce of only 1,262 (TEU) in 2006 while domestic containerized cargo was a massive 242,526 (TEU) in 2006. The top 10 items exported are: clinker, cocoa, marble, cement, wood & plywood, seafood, cashew, rubber, coffee and molasses.
Case Study – Retail Diamond Supermarket, Mal Panakkukang Diamond is one of three supermarket tenants in the main retail mall in Makassar – with Carrefour and Hypermart the other food retailers within the mall. The mall is very busy with almost 2 million visitors per month and never less than 20,000 per day. Diamond Makassar brings 1 x 20 ft reefer container per week of chilled produce from Jakarta and one open truck (20 tons) per week of fresh produce (vegetables etc) from Surabaya.
4 TEU - Container capacity is measured in twenty-foot equivalent units (TEU, or sometimes teu). An equivalent unit is a measure of containerized cargo capacity equal to one standard 20 ft (length) × 8 ft (width) × 9 ft in (height) container.

Vegetable value chains in Eastern Indonesia–a focus on chilli
- 20 -
The main vegetables issues for retailers in Makassar are: • Consistency in quantity – there is a shortage of specific vegetables from Sulawesi,
especially in the rainy season, and therefore there is a need to bring in produce from Java.
• The local quality of fresh produce is not as good as produce from Java. • There can be large fluctuations in price for some vegetables like chilli (up to Rp 25,000
per kg in December from a low of about Rp 6,000 per kg). • There is no farmer coordination, no organized distribution and no private sector
investment (except PT Focus at Malino). Diamond has one major supplier (collector) for 80% of their vegetable needs. The collector buys direct from the farmer and the wet retail market (pasar). There is no formal contract or written product specifications. If the produce does not meet Diamond’s quality requirements (visual) they will inform the collector who may chose to buy from another farmer. There are no penalties or no formal or informal information flows back to the farmer so the farmer receives no information to enable him to modify practices.
Case Study - Collector of cabbages from Malino South Sulawesi grows cabbages (65,048 ton) for local consumption and inter-island trading. At Malino (3 hours from Makassar) collectors load cabbages into trucks for shipment to East Kalimantan. The cabbages are packed into sacks in the field. Each sack is weighed (about 70 kg each) before it is emptied then the individual cabbages are loaded and stacked one by one into the truck. They are compressed to stop movement and the cabbage leaves are not removed as this is their natural packaging and protects the product. The truck was destined for Balikpapan (East Kalimantan). There is an average of 8% wastage by the time the truck arrives at the market. The price for the product that is damaged is split 50% between collector and buyer. The other product is sold on an agreed predetermined fixed price of Rp 1,500 per kg. The farmer gets paid Rp 600 – 650 per kg (about 40% of the selling price) and the truck costs Rp 150 per kg. The collector gets paid up to Rp 700 per kg (or Rp 14 million per truck).
Case Study - PT Focus Malino (Greenfields Malino) – Integrated Vegetable business Focus is a modern integrated vegetable business. It is a 50% joint venture from a Dutch person with the local government. Focus is a modern farm (with at least three tractors and modern equipment) and packing shed (grader and washer for potatoes and carrots) and two cool stores with capacity of 40 tons of produce. Most of the equipment is imported. The company has invested EU$ 1.7 million in developing this modern facility. Focus has 30 hectares of land that it owns and contracts out to 20 farmers for additional supply. It chooses farmers that are not close to the main road as they are able to negotiate a cheaper price. The business was set up about 18 months ago based on research by Focus that found there was a large margin between the price growers received and the market price. Focus pays the growers about 20% higher than other farmers receive and is able to supply direct in refrigerated trucks to the modern retailers, such as Hypermart and Diamond in Makassar at lower prices than competitors. Focus has established a supply chain based on providing its customers with a quality product at competitive prices.

Vegetable value chains in Eastern Indonesia–a focus on chilli
- 21 -
The company aims to be the major supplier of fresh vegetables in Eastern Indonesia to the modern retail and the food service (hotels / restaurants and catering) sectors. Target provinces include all provinces from East Kalimantan to Papua. At this stage, there are no formal product specifications or HACCP systems only verbal specifications. All sorting and packing is done at the packing shed located on the farm at Malino. Some of the vegetables (like cabbage) are shrink-wrapped and packed into plastic crates before cool storing and sending to Makassar in a refrigerated truck. The company needs more supply and has an opportunity of being a major hub (like a cooperative) for the district and contracting to a wider range of growers to meet their expansion plans.
Case study – Potato Farmer at Malino A major potato farmer (Musanto) of granola variety operates 47 hectares, with a nursery, about 10 cattle used for organic fertilizers, 3 tractors and 2 trucks. Chemical application is via overhead sprinklers. There is a sub agribusiness terminal (built by the Ministry of Agriculture) on the farm which is used for sorting of potatoes into sizes (S, M, L) and then into 70 kg bags. The bags are then stored in a shed until the volume is sufficient to load onto a truck for distribution to the markets of Surabaya, Makassar or Balikpapan. Cost of transport is about Rp 250 per kg to Balikpapan (Rp 5 million per truck for 20 tons). The farm employs a university graduate (plant health) as production and nursery development manager. The farm now grows the Atlantic variety (crisping) in the nursery and will be seeking a contact from Indofood.
7.3 South East Sulawesi
Population South East Sulawesi is one of the most remote regions of Sulawesi with no highway connecting it to the other provinces on the island of Sulawesi. The main transportation link is a ferry across the Bone Sea between Watampone (Bone) in South Sulawesi and the port of Kolaka in South East Sulawesi. The population of the province is 2.1 million people, mostly centered on Buton island off the south coast of South East Sulawesi and in and around Kendari (the capital). The population is forecast to reach 2.65 million by 2015; an average annual increase of 2.7%.
Vegetable production South East Sulawesi produces about 35,000 tons of vegetables from almost 7,500 hectares of land; an average yield of 4.6 tons per hectare. The main vegetables grown in South Sulawesi and their average yields are as follows:
• Aubergine (18.4%) – 8.4 t/ha • Yardlong Bean (15.9%) – 4.5 t/ha • Swamp Cabbage (13.2%) – 5.8 t/ha • Tomato (11.3%) – 5.4 t/ha • Chinese Cabbage (10.8%) – 6.5 t/ha

Vegetable value chains in Eastern Indonesia–a focus on chilli
- 22 -
Graph 3: Production of Vegetables, South East Sulawesi Province in 2005
0
1,000
2,000
3,000
4,000
5,000
6,000
7,000
Production (Ton) 6,379 5,505 4,556 3,895 3,736 2,931 2,119 1,589 1,538 718
Aubergin Y. Bean S. Cabbage Tomato C.
Cabbage Cucumber Spinach Leek Chili Cabbage
Key issues for vegetable production in South East Sulawesi are:
• The province imports a lot of vegetables from Makassar (South Sulawesi) and Surabaya (East Java) as the climate in South East Sulawesi is too hot for growing large volumes of vegetables.
• Need to improve the adoption of technology • There is no agribusiness sub-terminal in the district which would require investment • There is a need to strengthen the linkage between collectors and farmers for long term
partnerships. The system of collector coming to the farmer and the farmer accepting the price only benefits the collector (who makes the largest profit).
The major agricultural crops in the province are: cocoa, seafood and cashew.
Case Study – Retail market Pasar Baran A wide range of fresh produce is available at the local retail market. Local Large chilli retail for Rp 10,000 per kg while the smaller curly chilli was selling for Rp 5,000 (bought for Rp 4,000) per kg. The very small chilli was selling at Rp 5,000 per litre (2.5 litres per kg). Outside the market a stall offered a service to customers by processing fruits (making coconut fibre) and vegetables (eg grinding chilli and other ingredients into sauce) for a charge of Rp 3,000 per bag (1-2 kg). The machine (with a pull start motor) costs about Rp 2 million to buy.
Case Study – Wholesale market Pasar Grosir Most of the vegetables (potato, carrot, cabbage, tomato) for sale at the wholesale market in Kendari came from Makassar via bus. It takes 2 days via bus overland and ferry at a cost of Rp 600 per kg. The bus is a passenger bus loaded with about 20 passengers and sacks of vegetables squeezed into the space at the back of the bus or on the roof with other items (eg computers). Local chilli was being offered for sale at Rp 6,000 per kg; it was bought for Rp 4,000 per kg. The trader does the sorting at the market. There is an opportunity to add value by processing the damaged and poor quality chilli. However, the cost of the grinding machine is seen as being too expensive.

Vegetable value chains in Eastern Indonesia–a focus on chilli
- 23 -
7.4 Nusa Tenggara Barat (NTB)
Population Nusa Tenggara Barat (NTB) is a province in south-central Indonesia. It covers the western portion of the Lesser Sunda Islands, except for Bali. The two largest islands in the province are Lombok in the west and the larger Sumbawa island in the east. Mataram, on Lombok, is the capital and largest city of the province. The population of the province is 4.3 million; 71% of the population live on the island of Lombok.
Vegetable production NTB produces about 158,000 tons of vegetables from almost 26,000 hectares of land; an average yield of 6.1 tons per hectare. The main vegetables grown in NTB and their average yields (tons per hectare) are as follows:
• Shallot (51.5%) – 8.0 t/ha • Chilli (15.5%) – 2.5 to 3.4 t/ha • Tomato (6.6%) – 10.0 t/ha • Yardlong Bean (6.2%) – 6.3 t/ha • Swamp Cabbage (4.2%) – 17.4 t/ha
Production of shallots and small chilli from NTB are both ranked 4th in production output in Indonesia. Graph 4: Production of Vegetables, NTB Province in 2005
010,00020,00030,00040,00050,00060,00070,00080,00090,000
Production (Ton) 81,369 24,517 10,499 9,784 6,560 6,440 5,670 4,512 3,541 1,680
Shallot Chili Tomato Y.Bean S. Cabbage Garlic Cucumber Aubergin Cabbage Pumpkin
7.5 Nusa Tenggara Timur (NTT)
Population The population of the province is 4.1 million people and is forecast to reach 4.7 million by 2015. The religious mix of NTT is atypical of Indonesia, with 91% Christian (majority Catholic but a large Protestant population also) and only 8% Muslim. East Nusa Tenggara (NTT) is located in the eastern portion of the Lesser Sunda Islands, including West Timor. The provincial capital is Kupang which is located on West Timor. The

Vegetable value chains in Eastern Indonesia–a focus on chilli
- 24 -
province consists of about 550 islands covering an area of 46,138 km2, but is dominated by the three main islands of Flores, Sumba, and West Timor.
Vegetable production NTT produces about 50,000 tons of vegetables from 11,000 hectares of land; an average yield of 4.5 tons per hectare. The main vegetables grown in NTT and their average yields (tons per hectare) are as follows:
• Red Kidney Bean (16.6%) – 3.2 t/ha • Chinese Cabbage (10.0%) – 6.6 t/ha • Pumpkin (9.1%) – 7.5 t/ha • Shallot (7.6%) – 4.5 t/ha • Aubergine (6.8%) – 6.9 t/ha
Graph 5. Production of Vegetables, NTT Province in 2005
0
2,000
4,000
6,000
8,000
10,000
Production (Ton) 8,380 5,064 4,585 3,837 3,422 3,206 2,940 2,937 2,558 2,119
K.Bean C. Cabbage Pumpkin Shallot Aubergin Cucumber S.
Cabbage Tomato Chili Y. Bean
8 Focus on the Chilli Industry
8.1 Supply Overview Production of chilli5 in Indonesia has been increasing by an average of 20% per year since 2001 to reach over 1 million tons in 2005 from about 190,000 hectares; accounting for about 12% of vegetable production. In 2005, the majority of chilli grown in Indonesia was large (red) chilli (661,730 tons or 62% of chilli production) with small chilli production being 396,293 tons (or 38% of chilli production). Table 4. Indonesian Chilli in 2001 – 2005
Description 2001 2002 2003 2004 2005 Production 580,464 653,089 1,066,722 1,100,514 1,058,023 Harvested Area 142,556 150,598 176,264 194,588 187,236 Yield (Ton/Ha) 4.07 4.22 6.05 5.66 5.65 Source : Departemen Pertanian, Direktorat Jenderal Holtikultura, Direktorat Budidaya Tanaman dan Biofarmatika
5 Chilli is referred to as either (1) large or red chilli for multiple cooking uses, or (2) small chilli for sauce

Vegetable value chains in Eastern Indonesia–a focus on chilli
- 25 -
Over 60% of chilli is produced in Java with west Java (198,000 tons) being the major source of large chilli (30% of Indonesia’s production) and east Java (143,000 tons) as the major source of small chilli (36% of Indonesia’s production). Yields of large chilli range from 2.1 tons per hectare in Maluku to 12.7 tons per hectare in West Java while yields of small chilli range from 1.4 tons per hectare in South East Sulawesi to 11.8 tons per hectare in West Java. Production of large and small chilli in South Sulawesi and South East Sulawesi is ranked in size (compared to all 33 provinces) in table 5. The table shows that South Sulawesi is a significant producer of chilli (both small and large) but is inefficient in productivity (yield). South Sulawesi is ranked one of the smallest producers of both small and large chilli and lowest yield. Table 5. Production of Large and Small Chilli in South Sulawesi and S.E. Sulawesi South
Sulawesi South Sulawesi SE Sulawesi SE Sulawesi
Large chilli Small chilli Large chilli Small chilli Production (Tons) 30,168 (7th) 9,395 (8th) 820 (27th) 718 (28th) Production (HA) 6,152 (7th) 3,840 (5th) 367 (25th) 518 (22nd) Yield (T/HA) 4.9 (11th) 2.4 (27th) 2.2 (29th) 1.4 (31st)
8.2 Chilli Manufacturing – A Java Perspective The chilli sauce manufacturing industry is based on the island of Java (which has over 60% of all chilli production for fresh and processing) with 10 major companies and 12 manufacturing plants as follows: West Java (5), East Java (3), Central Java (2) and Jakarta (2). Major manufacturers of branded chilli sauce include Indofood and ABC Heinz, which both have 2 major factories each. (See Appendix 2) In addition there are numerous small home industry processors of chilli sauce e.g. PK Sinar in Makassar (South Sulawesi).
Case Study - ABC Heinz ABC is the major processor and seller of chilli sauce in Indonesia with the major shelf space in the modern retailers. ABC uses about 50 tons per day of fresh chilli. The company has contracts with growers for 50% of their needs at a fixed price of Rp 5,500 per kg delivered to the factory in Jakarta. The other 50% of supply is bought at spot prices from collectors; this can fluctuate from Rp 2,000 per kg up to Rp 15,000 per kg. ABC works with the nutrition scientists from the Institute Pertanian Bogor to develop the right quality (hotness) of chilli to meet their consumer expectations. Supply of chilli for ABC Heinz is from growers in East and West Java. ABC has an agronomy team that works with the growers on quality and pest and disease issues. The contracted growers must plant the variety of seed wanted by ABC. There are 25 farmers (per group) who work in one area of 5 hectares producing 2 tons on average. There is one agronomy supervisor for 50 hectares (10 groups). One supervisor is based in East Java and one supervisor is based in West Java. The supervisor meets with the farmer groups at least 3 times – before planting, during seeding and after harvesting.

Vegetable value chains in Eastern Indonesia–a focus on chilli
- 26 -
The farmer aims for 0.5 kg to 0.9 kg per plant depending on the soil and management. The collector will grade the chilli to meet the product specifications by ABC. ABC aims to improve issues with food safety with farmers by improving the collection of chilli so that there is no foreign matter when packaged. There is no cold chain as the chilli is used within 48 hours of arrival at the factory. However, ABC has imported frozen chilli from China when local prices were high. There is a possibility of establishing a supply chain with chilli from Sulawesi depending on prices, quality and transport availability and cost.
8.3 Chilli Industry in South Sulawesi The chilli industry in South Sulawesi is concentrated in two regencies – Gowa (south) and Enrekang (north). There are two main forms of chilli produced in Indonesia, commonly described as small chilli and Large chilli. In South Sulawesi there are a number of key differences between small chilli and Large chilli producers: Small chilli producers do not use high quality certified seed, whereas farmers in the same province producing Large chilli are using certified seed. The use of certified seed is used due to stronger market demand and greater intensity of cultivation. Small chilli cultivation appears to be less intensive and uses less chemical inputs compared to large chilli faming. In general, farmers in South Sulawesi use limited fertilizers and pesticides in comparison to chilli farming in East Java, which is highly commercialized with farmers using large quantities of fertilizers and insecticides. Small chilli cultivation uses less intensive labor treatment and technology application. Large chilli cultivation in South Sulawesi, however, is similar to what farmers in East Java are applying. Chilli production in South Sulawesi clearly needs a lot of improvement as it is way below its production capacity in both, small chilli and large chilli. Based on farmer surveys, small chilli productivity in South Sulawesi is less than 3 ton per ha which is only 50% of chilli productivity in East Java (6 ton per ha). Similarly, large chilli productivity in South Sulawesi is 3.7 ton per ha which is only 25% of large chilli productivity in East Java (15 ton per ha). One of the problems with the supply chain system is that collectors of fresh produce are not permanent (like in Java); they are flexible. There is a need to strengthen the system between collector and farmer. Another problem is the fluctuating price which results in limited commitment by farmers to grow chilli, after they have a bad harvest with low prices. There are options for value adding with some drying occurring then blending for the industrial sector. Managing the relationship between supply (harvest time) and demand is critical to enable reasonable prices to be paid to growers. Supply is erratic and there is a need for some system to manage crop production. While August – September is the peak season for chilli, prices

Vegetable value chains in Eastern Indonesia–a focus on chilli
- 27 -
decrease when production from the northern regencies are higher. Supplies to the local market decline when demand from Kalimantan and Papua increases in October – November. Figure 3: Chilli industry in South Sulawesi (Makassar)
The most common form of supply chain during the peak production season is the grower selling direct to the traditional markets (via collector). When supply is low, the traders visit the growers and buy direct. Growers are aware that prices must be higher when the wholesale traders visit the farmers so they try and get information from other traders. There is no formal market price reporting system to alert framers of market prices. As an example, in May 2006, prices for chilli dropped from Rp 7,000 per kg to Rp 3,500 per kg in two weeks. This was mainly due to an increase in supply. Break even price is about Rp 2,000 per kg. The trader sells chilli without grading at most retail markets. Sorting only occurs at the wholesale market for the modern retailers. Loses at the market are minimal at less than 1%. Pasar Makassar: Almost 90% of local chilli is sold through the wholesale market; about 30 to 50 tons per day. There are 2 main chilli traders; chilli can be sold to Surabaya and Balikpapan via airfreight if prices are good. The trader sells a sack of chilli (50 kg) with a profit margin of Rp 50,000 – Rp 70,000 per sack (Rp 1,000 per kg); however during the high season this will double. There are about ten local SME processors of chilli for sauce – some add salt during storage to extend the shelf life of the product. PK Sinar, a local chilli sauce producer, buys from the market (5-10 tons per day) if the price is low or will buy direct from the farmer. PK Sinar manufactures chilli sauce in large beer bottles for the kaki lima and small food shops.

Vegetable value chains in Eastern Indonesia–a focus on chilli
- 28 -
Case Study – Retail Diamond sells about 100 kilograms per day of chilli from 5 different varieties (more than 20 times of Matahari Hypermart, in the same location). Diamond has a large food service customer base (hotels and restaurants) and is known to be the cheapest for fresh vegetables; pasar prices and large areas to display produce encouraging bulk purchase. The retail margin is 25% (after tax). There is no HACCP, no food safety and no written specifications to suppliers. Wastage in the store is about 5% for vegetables. There is no feedback provided to farmers on quality only to the collector, but not always. There is no discount asked for if the product is of inferior quality. The main problem is the lack of volume of supply of quality product. Many times the store will accept a vegetable product that does not met visual expectation to ensure that they have product available for sale. Retail prices for chilli at Matahari are as follows:
• Cabe merah keriting – Rp 15,900 per kg • Cabe hijau TW – Rp 18,900 per kg • Cabe rawit hijau – Rp 18,990 per kg • Cabe rawit merah – Rp 19,900 per kg • Cabe merah TW – Rp 13,250 per kg • Cabe rawit Makassar – Rp 58,900 per kg
Case Study - Chilli Farmer A farmer with approximately 0.5 hectares of land (handed down from the previous generation) had planted with small chilli and inter-planted with a mixture of aubergine vegetables and rambutan (fruit) trees. The chilli plants were about 1 metre apart but in no system. The plants will last about 2 years before dying and then being replaced. Minimal inputs are applied. Some fertilizer (urea) is bought and used and some chemical spraying is done when the plants are big. The small chilli is picked when it is red and sold by the litre from the farm to collector or direct to the market. No sorting occurs on the farm.
8.4 Supply chain comparison of Chilli in South Sulawesi, South East Sulawesi and East Java
Supply Chain of Chilli in South Sulawesi – an overview In South Sulawesi, farmers sell chilli to local collectors (85%), traditional wholesalers (5%) and the local retail market (10%) (Figure #).

Vegetable value chains in Eastern Indonesia–a focus on chilli
- 29 -
Figure 4. Marketing Channel of Chilli in South Sulawesi
Half the chilli production is sent, by collectors, to the other islands. The collectors from regencies of Majene, Mamuju, Sidrap, Enrengkang, and Tator send chilli from South Sulawesi to East Kalimantan. While collectors from the regencies of Bulukumba, Takalar, Wajo and Selayar, will often send the chilli to Southeast Sulawesi. The other 50% of the chilli bought by collector is marketed to wholesalers at the Pasar Terong central market in Makassar. From the wholesaler in Pasar Terong, the chilli is sold to supermarket wholesaler (2.5%), directly to supermarket (5%), food processors (10%), to dry chilli wholesalers (20%), inter island traders (25%) and traditional market (38%). The wholesaler from South Sulawesi trades to most of Eastern Indonesia, including the cities of Balikpapan, Kendari, Ambon, Manado, Timika, and Jayapura. The total amount of chilli marketed through Pasar Terong central market is about 2-3 ton per day. Processors purchased increased volumes form the wholesale market when prices are low with PK Sinar, Sumber Baru, Merpati, and Sampurna regularly buying from wholesalers. Supermarket procures chilli either direct from the wholesaler (5%) in Pasar Terong or from specialized supermarket wholesaler (2.5%). The traditional wholesaler supplies about 50-150 kg per day of fresh small chilli to supermarket and 100-250 kg per day of large chilli. Traditional wholesaler also supplies supermarket wholesaler with premium grade chilli (2.5%), with about 50-100 kg per day used by the supermarkets. Supermarkets that procure local chilli in South Sulawesi are Diamond and Makro (150 kg per day), Carrefour, Hypermart, Gelael, and Hero (10-50 kg per day).

Vegetable value chains in Eastern Indonesia–a focus on chilli
- 30 -
Supply Chain of Chilli in South East Sulawesi – an overview South East Sulawesi has a smaller and a shorter supply chain for local chilli (Figure 5). The supply of chilli for South East Sulawesi also comes from South Sulawesi through Pasar Terong. The chilli production in South East Sulawesi is limited and not continuous through out the year. While (according to a wholesaler at Pasar Kendari central market) the market demand for chilli for wholesale is at least 500 kg per day in Kendari, the capital of South East Sulawesi. Figure 5. Supply chain of Chilli in South East Sulawesi
The localized nature of the supply chain gives farmers the opportunity to sell direct to the wholesaler at the central market (20%) and to local retailers (20%). The traditional wholesaler sells to retail market and a very small quantity goes to the supermarket (5-10 kg per day). There is only one modern supermarket in Kendari and the quantity required is considerably small, only 2-5 kg per day. Most supermarket customers are visitors to the region with the local community mostly buying food stuff from traditional markets.
A comparison with East Java The supply chain in South Sulawesi (Figure 4) is very similar to the that in East Java (Figure 6). The two chains have diversified market destinations and products, which ensure its competitiveness. However, since East Java is one of the main chilli production zones in Indonesia, its trading volume is significantly higher than South Sulawesi. Both markets are part of the main Indonesian chilli market, where South Sulawesi has a more dominant role in Eastern Indonesian market. Improving the efficiency of South Sulawesi supply chain will have significant impact especially in the East Indonesian markets.

Vegetable value chains in Eastern Indonesia–a focus on chilli
- 31 -
Figure 6. Marketing Channel of Chilli in East Java
Value Chain Analysis of Chilli A value chain analysis of the different supply chains, outlined above, (Figures 5 and 6) was undertaken based on the most common channels that farmers sell their harvest and as a basis for comparison of traditional and modern chain. Thus the chains selected are: Figure 7. Value Chain Map of Small Chilli and Large Chilli in Sulawesi Chains 1 to 3 are of both small and large chilli and Chain 4 is only for small chilli. Out of four chains, one chain is going to a traditional market (small and large chilli), two chains are going to supermarket (small and large chilli) and one chain is going to a food industry (small chilli only).
Farmer
Local retailer
Collector Central Wholesale Market
Trad. Retail Market
Food Industry
Supermarket
Inter Province Market
Consumer
Supermarket Wholesaler
Retailer at Central Market
90 %
10%
25%
5%
7.5
2.5
50%
5%
5%
10%
90%
Chain-1
Chain-2
Chain-3
Chain-4
Farmer Wholesaler Traditional Retail
Collector
Farmer Wholesaler Supermarket Collector
Farmer Wholesaler Food Industry Collector
Farmer Wholesaler Collector Supermarket Wholesaler
Supermarket
Small Chilli
Large Chilli

Vegetable value chains in Eastern Indonesia–a focus on chilli
- 32 -
Large chilli is also sold to the food industry, however, since large chilli is mixed with other materials in the process no information is currently available and is not included in the analysis. The following subsection is an analysis of value added distribution and cost for each different chain by type of chilli.
Chain 1(a) – small chilli to traditional retailers The farmer sells chilli to a local collector at the field without grading. The collector then makes an offer to several wholesalers at Pasar Terong central market. After price agreement, the collector sends the chilli to the wholesale market. The whole chain creates a value added of Rp 3,024 per kg of small chilli and the total cost spent to create the value added is Rp 1,478 per kg. From the total value added, the farmer receives the highest share, 37% and spends the highest share on the cost side (60%). Small chilli farmers spend most of that cost on labour and other inputs to create the product. However, on the marketing channel to a traditional market, there is little cost spent to create a value added. Hence the value added created is small.
Chain 1(b) –large chilli to traditional retailers For large chilli, the chain to traditional retailers creates a value add of Rp 3,383 per kg for a total cost of Rp 3,117 per kg. Compared to small chilli, the value added created by large chilli is higher but also requires higher cost (twice as much). From the total value added created, the wholesaler receives the highest share of value added (29%). The farmer still receives a high share of value added (28%) but a lot less than the farmer’s share on small chilli. In contrast, a wholesaler with only a share of 1% from the chain total cost receives the highest share of value added. The wholesaler spent most of his operational cost on labour for product procurement and selling and delivering to the retail market.
Farmer Traditional Wholesaler
Collector
Cost 60%
37% 24%
19%
16%
2%
Traditional Retail
24%
19%
1. Labor Cost 67% 2. Agro Input Cost 15% 3. Land Rent 18%
Value Added
Value Added: Rp 3,024.- per kg
Cost
Farmer Wholesaler Collector
65%
28% 17%
14%
29%
1%
Traditional Retail
26%
20%
1. Procurement Cost 38% 2. Handling Cost -% 3. Storage Cost -% 4. Selling Cost 62%
Value Added
Tot. Value Added: Rp 3,383.- per kg

Vegetable value chains in Eastern Indonesia–a focus on chilli
- 33 -
The wholesaler has the largest differential between cost and value added and this may be explained by the fact that the wholesaler has more information and when the market price is fluctuating can use the information to gain a better bargaining position and price. Chain 1a and 1b, to traditional retailers have only a small value added creation activity (the smallest among the four channels analyzed) as there is no storage, sorting, grading, packaging and labelling, and processing activities performed in the chain.
Chain 2(a) – small chilli to supermarket The farmer sells ungraded chilli to a local collector. The collector then grades and sell the highest quality chilli to a wholesaler. The wholesaler supplies only the highest quality to the supermarket. This second chain for small chilli creates value added of Rp 4,332 per kg for a total cost spend to create the value added at Rp 3,117 per kg. From the total value added created, the farmer receives the highest share of value added (44%). The small chilli farmer spends most of the cost on labour (66%) and other inputs to create the product. In this chain, the collector and wholesaler perform value added activities such as sorting, grading, and packaging. As a result, the chain creates higher value added than chain 1a.
Chain 2(b) – large chilli to supermarket The second chain on large chilli creates value added of Rp 4,552 per kg for a total cost of Rp 4,046 per kg. From the total value added created, the farmer receives the highest share of value added (37%). However, farmer also has to spend Rp 2,101 per kg (52% of the chain cost) which is mostly spent on labour (50%) and other inputs. The collector and wholesaler of large chilli perform some marketing functions to create value added such as sorting, grading and packaging as requested by the supermarket. Total value added of large chilli on the Chain 2b is 34% higher then value added created by the Chain 1b (channel to traditional market).
Value Added
Farmer Collector
Cost 39%
44% 17%
11%
Wholesaler Supermarket
20%
23%
18%
27%
1. Labor Cost 66% 2. Agro Input Cost 21% 3. Land Rent 13%
Tot. Value Added: Rp 4,332.- per kg
Value Added
Farmer Wholesaler Supermarket Collector
Cost 52%
37% 15%
11%
32%
18%
16%
19%
1. Labor Cost 50% 2. Agro Input Cost 44% 3. Land Rent 5%
Tot. Value Added: Rp 4,552.- per kg
Large Chilli

Vegetable value chains in Eastern Indonesia–a focus on chilli
- 34 -
Chain 3(a) – small chilli to supermarket, through speciality wholesaler This chain creates value added of Rp 5,810 per kg of small chilli for a total cost of Rp 2,600 per kg. From the total value added created, the speciality wholesaler receives the highest share of value added (33%). However, this wholesaler has to spend Rp 604 per kg to create those value added (22% of the chain cost), mostly spent on the cost of selling/delivery (68%). Speciality wholesalers of small chilli requires the traditional wholesaler to perform some marketing function to create value added such as sorting, grading and packaging as requested by the supermarket. The farmer also gains a high share of value added (the second highest in this chain at 28%). The total value added of small chilli in Chain 3a is 92% higher then value added created by the channel to traditional market (Chain 1a).
Chain 3(b) – large chilli to supermarket, through speciality wholesaler Chain 3(b) creates value added of Rp 5,045 per kg of large chilli for a total cost of Rp 3,935 per kg. From the total value added created, the farmer receives the highest share of value added (33%). However, the farmer also has to spend Rp 2,037 per kg (52% of the chain cost) which is mostly spent on labour (55%) and other inputs to create the product. The wholesaler of large chilli also performs some marketing function to create a value added such as sorting, grading and packaging which is requested by the supermarket. Total value added of large chilli through the Chain 3(b) is 49% higher then value added created by the channel to traditional market (Chain 1(b)).
Super Wholesaler Supermarket
33%
22%
12%
29%
Farmer
Cost 33%
28% Collector
12%
11%
Wholesaler
14%
5%
Value Added
1. Procurement Cost 16% 2. Handling Cost 16% 3. Selling/delivery Cost 68%
Tot. Value Added: Rp 5,810.- per kg
Super Wholesaler Supermarket
16%
17%
7%
16%
Farmer
Cost 52%
33%
Collector
13%
11%
1. Labor Cost 55% 2. Agro Input Cost 38% 3. Land Rent 7%
Wholesaler
31%
4%
Value Added
Total Value Added: Rp 5,045.- per kg
Small Chilli
Large Chilli

Vegetable value chains in Eastern Indonesia–a focus on chilli
- 35 -
Chain 4 – small chilli to food processing Most of food industry companies that process chilli in South Sulawesi are small and medium enterprises (SME). The industry procure chilli from wholesalers in Makassar or close by kabupatens (regencies) rather than direct from farmers. The industry does not require high quality chilli since chilli is usually processed with other materials and used only as source of spice to create the hot taste, mostly for chilli sauce. Hence, issues such as consistency, continuity and product quality are not a major issue for the SME factories that use chilli in Sulawesi. Beside, the industry demand for chilli at present is still considered small. The chain for the food industry creates a value added of Rp 3,083 per kg of small chilli for a total cost of value added of Rp 3,261 per kg. From the total value added, the farmer and the food processor receives the highest share of value added (36% and 35% respectively). The farmer has to spend Rp 881 per kg (27% of the chain cost) to create such a value added which mostly is spent on labour (67%) and other inputs to create the product. The industry, on the other hand, has spent the highest share on cost (62%) of Rp 2,014 per kg to produce chilli paste. Total value added of small chilli to a food industry is only 2% higher then value added created by the channel to traditional market.
Value Chain Analysis – Summary In summary, value chain to supermarket gives the highest return to farmers because it contains value creation activities, such as applying efficient technology in cultivation and conducting post harvest handling. The analysis of the four value chains shows that the highest value added chain is a channel to supermarket through supermarket wholesaler (Chain 1). Consistently, farmers received the highest return by supplying to the supermarket (Chain 1 and 2) compared to other channels. The lowest value added chain is a channel to traditional markets. There is a need to assist farmers to link to more dynamic markets such as a channel to supermarket and food industry. Technical assistant to farmers is also needed on more efficient cultivation technology to increase productivity and applying post harvest handling.
Farmer
27%
36%
Collector
22%
10%
1. Labor Cost 67% 2. Agro Input Cost 15% 3. Land Rent 18%
Wholesaler
6%
2%
Food Industry
35%
62% Cost
Value Added
Total Value Added: Rp 3,083.- per kg
1. Procurement Cost 1% 2. Handling cost 33% 2. Storage Cost 2% 3. Processing Cost 64%
Small Chilli

Vegetable value chains in Eastern Indonesia–a focus on chilli
- 36 -
9 Conclusions and recommendations
9.1 Indonesia has a large and diverse vegetable industry Indonesia, with a population of 220 million people, is a major consumer and producer of vegetables. In 2005, Indonesia produced more than 9 million tons (excluding almost 31 million tons of mushrooms) and imported more than 370,000 tons of vegetables, mainly from China. There are 33 provinces in Indonesia that produce over 20 types of vegetables. The main vegetables grown in Indonesia (besides mushrooms) are cabbages, chilli, potato, shallot/onions and tomato. The major vegetable producing provinces are: West Java (36%), Central Java (13%), East Java (12%) and North Sumatra (10%); these four provinces account for over 70% of all vegetable production. In Eastern Indonesia the provinces of North Sulawesi and South Sulawesi are the only major vegetable producers with 3.1% and 2.9% respectively of total Indonesian production.
9.2 Chilli has low input and productivity in Eastern Indonesia Over 60% of chilli is produced in Java with West Java (198,000 tons) being the major source of large chilli and East Java (143,000 tons) being the major source of small chilli South Sulawesi is a major producer of chilli (both small and large) but is inefficient in productivity (yield) whereas South East Sulawesi is ranked one of the smallest producers of both small and large chilli and lowest productivity. South Sulawesi has unique climatic conditions which enables it to produce chilli all year round. Generally, chilli cultivation in South East Sulawesi is less intensive and therefore has lower productivity compared to South Sulawesi. Low production and productivity in South East Sulawesi of chilli (and other vegetables) is mainly due to climatic conditions (too warm) which makes the province unsuitable for large scale vegetable production. Yields of large chilli in South Sulawesi and South East Sulawesi range from 4.9 tons and 2.2 tons per hectare respectively to 12.7 tons per hectare in west Java while yields of small chilli in South Sulawesi and Southeast Sulawesi range from 2.4 tons and 1.4 tons per hectare respectively to 11.8 tons per hectare in west Java. Most of the chilli farmers in Sulawesi are small farmers operating on “low input” farming practices. There are minimal uses of chemicals and fertilizers. Whereas, in East Java, productivity is much higher due to application of fertilizers (nutrients) and better management practices. There are opportunities to improve productivity of chilli and other vegetable farmers by introducing and adopting best practices which are being used in other provinces, such as West and East Java.

Vegetable value chains in Eastern Indonesia–a focus on chilli
- 37 -
9.3 Processing and Value-adding Opportunities Indonesian consumers consume large quantities when cooking (fresh chilli) or eating (fresh and chilli sauce). There are 10 major food companies in Indonesia that use chilli to manufacture sauces under brands such as Indofood, ABC, Sasa, Fina, Delmonte etc. All the major factories are located on the island of Java from Jakarta to Surabaya. Major companies like ABC Heinz have a formal supply chain system with their suppliers to obtain the required product and quality at a fixed price. This is a closed supply chain system where a number of growers sign up with the manufacturer to supply a specified quantity and quality of chilli at an agreed price. The customer provides information, inputs (including seed) and technical support to their suppliers. While, in Makassar (South Sulawesi) there are a number of small (PK) companies that manufacture chilli sauce for local uses at the lower end of the market (non branded). They buy their product from the market based on price not product specifications or quality. Some small traders are drying chilli for sale to wet markets while others are adding value by processing (grinding) chilli and other ingredients into sauce for a charge of Rp 3,000 per bag (1-2 kg). The processing machine costs less than Rp 2 million. This offers an opportunity for a regional farmer group to purchase a machine to process the second class quality chilli or when prices are low and there is a need to store the product. There are opportunities also to work with a major food processor (like ABC Heinz) or a local manufacturer to establish a supply chain with chilli growers in South Sulawesi for sauce.
9.4 Postharvest and Cool Chain Management Chilli and other fresh vegetables have a short shelf life because of a lack of post harvest handling practices – no packaging or cool chain. Chilli and other vegetables (such as potato and cabbage) are packed into large sacks (up to 70 kgs) and loaded onto open trucks / buses where they are sent to markets. Product deterioration and wastage is a problem for the customer but little feedback is provided along the supply chain. There is a need for more suitable packaging to protect the product from farm to market, reduce damage and increase returns. In Malino, a private company (PT Focus) has established a modern vertically integrated vegetable business involving a packing and cool-store facility with all the sorting, trimming and shrink wrapping occurring at the farm’s packhouse. Modern machines are used for washing and sorting of carrots and potatoes. The product is sent to the major cities by refrigerated truck with less wastage and at a lower retail buying price than competitors. While this may be considered a closed supply chain, the company needs more supply and there is an opportunity of expanding the supplier base by involving a wider range of growers.
9.5 Distribution options are plenty The port of Makassar is the major gateway port for Eastern Indonesia and there are over 280 registered exporters with 20% involved in refrigerated cargo business. However, most of the reefer containers are used for seafood. In addition, there are several other small ports that operate in South Sulawesi and ferry vegetables (by truck) to other islands, including Kendari

Vegetable value chains in Eastern Indonesia–a focus on chilli
- 38 -
(South East Sulawesi) and Balikpapan (East Kalimantan). Produce is sent via truck or bus on these ferries. The modern retailers in South Sulawesi all bring some supplies of fresh produce (including vegetables) by reefer container from Jakarta. Vegetables are also purchased from Surabaya in non refrigerated trucks. Major food distributors like Sukanda Jaya send up to 8 reefer containers (frozen) per month of imported and local food products from Jakarta for distribution to the food service and retail sectors. Most of the farmers have their product picked up from the road side (by a collector) in an open truck and sent to the markets. There is no pre sorting or packing of produce on the farm. This compares with PT Focus, a modern packing shed, which sorts, packs and cools the produce before sending to their major customers by refrigerated trucks. There is no modern central packing and warehouse facility in South Sulawesi, although at Malino there is an agribusiness sub-terminal, which is close to PT Focus modern packing and cool-store facility. This offers an opportunity of having discussions with major traders or collectors to gauge their interest in establishing a new supply chain using the agribusiness sub-terminal at Malino.
9.6 Market Development opportunities There is a trend towards organic and hydroponic products with some companies in Java and Bali specializing in growing a wide range of vegetables to meet this consumer trend. The market is for branded product sold via the modern retail sector. South East Sulawesi will open its first modern retail complex by 2010 and this will offer further opportunities for vegetable suppliers. Other provinces in Eastern Indonesia are expanding and also offer opportunities for suppliers of fresh vegetables, including chilli. Import replacement is the initial opportunity in Eastern Indonesia as significant quantities of fresh vegetables are imported into South Sulawesi and other Eastern Indonesia provinces from Java due to lack of availability of supply and good quality produce.
9.7 Value Chain Analysis shows weak farmer bargaining power Most of the growers are small farmers with less than one hectare of mixed farming. The farmer must sell his produce to receive some income and accepts the price offered by the collectors and traders. There is limited knowledge of selling prices in markets or trader profit margins. Profit sharing is inequitable and there is no market signals given to the farmers. There is a need to strengthen the farmer groups and to formalize a supply chain relationship between farmer and trader. The value chain analysis of four supply chains showed that supermarket gives the highest return to farmers because it contains value creation activities, such as applying efficient technology in cultivation and conducting post harvest handling. The analysis of the four value chains shows that the highest value added chain is a channel to supermarket through supermarket wholesaler. Consistently, farmers received the highest return by supplying to the supermarket compared to other channels. The lowest value added chain is a channel to traditional markets. There is a need to assist farmers to link to more dynamic markets such as a channel to supermarket and food industry.

Vegetable value chains in Eastern Indonesia–a focus on chilli
- 39 -
10 References AFFA, 2002. Forming and managing supply chains in agribusiness: learning form others,
Canberra, AFFA, CD-ROM. Note AFFA now known as DAFF BPS, Indonesia Bureau of Statistics, various publications R.S. Basuki, W. Adiyoga, Suyamto, A. Dimyati (2006) Marketing facilities needed to improve
supply chain management of vegetables in west Java, Indonesia In Acta Horticulture 699: International Symposium on Improving the Performance of Supply Chains in the Transitional Economies (June 2006 )
Dimyati, A. (2004) Supply Chain management in Indonesia: Prospects for Methodological
Adjustment and Practical Applications. In ACIAR Proceedings No. 119: Agri-product Supply Chain Management in Developing Countries
Genova II, K. Weinberger, H. An, D. Dam, N. Loc, L. Thinh, N. Thuy. 2006. Postharvest loss in
the supply chain for vegetables: The case of chilli and tomato in Viet Nam. AVRDC-The World Vegetable Center, Shanhua, Taiwan. AVRDC Publication No. 06-683, Working Paper No. 16, 47pp. This is one of a series of three completed and one for Indonesia is currently being undertaken. .
Gniffke, P (2006) Report on Inception Workshop for ACIAR CP2004/048, Integrated disease
management (IDM) for anthracnose, Phytophthora blight, and whitefly transmitted geminiviruses in chilli pepper in Indonesia, Bandungan, Central Java, Indonesia, September 4-8, 2006 31 pp.
Irianto, B., Yuniarti and P. Santoso (2006) Supply chain management assessment to improve
the performance of contract farming between a multinational company and smallholders in east Java. Acta Horticulture 699: I International Symposium on Improving the Performance of Supply Chains in the Transitional Economies (June 2006)
Natawidjaja, R.S., Noor, T.I., Perdana, T., Rasmikayanti, E., Bachri, S. and Reardon, T. (2006)
Restructuring of Agrifood Chains in Indonesia. Singgih, S and E J Woods (2004) Banana Supply Chains in Indonesia and Australia: Effects of
culture on supply chains ACIAR Proceedings No. 119 Singh, S. (2006) Horticultural Supply Chains and Small Producers in South Asia:
Governance, Participation, and Strategies Acta Horticulture 699: I International Symposium on Improving the Performance of Supply Chains in the Transitional Economies (June 2006)

Vegetable value chains in Eastern Indonesia–a focus on chilli
- 40 -
11 Appendixes
11.1 Tables on Production, Exports and Imports Table 1: Indonesia Vegetable Production in Tons, 2001 -2005
Commodities Production (ton) 2001 2002 2003 2004 2005
Chilli 580,464 635,089 1,066,722 1,100,514 1,058,023
Onions 861,150 766,572 762,795 757,399 732,610
Potatoes 831,140 893,824 1,009,979 1,072,040 1,009,619
Tomatoes 483,991 573,517 657,459 626,872 647,020
Carrots 300,648 282,248 355,802 423,722 440,001
Cabbages 1,205,404 1,232,843 1,348,433 1,432,814 1,292,984
Others 2,656,827 2,760,652 3,373,679 3,646,315 3,921,729
TOTAL 6,919,624 7,144,745 8,574,869 9,059,676 9,101,986 Source : Ministry of Agriculture Directorate General Horticulture, 2006 (ISBN: 979-99060-4-0)

Vegetable value chains in Eastern Indonesia–a focus on chilli
- 41 -
Table 2: Indonesia Harvested Area, Production & Yield of Vegetables, 2005
Description Harvested Area (%) Production (Ton) (%) Yield (Ton/Ha)
Shallot 83,614 9.2 732,609 8.4 8.8
Garlic 3,280 0.4 20,733 0.2 6.3
Leek 45,402 5.0 501,437 5.7 11.0
Potato 61,557 6.8 1,009,619 11.6 16.4
Cabbage 57,765 6.3 1,292,984 14.8 22.4
Cauli Flower 8,763 1.0 127,320 1.5 14.5
Chinese Cabbage 51,785 5.7 548,453 6.3 10.6
Carrot 24,653 2.7 440,002 5.0 17.8
Chinese Radish 3,293 0.4 54,226 0.6 16.5
Red/Kidney Bean 34,545 3.8 132,218 1.5 3.8
Yardlong Bean 84,839 9.3 466,387 5.3 5.5
Chilli 103,531 11.4 661,730 7.6 6.4
Small Chilli 83,705 9.2 396,293 4.5 4.7
Tomato 51,205 5.6 647,020 7.4 12.6
Egg Plant/Aubergine 45,340 5.0 333,328 3.8 7.4
French Bean 32,254 3.5 283,649 3.2 8.8
Cucumber 53,109 5.8 552,891 6.3 10.4
Pumpkin/Chajota 9,569 1.0 180,029 2.1 18.8
Swamp Cabbage 36,184 4.0 229,997 2.6 6.4
Spinach 36,952 4.1 123,785 1.4 3.3
TOTAL 911,345 100.0 8,734,710 100.0 9.6
Mushroom 2,542,417 73.6 30,853,530 77.9 12.1
TOTAL 3,453,762 100.0 39,588,240 100.0 11.5Source : Agricultural Survey Statistics of Vegetable and Fruit Plant Indonesia 2005

Vegetable value chains in Eastern Indonesia–a focus on chilli
- 42 -
Table 3. Total of Indonesia's Exports of Selected Fresh Vegetables, by Value (US$ '000) and Volume (Tonnes), 2005-2006
2005 2006 Commodity Description Volume
(Tonnes) Value (US$'000)
Volume (Tonnes)
Value (US$'000)
Potatoes, Fresh or Chilled Seed 176 50 72 35
Potatoes, Fresh/Chilled other than Seed 13,644 3,527 85,922 5,917
Tomatoes 1,169 433 179 92
Onions 235 101 2,922 775
Shallots 4,259 1,520 15,701 6,366
Garlic 18 7 17 11
Leeks 108 32 54 39
Cauliflowers & Head Broccoli 3,186 927 1,696 438
Brussels Sprouts 142 53 16 7
Cabbages 34,352 7,910 30,045 7,903
Cabbage Lettuce 26 9 2 5
Mushrooms 2,644 2,385 1,089 1,033
Carrots 173 38 369 103
Asparagus 543 983 - -
Celery 1 32 2 1
TOTAL 60,676 18,007 138,086 22,725 Source : The Indonesia Bureau of Statistics (BPS)

Vegetable value chains in Eastern Indonesia–a focus on chilli
- 43 -
Table 4: Indonesia Vegetable Imports (in US$'000) Commodity 1994 2001 2002 2003 2004 2005
Potatoes, Fresh or Chilled Seed 873 584 808 455 454 1,010
Potatoes, Fresh/Chilled other than Seed 164 773 747 888 1,217 2,248
Tomatoes 210 178 552 255 98 142
Onions 2,572 3,508 3,685 3,695 5,058 6,751
Shallots 5,964 12,475 9,069 12,370 14,240 15,412
Garlic 22,673 51,217 52,298 48,900 53,303 66,665
Leeks 94 34 387 109 294 571
Cauliflowers & Head Broccoli 149 216 188 243 288 568
Brussels Sprouts 1 43 7 7 30 24
Cabbages 180 117 82 175 165 180
Cabbage Lettuce 271 128 129 173 132 224
Mushrooms 94 119 58 224 209 309
Carrots 86 289 495 691 1,708 3,043
Asparagus 3 52 10 12 58 90
Celery 118 137 187 253 185 722
TOTAL 33,452 69,868 68,702 68,450 77,439 97,958Source: The Indonesian Bureau of Statistics (BPS)

Vegetable value chains in Eastern Indonesia–a focus on chilli
- 44 -
Table 5: Indonesia Vegetable Imports (in tonnes) Commodity 1994 2001 2002 2003 2004 2005
Potatoes, Fresh or Chilled Seed 866 1,136 1,436 676 683 1,360
Potatoes, Fresh/Chilled other than Seed 332 2,679 2,336 2,404 3,148 5,031
Tomatoes 219 227 1,711 380 120 125
Onions 6,340 12,964 12,913 12,343 17,385 22,133
Shallots 15,213 47,946 32,929 42,008 48,927 53,071
Garlic 29,626 205,470 226,085 218,538 243,721 283,283
Leeks 91 51 2,022 448 172 959
Cauliflowers & Head Broccoli 161 288 204 220 303 616
Brussels Sprouts 1 136 75 4 25 19
Cabbages 306 112 171 226 133 166
Cabbage Lettuce 175 106 142 171 274 240
Mushrooms 80 77 27 129 194 226
Carrots 104 476 1,262 1,623 5,239 7,030
Asparagus 2 171 9 9 38 67
Celery 138 122 144 166 142 155
TOTAL 53,652 271,961 281,465 279,345 320,505 374,482 Source : The Indonesian Bureau of Statistics (BPS)

Vegetable value chains in Eastern Indonesia–a focus on chilli
- 45 -
Table 6: Harvested Area, Production and Yield of Vegetables 2005, Province South Sulawesi
Description Harvested Area (%) Production (Ton) (%) Yield/Ha (Ton/Ha)
Shallot 2,381 4.4 12,081 4.7 5.1
Garlic 40 0.1 101 0.04 2.5
Leek 2,034 3.7 16,518 6.5 8.1
Potato 1,253 2.3 12,615 4.9 10.1
Cabbage 2,716 5.0 65,048 25.4 23.9
Cauli Flower 143 0.3 1,566 0.6 11.0
Chinese Cabbage 1,702 3.1 11,476 4.5 6.7
Carrot 796 1.5 7,113 2.8 8.9
Chinese Radish 0 0.0 0 0.0 0
Red/Kidney Bean 1,885 3.5 6,953 2.7 3.7
Yardlong Bean 5,974 11.0 20,205 7.9 3.4
Chilli 6,152 11.3 30,168 11.8 4.9
Small Chilli 3,840 7.0 9,395 3.7 2.4
Mushroom 0 0.0 0 0.0 0
Tomato 4,993 9.2 16,119 6.3 3.2
Egg Plant/Aubergin 6,251 11.5 11,634 4.5 1.9
French Bean 3,269 6.0 8,134 3.2 2.5
Cucumber 2,402 4.4 7,882 3.1 3.3
Pumpkin/Chajota 2,436 4.5 6,355 2.5 2.6
Swamp Cabbage 3,222 5.9 7,325 2.9 2.3
Spinach 3,049 5.6 5,049 2.0 1.8
TOTAL 54,538 100.0 255,737 100.0

Vegetable value chains in Eastern Indonesia–a focus on chilli
- 46 -
Table 7: Harvested Area, Production and Yield of Vegetables 2005, Province South East Sulawesi
Description Harvested Area (%) Production (Ton) (%) Yield/Ha (Ton/Ha)
Shallot 108 1.4 418 1.2 3.9
Garlic 2 0.0 5 0.0 2.5
Leek 271 3.6 1,589 4.6 5.9
Potato 0 0.0 0 0.0 0
Cabbage 114 1.5 718 2.1 6.3
Cauli Flower 5 0.1 23 0.1 4.6
Chinese Cabbage 574 7.7 3,736 10.8 6.5
Carrot 0 0.0 0 0.0 0
Chinese Radish 8 0.1 17 0.0 2.1
Red/Kidney Bean 105 1.4 66 0.2 0.6
Yardlong Bean 1,221 16.4 5,505 15.9 4.5
Chilli 367 4.9 820 2.4 2.2
Small Chilli 518 6.9 718 2.1 1.4
Mushroom 0 0.0 0 0.0 0
Tomato 715 9.6 3,895 11.3 5.4
Egg Plant/Aubergin 760 10.2 6,379 18.4 8.4
French Bean 230 3.1 609 1.8 2.6
Cucumber 569 7.6 2,931 8.5 5.2
Pumpkin/Chajota 277 3.7 473 1.4 1.7
Swamp Cabbage 792 10.6 4,556 13.2 5.8
Spinach 822 11.0 2,119 6.1 2.6
TOTAL 7,458 100.0 34,577 100.0

Vegetable value chains in Eastern Indonesia–a focus on chilli
- 47 -
Table 8: Harvested Area, Production and Yield of Vegetables 2005, Province NTB
Description Harvested Area (%) Production (Ton) (%)
Yield/Ha (Ton/Ha)
Shallot 10,136 39.4 81,369 51.5 8.0
Garlic 655 2.5 6,440 4.08 9.8
Leek 9 0.0 66 0.0 7.3
Potato 33 0.1 307 0.2 9.3
Cabbage 355 1.4 3,541 2.2 10.0
Cauli Flower 10 0.0 27 0.0 2.7
Chinese Cabbage 199 0.8 1,167 0.7 5.9
Carrot 40 0.2 360 0.2 9.0
Chinese Radish 0 0.0 0 0.0 0.0
Red/Kidney Bean 337 1.3 324 0.2 1.0
Yardlong Bean 1,553 6.0 9,784 6.2 6.3
Chilli 549 2.1 1,867 1.2 3.4
Small Chilli 9,060 35.2 22,650 14.3 2.5
Mushroom 78 0.3 190 0.1 2.4
Tomato 1,048 4.1 10,499 6.6 10.0
Egg Plant/Aubergin 469 1.8 4,512 2.9 9.6
French Bean 92 0.4 148 0.1 1.6
Cucumber 504 2.0 5,670 3.6 11.3
Pumpkin/Chajota 84 0.3 1,680 1.1 20.0
Swamp Cabbage 377 1.5 6,560 4.2 17.4
Spinach 168 0.7 823 0.5 4.9
TOTAL 25,756 100.0 157,984 100.0

Vegetable value chains in Eastern Indonesia–a focus on chilli
- 48 -
Table 9: Harvested Area, Production and Yield of Vegetables 2005, Province NTT
Description Harvested Area (%) Production (Ton) (%)
Yield/Ha (Ton/Ha)
Shallot 852 7.6 3,837 7.6 4.5
Garlic 421 3.8 1,764 3.50 4.2
Leek 88 0.8 532 1.1 6.0
Potato 403 3.6 1,808 3.6 4.5
Cabbage 235 2.1 1,237 2.5 5.3
Cauli Flower 57 0.5 357 0.7 6.3
Chinese Cabbage 767 6.8 5,064 10.0 6.6
Carrot 281 2.5 1,817 3.6 6.5
Chinese Radish 4 0.0 29 0.1 7.3
Red/Kidney Bean 2,627 23.4 8,380 16.6 3.2
Yardlong Bean 910 8.1 2,119 4.2 2.3
Chilli 378 3.4 1,067 2.1 2.8
Small Chilli 644 5.7 1,491 3.0 2.3
Mushroom 0 0.0 0 0.0 0.0
Tomato 419 3.7 2,937 5.8 7.0
Egg Plant/Aubergin 499 4.5 3,422 6.8 6.9
French Bean 288 2.6 1,799 3.6 6.2
Cucumber 520 4.6 3,206 6.4 6.2
Pumpkin/Chajota 615 5.5 4,585 9.1 7.5
Swamp Cabbage 632 5.6 2,940 5.8 4.7
Spinach 564 5.0 2,022 4.0 3.6
TOTAL 11,204 100.0 50,413 100.0

Vegetable value chains in Eastern Indonesia–a focus on chilli
- 49 -
Table 10: List of Major Chilli Manufacturers in Indonesia
No Company Name Brand City Province
1 Indosentra Pelangi, PT Indofood Bekasi West Java
2 Indosentra Pelangi , PT Indofood Semarang Central Java
3 Lasallefood, PT Delmonte Jakarta DKI Jakarta
4 Sekar Laut Tbk, PT Fina Sidoarjo East Java
5 Ika Food Putramas, PT Kokita Bandung West Java
6 Heinz ABC Indonesia, PT ABC Jakarta DKI Jakarta
7 Heinz ABC Indonesia, PT ABC Karawang Timur West Java
8 Mitratama Kencana Sejati, PT Sasa Bekasi West Java
9 Merak Food Indrutries, PT Soiz Bandung West Java
10 Lombok Gandaria, PT Gandaria Solo Central Java
11 Rimbaria, PT Rimbaria Surabaya East Java
12 Batara Agung Mulia, PT Bahagia, Raja Rasa Surabaya East Java
13 PK. Sinar - Makassar South Sulawesi

Vegetable value chains in Eastern Indonesia–a focus on chilli
- 50 -
11.2 Farming Analysis of Small Chilli and Large Chilli in South Sulawesi and East Java South Sulawesi East Java
Small Chilli Large Chilli Small Chilli Large Chilli Prod. Factor
Unit Amount (Per Ha)
Value (Rp/Ha)
Amount (Per Ha)
Value (Rp/Ha)
Amount (Per Ha)
Value (Rp/Ha)
Amount (Per Ha)
Value (Rp/Ha)
A. Agro Input
1. Seed 212,500 600,000 150,000 600,000
a. Certified Seed Pack - - 10 600,000 10 150,000 10.00 600,000
b. Local Seed (Uncertified) Pack 25 212,500 - - - - -
2. Fertilizer 310,000 935,000 280,000 1,110,000
a. Chemical Fertilizer 310,000 310,000 280,000 1,110,000
- Urea Kg 150 210,000 150 210,000 - - -
- SP-36 Kg - - - 75 127,500 150 255,000
- KCl Kg 50 100,00 50 100,000 50 70,000 300 420,000
- ZA Kg - - - 75 82,500 350 385,000
- KNO4 Kg - - - - - 10 50,000
b. Organic Fertilizer Kg - - 2,500 625,000 - - -
3. Pesticide 106,250 960,000 805,000 1,417,000
- Herbicide L - - - 3 120,000 7 280,000
- Fungicide Kg - - 8 480,000 6 252,000 12 504,000
- Insecticide 1 L 2.5 106,250 16 480,000 4 148,000 4 148,000
- Insecticide 2 L - - - 5 185,000 5 185,000
- Insecticide 3 L - - - 0.1 100,000 0.3 300,000
4. Materials - 500,000 17,500 2,952,500
a. Mulch Roll - - - - - 10 1,800,000
b. Long Stick Batang - - 20,000 500,000 - - 15,000 1,050,000
c. Short Stick Batang - - - - - 6 60,000
c. Seedling Polybag Pack - - - 10 17,500 10 17,500

Vegetable value chains in Eastern Indonesia–a focus on chilli
- 51 -
South Sulawesi East Java Small Chilli Large Chilli Small Chilli Large Chilli Prod. Factor
Unit Amount
(Per Ha) Value
(Rp/Ha) Amount (Per Ha)
Value (Rp/Ha)
Amount (Per Ha)
Value (Rp/Ha)
Amount (Per Ha)
Value (Rp/Ha)
d. Plastic Rope Gulung - - - - - 5 25,000
Total Agro Input Cost Rp/Ha 628,750 2,995,000 1,252,500 6,079,500
B. Labor
1. Seeding HOK 2 40,000 2 40,000 - 486,000
a. Seed preparation HOK - - - - - 27 270,000
b. Bed seeding HOK - - - - - 12 216,000
2. Land preparation 500,000 620,000
2,300,000
2,300,000
a. Ploughing HOK 25 500,000 25 500,000 60 600,000 60 600,000
b. land rowing (guludan) HOK - - 6 120,000 170 1,700,000 170 1,700,000
3. Planting HOK 15 262,500 15 225,000 15 150,000 20 400,000
4. Re-planting HOK 14 280,000 15 300,000 4 40,000 8 80,000
5. Watering/irrigation HOK 30 600,000 25 500,000 3 30,000 6 60,000
6. Pruning HOK - - - - - 25 250,000
7. Weeding HOK 30 600,000 20 400,000 10 100,000 10 100,000
8. Fertilizing HOK 8 160,000 30 600,000 45 450,000 107 1,070,000
9. Spraying HOK 30 600,000 40 800,000 30 300,000 180 1,800,000
10. Plant Maintenance HOK - 600,000 - 1,110,000
a. Mulching HOK - - - 56 560,000
b. Stick enforcing HOK - 10 200,000 - 15 150,000
c. Roping HOK - 10 200,000 - 25 250,000
d. Supporting HOK - 10 200,000 - 15 150,000
11. Harvesting HOK 45 787,500 60 1,200,000 30 300,000 120
1,200,000
Total Labor Cost Rp/Ha 3,830,000 5,285,000 3,670,000 8,856,000

Vegetable value chains in Eastern Indonesia–a focus on chilli
- 52 -
South Sulawesi East Java Small Chilli Large Chilli Small Chilli Large Chilli Prod. Factor
Unit Amount
(Per Ha) Value
(Rp/Ha) Amount (Per Ha)
Value (Rp/Ha)
Amount (Per Ha)
Value (Rp/Ha)
Amount (Per Ha)
Value (Rp/Ha)
C. Land Rent Ha 1 400,000 1
400,000 1 750,000 1 3,000,000
D. Depreciation 80,000 180,000 536,667 536,667
a. Sprayer unit 1 30,000 1 30,000 5 300,000 5 300,000
b. Hand plough unit 2 25,000 3 25,000 2 50,000 2 50,000
c. Sabit unit 2 12,500 3 12,500 2 20,000 2 20,000
d. Kored unit 2 12,500 2 12,500 2 16,667 2 16,667
e. selang rol - - 1 100,000 1 150,000 1 150,000
Total Cost Rp/Ha 4,898,750 8,860,000 6,209,167 18,472,167
Production Kg/Ha 3,000 3,700 5,000 15,000
Selling Price Rp/Kg 2,000 3,000 1,700 3,000
Revenue Rp/Ha 6,000,000 11,100,000 8,500,000 45,000,000
Profit Rp/Ha 1,061,250 2,240,000 2,290,833 26,527,833

Vegetable value chains in Eastern Indonesia–a focus on chilli
- 53 -
11.3 Comparison of Farming Activities and Technology in South Sulawesi and East Java
South Sulawesi East Java Description Small Chilli Large Chilli Small Chilli Large Chilli
Labor
1. Land preparation
- Cleaning and seeding √ √ √ √
- Ploughing √ √ * √ * - Drainaging √ √ √ - Fertilizing
(organic) √ - Land rowing √ √ √ - Mulching √ √
2. Maintenance - Replanting √ √ √ √ - Stick enforcing √ √ -
Watering/irrigating √ √ √ √ - Fertilizing √ √ √ - Weeding √ √ √ √ - Insect and
disease control √ ** √ √ √ 3. Harvesting √ √ √ √
Agro input 1. Certified seed √ √ √ 2. Fertilizer
- Urea √ - TSP √ √ - KCl √ *** √ √ - ZA √ √
3. Pesticide √ √ √ √ *) Ploughing using tractors **) Insect controlling is less intensive/ no prevention ***) Most farmers do not use KCL, only farmer in partnership with supermarket wholesaler use it

Vegetable value chains in Eastern Indonesia–a focus on chilli
- 54 -
11.4 Summary of Small Chilli Value Chain
No. Chain Actor and Activities
Farm-Coll-Trad Whol-
Trad Ret
Farm-Coll-Trad Whol-
Superm
Farm- Coll - Trad
Whol-Spr Whol-
Superm
Farm-Coll-Trad Whol-
F Ind
I A. Farmers Total Cost of Farmer Rp/Kg 881 1,047 881 881 % 60 39 33 27
Value Added Rp/Kg 1,119 1,927 1,634 1,119 % 37 44 28 36 Selling Price Rp/Kg 2,000 2,974 2,516 2,000II Collector
Total Cost Rp/Kg 284 292 284 314 % 19 11 11 10 Value Added Rp/Kg 716 734 716 686 % 24 17 12 22
Selling Price Rp/Kg 3,000 4,000 3,516 3,000III Traditional Wholesaler
Total Cost Rp/Kg 29 614 146 37 % 2 23 5 1 Value Added Rp/Kg 471 886 838 213 % 16 20 14 7 Selling Price Rp/Kg 3,500 5,500 4,500 3,250
IV Supermarket Wholesaler Total Cost Rp/Kg 604 % 22 Value Added Rp/Kg 1,896 % 33 Selling Price Rp/Kg 7,000
V Supermarket Total Cost Rp/Kg 715 775 % 27 29 Value Added Rp/Kg 785 725 % 18 12 Selling Price Rp/Kg 7,000 8,500
VI Traditional Retail Total Cost Rp/Kg 282 % 19 Value Added Rp/Kg 718 % 24 Selling Price Rp/Kg 4,500 Total Cost Rp/Kg 2,017 % 62 Value Added Rp/Kg 1,077 % 35 Selling Price Rp/Kg 6,344
Total Cost Rp/Kg 1,476 2,668 2,690 3,249 Total Value Added Rp/Kg 3,024 4,332 5,810 3,095Note: Farm=Farmer; Coll=Collector; Trd Woll=Traditional Wholesaler Market; Spr Whol= Supermarket Wholesaler; Trad Ret=Traditional Retail Market; Superm=Supermarket

Vegetable value chains in Eastern Indonesia–a focus on chilli
- 55 -
11.5 Detail of Small Chilli Value Chain Note: Farm=Farmer; Coll=Collector; Trd Woll=Traditional Wholesaler Market; Spr Whol= Supermarket Wholesaler; Trad Ret=Traditional Retail Market; Superm=Supermarket
No
Supply Chain Actor and Activities Farm-Coll-Trad Whol-Trad
Ret Farm-Coll-Trad Whol-
Superm Farm- Coll - Trad Whol-
Spr Whol-Superm Farm-Coll-TradWhol-
F Ind
Value % Value % Value % Value % IA Farmers 1 Labor Cost (family and hired) a. Land preparation Rp/Kg 175 30% 120 17% 175 30% 175 30% b. Fertilizer application Rp/Kg 53 8% c. Pesticide application Rp/Kg 105 18% 200 29% 105 18% 105 18% d. Weeding Rp/Kg 73 12% 61 9% 73 12% 73 12% e. Harvesting Rp/Kg 234 40% 260 37% 234 40% 234 40% Total Labor Cost Rp/Kg 587 67% 694 66% 587 67% 587 67%
2 Agro Input Cost a. Seed Rp/Kg 85 63% 71 32% 85 63% 85 63% b. Fertilizer Rp/Kg 103 47% c. Pesticide Rp/Kg 43 32% 35 16% 43 32% 43 32% d. Stick, Plastic and other Input Rp/Kg 7 5% 10 5% 7 5% 7 5% Total Input Cost Rp/Kg 135 15% 220 21% 135 15% 135 15%
3 Land Rent Rp/Kg 160 18% 133 13% 160 18% 160 18% Total Cost Rp/Kg 881 60% 1,047 39% 881 33% 881 27%
4 Selling Price Rp/Kg 2,000 2,974 2,516 2,000 Profit/Value Added Rp/Kg 1,119 37% 1,927 44% 1,634 28% 1,119 36%
II Collector 1 Buying Price Rp/Kg 2,000 2,974 2,516 2,000 2 Procurement a. Labor Rp/Kg 21 27% 21 25% 21 27% 21 19% - Load-unload Rp/Kg 15 73% 15 73% 15 73% 15 73% - Driver and Ass. Driver Rp/Kg 6 27% 6 27% 6 27% 6 27%

Vegetable value chains in Eastern Indonesia–a focus on chilli
- 56 -
No
Supply Chain Actor and Activities Farm-Coll-Trad Whol-Trad
Ret Farm-Coll-Trad Whol-
Superm Farm- Coll - Trad Whol-
Spr Whol-Superm Farm-Coll-TradWhol-
F Ind
Value % Value % Value % Value % b. Equipment and Materials Rp/Kg 28 35% 28 32% 28 35% 58 53% - Depreciation of scale Rp/Kg 0.3 1% 0.3 1% 0 1% - Package material Rp/Kg 15 55% 15 55% 15 55% 15 27% - Depreciation of car Rp/Kg 6 23% 6 23% 6 23% 6 11% - Operational cost of car Rp/Kg 6 21% 6 21% 6 21% 36 62% c. Weight Loss Rp/Kg 30 38% 38 43% 30 38% 30 28% d. Retribution Rp/Kg 0% Procurement Cost Rp/Kg 79 28% 86 30% 79 28% 109 35%
3 Handling (Sorting, Grading, Packaging)
a. Labor Rp/Kg 13 34% b. Equipment and Materials Rp/Kg 2 4% - Depreciation of Container Rp/Kg 0.3 15% - Depreciation of Building Rp/Kg 1 70% - Depreciation of Scale Rp/Kg 0.3 15% b. Weight Loss Rp/Kg 25 62% Handling Cost Rp/Kg 40 14%
4 Storage a. Equipment and Materials Rp/Kg - Depreciation of Building Rp/Kg Storage Cost Rp/Kg 0 0%
5 Delivery a. Labor Rp/Kg 15 8% 15 9% 15 8% 15 8% b. Equipment and Materials Rp/Kg 150 73% 150 91% 150 73% 150 73% - Truck rental and operational Rp/Kg 150 100% 150 100% 150 100% 150 100% - Package Material Rp/Kg c. Weight Loss Rp/Kg 39 19% 39 19% 39 19% d. Retribution Rp/Kg 0%

Vegetable value chains in Eastern Indonesia–a focus on chilli
- 57 -
No
Supply Chain Actor and Activities Farm-Coll-Trad Whol-Trad
Ret Farm-Coll-Trad Whol-
Superm Farm- Coll - Trad Whol-
Spr Whol-Superm Farm-Coll-TradWhol-
F Ind
Value % Value % Value % Value % Delivery Cost Rp/Kg 205 72% 165 57% 205 72% 205 65% Total Cost Rp/Kg 284 19% 292 11% 284 11% 314 10%
6 Selling Price Rp/Kg 3,000 4,000 3,516 3,000 Profit/Value Added Rp/Kg 716 24% 734 17% 716 12% 686 22%
III Traditional Wholesaler 1 Buying Price 3,000 4,000 3,516 3,000 2 Procurement a. Labor 23 91% 99 98% 23 91% 23 92% - Load-unload Rp/Kg 15 66% 99 100% 15 66% 15 66% - Scaling Rp/Kg 8 34% 8 34% 8 34% b. Equipment and Materials 0.3 1.0% 0.3 1% - Depreciation of scale Rp/Kg 0.3 100% 0.3 100% c. Retribution Rp/Kg 2 8% 2 2% 2 8% 2 8% Procurement Cost Rp/Kg 26 90% 100 16% 26 18% 25 49%
3 Handling (Sorting, Grading, Packaging)
a. Labor Rp/Kg 83 75% 35 32% 15 100% b. Equipment and Materials Rp/Kg 28 25% 60 68% - Depreciation of Container Rp/Kg 23 81% 0.2 0.3% - Rag Rp/Kg - Plat Rp/Kg - Rent land/Building Rp/Kg 5 16% - sack Rp/Kg - Depreciation of scale Rp/Kg 1 2% -Packaging Rp/Kg 15 20% 15 100% - Weight Loss Rp/Kg 60 100% Handling Cost Rp/Kg 0.00 0% 112 18% 110.6 76% 15 30%
4 Storage a. Labor Rp/Kg

Vegetable value chains in Eastern Indonesia–a focus on chilli
- 58 -
No
Supply Chain Actor and Activities Farm-Coll-Trad Whol-Trad
Ret Farm-Coll-Trad Whol-
Superm Farm- Coll - Trad Whol-
Spr Whol-Superm Farm-Coll-TradWhol-
F Ind
Value % Value % Value % Value % b. Equipment and Materials Rp/Kg - Depreciation of Building - packaging Rp/Kg - Weight Loss Rp/Kg Storage Cost Rp/Kg
5 Delivery a. Labor Rp/Kg 83 21% b. Equipment and Materials Rp/Kg 44 11% 7 70% 11 100% -Packaging Rp/Kg - Truck Rp/Kg 44 100% 11 100% - Ferry Rp/Kg - Depreciation of Scaling Rp/Kg 7 100% c. Weight Loss d. Fee 275 68%
d. Retribution Rp/Kg 3 100% 3 30% Delivery Cost Rp/Kg 3 10% 402 65% 10 7% 11 22% Total Cost Rp/Kg 29 2% 614 23% 146 5% 52 2%
6 Selling Price Rp/Kg 3,500 5,500 4,500 3,250 Profit/Value Added Rp/Kg 471 16% 886 20% 838 14% 198 6%
IV Supermarket Wholesaler 1 Buying Price Rp/Kg 4,500 2 Procurement a. Labor Rp/Kg 35 35% b. Equipment and Materials Rp/Kg 15 16% c. Fee Rp/Kg 0% d. Retribution Rp/Kg 8 8% e. Truck Rp/Kg 41 41%

Vegetable value chains in Eastern Indonesia–a focus on chilli
- 59 -
No
Supply Chain Actor and Activities Farm-Coll-Trad Whol-Trad
Ret Farm-Coll-Trad Whol-
Superm Farm- Coll - Trad Whol-
Spr Whol-Superm Farm-Coll-TradWhol-
F Ind
Value % Value % Value % Value % Procurement Cost Rp/Kg 98 16%
3 Handling (Sorting, Grading, Packaging)
a. Labor Rp/Kg 26 27% b. Equipment and Materials Rp/Kg 25 26% -Packaging Rp/Kg 21 82% -Depreciation of Scale Rp/Kg 1 3% -Building Rp/Kg 4 15% -Plat Rp/Kg -Land rent Rp/Kg b. Weight Loss Rp/Kg 45 47% b. Fee Rp/Kg Handling Cost Rp/Kg 96 16%
4 Storage a. Labor Rp/Kg b. Equipment and Materials Rp/Kg -Depreciation of Building Rp/Kg -land Rent Rp/Kg
-Depreciation of Packaging
Material Rp/Kg c. Weight Loss Rp/Kg Storage Cost Rp/Kg
5 Delivery a. Labor Rp/Kg 19 32% b. Equipment and Materials Rp/Kg 41 68% -Package Material Rp/Kg -Depreciation of Truck Rp/Kg 16 38% -Truck Operational cost Rp/Kg 25 62% Delivery Cost Rp/Kg 60 10%
6 Fee Rp/Kg 350 58%

Vegetable value chains in Eastern Indonesia–a focus on chilli
- 60 -
No
Supply Chain Actor and Activities Farm-Coll-Trad Whol-Trad
Ret Farm-Coll-Trad Whol-
Superm Farm- Coll - Trad Whol-
Spr Whol-Superm Farm-Coll-TradWhol-
F Ind
Value % Value % Value % Value % Total Cost Rp/Kg 604 22%
7 Selling Price Rp/Kg 7,000 Profit/Value Added Rp/Kg 1,896 33%
V Supermarket 1 Buying Price Rp/Kg 5,500 7,000 2 Handling cost a. Labor Rp/Kg 240 34% 240 31% b. Material Rp/Kg 255 36% 255 33% c. Weight Loss Rp/Kg 220 31% 280 36% Total Cost Rp/Kg 715 27% 775 29%
2 Selling Price Rp/Kg 7,000 8,500 Profit/Value Added Rp/Kg 785 18% 725 12%
VI Traditional Retail 1 Buying Price Rp/Kg 3,500 2 Procurement a. Labor Rp/Kg 15 100% b. Equipment and Materials Rp/Kg -Depreciation of Scale Rp/Kg -Truck Rental Rp/Kg c. Retribution Rp/Kg d. Weight Loss Rp/Kg Procurement Cost Rp/Kg 15 5%
3 Handling (Sorting, Grading, Packaging)
a. Labor Rp/Kg 7 100% b. Equipment and Materials Rp/Kg 52 88%

Vegetable value chains in Eastern Indonesia–a focus on chilli
- 61 -
No
Supply Chain Actor and Activities Farm-Coll-Trad Whol-Trad
Ret Farm-Coll-Trad Whol-
Superm Farm- Coll - Trad Whol-
Spr Whol-Superm Farm-Coll-TradWhol-
F Ind
Value % Value % Value % Value % - Depreciation of scale Rp/Kg 2 4% - Package material Rp/Kg 50 96% Handling Cost Rp/Kg 59 21%
4 Storage a. Equipment and Materials Rp/Kg 77 37% -Storage Rent Rp/Kg 77 100% b. Retribution Rp/Kg 23 11% c. Weight loss Rp/Kg 108 52% Storage Cost Rp/Kg 208 74%
5 Delivery a. Labor Rp/Kg b. Equipment and Materials Rp/Kg - Depreciation of scale Rp/Kg - Package material Rp/Kg Delivery Cost Rp/Kg Total Cost Rp/Kg 282 19%
6 Selling Price Rp/Kg 4,500 Profit/Value Added Rp/Kg 718 24%
VII Food Industry 1 Buying Price Rp/Kg 3,250 2 Procurement a. Labor Rp/Kg 20 99% b. Equipment and Materials Rp/Kg 0.2 1% -Depreciation of Scale Rp/Kg 0.2 100% -Truck Rental Rp/Kg c. Retribution Rp/Kg d. Weight Loss Rp/Kg

Vegetable value chains in Eastern Indonesia–a focus on chilli
- 62 -
No
Supply Chain Actor and Activities Farm-Coll-Trad Whol-Trad
Ret Farm-Coll-Trad Whol-
Superm Farm- Coll - Trad Whol-
Spr Whol-Superm Farm-Coll-TradWhol-
F Ind
Value % Value % Value % Value % Procurement Cost Rp/Kg 20 1%
3 Handling (Sorting, Grading, Packaging)
a. Labor Rp/Kg 500 93.8% b. Equipment and Materials Rp/Kg 1 0.1% b. Weight Loss Rp/Kg 33 2% Handling Cost Rp/Kg 533 26%
4 Processing Cost a. Labor Rp/Kg 60 4% b. Equipment and Materials Rp/Kg 1,323 96%
- Engine, Machine, Gerinda, and Belt Rp/Kg 70 5%
- Sack, Rp/Kg 1 0.04% - Water fee Rp/Kg 3 0.26% - Package Rp/Kg 1,250 94% Processing Cost Rp/Kg 1,383 69%
5 Storage a. Labor Rp/Kg 20 60% a. Equipment and Materials Rp/Kg 2 7% -Storage Rent Rp/Kg 2 100% b. Drum Rp/Kg 11 34% c. Retribution Rp/Kg d. Weight loss Rp/Kg Storage Cost Rp/Kg 33 2%
6 Processing a. Labor Rp/Kg 20 2% b. Equipment and Materials Rp/Kg 1,250 96% - Engine Rp/Kg 64 92%

Vegetable value chains in Eastern Indonesia–a focus on chilli
- 63 -
No
Supply Chain Actor and Activities Farm-Coll-Trad Whol-Trad
Ret Farm-Coll-Trad Whol-
Superm Farm- Coll - Trad Whol-
Spr Whol-Superm Farm-Coll-TradWhol-
F Ind
Value % Value % Value % Value % - Machine Rp/Kg 2 2%
- Gerinda Rp/Kg 3 4% - Belt Rp/Kg 1 1%
- Package material Rp/Kg 1,250 100% c. Retribution Rp/Kg 1 0% d. Truck Rent Rp/Kg 27 2% Processing Cost Rp/Kg 1,298 64% Total Cost Rp/Kg 2,014 62%
7 Selling Price Rp/Kg 6,344 Profit/Value Added Rp/Kg 1,080 35% Farmer share % 44% 42% 30% 32% Total Value Added Rp/Kg 3,027 100% 4,332 100% 5,849 100% 3,082 65% Total Cost Rp/Kg 1,473 100% 2,668 100% 2,651 100% 3,262 38%

Vegetable value chains in Eastern Indonesia–a focus on chilli
- 64 -
11.6 Summary of Large Chilli Value Chain Note: Farm=Farmer; Coll=Collector; Trd Woll=Traditional Wholesaler Market; Spr Whol= Supermarket Wholesaler; Trad Ret=Traditional Retail Market; Superm=Supermarket
No. Chain Actor and Activities Farm-Coll-TradWhol-Trad Ret
Farm-Coll-Trad Whol-
Superm
Farm-Coll-Trad Whol-Supr Whol-
Superm
I Farmers Total Cost of Farmer Rp/Kg 2,037 2,101 2,037 % 65 52 58 Value Added Rp/Kg 963 1,683 1,671 % 28.4 38 31
Selling Price Rp/Kg 3,000 3,784 3,708 II Collector
Total Cost Rp/Kg 418 425 425 % 13 11 12 Value Added Rp/Kg 582 686 664 % 17 15 12
Selling Price Rp/Kg 4,000 4,895 4,797 III Traditional Wholesaler
Total Cost Rp/Kg 35 727 154 % 1 18 4 Value Added Rp/Kg 965 1,378 1,549 % 28.5 31 28
Selling Price Rp/Kg 5,000 7,000 6,500 IV Supermarket Wholesaler
Total Cost Rp/Kg 294 % 8 Value Added Rp/Kg 1,206 % 22
Selling Price Rp/Kg 8,000 V Supermarket
Total Cost Rp/Kg 775 650 % 19 18 Value Added Rp/Kg 725 350 % 16 6
Selling Price Rp/Kg 8,500 9,000 VI Traditional Retail
Total Cost Rp/Kg 621 % 20 Value Added Rp/Kg 879 % 26
Selling Price Rp/Kg 6,500 VII Food Industry
Total Cost Rp/Kg % Value Added Rp/Kg %
Selling Price Rp/Kg TOTAL COST Rp/Kg 3,111 4,028 3,560 TOTAL VALUE ADDED Rp/Kg 3,389 4,472 5,440

11.7 Detail of Large Chilli Value Chain Note: Farm=Farmer; Coll=Collector; Trd Woll=Traditional Wholesaler Market; Spr Whol= Supermarket Wholesaler; Trad Ret=Traditional Retail Market; Superm=Supermarket
No Supply Chain Actor and Activities Farm-Coll-TradWhol-Trad Ret
Farm-Coll-Trad Whol-Superm
Farm-Coll-Trad Whol-Supr Whol-Superm
Value % Value % Value % IA Farmers 1 Labor Cost (family and hired) a. Land preparation Rp/Kg 193 17% 250 24% 193 17% b. Fertilizer application Rp/Kg 133 12% 162 15% 133 12% c. Pesticide application Rp/Kg 296 27% 216 20% 296 27% d. Weeding Rp/Kg 156 14% 189 18% 156 14% e. Harvesting Rp/Kg 333 30% 243 23% 333 30% Total Labor Cost Rp/Kg 1,111 55% 1,061 50% 1,111 55%
2 Agro Input Cost a. Seed Rp/Kg 222 29% 162 17% 222 29% b. Fertilizer Rp/Kg 309 40% 347 37% 309 40% c. Pesticide Rp/Kg 37 5% 270 29% 37 5% d. Stick, Plastic and other Input Rp/Kg 209 27% 153 16% 209 27% Total Input Cost Rp/Kg 778 38% 933 44% 778 38%
3 Land Rent Rp/Kg 148 7% 108 5% 148 7% Total Cost Rp/Kg 2,037 65% 2,101 52% 2,037 52%
4 Selling Price Rp/Kg 3,000 3,784 3,708 Profit/Value Added Rp/Kg 963 28% 1,683 37% 1,671 33%
II Collector Value % Value % Value % 1 Buying Price Rp/Kg 3,000 3,784 3,708 2 Procurement
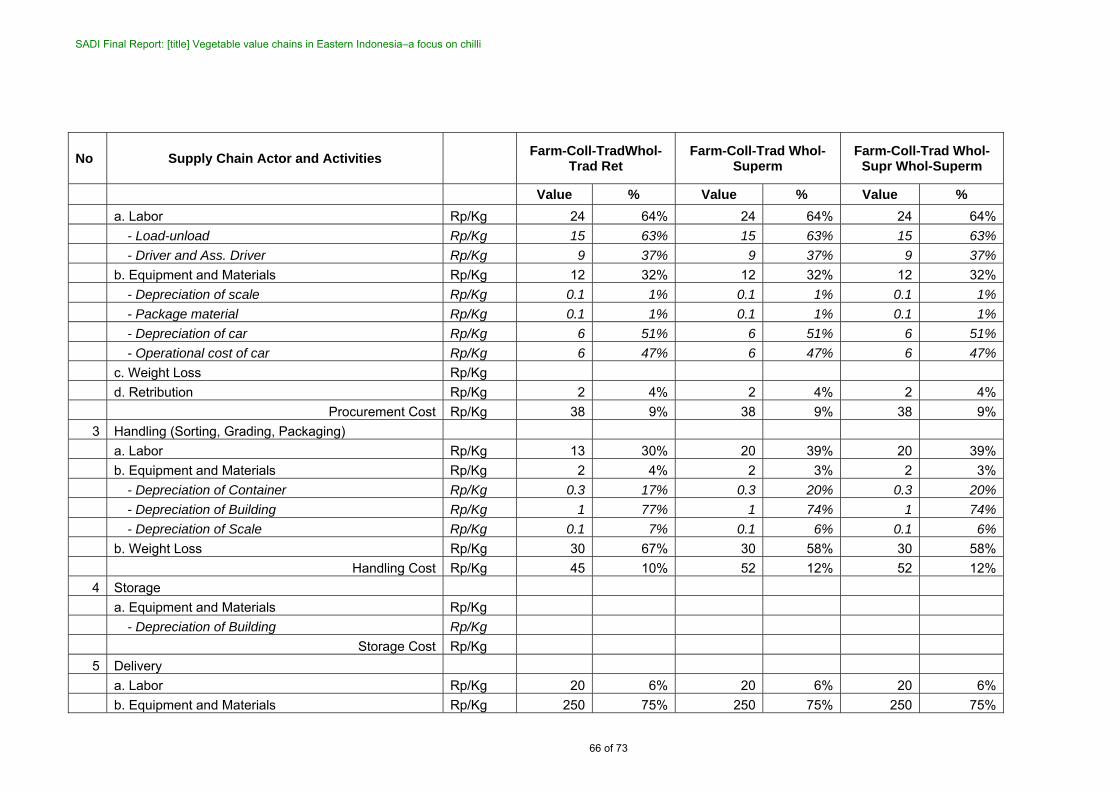
SADI Final Report: [title] Vegetable value chains in Eastern Indonesia–a focus on chilli
66 of 73
No Supply Chain Actor and Activities Farm-Coll-TradWhol-Trad Ret
Farm-Coll-Trad Whol-Superm
Farm-Coll-Trad Whol-Supr Whol-Superm
Value % Value % Value % a. Labor Rp/Kg 24 64% 24 64% 24 64% - Load-unload Rp/Kg 15 63% 15 63% 15 63% - Driver and Ass. Driver Rp/Kg 9 37% 9 37% 9 37% b. Equipment and Materials Rp/Kg 12 32% 12 32% 12 32% - Depreciation of scale Rp/Kg 0.1 1% 0.1 1% 0.1 1% - Package material Rp/Kg 0.1 1% 0.1 1% 0.1 1% - Depreciation of car Rp/Kg 6 51% 6 51% 6 51% - Operational cost of car Rp/Kg 6 47% 6 47% 6 47% c. Weight Loss Rp/Kg d. Retribution Rp/Kg 2 4% 2 4% 2 4% Procurement Cost Rp/Kg 38 9% 38 9% 38 9%
3 Handling (Sorting, Grading, Packaging) a. Labor Rp/Kg 13 30% 20 39% 20 39% b. Equipment and Materials Rp/Kg 2 4% 2 3% 2 3% - Depreciation of Container Rp/Kg 0.3 17% 0.3 20% 0.3 20% - Depreciation of Building Rp/Kg 1 77% 1 74% 1 74% - Depreciation of Scale Rp/Kg 0.1 7% 0.1 6% 0.1 6% b. Weight Loss Rp/Kg 30 67% 30 58% 30 58% Handling Cost Rp/Kg 45 10% 52 12% 52 12%
4 Storage a. Equipment and Materials Rp/Kg - Depreciation of Building Rp/Kg Storage Cost Rp/Kg
5 Delivery a. Labor Rp/Kg 20 6% 20 6% 20 6% b. Equipment and Materials Rp/Kg 250 75% 250 75% 250 75%

SADI Final Report: [title] Vegetable value chains in Eastern Indonesia–a focus on chilli
67 of 73
No Supply Chain Actor and Activities Farm-Coll-TradWhol-Trad Ret
Farm-Coll-Trad Whol-Superm
Farm-Coll-Trad Whol-Supr Whol-Superm
Value % Value % Value % - Truck rental and operational Rp/Kg 250 100% 250 100% 250 100% - Package Material Rp/Kg c. Weight Loss Rp/Kg 59 18% 59 18% 59 18% d. Retribution Rp/Kg 5 1% 5 1% 5 1% Delivery Cost Rp/Kg 334 80% 334 79% 334 79% Total Cost Rp/Kg 418 13% 425 11% 425 12%
6 Selling Price Rp/Kg 4,000 4,895 4,797 Profit/Value Added Rp/Kg 582 17% 686 15% 664 12%
III Wholesaler (General and Traditional) Value % Value % Value % 1 Buying Price 4,000 4,797 4,797 2 Procurement a. Labor 19 92% 15 85% 7 78% - Load-unload Rp/Kg 13 15 100% - Scalling Rp/Kg 7 35% 7 100% b. Equipment and Materials 0.3 1% 0.2 1% 0.3 3% - Depreciation of scale Rp/Kg 0.3 100% 0.2 100% 0.3 100% c. Retribution Rp/Kg 2 8% 3 14% 2 19% Procurement Cost Rp/Kg 21 60% 18 2% 9 6%
3 Handling (Sorting, Grading, Packaging) a. Labor Rp/Kg 60 33% 35 27% b. Equipment and Materials Rp/Kg 121 67% 96 73% - Depreciation of Container Rp/Kg 0.4 0.3% - Rag Rp/Kg - Plat Rp/Kg - Rent land/Building Rp/Kg 7 6%

SADI Final Report: [title] Vegetable value chains in Eastern Indonesia–a focus on chilli
68 of 73
No Supply Chain Actor and Activities Farm-Coll-TradWhol-Trad Ret
Farm-Coll-Trad Whol-Superm
Farm-Coll-Trad Whol-Supr Whol-Superm
Value % Value % Value % - sack Rp/Kg 0.3 0.3% - Depreciation of scale Rp/Kg 0.2 0.1% 0.5 0% -Packaging Rp/Kg 23 19% 15 - Weight Loss Rp/Kg 90 75% 80 83% Handling Cost Rp/Kg 181 25% 131 85%
4 Storage a. Labor Rp/Kg b. Equipment and Materials Rp/Kg - Depreciation of Building - packaging Rp/Kg - Weight Loss Rp/Kg Storage Cost Rp/Kg
5 Delivery a. Labor Rp/Kg 13 88% 125 24% 13 88% b. Equipment and Materials Rp/Kg 53 10% 0 0% -Packaging Rp/Kg - Truck Rp/Kg 53 100% - Ferry Rp/Kg - Depreciation of Scalling Rp/Kg c. Weight Loss 350 66% d. Fee d. Parking Rp/Kg 2 12% 2 6% Delivery Cost Rp/Kg 14 40% 528 73% 30 19% Total Cost Rp/Kg 35 1% 727 18% 154 4%
6 Selling Price Rp/Kg 5,000 7,000 6,500 Profit/Value Added Rp/Kg 965 28% 1,378 31% 1,549 31%

SADI Final Report: [title] Vegetable value chains in Eastern Indonesia–a focus on chilli
69 of 73
No Supply Chain Actor and Activities Farm-Coll-TradWhol-Trad Ret
Farm-Coll-Trad Whol-Superm
Farm-Coll-Trad Whol-Supr Whol-Superm
Value % Value % Value %
IV Super Wholesaler Value % Value % Value % 1 Buying Price Rp/Kg 6,500 2 Procurement a. Labor Rp/Kg 35 82% b. Equipment and Materials Rp/Kg c. Fee Rp/Kg d. Retribution Rp/Kg 8 18% e. Truck Rp/Kg Procurement Cost Rp/Kg 42 6%
3 Handling (Sorting, Grading, Packaging) a. Labor Rp/Kg 20 73% b. Equipment and Materials Rp/Kg 31 42% -Packaging Rp/Kg 0.4 1% -Depreciation of Scale Rp/Kg 0.2 1% -Building Rp/Kg 7 23% -Plat Rp/Kg -Land rent Rp/Kg -Packaging Rp/Kg 23 75% b. Weight Loss Rp/Kg Handling Cost Rp/Kg 74 25%
4 Storage a. Labor Rp/Kg b. Equipment and Materials Rp/Kg -Depreciation of Building Rp/Kg -Dland Rent Rp/Kg

SADI Final Report: [title] Vegetable value chains in Eastern Indonesia–a focus on chilli
70 of 73
No Supply Chain Actor and Activities Farm-Coll-TradWhol-Trad Ret
Farm-Coll-Trad Whol-Superm
Farm-Coll-Trad Whol-Supr Whol-Superm
Value % Value % Value % -Depreciation of Packaging Material Rp/Kg c. Weight Loss Rp/Kg Storage Cost Rp/Kg
5 Delivery a. Labor Rp/Kg 125 70% b. Equipment and Materials Rp/Kg 53 30% -Package Material Rp/Kg 0 0% -Depreciation of Truck Rp/Kg 9 18% -Truck Operational cost Rp/Kg 44 82% Delivery Cost Rp/Kg 178 61%
6 Fee Rp/Kg Total Cost Rp/Kg 294 8%
7 Selling Price Rp/Kg 8,000 Profit/Value Added Rp/Kg 1,206 22%
V Supermarket Value % Value % Value % 1 Buying Price Rp/Kg 7,000 8,000 2 Handling cost a. Labor Rp/Kg 240 31% 160 25% b. Material Rp/Kg 255 33% 170 26% c. Weight Loss Rp/Kg 280 36% 320 Total Cost Rp/Kg 775 19% 650 16%
2 Selling Price Rp/Kg 8,500 9,000 Profit/Value Added Rp/Kg 725 16% 350 6%
VI Traditional Retail Market Value % Value % Value %

SADI Final Report: [title] Vegetable value chains in Eastern Indonesia–a focus on chilli
71 of 73
No Supply Chain Actor and Activities Farm-Coll-TradWhol-Trad Ret
Farm-Coll-Trad Whol-Superm
Farm-Coll-Trad Whol-Supr Whol-Superm
Value % Value % Value % 1 Buying Price Rp/Kg 5,000 2 Procurement a. Labor Rp/Kg 15 100% b. Equipment and Materials Rp/Kg -Depreciation of Scale Rp/Kg -Truck Rental Rp/Kg c. Retribution Rp/Kg d. Weight Loss Rp/Kg Procurement Cost Rp/Kg 15 2%
3 Handling (Sorting, Grading, Packaging) a. Labor Rp/Kg 35 41% b. Equipment and Materials Rp/Kg 52 38% - Depreciation of scale Rp/Kg 2 4% - Package material Rp/Kg 50 96% c. Weight Loss Rp/Kg 50 37% Handling Cost Rp/Kg 137 22%
4 Storage a. Equipment and Materials Rp/Kg 75 16% -Storage Rent Rp/Kg 75 100% b. Retribution Rp/Kg 9 2% c. Weight loss Rp/Kg 385 82% Storage Cost Rp/Kg 469 75%
5 Delivery a. Labor Rp/Kg b. Equipment and Materials Rp/Kg - Depreciation of scale Rp/Kg

SADI Final Report: [title] Vegetable value chains in Eastern Indonesia–a focus on chilli
72 of 73
No Supply Chain Actor and Activities Farm-Coll-TradWhol-Trad Ret
Farm-Coll-Trad Whol-Superm
Farm-Coll-Trad Whol-Supr Whol-Superm
Value % Value % Value % - Package material Rp/Kg Delivery Cost Rp/Kg Total Cost Rp/Kg 621 20%
6 Selling Price Rp/Kg 6,500 Profit/Value Added Rp/Kg 879 26%
VII Food Industry 1 Buying Price Rp/Kg 2 Procurement a. Labor Rp/Kg b. Equipment and Materials Rp/Kg -Depreciation of Scale Rp/Kg -Truck Rental Rp/Kg c. Retribution Rp/Kg d. Weight Loss Rp/Kg Procurement Cost Rp/Kg
3 Handling (Sorting, Grading, Packaging) a. Labor Rp/Kg b. Equipment and Materials Rp/Kg - Engine Rp/Kg - Machine Rp/Kg - Grinder Rp/Kg - Belt Rp/Kg - Sack Rp/Kg b. Weight Loss Rp/Kg Handling Cost Rp/Kg

SADI Final Report: [title] Vegetable value chains in Eastern Indonesia–a focus on chilli
73 of 73
No Supply Chain Actor and Activities Farm-Coll-TradWhol-Trad Ret
Farm-Coll-Trad Whol-Superm
Farm-Coll-Trad Whol-Supr Whol-Superm
Value % Value % Value % 4 Storage a. Labor Rp/Kg a. Equipment and Materials Rp/Kg -Storage Rent Rp/Kg b. Drum Rp/Kg c. Retribution Rp/Kg d. Weight loss Rp/Kg Storage Cost Rp/Kg
5 Delivery a. Labor Rp/Kg b. Equipment and Materials Rp/Kg - Depreciation of scale Rp/Kg - Package material Rp/Kg c. Retribution Rp/Kg d. Truck Rent Rp/Kg Delivery Cost Rp/Kg Total Cost Rp/Kg
6 Selling Price Rp/Kg Profit/Value Added Rp/Kg Farmer share % 46% 45% 41% Total Value Added Rp/Kg 3,319 100% 4,472 100% 5,440 100% Total Cost Rp/Kg 3,181 100% 4,028 100% 3,560 100%