Natural Rubber value chains: A game changer for smallholders
34
Natural Rubber value chains: A game changer for smallholders A. Nosa Betty¹; A. A.i²; A. E.o² 1: RUBBER RESEARCH INSTITUTE OF NIGERIA, RESEARCH OUTREACH , Nigeria, 2: Rubber Research Institute of Nigeria,, Research outreach, Nigeria Corresponding author email: [email protected] Abstract: ABSTRACT The study analyzed the value chain of natural rubber in Nigeria. The study specifically mapped the natural rubber value chain and identify the functions performed by the respondents in the chain; identified the existing marketing channels and estimated the marketing margin at each value addition point. Data for the study were collected using a well-structured questionnaire administered to 425 respondents selected using a two–stage sampling process involving random and purposive sampling techniques. Data collected were analyzed using descriptive statistics, flow chat, marketing margins, marketing efficiency The findings showed a mean age of 53 years for farmers and 44 years for marketers, with males (97.86%) dominating. Most were married and majority had at least primary education. The main value chain agencies were input suppliers/nursery farmers, rubber farmers, marketers/collectors, processor and manufacturers, while the key product points along the chain were seeds, seedlings, budded stump, lump, latex concentrates, sheet, and crumbs. Marketing margin analysis showed crumb having the highest margin (N234.01) with processing cost having the major component. Value added by processing were N14.36k, N115.16, N136.14 and N124.38 per budded stump, latex concentrate, crumb and sheet respectively. The nursery was the most efficient and it was more profitable to process into crumb rubber. It was therefore recommendations that farmers may integrate backward to produce their own budded stumps and process their latex before selling for profit Acknowledegment: ACKNOWLEDGEMENTS The authors would like to acknowledge Prof. (Mrs). G.O. Alufohai and Dr. C.I Ada-Okungbowa for their contributions to the study JEL Codes: M31, Y10 #1237
-
Upload
khangminh22 -
Category
Documents
-
view
4 -
download
0
Transcript of Natural Rubber value chains: A game changer for smallholders

Natural Rubber value chains: A game changer for smallholders
A. Nosa Betty¹; A. A.i²; A. E.o²
1: RUBBER RESEARCH INSTITUTE OF NIGERIA, RESEARCH OUTREACH , Nigeria, 2: Rubber Research Institute of Nigeria,, Research outreach, Nigeria
Corresponding author email: [email protected]
Abstract:
ABSTRACT The study analyzed the value chain of natural rubber in Nigeria. The study specifically mapped the natural rubber value chain and identify the functions performed by the respondents in the chain; identified the existing marketing channels and estimated the marketing margin at each value addition point. Data for the study were collected using a well-structured questionnaire administered to 425 respondents selected using a two–stage sampling process involving random and purposive sampling techniques. Data collected were analyzed using descriptive statistics, flow chat, marketing margins, marketing efficiency The findings showed a mean age of 53 years for farmers and 44 years for marketers, with males (97.86%) dominating. Most were married and majority had at least primary education. The main value chain agencies were input suppliers/nursery farmers, rubber farmers, marketers/collectors, processor and manufacturers, while the key product points along the chain were seeds, seedlings, budded stump, lump, latex concentrates, sheet, and crumbs. Marketing margin analysis showed crumb having the highest margin (N234.01) with processing cost having the major component. Value added by processing were N14.36k, N115.16, N136.14 and N124.38 per budded stump, latex concentrate, crumb and sheet respectively. The nursery was the most efficient and it was more profitable to process into crumb rubber. It was therefore recommendations that farmers may integrate backward to produce their own budded stumps and process their latex before selling for profit
Acknowledegment: ACKNOWLEDGEMENTS The authors would like to acknowledge Prof. (Mrs). G.O. Alufohai and Dr. C.I Ada-Okungbowa for their contributions to the study
JEL Codes: M31, Y10
#1237

1
Natural Rubber value chains: A game changer for smallholders
INTRODUCTION
Nigeria is the second largest producer of natural rubber in Africa after Cote d’Ivoire and the
eleventh in the world, with a land area of 345,000 hectares under rubber, ranking seventh in the
world, having yield (hectogram/ha) of 4,159 which ranks twenty-fifth in the world (Food and
Agriculture Organization Statistics, 2015). About 68% of rubber producers in Nigeria are
smallholder farmers living in the rural areas (Aigbekaen, Imarhiagbe, and Omokhafe, 2000;
Giroh and Adebayo, 2007; Giroh, Umar and Yakub, 2010).
Natural Rubber, Hevea Brasilensis, is the world’s number one source for natural rubber
(Abolagba and Giroh, 2006). The Nigerian rubber industry has enormous potentials for
sustainable growth and development. Rubber performs basically three main functions in the
Nigerian economy in terms of providing raw materials for agro-based industries, foreign
exchange earnings and in the provision of employment (Aigbekaen, et al, 2000) having several
points whereby value is added to the product.
The Nigerian natural rubber industry, which is dominated by smallholders, suffered a
significant decline (70-80%) in output, despite the potentials of the crop as a major foreign
exchange earner (Rubber Research Institute of Nigeria, 2010). This decline in the production of
rubber in Nigeria has been described as alarming and worrisome especially to the nation’s
economy (Umar, Giroh, Agbonkpolor, and Mesike 2011). The fluctuation in production of
rubber in Nigeria has been attributed mainly to the decline in natural rubber prices particularly

2
between 1996 and 2002, which got to a historic low in 2000 and affected the global rubber
industry to the point that farmers in many producing countries including Nigeria shifted away
from the industry (Aigbekaen, et al, 2000). It is encouraging that local and world market prices
of rubber have increased such that the glut and low prices of the 1990s have transformed into
current deficit and hence high prices (FAOSTAT 2014). With the increase in prices it would be
expected that a corresponding increase in production and hectarage cultivation would follow,
rather it fell from 247,000ha in the 1970s to 154,000ha in 2006 and recently a slight increased
to 200,900ha in 2012 (Central Bank of Nigeria, 2013). This reduction in hectarage is mainly
due to withdrawal of small scale rubber farmers from rubber production (Umar and Ugwa,
2006). With favorable market prices of natural rubber, which is predicted to remain for a long
time (FAO, 2014) due to the indispensable nature of natural rubber in the manufacturing
industry, there ought to be a renewed interest in rubber cultivation, yet production has not
increased greatly. Therefore, this failure cannot be attributed to fluctuation in prices alone.
What then could the problem be?
Rubber has the potential to help in poverty reduction, but the current production, processing,
and marketing techniques being used, do not maximize the potential gains to be realized by
farmers who cultivate and market rubber products. Nigeria smallholder rubber farmers sell about
98% of their total production as raw unprocessed rubber lump and in doing so, profit margins are
slim. Adding value to natural rubber could generate higher profits, decrease unemployment rate
for the country citizens and contribute as income generation for poor population. What then are
ways farmers/marketers can add value to rubber to make good profit?
Natural rubber marketing, unlike other agricultural products, is unique for several reasons; it is
purely an industrial product hence it is highly technical, involving specifications and quality of

3
the product, which everyone involved in the marketing system, must abide with. Absence of
organized marketing has been felt as one of the major bottlenecks in accelerating the growth of
rubber production. The Farmers have to depend on various marketing agencies to get a
remunerative price for their produce, who in turn depend on rubber processors/manufactures for
affecting their sales. It is obvious that the natural rubber sector needs a good marketing system.
It is important to know how much marketing margin is earned in rubber marketing. What
proportion of this margin is earned by the different marketing organizations and how profitable
and sustainable is the value addition at each stage of the marketing channel for natural rubber?
This study, therefore, sought to provide answers to the following research questions:
1. Who are the agencies and what functions do they perform along the marketing channels
for natural rubber?
2. What are the existing value addition points and marketing channels for Natural Rubber
in Nigeria?
3. What proportion of the marketing margin is earned by each enterprise in the marketing
chain and how sustainable are these enterprises?
RESEARCH METHODOLOGY
Area and Scope of the Study: The study was conducted in south-south, Nigeria. The zone was
chosen because of its status as the major natural rubber growing areas in the country. The zone is
characterized by a tropical climate with distinct dry season between November and March and a
wet season between April and October.

4
Sources and types of data: The Primary data were collected with the aid of a set of well-
structured questionnaire which was used to gather the information from the farmers, tappers,
local collectors, wholesalers, processors and manufacturers.
Sampling procedure and Sampling size: A two-stage sampling procedure involving purposive
and random sampling techniques was used in selecting 452 respondents study. Stage one was
the purposive selection of Edo, Delta and Akwa-Ibom States being the major rubber- producing
States in Nigeria. About 62.34% of the total rubber area planted in the country is owned by
small-holder farmers, out of which, 75% are located in Study Area. (RRIN, 2010).
The second stage was the random selection of respondents-
- 20 small-holder nursery farmers from each State, that were involved in raising rubber
seedlings and budded- stump cultivation, from the 2013 list of rubber nursery farmers
obtained from the Rubber Research Institute of Nigeria (RRIN).
- 50 smallholder farmers involved in rubber cultivation in each of the three States from the
2007 list of rubber farmers obtained from the Rubber Research Institute of Nigeria and
the tree crop units of the Ministry of Agriculture and Natural Resources in Edo, Delta and
Akwa Ibom States. (The 2007 list comprises of farmers whose plantation would have
attained tapping age; gestation period for rubber is 7years).
- 60 tappers. (20 tappers from each state)
- 120 marketers (40 from each State).
- the processing of wet coagulants into ribbed smoked sheet and blocked rubber and the
processing of latex into concentrates, crepe and crumb rubber was done by about 47
rubber processing factories in Edo, Delta, and Akwa- Ibom states (RRIN 2010). Out of

5
the 47 processing factories, only 20 were processing fully and the 20 were purposively
selected.
- 12 manufacturers were randomly selected, 4 from each State.
A total of 452 respondents, 60 input suppliers/nursery farmers, 150 farmers, 90 tappers, 120
marketers, 20 processors and 12 manufacturers were interviewed for the study.
Analytical Techniques; Data collected were analyzed using descriptive statistics which were
frequency counts, pie chart, percentages, means and mode. Value Chain mapping was done
using functional approach. The core processes, enterprises involved, flow and quantity of
product at each node of the value chain were determined and represented by a flow chart. Value
added is the amount of wealth created by a respondent in the chain; it is measured from net sales
less the costs of bought-in goods and services (Iyabo, Omobowale, Sulaiman and Kemisola,
2013).
Value added = (Total sales value) – (Value of intermediate goods)
Total sales value = price x volume of final product sold.
Value Added is mathematically expressed as:
n
VA = PiQi - ∑ rix I ……………………………. (1).
i
(Oni, 2013)
Where VA - value added ( in terms of net profits)
PQ - value of output
rX - cost of raw materials and intermediate goods/services
Marketing Margin = Selling Price - Purchase Price ……………………………………… (2)

6
Computing the total marketing margin is always related to the final price paid by the end buyer
and is expressed as percentage.
Total Gross Marketing Margin (TMM) = End buyer price - First seller price X 100 …… ……(3)
End buyer price
( Mussema,2006)
Statistics of Respondents Sampled: 452 respondents were sampled for the study, a total of
425 were found useful for the study. These represent about 94% response rate. Manufacturers’
response rate was 33% and the products manufactured differed greatly- ranging from rubber
bands, balloons, tries, carpet underlay, foot wears, hence marketing margin, profit and other
financial calculations was not computed for this category expect their constraints.
Table 1: Distribution of Respondents Sampled
Number of sampled
respondents
Number valid for the
study
Response Rate %
Nursery Farmers Study Area 60 60 100
Rubber Producers Edo 50 50 100
Delta 50 46 92
Akwa-Ibom 50 44 88
150 140 93
Tappers Study Area 90 90 100
Marketers Edo 40 38 95
Delta 40 38 95
Akwa-Ibom 40 35 88
120 111 93
Processors Study Area 20 20 100
Manufacturers Study Area
12 4 33.33
TOTAL 452 425 94.03
Source: Computed from Survey Data, 2017
7
RESULTS AND DISCUSSION
Socio – Economic Characteristics of Rubber Farmers in the study area.
Table 2 presents the socio-economic characteristics of the rubber farmers. The modal class was
the age bracket of 51-60 and a mean value of 53 years. Generally there were a higher proportion
of old farmers from each State than young farmers. This mean age suggests that rubber farmers
in the study area were not young. The low representation of youth and middle aged in the sample
might be due to their unfavorable attitude towards agriculture. This is consistent with findings of
Balogun, Esekhade, and Omo-Ikeroda (2011) and Abolagba, , Aigbeaen, and Omokhafe (2003)
who noted that rubber farmers consisted mainly of the aged category. Findings were, however
not in agreement with Bameke and Omoregbee (2009) their findings indicates that many of the
respondents were in their active age of 36 to 45 years, in their Study 0f Farmers’ Perception of
the Factors Militating against Rubber Production in Edo and Delta States of Nigeria
Results from the pooled data indicate that majority of the respondents were males, indicating
that the sector is male dominated. This suggests that men were more involved in the production
of natural rubber in the study area than women. This may be attributable to the enormous labour
involved in rubber production.
The pooled data indicated that 86.43% of the respondents were married. The high percentage of
married respondents may imply the importance attached to the marriage institution in Nigeria
and family labour is still very important for many small-scale farmers.
Being educated may help the farmers adopt new and improved techniques without much
difficulty, as they are likely to learn with ease and disseminate innovations. Results from the
pooled data indicate that respondents from Edo State having higher literacy level compared to

8
Delta and Akwa-Ibom Farmers. Respondents in Akwa-Ibom were least educated. This could be
due to value and interest placed on education in these areas.
The pooled data showed that majority of the respondents engaged in rubber farming on part-
time basis. 10.71% of the respondents were full-time rubber farmers. This suggests that very few
hands are full time rubber farmers, which might not be healthy for the growth and development
of the rubber industry. Being involved in farming on secondary basis is probably a risk for latex-
producing rubber trees because the farmers might feel less committed to using good tapping
techniques and other practices that could endanger the trees.
Experience in farming had a mean value of 18.57 years. This implies that most of the farmers
have been into farming for reasonable number of years. The long years of experience may
indicate that most of the farmers started the farming at a young age (say 35 years). These years
of experience could help in rubber development.
Results from the pooled data showed a mean household size of 9 persons. The large family size
could be a valuable source of labour for rubber production and other agricultural and
nonagricultural activities.
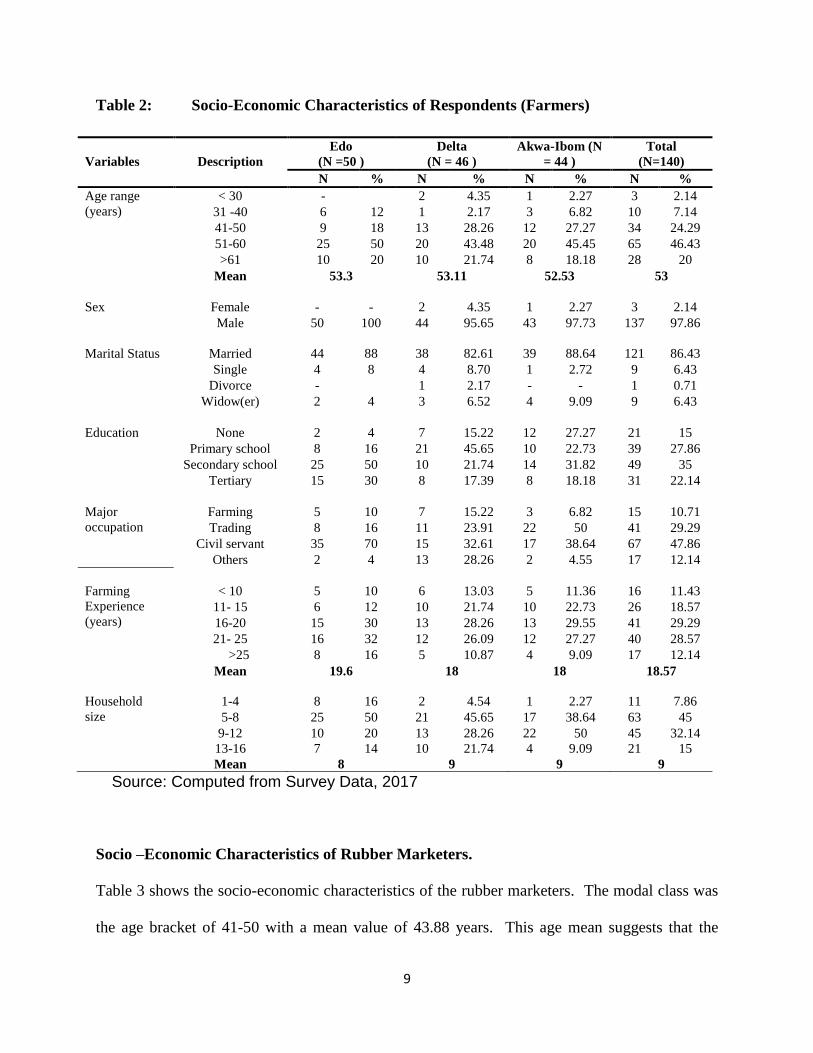
9
Table 2: Socio-Economic Characteristics of Respondents (Farmers)
Variables
Description
Edo
(N =50 )
Delta
(N = 46 )
Akwa-Ibom (N
= 44 )
Total
(N=140)
N % N % N % N %
Age range
(years)
< 30 - 2 4.35 1 2.27 3 2.14
31 -40 6 12 1 2.17 3 6.82 10 7.14
41-50 9 18 13 28.26 12 27.27 34 24.29
51-60 25 50 20 43.48 20 45.45 65 46.43
>61 10 20 10 21.74 8 18.18 28 20
Mean 53.3 53.11 52.53 53
Sex Female - - 2 4.35 1 2.27 3 2.14
Male 50 100 44 95.65 43 97.73 137 97.86
Marital Status Married 44 88 38 82.61 39 88.64 121 86.43
Single 4 8 4 8.70 1 2.72 9 6.43
Divorce - 1 2.17 - - 1 0.71
Widow(er) 2 4 3 6.52 4 9.09 9 6.43
Education None 2 4 7 15.22 12 27.27 21 15
Primary school 8 16 21 45.65 10 22.73 39 27.86
Secondary school 25 50 10 21.74 14 31.82 49 35
Tertiary 15 30 8 17.39 8 18.18 31 22.14
Major
occupation
Farming 5 10 7 15.22 3 6.82 15 10.71
Trading 8 16 11 23.91 22 50 41 29.29
Civil servant 35 70 15 32.61 17 38.64 67 47.86
Others 2 4 13 28.26 2 4.55 17 12.14
Farming
Experience
(years)
< 10 5 10 6 13.03 5 11.36 16 11.43
11- 15 6 12 10 21.74 10 22.73 26 18.57
16-20 15 30 13 28.26 13 29.55 41 29.29
21- 25 16 32 12 26.09 12 27.27 40 28.57
>25 8 16 5 10.87 4 9.09 17 12.14
Mean 19.6 18 18 18.57
Household
size
1-4 8 16 2 4.54 1 2.27 11 7.86
5-8 25 50 21 45.65 17 38.64 63 45
9-12 10 20 13 28.26 22 50 45 32.14
13-16 7 14 10 21.74 4 9.09 21 15
Mean 8 9 9 9
Source: Computed from Survey Data, 2017
Socio –Economic Characteristics of Rubber Marketers.
Table 3 shows the socio-economic characteristics of the rubber marketers. The modal class was
the age bracket of 41-50 with a mean value of 43.88 years. This age mean suggests that the

10
rubber marketers are in their active age and that younger people were more involved in the
marketing of rubber compared to those in production. Delta State recorded the lowest mean-age
of 42.6 years as compared to Edo and Akwa-Ibom States. Rubber marketing involves a lot of
travelling and activities; this could be the reason for the younger age mean.
The results also showed that majority (89.84%) of the respondents in Edo State was males and
only two were females. About 95% and 91% were recorded as males in Delta and Akwa-Ibom
states respectively. Results from the pooled data indicate 6.31% of the respondents were females,
while record for males was about 94%. This suggests that rubber marketing in the study area
was male dominated. This could be attributed to the numerous travelling and activities involved
in rubber marketing, which might be cumbersome for female.
Most of the respondents were married. This suggests that rubber marketing in the study area was
dominated by married people.
Majority had formal education. The literacy level is higher than that of their counterpart in the
rubber production. This suggests that the marketers had the required basic knowledge and skill to
enhance their marketing performance which will help in the efficient performance of all the
marketing functions like effective communication, record keeping and devising strategies on
how to enhance efficient marketing activities.
As regards occupation, about 68% was fully involved in the marketing of natural rubber, few of
the marketers were involved in farming. This suggests that rubber marketing might be a
profitable and sustainable business.
Results for marketing experience suggests that, on average, rubber marketers have been in the
business for at least 17 years. This implies that most of the marketers in the study area have been

11
in the rubber marketing business for a long time. They were thus assumed to be experienced to
know the right decisions to take and ought to have been contributing to source of income to
many families.
Table 3: Socio –Economic Characteristics of Rubber Marketers
Variables
Description
Edo
(N = 38 )
Delta
(N = 38)
Akwa-Ibom
(N =35 )
Pooled
(N=111)
N % N % N % N %
Age range < 30 1 2.63 3 7.89 1 2.86 5 4.5
(years) 31 -40 12 31.58 15 39.47 6 17.14 33 29.73
41-50 19 50 14 36.84 21 60 54 48.65
51-60 5 13.16 2 5.26 6 17.14 13 11.71
>60 1 2.63 4 10.53 1 2.86 6 5.41
Mean 43.66 42.61 45.5 43.88
Sex Female 2 5.26 2 5.26 3 8.57 7 6.31
Male 34 89.47 36 94.74 32 91.43 104 93.69
Marital Status Married 33 86.84 30 78.94 30 85.71 93 83.78
Single 2 5.26 4 10.53 1 2.86 7 6.31
Divorced 2 5.26 1 2.63 - 3 2.70
Widow (er) 1 2.63 1 2.63 4 11.43 6 5.41
Education No formal - 1 2.63 - 1 0.9
Primary school 8 21.05 11 28.95 10 28.57 29 26.13
Secondary school 22 57.89 23 60.53 12 34.29 57 51.35
Tertiary 8 21.05 3 7.89 13 37.14 24 21.62
Major
occupation
Farming 5 13.16 6 15.79 3 8.57 14 12.61
Trading 28 73.68 22 57.89 25 71.43 75 67.57
Civil servant 5 13.16 2 5.26 5 14.29 12 10.81
Others 2 5.26 8 21.05 2 5.71 12 10.81
Marketing
Experience
(years)
< 10 5 13.16 3 7.89 5 14.29 13 11.71
11- 15 10 26.32 9 23.68 5 14.29 24 21.62
16-20 15 39.47 11 28.95 18 51.43 44 39.64
21- 25 6 15.79 7 18.42 6 17.14 19 17.12
>25 2 5.26 8 21.05 1 2.86 11 9.91
Mean 16.68 19.05 17 17.59
Source: Computed from Survey Data, 2017
Socio-Economic Characteristics of Tappers in the Study Area.
Table 4 shows the socio-economic characteristics of the tappers. The modal class was 41-50 age
brackets with a mean value of 43.6. This implies that many of the respondents were young,
(compared to the mean ages of rubber farmers and marketers in the study area) and in their active
age, especially given the task of rubber tapping.

12
Majority of the respondents were males. This suggests that rubber tapping in the study area was
mostly undertaken by men and that the task might be too tedious for females.
Majority of the tappers had formal education, which will positively predispose them to willingly
accept innovations and practices that will enhance rubber tapping and their tapping skills.
Tapping experience results revealed a modal class of less than ten years and mean value was 11.5
years. This suggests that the tappers had experience and will be expected to tap well.
Table 4.: Socio-Economic Characteristics of the Rubber Tappers
Edo Delta Akwa-Ibom Pooled
Variables Description (N = 30 ) (N = 30) (N =30 ) (N=90)
N % N % N % N %
Age range < 30 1 3.33 3 10 - - 4 4.44
(years) 31 -40 14 46.67 15 50 8 26.67 37 41.11
41-50 15 50.00 12 40 21 70.00 48 53.33
51-60 - - - - 1 3.33 1 1.11
Sex Female 3 10 2 6.67 5 16.67 10 11.11
Male 27 90 28 93.33 25 83.33 80 88.89
Education No formal 1 3.33 1 3.33 5 16.67 7 7.78
Primary
school 8 26.67 11 36.67 15 50.00 34 37.78
Secondary
school 21 70 18 60.00 10 33.33 49 54.44
Tapping
Experience
< 10 15 50 21 70.00 13 43.33 49 54.44
11-15 12 40 9 30.00 10 33.33 31 34.44
16- 20 3 10 - - 6 20.00 9 10.00
21- 25 - - - - 1 3.33 1 1.11
Source: Computed from Survey Data, 2017

13
Natural Rubber Value Chain in the Study Area
The value chain mapping highlights the involvement of different respondents/agencies who
participate directly or indirectly in the natural rubber value chain.
Direct Agencies /Respondents and their Functions in the Value Chain
The results of the analysis indicates that the key processes in natural rubber Value Chain in the
study area are input supplies, Production, marketing, Processing, Consumption and Export, while the
key respondents/agencies are input suppliers, producers, marketers, processors, manufacturers,
exporters and consumers. Similar processes were also found by Hoang (2008) in Upgrading Strategy
for Rubber Value Chain in Bo Trach. The direct agencies included co-operatives, farmer groups,
processors, local manufacturers, and exporters. The indirect agencies included financial institution,
Rubber Research Institute of Nigeria, Agricultural Development Programme - tree crop unit and the
Raw Materials Research and Development Council (RMRDC). The value chain map for natural
rubber is in Figure 1, and it was the same for the three States studied. Each of these respondents
added value to the product along the chain. Some functions were performed by more than one
respondent and some respondents performed more than one function.

14
Seedlings Budded Stumps
Rubber Plantation
Rubber Seed
Sell off or lease
Latex
Tappers
Collectors
Seed
Seed oil Cake Empty kernel
Poultry and
Piggery
Feedstuffs
Latex Concentrates
Trunk
Coagulant
Rubber
Sheet
Dipped
goods
Non-Dipped
goods Crepe and
crumb rubber
Fertilizers
Briquettes for fuel
Alkyd resin, paints, putty, vanish, ink, body cream, hair shampoo, fat liquor, rubber plasticizers
Furniture, particle board, Briquettes for fuel
Tyres, tubes, exhaust hangers, car mat, car bumpers, rubber bushings, shaft rubber, radiator hose, fan belts, shoes, bathroom slippers, clothing
Foam, toys, adhesives, paints
Ballons, Rubber band, Rubber gloves, condoms
Picking,
Sorting,
Weighing
Picking,
Sorting,
Planting
Nursery
Workers
Budders
Cultivation, Production
Processors
Processors
Felling, sawing, loading
Washing
Milling
Treating
Processing
Figure 1. Natural Rubber Value Chain Mapping for the study area Source: Mapped from Survey, 2017

15
Input Suppliers in the Rubber Value Chain
At this stage of the value chain, there were many agencies that were involved directly or
indirectly in input supply in the study area. The input suppliers were responsible for providing
seeds, seedlings, budded stumps and procuring inputs from manufacturer’s representatives and
selling to farmers. Such inputs included herbicides, pesticides, fertilizers, and farm tools such as
budding tools, cutlasses and hoes. They also render advisory services to the farmers on the type
of clone to plant, cropping system/pattern, type and method of application of the various inputs.
The major source of seed among of the nursery producers was nearby rubber plantations
(94.29% of nursery producers). Major clones used as rootstock among nursery producers
included, NIG 800 series (71.43%), GTI (22.86%) and RRIM 600 (5.71%). Majority of the
respondents (85%) sourced these inputs (seeds, agrochemicals and tools) within their locality,
while 15% sourced their inputs from urban centers such as Benin, Asaba, Warri and Calabar.
Most farmers (65%) did not applying fertilizers of any kind. Results revealed that Input suppliers
were vertically/forwardly integrated with about 35% of the nursery owners having their own
rubber plantation.
Producers/Farmers in the Rubber Value Chain
Natural Rubber producers owned rubber farms of various sizes in smallholdings. The mean
farm size was computed to be 3.5, 3.2 and 3.6 hectares in Edo, Delta and Akwa-Ibom State
respectively. The producers were responsible for the production of naturally coagulated rubber
(cup lump), rubber latex and rubber seeds. Their functions/activities included establishment,
cultivation and management of the rubber farm. They added value right from farm preparation,
procurement of the inputs, tapping and marketing. Other functions include ploughing, planting,
fertilization application, weeding, pest/disease control and post-harvest handling. The budded

16
stumps were mainly supplied by the Rubber Research Institute of Nigeria (RRIN) private
nurseries, and Michelin farms. Rubber production in the study area was rain fed. Some farmers
sell-off or lease out their farms when the plantation attains tapping age for some period. The
lessee is responsible for the plantation maintainers, tapping and sells of products depending on
the agreement, which is usually on yearly basics. Most of the respondents enhanced the value
chain by engaging in different cropping system. Table 5 showed that only 6% of the respondents
in Edo practiced sole farming, while 11.9% was recorded in Delta and Akwa-Ibom States
respectively. In Edo State 70% of the respondents practiced intercropping, while Delta and
Akwa-Ibom States had 78.26% and 65.91% respectively. This mean that the respondents are
adding value to the farms by engaging in intercropping which serves to protective crops, reduce
weeding cost and source of addition food/revenue to the farmers. Mixed farming was practiced
by 23.18% of the respondents. Results from the pooled data indicates that 5.71% of the
respondents practiced sole rubber farming, 71.43% practiced intercropping, while 22.86%
practiced mixed farming. Major intercropping systems identified were with
cassava/Plantain/maize (about 26%), cassava/plantain/pineapple about 25% and (about 22%)
Cassava/pawpaw/cocoyam. About 94% of the respondents claimed that intercropping and mixed
farming was a means to ensure additional returns and reduce cost of slashing in the rubber farms.
This suggests that most of the respondents were involved in either mixed farming or
intercropping at one stage or the other in their rubber plantation. This production system created
opportunities for income enhancement through the integration of arable crops on the inter-rows
during the immature stages of rubber or high value agro –forestry crops at the periphrasis and
mini-livestock in matured plantations.

17
This system which is known as rubber agroforestry system, may have contributed immensely to
the farmers’ food security and income opportunities. This is similar to the findings of Ogwuche,
Umar, Esekhade and Francis (2012) on the economics of intercropping natural rubber. They
found out that rubber farms intercropped with arable crops will reach tapping stage earlier which
means a quicker return is expected from rubber intercropped compared with a sole rubber
plantation and guaranteed annual income flow.
The farmers in the study area were utilizing rudimentary implements in their production
activities. Post-harvest handling, which included packing, storing, transportation, loading and
unloading were carried out by the producers. Where rubber lump is sold at the farm gate, all
aforementioned activities were performed by the collector/traders. The means of transportation
varied but predominantly producers made use of motorcycles and pick-up vans. Results revealed
that 15% of the producers tap their rubber themselves and about 30% market their products
themselves.
Table 5 Natural Rubber Cropping System in the Study Area
Source: Computed from Survey Data, 2017
Variables
Description Edo
(N = 50 )
Delta
(N = 46 )
Akwa-Ibom
(N =44 )
Total
(N=140)
N % N % N % N %
Sole 3 6 - - 5 11.9 8 5.71
Intercrop Cassava/plantain
/maize
24 48 9 19.56 3 6.82 36 25.71
Cassava/plantain
/pineapple
7 14 25 54.35 2 4.76 34 24.64
Cassava/telferia
/cocoyam
4 8 2 4.35 24 57.14 30 21.74
Total 35 70 36 78.26 29 65.91 100 71.43
Mixed
farming
Bee keeping 4 8 4 8.7 2 4.76 10 7.14
rabbit 4 8 6 13.04 7 16.67 17 12.14
snail 4 8 - - 1 2.38 5 3.57
Total 12 24 10 21.74 10 23.81 32 22.86

18
Tappers in the Rubber Value Chain
Their functions include tapping, collection of latex, addition of acid (coagulant or anti-coagulant)
and transportation to farm gate. It was also found out that a mean of 396 trees were tapped per
day as against the 450 to 500 trees recommended by Schroth et al. (2004).Several factors have
been identified for low number of trees tapped and include the following: weedy plantations and
wind damages to rubber trees. Results also revealed that 4.44% of the tappers own their
plantation, while 11.11% on lease plantation. 10% of the tappers, market their products
themselves. This implies forward and backward market integration, which is necessary for
sustainable development for the small holders.
Collectors/Marketers in the Rubber Value Chain
Their functions include collection, transportation, sorting, grading, quality control and distribution.
Their socio-economic characteristics had earlier been presented in Table 4. It was discovered that
there were two major types of collectors in the rubber value chain in the study area: Farm-
Gate/Village Assemblers and Wholesaler marketers. The Village marketers collect and bulk rubber
lump from individual farmers, and most times sell to the wholesalers. They handle 58% of total
marketed rubber. This is similar to the findings of Iyabo et al (2013) on Plantain Value Chain
Mapping in Southwestern Nigeria. Selling at the Farm Gate prevent producers from bargaining for
higher prices compared to when the commodity is taken to markets. Results revealed that the
marketers were vertically integrated with about 41% of the respondents processing lump/latex into
different products.

19
Processors in the Rubber Value Chain
They process Primary products (latex concentrates and lump) into different types of products such as
into crepe, crumb, ribbed smoked sheet and blocked rubber. Latex in the study area is processed into
different types of products such as rubber sheet. The coagulant is processed into crumbs and crepe
for export and for local manufacturing of tires. Results revealed that 40% of the processed products
were sold locally to manufacturers, while 60% was exported. 10% of the respondents (processor)
had their own manufacturing industries.
Manufacturers in the Rubber Value Chain
Manufacturers of rubber-based products can be classified into two according to the raw materials
they use (dry rubber and liquid rubber).
Manufacturers using dry rubber produce tires, tubes, belts, hoses, mats, floor coverings, slippers,
gaskets, caster wheels, hot water bottles, jar rings, exercise components, automotive components, and
other similar products.
Latex-based or liquid rubber based manufacturers produce dipped products including different types
of gloves (examination, surgical, household, cotton supported industrial and agricultural gloves),
balloons, foam rubber mattresses and other articles of foams, rubber bands and threads, toys and
masks, cot sheets.
Supporting agencies in the Rubber Value Chain
Financial institutions were the banks and insurance companies that granted credit and assists farmers
and marketers in their rubber business.
RRIN was the main source of training in the study area. The survey results revealed that majority of
respondents participated in training that were organized in the last three years. The results show that
most of the trainings were given on tapping, disease control and management, and the other trainings

20
such as intercropping-arable and perennial; mixed framing-mini livestock and post-harvest handling
were given. Trainings were not given on rubber marketing. The supporting agencies have never
organized any training on marketing of rubber.
Table 6: Access to Services by Respondents
Variables Items Edo
N=50
Delta
N=46
Akwa-Ibom N=44 Total
N=140
N % N % N % N %
Training Participated
in Training
Programme
45
90 40 86.96 40 90.91 125 89.29
Did not
Participate in
Training
Programme
5 10 6 13.04 4 9.09 15 10.71
Extension Access to
Extension
services
10 20 13 28.26 14 31.81 37 26.42
No Access to
Extension
services
40 80 33 71.74 30 68.18 103 73.57
Source: Computed from Survey Data, 2017
Marketing Channels for Natural Rubber in the Study Area
The diagrammatic representations of the marketing channels in the study area are contained in
Figures 2. Natural rubber in the study area had a long marketing chain because lump/latex passes
through many market participants and different form of processing before reaching the final
consumers. The major agencies in the channeling of natural rubber in the study area included the
producers, the marketers, the processors, manufacturers, exporter, the retailers and the consumers.
the main receivers from producers were marketers/collectors. The channels was however the same
for the three States. The majority of farmers (86.43%) sold their produce to marketers. The marketers
consisted of village marketers, wholesalers and co-operative societies or fellow farmers. About 46%
of farmers sold their produce to village marketer and wholesalers, 35% to co-operative society and

21
5.0% to fellow farmers. Marketers are the major buyers of rubber produce from producers because
they are accessible and available all the time. Most farmers in Edo State sold to the co-operative
societies, the co-operative in turn sold to the processors (Michelin Company). Farmers (13.57%) also
sold produce to processors and manufacturers. Five major marketing channels were identified. Study
also revealed that this is one product where the final consumer could not buy directly from the
producers. The volume of natural rubber (lump and latex) flow through the channel reflected efforts
by producers to sell their products through channels that provided more profit and also marketers
strive to buy through channels where they had a higher chance of making profit. It is clear that the
major value-added activity by the marketers was the transfer of latex or lump from one location to
the other as the trade was based mainly on raw materials. The major marketing functions carried out
in all five marketing channels are storage, packaging, grading and processing.

22
Figure 2: Marketing Channel for Natural Rubber Lump and Latex Concentrates in the Study Area.
Source: Computed from Survey Data, 2017
Wholesalers
Processors
Producer
Local manufacturers
Consumers
Retailers
Export
Wholesalers
Collectors/marketers

23
Marketing Margin at each Value Addition Point for Key Products
The identified functions included transportation, processing, storage, packaging and
distribution which formed the major components of the marketing margin. Table 7 shows the
average marketing margins for key products in the study area. Findings show that marketing
margin percentage for dry rubber crumb was the highest accounting for 60% of selling price,
followed closely by latex concentrates and sheet which recorded 59.20% and 50% respectively.
In Table 8, the mark-up/profit for the seedlings marketers accounted for 67.59% of the total
margin while the cost of marketing functions accounted for 32.43% with transportation cost
taking the greater proportion (24.32%) of the total margin. This is in conformity with the
findings of Achike and Anzaku (2010) that transportation accounted for the greater share of
the cost in the marketing of benniseed. The results also show that marketers who process into
latex concentrate, crumb and sheet had mark-up that accounted for 89.80%, 77.12% and 80.33%
of their total margin respectively which shows that the marketers and processors were more
exploitative in their prices relative to the marketers of seedlings and rubber lump. The
marketing functions for those that process into latex concentrate, crumb and sheet accounted for
10.20%, 22.88% and 19.67% of their total margins respectively with processing cost taking
the lion share. This also supports the findings by Folayan and Bifarin (2011) who found out that
processing cost was high relative to the other cost components in the business of plantain
processing in Ondo State.
Likewise the major components of marketing margin for seedlings and budded stump were
identified to be middlemen’s mark-up and transportation cost, which also corroborates Alufohai
and Abiola (2003) who found mark-up and transportation to be the major components in the

24
processing of plantain flour in Edo State. Likewise the major components of the marketing
margin for the processors of latex concentrates, rubber crumb and rubber sheet were
middlemen’s mark-up and processing cost. The mark-up for the budded stump marketers was
highest, which was closely followed by latex, sheets and crumb, while that of lump and seedling
were the least among the product in the study.
Table 7: Average Marketing Margins for key products
Products
/one/kg
Purchase price (N) Selling Price(N) Market Margin Marketing margin%
1 2 3 = (2 - 1) 4=3/2*100
Seedlings 10 13.7 3.7 27.01
Budded
Stump 41.29 60 18.71 31.18
Cup Lump 95.92 155.99 60.07 38.51
Latex Conc. 122.41 300 177.59 59.20
Crumb 155.99 390 234.01 60.00
Sheet 210 420 210 50.00
Source: Computed from Survey Data, 2017

25
Table 8 Identified Components of the Marketing Margin for Cup Lump and processed Products
Component
cost
Seedlings Budded stump Cup lump Latex Conc. Crumb Sheet
Mean Percentage
Mean Percentage
Mean Percentage
Mean Percentage
Mean Percentage
Mean Percentage
N N N N N N
Standardization
1.1 1.83 1.9 1.07
0.00 - -
Transportation 0.9 24.32 1.2 6.41 8.44 14.05 2.56 1.44 1 0.43 2.00 0.95
Packaging 0.2 5.41 0.1 0.53 0.07 0.12 1.11 0.63 1 0.43 2.00 0.95
Storage -
0.2 1.07 1.12 1.86 0.56 0.32 1 0.43 3.00 1.43
Processing 0 0.00
0.00
0.00 8.03 4.52 50 21.37 33.00 15.71
Losses 0.1 2.70 0.15 0.80 1.02 1.70 2.15 1.21 0.05 0.02 0.80 0.38
Other levies 0 0.00 0.2 1.07 4.00 6.66 1.8 1.01 0.5 0.21 0.50 0.24
Mark-
up/Profit 2.5 67.57 16.86 90.11 44.32 73.78 159.48 89.80 180.46 77.12 168.70 80.33
Total Margin 3.7 100 18.71 100 60.07 100 177.59 100 234.01 100 210 100
Source: Computed from Survey Data, 2017

26
Source: Computed from Survey Data, 2017
Figure 3: Bar Chart showing profit for different value addition points of Rubber
Value Addition through Processing
Results in Table 9 show value addition to natural rubber from seedlings to processing. Value
addition per unit of budded stump was N 14.36. Value addition per 1kg of rubber was N115.16
for latex concentrates, N 136.14 for crumb rubber and N 124.38 for sheet rubber. This means
that the value of the products could increase by a ratio of about 3:1 for all products. Findings
also show that crumb rubber had the highest value addition, which means it is more profitable to
process into crumb rubber followed by rubber sheet followed by latex concentrates. However it
is profitable to process into any of the three products when compared with the profit from
rubber lump (coagula). The differences was however significant at 5% level.
67.57
90.11 73.78
89.8 77.12 80.33
Seedlings budded stump cup lump latex conc. crumb sheet
Mark-up/Profit

27
Table 9 Value Added by Processing and Marketing Efficiency
Products Profit
(N)
Value Added
(N)
Cost of Value added
(N)
Marketing
Efficiency
Seedlings 2.5
1.2
Budded Stump 16.86 14.36 1.85 7.76
Cup Lump 44.32
15.75
Latex Conc. 159.48 115.16 18.11 6.36
Crumb 180.46 136.14 53.55 2.54
Sheet 168.7 124.38 41.30 3.01
Source: Computed from Survey Data, 2017
Conclusion and Recommendation
The study established numerous enterprises and products derivable from natural rubber value
chain. The rubber marketing system also gave a unique result as the marketing systems were the
consumer does not buy directing from the producer. The rubber value addition points all
appeared efficient and sustainable.
Based on the findings of this study the following recommendations have been made:
i. Nursery had the highest value add, farmers should be encouraged to venture into nursery
enterprise.
ii. Farmers should endeavor to integrate backwards to produce budded stumps and also
process rubber latex into its different products since they were all profitable.
iii. Farmers should be encouraged to form cooperatives/Commodity Associations/SMEs such
as: Use of lohashilpi sheeting battery for production of sheet rubber; Production of latex
concentrate; Production of dipped goods such as hand gloves, rubber band, balloons;
Information dissemination on production of industrial goods.
28
iv. The mean age of the farmers was approximately 53 years, which shows that the
respondents were relatively old; this call for concerted efforts that should aim at
encouraging younger farmers to embark on rubber production activities by the
Government and the Supporting agencies.
v. Training should be organized for marketers and other relevant agencies by the
Government and the Supporting agencies
vi. Market and processing infrastructure should be improved upon (by the Federal
Government and the Supporting agencies) by investing in advance technology/facilities
in order to improve the production, marketing and processing of natural rubber as it was
indicated as a major constraint.
REFERENCES
Abolagba, E.O, Aigbekaen, E.O. and Omokhafe, K.O. (2003). Farm Gate Marketing of Natural
Rubber in the South East Rubber Growing zone of Nigeria, Nigeria Journal of Agric. and
Rural Development 6:40-48
Abolagba, E.O. and Giroh, D.Y. (2006). Constraints to sustainable Development of Rubber
Industry in Nigeria. Moor Journal of Agricultural Research. 7(1): 42 – 48
Achike, A. I and Anzaku, T. A. K. (2010). Economic Analysis of the Marketing Margin of
Benniseed in Nasarawa State, Nigeria. Agro-Science Journal of Tropical Agriculture,
Food, Environment and Extension, 9(1): 47-55.
Aigbekaen, E.O., Imarhiagbe, E.O. and Omokhafe, K.O. (2000). Adoption of some
recommended Agronomic practices of natural rubber in Nigeria. Journal of Agriculture
forestry and Fish, 1: 51-56
Balogun, F.E, Esekhade, T.U., and Omo-Ikeroda, E.E. (2011). Analysis of Constraints to
Smallholder Farmers’ Involvement in Rubber production in Edo and Delta States,
Nigeria: Implications for Rural Policy Development. World Rural Observations, 3(4):
38-43
Banmeke, T. O. and Omoregbee, F. E. (2009). Farmers’ Perception of the Factors Militating
Against Rubber Production in Edo and Delta States of Nigeria International Journal of
Agricultural Economics, 2(2): 33-39
29
Central Bank of Nigeria (2013). Statistical Bulletins and Annual Report, 2012. Vol. 2. Dec.
2013.
Folayan J.A and J. O. Bifarin (2011). Economic analysis of plantain processing industry in
Akure south local government of Ondo State. Journal of Agricultural Extension and
Rural Development Vol. 3(4), pp.77-81.
Food and Agriculture Organization of the United Nations (2015). FAOSTAT Online Statistical
Service. Available online at: http://faostat.fao.org. Accessed July 21, 2017.
Giroh, D.Y. and Adebayo, E.F. (2009). Analysis of the technical in efficiency of rubber tapping
in Rubber Research Institute of Nigeria. Journal of Human Ecology. 27(3): 171 – 174
Giroh, D.Y., Umar, H.Y. and Yakub, W. (2010). Structure, Conduct and Performance of Farm
Gate Marketing of Natural Rubber in Edo and Delta State, Nigeria. African Journal of
Agriculltural Research, 5(14): 1780-1783.
Iyabo, B.A., Omobowale, A. O., Sulaiman, A.Y. and Kemisola, O.A. (2013). Plantain Value
Chain Mapping in Southwestern Nigeria. Journal of Economics and Sustainable
Development 4(16):137 – 145.
Mussema, R. (2006). Analysis of red pepper marketing. The case of Alaba and Siltie in Snnprs
of Ethiopia. MSc, Thesis, Haramaya University, Ethiopia.
Ogwuche, P., Umar, H.Y., Esekhade, T.U. and Francis, S.Y. (2012). Economies of
Intercropping Natural Rubber with Arable Crops: A Panacea for Poverty Alleviation of
Rubber Farmers. Journal of Agriculture and Social Science. 8: 60-66.
Oni, T.O. (2013). Evaluation of Income and Employment Generation from Cassava Value
Chain in the Nigerian Agricultural Sector. Asian Economic and Social Society. 3(3):145-
154.
RRIN (2010). 2010 Annual Report. Federal Ministry of Agriculture Abuja – Nigeria. 57p.
Schroth G, Moraes VHF, da Mota MSS (2004). Increasing the profitability of traditional, planted
rubber agro forest at the Tapajo’s river, Brazilian Amazon. Journal of Agriculture,
Ecosystem Environment, 102: 319-339
Umar, H.Y., Giroh, D.Y., Agbonkpolor, N.B. and Mesike, C.S. (2011). An overview of World
Natural Rubber Production and Consumption: An implication for Economic
Empowerment and Poverty Alleviation in Nigeria. Journal of Human Ecol. 33(1): 53 –
59.
Umar, H.Y. and Ugwa, I.K. (2006). Global Evaluation of natural rubber production (1894 –
2004): The Nigerian experience. Nigeria Journal of Tropical Agriculture. 8(1): 164-175.

30
APPENDIX
Rootstock nursery
Bud wood garden of RRIN developed natural rubber clones

31
Rubber + cassava
Rubber + pineapple
Rubber + yam
Natural rubber intercropping
Rubber + Snailery
Rubber + Bee hive
Mixed farming in rubber plantation

32
Showing Rubber Latex, Cup Lump, Sheet and Crumb Rubber

33

![smallholders in Marathwada, Maharashtra state [India]](https://static.fdokumen.com/doc/165x107/632768b35c2c3bbfa80429ba/smallholders-in-marathwada-maharashtra-state-india.jpg)