Special Section 1: Global Value Chains (GVCs)
16
Special Section 1: Global Value Chains (GVCs) – Implications for Pakistan S1.1 Introduction Global Value Chains (GVCs) had been the most prominent force behind globalization and world GDP growth during 1995-2008. 1 Over the past two decades, the scale and patterns of global trade have become organized around and governed by the GVCs. This is evident from the fact that GVC-related trade accounts for 48.1 percent of the total global trade (Figure S1.1). In light of the above, this section intends to: (i) highlight the importance of GVCs and comment upon the emerging trends with regards to their structure and organization; (ii) present stylized facts about the current position of Pakistan in the GVCs; and (iii) elaborate upon the policy implications and the way forward for the country to enhance its integration with the global production networks. In particular, the section makes the case that without increasing its share in the GVCs, it will be challenging for Pakistan to achieve sustainable export-led growth. S1.2 Importance of Global Value Chains GVCs are enterprise networks in which the production of a certain commodity/service crosses at least one border, and typically many borders, before final assembly or provision. For instance, production design and engineering elements of the iPhone are finalized in the US, while the assembling and packaging is outsourced to countries like China and Vietnam; these, in turn, use components shipped from countries such as South Korea and Japan to produce the final output. The product would then be re-exported to the US (and other destination economies) to be marketed and sold in its final form. The reason that GVCs have become so important over the past two decades is that they have provided the means for countries to overcome indigenous resource 1 Source: Measuring and Analyzing the Impact of GVCs on Economic Development, Washington DC, World Bank (2017). 35 40 45 50 55 60 65 1970 1973 1976 1979 1982 1985 1988 1991 1994 1997 2000 2003 2006 2009 2012 2015 percent GVC Traditional Figure S1.1: Decomposition of International Trade between Traditional Networks and Global Value Chains Data source: World Bank (2019); Johnson and Noguera (2017)
-
Upload
khangminh22 -
Category
Documents
-
view
3 -
download
0
Transcript of Special Section 1: Global Value Chains (GVCs)

Special Section 1: Global Value Chains (GVCs) – Implications for Pakistan
S1.1 Introduction
Global Value Chains (GVCs)
had been the most prominent
force behind globalization and
world GDP growth during
1995-2008.1 Over the past two
decades, the scale and patterns
of global trade have become
organized around and governed
by the GVCs. This is evident
from the fact that GVC-related
trade accounts for 48.1 percent
of the total global trade
(Figure S1.1).
In light of the above, this section intends to: (i) highlight the importance of GVCs
and comment upon the emerging trends with regards to their structure and
organization; (ii) present stylized facts about the current position of Pakistan in the
GVCs; and (iii) elaborate upon the policy implications and the way forward for
the country to enhance its integration with the global production networks. In
particular, the section makes the case that without increasing its share in the
GVCs, it will be challenging for Pakistan to achieve sustainable export-led
growth.
S1.2 Importance of Global Value Chains
GVCs are enterprise networks in which the production of a certain
commodity/service crosses at least one border, and typically many borders, before
final assembly or provision. For instance, production design and engineering
elements of the iPhone are finalized in the US, while the assembling and
packaging is outsourced to countries like China and Vietnam; these, in turn, use
components shipped from countries such as South Korea and Japan to produce the
final output. The product would then be re-exported to the US (and other
destination economies) to be marketed and sold in its final form.
The reason that GVCs have become so important over the past two decades is that
they have provided the means for countries to overcome indigenous resource
1 Source: Measuring and Analyzing the Impact of GVCs on Economic Development, Washington
DC, World Bank (2017).
35
40
45
50
55
60
65
19
70
19
73
19
76
19
79
19
82
19
85
19
88
19
91
19
94
19
97
20
00
20
03
20
06
20
09
20
12
20
15
per
cen
t
GVC Traditional
Figure S1.1: Decomposition of International Trade between Traditional Networks and Global Value Chains
Data source: World Bank (2019); Johnson and Noguera (2017)
The State of Pakistan’s Economy
86
dependency by enabling them to import raw material and intermediate inputs and
adding value to them via further processing. This has had a two-fold impact.
First, the countries have been able to develop those industries in which they might
have a competitive advantage, even if resources for the same were not available
domestically at all, or if the local resources were of an inferior quality or in less
abundance (backward integration). Second, it allows countries to export locally
manufactured/processed items in raw or unfinished form (forward integration) in
which they might not have a competitive advantage over the full value addition
cycle. This leads countries that are integrated with the GVCs to achieve
sustainable growth patterns in their exports that are also more aligned with the
overall global demand.
As mentioned before, GVC participation has allowed many countries to increase
their exports, even when local availability for the required resources of production
were negligible or absent. For instance, despite having negligible local raw
materials (cotton or synthetic fiber), Bangladesh has consistently expanded its
garment export base – a process within the overall textile value chain where it had
competitive advantage in terms of cheaper labor. This, in turn, led the country to
import intermediate goods from economies that had a competitive advantage in
producing those (for example, Pakistan and India for fabric and yarn). As
Bangladesh’s participation in the GVCs rose, it was able to consolidate its
presence in Europe and North America’s apparel markets.2 Today, Bangladesh is
the second biggest exporter of apparel and clothing accessories in the world,
second only to China. It is important to recall here that garments alone account
for over 85 percent of Bangladesh’s total exports, and have been the major engine
of growth for the economy. The increasing integration of its firms with GVCs has
thus helped the country become the fastest growing economy in South Asia over
the past couple of years.
Vietnam is another success story. In the mobile manufacturing segment, for
instance, Vietnam focuses primarily on production of outer structures and final
assembling, and imports high-tech components such as semiconductors, displays
and turnkeys from countries like the US, Taiwan, Korea and China. Those
countries have competitive advantages in producing technology-intensive products
2 Alongside integration with the GVCs, factors such as liberal investment and trade policies, focus
on addressing structural problems, and overall macroeconomic stability also figured prominently in
Bangladesh achieving consistently high export and economic growth. According to the World
Bank’s Bangladesh Development Update (2019), economic “output growth will be supported by
strong macroeconomic fundamentals, faster implementation of public investments in megaprojects,
continued movement of labor away from low productivity sectors in agriculture, higher domestic
demand aided by remittances, and continued export growth as production shifts from China.”
First Quarterly Report for FY20
87
and services (design elements and engineering), while Vietnam has an edge in
labor-intensive and scale-based operations, such as assembling and packaging.
This led Vietnam to become the third-largest smartphone exporter in the world,
and to get highly integrated with Samsung’s value chain, producing 40 percent of
the firm’s mobile devices. Similarly, countries like Taiwan, China and South
Korea were able to focus on their core competencies and further solidify their
shares in the higher-end stages of the manufacturing chain.
In overall terms, GVCs have therefore resulted in substantial returns for both the
advanced and emerging economies, as well as for the firms and the consumers. In
developed economies, GVCs provide access to more competitively priced inputs,
higher variety of goods and services, and economies of scale. For emerging
economies, GVCs are viewed as a fast-track towards industrialization – where
countries join existing supply chains instead of building them anew. GVC
participation also helps attract more investment in the emerging economies;
however, the relationship is not like-for-like, as investments also crucially depend
on broader policy and institutional frameworks of an economy.
For firms, the trade, investment and knowledge flows underpinning GVCs provide
mechanisms for rapid learning, innovation, and industrial advancement.
Meanwhile, productivity rises as businesses relocate the least efficient production
stages to concentrate on core activities. Furthermore, as a cost-saving technique,
offshoring potentially raises profits that can be utilized for pursuing innovation.
S1.3 Restructuring of GVCs and Emerging Opportunities for Pakistan
While countries like Vietnam and Bangladesh have reaped substantial returns in
terms of export and economic growth over the past two decades via participation
in the GVCs, Pakistan has been unable to establish a similar presence in the global
production and supply networks. However, the following key developments
pertaining to GVCs currently underway provide the country with an opportunity to
realign its trade activities and improve integration within the existing and
emerging global value chains.
First, the manufacturing activities around the world are becoming more services-
oriented. Trade flows in value-added terms reveal that transport logistics,
communication, and financial services play important roles in GVCs. Resultantly,
the value created by services as intermediate inputs represent over one-third of
total GVA of global manufacturing, and services exports figures in gross terms

The State of Pakistan’s Economy
88
(43 percent) vastly understate the exports of services in value-added terms (21
percent).3
Second, information technologies are undergoing a revolutionary transformation.
Businesses and consumers alike are transitioning from the usage of social media,
analytics, and cloud computing to areas such as distributed ledger technology,
artificial intelligence, reality augmentation, and quantum computing. Together,
these developments stand to facilitate and increase the transfer and accessibility of
information exponentially, thereby enabling more processes and activities to be
fragmented and/or outsourced.
Third, with consumption patterns changing and becoming more personalized, the
GVCs are also undergoing a transformation, from mass production towards mass
customization. This is resulting in the creation of multiple value chains for similar
products, with input materials being sourced from various locations instead of
relying on suppliers from a single geographical location. The wage increases in
production countries such as China are also pushing firms to relocate to alternate
destinations to keep their competitive edge intact.
Fourth, the gradual rise in demand in the emerging economies, particularly China
and India, is increasing the attraction of such destinations not only as an
outsourcing market but also as a selling one. This rerouting of value chains is
expected to continue over the next decade and beyond as emerging economies are
3 OECD. The Future of Global Value Chains – Business as Usual or a New Normal? September
2017.
4.6
4.8
4.9
4.9
4.9
5.2
5.3
5.8
7.4
8.2
0 2 4 6 8 10
Algeria
Vietnam
Kenya
U.A.E.
Saudi Arabia
Guatemala
India
South Korea
Cameroon
Pakistan
percentData source: Euromonitor International (2017)
Figure S1.2b: Fastest Growing Retail Markets Annual Growth Forecast 2016-2021
8174
62
49
1926
38
51
0
10
20
30
40
50
60
70
80
90
1995 2007 2017 2030(proj.)
per
cen
t
Advanced Emerging
Figure S1.2a: Share in Global Demand by Type of Economy
Data source: McKinsey Global Institute (2019)

First Quarterly Report for FY20
89
expected to achieve 50 percent share in total global demand by 2030 fueled by
consistently high retail market growth rates (Figure S1.2).
Keeping in view these developments, Pakistan must utilize this opportunity and
deepen the linkage of its manufacturing activities with the global value chains to
steer its exports towards a sustainable growth trajectory, akin to Bangladesh’s
performance in the textile sector (Figure S1.3). In this backdrop, the following
sub-section analyzes the potential of Pakistani firms to reorient their businesses
within the established chains pertaining to textiles, electronics and ICT sectors. In
the long run, the country holds the potential to target even the middle- to higher-
end segments of the GVCs, given that the right mix of policies is adopted
(discussed in subsequent sub-sections).
S1.4 Where does Pakistan Stand?4
At present, Pakistan stands among those economies that could not realize
maximum benefits of integrating into GVCs across different sectors. The
following stylized facts present the prominent features of the value added content
of Pakistan’s exports and their level of participation in global production
networks.
The value added profile of Pakistan’s exports shows that the country has
remained unable to achieve adequate level of foreign value addition to its
exports. As shown in Figure S1.4, the domestic value-added content (i.e.,
4 The data referred to in this section has been extracted from the EORA database. Formal citation
is: Casella, B.R. Bolwijn, D. Moran and K. Kanemoto (forthcoming). Improving the analysis of
global value chains: the UNCTAD-Eora Database. Transnational Corporations 26(3). New York and
Geneva: United Nations.
0
5
10
15
20
25
30
35
40
45
2003
2005
2007
2009
2011
2013
2015
2017
US$
bil
lio
n
Pakistan Bangladesh
Figure S1.3b: Textile Finished Goods Exports
0
2
4
6
8
10
12
14
2003
2005
2007
2009
2011
2013
2015
2017
US$
bil
lio
n
Pakistan Bangladesh
Data source: International Trade Centre
Figure S1.3a: Textile Raw Material Imports

The State of Pakistan’s Economy
90
value added of intermediate goods that are produced locally) predominantly
constitutes Pakistan’s exports. In contrast, the share of foreign value-added
content of exports, which corresponds to the value added of inputs that were
imported in order to produce intermediate or final goods/services to be
exported, is quite small. Furthermore, during the span of 20 years (1995-2015),
the share of foreign value added in exports inched up by only 0.7 percentage
points.
This phenomenon is also reflected in the overall composition of GVC
participation of Pakistan, which is the sum of backward and forward
participation in global exports. The data suggests that the share of backward
participation in exports (the share of imported intermediate inputs the country
used to produce exports), only reached 5.6 percent in 2015 (Table S1.1). This
signifies two main characteristics of Pakistan’s trade paradigm:
i. Exports have been concentrated in low value added products and primary
commodities, which do not usually require processing of imported inputs;
and
ii. The country has imposed strong trade policy distortions in the form of
tariff and non-tariff barriers on imports – Pakistan’s tariffs on intermediate
goods are four times the average in East Asia.5 This ultimately results in
higher production costs for exporting firms and erode their
competitiveness in the global market.
5 World Bank 2020. World Development Report 2020: Trading for Development in the Age of
Global Value Chains. Washington DC: World Bank
0 50 100
1995
2005
2015
percent
Domestic value added Foreign value added
Figure S1.4a: The Value Added (VA) Components of Exports, 1995, 2005 and 2015 (percent share)
8.3
10.39.0
11.1
4.8
9.711.0
12.0
7.9
5.8
Pak
ista
n
India
Ban
gla
des
h
Chin
a
US
A
per
cen
t
Domestic value added Foreign value added
Figure S1.4b: Percentage Change in VA Components of Exports, 2005 - 2015
Data source: UNCTAD-Eora Global Value Chain Database

First Quarterly Report for FY20
91
In case of forward participation, which reflects the share of intermediate
goods in Pakistan’s exports that are used as inputs in exports of other
countries, Pakistan’s performance is relatively better. As shown in Table
S1.1, 27 percent of Pakistan’s exports are used as inputs in exports of other
countries. Most of these exports originate from primary agricultural
commodities and low-tech manufacturing sectors (such as cotton
yarn and fabric), and are shipped to China, Bangladesh and Turkey, which
produce and export value-added finished products to high-end garment stores
such as Zara, Marks & Spencer and H&M.6
During 2000-15, Pakistan could only increase its GVC participation by US$
6.7 billion (Figure S1.5). The country exhibited the lowest rate of GVC
participation as percent of exports in 2015. This shows the low presence of
Pakistani companies in the network of coordinated transactions among
different layers of firms on a global scale.
The value-added content of Pakistan’s exports is predominantly concentrated
in a single sector – textiles and wearing apparels – which represent 60 percent
of domestic value addition in the country’s exports. It has also added the
6 For instance, the share of Pakistan in overall Bangladesh imports of denim fabric was recorded at
24.7 percent in 2018.
Table S1.1: GVC Participation Index*
Percentage share in total exports
Total GVC participation* Backward participation** Forward participation***
1995 2015 1995 2015 1995 2015
Singapore 80.5 70.7 68.9 57.9 11.7 12.7
Malaysia 65.5 63.3 48.4 35.5 17.1 27.8
UK 52.2 58.9 26 25.3 26.2 33.7
Vietnam 44.9 57.1 27.5 35.6 17.4 21.5
France 49.6 55.9 24.7 28.2 24.9 27.7
Germany 47.3 55.5 24.7 33.2 22.6 22.3
Turkey 43.9 51.8 19.1 28.5 24.8 23.3
Japan 39.1 46.8 9.1 19.4 30 27.5
USA 38.4 44.5 9.3 13 29.1 31.5
China 32.4 42.8 11.6 13.8 20.8 29
India 33.1 40 9.4 14 23.7 26.1
Pakistan 26.7 33.2 4.8 5.6 22 27.6
* GVC Participation index is a sum of share of backward and forward participation in exports
**Backward participation shows share of imported intermediate inputs the country is using in exports ***Forward participation shows share of intermediate inputs the country is exporting to other countries
Data source: UNCTAD-Eora Global Value Chain Database

The State of Pakistan’s Economy
92
highest content of foreign
value addition of 3.8
percent to its exports, in
the form of chemical and
dyes, high quality cotton,
man-made fiber (MMF),
etc.
In 2015, over 50 percent of
Pakistan’s exports went to
five countries: China,
USA, Germany, Saudi
Arabia and the UK. In
addition, most of the
exports to these countries
were textiles and apparel products, with the highest share of 85.1 percent in
total exports to China and the lowest of 48.7 percent in case of Saudi Arabia.
Box S1.1: Strategies to Improve Participation of Existing Exporting Sectors in GVCs
In order to increase participation along the GVCs, a low-hanging fruit can be to target sectors where
domestic players already have established global relationships, such as textiles and Business Process
Outsourcing (BPO). This strategy would not only provide an opportunity to deepen the present
relationships, but also allow firms to branch out and diversify both their product base (towards
higher value-added items) and geographic sources/destinations. Going forward, however, Pakistan
must tap sectors, such as light engineering, appliances manufacturing and services, whose shares in
GVC trade are consistently rising.
In light of the above, this section builds upon the prospects of Pakistan’s current exporting sectors to
engage in the evolving GVCs, using the World Bank and Duke University’s Global Value Chains
Center studies for exporting sectors including textiles, medical devices and offshore services.7
a. Textiles
During FY19, Pakistan’s apparel exports (comprising knitwear and readymade garments) fetched
US$5.4 billion; exports had risen steadily over the last two decades and grown by nearly 200 percent
since FY00. However, the sector could not tap the growing demand in the product categories
offering higher unit values, like those based on man-made fiber (MMF); instead, exports are
concentrated in cotton-based products, which fetch lower unit prices. Besides, the sector also lacks
some vital links in the value addition processes that, if focused upon, could generate more earnings
as compared to conventional processes. For instance, firms are clustered around low value stages of
Original Equipment Manufacturers (OEMs), and the second tier Cut, Make & Trim providers
(CMTs); active participation is missing at the most value added stages of GVCs i.e., Original Brand
Manufacturers (OBMs) and Original Design Manufacturers (ODMs). The absence of links with
OBMs and ODMs explains the lack of product diversity and upgradation in the country’s apparel
sector.
7 This section also draws heavily from discussions with stakeholders in the relevant industries.
806
725
401
343
300
260
194.1
136.2
107.4
42.9
9.96
6.72
Germany
China
USA
France
UK
Japan
Singapore
Malaysia
India
Turkey
Viet Nam
Pakistan
Figure S1.5: Change in Total GVCs -2000-2015 (US$ billion)
Data source: UNCTAD-Eora Global Value Chain Database

First Quarterly Report for FY20
93
Being the world’s 5th largest cotton producer, Pakistan has relatively easier access to a major input
for apparel-making, which facilitates backward linkages in the value addition process. In addition,
the sector also has a competitive edge over regional peers in the form of: i) low labor wages; ii)
GSP+ access to EU markets; iii) domestic ownership of firms and their vertical integration; and iv)
an extensive network of supportive institutions at each stage of the value chain.8 Realizing these
benefits, the apparel sector has achieved moderate success in product upgradation: in 2016, the
country stood 3rd in unit value associated with denim-trouser export and 6th in terms of quantum
exports. Some of the country’s leading firms have started to contribute in the supply chain of global
brands such as Target, the Gap, Levi’s, and C&A etc.
b. Medical Devices
Pakistan has a long history of exporting surgical instruments, exhibiting an edge in the
manufacturing of metallic instruments. Besides low wage labor, established capacities for a wide
range of products and a geographically concentrated production hub in a single city – i.e. Sialkot –
assists the industry to cater to the growing global demand.9
However, Pakistan does not currently have a strong foothold in the medical devices industry. In
terms of the sector’s linkages with the GVCs, 98 percent of the local participation is concentrated in
the precision metal instruments segment (Table S1.1.1). Resultantly, the leading firms (MNEs) that
dominate the global medical devices business did not actively invest in Pakistan’s domestic industry,
and instead set up their production facilities in Malaysia (Penang), Mexico (Baja California), and the
Dominican Republic (Santo Domingo) etc. This MNE investment significantly contributed to the
product and process upgradation of local industries in those countries.
Table S1.1.1: Presence of Pakistan's Firms in Medical Device GVCs
Research &
development
Component
manufacturing Assembly Distribution
Marketing &
sales Post-sales services
Prototype Software dev. Assembly Capital equipment Cardiovascular Training
Process development
Electronic/elec. comp.
Packaging Therapeutic
devices Orthopedics Consulting
Regulatory
approval
Precision metal
works
Sterilizati
on
Surgical &
medical Inst. General surgery
Complains
management
Sustaining eng. Plastic extrusion Disposables Infusion systems Maintenance/repair
Weaving knit. text. Consumables Others Highlighted cells indicate areas where Pakistani firms have a presence in the GVCs
Data source: World Bank and Duke University’s Global Value Chains Center
Since Pakistan has basic infrastructure to tap the growing demand in the medical devices industry,
diversification and inter-sectoral upgradation in products and processes will be key to increase
8 The export-oriented sectors in Pakistan, including textiles, are also provided with concessionary
borrowing facilities such as SBP’s Export Finance Scheme (EFS) and Long Term Financing Facility
(LTFF). 9 Currently, few firms in the medical device industry have ventured into relatively advanced product
markets, such as endoscopic instruments, liposuction accessories, biopsy punches and implantable
staples.

The State of Pakistan’s Economy
94
participation in the GVCs. The current initiatives of setting up SEZs and EPZs (with customary
benefits such as tax holidays, duty free exports/imports, equity ownership etc.) may attract leading
firms, entailing positive spillover for the local industry. Lastly, product diversification in new
segments, such as apparatus used in minimally invasive surgeries, disposable items, medical textile
items, therapeutics and implantable devices, may assist the local industry in carving out a sizeable
share in the upscale GVCs.
c. ICT Services
ICT services are one of the most promising areas for Pakistan’s future exports. The sector, which
was almost non-existent in the early 2000s, grew extensively during the last decade. This is evident
from the double-digit growth in exports of segments such as software consultancy services, call
centers and other software and computer services during FY06-FY19 (Table S1.1.2).
The latest available estimates suggest that in terms of revenues, the market size of global offshoring
services ranges from US$262 billion to US$1.3 trillion (as of 2017). The global value chain of
offshore services has three horizontal segments: Information Technology Outsourcing (ITO),
Business Process Outsourcing (BPO) and Knowledge Process Outsourcing (KPO), and a vertical
segment that pertains primarily to the financial sector. In terms of magnitude, ITO dominates with
52 percent of total deal values in 2017, followed by KPO with 18 percent share.10
In comparison to mature markets like India, Philippines, Sri Lanka, Mexico etc., Pakistan’s share in
global offshore services exports is minimal, at 0.1 percent. Most of the activities of Pakistan’s
offshore services firms are concentrated around low value added services in ITO and BPO, which
have a cumulative share of 65 percent in total offshore services; very few firms are active in vertical
and knowledge process outsourcing.
10 ‘Global IT-BPO Outsourcing Deals Analysis,’ Annual Analysis for 2017, KPMG (2017).
Table S1.1.2: Pakistan's Exports of ICT Services Value Chain
In million US$ CAGR
(FY06-19)
FY06 FY10 FY19 (percent)
a. Information Technology Outsourcing
Software consultancy services 18.1 31.4 354.6 25.7
Export / Import of computer software 46.7 124.2 279.5 14.8
Other computer services 5.9 29.6 155.0 28.5
b. Knowledge Process Outsourcing
Research and development services 3.8 5.2 17.3 12.4
Legal services 5.8 18.3 19.0 9.5 Accounting, auditing, bookkeeping, and tax
consulting services 17.3 4.0 34.7 5.5
Business and management consulting and public relations services 47.2 87.5 144.8 9.0
Advertising, market research, and public
opinion polling 20.0 20.9 108.8 13.9
c. Business Process Outsourcing
Call centers 0.0 16.6 98.7 NA
d. Vertical Activities
Financial services 70.1 89.7 107.8 3.4
Insurance and pension services 28.6 41.8 45.0 3.6
Data source: SBP

First Quarterly Report for FY20
95
S1.5 Policy Implications and the Way Forward
To increase traditional exports, countries have relied on updating their investment
policies, signing free trade agreements and bilateral investment treaties with
strategic partners, becoming a part of regional trade associations, and loosening
FDI and labor regulations, etc. However, a key distinction in terms of GVC
exports is that they require liberalization of a country’s import policy, particularly
pertaining to raw and intermediate products and services. This is vital to ensure
businesses’ participation in both backward and forward value chain processes.
Currently, sectors such as electrical & machinery, petroleum, chemical, mineral,
transport equipment, metal products and financial intermediaries & business
activities, capture the first five positions in terms of global export revenues.
However, Pakistani firms have marginal presence in these sectors at the global
level (Figure S1.6).
Given the level of innovation, automation techniques and human skills that some
high-tech industries require, it would be challenging for Pakistan to pursue them
over the short- to medium-term. As mentioned before, the existing base of
infrastructure in the country’s current exporting sectors (textile, leather, and
offshore services etc.) may be utilized effectively to tap GVCs in the low value
added segments in the first stage. The participating firms may eventually venture
into more complex processes, once fully realizing their comparative advantage in
the existing products and processes. Furthermore, the importance of human
capital development cannot be overstated. Particularly, the labor-intensive and
low-skilled manufacturing activities in which Pakistani firms trade the most in the
GVCs, are the most susceptible to disruption under the ongoing global automation
0.5
0.7
1.0
1.0
1.1
1.2
1.3
1.5
1.7
2.9
4.7
Agriculture
Wood and Paper
Food & Beverages
Transport
Mining and Quarrying
Textiles and Wearing Apparel
Fin. Interm. and Bus. Act.
Metal Products
Transport Equipment
Petrol., Chem. & Non-Met. Min.
Electrical and Machinery
Global exports in terms of trillion US$
0.32
0.01
0.16
0.14
0.02
1.42
0.00
0.03
0.00
0.02
0.01
Pakistan's share in global exports
Figure S1.6: Exports of Major Sectors and Pakistan's Share in Global Exports (2015)
Data source: UNCTAD-Eora Global Value Chain Database
The State of Pakistan’s Economy
96
and digitization drive. More importantly, if the country aspires to become a
noteworthy participant in the high-growth areas such as ICT and financial
intermediation services, substantial investment would be required to prepare the
workforce for the evolving demands of those industries.
Designing an adequate and effective institutional framework is necessary to
facilitate growth of domestic businesses As illustrated in detail in the Annual Report of FY19, a major reason for the
constrained investment and business climate in Pakistan is the difference between
the de jure and de facto policy environments for domestic investors.11 In
particular, the existing investment landscape is deficient in terms of facilitation for
local businesses, partly due to issues on the contract enforcement and dispute
resolution fronts, as well as inadequate guidance and policy communication
practices of the relevant supervisory and regulatory government authorities. This
results in investors finding it hard to carry out and expand their business activities
over the medium- to long-term. The unfavorable tax environment also merits a
special mention, with domestic firms facing cumbersome documentation
procedures, incidences of corruption, and an overall lack of ease on the tax
administration front.
Encouragingly, substantial improvement in the business climate has been observed
over the past couple of years. This is evident from the 39 point jump in Pakistan’s
standing in the World Bank’s Ease of Doing Business rankings, from 147th in
2017 to 108th in 2019. However, it is vital now for the government to ensure that
these improvements are not only maintained but also built upon further. Here,
emphasis should be on the establishment of clear communication and policy
advocacy channels for businesses; enhanced cooperation between federal and
provincial authorities to minimize policy uncertainties and complexities; targeted
incentive programs for domestic firms showing growth potential as well as
integration capability within the GVCs; and a stronger role of the state bodies to
lead investments in sectors deemed important for long-term objectives.
Attracting and integrating with MNEs must be a priority
It is widely held that a major reason for the increased GVC-related trade activities
over the past two decades is the rising popularity of multinational enterprises
(MNEs).12 These corporations, with their dispersed and vertically integrated
11 For details, please see Chapter 7 titled “Factors Constraining Investments in Pakistan: Beyond the
Macroeconomics” in the SBP’s FY19 Annual Report on the State of Pakistan’s Economy. 12 See, for example, Baldwin, R. (2016), The Great Convergence, Information Technology and the
New Globalization, Harvard University Press and Dicken, P. (2015), Global Shift: Mapping the
Changing Contours of the World Economy, Seventh edition, Guilford Press, New York.

First Quarterly Report for FY20
97
operational footprints, are particularly important for the developing economies.
This is because they provide an opportunity to easily integrate in the already
established global production networks. According to recent estimates, MNEs
account for around one-third of the global output and 80 percent of total world
exports.13 In particular, of the production by foreign affiliates of MNEs – which
grew from US$ 7 trillion to US$ 20 trillion between 2000 and 2014 – around 60
percent consists of intermediate goods and services to be used for production of
final products across the various GVCs.
Encouragingly, the government has introduced various reforms to improve and
broaden the scope of the Board of Investment (BOI) in the areas of grievance
handling, dedicated country- and sector-specific task forces, investment tracking
services and policy advocacy channels, etc. The efforts on this front have been
acknowledged in the World Bank’s Doing Business rankings as well. If such
measures are continued, they would attract investors and MNEs into the country
going forward.
Pakistan needs to liberalize its trade policy Pakistan was late in initiating trade liberalization policies compared to the regional
economies at the start of the century.14 This had a twofold impact. First, higher
tariffs meant that the input costs were higher than for peer economies, resulting in
lost competitiveness. Second, by the time the country finally started rationalizing
the tariff lines, many of the competitors had already forged international trade
relationships with buyers and suppliers; this meant that Pakistan missed the first-
mover advantage just when complex GVCs were gaining traction.
While the tariff liberalization process in Pakistan since the start of the 2000s has
been substantial, the applied rates are non-uniform across sectors. This has meant
that some industries, such as automobile and steel, have continued to enjoy higher
protection, which fueled an anti-export bias. The protectionist policy stance is
also augmented by the imposition of various regularity duties (RD) on imported
items – a measure that was initially adopted as a temporary tool to tackle the
balance of payments crisis of FY08, but gained in scope and applicability over
13 Cadestin, C., De Backer, K., Desnoyers-James, I., Miroudot, S., Ye, M., & Rigo, D. (2018).
Multinational Enterprises and Global Value Chains: New Insights on the Trade-Investment Nexus.
OECD Science, Technology and Industry Working Papers, 2018(5), 0_1-36. The estimates provided
in the study were obtained by taking into account the MNEs’ “arms-length” trade (i.e. trade between
MNEs and final consumers or non-MNE firms), intra-firm trade (i.e. trade within MNEs between
affiliates or with the parent company) and trade between companies that have no ownership link but
are associated through franchising, licensing or other forms of contractual relationships. 14 World Bank. 2006. Pakistan - Growth and Export Competitiveness. Washington, DC.

The State of Pakistan’s Economy
98
time as a revenue-generating tool for the government. Hence, there is an urgent
need to correct this trend.
According to the World Economic Forum’s Competitiveness Index rankings of
2019, Pakistan stands at 138th position in terms of trade openness out of 141
countries. By contrast, regional competitors such as Vietnam and Bangladesh
stand at 91st and 119th positions, respectively, and fare better in indicators like the
prevalence of non-tariff barriers, trade tariff rates, tariff complexity, and border
clearance efficiency.15 Pakistan’s ranking is particularly weakened by below-par
performance in the trade tariffs sub-index, where Pakistan ranks at 139th out of
141 economies.
From the policy perspective, the authorities should strive to streamline and
rationalize trade tariffs by committing to a minimal and uniform structure in order
to encourage export-orientation. Furthermore, policy coordination between the
trade policy setting authorities (such as the Ministry of Commerce) and para-tariff
implementation bodies (such as FBR) is vital to strike an efficient balance
between trade liberalization and the revenue generating objective of the
government. This would bring much needed clarity and transparency to the
import policy, thereby reducing uncertainty and improving businesses’ confidence
and access to competitive inputs for value-addition and re-exporting purposes.
Focus should be on trade logistics and facilitation
Faster and smoother trade flows are important with regards to conventional trade
activities, and they become even more so under the GVC model. Pakistan can
vastly improve its trade potential in the GVCs by enhancing the state of trade-
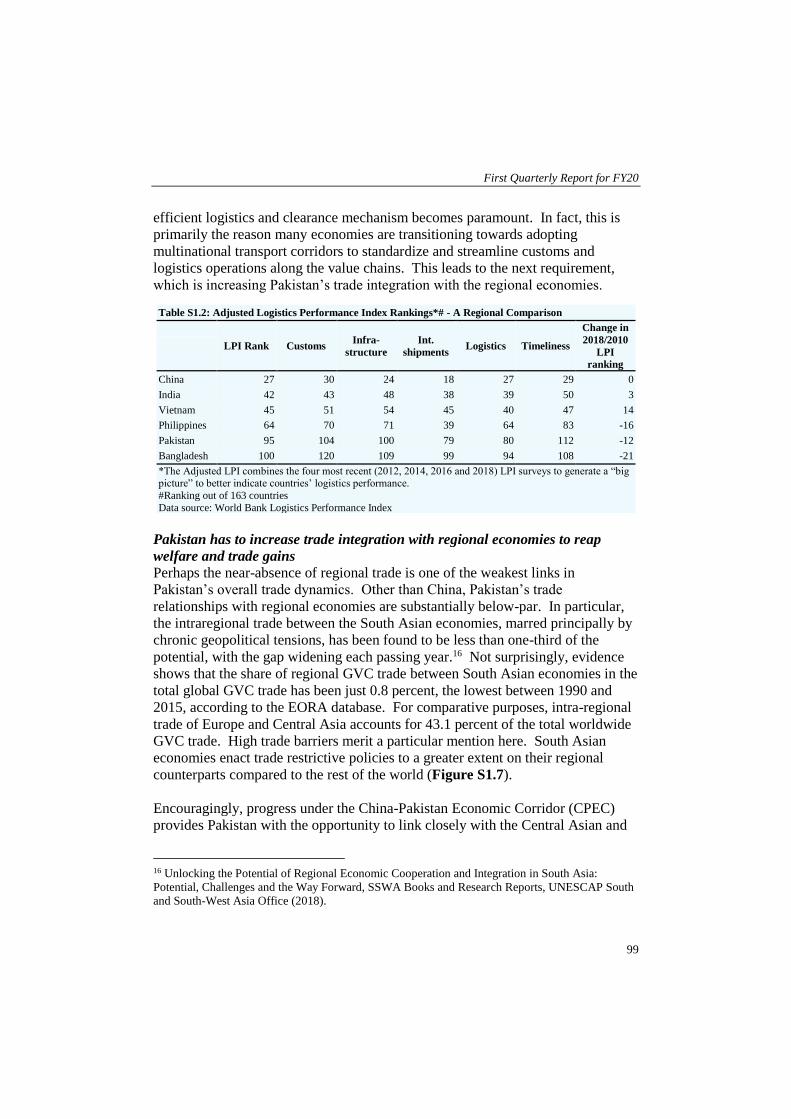
related infrastructure and service provision in the country. At present, Pakistan
performs poorly amongst selected peer economies in terms of customs,
infrastructure, international shipments and logistics competence, and timeliness
(Table S1.2). Cumbersome documentation requirements, delays in clearance,
high port traffic, and poor record of timeliness has led to a fall in the country’s
ranking in the World Bank’s Logistics Performance Index to 122nd in 2018, from
110th in 2010.
Digitization of customs procedures, liberalizing transport services and further
investment in road, railway and port physical infrastructure can go a long way
towards addressing this deficit. Add in the changing demand dynamics that call
for increased customization and reduced delivery times, and the need for an
15 Global Competitiveness Report 2019: How to End a Lost Decade of Productivity Growth. World
Economic Forum.
First Quarterly Report for FY20
99
efficient logistics and clearance mechanism becomes paramount. In fact, this is
primarily the reason many economies are transitioning towards adopting
multinational transport corridors to standardize and streamline customs and
logistics operations along the value chains. This leads to the next requirement,
which is increasing Pakistan’s trade integration with the regional economies.
Pakistan has to increase trade integration with regional economies to reap
welfare and trade gains
Perhaps the near-absence of regional trade is one of the weakest links in
Pakistan’s overall trade dynamics. Other than China, Pakistan’s trade
relationships with regional economies are substantially below-par. In particular,
the intraregional trade between the South Asian economies, marred principally by
chronic geopolitical tensions, has been found to be less than one-third of the
potential, with the gap widening each passing year.16 Not surprisingly, evidence
shows that the share of regional GVC trade between South Asian economies in the
total global GVC trade has been just 0.8 percent, the lowest between 1990 and
2015, according to the EORA database. For comparative purposes, intra-regional
trade of Europe and Central Asia accounts for 43.1 percent of the total worldwide
GVC trade. High trade barriers merit a particular mention here. South Asian
economies enact trade restrictive policies to a greater extent on their regional
counterparts compared to the rest of the world (Figure S1.7).
Encouragingly, progress under the China-Pakistan Economic Corridor (CPEC)
provides Pakistan with the opportunity to link closely with the Central Asian and
16 Unlocking the Potential of Regional Economic Cooperation and Integration in South Asia:
Potential, Challenges and the Way Forward, SSWA Books and Research Reports, UNESCAP South
and South-West Asia Office (2018).
Table S1.2: Adjusted Logistics Performance Index Rankings*# - A Regional Comparison
LPI Rank Customs Infra-
structure
Int.
shipments Logistics Timeliness
Change in
2018/2010
LPI
ranking
China 27 30 24 18 27 29 0
India 42 43 48 38 39 50 3
Vietnam 45 51 54 45 40 47 14
Philippines 64 70 71 39 64 83 -16
Pakistan 95 104 100 79 80 112 -12
Bangladesh 100 120 109 99 94 108 -21
*The Adjusted LPI combines the four most recent (2012, 2014, 2016 and 2018) LPI surveys to generate a “big picture” to better indicate countries’ logistics performance.
#Ranking out of 163 countries
Data source: World Bank Logistics Performance Index

The State of Pakistan’s Economy
100
other Belt and Road Initiative
(BRI) member states.
However, the South Asian
states must also loosen their
trade policy stances with
respect to each other in order to
net substantial welfare and
trade gains.
Finally, the services sector
exports of the country must be
enhanced
Although the services sector’s
share in the country’s GDP and
labor force has continued to
increase, its exports have not risen commensurately. However, with the
servicification of the manufacturing sector underway across the globe, the
importance of the services sector is rising with respect to the GVCs.17 In this
regard, Pakistan must strive to increase its services exports to improve integration
with the global production networks.
Recently, there has been palpable progress on this front. The Ministry of
Commerce has recently introduced the draft E-Commerce Policy, while the SBP
has released the draft Electronic Money Institutions Guidelines. Both stand to
work under the ambit, and complement the associated objectives, of the Digital
Pakistan Policy released by the Ministry of IT and Telecom. Likewise, numerous
incubators and accelerators are increasingly financing and facilitating startups
under the domain of 4IR (cloud computing, data analytics, ICT, 3D-printing, and
reality augmentation, etc.). In the medium- to long-term, the direct benefit of such
efforts would be an increase in the country’s IT exports, while indirectly the focus
on technological advancement would result in increasing the productivity and
competitiveness of the manufacturing and agricultural products. Both these
developments are vital to ensure a sustainable and meaningful integration of the
domestic firms in the GVCs going forward.
17 Raei, F., Ignatenko, A., & Mircheva, B., Global Value Chains: What are the Benefits and Why Do
Countries Participate? IMF Working Paper No 19/18 2019.
0.3 0.5 0.5
6.9
1.0
3.0
4.6
10.6
0
2
4
6
8
10
12
Sri Lanka Pakistan India Nepal
trade r
est
ricti
veness
index s
co
re with Rest of the World in South Asia
Figure S1.7: Incidence of Trade Restrictiveness in South Asian Economies (2011)*
* 0 = being least restrictiveData source: UNCTAD