POSTFIRE STAND STRUCTURE IN A SEMIARID SAVANNA: CROSS-SCALE CHALLENGES ESTIMATING BIOMASS
Journal of Hydrology (2007) 343, 187–202
ava i lab le a t www.sc iencedi rec t . com
journal homepage: www.elsevier .com/ locate / jhydrol
Suspended sediment transport in a semiaridwatershed, Wadi Abd, Algeria (1973–1995)
Mohamed Achite a, Sylvain Ouillon b,*
a Laboratoire Eau-Environnement, Universite Hassiba Ben Bouali, Chlef, Algeriab Institut de Recherche pour le Developpement, IRD Noumea, BP A5, 98848 Noumea, New Caledonia
Received 28 July 2006; received in revised form 21 June 2007; accepted 25 June 2007
00do
*
KEYWORDSWater erosion;Suspended sedimentconcentration;Sediment transport;Rating curve;Wadi;Intermittent river;Algeria
22-1694/$ - see front mattei:10.1016/j.jhydrol.2007.06
Corresponding author. TelE-mail addresses: achite_m
r ª 200.026
.: +687 2eddz@y
Summary A quantification of the fine sediment budget of a wadi (dryland river) in NWAlgeria is presented for a period of 22 hydrological years (1973–1995). The climate is Med-iterranean over the Wadi Abd basin (2480 km2), the mean annual precipitation is 250 mmand the mean annual discharge is 1.0 m3 s�1 at the gauging station. Regression relation-ships between water discharge Q and suspended sediment concentration C are calculatedfrom 1432 paired measurements in the Wadi Abd, leading to power-law equations of thetype C = a Qb. The variability of coefficients a and b, calculated for 138 floods and floodstages, is analyzed. The median value of b is 0.757, indicating that C is almost propor-tional to Q3/4. Given that the (a, b) pairs are correctly aligned (r2 = 0.578), the coefficientsa and b are not independent. Regression relationships between daily Q and daily sus-pended sediment concentration and discharge Qs are calculated from 702 input data.The performances of these regression relationships are shown to be equivalent, leadingto over-estimations of 20–25% of the suspended sediment flux. The non-biased C–Q sed-iment rating curve is used to extrapolate a time series of C measurements, and thus toanalyze the long-term patterns in suspended sediment transport. Average sedimentwash-down (136 t km�2 yr�1) is similar to the mean global value. The ratio of sedimentwash-down to the river water discharge is 10.7 · 106 t km3, 20 times greater than the aver-age ratio in the Earth’s eastern hemisphere, and illustrates the highly erosive power ofwadis. Variability is shown to be significant at the seasonal scale (CV = 89%) and higherat the interannual scale (CV = 139%). The fine sediment flux mainly occurs in autumn(48.4%) and spring (32.7%). Although precipitation decreased, it was more irregular fromone year to another over the period 1985–1995 than during the period 1973–1985, and theWadi Abd, which was a perennial river, became intermittent in the late 1980s. Thisincreasing irregularity is accompanied by: an amplification of the variations of discharge,an increase in the average discharge of approximately 20% during the second period, anda higher and more irregular suspended particulate flux. The mean annual suspended
7 Elsevier B.V. All rights reserved.
6 07 29; fax: +687 26 43 26.ahoo.fr (M. Achite), [email protected] (S. Ouillon).

Table 1 Targeted papers relevan
Reference Riv
Schick (1977) TunSutherland and Bryan (1990) Kat
Laronne et al. (1994),Reid and Laronne (1995),Powell et al. (2001)
Yat
Reid and Frostick (1997) NumClapp et al. (2000) Yae
Terfous et al. (2001) Mo
Touaıbia et al. (2001) Had
MinAchite and Meddi (2004) Had
Megnounif et al. (2003) Seb
Alexandrov et al. (2003a) Esh
Benkhaled and Remini (2003) WaAmos et al. (2004) Bur
Cohen and Laronne (2005) Rah
Alexandrov et al. (2007) Esh
188 M. Achite, S. Ouillon
sediment yield is shown to be highly correlated with the standard deviation of mean dailydischarge calculated per year (r2 = 0.989). The highly significant interannual variabilitypoints to the difficulty of defining a suitable period to calculate a reference value for sed-iment budgets. It also emphasizes the absolute necessity of continuing a series of mea-surements over longer time periods to study fluctuations in the context of climate change.
ª 2007 Elsevier B.V. All rights reserved.
Introduction
The volume and types of particles eroded and transportedby the rivers exhibits great geographical and temporal var-iability. The stakes associated with erosion and particulatetransport are numerous. These include impacts on groundfertility, transfer, storage and fate of nutrients and con-taminants, changes in water quality trends, aquatic habi-tats, silting up of channels, reservoirs and harbours, andreductions in hydroelectric equipment longevity (Williams,1989; Ouillon, 1998; Horowitz, 2003). In the Maghreb(North Africa), problems essentially relate to the siltingup of the dams, which reduces the water storage capacity
t to sediment transport in wad
er basin or region Ephemeraintermitt
isia, Peru, Nile Bothiorin, Kenya Ephemera
ir, Negev Ephemera
erous Ephemeral, Israel Ephemera
uilah, NW Algeria Intermitt
dad, Algeria Intermitt
a, Algeriadad, Algeria Intermitt
dou, NW Algeria
temoa, Negev Ephemera
hrane, Algeria Intermittdekin, Australia Intermitt
af-Qanna’im, Israel Ephemera
temoa, Negev Ephemera
and the hydraulic potential by 2–5% per year (Kassoulet al., 1997). A correct estimation of the sediment volumecarried by a river is therefore necessary for an adaptedwater resources management strategy. A greater workingknowledge of long-term variations of sediment loads in avariety of rivers is also necessary for an assessment ofthe current trends in global land-ocean sediment transferin the context of climate change (Walling and Fang,2003). Sediment transport is well documented in perennialrivers in temperate or humid climates but is far less stud-ied in dryland streams, also called wadis or oueds, despitetheir known high transport efficiency (Reid and Laronne,1995).
is
l orent
Duration ofmonitoring
Suspension and/or bedload
Main contribution
Reviewl 1 year Suspension Particle-size analysis
of suspendedsediment
l Flash floods Bedload Quantification ofbedload, armouringand bedload grain sizedistribution
l Reviewl 33 years Both Long-term sediment
generation ratesversus sediment yield
ent 16 years Suspension Temporal variabilityof sediment transport
ent 22 years Suspension Temporal variabilityof sediment transport
ent 22 years Suspension Temporal variabilityof sediment transport
5 years Temporal variabilityof sediment transport
l 6 years Suspension Temporal variabilityof sediment transport
ent 13 floods Suspension C–Q rating curvesent 1 flood
(15 days)Both Detailed sediment
transport during oneflood
l Several floods Both Sediment transportduring high dischargeevents
l Suspension Relationship betweenC–Q curve and rainfalltype

Suspended sediment transport in a semiarid watershed, Wadi Abd, Algeria (1973–1995) 189
Few studies have been published on sediment transportin rivers in semiarid zones. Probst and Amiotte-Suchet(1992), in their review of suspended sediment transportedby wadis in the Maghreb, underline the lack of availabledata for such river types. Other reviews have also been pub-lished by Schick (1977), and Alhamid and Reid (2002) and abrief description of these and other papers is given in Table1. Nevertheless, data from these systems is still fragmen-tary and further study of both the quantification of solidtransport in semiarid basins and its variability is clearly re-quired. Therefore, the purpose of this paper is to quantifysuspended sediment transport in a semiarid catchmentarea, the Wadi Abd basin in Algeria, and to analyze its tem-poral variability over a 22-year period. Wadi Abd is a tribu-tary of the Wadi Mina and contributes to the silting of theSidi M’hamed Benouada dam.
For the gauged sites, suspended sediment yield is com-puted from rating curves established from long-term mea-surement series (Walling, 1977; Ferguson, 1986; Jansson,1996; Asselman, 2000; Achite, 2002; Horowitz, 2003). Inungauged rivers, suspended sediment yield may be com-puted from models where basic physiographic factors (cli-mate, soils and top cover) are taken into account(Poliakov, 1935; Lopatin, 1952; Lisitisyna and Aleksandrova,1972; Merritt et al., 2003). In the Mediterranean region, thequantification of sediment transport by a river is rendereddifficult by the temporal variability of water flow. In thesesemiarid environments, most of the river discharge occursduring flash floods, and obtaining samples during these
Figure 1 The Wadi Abd catchment area.
quick events is often difficult (Schick, 1977; Reid and Lar-onne, 1995; Serrat et al., 2001). For long observation peri-ods (>15 years), average annual suspended sediment yieldis equal to the arithmetic mean value of observed annualsuspended sediment yield.
In this paper, regression relationships are built betweeninstantaneous and daily values of concentration and waterdischarge, and also between daily suspended sediment dis-charge and water discharge from data collected at the gaug-ing station of Ain Hamara in the Wadi Abd during a 22-yearperiod (1973–1995). These regressions are discussed with aprimary focus on the coefficients involved in the sedimentrating curve and their temporal variability. A secondary dis-cussion focuses on the comparison of statistical perfor-mances of C–Q and Qs–Q relationships. The regressionsare compared to those from other rivers, and are then usedto (a) obtain a long-term estimate of suspended sedimentdischarge from daily water discharge values at the gaugingstation during the 1973–1995 period; and (b), analyze thevariability of the mean suspended sediment flux at seasonaland interannual scales over a 22-year period.
Study area: the Wadi Abd
General information
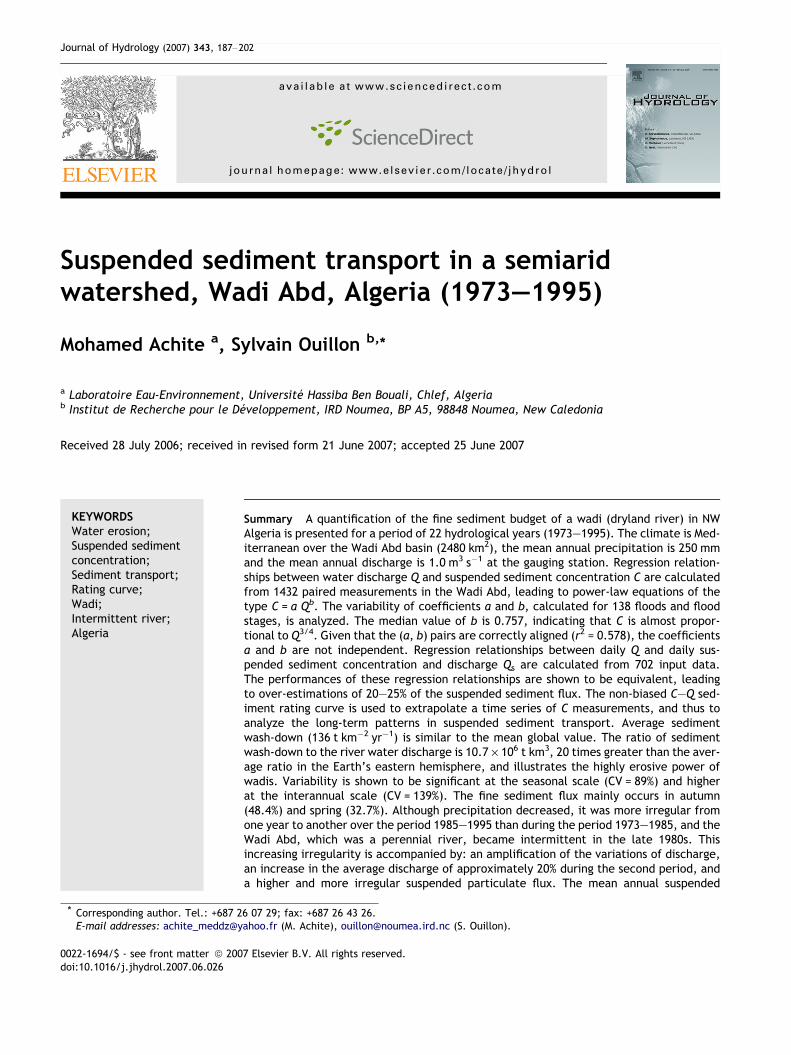
The Wadi Abd basin is located in the north western part ofAlgeria, draining an area of 2480 km2 (Fig. 1). It is locatedbetween 34�40 0 N and 35�25 0 N, and 0�20 0 E and 1�10 0 E.
Ain Hamara gauging station is station 3.

Table 2 Main characteristics of the Wadi Abd basin
Parameters Unit Value
Basin area km2 2480Mean elevation m 711Minimum elevation m 288Maximum elevation m 1339Mean slope gradient % 0.48Length of the main wadi km 118Drainage density km km�2 3.70
S O N D J F M A M J J A
0.4
Month
Mon
thly
prec
ipita
tion
(mm
)
Wat
erdi
scha
rge
(m3
s-1)
0.0
0.8
1.2
1.6
2.0
0
10
20
30
40
45
PrecipitationWater discharge
Figure 2 Variability of mean monthly precipitation and waterdischarge. (precipitation in S11, water discharge in 3, seelocations in Fig. 1).
Wat
erdi
scha
rge
(m3
s-1)
Year
lypr
ecip
itatio
n(m
m)
PrecipitationWater discharge
0
50
100
150
200
250
300
350
0
0.5
1.0
1.5
2.0
2.5
73/74
75/76
77/78
79/80
81/82
83/84
85/86
87/88
89/90
91/92
93/94
Figure 3 Variability of annual precipitation and mean annualwater discharge. (precipitation in S11, water discharge in 3, seelocations in Fig. 1) Horizontal lines are average values.
190 M. Achite, S. Ouillon
The main physiographic characteristics are reported in Ta-ble 2. The Wadi Abd is a tributary of the Wadi Mina; theWadi Mina is a main tributary of the Wadi Chelif, Algeria’sprincipal river. The basin can be divided into two majorzones: mountains (Mounts of Saida in the South and Mountsof Frenda, Tiaret, in the North), and the plain of Mina.
The Wadi Abd has been selected for this study because ofthe availability of rainfall and hydrometric records. Theavailable hydrological data consists of the mean daily waterdischarge (m3 s�1), coincident measurements of water dis-charge (m3 s�1) and suspended sediment concentrations(kg m�3). The data has been provided by the NationalAgency of Hydraulic Resources (ANRH, Alger).
Geology, vegetation and topography
The Wadi Abd catchment area is predominantly made up ofUpper Jurassic (marl-limestone, 45.9% of the surface), largezones of Middle Jurassic (calcareous and karstic dolomites,20.2%) and Pliocene (7.4%) (Achite, 1999).
The Jurassic zone of the Southern basin is eroded andnearly 50% of its surface is covered by a varying density ofvegetation. The forests cover 5.8% of this zone, mainly withyoung plantations of Aleppo pines (Pinus halepensis). Twoforms of scrub cover 32% of the catchment area: scrub withPistacia and Olea, and scrub with Tetraclinis. In addition tothe natural vegetation, the herbaceous vegetation mainlyconsists of cereal crops which form the principal permanentcultures (Kouri, 1993; Mahieddine, 1997).
The basin relief exhibits slopes between 0.12% and 0.25%on the Jurassic mountains (Achite, 1999). Water erosion ismostly intensive in the northern and western mountainousparts of the Wadi Abd basin.
Climate, rainfall and runoff
The climate is Mediterranean and is characterized by a wetand dry season. The rainy season is from October to March,and the dry season lasts from April to August/September(Fig. 2). Annual precipitation is highly irregular, varying be-tween 174 mm yr�1 and 303 mm yr�1 (Fig. 3). Mean annualprecipitation is 250 mm, with a coefficient of variation (de-noted hereafter CV and defined as the ratio of the standarddeviation to the mean) of 17.6% between 1973–74 and1994–95. Mean annual discharge at the Ain Hamara gaugingstation (see location in Fig. 1 and data in Fig. 3) was1.0 m3 s�1 for the same period of observation. The interan-nual variability, characterized by a CV of 41% during the 22-year period, was higher than that of yearly precipitation
(Fig. 3). This demonstrates an amplification of the mean an-nual discharge compared to annual precipitation. For exam-ple, although annual rainfall was approximately 20% higherthan average, mean yearly discharge varied between + 61%(1986–87) and +112% (1994–95). In contrast, lower thanaverage annual rainfall was accompanied by a highly dis-persed mean annual discharge (see Fig. 3).
Hydroclimatic fluctuations affected the basin producinga wetter period from 1973 to 1980 and a drier period from1981 to 1993 (except 1986 and 1990) (Fig. 3). It is of interestto place this variability in the context of a longer time scaleand at a regional scale. An extensive comparison betweenthe study area in North Africa and Central and West Africaduring the second half of the 20th century shows that thishydrological variability is consistent. Several researchers(e.g. Laraque et al., 2001; L’Hote et al., 2002) show thatdiscontinuities occurred on a 10-year scale since the1950s. There was a phase of surplus river discharge in the1960s in Central Africa, a discontinuity at the beginning ofthe 1970s at the start of a period of dryness in the Saheland lower discharge in Central Africa. This was followedby a second discontinuity, initiating a phase of further re-duced discharge at the beginning of the 1980s in CentralAfrica, while the dryness continued in the Sahel. In the WadiAbd basin, the reduction in annual precipitation from 1981–82 is clear compared to the previous years: average precip-itation was 287 mm yr�1 over the period 1973–74/1980–81

Suspended sediment transport in a semiarid watershed, Wadi Abd, Algeria (1973–1995) 191
and 225 mm yr�1 over the period 1981–82/1993–94. 1994has been singled out as an anomalous year in the Sahel(L’Hote et al., 2002) and in the Wadi Abd basin increasesin precipitation and flow were measured during the autumnof 1994 and spring 1995 (Fig. 3).
Hydrological and suspended sediment data
Suspended sediment concentrations (hereafter denoted C)were measured in the Wadi Abd at Ain Hamara station dur-ing different hydrological conditions (low discharge to se-vere flood events). During each sampling, theinstantaneous water discharge (hereafter denoted Q, ex-pressed in m3 s�1) was also measured.
At the gauging station, the river flows through in a single46 m wide channel. The flow is generally measured with awinch by gauging a section over 5–8 verticals with between2 and 6 measurements per vertical. At night, during holi-days, or during some floods, the discharge was derived froma limnimetric height using a local abacus. During the 22 con-sidered hydrological years, the Wadi Abd did not overflowthe flood plain at the gauging station.
To determine sediment concentrations, water was man-ually sampled using a simple 0.5 L or 1 L dip sample. One ortwo samples are taken by measurement in the middle of thewadi and/or at its edge. Suspended matter concentrationsare determined by filtration of the samples on pre-weightedfiberglass filters (0.45 lm, Whatman GF/F), then dried andweighed. The average concentration of the section is as-sumed to be the concentration. Other available long-termdata for the Algerian wadis were collected according tothe same protocol (Touaıbia et al., 2001; Benkhaled and Re-mini, 2003; Megnounif et al., 2003). When the dischargeflow exhibited little variation, only one sampling was per-formed per day at noon. The sampling rate arbitrarily in-creased with the flow until reaching a sampling frequencyevery 15 mn or 30 mn at the peak of a flood.
In our database (1973–1995, 1432 paired C and Q mea-surements), water discharge varied from 0.09 m3 s�1 to352 m3 s�1 and C varied from 0.14 kg m�3 to 118.5 kg m�3.Instantaneous flow was continuously recorded at Ain Ha-mara gauging station during the period 1973–1995. Theduration of runoff events in the Wadi Abd at Ain Hamara sta-tion, which last at least 10 days, enabled us to study thehydrology from daily discharges.
The size distribution of suspended particles demon-strates a predominance of silts and clays. The mean classof grain diameter ranges from 4.35 to 5.82 lm (very finesilt). Clay represents more than 20% of the total populationof particles. Sand is present in small quantities (<5%).
Flow regime of the Wadi Abd
Dryland rivers (i.e. the rivers of arid and semiarid regions,Davies et al., 1994) can be perennial, intermittent orephemeral (see terminology used in ecological studies inUys and O’Keeffe, 1997). Ephemeral rivers are defined asthose that run for short periods after rain has fallen highin their catchment area (Day, 1990). An intermittent riveris defined as having relatively regular, seasonally intermit-tent discharge, i.e. a river that experiences a recurrent
dry phase of varying duration. Rivers that flow less than20% of the year can be considered as ephemeral, and thosethat flow between 20% and 80% as intermittent (Matthews,1998).
The flow regime of the Wadi Abd has been studied fromthe daily river discharge at Ain Hamara station. From 1973to 1985, water was always present in the Wadi except for12 days in 1979–1980 and 1 day in 1981–1982. There were51 days without any water in the Wadi in 1985–86, 0 in1986–87, 48 in 1987–88, 50 in 1988–89, 91 in 1989–90,102 in 1990–91, 60 in 1991–92, 109 in 1992–93, 117 in1993–94 and 96 days in 1994–95.
The Wadi Abd was thus a perennial river until the late1980’s and thereafter became an intermittent river, withan average of 72.4 days over 10 years with no flow per year(i.e. 20% of time). The number of days with no flow went upand reached 96.8 days per year (26% of the year) over thelast 5 considered years, i.e. from 1990 to 95. The headwatertributaries of the Wadi Abd show the same water regime.
Independently of the main study, which focuses on sedi-ment fluxes, the observation of a changing flow regime dur-ing the 1980s is an important result that needs to beemphasized in the context of climate change. The possibil-ity that these observations were not artificially introducedby changes in sampling or measurement methods was exam-ined. Water flow regime results from three inter-dependentfactors: intrinsic natural variability, anthropogenic impactson the catchment (such as changes in agriculture, vegeta-tion cover, irrigation), and climate change. In the WadiAbd basin, the changes in water flow regime were due toa very long period of drought beginning in the early 1980swhich resulted from climate change or a long-term intrinsicnatural variability.
Models and methods
Suspended sediment discharge, which is equal to C times Q,is hereafter denoted Qs and is expressed in kg s�1. Mostquantitative studies of suspended sediment load are basedon an empirical relationship between C and Q after logarith-mic transformation of the data (Ferguson, 1987; Hasnain,1996) or between Qs and Q (Restrepo and Kjerfve, 2000),leading to equations of the type:
C ¼ aQb ð1:aÞor
Q s ¼ a0Qb0
s ð1:bÞ
The a 0-coefficient should be equal to a and the difference inthe b and b 0 coefficients should be 1.0 if the mean of theproduct Qs = C*Q is equal to the product of the means. How-ever, this is often not rigorously verified as C and Q are notcompletely independent.
Here, two complementary approaches were successivelyadopted. In a first part (Section ‘‘Instantaneous suspendedconcentration versus river discharge’’), we analyze the var-iability of coefficients a and b flood by flood from coincidentmeasurements of C and Q. The resulting values make it pos-sible to analyze the variability of the sediment rating curveof Wadi Abd for 138 complete or partial floods. They alsomake it possible to compare the Wadi Abd’s behaviour withother rivers.

-2
-1
0
1
2
3
0.1 1 10 100 1000 10000
a - coefficient
b -
coef
ficie
nt
b = - 0.311 Ln a + 1.066r = 0.578n = 138
Aggressive floods (n=18)
Average floods (n=104)Weaker than average floods (n=16)
Figure 4 Correlation between slope/intercept values ofsuspended sediment rating curves fitted using power-lawregression relationships.
192 M. Achite, S. Ouillon
In a second part (Section ‘‘Daily suspension flux versusriver discharge’’), as multiple pairs of (C, Q) values havebeen measured for some days, the C, Q and Qs values forthese days are averaged. Our 1432 paired C and Q measure-ments were performed for 702 days. Their respective aver-ages, per day, result in 702 values of C, Q and Qs referred toas ‘‘mean daily concentration’’, ‘‘mean daily water dis-charge’’ and ‘‘mean daily solid discharge’’, respectively.‘‘Mean’’ is defined by:
meanðxÞ ¼ �x ¼ 1
p
Xpi¼1
xi ð2Þ
Note that these averages are based on coincident availableC and Q data, and not on a true average value resulting fromcontinuous measurement throughout the day, as was thecase for the daily discharge. Regression relationships arebuilt from mean daily values which are then comparedand discussed. The evaluation of the relationships is basedon the following criteria: stdev is defined by:
stdevðxÞ ¼ 1
n� 1
Xni¼1ðxi � �xÞ2
" #1=2ð3Þ
From these equations, the mean normalized bias (MNB) andthe normalized root mean square (rms) error, in percent,are calculated following:
MNB ¼ meanycalc � yobs
yobs
� �� 100 ð4:aÞ
rms ¼ stdevycalc � yobs
yobs
� �� 100 ð4:bÞ
where ycalc is a variable calculated using a regression rela-tionship and yobs is the value measured in situ (for C) or di-rectly derived from in situ measurements (for Qs = C · Q).MNB is an indicator of systematic error and rms an indicatorof random error.
Sediment rating curves
Instantaneous suspended concentration versusriver discharge
The 1432 instantaneous (C, Q) values lead to a regressiontype Eq. (1.a) where a = 2.180, b = 0.626, r2 = 0.445. Theregression coefficient is low because the complete dataset includes many (C, Q) pairs for very dispersed, very lowflows and whose significance is not important for this studysince the suspended sediment flux occurs primarily duringfloods.
To focus our analysis on the major transport episodes, wehave calculated the specific regression relationship for eachflood. For floods where sufficient data are available, wehave plotted all available (C, Q) data flood by flood and haveexamined their evolution from beginning-to-end of eachflood. For 98 floods, one rating curve was sufficient to rep-resent the variations in (C, Q), for floods that did not pres-ent any hysteresis (r2 > 0.35, median r2 = 0.777). For 13floods, it was necessary to define distinct phases (40 onthe whole) with separate (a, b) pairs: rising, temporarystages if any (e.g. beginning of falling before a new rising),falling. To distinguish different flood stages, successive (C,
Q) data are considered to form a single ‘‘stage’’ if theyare significantly correlated (r2 > 0.35, 36 flood stages) orhave been taken within a short duration (with n > 6 and amaximum of a few hours duration when flood duration ison average of ten days, 4 flood stages). We thus obtain138 (a, b) pairs calculated from, on average, 8.2 (C, Q) pairs(minimum: 3, median: 7) with an average r2 of 0.747, and amedian of 0.792.
The 138 values obtained are reported in Fig. 4. All epi-sodes considered, the median value of (a, b) pairs is(2.154, 0.757). The relative variation calculated with thewhole of the instantaneous values (2.180, 0.626) is 1.2%for a and 20.9% for b. The value of b indicates that, froma global point of view, C is almost proportional to Q3/4 inthe Wadi Abd during the flood episodes.
The (a, b) pairs calculated for different floods are some-what correctly aligned (r2 = 0.578, n = 138, see Fig. 4); thecoefficients a and b are thus not independent. In the WadiAbd, a and b are connected by the regression relationship:
b ¼ �0:311 ln aþ 1:066 ð5ÞSeparating out the most aggressive floods from the leastaggressive floods, we can study their specific behaviourand determine their seasonal variation and/or criteria ofoccurrence. A flood which, for a given coefficient a (resp.b), has a coefficient b (resp. a) appreciably higher than anaverage flood, carries a higher sediment load than an aver-age flood; this is referred to as an ‘‘aggressive’’ flood. Onthe contrary, a flood which, for a given coefficient a (resp.b) has a coefficient b (resp. a) appreciably lower than anaverage flood, carries a lower sediment load than an aver-age flood and is now referred to as a ‘‘weaker than aver-age’’ flood. A flood is considered as ‘‘aggressive’’ if itscouple (a, b) fulfils the criterion: b + 0.311 ln a � 1.066> 0.4, while a ‘‘weaker than average’’ flood fulfils the crite-rion: b + 0.311 ln a � 1.066 < �0.4. The coefficient 0.4 is anarbitrary choice; for example, floods #1 and #2 withb2 + 0.311 ln a2 = b1 + 0.311 ln a1 + 0.4 are such that b2 =b1 + 0.4 if a1 = a2,or a2 = 3.6a1 if b1 = b2. According to thesearbitrary criteria, the 138 floods and flood stages are di-vided into 104 ‘‘average’’, 18 ‘‘aggressive’’ and 16 ‘‘weakerthan average’’ floods (see Fig. 4).
The rating parameters characteristic of each type offlood are shown in Table 3. It is particularly noticeable that

17-19 Oct 78
C = 30.96 Q R = 0.624
2
C = 10.79 Q R = 0.877
3
C = 2.912 Q R = 0.360
4
C = 11.28 Q R = 0.872
1
Instantaneous Q (m3.s )-10. 5. 10. 15. 20. 25.
0.
20.
40.
60.
80.
100.
120.
Inst
anta
neou
s C
(kg
.m-3
)
C = 0.358 Q R = 0.595
1
C = 163.1 Q R = 0.066
2
C = 0.838 Q R = 0.931
3
1-5 Mar 79
10. 20. 30. 40. 50. 60.0.
10.
0.
60.
50.
40.
30.
20.
70.
Instantaneous Q (m3.s-1)
Inst
anta
neou
s C
(kg.
m-3
)
a b
Figure 5 Suspended sediment rating curves fitted using power-law regression relationships during different phases of a flood. (a)17th–19th October 1978; (b) 1st–5th March 1979. Distinct stages are chronologically numbered within circles.
-1
0
1
2
a - coefficient10 100 100010.1
b-c
oeffi
cien
t
17-19 Oct 7815-17 Feb 79
1-5 Mar 79median (all years)median (1978-79)
Figure 6 Pairs of (a, b) values for the main floods of the WadiAbd in 1978–79.
Table 3 Parameters of the suspended load versus discharge regression relationship for the floods or flood stages of the Wadi Abd
N Median regressioncoefficients
b versus a
a b Regression relationship r2
All of the floods 138 2.154 0.757 b = �0.311 ln a + 1.066 0.578‘‘Average’’ floods 104 2.307 0.736 b = �0.297 ln a + 1.001 0.829‘‘Aggressive’’ floods 18 3.408 1.568 b = �0.320 ln a + 1.842 0.746‘‘Weaker than average’’ floods 16 1.162 0.531 b = �0.376 ln a + 0.584 0.970
Suspended sediment transport in a semiarid watershed, Wadi Abd, Algeria (1973–1995) 193
the (a, b) pairs of aggressive floods are dispersed(r2 = 0.746, n = 18), while the (a, b) pairs of ‘‘weaker thanaverage’’ floods are remarkably linear (r2 = 0.970, n = 16).During aggressive floods, C is almost proportional to Q3/2
since b = 1.568, while for the least aggressive floods, C is al-most proportional to Q1/2 (b = 0.531). Average floods practi-cally behave like the median flood calculated for the wholedataset, with C almost proportional to Q3/4. The remarkablelinearity of the (a, b) pairs for the ‘‘weaker than average’’floods seems to indicate that a minimal threshold of erosionof the catchment area exists.
How do the phases of a flood follow one another in theWadi Abd and is there a seasonal variation of these phases?To illustrate this question, Fig. 5 shows distinct stages oftwo floods. A multi-peak flood is presented in Fig. 5a: stage1, decrease of flow on 17th Oct. 1978 from 7.30 to 10 h (therise during the previous night was not sampled); stage 2, riseuntil 11.10 h; stage 3, decrease until 14.15 h. After an in-crease of flow which was not sampled, stage 4 correspondsto the final falling which spread out between 17th Oct. 17 hand 19th Oct. 15 h. The flood presented in Fig. 5b is lesscomplex and shows a clockwise hysteresis: a rise of flow(stage 1, from 1st March 1979 16 h to 2nd March 12.30 h),a stage of high flow (stage 2, from 2nd March 13 h to 21 h,is one of the 4 stages of short duration and of poor correla-tion within the global data set; the other phases in Fig. 5 aresuch as r2 > 0.35), then the falling (stage 3 from 2nd March22 h to 5th March 12 h).
In Fig. 6, the (a, b) pairs of the main floods of 1978–1979are compared to the median pair of the same hydrologic
year and also to the median calculated over 22 years(1973–1995). The (a, b) pairs for the flood of October 78(Fig. 5a) are as follows: stage 1 is ‘‘aggressive’’, stages 2to 4 are ‘‘average’’; for the flood of March 79 (Fig. 5b),stages 1 and 2 are ‘‘average’’, stage 3 is ‘‘weaker than aver-age’’ (Fig. 6). The flood of March 1979 (Fig. 5b) shows aclockwise hysteresis, with a higher particulate load duringthe rising stage than during the falling stage, at an equiva-

194 M. Achite, S. Ouillon
lent flow (see Williams, 1989 for a general typology of therelationship between concentration and discharge duringhydrologic events). Benkhaled and Remini (2003) have ana-lyzed the hysteresis episodes of C–Q relationships on an-other Algerian basin, the Wadi Wahrane basin, for 13floods. They show a significant prevalence of hysteresis ofclockwise type (8 out of 13). A systematic analysis of the en-tire data for the Wadi Abd was not conducted during thisstudy. However, we have observed that the pair (a, b) dur-ing a flood (including several falling phases as in Oct. 1978)is generally translated in an a–b diagram by a shift either tothe left (a decreases, as in Oct. 1978, see Figs. 5a and 6), ortowards the bottom (b decreases, as in March 1979, seeFigs. 5b and 6). This reduction in a or b probably indicatesthat the suspended sediment concentration (resulting fromerosive power and sediment supply) of the Wadi Abd de-creases at the end of the flood. The successive positionsof the pair (a, b) on the a–b diagram also make it possibleto visually compare between floods. As an example, Fig. 6shows a left-shift of the spring flood as compared to the au-tumn flood, demonstrating that the autumn flood is moreaggressive. These examples observed in 1978–1979 illus-trate the tendency generally noted on Wadi Abd: the firststages of a flood are more ‘‘aggressive’’ than the last, andthe floods of autumn are more ‘‘aggressive’’ that the floodsof spring.
We have tested the predictive capacity of the medianpairs of coefficients (a, b) obtained for the 3 flood types(average, aggressive, weaker than average) to estimatethe instantaneous concentration from instantaneous dis-charge, if the type of flood is known. In the majority of‘‘aggressive’’ and ‘‘weaker than average’’ floods, thechoice of an adapted pair decreases the error in the calcu-lation of C compared to the use of the total median pair.However, none of the three median pairs is adapted to givea correct estimation of C for flood stages such as b < 0. Neg-ative values of b correspond to a particular case where Cand Q evolve conversely, with C increasing while Q de-creases and vice versa. None of the median pairs (all ofwhich are b > 0) can reproduce this generally transitorybehaviour which occurs during an intermediate phase in be-tween the rise and fall of the flood (see two examples inFig. 5a and b). If one wants to determine pairs of (a, b) coef-ficients by flood type, it is necessary to restrict the three al-ready defined types of floods by b > 0 and to add a fourthtype corresponding to the transitional stages where C andQ are in negative correlation. The calculation of the mediancouple for the 11 phases of such floods out of 138 providesa = 84.72 and b = �0.48.
Daily suspension flux versus river discharge
The regression relationship between the mean daily C andthe mean daily Q is (r2 = 0.463, n = 702):
C ¼ 1:710 Q 0:750 ð6Þwhere C is expressed in g L�1 and Q in m3 s�1. C is depen-dent on two main factors: water discharge and supply.The r2 value means that the variations of C are explainedby up to 46% by those of Q. More than 50% of the variabilityin C is explained by the supply of sediments to the river sys-tem, with supply determined by the occurrence or absence
of recent floods, seasonal variations of vegetation cover andother parameters.
The best-fit regression relationship between mean dailysediment discharge and mean daily water discharge is apower-law relationship of the type of Eq. (1.b) given by(r2 = 0.826, n = 702):
Q s ¼ 1:712 Q 1:769 ð7Þ
The a and a 0 coefficients in Eqs. (6) and (7) differ by 0.11%,and b 0 = b + 1.019. To estimate Qs from the entire Q dataavailable, one can apply Eq. (7) directly, or determine Cusing Eq. (6) then multiply the result by Q. In the relevantliterature, the second alternative is used more frequentlythan the first because the coefficient of correlation of Qs–Q is superior to that of C–Q. We have applied the two meth-ods to our data set.
The first application relates to the data set being used toestablish the regression relationships. The Qs–Q relationshipprovides Qs values which are on average 48.5% higher thanthe measurement derived Qs values (MNB = 48.5%,rms = 133%). The C–Q relationship provides C values thatare on average 48.1% higher than the C measured values(rms = 132%) which, multiplied by Q, provide values of Qs
on average 45.7% higher than Qs values derived from mea-surements. Statistical comparison between 702 measuredQs and C–Q derived values of Qs is based on log-transformeddata to encompass the several-orders-of-magnitude varia-tion in Qs. Statistics such as regression slope (1.011) andintercept (�0.0022), coefficient of determination (r2 =0.827) and rms error (100%) provide a numerical index ofmodel performance which can be compared to those of othermodels and other rivers (such statistics are commonly used tocompare bio-optical algorithms (see the example of O’Reillyet al., 1998)). The difference between predicted and ob-served values is calculated on the entire data set and, there-fore, does not take into account the absolute values of Qs. Infact, the most important aspect in the reconstitution of thesolid discharge rates relates to the episodes of highest flowwhose contribution is essential both to estimation of totalflux of river-driven particles and for the analysis of its vari-ability on seasonal and interannual scales. When the cumu-lated values of suspended load for the 702 considered daysare compared using the two methods of reconstitution (bysumming the predicted mean daily solid discharges), anover-estimation of 25.7% is obtained compared to the ‘‘mea-sured’’ daily suspended loads by the use of the Qs–Q rela-tionship, and of 21.8% by the use of the C–Q relationship.
Several lessons can be learned from these results:
1. Since the average relative error (�48%) is higher than theabsolute error of the cumulated solid discharge (�25%),the relative errors are weaker during high flows than dur-ing low ones. This is easily explained by the increasedscattering of the concentrations during low dischargerelative to those during high discharge, and becausethe episodes of high discharge, which are fewer, forcethe regression relationship more than do the points oflow discharge.
2. With our data set, the reconstituted time series are morelikely to over-estimate the low solid discharges than thehigh ones. This will decrease the variation of suspendedload of seasonal or interannual origin.

Suspended sediment transport in a semiarid watershed, Wadi Abd, Algeria (1973–1995) 195
3. An over-estimate of about 25% in the calculation of thesuspended load cumulated over 702 days can be easilyseen as high. Nonetheless, this performance, which onemay describe as ‘‘average’’, does not require any spe-cific knowledge other than the liquid discharge whichcan easily be gauged, since a simple regression relation-ship has now been established. Since the variability of Cin the Wadi Abd is explained up to only 46% by the flow,we estimate that the performance of the reconstitutionis acceptable. To achieve a finer precision, the integra-tion of other explanatory factors than the discharge onlyis needed which would require the building of a morecomplex model.
4. Although the Qs–Q correlation is higher than that of theC–Q relationship, the performance of the two methodsof prediction of Qs is equivalent. This is due to the factthat the former is biased, and the latter is not. The useof a non-biased C–Q relationship introduces an uncer-tainty in C, but when Qs is calculated from C, no addi-tional error is introduced because the value of Qmultiplied by C was measured. The use of the C–Q rela-tionship and the multiplication of C by Q thus appears tointroduce less errors than using the law Qs–Q, eventhough the Qs–Q relationship presents a highercorrelation.
Moreover, we may also note that the pair (a, b) estab-lished using mean daily concentration and water discharge,(1.710, 0.750), differs slightly from that calculated for theflood phases, (2.154, 0.757). While the b-coefficient re-mains unchanged, the a-coefficient is reduced by 20.6%when considering the mean daily variables. The differentmethods of calculation can partly explain the discrepancybetween both pairs, since the pair (a, b) relative to themean daily variables results from a best-fit regression rela-tionship, while the other is the median of the (a, b) pairscalculated from a collection of flood episodes. The fact thatat low discharge, concentrations, which are generally lowerthan those estimated by the regression relationship, areconsidered within daily values but not as flood phase values(which include only high sediment load episodes) is probablythe main reason for discrepancy between both (a, b) pairs.
Comparison to other rivers
Comparisons of a and b among sites are delicate because thedimension of a [here expressed in (kg m�3)(s m�3)b for everygiven example] depends on the value of b (dimensionless).Nevertheless, these comparisons make it possible to havea greater understanding of the respective physical signifi-cances of a and b which depend on multiple factors (Frosticket al., 1983; Syvitski et al., 2000; Asselman, 2000). Syvitskiet al. (2000) have compared rating parameters at 57 gaugingstations in North America, 1 in Europe and 1 in China. Theyexamine the rating equations in comparison to the long-term character of the suspended sediment load in the riversand show that the rating coefficient a is inversely propor-tional to the long-term mean discharge and is secondarilyrelated to the average temperature and the basin’s topo-graphic relief. They also show that the rating exponent bcorrelates most strongly with the average air temperatureand basin relief and is weakly correlated with the long-term
load of the river. Their explanation is that each river under-goes higher-frequency variability that is controlled byweather patterns and channel recovery from extreme pre-cipitation events.
Rating parameters a and b of a river strongly depend onflow regime and do not vary in the same proportions (Table4). Generally, b stays in range 0.3–2.5, while a can vary byseveral orders of magnitude (e.g. Reid and Frostick, 1997).Frostick et al. (1983) have shown that the coefficient b issmaller in arid zone flash floods (usually b < 1) as comparedto typical perennial systems draining temperate regionswhere b > 1. Intermittent rivers in semiarid environmentsseem to have b-coefficients lower than 1, similar to ephem-eral rivers in arid zones (Table 4). The rating parameterscalculated for the Katiorin basin in Kenya (Sutherland andBryan, 1990) and for the Eshtemoa in the northern NegevDesert (Alexandrov et al., 2003a) are such that b + 0.311ln a � 1.066 gives 0.40 on the Katiorin and 0.24 on the Este-moa, respectively. This means that these floods are slightlymore ‘‘aggressive’’ than the average floods of the WadiAbd. Another interesting comparison is that in the three ba-sins, the variations in discharge explain only about 50% ofthe variance in suspended sediment discharge (49% for theEshtemoa, 52% for the Katiorin and 46.3% for the Wadi Abd).
Eqs. (6) and (7) provide little understanding of thephysical processes that underlie the sediment transport.However, physical explanations on shapes of C–Q relation-ships, either linear or non-linear (concave or convex), canbe found in the literature (e.g. Williams, 1989; Sichinga-bula, 1998; Morehead et al., 2003). In particular, the avail-able studies underline the influence of preceding dischargeor antecedent moisture, which tends to generate quick ordelayed runoff. This then causes rapid or slow increases insediment concentration in concert with discharge changesas well as affecting the variability in the amount of easilyerodible sediment stored in the channel.
The high-frequency variability (at the flood event) of therating parameters is also examined in the present study. Itappears that their alignment demonstrates that a and bare not independent and that one cannot interpret onewithout the other, as is sometimes found in the literature.The alignment of the (a, b) pairs for the sediment ratingcurves either at a station, or at several stations of the samecatchment area, has already been described by Asselman(2000) for the perennial Rhine River and its tributaries.Asselman obtains the following relationships: b = �0.296 lna + 0.467 (Andernach station, Rhine), b = �0.393 ln a +0.577 (Cochem station, Mosel) and b = �0.462 ln a + 0.736(Rockenau station, Neckar). The slope for the relationshipin the Wadi Abd (Eq. (5), see Fig. 4) is consistent with thesevalues, although the intercept is higher.
Concerning the wadis in Algeria, Touaıbia et al. (2001)present rating curves based on a long-term series of flowand concentration measurements at two stations close toAin Hamara, one of which is located downstream from AinHamara, the other is located in the neighbouring sub-catch-ment of the Wadi Haddad. All the mean monthly relation-ships that they obtain from instantaneous values have ahigher factor a and a smaller factor b than in the presentstudy. The high values of b (together with low values of a)have been obtained for the months where there is an in-crease in precipitation after 3 months of low water level,

Table 4 Examples of coefficients (a, b) in the rating curve C = a Qb, where C (concentration of suspended sediment) is expressedin g L�1 and Q (water discharge) in m3 s�1
Reference River Semiaridbasin
Rainfall(mm yr�1)
a b Complementaryinformation
Chikita (1996) Ikushunbetsu, Japan No 1418 4.28 · 10�3 2.11 Sediment dischargedominated by theriverbank erosion insnowmelt runoff
Morehead et al. (2003) North Saskatchewan,Alberta
No Not given 1.3 · 10�5 1.58
Asselman (2000) Rhine, Germany No 600–2500 7.7 · 10�7
� 1.7 · 10�61.22–1.44 From 4 stations along
the Rhine River
Achite and Ouillon, this paper Abd, Algeria Yes 250 1.71 0.75 From daily valuesTouaıbia et al. (2001) Haddad, Algeria Yes 249 5.79–25.13 0.36–0.74 Monthly values
3.62 0.44 Median of monthlyvalues
Alexandrov et al. (2003a) Eshtemoa, Israel Yes 220–350 16.98 0.43Sutherland and Bryan (1990) Katiorin, Kenya Yes 640 43 0.30
(a, b) provided by Chikita (1996); Morehead et al. (2003) and Asselman (2000) resulted from instantaneous C and Q measurements.
196 M. Achite, S. Ouillon
in July in the Wadi Haddad and in February in the Wadi Mina(El-Abtal station). Conversely, the low values of b, whichare not associated with the highest values of a, are obtainedfor the months that follow a period of at least two monthsof high flow (in December and March in the Wadi Haddad,in December in the Wadi Mina). It should be noted thatthese variations of b on a monthly scale are consistent withthe short-term variations of b that we have observed on theC–Q curves during a flood (Fig. 5). This is also in agreementwith the variations between rising and falling discharge epi-sodes observed in the Rhine River by Asselman (2000). Thisreinforces the assumption of a strong relation betweencoefficients a and b.
Annual sediment wash-down and its variability
Annual suspended sediment budget
The average value of the suspended sediment flux for theWadi Abd basin calculated from the reconstructed time ser-ies of suspended sediment transport is 339 · 103 t yr�1 forthe period 1973–1995. This corresponds to a specific sus-pended sediment yield, which is the ratio of suspended loadto basin area, of 136 t km�2 yr�1. The specific suspendedsediment yield is also called ‘‘sediment wash-down’’ or‘‘suspended solids yield’’ in the literature.
Suspended sediment flux should not be confused with therate of soil erosion as sediment eroded from upland soils isprogressively stored in the river valley (Milliman and Meade,1983). Moreover, it seems that, globally, the two quantitiesare inversely affected by anthropogenic impacts, with soilerosion accelerating while sediment flux to the coastal zoneis globally decreasing (Syvitski, 2003).
Nor should suspended sediment flux be confused with thetotal sediment delivery which results from bedload charge,suspended sediment, and dissolved sediment (Serrat, 1999).Bed load is generally assumed to be a minor part of partic-ulate matter flux, accounting for only approximately 5–10%
(Eisma, 1998; Syvitski et al., 2003; see also ref. quoted inCoynel et al., 2004). However, bedload transport seems tobe extremely variable in dryland rivers. Reid and Laronne(1995) have reported very high bedload rates in a gravelbed ephemeral river, that are orders of magnitude higherthan in its more humid counterparts. On the other hand,Serrat (1999) noted that bedload sediment volume was lessthan 1% of the suspended load in an intermittent river ofMediterranean type. In the Wadi Abd, the small proportionof sand in suspension (<5% of dry weight of suspended parti-cles) does not allow us to conclude on the relative impor-tance of transport in suspension and bedload transport.The value of 136 t km�2 yr�1 may only be considered as anestimate of the fine sediment flux for the Wadi Abd Basin.The value of 136 t km�2 yr�1 is similar to the global meansediment wash-down, of the same order as the sedimentwash-down in South America, and far higher than the meansediment wash-down in Africa (see Table 5). These regionalvalues are average values and it must be remembered thatthe specific sediment yield is known to decrease with thedrainage basin area (see Fig. 1 in Jiongxin and Yunxia,2005). The suspended sediment yield for the Wadi Abd basinhas been also compared to values provided for other catch-ments in the Mediterranean basin (Table 5); it is similar tothe values reported for other basins in Algeria and Israel.
The specific sediment yield Y, which is generally ex-pressed in t km�2 yr�1, can also be expressed in kgkm�2 day�1 to permit cross-site comparison using quantilesof its distribution that can not be expressed on a yearly basis(Meybeck et al., 2003). In the Wadi Abd, the average dailysuspended solids yield is 374 kg km�2 day�1 and the mediandaily sediment fluxes over the period 1973–1995 (Y50) is28 kg km�2 day�1. The resulting flux variability as definedby their ratio is 13.4, which is typical of high suspended sol-ids flux variability on the daily-scale following the classifica-tion proposed by Meybeck et al. (2003).
Lastly, it is of interest to jointly analyze river flow andsediment wash-down. The average water discharge calcu-

Table 5 Suspended sediment yield of several regions and catchments in the Mediterranean basin
References River basin or Region Area (km2) Rainfall (mm yr�1) Suspended sedimentyield (t km�2 yr�1)
Tamrazyan (1989) Global 135.1 · 106 120Milliman and Meade (1983) Global 88.6 · 106 150Tamrazyan (1989) Africa 30.3 · 106 32Tamrazyan (1989) Eastern hemisphere
(Africa, Europe, Asia, Australia)92.8 · 106 133
Tamrazyan (1989) South America 18.1 · 106 138Tamrazyan (1989) Equatorial region (10�N–10�S) 153Tamrazyan (1989) Asia 43.4 · 106 242Tamrazyan (1989) Tropical region (10–30�N) 253Probst and Amiotte-Suchet (1992) Maghreb (drainage basins into
the Mediterranean Sea)400
Serrat et al. (2001) Tet, France 1380 750 40Serrat (1999) Agly, France 1045 700 103Bourouba (1997) Leham, East Algeria 5600 154 104Bourouba (1998) Medjerda, East Algeria 217 598 113Clapp et al. (2000) Yael, Israel 0.6 30 113–138Terfous et al. (2001) Mouilah, NW Algeria 1680 300 126Achite and Ouillon, this paper Abd, Algeria 2480 250 136Ghachi (1986) Seybousse, East Algeria 6450 577 137Megnounif et al. (2003) Upper Tafna, West Algeria 256 419 1120
S O N D J F A JM M J AMonth
0 0
5
10
15
20
25
20
40
60
80
100
Susp
ende
dse
dim
entf
lux
(103
t /m
onth
)
Con
tribu
tion
perm
onth
(%)
Mean
AutumnWinter
SpringSummer
48.4 % 11.4 %
32.7 % 7.5 %
Figure 7 Intra-annual variability of suspended sedimenttransport and contribution in percent of monthly suspendedsediment flux to the annual suspended sediment flux.
Suspended sediment transport in a semiarid watershed, Wadi Abd, Algeria (1973–1995) 197
lated over the 22-year period is 1.00 m3 s�1 or0.0315 km3 yr�1. As a result, the ratio of the sedimentwash-down to the river water flow is 10.7 · 106 t km�3 forthe Wadi Abd. This is 20 times higher than the average ratioin the eastern hemisphere of the globe and 28 times its va-lue over the globe as a whole (without the Antarctic) (Tam-razyan, 1989). This is an illustration of the highly erosivepower of wadis (Ouillon, 1998).
Seasonal variability
The results obtained over the 22 hydrological years of obser-vation show that there is a significant variation of sedimenttransport at the intra-annual scale (CV = 88.7%, Fig. 7). Al-most half of suspended solid transport occurs in autumn(48.4%) and approximately a third of the annual flux inspring (32.7%). The total flux in winter and summer is lowerthan 20% of the annual flux. The two seasons favourable tosolid transport correspond to the two seasonal peaks of dis-charge which take place in October and March (Fig. 2). Thefloods in autumn are more aggressive than the floods inspring because they follow a season of much lower dis-charge. The flow is on average 0.37 m3 s�1 during the threesummer months and 1.14 m3 s�1 in winter. The high variabil-ity in rainfall is also probably responsible for the changes invegetation that in turn directly influence the erosive capac-ity of rainfall. Solid transport thus occurs mainly in autumnafter a long dry season characterized by high temperatures,by destruction of ground aggregates and, by reduced vege-tation cover (Rakoczi, 1981). In winter, rainfall and averagedischarge are significant but most of the erodible particlesare transported by the first floods of the preceding autumn.It is thus necessary to await the high rainfall in March andthe associated big floods so as to observe high erosion.
A review of several factors that control seasonal varia-tions in suspended sediment transport is given by Alexan-drov et al. (2003b). In particular, these seasonal variationscan be analyzed by regarding the seasonal climatic varia-tions and weather forcing. In the Negev, Alexandrov et al.(2007) show that rainfall episodes in autumn and spring,which result from high intensity convective or convec-tively-enhanced storms, are characterized by high concen-trations and low correlation with water discharge. On theother hand, winter rainfall, which results from low intensityfrontal storms, is accompanied by lower concentrations thatare correlated with water flow. In the Wadi Abd basin, suf-ficient weather data for a historical analysis of rainfallevents is unavailable. However, the previous analysis is con-sistent with that of Alexandrov et al. (2007) since the his-tory of flow during the months preceding a flood resultsfrom variations in precipitation.

198 M. Achite, S. Ouillon
The seasonal variation of suspended particulate trans-port in the Wadi Abd is comparable with that observed forother wadis of the region. The same seasonal variation is in-ferred by Touaıbia et al. (2001) at one station downstreamfrom the Ain Hamara station in the Wadi Mina, and in aneighbouring sub-catchment basin. In the Upper-Tafna riverbasin (another small basin in North-West Algeria), Megnou-nif et al. (2003) indicate that 43.7% of the annual suspendedsediment flux occurs in autumn and 36.4% in spring. The sea-sonal variation of solid transport is high in the wadis, and isalso highly significant in other areas subjected to strong sea-sonal variations of flow. These strong seasonal variationscould be the result of monsoons or melting snow (e.g.Vaithiyanathan et al., 1992; Hasnain and Thayyen, 1999).
Interannual variability
The 22-year variation of suspended sediment transportshows a significant interannual variability (CV = 138.8%,Fig. 8), that is greater than the seasonal variability. The an-nual suspended sediment yield variability expresses anamplification of the variations of discharge (CV = 41%) whichare themselves the result of an amplification of precipita-tion variability (CV = 17.6%) (see Fig. 3 and Table 6). Fig. 8clearly shows the considerable increase in the annual sus-pended sediment yield in 1985–1986, which then continuesfor 6 years. The average annual load is 127 · 103 t yr�1 forthe period 1973–1985, and 593 · 103 t yr�1 for the period1985–1995 (Table 6).
Wadis are known to have, among the rivers, the greatestinterannual variability. Milliman and Meade (1983) haveemphasized that catastrophic floods in wadis can, in just afew days, evacuate much more sediment than in an averageyear. To illustrate the interannual variability of the sedi-
73/74
75/76
77/78
79/80
81/82
83/84
85/86
87/88
89/90
91/92
93/94
0.
0.5
1.0
1.5
2.0
Annu
alsu
spen
ded
sedi
men
tflu
x(1
06 t y
r-1)
Average 339 10 t yrstdev 470 10 t yrCoefficient of variation 138.8 %
Average 127 10 t yrstdev 111 10 t yrCoefficient of variation 86.9 %
Average 593 10 t yrstdev 608 10 t yrCoefficient of variation 102.3 %
Figure 8 Interannual variability of suspended sediment flux(1973–1995) at the Ain Hamara gauging station.
Table 6 Summary of statistical data for annual precipitation at SFig. 3) and annual suspended sediment yield at the Ain Hamara g
1973–1995 1973–1985
Precip.(mm yr�1)
Q (m3 s�1) Qs (103 t yr�1) Precip.
(mm yr�1)Q (m
Mean 250 1.00 339 264 0.9Stdev 44.0 0.41 470 40.2 0.2CV (%) 17.6 41.0 138.8 15.2 27.9
ment concentrations, we have calculated for each yearthe ’’discharge-weighted total suspended solids’’, alsocalled ‘‘representative annual suspended particulate mat-ter concentration’’ (Meybeck et al., 2003; Coynel et al.,2004), denoted SPM* and calculated from daily suspendedmatter fluxes weighted by daily discharges following:
SPM� ¼Pn
i¼1CiQ iPni¼1Qi
ð8Þ
The 22 values of annual SPM* calculated over the period1973–74/1994–95 vary between 2.01 g L�1 and 29.63 g L�1.These are among the highest values in the world (seeFig. 4 in Walling and Kleo, 1979) and are typical of semiaridenvironments (Meybeck et al., 2003). The variation of an-nual SPM* is close to that of annual sedimentary flow shownin Fig. 8, although having a reduced difference betweenmaxima and minima as indicated by a lower coefficient ofvariation (90.3% against 138.8%). The 22 annual SPM* valuesshow a positive correlation with the mean annual discharge(Fig. 9a). Note that the discharge-weighted value of SPM*calculated over the period 1973–1995 (and not over a year)is the same quantity as the ratio of the sediment wash-downto the river water flow, i.e. 10.7 g L�1 (see Section ‘‘Annualsuspended sediment budget’’).
To understand the interannual variability in suspendedload, it is advisable to jointly analyze the statistical dataof the variables: rainfall, discharge, and suspended load fluxfor the whole of period 1973–1995 and separately over theperiods 1973–1985 and 1985–1995 (Table 6). The secondperiod corresponds to a phase of lower annual precipitationstarting in 1981–1982 (see Fig. 3 and Section ‘‘Climate,rainfall and runoff’’). Although, weaker than average, pre-cipitation is more irregular from one year to the next overthe period 1985–1995 than over the period 1973–1985. Thisincreasing irregularity is accompanied by: an amplificationof the variations of discharge, an increase in the averagedischarge of approximately 20% during the second period,a change in flow regime (Section ‘‘Flow regime of the WadiAbd’’), and a higher and more irregular suspended particu-late flux. The increasing irregularity of precipitation on anannual scale is probably a major factor in increased soil ero-sion. Dynamic data of the zone’s vegetation is not available,but the increase in discharge and in partial erosive capacity(only based on transport into suspension) could be the resultof a reduction in vegetation cover or its density inducedby the decrease in rainfall from 1981–82 onwards. Overthe 22 years of the data set, we thus observe a tendencytowards an increase in suspended sediment yield accompa-nied by a small reduction in rainfall and an amplification ofits variations on an annual scale.
tation S11 (see Fig. 1), mean yearly discharge at Station 3 (seeauging station
1985–1995
3 s�1) Qs (103 t yr�1) Precip.
(mm yr�1)Q (m3 s�1) Qs (10
3 t yr�1)
1 127 233 1.11 5935 111 43.7 0.54 608
86.9 18.8 48.5 102.6

0
Annu
alSP
M*(
gL-1
)
10
20
30
0 5 10 15
SPM* = 2.925 σQR2 = 0.9887
σQ (m3s-1)
b
20 40 80600
Annual Q (106 m3s-1)
0
10
20
30
Annu
al S
PM*(
gL-1
)
SPM* = 0.0056 Q 2 + 0.0548 Q
R2 = 0.717
a
Figure 9 Variation of the representative annual suspended particulate matter concentration against: (a) the annual discharge and(b) the standard deviation of mean daily discharge calculated per year, at the Ain Hamara gauging station (1973–1995).
Suspended sediment transport in a semiarid watershed, Wadi Abd, Algeria (1973–1995) 199
The influence of climate on mean annual suspended sed-iment yield is generally analyzed from mean annual precip-itation (Walling and Kleo, 1979). Langbein and Schumm(1958) have shown that suspended sediment yield (per unitarea of basin) is at a maximum when precipitation is about250–350 mm yr�1 (10–14 in yr�1, i.e. in semiarid areas). Inthe Wadi Abd basin, annual rainfall was between 250 and300 mm yr�1 from 1974 to 1980–1981 and thereafter gener-ally decreased. If annual precipitation is the main factorexplaining suspended sediment yield, the latter should havedecreased during the second period while in actual fact itincreased. We have tried to compare suspended sedimentyield with annual precipitation but have found no significanttendency (r2 < 0.1 whatever the type of regression consid-ered). However, we observed that the flow regime changedin the late 1980s, that the discharge slightly increased, andthat the discharge variability considerably increased. In anattempt to quantify this effect, plotting the annual sus-pended sediment yield Qs versus the CV of monthly dis-charge calculated per year yields to the followingregression relationship (r2 = 0.532, n = 22):
Ln Q s ¼ 1:872 CVþ 3:888 ð9Þ
It shows that 53% of the increase in the suspended sedimentyield can, potentially, be explained by the increasing vari-ability of the monthly discharge. As only 46% of the varia-tions of C can be explained by those of Q and that morethan 50% of the variability in C is explained by the sedimentsupply to the river system (see Section ‘‘Daily suspensionflux versus river discharge’’), the CV of monthly dischargecalculated on a yearly basis, a proxy for the discharge sea-sonality and the flow regime, may be considered as a partialindicator of the sediment supply to the river. We also ana-lyzed SPM* versus the CV of monthly discharge and obtainedthe following regression relationship (r2 = 0.716, n = 22):
Ln SPM� ¼ 1:563 CVþ 0:303 ð10Þ
The correlation between these two variables is higher thanbetween sediment yield and the CV of monthly discharge.This illustrates the strong influence of flow regime on meanconcentration in a semiarid basin.
The discharge-weighted mean annual concentration SPM*
was analyzed against several parameters so as to betterunderstand how an increase in mean yearly discharge from
0.91 m3 s�1 to 1.1 m3 s�1 could result in an increase of sus-pended sediment yield from 127 · 103 t yr�1 to593 · 103 t yr�1. Linear regression relationships of SPM* pro-vided r2-values <0.1 against the annual precipitation andmaximum of daily precipitation within a year, 0.46 againstthe 90th percentile of daily discharge (Q90) calculated peryear, 0.73 against the maximum of daily discharge per year,and 0.84 and 0.88 for the 95th percentile Q95 and the 98thpercentile Q98 of the daily discharge per year, respectively.Q95 was 1.58 m3 s�1 on average from 1973 to 85 and became2.82 m3 s�1 from 1986 to 95; Q98 was 3.76 m3 s�1 on averagefrom 1973 to 85 and became 10.96 m3 s�1 from 1986 to 95.SPM* is thus highly correlated with the 10 to 15 highest dailydischarges in a year, the latter of which increased morethan the mean yearly discharge.
Finally, as the 1973–1995 period was characterized byincreases both in discharge-weighted mean annual concen-tration and in number of days per year without water inthe river and Q95 (the two latter parameters indicating anincrease in discharge scattering), we have tried to analyzeyearly SPM* against the standard deviation of the daily dis-charge per year (rQ). A remarkable linearity was found be-tween both values (r2 = 0.9887, see Fig. 9b). This suggeststhat the suspended sediment yield on the Wadi Abd is dras-tically forced by the discharge variability.
The significance of the interannual variability indicatesthat it is absolutely necessary to continue this type of seriesof measurements over longer periods in small rivers, as hasbeen done in the case of large rivers, if studying fluctuationsin the context of climate change is to be achieved. In addi-tion, this result points to the difficulty in defining a suitableperiod to calculate a ‘‘standard’’ or reference value of sed-iment yield from which the deficits or excesses will be usedin water resources management, as has been demonstratedfor other hydrological parameters (e.g. Paturel et al., 2003;Syvitski, 2003).
Conclusion
Soil erosion constitutes a major aspect of landscape degra-dation in semiarid Mediterranean environments. Sedimentyield in semiarid areas is highly variable because precipita-tion and runoff are themselves highly variable.

200 M. Achite, S. Ouillon
In order to estimate the monthly or annual suspendedsediment transport of rivers and to analyze their variability,sediment rating curves based on measured concentrationsand discharge data can be constructed. This study showsthat non-biased C–Q regression relationships are as preciseas the more frequently used biased Qs–Q relationships. Anextensive dataset from the Wadi Abd basin was analyzedand provided an estimation of the sediment wash-down of136 t km�2 yr�1 for the 1973–1995 period which is of thesame order as the global mean sediment wash-down. How-ever, suspended sediment transport variability in the WadiAbd basin is high on the seasonal scale (CV = 88.7%) and evenhigher on the interannual scale (CV = 138.8%). The annualsediment yield variability expresses an amplification of thevariations of discharge (CV = 41%) which are themselvesthe result of an amplification of precipitation variability(CV = 17.6%). We note that, over 22 years, the increasingirregularity of precipitation at the annual scale (and theresulting changes in discharge variability) is likely a majorfactor influencing the increase in the discharge-weightedmean annual concentration. Finally, the ratio of sedimentwash-down to river water discharge, 10.7 · 106 t km�3, is20 times higher than the average value for Eastern hemi-sphere (Africa, Europe, Asia and Australia).
This highly erosive power in semiarid environments in-duces repercussions both in the eroded zone (impoverish-ment of substrates) and in the receiving zone (damfilling). Thus, it is clear that, the targeting of sediment man-agement strategies is a key requirement in semiarid regionsbecause of both high erosion and limited resources avail-able. For that purpose, sustainable management of waterand soil resources requires effective use of predictive mod-els and an ability to analyze the data in the context of hightemporal variability of semiarid environments. Data seriessuch as those presented in this paper should be encouragedand should be followed up over longer periods of time. Thiswill be especially important for the study of variability inthe context of climate change.
Acknowledgements
The authors warmly thank Miss Abda Leila from the Hydrom-etry office, Mr Ould Lamara Arezki from the Climatology Of-fice of the Agence Nationale des Ressources Hydrauliques(ANRH) in Alger, and two anonymous reviewers whose com-ments and suggestions were highly appreciated.
References
Achite, M., 1999. Analyse multivariee de la variable ErosionSpecifique: Cas du bassin versant de l’Oued Mina. MagisterThesis Report, Ecole Nationale Superieure d’Hydraulique, Blida,Algerie, p. 206
Achite, M., 2002. Statistical approach for evaluation of solidtransport in the catchment area of the Wadi Mina (Algeria).Proceedings of the International Conference on Water in theMediterranean Basin, October 10–13 2002, Monastir (Tunisia),894-899.
Achite, M., Meddi, M., 2004. Estimation du transport solide dans lebassin versant de l’oued Haddad (Nord-Ouest algerien). Secher-esse 15 (4), 367–373.
Alexandrov, Y., Laronne, J.B., Reid, I., 2003a. Suspended sedimentconcentration and its variation with water discharge in a drylandephemeral channel, northern Negev, Israel. J. Arid Environ. 53,73–84.
Alexandrov, Y., Laronne, J.B., Reid, I., 2003b. Suspended sedimenttransport in flash floods of semiarid northern Negev, Israel. In:Servat, E., Najem, W., Leduc, C., Shakeel, A. (Eds.), Hydrologyof Mediterranean and semiarid regions, vol. 278. InternationalAssociation of Hydrological Sciences Publication, pp. 346–352.
Alexandrov, Y., Laronne, J.B., Reid, I., 2007. Intra-event and inter-seasonal behaviour of suspended sediment in flash floods of thesemiarid northern Negev, Israel. Geomorphology 85, 85–97.
Alhamid, A.A., Reid, I., 2002. Sediment and the vulnerability ofwater resources. In: Wheater, H., Al-Weshah, R. (Eds.), Hydrol-ogy of Wadi Systems, IHP Network on Wadi Hydrology in the Arabregion, vol. 55. UNESCO, Technical Documents in Hydrology,Paris, pp. 37–55.
Amos, K.J., Alexander, J., Horn, A., Pocock, G.D., Fielding, C.R.,2004. Supply limited sediment transport in a high-dischargeevent of the tropical Burdekin River, North Queensland, Austra-lia. Sedimentology 51, 145–162.
Asselman, N.E.M., 2000. Fitting and interpretation of sedimentrating curves. J. Hydrol. 234, 228–248.
Benkhaled, A., Remini, B., 2003. Variabilite temporelle de laconcentration en sediments et phenomenes d’hysteresis dans lebasin de l’Oued Wahrane (Algerie). Hydrol. Sci. J. 48 (2), 243–255.
Bourouba, M., 1997. Les variations de la turbidite et leurs relationsavec les precipitations et les debits des oueds semi-arides del’Algerie orientale. Bull. ORSTOM 17, 345–360.
Bourouba, M., 1998. Phenomene de transport solide dans les HautsPlateaux Orientaux Cas de l’Oued Logmane et de l’Oued Lehamdans le bassin de la Hodna. Revue des Sciences et Technologie 9,5–11.
Chikita, K., 1996. Suspended sediment discharge from snowmelt:Ikushunbetsu River, Hokkaido, Japan. J. Hydrol. 186, 295–313.
Clapp, E.M., Bierman, P.R., Schick, A.P., Lekach, J., Enzel, Y.,Caffee, M., 2000. Differing rates of sediment production andsediment yield. Geology 28 (11), 995–998.
Cohen, H., Laronne, J.B., 2005. High rates of sediment transport byflashfloods in the Southern Judean Desert, Israel. Hydrol.Process. 19, 1687–1702.
Coynel, A., Schafer, J., Hurtrez, J.E., Dumas, J., Etcheber, H.,Blanc, G., 2004. Sampling frequency and accuracy of SPM fluxestimates in two contrasted drainage basins. Sci. Total Environ.330, 233–247.
Davies, B.R., Thoms, M.C., Walker, K.F., O’Keeffe, J.H., Gore,J.A., 1994. Dryland, rivers their ecology, conservation andmanagement. In: Calow, P., Petts, G.E. (Eds.), The rivershandbook, vol. 2. Blackwell Scientific Publications, Oxford, pp.484–511.
Day, J.A., 1990. Environmental correlates of aquatic faunal distri-bution in the Namib Desert. In: Seely, M.K. (Ed.), Namib Ecology:25 years of Namibian research. Transvaal Museum MonographNo. 7, Transvaal Museum, Pretoria, 99–107.
Eisma, D., 1998. Intertidal deposits: river mouths, tidal flats andcoastal lagoons. CRC Press, Boca Raton, FL (p. 459).
Ferguson, R.I., 1986. River loads underestimated by rating curves.Water Resour. Res. 22, 74–76.
Ferguson, R.I., 1987. Accuracy and precision of methods forestimating river loads. Earth Surf. Process. Landforms 12, 95–104.
Frostick, E.L., Reid, I., Layman, Y., 1983. Changing size distributionof suspended sediment in arid – zone flash floods, vol. 6. Spec.Publ. Int. Assoc. Sedimentol., pp. 97–106.
Ghachi, A., 1986. Hydrologie et utilisation de la ressource en eau enAlgerie: Bassin de la Seybousse. These Doctorat 3e cycle. Ed.Office des Publications Universitaires (OPU), Alger, p. 508.

Suspended sediment transport in a semiarid watershed, Wadi Abd, Algeria (1973–1995) 201
Hasnain, S.I., 1996. Factors controlling suspended sediment trans-port in Himalaya glacier meltwaters. J. Hydrol. 181, 49–62.
Hasnain, S.I., Thayyen, R.J., 1999. Discharge and suspended-sediment concentration of meltwaters, drainig from theDokriani glacier, Garhwal Himalaya, India. J. Hydrol. 218,191–198.
Horowitz, A.J., 2003. An evaluation of sediment rating curves forestimating suspended sediment concentrations for subsequentflux calculations. Hydrol. Process. 17, 3387–3409.
Jansson, M.B., 1996. Estimating a sediment rating curve of theReventazon river at Palomo using logged mean loads withindischarge classes. J. Hydrol. 183, 227–241.
Jiongxin, X., Yunxia, Y., 2005. Scale effects on specific sedimentyield in the Yellow River basin and geomorphomogical explana-tions. J. Hydrol. 307, 219–232.
Kassoul, M., Abdelgader, A., Belorgey, M., 1997. Caracterisation dela sedimentation des barrages en Algerie. Revue des Sciences del’Eau 3, 339–358.
Kouri, L. 1993. L’erosion hydrique des sols dans le bassin versant del’Oued Mina. Etude des processus et type de fonctionnement desravins dans la zone des marnes tertiaires. Ph.D. Thesis, LouisPasteur University, Strasbourg, France, p. 238.
Langbein, W.B., Schumm, S.A., 1958. Yield of sediment in relationto mean annual precipitation. Trans. Am. Geophys. Union 39,1076–1084.
Laraque, A., Mahe, G., Orange, D., Marieu, B., 2001. Spatiotem-poral variations in hydrological regimes within Central Africaduring the XXth century. J. Hydrol. 245, 104–117.
Laronne, J.B., Reid, I., Yitshak, Y., Frostick, L.E., 1994. The non-layering of gravel streambeds under ephemeral flood regimes. J.Hydrol. 159, 353–363.
L’Hote, Y., Mahe, G., Some, B., Triboulet, J.P., 2002. Analysis of aSahelian annual rainfall index from 1896 to 2000; the droughtcontinues. Hydrol. Sci. J. 47 (4), 563–572.
Lopatin, G.V., 1952. Sediment in the rivers of the USSR. Geografgiz,Moscow, p. 366.
Lisitisyna, K.N., Aleksandrova, V.I., 1972. Sediment from the riversof the European USSR. Trudy GGI 191, 23–51.
Mahieddine, M. 1997. Quantification et variabilite parcellaire soussimulation de pluie dans le bassin versant de l’Oued Mina.Magister Thesis Report, Ecole Nationale Superieure des SciencesAgronomiques, Alger, 120 p.
Matthews, W.J., 1998. North American streams as systems forecological study. J. North Am. Benthol. Soc. 7 (4), 387–409.
Megnounif, A., Terfous, A., Bouanani, A., 2003. Production andtransport of suspended sediment transport in the Upper-Tafnariver basin (North West Algeria). Rev. Sci. Eau 16 (3), 369–380.
Merritt, W.S., Letcher, R.A., Jakeman, A.J., 2003. A review oferosion and sediment transport models. Environ. Model. Soft-ware 18 (8–9), 761–799.
Meybeck, M., Laroche, L., Durr, H.H., Syvitski, J.P.M., 2003. Globalvariability of daily total suspended solids and their fluxes inrivers. Global Planetary Change 39 (1–2), 65–93.
Milliman, J.D., Meade, R.H., 1983. World-wide delivery of riversediment to the oceans. J. Geol. 91, 1–21.
Morehead, M.D., Syvitski, J.P., Hutton, E.W.H., Peckham, S.D.,2003. Modeling the temporal variability in the flux of sedimentfrom ungauged river basins. Global Planetary Change 39 (1–2),95–110.
O’Reilly, J.E., Maritorena, S., Mitchell, G.G., Siegel, D.A.,Carder, K.L., Garver, S.A., Kahru, M., McClain, C., 1998.Ocean color algorithms for SeaWiFS. J. Geoph. Res. 103,24937–24953.
Ouillon, S., 1998. Erosion et transport solide: ampleur et enjeux. LaHouille Blanche 2, 52–58.
Paturel, J.E., Ouedraogo, M., Servat, E., Mahe, G., Dezetter, A.,Boyer, J.F., 2003. The concept of rainfall and streamflow
normals in West and Central Africa in a context of climaticvariability. Hydrol. Sci. J. 48 (1), 125–137.
Poliakov, B.V. 1935. Investigation of suspended sediment & bedloadyield. Leningrad, 129 p.
Powell, D.M., Reid, I., Laronne, J.B., 2001. Evolution of bed loadgrain size distribution with increasing flow strength and theeffect of flow duration on the calibre of bed load sediment yieldin ephemeral gravel bed rivers. Water Resour. Res. 37 (5), 1463–1474.
Probst, J.L., Amiotte-Suchet, P.A., 1992. Fluvial suspended sedi-ment transport and mechanical erosion in the Maghreb (NorthAfrica). Hydrol. Sci. J. 37 (6), 621–637.
Rakoczi, L., 1981. Problems of Sediment Gauging in Gravel BedRivers. International Association for Hydraulic Research XIXCongress, New Delhi, India.
Reid, I., Laronne, J.B., 1995. Bed load sediment transport in anephemeral stream and a comparison with seasonal and perennialcounterparts. Water Resour. Res. 31 (3), 773–781.
Reid, I., Frostick, L.E., 1997. Channel form, flows andsediments in deserts. In: David, S.G. (Ed.), Arid ZoneGeomorphology. John Willey and Sons, Chichester, England,pp. 205–229.
Restrepo, J.D., Kjerfve, B., 2000. Magdalena river: interannualvariability (1975–1995) and revised water discharge and sedi-ment load estimates. J. Hydrol. 235, 137–149.
Schick, A.P., 1977. Study of sediment generation, transport anddeposition in semiarid zones. Hydrol. Sci. Bull. 22 (4), 535–542.
Serrat, P., 1999. Dynamique sedimentaire actuelle d’un systemefluvial mediterraneen: l’Agly (France). Comptes Rendus del’Academie des Sciences IIA 329, 189–196.
Serrat, P., Ludwig, W., Navarro, B., Blazi, J.L., 2001. Spatial andtemporal variability of sediment fluxes from a coastal Mediter-ranean river: the Tet (France). Comptes Rendus de l’Academiedes Sciences IIA 333 (7), 389–397.
Sichingabula, H.M., 1998. Factors controlling variations in sus-pended sediment concentration for single-valued sedimentrating curves, Fraser River, British Columbia, Canada. Hydrol.Process. 12 (12), 1869–1894.
Sutherland, R.A., Bryan, R.B., 1990. Flow dynamics and thevariability of suspended sediment in a semiarid tropical stream,Baringo district, Kenya. Geografiska Annaler Series A: PhysicalGeography 72 (1), 23–39.
Syvitski, J.P.M., 2003. Supply and flux of sediment along hydrolog-ical pathways: research for the 21st century. Global PlanetaryChange 39, 1–11.
Syvitski, J.P.M., Morehead, M.D., Bahr, D.B., Mulder, T., 2000.Estimating fluvial sediment transport: the rating parameters.Water Resour. Res. 36, 2747–2760.
Syvitski, J.P.M., Peckham, S.D., Hilberman, R., Mulder, T., 2003.Predicting the terrestrial flux of sediment to the global ocean: aplanetary perspective. Sediment. Geol. 162, 5–24.
Tamrazyan, G.P., 1989. Global peculiarities and tendencies in riverdischarge and wash-down of the suspended sediments - Theearth as a whole. J. Hydrol. 107 (1–4), 113–131.
Terfous, A., Megnounif, A., Bouanani, A., 2001. Etude du transportsolide en suspension dans l’Oued Mouilah (Nord Ouest Algerien).Rev. Sci. de l’Eau 14 (2), 173–185.
Touaıbia, B., Aıdaoui, A., Gomer, D., Achite, M., 2001. Quantifi-cation et variabilite temporelles de l’ecoulement solide en zonesemi-aride de l’Algerie du Nord. Hydrol. Sci. J. 46 (1), 41–53.
Uys, M.C., O’Keeffe, J.H., 1997. Simple words and fuzzy zones:early directions for temporary river research in South Africa.Environ. Manag. 21 (4), 517–531.
Vaithiyanathan, P., Ramanathan, A., Subramanian, V., 1992.Sediment transport in the Cauvery River basin: sedimentcharacteristics and controlling factors. J. Hydrol. 139 (1–4),197–210.

202 M. Achite, S. Ouillon
Walling, D.E., 1977. Assessing the accuracy of suspended sedimentrating curves for small basin. Water Resour. Res. 13, 531–538.
Walling, D.E., Kleo, A.H.A., 1979. Sediment yield of rivers in areasof low precipitation: a global view. In: Dooge, J.C.I. (Ed.), TheHydrology of Areas of Low Precipitation, vol. 128. InternationalAssociation of Hydrological Sciences Publication, pp. 479–493.
Walling, D.E., Fang, D., 2003. Recent trends in the suspendedsediment loads of the world’s rivers. Global Planetary Change39, 111–126.
Williams, G.P., 1989. Sediment concentration versus water dis-charge during single hydrologic events in rivers. J. Hydrol. 111(1–4), 89–106.
Copyright © 2022 FDOKUMEN