Survey of Water Transport and Ports Chapter 4.
123
Data Collection Survey on Reverse Logistics in the Pacific Islands 95 Survey of Water Transport and Ports Chapter 4. 4.1 International Maritime Network Water transportation is a key factor to circulate recycling material into a global market. International maritime network and domestic maritime network will be examined in this chapter. Before surveying international maritime conditions, the team will grasp the general view of international trade in Pacific countries and world. 4.1.1 Trade Characteristics in PICs (1) General view of trade in PICs Based on International Trade Statistics 2010, the value of foreign trade in Fiji 2009 is US$1,437 million in imports and US$ 629 million in exports which represents 75% of total of the five countries (see Figure 4-1). There is a big imbalance of trade between import and export. This situation is the same as the other four countries. The value of imports in Samoa is US$ 230.5 million, followed Vanuatu (US$201.7 million), Tonga (US$144.6 million) and Tuvalu (US$26.5 million).The value of exports is very small in each country. PICs’ main trading partners are Singapore, Australia and NZ and the Far East countries. Intra trade is small.
-
Upload
khangminh22 -
Category
Documents
-
view
1 -
download
0
Transcript of Survey of Water Transport and Ports Chapter 4.

Data Collection Survey on Reverse Logistics in the Pacific Islands
95
Survey of Water Transport and Ports Chapter 4.
4.1 International Maritime Network
Water transportation is a key factor to circulate recycling material into a global market. International maritime network and domestic maritime network will be examined in this chapter. Before surveying international maritime conditions, the team will grasp the general view of international trade in Pacific countries and world.
4.1.1 Trade Characteristics in PICs
(1) General view of trade in PICs
Based on International Trade Statistics 2010, the value of foreign trade in Fiji 2009 is US$1,437 million in imports and US$ 629 million in exports which represents 75% of total of the five countries (see Figure 4-1). There is a big imbalance of trade between import and export. This situation is the same as the other four countries. The value of imports in Samoa is US$ 230.5 million, followed Vanuatu (US$201.7 million), Tonga (US$144.6 million) and Tuvalu (US$26.5 million).The value of exports is very small in each country. PICs’ main trading partners are Singapore, Australia and NZ and the Far East countries. Intra trade is small.
Data Collection Survey on Reverse Logistics in the Pacific Islands
96
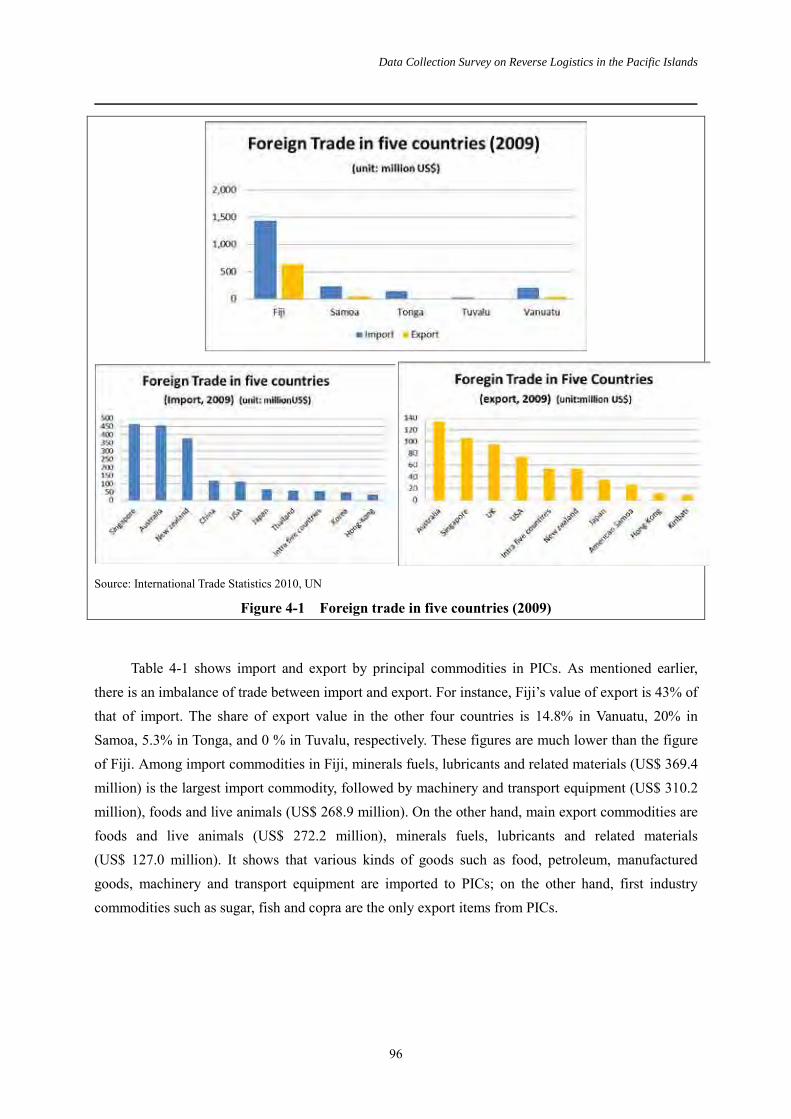
Table 4-1 shows import and export by principal commodities in PICs. As mentioned earlier, there is an imbalance of trade between import and export. For instance, Fiji’s value of export is 43% of that of import. The share of export value in the other four countries is 14.8% in Vanuatu, 20% in Samoa, 5.3% in Tonga, and 0 % in Tuvalu, respectively. These figures are much lower than the figure of Fiji. Among import commodities in Fiji, minerals fuels, lubricants and related materials (US$ 369.4 million) is the largest import commodity, followed by machinery and transport equipment (US$ 310.2 million), foods and live animals (US$ 268.9 million). On the other hand, main export commodities are foods and live animals (US$ 272.2 million), minerals fuels, lubricants and related materials (US$ 127.0 million). It shows that various kinds of goods such as food, petroleum, manufactured goods, machinery and transport equipment are imported to PICs; on the other hand, first industry commodities such as sugar, fish and copra are the only export items from PICs.
Source: International Trade Statistics 2010, UN
Figure 4-1 Foreign trade in five countries (2009)

Data Collection Survey on Reverse Logistics in the Pacific Islands
97
Table 4-1 Import and export by principal commodities (Unit: US million $)
Source: International Trade Statistics Yearbook 2010, UN
(2) Base metal flow in PICs
The team briefly surveyed the flow of scrap metal in the world. Scrap metal is the main commodity of the recycling industry. According to international trade statistics, value of total trade (import and export) of scrap metals was US$ 8,890 million in 2009. In the last five years, the value of total trade of that ranged from US$ 6,200 to 10,900 million. Turkey (US$ 7,120 million) is the largest consumer of scrap metal in the world, followed by Korea (US$ 3,814 million) and China (US$ 3,006 million). Korea exported scrap metal worth US$430millions, however balance of import and export shows that Korea is still a major consumer. European countries such as Belgium (US$ 2,853 million import, US$ 1,427 million export), Germany (US$ 2,527 million import, US$ 4,794million export) and Netherlands (2,088 import, US$ 3,855 million export) are major importers of scrap metal as well
IMPORT EXPORT IMPORT EXPORT IMPORT EXPORT IMPORT EXPORT IMPORT EXPORT
Total 1,437.0 628.7 230.5 46 144.6 7.8 26.5 0 201.7 29.9
0 Foods and live animals 268.9 272.2 64.9 7.7 40.0 6.6 4.8 0 34.3 8.7
1 Beverages and tobacco 11.5 45.3 3.2 1.0 8.2 0.1 0.8 0 6.6 0.0
2 Crude materials,inedible, except fuels
11.3 25.7 5.7 0.2 2.7 0.3 1.0 0 3.3 5.4
3Minerals fuels,lubricants and relatedmaterials
369.4 127.0 42.8 0.0 29.4 0.0 4.4 0 36.5 0.0
4 Animals and vegetableoils, fats ans waxes
14.9 3.8 1.2 1.2 0.0 0.0 0.0 0 1.1 4.9
5 Chemicals and relatedproducts, nes
118.2 19.8 13.1 0.0 6.8 0.3 0.4 0 13.7 0.3
6Manufactured goodsclassified chietly bymaterial
205.9 33.6 27.9 0.2 15.0 0.1 1.0 0 32.1 0.5
7 Machinery andtransport equipment
310.2 21.5 20.5 31.5 27.2 0.1 2.2 0 49.4 0.9
8 Miscellaneousmanufactured articles
120.6 55.0 12.9 0.2 8.7 0.3 0.7 0 19.2 0.8
9Commodities andtransactions notclassified elsewhere
6.1 24.8 38.3 4.0 6.6 0.0 11.2 0 5.5 8.3
(2007)
TUVALU
Commodity
Country(2009) (2009) (2009) (2008)FIJI SAMOA TONGA VANUATU
Data Collection Survey on Reverse Logistics in the Pacific Islands
98
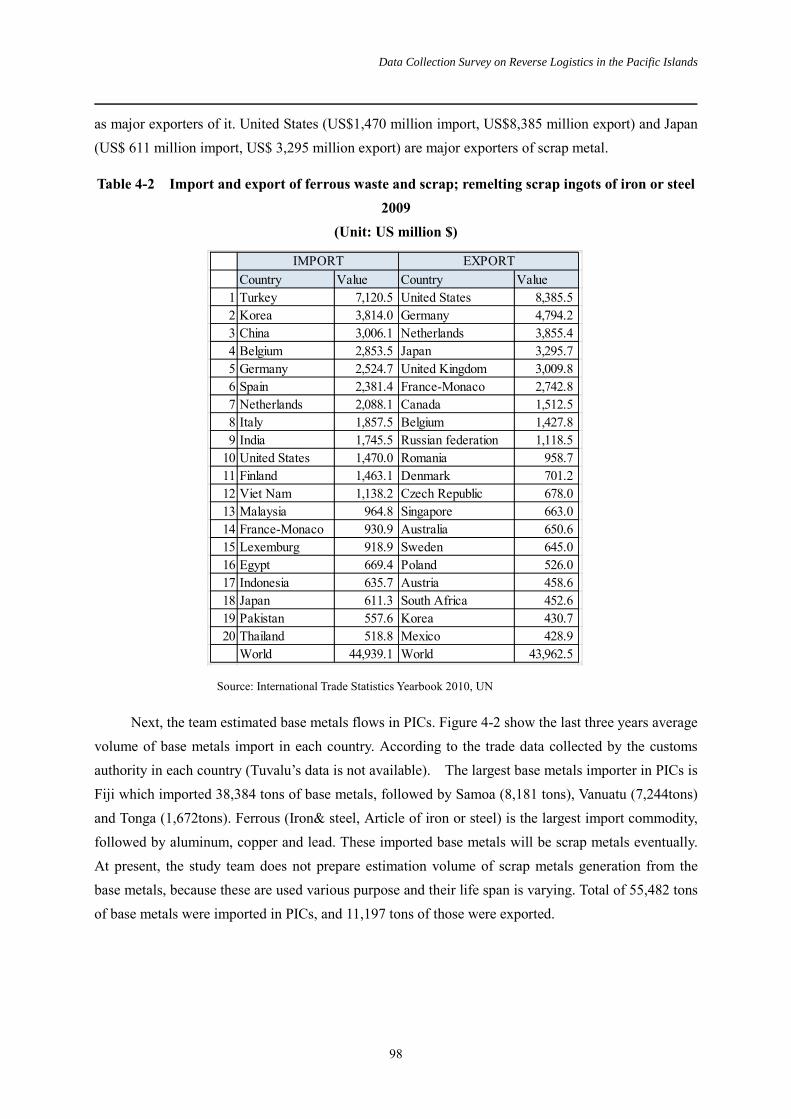
as major exporters of it. United States (US$1,470 million import, US$8,385 million export) and Japan (US$ 611 million import, US$ 3,295 million export) are major exporters of scrap metal.
Table 4-2 Import and export of ferrous waste and scrap; remelting scrap ingots of iron or steel 2009
(Unit: US million $)
Source: International Trade Statistics Yearbook 2010, UN
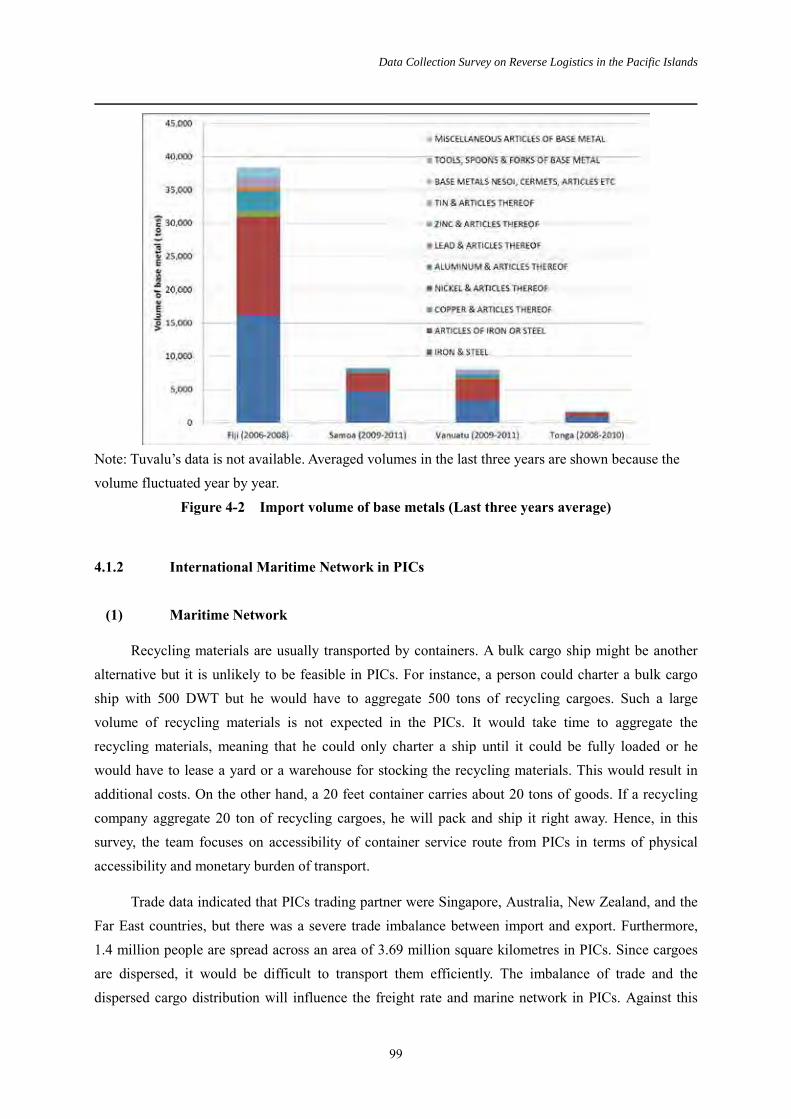
Next, the team estimated base metals flows in PICs. Figure 4-2 show the last three years average volume of base metals import in each country. According to the trade data collected by the customs authority in each country (Tuvalu’s data is not available). The largest base metals importer in PICs is Fiji which imported 38,384 tons of base metals, followed by Samoa (8,181 tons), Vanuatu (7,244tons) and Tonga (1,672tons). Ferrous (Iron& steel, Article of iron or steel) is the largest import commodity, followed by aluminum, copper and lead. These imported base metals will be scrap metals eventually. At present, the study team does not prepare estimation volume of scrap metals generation from the base metals, because these are used various purpose and their life span is varying. Total of 55,482 tons of base metals were imported in PICs, and 11,197 tons of those were exported.
Country Value Country Value1 Turkey 7,120.5 United States 8,385.52 Korea 3,814.0 Germany 4,794.23 China 3,006.1 Netherlands 3,855.44 Belgium 2,853.5 Japan 3,295.75 Germany 2,524.7 United Kingdom 3,009.86 Spain 2,381.4 France-Monaco 2,742.87 Netherlands 2,088.1 Canada 1,512.58 Italy 1,857.5 Belgium 1,427.89 India 1,745.5 Russian federation 1,118.5
10 United States 1,470.0 Romania 958.711 Finland 1,463.1 Denmark 701.212 Viet Nam 1,138.2 Czech Republic 678.013 Malaysia 964.8 Singapore 663.014 France-Monaco 930.9 Australia 650.615 Lexemburg 918.9 Sweden 645.016 Egypt 669.4 Poland 526.017 Indonesia 635.7 Austria 458.618 Japan 611.3 South Africa 452.619 Pakistan 557.6 Korea 430.720 Thailand 518.8 Mexico 428.9
World 44,939.1 World 43,962.5
IMPORT EXPORT
Data Collection Survey on Reverse Logistics in the Pacific Islands
99
Note: Tuvalu’s data is not available. Averaged volumes in the last three years are shown because thevolume fluctuated year by year.
Figure 4-2 Import volume of base metals (Last three years average)
4.1.2 International Maritime Network in PICs
(1) Maritime Network
Recycling materials are usually transported by containers. A bulk cargo ship might be another alternative but it is unlikely to be feasible in PICs. For instance, a person could charter a bulk cargo ship with 500 DWT but he would have to aggregate 500 tons of recycling cargoes. Such a large volume of recycling materials is not expected in the PICs. It would take time to aggregate the recycling materials, meaning that he could only charter a ship until it could be fully loaded or he would have to lease a yard or a warehouse for stocking the recycling materials. This would result in additional costs. On the other hand, a 20 feet container carries about 20 tons of goods. If a recycling company aggregate 20 ton of recycling cargoes, he will pack and ship it right away. Hence, in thissurvey, the team focuses on accessibility of container service route from PICs in terms of physical accessibility and monetary burden of transport.
Trade data indicated that PICs trading partner were Singapore, Australia, New Zealand, and the Far East countries, but there was a severe trade imbalance between import and export. Furthermore, 1.4 million people are spread across an area of 3.69 million square kilometres in PICs. Since cargoes are dispersed, it would be difficult to transport them efficiently. The imbalance of trade and the dispersed cargo distribution will influence the freight rate and marine network in PICs. Against this

Data Collection Survey on Reverse Logistics in the Pacific Islands
100
background, the study team will survey present status of shipping networks and deployed ships in the marine network in PICs, interview shipping lines and recycling companies on freight rate for exporting goods, and explore share of marine transportation cost on recycling material selling price.
At first, the team will survey present international shipping network. PICs are far from trunk lines of container ships. Eleven Shipping companies extend their network service routes depending on needs for transportation. However the PICs are directly connected to NZ, Australia and the Far East. In addition, there is a direct route to Singapore and the USA. The study team summarized operators and its shipping route, and deployed ships. Details of each route are described in the following sections.
PICs – Australia and NZ Route 1)
Table 4-3 indicates operators and their service between PICs and Australia, NZ. Eight routes are served at present. Pacific Direct Line, Pacific Forum Line, Reef, and Polynesian Shipping Line, Cooltainer and other shipping lines are forming a consortium in order to reduce transportation cost and alleviate operational risks. Voyage duration is from 15 to 30 days. The ships call 156 times in a year. Each international container ship directly calls capital city ports except for Funafuti, Tuvalu. Seven out of the eight routes calls Suva, Fuji. Suva is in fact the hub of the network. Pacific Forum Line was sponsored and established by twelve countries in the Pacific in 1978. NZ is the largest shareholder with 23% of the largest route in PICs.

Data Collection Survey on Reverse Logistics in the Pacific Islands
101
Table 4-3 Operators and their service between PICs and Australia, New Zealand
Figure 4-3 illustrates a container shipping route between PICs and Australia and New Zealand. Container ships call each port in PICs but there is particularly heavy traffic between Suva and Auckland. This route is the largest route in PICs.
SERVISE ROUTEVOYAGE
DURATION
(Shipping Company) (Number of callsin a year)
Forum Fiji(24)
(18)
(18)
(24)
(24)FIJI/TUVALU
(18)
FIJI/NAURU/PAPUA NEWGUINEA 20days
(Reef) (18)
AUSTRALIA/VANUATU/FIJI30days
(Swire) (12)
Total (156) note:Voyage duration indicates for full circle.
AUSTRALIA/FIJI/NEWZEALAND Capitain Tasuman
MELBOURNE - PORT KEMBLA -BRISBANE - NOUMEA - SUVA -LAUTOKA - AUKLAND - TAURANGA -NAPIER - MELBOURNE
(Pacific Direct Line,Pacific Forum Line,Reef,Swire,Cooltainer )
30days
NEWZEALAND/FIJI/SAMOA/
TONGASouthern Lily2
AUKLAND - LAUTOKA - SUVA - APIA -PAGOPAGO - NUKU'ALOFA -AUKLAND
20days(Pacific Direct Line,Pacific ForumLine,
Reef,Cooltainer, Polynesian Shipping Line)
NEWZEALAND/FIJI/SAMOA/
TONGASouthern Cross
AUKLAND - SUVA - APIA -NUKU'ALOFA - AUKLAND20days
(Pacific Direct Line,Pacific ForumLine,Reef,Cooltainer, Polynesian Shipping Line)
NEWZEALAND/FIJI/VANUATUSouthern Fleur
AUKLAND - NOUMEA - LAUTOKA -SUVA - PORT VILA - SANTO -TAURANGA - AUKLAND
15days(Pacific Direct Line,Pacific ForumLine,
Reef,Cooltainer, Polynesian Shipping Line)
(Pacific Direct Line,Pacific Forum Line,Reef)
Reef Nauru SUVA - LAUTOKA - NAURU - HONIARA- LAE - PORT MORESBY - SUVA
NEWZEALAND/TONGASouthen Tiare
AUKLAND - NUKU'ALOFA - VAVA’U -NIUE - AUKLAND15days
(Pacific Direct Line,Pacific ForumLine,Reef,Cooltainer, Polynesian Shipping Line)
VESSEL PORT OF CALL
Micronesian Pride
MELBOURNE - PORT KEMBLA-GLADSTONE - BRISBANE - PRONY -SANTO - SUVA - TARAWA -MELBOURNE
Southern Pearl20days SUVA - WALLIS - FUNAFUTI -
TARAWA - MARSHALL ISLANDS - SUVA

Data Collection Survey on Reverse Logistics in the Pacific Islands
102
Figure 4-3 Shipping route between PICs and Australia, NZ
SOU
THER
NFL
EUR
SOU
THER
NPE
ARL
REEF
NAU
RU
SOU
THER
NCR
OSS
SOU
THER
NLI
LY2
SOU
THER
NTI
ARE
FORU
M F
UJI
&CA
PITA
INE
TASM
AN
MIC
RON
ESIA
N P
RID
E

Data Collection Survey on Reverse Logistics in the Pacific Islands
103
Table 4-4 lists specification of deployed ships between PICs and Australia and New Zealand. Eight ships are serving in the route of which gross tonnages of deployed vessels are 1,200 GT to 13,497GT. The container ships capacities are varying from 79 TEUs to 1,280 TEUs. A typical vessel, for instance, MV Forum Fiji, is 145 meters in length, 8.12 meters in draft, 951 TEUs capacity and equipped with two 40-ton cranes. Drafts of these ships are varying from 4.27 meters to 9.22 meters. International ports in PICs are in shallow water and not equipped with container cranes except for Suva port. Therefore, container ships are small and use deck cranes to handle cargoes.
Table 4-4 Specification of deployed ships between PICs and Australia, NZ
Grosstonnage
9,725t Grosstonnage
9,725t
Length 145.93m Length 145.93mBeam 22.6m Beam 22.6mDraft 8.12m Draft 8.12mTEU 951TEU TEU 951TEU
Cargogear
2×40tcranes
Cargogear
2×40tcranes
Ramp none Ramp none
Capitaine TasmanForum Fiji
Grosstonnage
13,497t Grosstonnage
5,234t
Length 159.53m Length 109.4mBeam 25.0m Beam 18.2mDraft 9.22m Draft 6.68mTEU 1,280TEU TEU 570TEU
Cargogear
2×40tcranes
Cargogear
2×45tcranes
Ramp none Ramp none
Southern Lily 2 Southern Pearl
Grosstonnage
6,245t Grosstonnage
1,185t
Length 115.43m Length 62.55mBeam 20.8m Beam 11.4mDraft 7.0m Draft 4.27mTEU 688TEU TEU 79TEU
Cargogear
2×45tcranes
Cargogear
2×20tcranes
Ramp none Ramp none
Southern Cross Southern Tiare

Data Collection Survey on Reverse Logistics in the Pacific Islands
104
Data of MV Micronesian Pride is not available.
PICs – Far East route 2)
Table 4-5 shows the operators and its service between PICs and the Far East. There are three routes. Container ships are calling Lautoka, Suva, Apia, Nuku’alofa, Santo in the PICs, a total 21 times calls a year. Voyage duration is from 60 to 70 days. Greater Bali Hai, Swire and Kyowa Line have formed a consortium. Kyowa Line was established in Tokyo 1974. It carries eight vessels and covers the whole Pacific. Swire is a subsidiary shipping company of China Navigation.
Table 4-5 Operators and its service between PICs and the Far East
Figure 4-4 shows the container shipping route between the Far East and PICs. A
Grosstonnage
9,999t Grosstonnage
2,800t
Length 142.7m Length 86.0mBeam 22.6m Beam 15.2mDraft 6.68m Draft 6.68mTEU 1,217TEU TEU 267TEU
Cargogear
3×40tcranes
Cargogear
2×25tcranes
Ramp none Ramp none
Southern Fleur Reef Nauru
SERVISE ROUTEVOYAGE
DURATION
(Shipping Company) (Number of callsin a year)
Coral IslanderⅡ 70days
Pacific IslanderⅡ 70days
(Greater bali hai,Swire,kyouwashipping,NYK-hinode line) (10)
(Greater bali hai,Swire,kyouwashipping,NYK-hinode line) (5)
(Greater bali hai,Swire,kyouwashipping,NYK-hinode line) (6)
Total (21)
note:Voyage dur mber of calls in a year
KAOHSIUNG-BUSAN-KOBE-NAGOYA-YOKOHAMA-HONIARA-SANTO-PORTVILA-NOUMEA-LAUTOKA-SUVA-APIA-PAGOPAGO-KAOHSIUNG
VESSEL PORT OF CALL
KOREA/JAPAN/VANUATU/FIJI/SAMOA
KAOHSIUNG-BUSAN-KOBE-NAGOYA-YOKOHAMA-MAJURO-TARAWA-NOUMEA-LAUTOKA-SUVA -APIA-PAGOPAGO-PAPEETE-NUKU'ALOFA-NOUMEA-SANTO-HONIARA-NORO-KAOHSIUNG
Tropical Islander
KAOHSIUNG-BUSAN-KOBE-NAGOYA-YOKOHAMA-HONIARA-SANTO-PORTVILA-NOUMEA-LAUTOKA-SUVA-APIA-PAGOPAGO-PAPEETE-KAOHSIUNG
KOREA/JAPAN/VANUATU/FIJI/SAMOA
70days
South Islander 60days
KOREA/JAPAN/FIJI/SAMOA/TONGA
Data Collection Survey on Reverse Logistics in the Pacific Islands
105
multi-port-calling network is formed in the PICs even though major trunk lines in the world form hub-and-spoke network. Limited cargo volume and poor port facilities in each country might be one of the reasons for forming the multi-port-calling network. On the other hand, Kyowa line has a round trip route with a hub port in Busan for its Far East service. Cargoes from/to the Far East are transhipped in Busan, Korea.
A typical deployed vessel, for instance, the Pacific Islander II, is 161 meters in length, 7.6 meters in draft, 912 TEU capacity and equipped with two 40-ton cranes and a ramp for RORO cargo. She can carry containers, break bulk and RORO cargoes such as automobiles and trucks. These have been developed and tailored on port condition of the Pacific Islands with shallower water, few quay cranes on port, less container cargo handling in each port, variety of cargo package. The deployed vessels in the Far East route are relatively larger than those in NZ and Australia route.

Data Collection Survey on Reverse Logistics in the Pacific Islands
106
Figure 4-4 Shipping route between PICs and the Far East
TRO
PICA
LIS
LAN
DER
SOU
THIS
LAN
DER
CORA
LIS
LAN
DERⅡ
&PA
CIFI
CIS
LAN
DER
Ⅱ

Data Collection Survey on Reverse Logistics in the Pacific Islands
107
Table 4-6 Specification of deployed ships between PICs and Far East
PICs – Singapore Route 3)
Table 4-8 and Figure 4-5 shows container shipping route between PICs and Singapore. Swire operates the route and deploys four vessels. Voyage duration is 60 days. The ships call 24 times per year but only call Suva and Lautoka in Fiji among ports in PICs. Suva is in fact a hub port in PICs for Singapore.
Table 4-7 Operators and its service between PICs and Singapore
Grosstonnage
17,134t Grosstonnage
18,174t
Length 161.0m Length 151.0mBeam 25.0m Beam 25.0mDraft 7.6m Draft 8.0mTEU 912TEU TEU 966TEU
Cargogear
2×40tcranes
Cargogear
2×40tcranes
Ramp equipped Ramp equipped
Pacific IslanderⅡ Tropical Islander
Grosstonnage
18,174 t Grosstonnage
17,111 t
Length 161.0m Length 161.0mBeam 25.0m Beam 25.0mDraft 8.0m Draft 7.7mTEU 966TEU TEU 914TEU
Cargogear
2×40tcranes
Cargogear
2×40tcranes
Ramp equipped Ramp equipped
South Islander Coral IslanderⅡ
SERVISE ROUTEVOYAGE
DURATION
(Shipping Company) (Number of callsin a year)
Pacific Nanigator
Tasman Endevour
(Swire) Ningpo (24)
Ninghai
Total (24)
JURONG - JAKARTA-PORT MORESBY-NOUMEA-LAUTOKA-SUVA-TAURANGA-AUKLAND - LAE - DAVAO - JURONG
SINGAPORE/FIJI/NEWZEALAND 60days
VESSEL PORT OF CALL
note:Voyage duration indicates for full circle.

Data Collection Survey on Reverse Logistics in the Pacific Islands
108
Figure 4-5 Shipping route between PICs and Singapore
PACI
FIC
NAV
IGAT
OR
TASM
ANEN
DEV
OU
RN
ING
PON
ING
HAI

Data Collection Survey on Reverse Logistics in the Pacific Islands
109
Four container ships are serving in the route of which gross tonnages of deployed vessels are 16,175 GT to 18,451 GT. The ships capacities are varying from1,258 TEUs to 1,728 TEUs. A typical vessel, for instance, MV Tasman Endevour, is 184.9 meters in length, 10.588 meters in draft, 1,257 TEUs capacity and equipped with two 26 and 35 ton cranes. Drafts of these ships are more than 10 meters in depth.
Table 4-8 Specification of deployed ships between PICs and Singapore
PICs – the USA Route 4)
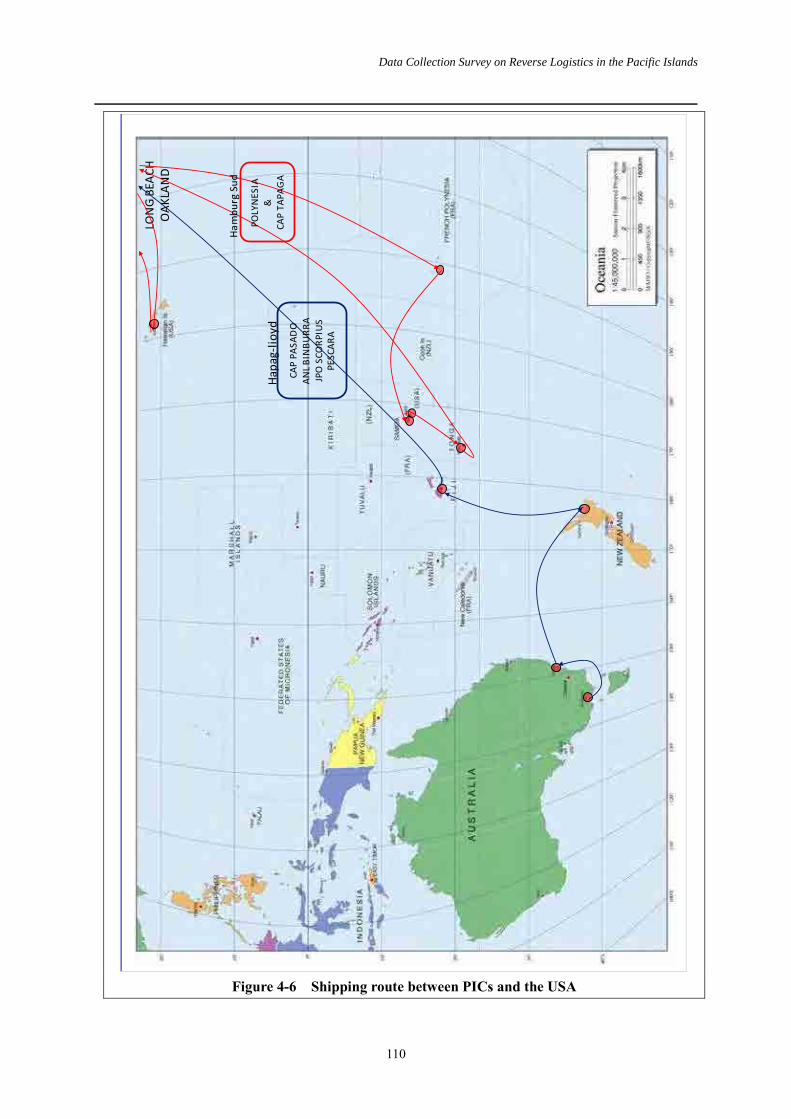
Figure 4-6 and Table 4-9 shows container shipping routes between PICs and the USA. Hamburg Sud and Hapag Lloyd are operating the routes with six ships. Hamburg Sud operates Hawaii, USA, Samoa, Tonga and USA route with 30 days voyage, and Hapag Lloyd operates Australia, NZ, Fiji and USA route with 60 days voyage respectively. The ships call 36 times in a year. Long Beach and Oakland are base ports on the USA west coast.
Grosstonnage
16,175t Grosstonnage
18,451t
Length 184.7m Length 184.9mBeam 25.3m Beam 27.6mDraft 10m Draft 10.588mTEU 1728TEU TEU 1257TEU
3×35t2×26t
Ramp none Ramp none
Pacific Navigator Tasman Endevour
Cargogear
Cargogear
3×45tcranes
Grosstonnage
16,801t Grosstonnage
16,802t
Length 183.9m Length 184.7mBeam 25.3m Beam 25.3mDraft 10.0m Draft 10.0mTEU 1,728TEU TEU 1,728TEU
Ramp none Ramp none
3× 45tcranes
Ningpo Ninghai
Cargogear
3× 45tcranes
Cargogear
Data Collection Survey on Reverse Logistics in the Pacific Islands
110
Figure 4-6 Shipping route between PICs and the USA
LON
G BE
ACH
OAK
LAN
D
POLY
NES
IA&
CAP
TAPA
GA
Hapa
g-lio
yd
Ham
burg
Sud
CAP
PASA
DO
ANLB
INBU
RRA
JPO
SCO
RPIU
SPE
SCAR
A

Data Collection Survey on Reverse Logistics in the Pacific Islands
111
Table 4-9 Operators and its service between PICs and the USA
Table 4-10 shows specification of deployed ships between PICs and the USA. Six container ships are serving in the route of which gross tonnages of deployed vessels are 12,029 GT to 28,372 GT. Ships’ capacities are varying from 1,122 TEUs to 2,742 TEUs. A typical vessel, for instance, MV Cap Pasado, is 221.6 meters in length, 11.1 meters in draft, 2,742 TEUs capacity and equipped with three 45 ton cranes. Drafts of these ships range from 9m to 12m in depth. Compared to the ships deployed in Australia, New Zealand route, the ship for the USA route is larger. Long voyage requires large ships for navigation.
Table 4-10 Specification of deployed ships between PICs and the USA
SERVISE ROUTEVOYAGE
DURATION
(Shipping Company) (Number ofcalls in a year)
HAWAI/USA/SAMOA/TONGA/USA Cap Tapaga 30days
(Hamburg Sud) Polynesia (12)
JPO Scorpius
Cap Pasada
ANL Binburra (24)
PescaraTotal (36)
HONOLULU - SEATTLE - LONG BEACH -OAKLAND - PAPEETE - APIA - PAGOPAGO - NUKU'ALOFA - LONG BEACH -OAKLAND - HONOLULU
AUSTRALIA/NEWZEALAND/
FIJI/USA
VESSEL PORT OF CALL
MELBOURNE -SYDNEY- TAURANGA -SUVA - OAKLAND - LONG BEACH -AUCKLAND - MELBOURNE
60days
(Hapag-lioyd)
note:Voyage duration indicates for full circle.
Grosstonnage
15,636t Grosstonnage
12,029 t
Length 161.4m Length 157.1m
Beam 25.0m Beam 23.5mDraft 9.9m Draft 9.3mTEU 1,304TEU TEU 1,122TEU
Cargogear
2×45tcranes
Cargogear
2×45tcranes
Ramp none Ramp none
Polynesia Cap Tapaga

Data Collection Survey on Reverse Logistics in the Pacific Islands
112
(2) Maritime Freight
Maritime freight rate is set by private negotiation, and mainly depends on the volume and frequency of cargoes. Furthermore, vessel capacity and cargo demand is a key factor for deciding the freight rate. That is why the freight rate is said to be confidential. The team conducted a survey on the freight rate to shipping agents and shipping companies in PICs. According to the survey, the shipping companies are suffering an imbalance of import/export. The share of import is said to be between 75% and up to over 90% of the total cargoes. They are offering a lower rate on exports to address the imbalance. The freight rates that we obtained from the shipping agents and companies are summarized below. Freight rate per 20ft container from Australia, NZ to PICs is US$1,000 to US$3,000. If cargoes are transhipped in Suva, the rate increases to over US$4,000. On the other hand, freight rate from PICs to Australia and NZ is from US$650 to US$2,500. Freight rate per 20ft container from the Far East to PICs is US$3,000, while that from PICs to the Far East is US$1,500 to US$2,000. The freight rate of exports is half to two-thirds that of imports.
Grosstonnage
28,372t Grosstonnage
25,535t
Length 221.6m Length 207.4mBeam 29.8m Beam 29.8mDraft 11.1m Draft 11.6mTEU 2,742TEU TEU 2,466TEU
Cargogear
3× 45tcranes
Cargogear
3×45tcranes
Ramp none Ramp none
Cap Pasado ANL Binburra
Grosstonnage
26,350t Grosstonnage
35,697t
Length 210.0m Length 231.0m
Beam 30.1m Beam 32.2mDraft 11.5m Draft 12.0mTEU 2,602TEU TEU 3,554TEU
Cargogear
4×45tcranes
Cargogear
none
Ramp none Ramp none
JPO Scorpius Pescara

Data Collection Survey on Reverse Logistics in the Pacific Islands
113
Table 4-11 Freight rate in each route from/ to the PICs (unit: $US per 20ft container)
Next, team compared the freight rate in PICs with that in major routes in the world. Table 4-12 shows freight rate for major trade routes in the world. The freight rate from South China to USWC (US west coast) is US$2,100, while that from USWC to South China is US$670. This difference means that more cargoes flow from China to the US than vice versa. The same trend is found in other routes; South China - USEC, South China - UK, UK- USEC. Freight rate per 40ft container is US$670 to US$2,760 in the major world routes. The freight rate of a 20ft container is said to be approximately 60 % that of a 40ft container. If this ratio is applied, the freight rate per 20ft container in the major routes would be US$ 402 to US$1,656. This value includes terminal handling charges at origin and destination.
On the other hand, freight rate per 20ft container from/ to PICs is US$650 to US$3,000 (see Table 4-11). These numbers exclude terminal handling charges at origin and destination ports. This comparison shows that the freight rate in PICs is higher than that in world major routes. Serious imbalance of cargo volume, small volume of cargo, poor port facility and difficulty of formation of hub-spoke network are the causes of the higher freight rate.
Route Freight rate in March 2012Australia,NZ to PICs 1,000 - 3,000 Australia,NZ to PICs (Fiji Tranship) over 4,000PICs to Australia,NZ 650 - 2,500Far East to PICs 3,000PICs to Far East 1,500 - 2,000Singapore to PICs N/APICs to Singapore 1,500 - 3,000
Note:(a) Actual freight rate is confidential. The rate is set through privatenegotiation between a shipping company and shipper and mostly dependson the volume, frequency of shipping cargoes.(b) BAF(Bunker Adjustment Factor) is included. Terminal handlingcharges at origin and destination port are not counted.(c)The JICA study team rougly summarized transportation cost based onshipping company and shipper interviews in five countries.

Data Collection Survey on Reverse Logistics in the Pacific Islands
114
Table 4-12 Freight rate benchmarks (spot market) for major trade routes, “All-in” (US$ per 40ft containers)
Scrap metal is actually collected and shipped from Vanuatu to Korea now. The team explored the share of marine transportation cost in producing recycling materials (see Table 4-13).Selling price of scrap metal in the global market is said to be US$350 per ton. If scrapped metal is collected, sorted into a standard size, packed into containers and shipped to the destination, following costs should be counted. Selling price of metal metal is US$7,000 per 20ft container. On the other hand, its marine transport and terminal handling charges would be US$2,180 per 20ft container. Even though collecting fee, sorting labor cost, and land transportation cost should be counted, we can assume that share of water transportation cost is at most 31% of producing and shipping scrap metal from PICs to the Far East. On the other hand, selling price of base metal and precious metal are much higher than that of scrap metal (see Table 4-14). Recycling these metals would be more viable assuming collection and sorting fee are the same as scrap metal.
Table 4-13 Case study of fee (tentative)
Route Freight rate in March 12South China to USWC US$2,100USWC to South China US$670South China to USEC US$3,290USEC to South China US$1,670South China to UK US$2,760UK to South China US$1,280UK to USEC US$2,360USEC to UK US$1,320
Sourece: Drewry Container Freight Rate Insight
Note: All-in rates include base rate, BAF, other surcharges andterminal handling charges at origin and destination
Work Fee Value(US$/TEU) ShareCost Collection and Sort scrap collecting fee N/A
N/ATransportation cost Inland freight N/A
1,600Terminal handling charge Port in pacific Islands (PortVila) 506 31%
Port in Far East (Busan) 74Total 2,180+α
Income Scrap metalScrap metal 7,000 100% 350
Note: Selling price of Scrap metal is US$350 per ton.
Vanuatu - Far East
sort scrapand pack in container
water freight(Pacific Islands - Far East)
US$ per ton

Data Collection Survey on Reverse Logistics in the Pacific Islands
115
Table 4-14 Selling price of base metal
Figure 4-7 shows selling price of scrap metal in Tokyo for the last 8 years. In the beginning of 2004, the price of scrap metal was relatively stable, fluctuating between JPY 10,000 to 20,000 per ton. However, in late 2006 the price started to increase and reached JPY 60,000 per ton in July 2008. This huge surge in price was due to a shortage of metal when the Beijing Olympic games were held in August 2008. The price dropped to JPY 4,000 per ton just after the games, and has been ranging between JPY 20,000 to 30,000 per ton recently. This means that the price is changeable depending onworld market.
(Source: Sangyo Press, Japan)
Figure 4-7 Selling price of scrap metal in Tokyo, Japan
(3) Quarantine at a destination port
When importing recycling materials, the materials are subjected to quarantine inspection. A
US$ per ton US$ per TEUSteel 350 7,000Copper 8,043 160,860Lead 2,094 41,880Zinc 1,981 39,620Nickel 19,815 396,300
Source: Steel: Team interviewed a recycling agent in NZCopper, Lead, Zinc,Nickel: data from Japan Oil, Gas and Metals National Corporation
Selling Price

Data Collection Survey on Reverse Logistics in the Pacific Islands
116
consignor has to meet quarantine requirements at a destination port. Many recyclable materials tend to be exposed to the elements and thus it will be necessary to remove biosecurity contaminants in the processing stage. Precise information on quarantine regulations is necessary for exporters of recycling materials in PICs.
Quarantine regulations in New Zealand where many of the recycling materials are imported from PICs are as follows. Importing scrap metals are designated as inorganic risk materials (IRMs) in Biosecurity in New Zealand. The import health standard states the minimum legal requirements that must be met at the port of first arrival and at transitional facilities when importing full containers of the IRMs from any country into New Zealand. All containers of the IRMs must be clean and free of regulated biosecurity contaminants and pests (or meet the threshold specified under Table 4-15). Scrap metal for recycling is categorized as IRMs. Table 4-16 shows mandatory treatment and MAF inspection requirement on scrap metal. Furthermore, information relating to IRM consignments must be received by the Ministry of Agriculture and Forestry (MAF) prior to arrival. This includes: (1) Commodity type. (2) Port of origin. (3) Shipment details (for example vessel, consignee, container number, treatment certification (if conducted offshore and prior permission was obtained from MAF).
In addition, consignments of IRMs (less than a container load) inside mixed consignment containers and in/on flat-rack containers, open sided or open top containers and pallets are prohibited from entering NZ. If these consignments arrive at the NZ boarder they will be held, re-shipped to origin or treated unless prior written agreement from MAF was provided permitting importation.
Table 4-15 Threshold levels for biosecurity contaminants and other contaminants Regulated Biosecurity / Other Contaminant Type Per IRM Consignment
Animal materials or by-products (biosecurity risk materials) Prohibited
Arthropods & Molluscs – dead (biosecurity risk materials) Unlimited permitted
Plant Material - dead / desiccated (biosecurity risk materials)1 5 pieces(<20cm) are permitted only
Plant Material – fresh / green including seeds (biosecurity risk
materials)1
Prohibited
Dust/Gravel/film/Sand (including no biosecurity risk material) Unlimited permitted
Soil (risk material) 20 grams only permitted
Water Prohibited unless treated on arrival
Wood Prohibited unless ISPM 15 compliant
1.Includes fruit, leaves, twigs, bark, etc
Table 4-16 Mandatory treatment and MAF inspection requirements (abstract) Category Treatment Inspection Requirement at the port of first arrival
(POFA) or at transitional facilities (TF)
Scrap metal Fumigation or heat treatment at POFA
within 12 hours of arrival
6-sides inspection at the POFA, then scrap metal
inspection within 4 hour of TF unloading.

Data Collection Survey on Reverse Logistics in the Pacific Islands
117
4.1.3 Summary
There is heavy dependency on the import of consumer goods in the PICs. Various commodities, food, machines, clothes and transportation vehicles are imported but few cargoes, only first industry production, sugar, fish and copra are export commodities. Fiji, the largest exporter of PICs, exports one-fourth of the import value. The ratios of the other countries are less than that of Fiji. It was also found that recycling materials are new export commodities in PICs. Recycling consumers exist in the Pacific region such as Korea, China, Vietnam and Indonesia. Japan still imports scrap metal even though it is major scrap metal export country.
PICs are connected to the developed countries where final recycling consumers are found. There are four major shipping routes. One is from PICs to NZ and Australia. There is a heavy traffic between PICs and NZ, Australia. Second is to the Far East. Kyowa and its partners operate services 21 times per year. They deploy multi-purpose vessels tailored for ports in PICs with shallow water, poor port facilities and a few but various cargoes. The third is to Singapore. SWIRE operated the only direct line to Juron, Singapore 24 times per year. Deployed vessels are container ship with 1,200 to 1,700 TEU capacities. The fourth is for US. Hamburg Sud and Hapag-Lloyd operate direct connection to the US west coast by container vessels with 1,200 to 2,700 TEU capacities.
Freight rate in PICs is higher than that in the major world route. Shipping companies provide a lower price for export than that for import to encourage export in PICs as they do in the major world routes. After conducting a case study of recycling cost, the team assumes that share of water transportation cost was at most 31% of producing and shipping scrap steel from PICs to the Far East. In addition, selling price of base metal and precious metal are much higher than that of scrap metal. These metals would be more viable. The export of scrap metal is viable under present market conditions as we mentioned before. However, the selling price of scrap metal depends on the global market; in addition, domestic freight rate will be added to the selling price when it is transported from local islands. Accordingly, future prospects are not known.
Recycling materials are subjected to quarantine inspection in importing ports. A consignor has to meet quarantine requirements at a destination port. Many recyclable materials tend to be exposed to the elements and thus it will be necessary to remove biosecurity contaminants in the processing stage. Precise information on quarantine regulations is necessary for exporters of recycling materials in PICs.
4.2 Domestic maritime network
Each PICs consists of many islands, and some of them are far away from the mainland. The dispersed and distant islands make it difficult to collect and transport recycling materials. In this section, we will examine the domestic shipping network, freight rate and port conditions and present recycling materials transport in PICs.

Data Collection Survey on Reverse Logistics in the Pacific Islands
118
4.2.1 Fiji
Fiji consists of 322 islands, of which 106 are inhabited. Total population is 860,000. There are two major islands; Viti Levu and Vanua Levu, which together account for approximately three-quarters of the total land area of the country. Other islands and island groups include Taveuni and Kandavu (the third and fourth largest islands respectively), the Lomaiviti Group, off Suva, and the remote Lau Group. Viti Levu hosts the capital city of Suva, and nearly three quarters of the population live here.
(1) Ships and routes for domestic transport
Viti Levu is the mainland of Fiji, hosting two international ports; port of Suva and port of Lautoka and a domestic port of Natovi. Second largest island, Vanua Levu has two major domestic ports; Savusavu and Nabouwalu. Fiji’s domestic shipping routes are extending to remote islands and groups from Viti Levu and Vanua Levu. Major private companies are providing the following routes as illustrated below (see Figure 4-8).
Figure 4-8 Major domestic routes in Fiji
A total of 647 RORO vessels called Fiji Ports in 2010. RORO vessels transported 1,162,880 GRT while the total domestic volume is 1,555,927 GRT. This shows that the RORO vessels play an important role in marine domestic transportation.

Data Collection Survey on Reverse Logistics in the Pacific Islands
119
Table 4-17 Vessel in Fiji ports (2010)
Source: Fiji Ports Corporation
Government Shipping Service (GSS) which is belong to Ministry of Works, Transport and Public Utilities and nine private shipping companies are operating cargo transportation in Fiji as listed below (See Table 4-18).
Table 4-18 Shipping company and its service routes
(Hearing from Shipping companies in Fiji)
RORO ships are very popular for marine transportation in Fiji Suva. Natovi, Levuka, Kadau and Savusavu are major domestic ports which can accommodate RORO ships.(see Figure 4-9 and Figure 4-10). However, barges are used in small islands and island groups where deep draft ships cannot enter. Information on direct RORO ship entry ports was not obtained in the survey.
GSS owns a RORO ship and four general cargo vessels. They are serving remote and less populated island routes where large revenues cannot be expected and thus receive government financial support. GSS transported 2,882 tons of cargoes outward and 144 tons of cargoes inward in 2009. According to a representative of GSS, recycling material cargo has not been transported.
Vessel type Number GRTForeign vessel 1,516 12,456,706 RORO/passenger 647 1,162,880 Conventional/passenger 556 126,770 Fishing/Others 2,848 266,277Local sub-total 4,051 1,555,927Total 5,567 14,012,633
Shipping company Route ShipPatterson Brothers Shipping Natovi - Nabouwalu - Levuka FerryVenu Shipping Ltd Suva - Kadavu - Levuka ROROGounder Shipping Suva - Savusavu - Taveuni N/ABligh Water Shipping Lautoca - Suva - Natovi - Savusavu N/AKelton Group Natovi - Nayau N/ALau Shipping Suva - Lau group ( Lakeba - Nayau - Vanua Balavu - Cicia - Vanua Vatu ) N/ASeaview Shipping Suva - Lomaiviti group (Gau - Bakiraki - Naviti - Moala -Totoya - Matuku -Levuka -Natovi) N/ACruz Holding Suva - Taveuni - Savusavu N/AConsort Shipping Suva - Savusavu - Taveuni Ferry
Suva-Gau FerrySuva- Naitaba - Mago, gourps Barge
Government Shipping Services Suva-small islands and groups Ferry/Barge

Data Collection Survey on Reverse Logistics in the Pacific Islands
120
Figure 4-9 A ferry boat accommodating containers, automobiles, trucks and
passengers (domestic terminal in Suva)
Figure 4-10 A truck boarding a RORO ship (domestic terminal in Suva)
(2) Ports
The Ministry of Works, Transport and Public Utilities holds jurisdiction over ports, and marine transport, while the Fiji Ports Corporation operates six ports (Suva, Lautoka, Malau, Levuka, Wairiki and Rotuma). The total volume of trading is 2,005,072 tons for import and 1,439,115 tons for export, totaling 3,444,187 tons in 2010. Within this volume, the container volume is 1,748,326 tons or 86,863 TEU while include 959,557 tons for import and 788,769 tons for export.
Table 4-19 Fiji's container trading volume (ton)
2007 2008 2009 2010
Import 962,157 t 1,004,013 t 898,347 t 959,557 t
Export 788,687 t 745,382 t 642,109 t 788,769 t
Total 1,750,844 t 1,749,395 t 1,540,456 t 1,748,326 t
(Source: Fiji Ports Corporation)
Note: Fiji exported 8,663 tons (equivalent to 433 TEU) of recycled materials in 2011 according to customs statistics. According to the interview survey with recycling contractors, they export 20 TEU of recycled materials per month (240 TEU or 4,800 tons per year).
The current status of the Port of Suva and Port of Lautoka, which are international ports of Viti Levu Island, and major ports of the neighboring islands Vanua Levu and Kadavu are described below.
Port of Suva 1)a) Outline of Port of Suva

Data Collection Survey on Reverse Logistics in the Pacific Islands
121
Figure 4-11 Entire view of Port of Suva
b) Port of Suva Container TerminalThe quay layout of the Suva Terminal is shown in Fig. 4-14. The total length of the quay is 845 m,
including 495 m for Kings wharf, 165 m for Princes wharf, and 185 m for Walu Bay wharf. The depth is 11 m for all of them. The total area of the terminal is 8.0 ha. The cargo of container vessels is mainly handled in the 330 m long section of Kings Central and Kings North.
Figure 4-12 Layout of Suva Container Terminal
Table 4-20 Major port facilities of Suva Container TerminalPort facility Length(m) Depth(m)
Kings wharf 495m 11m
Princes wharf 165m 11m
Walu Bay wharf 185m 11m
Internationalport
Domestic port

Data Collection Survey on Reverse Logistics in the Pacific Islands
122
Terminal area 8.0ha
Container yard area 2.5 ha
Capacity 2,500TEU
The container yard covers an area of 2.5 ha. The cargo handling equipment includes two 100-ton tire type wharf cranes, two 32-ton trip lifters, and four 25-ton trip lifters. Because there are no straddle carriers, trailers are used to transport cargo within the yard.
Table 4-21 Major cargo handling equipment at Suva Container TerminalMajor cargo handling equipment Number
Mobile crane(100 tone) 2
Top lifter(32 tone) 2
Top lifter(25 tone) 6
Fork-lift(20 tone) 2
Yard tractor(40 feet) 3
Yard tractor(20 feet) 3
As shown in Figure 4-13, the yard layout of Suva container terminal has two mobile cranes, Amigo and Mika, at the front of the wharf, and yard tractor cranes operate clockwise on a one-way route. The slot layout is six slots by two or three rows and ten slots by two to four rows.
Figure 4-13 Yard layout of Suva Container Terminal

Data Collection Survey on Reverse Logistics in the Pacific Islands
123
The annual number of container handled in 2011 was 52,254 TEU. The breakdown is 35,340 20-ft containers and 7,957 40-ft containers, and 80% of the total volume was occupied by 20-ft containers. Imports are far greater than exports with 28,409 TEU for imports and 17,823 TEU for exports. The port also handles transshipment cargo, which was 5,022 TEU in 2011.
Table 4-22 Container trading volume at Suva Container Terminal in 2011 2011 20 feet(box) 40 feet(box) TEU
Import 18,461 4,974 28,409
Export 12,839 2,492 17,823
Tranship(Import) 1,639 214 2,067
Tranship(Export) 2,401 277 2,955
TOTAL 35,340 7,957 52,254
The total number of vessels that called at this port in 2011 was 277 including 261 container vessels, 2 car ferries, and 14 bulk cargo vessels. The terminal operation company said the Port of Suva was congested since there are only two container berths actually available.
Table 4-23 Vessels berthed at Suva Container Terminal in 2011 Number of ship visits 2011
Container 261
Car carrier 2
Bulk carrier 14
c) Survey on the current status of the cargo handling capability of Suva Container Terminal
The status of cargo handling at Suva Container Terminal was investigated by visual observation of four container vessels and counting the number of containers handled per hour. The survey was conducted in three days, Sept. 22, 23 and 28 in 2012.
i) Visual observation result Container handling is conducted round-the-clock by three teams in three shifts from 0:00 to 8:00,
8:00 to 16:00, and 16:00 to 24:00. Work is cancelled when it rains. The results of visual observation are summarized in Fig. 4-14, 4-15, and 4-16.

Data Collection Survey on Reverse Logistics in the Pacific Islands
124
Figure 4-14 Shipboard crane handling 20-ft containers
Figure 4-15 Handling of 40-ft containers on the deck
Figure 4-16 Cargo handling with a wharf crane
20-ft containers are handled with ship gear (shipboard crane) and a spreader. This procedure is poor in container stability during loading and unloading and is also time-consuming.
Containers handled only with ship gear with no spreader. This work lacks stability and is time-consuming. When handling filled 40-ft containers, the vessel itself can greatly careen because of the moment of the containers.
Cargo handled with two shore cranes. This procedure ensures greater efficiency than use of ship gear but is said to only be capable of handling up to about 20 containers per hour. One of them was out of order.
ii) Results of cargo handling capacity survey
The number of containers handled per hour was counted for four container vessels. Changes in the number of containers handled per hour for the containers surveyed are shown in Figs. 4-19, 4-20, 4-21 and 4-22. The number of containers handled and the specifications of the container vessel are shown in Tables 4-25 to 4-28. Two cranes handled the cargo of all vessels.
Every survey shows a wide variety in the number of containers handled per hour, which means cargo handling was not stable. The average number of containers handled per hour is 6.8 for Scelde Trader, 14.8 for South Islander, 8.4 for ANL BinBura, and 11.3 for Reef Samoa, and the total average is 10.3. The maximum number of containers handled is 11 for Scelde trader, 24 for South Islander, 17 for ANL BinBura, and 19 for Reef Samoa, and the total average is 17.8. When cargo is handled with a deck crane, cargo is hoisted with a single wire, not in a four-point hoisting style, and therefore the container itself greatly swings during hoisting. Thus, a lot of time is spent on the loading and unloading of these containers. Container vessels that call in the port are not particularly large. Given their size, these vessels sway and roll more while containers placed on the quay are being stacked aboard with a shipboard crane. Excessive motion of a ship creates various risks; the safety of cargo handling workers may be compromised, container casings may be damaged due to the containers bumping into each other, or the cargo inside containers may be damaged. The terminal operator pointed out insufficiency in maintenance of cargo handling machinery claiming that shore cranes are more efficient than shipboard cranes but cannot perform to their full potential because of frequent failures or because spreaders, which are designed to ensure stability of crane hoisting in a single-point suspension, often fail.

Data Collection Survey on Reverse Logistics in the Pacific Islands
125
The general understanding about the cargo handling efficiency of a tire-type crane is that one crane can handle about 20 containers per hour. Now that two cranes have been installed, there should be more room for efficiency improvement considering the present cargo handling results. It is also necessary to improve the operating rate of shore cranes and spreaders. Improvement in maintenance skills for cargo handling machinery is also required. The hinterland of the port is occupied by management offices and warehouses. If a procesing facility and /or dedicated yard for recyclable materials is set up in the port area in the future, appropriate measures should be taken accordingly such as revision of the terminal layout and improvement of the cargo storage capacity. ①Vessel: Scelde Trader; survey date: Sept. 22, 2012
Figure 4-17 Changes over time in the number of containers handled (Scelde Trader)
Table 4-24 Handled container survey results and container vessel specification (Scelde Trader)
②Vessel: South Islander; survey date: Sept. 23, 2012
02468
1012
Load:20ft containerLoad:40ft containerTotal
05
1015202530
Load:20ft containerLoad:40ft containerUnload:other cargoTotal
Total handling number 61 box Vessel Scelde Trader
Average handling number 6.8 box per hour Length 132.60m
The maximum handling number 11 box per hour Draft 7.20m
The minimum handling number 3 box per hour TEU 660 TEU
The number of cranes 2 ship crane Cargo gear 2×50t cranes

Data Collection Survey on Reverse Logistics in the Pacific Islands
126
Figure 4-18 Changes over time in the number of containers handled (South Islander)
Table 4-25 Handled container survey results and container vessel specification (South Islander)
③Vessel: ANL BinBura; survey date: Sept. 28, 2012
Figure 4-19 Changes over time in the number of containers handled (ANL BinBura)
Table 4-26 Handled container survey results and container vessel specification (ANL BinBura)
④Vessel: Reef Samoa; survey date: Sept. 28, 2012
02468
1012141618
Load:20ft containerLoad:40ft containerUnload:20ft containerUnload:40ft containerUnload:other cargoTotal
Total handling number 74 box Vessel South Islander
Average handling number 14.8 box per hour Length 161.0m
The maximum handling number 24 box per hour Draft 8.0 m
The minimum handling number 6 box per hour TEU 966 TEU
The number of cranes 2 ship crane Cargo gear 2×40t cranes
Total handling number 59 box Vessel ANL BinBura
Average handling number 8.4 box per hour Length 207.4m
The maximum handling number 17 box per hour Draft 11.6 m
The minimum handling number 2 box per hour TEU 2,466TEU
The number of cranes 1 ship crane
+ 1 mobile crane
Cargo gear 3×45t cranes

Data Collection Survey on Reverse Logistics in the Pacific Islands
127
Figure 4-20 Changes over time in the number of containers handled (Reef Samoa)
Table 4-27 Handled container survey results and container vessel specification (Reef Samoa)
Port of Lautoka2)Like the Port of Suva, the Port of Lautoka is also located in Viti Levu Island and is Fiji's second
largest container port. The major quay specifications are 299 m in total length and 11 m in depth, while the domestic port's quay specifications are 78 m in total length and 7 m in depth. Behind the port are located many factories including a sugar manufacturing factory and chip factory.
Figure 4-21 Entire view of Port of Lautoka
0
5
10
15
20
Load:20ft containerLoad:40ft containerTotal
Internationalport
Domestic port
Total handling number 34 box Vessel Reef Samoa
Average handling number 11.3 box per hour Length 109.4 m
The maximum handling number 19 box per hour Draft 5.8 m
The minimum handling number 3 box per hour TEU 519TEU
The number of cranes 2 ship cranes Cargo gear 2×40t cranes

Data Collection Survey on Reverse Logistics in the Pacific Islands
128
Table 4-28 Specifications of major port facilities of Port of Lautoka Port Wharf Length(m)) Depth(m) Remarks
Lautoka International 299 11
Domestic 78 7
(Source: Fiji Ports Corporation)
Ports on Neighboring Islands (Vanua Levu) 3)Covering an area of about 5,587 km2 and having a population of about 130,000, Vanua Levu
Island is Fiji's second largest island after Viti Levu, where Fiji's capital is located. The largest city on this island is Labasa, which has a population of about 27,000 and is the country's second largest sugar producing town. The second largest city is SavuSavu, a tourist spot.
An integrated marine and land intermodal transport is fully established between Labasa, the central city of Vanua Levu, and Suva in Viti Levu. That is to say, one can travel between Suva and Labasa on an express bus. The route of this service is as follows:
4:30 am: Departure from Suva bus terminal 6:30 - 7:00 am: Departure from Natovi Jetty, northeastern part of Viti Levu, on a ferry 11:00 - 11:30 am: Departure from Nabouwalu Jetty, southwestern part of Vanua Levu, again on a
bus by land 3:30 - 4:00 pm: Arrival at Labasa This land route is also connected to the bus route to the island's second largest town SavuSavu.
Express bus service is also available from Labasa to Suva, with a bus departing from Labasa at 6:30. The express bus service is operated once per day from Monday to Saturday (no service on Sundays). The major transportation operators are all private companies, namely Patterson Brothers Shipping, which operates the ferry service, and Seaboard, which operates the express bus service.
There are three ports on Vanua Levu, the Ports of Nabouwalu, SavuSavu and Labasa. These ports are managed by the Maritime Safety Agency of Fiji, an organization under the Ministry of Works, Transport and Public Utilities. Natovi Jetty, which is located in the main island of Fiji, and jetties of Nabouwalu, SavuSavu and Labasa in Vanua Levu island are explained below.
①Natovi Jetty A Ro-Ro ramp and a small landing craft ramp are developed on both sides of the jetty. This jetty
is located in a place susceptible to waves as no breakwater is constructed off the port. Although some parts of the road from Suva to Natovi Jetty are unpaved, the trunk road connects these two points, a trip which takes about two hours by express bus.

Data Collection Survey on Reverse Logistics in the Pacific Islands
129
Figure 4-22 Natovi Jetty before arrival of a ferry
Figure 4-23 Natovi jetty when a ferry arrived
The jetty is 40 m long and 4 m wide. Ferryboats are moored to the front ramp and tires are used instead of fenders.
This ferry, named the Spirit of Harmony, is a used ferry from Japan. It was previously known as Ferry Sazan.
Figure 4-24 Express bus connecting Suva and SavuSavu
Figure 4-25 Mooring of the ferry to Natovi Jetty
This bus is bound for Labasa, the central city of Vanua Levu, and it connects to another bus bound for SavuSavu along the way to Labasa.
The ferry is longer than the mooring facility, so the concrete mooring post at the tip of the jetty plays an important role.
②Nabouwalu Jetty This jetty is about 100 m in total length and about 10 to 20 m in width. No breakwater is
constructed, but the flow of water is gentle. The facility is managed by the local office of the Maritime Safety Authority of Fuji (MSAF) on Vanua Levu Island. Although there is direct access from Nabouwalu Jetty by express bus on a ferry to the island's central city Labasa, about half the route is unpaved, and it takes about four hours.

Data Collection Survey on Reverse Logistics in the Pacific Islands
130
Figure 4-26 Entire view of Nabouwalu Jetty
Figure 4-27 Ferry arrived at Nabouwalu Jetty
Seen on the ferry deck are many express buses, which directly head for Suva, as well as many cars and passengers. This ferry service mainly carries passengers.
The mooring system used here is longitudinal mooring that connects the rear part of the ferry to the jetty and uses an anchor only to fix the front of the boat.
③SavuSavu Jetty This jetty is located in the southern central part of Vanua Levu. It has a Ro-Ro ramp and a recently
improved mooring jetty. Ro-Ro ship (carrying a mixture of vehicles and passengers) service connecting to the Port of Suva is operated four times a week by two private shipping companies. Metal Scrap metals are shipped out in the open box of a truck four or five times a week.
Figure 4-28 Ramp of SavuSavu Jetty to which Ro-Ro boats are moored (longitudinal
mooring)
Figure 4-29 Newly constructed mooring jetty at SavuSavu Jetty
④Labasa Jetty There is a small jetty along a river flowing through the island's central city Labasa. The jetty is
located in the compound of the MSAF that operates the jetty. No large ships such as Ro-Ro ships use the jetty. It is only used to moor small ships and service boats. In the neighborhood are sugar factories and fertilizer factories, and Labasa Jetty is dedicated to the shipping of products from those factories. But we were told that a plan to construct a jetty for international trade at Labasa is under consideration.

Data Collection Survey on Reverse Logistics in the Pacific Islands
131
Figure 4-30 Entire view of Labasa Jetty
Figure 4-31 Office building of MSAF
Ports on Neighboring Islands: Kadavu Island 4)Kadavu Island, the third largest island of Fiji after Viti Levu and Vanua Levu, has a population of
10,167 and covers an area of about 411 km2 (compare to Awaji Island with a population of 140,000 and an area of 592 km2). Although there are about 250 settlements scattered across the island, there is no concentration of population in the form of a town or village. The administration office and hospital are located at a place called Vunisea. Kadavu is situated about 90 km south of Suva.
Venu Shipping operates a seaway line that leaves Suva and returns to Suva after visiting Kabulelevu-I-Ra, Vunisea and Kavala on Kadavu Island. The ship leaves Narains Wharf, Walu Bay, Suva, for Kadavu every Tuesday for a sailing time of 24 hours.
Figure 4-32 Mooring to the
buoy (Kabukelevu-I-Ra area)
Figure 4-33 Vunisea Jetty
Figure 4-34 Kavala Jetty
There is no quay. Ships are moored to a buoy in the water, and cargo is reloaded onto a small boat for transport to land. A boat is lifted off of the ship, and the personnel on the boat connect the mooring cable to the buoy.
Although the jetty was newly constructed by the government, it is subject to oceanic waves. Therefore, cargo handling is difficult when there are waves. In addition, the jetty suffers scouring.
It is a good port facing an estuary. There are no access roads or warehouses.

Data Collection Survey on Reverse Logistics in the Pacific Islands
132
Figure 4-35 Cargo and passenger during landing at Kavukelevu-I-Ra area
Figure 4-36 Mooring at Vunisa Jetty
Figure 4-37 Mooring at Kavala Jetty
The jetty has no quay. Ships anchor offshore, and cargo and passengers are reloaded for disembarking or embarking. Cargo handling work is prevented when waves occur due to the tidal current. Vessels call to this port once a month.
Cargo is transported on trucks to local settlements after being unloaded from the vessel. This jetty was relocated to the mouth of the bay, where reefs are distributed in the nearby waters. Since there are no navigation signs, vessels are forced to take this dangerous seaway.
No access roads are properly developed. Manual labor is used for loading and unloading.
Sinu-I-Wasa (ferry-cum-freighter) operated by Venu Shipping is a 1,481 GT (1,053 DWT) vessel.
Cargo handled by the vessel mainly includes bulk loads such as building materials, foodstuffs (canned foods, grains and edible oil), and fuel consumed in the island. Unit loads such as containers or pallets are not yet transported. According to the captain of this vessel, there are a few problems with Narains Wharf, a domestic vessel terminal of Suva: there is a ship that sank in the water ahead of the wharf, the water area for turning around, a necessity for vessels to dock, is too small, and nighttime navigation signs are not sufficiently installed.
Figure 4-38 Cargo stored in the vessel (1)
Figure 4-39 Cargo stored in the vessel (2)
Figure 4-40 Kava, one of the major exports of the island
Cargo inside the vessel is stored Trucks and heavy machines were Kava is a valuable agricultural

Data Collection Survey on Reverse Logistics in the Pacific Islands
133
in cardboard boxes or plastic bags; there is no unit-loading arrangement.
also included in the cargo to the island, but these trucks were not the kinds used for land transport business in the island.
export item.
(3) Freight rate
In Fiji, the Prices and Incomes Board (PIB) sets a ceiling rate on freight transportation. Under the rate, a private liner can set its rate for individual shippers depending on the volume and frequency of the cargoes. The PIB rate that the team collected is listed in the table. For instance, freight rate from Suva to Savusavu is F$80 in PIB rate, however the actual rate is less than F$80. According to interview with domestic liners, the PIB rate has not been changed for the last two decades even though bunker rate increased dramatically.
Major shipping companies don’t receive any subsidies from the government, however some lines providing service for less populated groups are said to receive a subsidy because of lower economic performance.
Table 4-29 Major routes’ freight rate in Fiji
Source: Prices and Incomes Board
(4) Recyclable materials transport
According to Fiji custom, 8,663 tons of scrap metal was exported in 2011. Recycling company says that ferrous, non-ferrous, plastics and paper are collected and most of them are exported. Table 4-30 shows an example of local recycling company’s recyclable material export. In addition to local recycling companies, Korean recycling companies are also collecting and exporting scrap metals to Korea. On the other hand, actual cargo handling volume of recyclable materials is not reported to Fiji Ports Authority. There is neither regulation nor limitation for exporting recycling materials at present in ports. Biosecurity Authority Fiji administers a procedure of custom invoice but does not conduct any inspection on exporting recyclable material.
PIB rate 20 feet container in F$ 20 feet container in US$Suva-Koro F$78/ton 1,560 839Suva-Savusavu F$80/ton 1,600 861Suva-Labasa (includingland transportation cost) F$88/ton 1,760 947
Suva-Kasavu F$54.05/ton 1,081 581Natovi-Nabouwalu F$1,00/ (7-9 ton truck) 2,500 1,345Natovi-Odalau F$900/(7-9 ton truck) 2,250 1,210
RouteFreight rate

Data Collection Survey on Reverse Logistics in the Pacific Islands
134
Table 4-30 Recyclable materials volume and export destination (a case of a recycling company in Fiji)
Recyclable materials Volume of exports Destination
Plastics(including PET) 2 TEUs per three months Hong Kong
Paper 5 – 8 TEUs per month Australia
Cardboard 2 TEUs per month Australia
Ferrous 10 TEUs per month Indonesia
Non Ferrous 2 TEUs per month Australia and NZ
Hearing from a recycling company in Fiji
Recycling material is expected to be a new export commodity. Recyclable materials are collected not only in the mainland, Viti Levu, but also on local islands. Scrap metals are transported from local islands to Viti Levu. These are transported in an open truck from Lambasa, Vanua Levu to Suva, and are put in a container before being shipped abroad. As far as our team survey findings, no recycling material is transported by ship except scrap metals from Lambasa at present. The imbalance of cargo volume still remains in domestic transportation. Many of the domestic liners carry consumer commodities from Suva and Natovi in Viti Levu Island to other local islands. On the other hand, a few export cargoes including timber, copra fish and taro, are generated from the local islands. Additional export cargoes are required in local islands.
4.2.2 Samoa
Samoa consists of Upolu Island, Savai’i Island and seven small islands. Total population is 180,000.
(1) Ships and routes for domestic transport
Samoa Shipping Corporation (SSC) is the only domestic shipping line in Samoa. The SSC owns six domestic vessels. The SSC was funded by the government but does not receive any operational subsidy from the government. Specifications of its ships are listed below. The ships have limited drafts with around 1.4 to 2.4 meters for entering shallow water in ports. MV Lady Samoa III is 42 meters in length, 2.35 meters in draft. She is deployed in the main route between Upolu island and Savai’i island.
Table 4-31 Specifications of ships of Samoa Shipping Corporation Name Type Loa(m) Draft (m) GT (tons) Remarks
MV Lady Samoa III Passenger/Vehicle Ferry 42.0 2.35 1,045 Japan grant
MV Lady Naomi Passenger/Vehicle Ferry 46.5 2.40 993
MV Lady Samoa II Passenger/Vehicle Ferry 43.3 2.35 867 Japan grant

Data Collection Survey on Reverse Logistics in the Pacific Islands
135
MV Fotu-O-Samoa II Cargo Barge-Ramp Type 39 2.5 299
MV Samoa Express Cargo Barge-Bow Ramp 42.0 2.18 340
MV Lady Filifilia Passenger 23.76 1.4 60
Source: Samoa Shipping Corporation website
Figure 4-41 A passenger / vehicle ferry MV Lady Samoa III.(source: SSC website)
Figure 4-42 Cargo barge-ramp type ship MV Fotu-O-Samoa II (at Apia port)
The main route is Upolu Island and Savai’i Island. MV Lady Samoa III and MV Fotu-O-Samoa II connect Mulifanua port in Upolu and Salelologa port in Savai’i. They serve 4 or 6 times per day from Monday to Saturday and 2 times per day on Sunday. It takes about 70 to 90 minutes.
In addition, SSC provides an international route service to American Samoa as well as Tokelau islands (NZ territory) which are located north of Samoa.

Data Collection Survey on Reverse Logistics in the Pacific Islands
136
Figure 4-43 Domestic and international routes in Samoa
(2) Ports
Samoa Port Authority (SPA) manages and operates ports in Samoa. The Port of Apia is a major port of Upolu Island; it has two international berths that are 11 m deep. The average volume of cargo handled per year over the past eight years is about 400,000 ton. Other major ports include the Port of Salelologa, the gateway to Savai'i Island, and the Port of Mulifanua, a domestic port of Upolu Island. Of the two quays of Apia Port, the main quay is 187 m in length and 11 to 12 m in depth. The new quay is 165 m in length and 11 to 12 m in depth. Apia Port also has two berths for domestic transport. The Port of Salelologa has a 5-m deep international quay and a 4- to 5-m deep domestic quay. The Port of Mulifanua in Upolu Island has two quays that are both 3 m deep.
Table 4-32 Cargo handled by ports in Samoa
2011Total cargo throughput
(unit:1,000 tonnes)
Container cargo
throughput
Container cargo
throughput(unit:TEU)
(unit:1,000 tonnes)( ):Number of empty
containers
Import 382 377 12,205 (748)
Export 100 103 12,284 (9,070)
Total 482 480 24,489 (9,818)
International forAmerican Samoaand Tokelau
Domestic

Data Collection Survey on Reverse Logistics in the Pacific Islands
137
(Source: Samoa Port Authority)
Note: The amount of base metals exported to foreign countries in 2011 was 720 tons (equivalent to 36 TEU) according to customs statistics. According to the interview with the recycling contractors, a total of 1,206 tons (equivalent to 60 TEU) were exported, including 885 tons of iron, 110 tons of automotive parts, 92 tons of aluminum, 82 tons of batteries, and 37 tons of electric motors.
The international container terminal of Apia Port has an area of 12,700 m2, and the land area behind the terminal is occupied by management offices and warehouses. Because of the lack of landspace, SPA plans to expand the container terminal and repair the existing quays. If a procesing facility and/or dedicated yard for recyclable materials is set up in the port area in the future, appropriate measures should be taken accordingly such as revision of the terminal layout for improvement of the cargo storage capacity.
Since the port faces the open sea, it is susceptible to sea swells, which often prevents smooth berthing and cargo handling at this port. Given this condition, shipping companies expressed their desire for improvement of port facilities.
Table 4-33 Specifications of major ports in SamoaPort Wharf Length(m)) Depth(m) Remarks
Apia
International
Container yard:120,000
square meter
Main Wharf 187 11
New Wharf 165 11-12
Domestic - - 2 berths
SalelologaInternational - 5 1 berth
Domestic - 4-5 1 berth
Mulifanua Domestic - 3 2 berths
(Source: Samoa Port Authority)
Figure 4-44 Entire view of Apia Port
Internationalport
Domestic port
Internationalport

Data Collection Survey on Reverse Logistics in the Pacific Islands
138
Figure 4-45 Entire view of Mulifanua Port
Figure 4-46 Entire view of Salelologa Port
The white building at center is the passenger terminal. The typical mooring position of a ferry is the yellow part seen on the right of the building and the ramp behind it.
The white building at center is the passenger terminal. To the left of the building is the ferry mooring quay. A stand-by ship, Lady Samoa II (supplied by Japan) is moored farther to the right of the picture.
(3) Freight Rate
Freight rate between port of Mulifanua and port of Salelologa is shown below. The freight rate is applied to length of Vehicle. A 20 feet container will be charged at SAT$700 (US$300).
Table 4-34 Freight rate between Mulifanua port and Salelologa port (abstract)
Source: Samoa Shipping Corporation
In addition, international freight rate between Apia, Fiji and Pagopago, American Samoa, is shown below. A 20 feet container will be charged at SAT$ 3,600 (US$ 1,520).
Table 4-35 Freight rate between Apia, Fiji and Pago Pago, American Samoa
SAT$ US$9ft-12ft 80 3412ft-15ft 95 4015ft-18ft 100 4218ft-21ft 110 46
SAT$35(US$15) per ton
Freights
Heavy truck, bus, all othermachinery equipment
Length ofVehicle

Data Collection Survey on Reverse Logistics in the Pacific Islands
139
Source: Samoa Shipping Corporation
(4) Recycling Materials Transport
Custom data indicates that 720 tons of base metals were exported abroad in 2011. According to a local recycling company, 885 tons of ferrous, 110 tons of automobile parts, 92 tons of aluminum, 82 tons of batteries and 37 tons of electric motors were exported in 2011. Plastics are no exported at present. These two figures are not equal, but ferrous is a main commodity for export. According to Samoa Shipping Corporation (SSC), recyclable materials do not seem to be transported from outside the mainland. There is no recycling company operating outside the mainland. At present, port authority does not impose any regulation on exporting recyclable materials.
If the recyclable material were to be transported, following domestic maritime conditions would be considered. Major cargoes between the two ports are food, fuel and construction materials. These are transported by containers or open trucks. Transportation volume is listed below. 23,850 vehicles weighing 76,523 tons were transported from Mulifanau to Salelologa, and 24,967 vehicles weighing 63, 216 tons were transported from Salelologa to Mulifanau. These data are based on the number of trucks, not based on cargo items. However, recycling materials are not considered to be transported on the domestic route in Samoa, although a recycling company is operating in Upolu.
Table 4-36 Number of vehicles with tonnage between Mulifanau and Salelologa (July 2009 to June 2010)
Source: Samoa Ports Authority
Furthermore, there is a regional international network among Samoa, American Samoa (USA) and Tokelau (NZ). The volume of transportation between Apia and Pago Pago, and Apia and Tokelau is listed below respectively. 679 tons of cargoes were transported from Apia to Pago Pago. 218 tons of cargoes were transported from Pago Pago to Apia. Volume of export from Apia is two or three times
SAT$ US$ SAT$ US$Sacks (Taro, Copra, Coconuts, Bananas, Taamu) / Repacks, BundleFine mats – max weight 50 lbs. (min charge SAT$10.0)Pallets (1 cubic meter – up to 600 lbs.) 120 50 160 67General Cargo up to 1 ton or 2,000 lbs. 180 76 235 99
Type of Cargo
25 5011 21
One Way Round trip
DestinationOrigin
Note: ( ) shows the number of vehicles.
Salelologa 63,216(24,967)
Mulifanau Salelologa
Mulifanau 76,523(23,850)

Data Collection Survey on Reverse Logistics in the Pacific Islands
140
larger than that from Pago Pago and Takelau. Some recycling materials are transported by MV Fatu-O-Samoa, but this is in American Samoa’s territory. 5,306 tons of cargoes were transported from Apia to Tokelau, on the other hand, 1,339 tons of cargoes were transported from Tokelau to Apia. Waste materials such as timbers and base metals generated in Manau islands, west of American Samoa, are transported to Pago Pago, center of America Samoa, by MV Fatu-O-Samoa when requested by American Samoa (usually every two or three months).
Table 4-37 Volume of Inter-Island Shipping (July 2009 to June 2010)
Source: Samoa Ports Authority
4.2.3 Tonga
Tonga consists of 170 islands and group islands with a population of 103,000. Tongatapu island is the largest in Tonga and the capital city Muku’alofa is located there. Major group islands are Ha’apai group located 150 kilometer north of Tongatapu, Vava’u group 400 km from Tongatapu and Niuas group 600 km north east of Tongatapu respectively.
(1) Ships and lines for domestic transport
Four domestic shipping lines cover domestic service routes in Tonga. Their operating routes are illustrated and listed below. Friendly Islands Shipping Agency (FISA) has the largest network among the four. FISA is operating a RORO ship MV Otuanga’ofa (1534GT) that was granted to Tonga from Japan. Her weekly service route is Nuku’alofa – Nomuka – Tungua - Haafeva Is – Lifuka – Vava’u. She also calls Vava’u – Niuafo’ou - Niua Toputapu once every four or six months. The only ports she can enter are Nuku’alofa and Vava’u. A surfboat is essential for berthing in the other ports. Originally a government shipping company served domestic main routes. After a marine accident in 2008, it was dissolved and the FISA succeeded its operation.
Destination DestinationOrigin Origin
5,306 tons
PagoPago, American Samoa 218 tons Tokelau, NZ 1,339 tons
Apia PagoPago Apia Tokelau
Apia, Fiji 679 tons Apia, Fiji

Data Collection Survey on Reverse Logistics in the Pacific Islands
141
Figure 4-47 Domestic shipping routes in Tonga
Besides FISA, there are three private companies operating domestic routes. Uata Shipping Lines is providing a weekly service with a RORO ship MV. Pulupaki; from Nuku’alofa - Ha’apai Group -Vava’u Group. It takes about 18 hours from Nuku’alofa to Vava’u. It is also serving a route from Vava’u to Niuas Group in one or two-month interval. This route is subsidized by the government because of the long distance and relatively small volume of cargoes.
Tofa Landsea Shipping is operating a ferry MV ALAIMOANA (160GT) from Nuku’alofa to Eua islands. South Sea Shipping Ltd. is operating a general cargo ship MV SITKA (289GT) between Nukas – Hapai – Vava’u – Niua.
Table 4-38 Domestic shipping companies and their service routes in Tonga
Figure 4-19 shows a handy container being discharged from MV Otuanga’ofa at Nukua’lofa port. MV Otuanga’ofa is 53 meters in length, 3.0 meters in draft, equipped with two 5-ton cranes and aft ramp door. Originally a handy size open container was used in the domestic route in Tonga.
Shipping company Ship type Route
Friendly Islands ShippingAgency
RORO,container multi-purpose (1)
Nukualofa – Nomuka – Tungua - Ha’afeva Is – Lifuka – Vava’u (weekly service).Vava’u – Niuafo’ou - Niua Toputapu (every four or six months).The ship can enter ports in Nulualofa and Vava'u
Uata Shipping lines RORO(1) Nukualofa - Ha'afeva - Ha'apai - Vava'u General cargo ship (1) Nukualofa - Eua
Tofa Landsea Shipping Ferry (1) Nukualofa - EuaSouth Sea Shipping Ltd. RORO (1) Nukualofa - Ha'apai - Vava'u - Niua

Data Collection Survey on Reverse Logistics in the Pacific Islands
142
However, the open container would get wet during rainy weather and theft was also a concerned. The new handy container was introduced. Specification of the new handy container is 2.438 meters (8 feet) in width, 1.829 meters (6 feet) in depth and 2.0 meters in height. Tare is 1 ton and gross weight is 6 tons which can be handled by folk lifts in local ports. 54 dry containers and 8 reefer containers are used at present. This container is suitable for small cargo in local ports.
Figure 4-20 shows MV Pulupaki of Uata Shipping Lines berthing at Nuku’alofa port. The ship is 675 GT and has a draft of 3.7 meters. It was originally operated in Japan.
Figure 4-48 Handy containers being discharged from MV Otuanga’ofa (FISA) at
Nuku’alofa port.
Figure 4-49 MV Pulupaki of Uata Shipping Lines berthing at Nuku’alofa port.
(2) Ports
Port Authority of Tonga is in charge of port of Nukualofa. Dept. of Marine & Ports, Ministry of Transport administers mariners and the other ports in Tonga. Port of Nuku’alofa is the main port of Tonga with two international wharves and a domestic RORO wharf. The total wharves area is approximately 300 meter in width and 200 meter in length. The port is equipped with mobile cranes but the yard is not paved. Most of the land is unutilized. A warehouse with quarantine office was granted by EU.

Data Collection Survey on Reverse Logistics in the Pacific Islands
143
Figure 4-50 Entire view of Nuku’alofa Port
Port of Nuku’alofa has two international wharves; Main wharf 1 is 105 meters in length, 13 meter in depth, and Main wharf 2 is 114 meters in length, 10 to 11 meters in depth. In addition, the domestic wharf is 100 meters length, 5 to 7 meter in depth.
Table 4-39 Port facilities in ports in Nuku’alofa port
Source: Port Authority of Tonga
Port of Nuku’alofa handled a total of 8,530 TEUs containers (2,635 TEUs of import, and 5,895 TEUs of export) in 2011. However the total of container handling volume has been stagnant for the last four years.
Table 4-40 Cargo handling in Nuku’alofa port
Source: Port Authority of Tonga
The port authority is now planning rehabilitation of the two existing wharves and the construction of additional new wharf. If a recycling process facility or a designated yard for recycling
International portMain wharf1
Domestic port
International portMain wharf2
Port Wharf Length(m) Depth(m) remarksNuku'alofa Internatioal
Main Wharf 1 105 13 Main Wharf 2 114 10-11Domestic 100 5-7
2008 2009 2010 2011Import 6,073 5,615 5,341 2,635Export 5,865 5,599 4,962 5,895Total 11,938 11,214 10,303 8,530
(TEU)

Data Collection Survey on Reverse Logistics in the Pacific Islands
144
materials will be introduced in the terminal area in the future, re-allocation of terminal use and improvement of cargo handling capacity in the terminal will be required.
(3) Freight Rate
FISA’s freight rates are prepared by general cargo, livestock, construction material, hazardous and container. The freight rate for container is listed below. MV Otuanga’ofa is carrying a handy container designed for a local small volume of cargo. She can carry 54 dry containers and 8 liquid containers at one time. The container can accommodate 6 tons of cargoes or about 20% of the volume of a twenty-feet container.
Table 4-41 Freight rate between of MV Otuanga’ofa (abstract)
Note: NUK: Nuku’alofa, PNG: Pangal, VAV: Vava’u, NTT: Niuatoputapu Source: FISA Website
(4) Recycle Material Transport
According to a foreign trade report for 2010, published by Tonga statistics department, 381 tons of ferrous and 45 tons of non-ferrous were exported abroad. Almost all of the ferrous are exported to NZ, and the Non-ferrous are to Taiwan respectively. The customs office and the quarantine office do not impose any regulation on exporting recyclable materials because these materials were not hazardous.
There is one recycling company is operating in Tonga at present. It ships recycling material not only from the mainland Tongatapu, but also from Ha’apai and Vava’u. Containers from Ha’apai are transported to Nuku’alofa. These are transhipped at Nuku’alofa to NZ. Furthermore, recycling materials from Vava’u are shipped from Vava’u to NZ directly.
(Upper:T$)(Lower:US$)
Type & Load ofcontainer
NUK/PNG NUK/VAV NUK/NTT PNG/VAV PNG/NTT VAN/NTT
FISA full load 134 165 345 109 281 26556 69 145 46 118 111
FISA half load 86 102 194 74 162 15236 43 82 31 68 64
20 feet laden 618 751 2,403 482 2,100 1,792260 316 1,010 203 883 754
20 feet empty 1,098 1,299 2,403 780 2,100 1,792462 546 1,010 328 883 754

Data Collection Survey on Reverse Logistics in the Pacific Islands
145
4.2.4 Tuvalu
Eight thousand people dwell in Tuvalu, the least populated among the five survey countries. Small Islands are scattered across a length of 700 kilometers from north to south, encompassing a vast area of 280thousands square kilometers.
(1) Ships and Routes for Domestic Transport
The domestic network in Tuvalu is mainly served by two general cargo ships; MV NINAGA II (1,042GT) and MV MANUFOLAU (580GT). They are owned and operated by Department of marine & Port Service, Ministry of Communication & Transport of Tuval. They voyaged thirty six (36) and forty eight (48) times respectively in 2010. They connect Funafuti with the other 8 islands and atolls in Tuvalu; Nanumea, Nanumanga, Niutao, Nui, Vaitupu, Nukufetau, Nukelaelae, Niulakita. All the ports in Tuvalu except Funafuti have only slopes for surfboats. That is why the ships can handle only small break bulk cargoes, and not containers. Recycling materials, such as scrap metals, PETs and e-wastes, are usually transported as containers because of their handling difficulties. A unit load system needs to be developed if recycling materials are to be shipped from the remote islands.
Total volume of domestic cargo transported 7,689 tons (6,753 tons by MV NIVAGA II and 936 tons by MV MANI FOLAU) in 2011. The total cargo volume has increased in the last four years.
Table 4-42 Volume of domestic cargo transportation from 2007 to 2012
Source: Tuvalu marine office
Year 2007 2008 2009 2010 2011 2012 (by theend of March)
Nivaga 2,550 3,441 5,148 5,342 6,753 430Manu Folau 830 900 946 986 936 83Total 3,380 4,341 6,094 6,328 7,689 513
(Unit:Cubic meter)
Figure 4-51 Domestic marine network in Tuvalu: there are three main routes: north, central and south.

Data Collection Survey on Reverse Logistics in the Pacific Islands
146
(2) Ports
Department of Marine & Port Services, Ministry of Transport & Communications is in charge of port operation and management in Tuvalu. Port of Funafuti is the main gate of Tuvalu. The port has an international wharf and a domestic wharf. These are eight meters depth each. The international wharf was granted by Japan in 2009.
The port has a warehouse and mobile cranes but yard is not paved. There is little room for expansion in the terminal area. If a recycling process facility or a designated yard for recycling materials will be introduced in the terminal area in the future, re-allocation of terminal use and improvement of cargo handling capacity in the terminal will be required.
Figure 4-52 Overview of Funafuti Port
Table 4-43 Port facilities in ports in Funafuti port
Source: Tuvalu marine office
Funafuti port handled a total of 1,107 TEUs container (564 TEUs of imports and 543 TEUs of exports) in 2011. The number of empty containers is counted. According to Tuvalu Marine office, there are few export cargoes from Tuvalu.
Internationalport
Domestic port
Port Wharf Length(m) Depth(m) remarksFunafuti Interenational
Main Wharf 50 8 Japan grantDomesic 46 8

Data Collection Survey on Reverse Logistics in the Pacific Islands
147
Table 4-44 Cargo handling in Funafuti port
Source: Tuvalu marine office
Figure 4-24 shows views of MV NIVANGA berthing at Funafuti port. Figure 4-25 shows surfboats carrying passengers and light commodities to shore in a remote island while mother ship is anchoring off the port. A 20 feet container cannot be accommodate at local ports in Tuvalu.
Source: Tuvalu Cooperative Society
Figure 4-53 MV NIVANGA II (1,042GT) and its surfboat; berthing at Funafuti port
Figure 4-54 Surfboats carrying passengers and light commodities to shore in a remote island.
(3) Freight rate
Domestic freight rate is shown below. For instance, the freight rate for private ships from Funafuti and Nanumea, which is the farthest island from Funafuti, is AUS$85.00* per ton/cubic meter.
(*: AUS$85.00/ton = Freight $66.50/ton + Wharfage $8.50/ton + Handling $10.00/ton.)
Table 4-45 MV NIVAGA II & MANIFOLAU Freight table - 1995
(unit: AU$) (Private)
Naumea 25.00 32.50 45.50 54.00 56.00 66.50 79.50 89.00
33.75 Naumaga 29.50 32.50 48.50 49.50 60.50 72.50 81.50
43.88 39.83 Niutao 31.50 40.00 43.50 54.00 66.00 77.50
(TEU)2010 2011 2012
Import 429 564 218Export 464 543 191Total 893 1,107 409

Data Collection Survey on Reverse Logistics in the Pacific Islands
148
61.43 43.88 42.53 Nui 35.50 35.00 47.00 58.00 67.00
72.90 65.48 54.00 47.93 Vaitupu 24.50 32.00 41.50 57.00
75.60 66.83 58.73 47.25 33.08 Nukufetau 30.00 41.00 52.50
89.78 81.68 72.90 63.45 43.20 40.50 Funafuti 31.00 44.50
107.33 97.88 89.10 78.30 56.03 55.35 41.85 Nukulae 34.00
120.15 110.03 104.63 90.45 76.95 70.88 60.08 45.90 Niulakita
(Government and Private organization) Private wharfage=$8.50 per ton/cubic metre Handling=$10.00per ton/cubic metre Government/Corporation/Organizations
wharfage=$11.48 per ton Handling=$13.50per ton Freight Suva-Funafuti==$62.00 per ton
Source: Tuvalu marine office
(4) Recycling Materials Transport
A one-man enterprise is the only recycling business being operated in Funafuti, Tuvalu. Five containers of ferrous metal and one container of non-ferrous metal were shipped to NZ in 2010. These are the only export commodities from Tuvalu. Obviously, the business is still in the embryonic stage. The owner has limited capital resources and thus he collects scrap metals in the island, and cuts them with his hands. There is neither metal cutting equipment nor truck for transportation.
In addition, there are no recycling materials shipped from the remote islands. When shipping commodities from Nanumea Island to NZ, first the cargo is transported to Funafuti as break bulk, and then it is put into a container, sent to Suva, and transhipped to NZ. It will be charged both domestic and international freight rates. There are no specific regulations for transporting recycling materials in Tuvalu.

Data Collection Survey on Reverse Logistics in the Pacific Islands
149
4.2.5 Vanuatu
The country is composed of 83 islands scattered across a length of 1,200 kilometers from north to south in the South Pacific Ocean. People are dwelling in twelve islands out of the 83 islands
(1) Ships and routes for domestic transport
There are three major domestic routes. The north route connects Luganville, the Torres islands and Banks Islands. The central routes connect Luganville and Port-Vila via Pentecost, Ambrym and Malakula. The south route connects Port-Vilaand Tafae province.
In 1999, Vanuatu government deregulated domestic marine routes and allowed foreign registered vessels to provide service on domestic routes in order to increase the frequency of service.
At present, In Vanuatu, forty two (42) private ships are serving on the domestic routes, but most of these ships are small and old. Table 4-37 shows that around three fourths of operational ships are less than 150 GT and more than 20 years of age. Most of ships can transport both cargo and passenger while a few of them are land craft type boat(which means a small RORO boat).
Table 4-46 Ships serving domestic network in Vanuatu
Figure 4-55 Major domestic marine network in Vanuatu: There are three man
routes; north, central and south.

Data Collection Survey on Reverse Logistics in the Pacific Islands
150
Source: Department of port and marine
Table 4-47 Number of ships by size and built year
Gross Ton. year ~1969 1970~1989 1990~2010 Total
0~ less than 50 3 7 1 11
50~ less than 100 4 5 1 10
100~ less than 150 1 8 1 10
150~ less than 200 - 4 1 5
250~ less than 300 - 2 1 3
350~ less than 400 - 1 - 1
450~ less than 500 - - 2 2
Total 5 27 7 42
Source: Port & Marine Department, Vanuatu
(2) Ports
Ports in Vanuatu are managed and operated by the Department of Port and Marine. Vanuatu has two international ports, the Port of Port-Vila in Efate Island and the Port of Luganville in Espiritu Santo Island. The following outlines the present status of major ports including the Port of Port-Vila, Port of Luganville, and others in neighboring islands.
Name of ship GT RouteMarata 30 Malekula-SantoLC Tina 1 192 Santo-Amoae-Pentecost-Ambym-Epi-PortVilaLady Sabrina 43 Santo-Ambae-Maewo-SantoMakila 92 Santo-Amoae-Pntecost-Ambym-Epi-PortVilaKawale 115 Santo-Torba ProvinceKeidi 114 Santo-Torba ProvinceSowides 63 Santo-Torba ProvinceAurora 103 Santo-MaluklaHavutu 99 Santo-Ambae-Maewo-Pntecost-Malekula-SantoLC Brisk 104 Santo-Ambae-Pentecost-Ambym-Epiport-Malekula-SantoJadams 45 Santo-MalekulaH.Tino 38 Santo-MalekulaBig Sista 33 PortVila-epi-Paama-malekula-SantoEpi Dream 17 PortVila-EpiTouaraken 264 PortVila-Tafea ProvinceEfate Queen 118 Santo-Ambae-Pentecost-Ambrym-PortVilaLC Kalyara 120 Portvila-TannaSanto Queen 94 Portvila-Malekula-SantoElkemar II 291 Santo-Ambae-Ambrym-Epi-Malekula-Santo
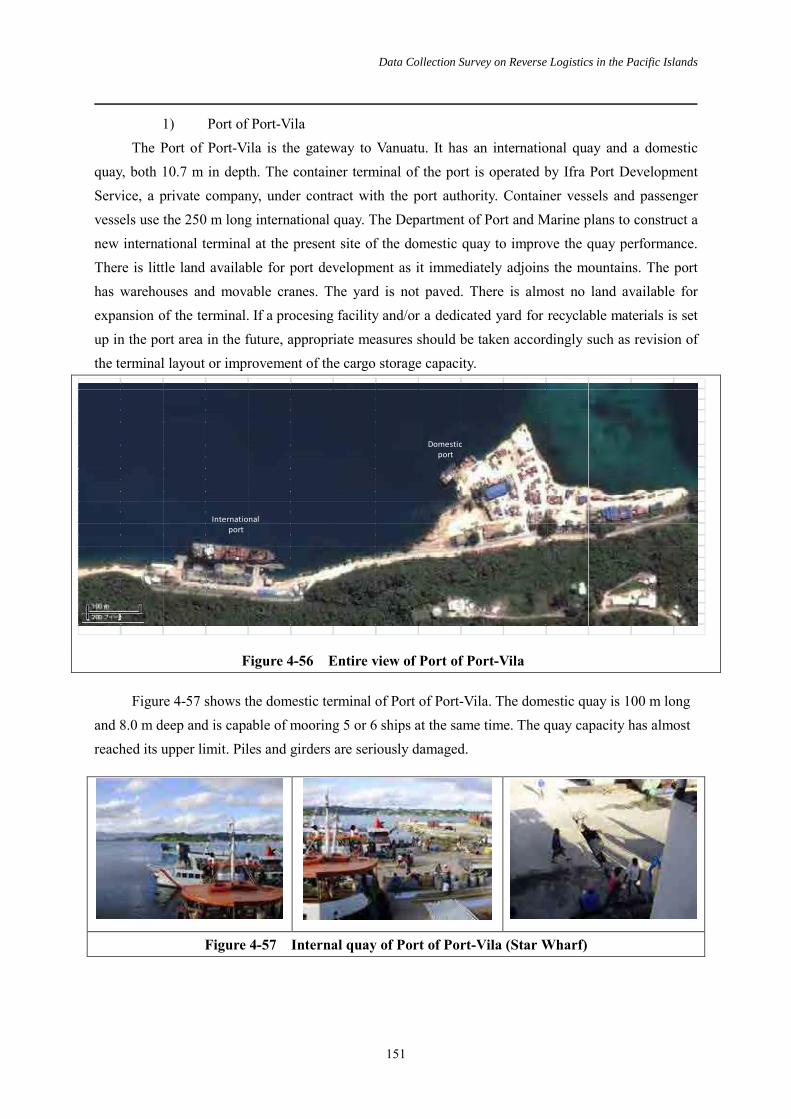
Data Collection Survey on Reverse Logistics in the Pacific Islands
151
Port of Port-Vila1)The Port of Port-Vila is the gateway to Vanuatu. It has an international quay and a domestic
quay, both 10.7 m in depth. The container terminal of the port is operated by Ifra Port Development Service, a private company, under contract with the port authority. Container vessels and passenger vessels use the 250 m long international quay. The Department of Port and Marine plans to construct a new international terminal at the present site of the domestic quay to improve the quay performance. There is little land available for port development as it immediately adjoins the mountains. The port has warehouses and movable cranes. The yard is not paved. There is almost no land available for expansion of the terminal. If a procesing facility and/or a dedicated yard for recyclable materials is set up in the port area in the future, appropriate measures should be taken accordingly such as revision of the terminal layout or improvement of the cargo storage capacity.
Figure 4-56 Entire view of Port of Port-Vila
Figure 4-57 shows the domestic terminal of Port of Port-Vila. The domestic quay is 100 m long and 8.0 m deep and is capable of mooring 5 or 6 ships at the same time. The quay capacity has almost reached its upper limit. Piles and girders are seriously damaged.
Figure 4-57 Internal quay of Port of Port-Vila (Star Wharf)
Internationalport
Domestic port

Data Collection Survey on Reverse Logistics in the Pacific Islands
152
Table 4-48 Port facilities in ports in Vanuatu
(Source: Department of port and marine)
Vanuatu handled 16,274 TEU of foreign cargo in total in 2010. This breaks down to the Port of Port-Vila handling 12,426 TEU (6,084 TEU of imports and 6,342 TEU of exports including empty containers), and the Port of Luganville handling 3,484 TEU (1,752 TEU of imports and 2,096 TEU of exports including empty containers). There is almost no export cargo shipped from Vanuatu.
Table 4-49 Cargo handling in ports of Vanuatu
(Source: Department of port and marine)
Note: 4,158 tons (208 TEU) and 133 tons (7 TEU) of metal scraps were exported in 2011 and 2010 respectively
according to the customs statistics of Vanuatu. 95% of these are metal scraps. According to the interview with Vanuatu
recycling contractors, 587 TEU (11,740 ton) were exported in 2011.
Ports in Neighboring islands: Malekula Island 2)Located at the center of the island nation, Malekula Island is Vanuatu's second largest island and
a part of Malampa Province. Composed of three major islands, Malampa Province has a population of 36,100 and an area of 2,770 km2. The central island of the province, Malekula, has a population of about 30,000 and has the provincial capital Lalatoro. This island has a few small-scale mooring facilities for small vessels. These facilities are managed by the provincial government. ①Lits Lits Wharf
Lits Lits Wharf is located near the capital Lalatoro. The wharf is about 40 m long and about 8 m wide, with a T-shaped pier and a 100-m long approach road. South of this approach is a temporary ramp. According to the survey, this temporary ramp was constructed to serve banana boats coming from Noumea about once a month.
This area is included in one of the local port development projects launched with the assistance
Port Wharf Length(m) Depth(m) remarksPort-Vila International
Main Wharf 250 10.7Domestic Star Wharf
Luganville International/Domestic(Santo) Main Wharf
50 8
200 13
2010 remarksPort-Vila Import 6,084
Export 6,342Luganville Import 1,752
Export 2,09616,274
(TEU)
Estimation value
Total
Vanuatu

Data Collection Survey on Reverse Logistics in the Pacific Islands
153
of the Asian Development Bank and New Zealand. The plan is to extend the area south of the approach road and construct a mooring facility and a yard.
Figure 4-58 Entire view of Lits Lits Wharf (T-shaped pier)
Figure 4-59 Approach road and ramp of Lits Lits Wharf
②PRV facilities
Located north of Norsup, PRV or Plantation Rusel Vanuatu is a private enterprise engaged in export of copra and cacao. This company owns a small pier for their own use. The structure of this pier is about 50 m long, 3 m wide and about 1.4 m deep. About half of the structure is located on the landside. Gabions are installed beside the structure so as to allow mooring of a ramp-way type barge. This barge vessel owned by PRV is fully loaded with four or five cars. It is used to carry copra, cacao and cows to Luganville on Espiritu Santo Island.
Figure 4-60 Entire view of the privately owned port facility (PRV)
Figure 4-61 A vehicle being loaded onto the barge
Ports on Neighboring Islands: Tanna Island 3)Tanna Island is part of Vanuatu's southernmost province Tafea. Some 27,000 people live in Tafea
Province covering an area of 1,627 km2. The provincial capital of Isangel is located in Tanna Island. A volcanic island, Tanna is about 40 km from north to south, about 19 km from east to west, and has an area of about 550 km2. It is reported that some 8,000 people live on this island

Data Collection Survey on Reverse Logistics in the Pacific Islands
154
①Lenakel Wharf Lenakel Wharf is the only mooring facility on Tanna. It was first constructed in the 1980s and was
repaired in 1999. With a jetty sticking into the sea through the approach road, the mooring facility faces the open sea and is therefore easily subject to oceanographic phenomena. It is hard for the wharf to keep calmness of waters. Stevedoring is conducted by a local contractor. They have no cargo handling equipment; all work is done manually.
Lenakel Wharf is used by a total of three liner services operated by three shipping companies each operating a liner once a week. But the wharf is often affected by meteorological conditions. Hence no clearly scheduled timetables are provided. When the western part of the island is affected by the bad condition, ships take shelter in the tranquil waters on the eastern part of the island, namely Waisisi Bay or Port Resolution. Daily commodities are transported once a month to other neighboring islands of Tafea Province. No recyclable waste is transported out from Tanna.
Figure 4-62 A regular liner moored at Lenakel Wharf
Figure 4-63 Approach road to Lenakel Wharf
Ports on Neighboring Islands: Espiritu Santo Island 4)Part of Sanma Province located in the northern part of the island nation, Espiritu Santo Island is
the largest among the New Hebrides. The island covers an area of about 4,000 km2. The core city is Luganville, Vanuatu's second largest city with a population of about 10,000. The Port of Luganville is also an international port that serves regular oceangoing vessels. The Port of Luganville has an international terminal, Main Wharf, and two domestic wharfs, Samanson and Melcoffe.
①Main Wharf It consists of the old quay, about 100 m long, and the new quay, about 115 m long. These wharves
are consecutive and depth ranges from 15 to 18 m. It is a terminal wharf serving about ten regular services a month. The terminal is operated by a local terminal operations company, Northern Island Stevedoring Co. Ltd. (NISCOL). Cargo handling equipment is also owned by NISCOL. Until the early part of this year, RWMs were exported in a monthly amount of about 10 to 15 TEU in containers. But
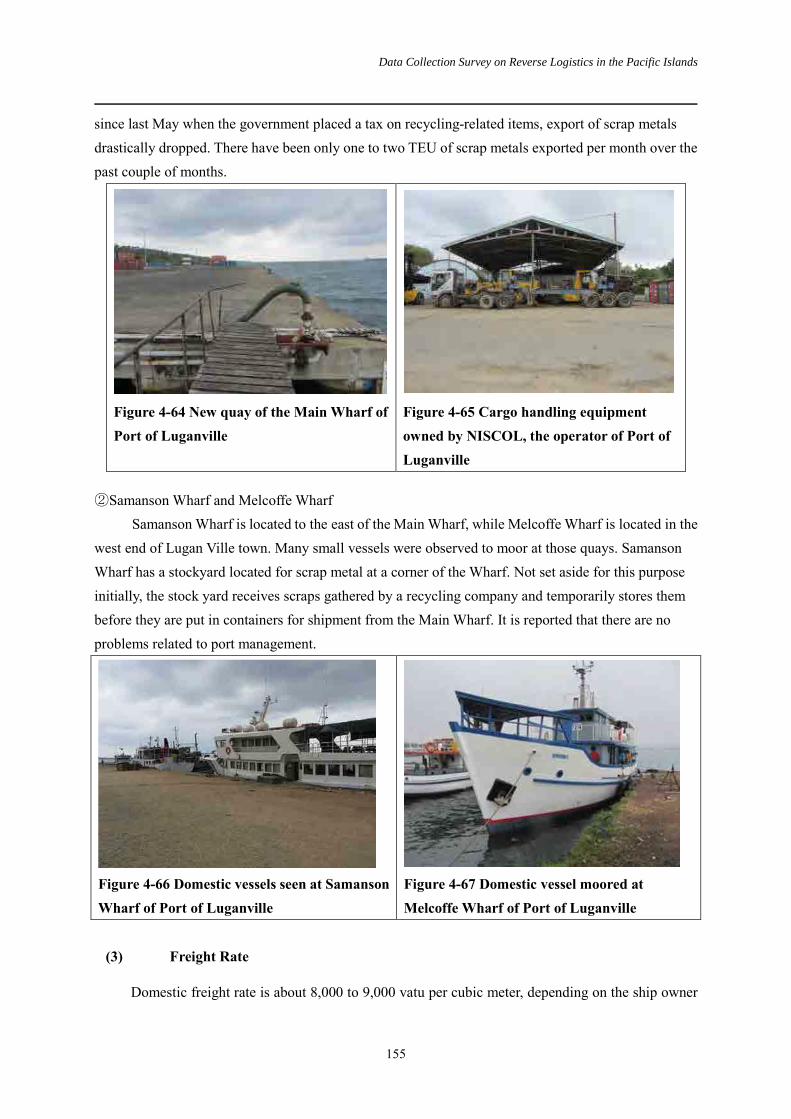
Data Collection Survey on Reverse Logistics in the Pacific Islands
155
since last May when the government placed a tax on recycling-related items, export of scrap metals drastically dropped. There have been only one to two TEU of scrap metals exported per month over the past couple of months.
Figure 4-64 New quay of the Main Wharf of Port of Luganville
Figure 4-65 Cargo handling equipment owned by NISCOL, the operator of Port of Luganville
②Samanson Wharf and Melcoffe WharfSamanson Wharf is located to the east of the Main Wharf, while Melcoffe Wharf is located in the
west end of Lugan Ville town. Many small vessels were observed to moor at those quays. Samanson Wharf has a stockyard located for scrap metal at a corner of the Wharf. Not set aside for this purpose initially, the stock yard receives scraps gathered by a recycling company and temporarily stores them before they are put in containers for shipment from the Main Wharf. It is reported that there are noproblems related to port management.
Figure 4-66 Domestic vessels seen at Samanson Wharf of Port of Luganville
Figure 4-67 Domestic vessel moored at Melcoffe Wharf of Port of Luganville
(3) Freight Rate
Domestic freight rate is about 8,000 to 9,000 vatu per cubic meter, depending on the ship owner

Data Collection Survey on Reverse Logistics in the Pacific Islands
156
The Government does not control the freight.
(4) Recycling Materials Transport
A local recycling company and Korean recycling companies are operating their businesses in Vanuatu. Vanuatu customs indicated that 4,158 tons of scrap metal were exported in 2011, 133 tons in 2010. 95% of them are scrap metals.
At present recycling materials are collected in both Efate island and Espritu-Santo island. The collected materials are put into containers in each island and shipped abroad directly from Port-Vilaand Luganville ports respectively. No domestic transport of recycling cargo is reported at present.Local collector and Korean collectors are operating collecting activities. Local ships collectedrecyclable materials to NZ and Korean ship to Korea respectively. Figure 4-28 shows the actual collection and sorting process conducted by a local company in Luganville, Esprit-Santo. Collected materials are sorted into a standard size and packed into containers. The floor and walls inside the container are protected with wood panels.
(1)Collecting scrap metals(2) Sorting and cutting into a
standard size(3)Putting scrap metal into a
container
Figure 4-68 Process of sorting scrapped metals in Luganville, Espritu-Santo
4.2.6 Summary
AT present, recycling activity is operated in the mainland in each country, and gradually spreading to local islands. Provided that recyclable material collection activity is well developed, domestic shipping would be key to collect and aggregate recycling materials from rural islands to the mainland.
(1) Ships and routes for domestic transport
Reviewing maritime transport in PICs, several characteristics are identified. First is ownership of marine transport. The domestic network is covered by local shipping companies in PICs. However, ownership of the domestic shipping company depends on the country’s policy. Nine private shipping

Data Collection Survey on Reverse Logistics in the Pacific Islands
157
companies and one government owned company are serving routes in Fiji. Private ships are serving the domestic network in Vanuatu. On the other hand, a shipping corporation in Samoa and a shipping agency supported by the government of Tonga are serving the domestic route. A government owned general cargo ship is operating in Tuvalu. This means that privatization in maritime business has been introduced in populated countries, but government assistance is essential in less populated countries.
Second, transportation system is tailored and developed to meet PICs conditions. Even though RORO/Ferry ships are deployed in each country except Tuvalu, many of the RORO ships are equipped with surf boats and cranes. A surf boat is essential to carry commodities to small islands where a mother ship cannot enter. Another finding is that 6-ton capacity containers have been introduced to transport small cargoes in Tonga where port facilities cannot accommodate larger containers.
(2) Freight rate
Freight rates in each country are sampled in Table 4-39. These amounts of freight rate are to be added to international freight rate when a recycling company plans to export abroad recyclable materials collected in local islands via the mainland. International freight rate between PICs and the Far East is said to be US$1,500 to US$2,000 per TEU. Compared the international the freight rate and the domestic rates, the domestic rates are relatively low.
Table 4-50 Domestic freight rate in PICs Country Route Freight (per 20ft container) Remarks
Fiji Suva – Lambasa US$947 Including land transportation
cost
Samoa Manifanua – Salelologa US$300 Heavy truck (US$15 per ton)
Tonga Nuku’alfa – Vava’u US$546
Tuvalu Funafuti – Nanumea US$1,600
Vanuatu - N/A
(3) Port facilities
To facilitate circulation of recyclable material collection throughout the region, RORO system is essential. RORO ships that enable container transport have been introduced in PICs but they cannot enter all ports. Table 4-51 shows provincial population distribution in each country. Distribution of population is quite uneven in PICs. For instance, seventy-nine percent of Fijian total population is found in the province of Viti Levu where the capital city is located. On the other hand thirty-four percent of Vanuatu’s population is found in Shefa, where the mainland is located, while the share of other provinces ranging from 13 to 20 percent (with exception of Torba). This means that Vanuatu has a more dispersed population distribution than Fiji does. Tuvalu, the least populated country, has the most dispersed population distribution among the five. When examining the development of new

Data Collection Survey on Reverse Logistics in the Pacific Islands
158
RORO facilities, features of the population distribution should be considered.
Table 4-51 Provincial population and RORO port in PICs
(4) Recycling material transport
Recycling business has been operating in the main land of each PIC. The volumes of export per year are varying from 8,663 tons in Fiji to five containers (approx. 100 tons) in Tuvalu. Furthermore, businesses have also started in local islands in Fiji, Vanuatu and Tonga. Container transport or truck transport is used in each case. No regulation is applied for domestic recycling materials transport as long as these are neither hazardous nor explosive. Precise data on recycling material domestic transport cannot be collected in each country at present. In order to formulate a policy and a plan related to recycling business, comprehensive data collection system is required.
RoRo Non-RoRo
VITILEVU 661,997 79% Suva, Lautoka Suva, Lautoka, NatoviNatovi, Elington, Denarau and Ysawai Rara
VANUALEVU 135,961 16%Malau, Galoa, Wairikiand Savusavu
Nabouwalu, Malau, Savusavu,Taveuni Natuvu
LOMAIVITI 16,461 2% Levuka, Koro, Muanivanua,Buresala, Gau (Nawaikama & Qarani
Rakiraki, Naviti, Tovulalai
LAU 10,683 1% N/AMoala, Toyota, Matuku, Lakeba,Naitauba, Nayau, Vanua Balavu,Cicia, Vanua Vatu, Nasaqalau
KADAVU 10,167 1% Vunisea Vunisea, ManoROTUMA 2,002 0% Oinafa
TOTAL 837,271 100%TORBA 9,359 4% N/A Torba ProvinceSANMA 45,855 20% Santo SantoPENAMA 30,819 13% N/A Ambae,Maewo,PentecostMALAMPA 36,727 16% N/A Ambrym,Malekula,PaamaSHEFA 78,723 34% Port vila Port vila EpiTAFEA 32,540 14% Tanna,Tafea Province
TOTAL 234,023 100%UPOLU 137,599 76% Apia Apia,MulifanuaSAVAII 43,142 24% Salologa
TOTAL 180,741 100%TONGATAPU 72,045 71% Nuku’alofa Nuku’alofa,LifukaVAVA'U 15,505 15% Vava'u Vava'u Neiafu
HA'APAI 7,570 7%Pangal ,Ha'afevaIs,Nomuka,Tungua,Pangai
'EUA 5,206 5% 'EuaNIUA 1,665 2% Niuatoputapu,Niuafo’ou
TOTAL 101,991 100%FUNAFUTI 4,492 47% Funafuti FunafutiNANUMEA 664 7% NanumeaNANUMAGA 589 6% NanumangaNIUTAO 663 7% NiutaoNUI 548 6% NuiVAITUPU 1,591 17% VaitupuNUKUFETAU 586 6% NukufetauNUKULAELAE 393 4% NukelaelaeNIULAKITA 35 0% Niulakita.
TOTAL 9,561 100%
Population and Housing Census2006
Tonga 2006 Census of Populationand Housing
Tuvalu 2002 Population andHousing Census
2007 Population Census of Fiji
2009 National Population andHousing Census
Country
Fiji
Tonga
Vanuatu
Tuvalu
Samoa
Province Population International PortDomestic Port
SourcePopulation
Share

Data Collection Survey on Reverse Logistics in the Pacific Islands
159
Review Issues in Transport and Storage of Recycled Waste Chapter 5.Materials under Reverse Logistics
5.1 Issues on Reverse Logistics
5.1.1 Issues on Bulky Waste Recycling
As described in the earlier chapters of this report private recycling companies have emerged in each of the 5 countries, in varying capability (manpower, amounts of RWMs, equipment used, etc.) levels. Based on their performance and discussions with the concerned officials the following issues are identified.
(1) Collection coverage of RWG
The following issues on the collection coverage of RWG were identified;
● There is hardly any source separation of the RWGs
● There is no fixed system of collection of the RWGs, and these are collected by “collection contractors” or in some instances directly by the recycling companies
● The collection of RWGs in the outer and remote islands is very limited
In Fiji, many recycling companies reported that many of the collection contractors do not keep their commitments and sell the RWG to the highest bidders. While in three of the PICs, the populations are very largely concentrated in the main cities and islands, in Vanuatu and Tuvalu the population is more evenly disbursed over a larger number of islands and more efforts are needed to improve domestic shipping to extend collection over a wider region of the country.
Public awareness is required to gradually introduce source separation. In addition the need for a format to enhance more coordination between the collection contractors and recycling companies may be considered.
(2) Requirement to improve working standards and conditions at Recycling Companies
The Study Team had the opportunity to visit a number of yards operated by the recycling yards. The general impression was that:
● The yards are limited in size with little space to improve stockpiling conditions and provide more space for processing work

Data Collection Survey on Reverse Logistics in the Pacific Islands
160
● Salvage rates of RWG are around 50 - 60% for vehicles and white goods, as the Recycler Companies mainly concentrate on metal while other components such as tires, glass, plastics and rare earth minerals are mostly sent to the landfill.
● In many of the yards the workers process the RWGs under difficult working conditions, lacking sufficient protective gears and equipment
● The general impression was that the recycling companies do not inject sufficient investments in their operations to improve the quality of the work and that there may not be a long-term commitment by them to this work. This is a significant issue in the case of the recycling companies formed in association with foreign companies.
The comparatively large number of private recycling companies that emerged in Fiji during the last few years is very welcome, but it is clear that there are issues related to their operations which need to be improved. Better separation of the scrap metals by category is expected to lead to increased foreign demand. In addition balanced monitoring by the concerned government authorities and government policies would encourage recycling companies to invest more in equipment and improved working conditions.
(3) Strengthening the International Demand for RWMs and Promoting the local Demand
The Study estimated that about 60% of the RWGs are salvaged and processed into RWMs in Fiji and the rates are less than 40%in the other four PICs studied. This situation may be due to the following issues;
● There is hardly any domestic demand of the RWGs
● There is none or little international demand for paper and cardboard and pet bottles
● The recycling companies do not meet the requirements of potential international buyers for proper separation of the RWMs
● There is little government support to promote international markets for RWMs originating from the PICs.
The domestic demand for waste paper and vehicle batteries was observed only in Fiji. The Study Team confirmed from three beverages manufacturing plants in Fiji and Samoa that the materials used to make bottles and cans by these plants are imported. While these plants have introduced systems to collect used pet bottles and cans, these are processed and shipped overseas for producing the metal sheets and resins that are then exported back to the plants for making the packaging. There is a need to seriously study the feasibility to manufacture the cans and pet bottles in the PICs to increase domestic

Data Collection Survey on Reverse Logistics in the Pacific Islands
161
demand, and develop regional and domestic markets for such waste items as paper that are not in demand in the international market.
(4) Identification of Government responsibility
With the private sector taking the initiative in the bulky waste recycling sector, the extent that the government should intervene in this sector should be cautiously considered. Will more government intervention increase the recycling amounts or will it create obstacles and hinder the business? Some of the issues that the Government may help resolve are listed below:
● Lack of proper monitoring of operations and working conditions and collection of data to analyse the extent of the recycling operations
● Small number of private sector companies participating in the recycling industry
● No obligation on the part of dealers of vehicles and white goods to participate in operating collection systems for the discarded units
● Sudden introduction of official actions, such as excessive taxes on recycling business, new deposit systems and imports of RWM, without sufficient discussions with the stakeholders
Some of the recycling companies in Fiji complained that there is no level field in terms of the recycling companies meeting the requirements of the DOE; which creates the situation where some companies spend more on improving operations to meet the requirements while others spend much less. In Fiji, the OE is contemplating introduction of Container Deposit Legislation which is opposed by some recycling companies. In Vanuatu the government is not actively supporting Port Villa city’s welcome effort to introduce the chargeable bag system. An active recycling company in Vanuatu has considered suspending operations after the government there suddenly set a tax on the recycling activity.
Governments should be encouraged to develop policies, strategies and action plans for bulky wastes recycling to encourage wider participation by the private sector. And the permitting systems provided to recycling companies need to provide for monitoring of the companies’ activities in order to improve the working conditions and ensure that the companies are upgrading their processing skills.
5.2 Issues on Water Transport and ports for handling RWG and RWM
Recycling material has already been shipped from PICs. When circulating recycling materials, collecting, processing and packing recyclable materials are the main issues rather than transporting at present. However several issues on transporting and stocking the recycling materials in ports are identified based on our site survey. Furthermore, our survey revealed that recycling material exports

Data Collection Survey on Reverse Logistics in the Pacific Islands
162
will reach 2,800 TEUs in Fiji, 380 TEUs in Samoa, 90 TEUs in Tonga, 10 TEUs in Tuvalu and 400 TEUs in Vanuatu in 2020 respectively. Total volume in 2020 is 40 percent larger than that in 2011. First, to achieve this, the participation of government and private sectors for recycling activity in each country will be required. Second, improving transport should only be done when it is justified by the generated volume of recycling materials.
(1) Collection system over a wide are is not formed in PICs
Present collection system does not serve outer and sparsely inhabited islands. 1.4 million people are spread across an area of 3.69 million square kilometres. Since recyclable materials are dispersed, it would be hard to aggregate and process materials without effective transportation. International container routes for developed countries from PICs are multi-port-calling networks, though major trunk lines form hub-and-spoke networks. The multi-port-calling networks are preferable for collecting recycling materials in dispersed regions. Even though further study of generation of recycling materials, allocation of processing points and capacity of recycling agents is required, linkage between international network and domestic network in each country should be explored to achieve effective collection of recycling materials.
(2) Difficulty of domestic recycling materials transport
RORO system is essential to facilitate collection of recyclable material throughout PICs. RORO ships that enable container transport have been introduced in PICs but they cannot enter all ports. It is not feasible to construct a RORO terminal in each island and atoll. Transportation system is traditionally tailored and developed to meet PICs conditions. Even though RORO/Ferry ships are deployed in PICs, many of the RORO ships are equipped with surf boats and cranes. A surf boat allows commodities to be carried from/to small islands where a mother ship cannot enter. Small unit containers, less than 20 feet containers, have been introduced to handle small cargoes. Transport and cargo handling technology should be continuously improved. In addition, the relationship between population distribution and RORO terminal needs to be examined further as it will indicate where priority on port improvement should be placed.
(3) Ocean freight rate is added on recycling cost
The extent of the burden of freight rates on transport of recyclable waste materials should be considered. For instance, major scrap material exporters are US, JAPAN and other European developed countries that are located in densely populated areas. They generate a huge volume of recycling materials and this can take advantage of economy of scale. PICs cannot expect this advantage. Scrap metal market including selling prices is dominated by these large generators and consumers.

Data Collection Survey on Reverse Logistics in the Pacific Islands
163
On the other hand, PICs have to export the materials over a long distance. Freight rate in PICs is higher than that in the major world routes. A case study of recycling cost showed that share of water transportation cost was at most 31% of the cost of producing and shipping scrap steel from PICs to the Far East, even though shipping companies provide a lower price for export that for import to encourage export in PICs. Furthermore, domestic freight rates are to be added to the international freight rate when a recycling agent plans to export abroad recyclable materials collected in local islands via the mainland. The export of scrap metal is viable under present market conditions, but future prospect are not known. In order to alleviate impact of freight cost on exporting recycling materials, various kind of efforts will be expected such as improvement of cargo handling operation in ports, volume increment of cargo handling including recycling goods in ports, shipping company’s cooperation, and government assistance for export.
(4) Recycling companies’ lack of information on quarantine regulation at destination port
There are cases where recycled materials shipments were rejected at importing ports because of not satisfying standards. For instance, biosecurity authority of NZ is preparing mandatory treatment and inspection requirement for scrap metal. Plant materials, soil, water, wood and other biosecurity items are regulated. Many of the recyclable materials tend to be exposed to the elements and thus, it will be necessary to clean biosecurity contaminants in processing stage. Precise information on quarantine regulation is necessary for exporter of recycling materials in PICs.

Data Collection Survey on Reverse Logistics in the Pacific Islands
164
Forming reverse logistics in the pacific islandsChapter 6.
6.1 A regional framework of reverse logistics in the pacific islands
6.1.1 Concept of reverse logistic system
A regional framework of reverse logistics system in the pacific islands is shown below. RWGs generated in local islands are expected to be collected and transported to an international port in the main island by domestic shipping. The accumulated RWGs are cleaned, selected, and sorted as commercial commodities and then, stocked in the international port or its vicinity until finally being exported by international shipping.
A framework for forming e reverse logistics in the pacific islands
Figure 6-1 Regional framework of reverse logistics in the pacific islands
Within the regional reverse logistics network, there will be individual reverse logistic network in each country. The following figure shows the example of such domestic reverse logistic network. In order to materialize formation of the reverse logistics network and to promote recycling business in
International Recycling-Port+ Container terminal+ Recycling treatment plant+ Stock yard
Domestic Unit-load Terminal+ RORO terminal+ Recycling treatment yard
Improvement Countermeasure for Reverse Logistics+ External collection to remote and outer islands initially through government support+ Expausion of domestic potential recycling demand+ Introduction of small unit container in domestic route+ RORO terminals upgrade in domestic route+ Capacity building for handling technology and rehabilitation of international container terminal+ Establishment of international platform for recycling business+ Production of more valuable Recycling materials by improving technology
International routeDomestic route
To Far EastFrom far East
530TEU7TEU
2,510TEU
390TEU
70TEU

Data Collection Survey on Reverse Logistics in the Pacific Islands
165
the pacific islands, RWG colleting system that is being now conducted in cities in main islands should be expanded to the whole of the main island as well as local islands. At present in main islands, a recycling company collects RWGs generated in the island, processes them in its workshop, and then exports them to foreign markets from an international port. On the other hand, public sector support may be needed if RWGs in local islands will be collected and stocked in a recycling agent’s premises or port. Since the volume of RWGs in local islands is relatively lower than that in the main island. For example, when the volume of stocked RWGs will reach a certain level in a local island, the RWGs would be packed into a container, and transported from a local port to an international port, and then processed as a commercial commodity, and finally exported to the foreign market. A processing facility for the RWGs from local islands will be prepared in the international port or its vicinity if necessary.
Figure 6-2 Domestic reverse logistic network between a main island and local islands.
6.1.2 Activity and flows of reverse logistics
The next figure shows RWGs’ processing flow in each region. Each activity is listed in each RWGs processing stage from RWGs collecting stage to exporting and selling stage. Region is divided into three based on accessibility to the global market.
The recycling business has been conducted in main cities which have an international port. It would be desirable for the business to cover the whole country or a region to improve environment in the pacific islands. However the business would not be viable due to inefficient transport conditions

Data Collection Survey on Reverse Logistics in the Pacific Islands
166
resulting from the remote and dispersed islands and limited amount of RWGs generation in the island. In this survey, the team will propose three regional categories; a city in a main island which has an
international port (International Port City), the other local cities in the main islands which have an international port (Inland cities in islands with international port), and remote islands (Outer Islands). The team will examine the viability of reverse logistics in each category. In addition, the problems in each stage such as RWG collection, packaging, domestic transportation (land and marine), processing, international transportation, and export and marketing will be identified, and countermeasures for the problem in each stage will be proposed.
Figure 6-3 RWGs’ processing flow and activity in each region.
Domestic transportation(Land)
Quarantine and selling
International transportation
Enhancement of value added to products, and
storage
Collection of RWGs Collection of RWGs
Exporting and selling stage
International transportation
stage
Domestic transportation
Stage
Treatment Stage
Collection stage
International Port CityInland cities in islands with
international port
Activity
Pretransport processing and storage
Transport Preparation
Stage
Domestic transportation(Marine)
Collection of RWGs
Outer Islands
Pretransport processing and storage
Domestic transportation(Land)

Data Collection Survey on Reverse Logistics in the Pacific Islands
167
6.1.3 Categorization and future prospects in five countries
The five countries are divided into three categories based on the development of reverse logistics. At first, the team focused on the activities of recycling companies in each country. In Tuvalu, a one-man enterprise is currently the only recycling business being operated. If he stops his business, the reverse logistic in Tuvalu will be terminated. There is only one company in Tonga; however it is undertaking this business actively. There are a number of recycling companies operating in the other three countries. Stable recycling businesses are expected in these four countries. In Fiji, a registration system for recycling operators has already been introduced to prevent unqualified entities from entering the recycling business. In addition, recycling companies are handling not only scrap metal but also other recycling items and some of RWG is reused in the country of origin.
From a marine transport perspective, the team assessed the five countries to determine whether they can access international network directly or not. The network enables the countries to connect to the final consumer destination of the RWM in the pacific countries. Four countries except Tuvalu connect abroad directly. Tuvalu is outside the multi-calling international network and relies on transshipment from Suva, Fiji. Next, the team examined the present status of domestic marine transport for RWGs. Domestic marine transport for RWGs is operated in Fiji and Tonga but has not yet been introduced in the other three countries.
Based on the review of recycling activity and RWG’s transport in PICs, the team categorized Fiji as category I, Samoa, Tonga and Vanuatu as category II, and Tuvalu as category III respectively. The team defined each category and proposed countermeasures for improving the situation.
Category I: Private recycling companies maximize the items and volume of RWG and improve the collection ratio of RWG to further develop reverse logistics system. Public sector supports their businesses, if necessary.
Category II: Public sector leads and works together with private recycling companies to improve reverse logistics system. The focus will initially be on economically feasible RWGs including scrap metal. Support should be made available to private companies until a stable business environment is created.
Category III: Public sector should play a main role and involve private sector to establish reverse logistics system in the country.
Table 6-1 Categorization in five countries Category I Category II Category III
Countries Fiji Samoa Vanuatu Tonga Tuvalu
Population(2011) 854,120 184,864 251,500 103,036 9,531 Registration system for recycling company ◎ ○ ○ ○ ― Number of recycling company Around 15 Around 3 Around 5 1 1(one man
operation)
Present status of recycling in each
countries and categorization
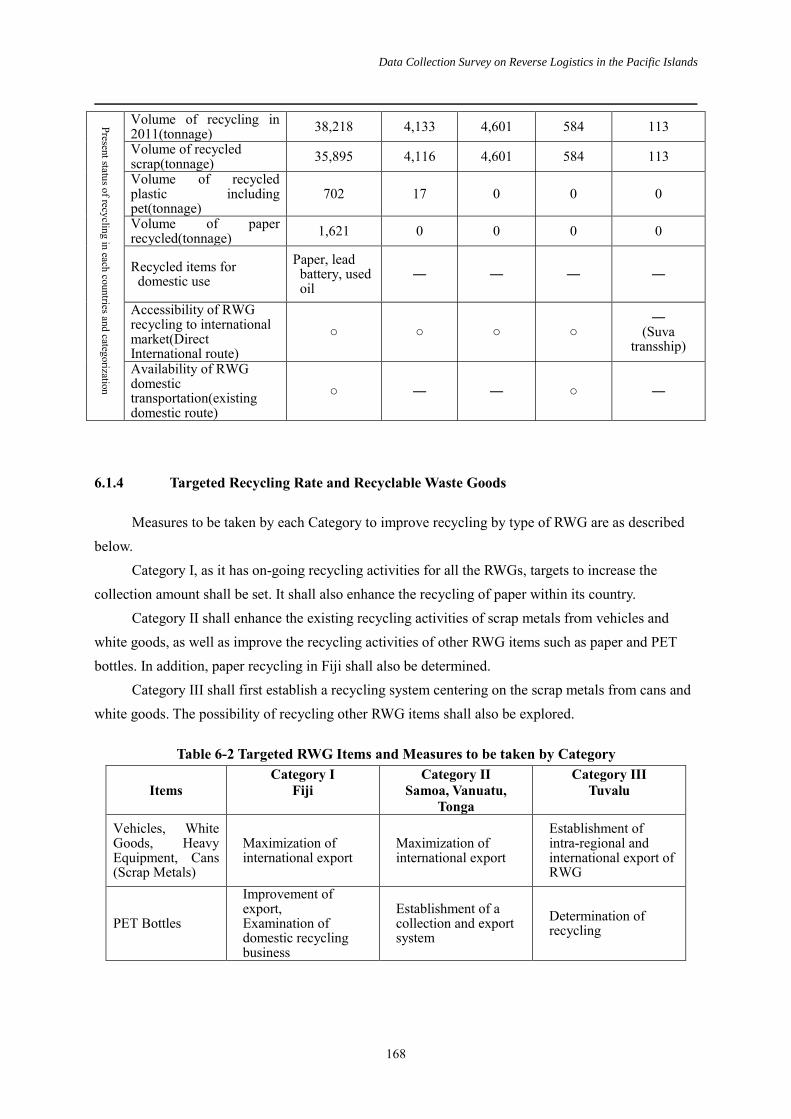
Data Collection Survey on Reverse Logistics in the Pacific Islands
168
Volume of recycling in 2011(tonnage) 38,218 4,133 4,601 584 113 Volume of recycled scrap(tonnage) 35,895 4,116 4,601 584 113 Volume of recycled plastic including pet(tonnage)
702 17 0 0 0
Volume of paper recycled(tonnage) 1,621 0 0 0 0
Recycled items for domestic use
Paper, lead battery, used oil
― ― ― ―
Accessibility of RWG recycling to international market(Direct International route)
○ ○ ○ ○ ―
(Suva transship)
Availability of RWG domestic transportation(existing domestic route)
○ ― ― ○ ―
6.1.4 Targeted Recycling Rate and Recyclable Waste Goods
Measures to be taken by each Category to improve recycling by type of RWG are as described below.
Category I, as it has on-going recycling activities for all the RWGs, targets to increase the collection amount shall be set. It shall also enhance the recycling of paper within its country.
Category II shall enhance the existing recycling activities of scrap metals from vehicles and white goods, as well as improve the recycling activities of other RWG items such as paper and PET bottles. In addition, paper recycling in Fiji shall also be determined.
Category III shall first establish a recycling system centering on the scrap metals from cans and white goods. The possibility of recycling other RWG items shall also be explored.
Table 6-2 Targeted RWG Items and Measures to be taken by Category
Items Category I
Fiji Category II
Samoa, Vanuatu, Tonga
Category III Tuvalu
Vehicles, White Goods, Heavy Equipment, Cans (Scrap Metals)
û Maximization of international export
û Maximization of international export
û Establishment of intra-regional and international export of RWG
PET Bottles
û Improvement of export, û Examination of
domestic recycling business
û Establishment of a collection and export system
û Determination of recycling
Present status of recycling in each countries and categorization

Data Collection Survey on Reverse Logistics in the Pacific Islands
169
Items Category I
Fiji Category II
Samoa, Vanuatu, Tonga
Category III Tuvalu
Paper, Cardboard
û Maximization of domestic recycling business, û Improvement of
international export
û Establishment of a collection system, û Establishment of
intra-regional and international export
û Determination of recycling
Based on the considerations described so far the recycling targets for each of the three categories were set.
In countries of Category I the recycling activities are already progressing, and therefore a modest increase rate of 5% to 10% has been set. Countries of Category II have low recycling rates at present, and the rates are actually very low when compared to that of Fiji. Therefore there is significant room for improvement and accordingly more ambitious improvement rates for recycling nu 2020 of more than 10% of the present rates have been set. In the case of Category III countries, it is first necessary to develop the basic infrastructure to support the reverse logistics, and therefore a low improvement rate of only a few percentage points in 2020 has been targeted.
Accordingly Table 6-3 shows the target improved recycling rates set by category (country) in this Project.
Table 6-3 Target Recycling Rate by Category (Country)
Recycling Rate Category I Fiji
Category II Category III Tuvalu Samoa Vanuatu Tonga
Recycling Rate as of 2011 57% 36% 37% 10% 15%
Target value for 2020 (Targeted rate)
+5%~10% (64%)
+10% or more +a few percent (18%) (48%) (50%) (21%)
The effects of achieving the targeted recycling rates described in Table 6-3 are shown in Table 6-3. If we consider the case of Fiji the amount of RWMs in 2020 when compared to the figure of 2011 would grow by about 13,000 tons. This growth would in turn increase the number of containers to be imported by 630 units, create increased employment of 121 persons in the recycling sector, and decrease the costs of collection and disposal of waste by JPY 66 million. In similar terms for Samoa, Vanuatu and Tonga the growth in recycled waste amount would increase by 3,000 tons, 6,000 tons and 1,000 tons respectively, raising number of container units for export to 150, 300 and 40 units and increasing the number of employees in the recycling countries in these countries to 28 persons, 53 persons and 8 persons. On the other hand reductions in collection and disposal costs of JPY 15 million, JPY 29 million and JPY 4 million may be expected in Samoa, Vanuatu and Tonga respectively. For Tuvalu the recycling amount is expected to grow by 30 tons

Data Collection Survey on Reverse Logistics in the Pacific Islands
170
Table 6-4 Effects of Achieving the Target Recycling Rates
Item Category I
Fiji
Category II Category III
Tuvalu Samoa Vanuatu Tonga
Recycled amount in
2011, tons 38,081 4,741 4,642 598 103
Recycled amount in
2020, tons 51,407 7,813 10,526 1,470 135
Growth amount (tons) 13,326 3,072 5,884 872 32
Container units increase
(units/year) 630 150 300 40 2
Recycling companies
increased employment(1)
(person)
121 28 53 8 0
Reduction in costs of
collection and disposal(2)
(FJ$/year)
1,532,000 353,000 677,000 100,000 4,000
Reduction in costs of
collection and disposal(2)
(JPY/year)
66,000,000 15,000,000 29,000,000 4,000,000 200,000
(1):Our survey result shows that the production rate of one recycling company employee is 110 t/year
(2):National Solid Waste Management Strategy 2011-2014, Fiji indicates that cost for collection and disposal
is FJ$ 115/ year
Source: JICA Study Team

Data Collection Survey on Reverse Logistics in the Pacific Islands
171
6.2 Policies and Strategies to promote Reverse Logistics
Detailed policies and strategies shall be described hereafter for each of the three categories in order to improve reverse logistics at the different phases of the system and towards the public and private sectors respectively.
6.2.1 Category I Policies and Detailed Strategies
The country of category I, Fiji, will implement required countermeasures under the policy of “Private recycling agents maximize the items and volume of RWG and improve the collection ratio of RWG to further develop reverse logistics system. Public sector supports their businesses, if necessary.” aiming to improve reverse logistic in cities which have international ports; inland cities and towns which are located on islands where there are international ports and outer islands. Existing reverse logistics for scrap metal such as discarded vehicles and white goods will be improved and their exports will be maximized.
Existing reverse logistics for PET bottles also will be improved and possibility of domestic recycling will be considered. In addition, existing reverse logistics for waste paper and cardboard will be improved and existing domestic recycling also will be maximized.
(1) Collection Stage
Although the national strategy for solid waste management has already been formulated, however, specific activity and policy for bulky waste are not mentioned. At first the government will analyze the current situation and then formulate policy for collection of recyclable waste goods and their recycling. The policy is expected to stipulate targeted recyclable waste goods and their respective recycling rates and tentatively the following countermeasures are proposed to achieve the targets;
ü Strengthen partnership with recyclers and establish an association ü Implement economic incentives ü Strengthen regional cooperation among PICs ü Collect and provide relevant information of recycling activity ü Study on possibility of PPP (Public-Private Partnership) and ü Support RWG collection from outer islands
Public and private sectors will implement RWG collection in line with the policy.
Institutional and legal set up are required to realize the policy. There are few recovery factories of RWM in Fiji and most of the RWM is exported to foreign countries. Recyclers in Fiji which follow the market principal encounter limitations in the volumes and diversity of targeted RWG because of the high total costs for recycling including maritime transportation cost. Without any economic incentives offered by the public sector, RWGs of low value are difficult to recycle.

Data Collection Survey on Reverse Logistics in the Pacific Islands
172
Institutional and legal set up based on the producer responsibility are not suitable to Fiji which imports most of commodities from foreign countries. It would be more suitable to apply responsibility to importers, dealers and consumers. The Department of Environment of Fiji is promoting the Container Deposit Legislation and Refund System for Fiji (CDL), however there are few measures related to adding levies to waste cars and white goods. To reduce the waste amount and increase the recycling rate, the government should consider that importers, dealers and consumers will bear a part of cost for the recycling, such as 1) levy on car and white goods at the time of import into, sale and purchase; 2) Introduce and promote CDL; 3) provide subsidy for collection and recycling activities; and 4) preferential taxation for collection and recycling activities. One option for the government of a country depending on imports is to levy deposit on the incoming goods within the custom duty at custom clearance. The deposit will be managed as a Recycling Fund with the purpose of promoting RWG collection and recycling activity. In addition, Capacity Development of relevant government officers is required for the policy formulation and the legal set up.
Existing collection system will be improved and expanded in international port cities and inland
cities in islands with international port. With regard to the private sector, recyclers will enhance their collection system for RWGs such as vehicles, heavy equipment and white goods, and cooperate in RWG collection schemes carried out by the public sector. Dealers for vehicles and white goods will be expected to provide deposit funds for RWG. Even though a few recyclers collect waste papers and PET bottles, collection of those goods requires support from the public sector due to low market value especially low price and less generation amount. Therefore public sector will collect those goods and improve their reverse logistics.
Collection system will be introduced in outer islands. Considering that collection systems for
general waste are sporadic in the outer islands, as a first step the public sector will start waste collection and then introduce collection system for RWG. Recyclers may be reluctant to do business in the outer islands, and therefore the public sector will take the lead by starting a pilot project for RWG collection.
Table 6-5 Improvement Measures in the Collection Stage Spatial
Characteristics Activity Policy Detailed Strategy by Implementing Sector Public Sector Private Sector
International Port City
Collection of RWGs
Expansion of collection of RWGs
・Establish RWGs recycling strategy (recycling targets, identify target RWGs, etc.) ・Prepare the related legal framework (determine responsibilities of importer, dealers and consumers; introduce economic incentives) ・Implement separate collection (can, paper, pet
・Recycling companies will collect waste vehicles, heavy equipment and white goods ・Recycling companies will process RWGs collected by public authorities ・Dealers of vehicles and white goods will arrange

Data Collection Survey on Reverse Logistics in the Pacific Islands
173
bottles) ・Increase public awareness
drop off points for waste vehicles and white goods
Inland cities in islands with international
port
Collection of RWGs
Establish a RWG collection system
As above As above
Outer Islands Collection of RWGs
Introduce collection system (include within solid waste collection)
・Develop related legislation ・Develop capacities of related government authorities ・Introduce waste collection ・Implement RWG collection pilot project ・Increase public awareness
・Obtain community cooperation through increased public awareness
(2) Transport Preparation Stage
Transport preparation stage includes preliminary shredding and dismantling, as well as primary storage of RWG collected in outer islands or inland cities in islands with international port, before transporting RWG to the recycling companies in international port city.
For the smooth implementation of this process, it is crucial to install facilities for preparatory treatment and storage in the inland cities in islands with international port. It is suggested that the operation and maintenance of the facilities shall be carried out by private sector, while public sector supports them by providing a preferential treatment such as tax incentives.
It is also necessary to develop those facilities in an outer island. However, there is little incentive for a private company to undertake the development. Therefore, it would be more practical that public sector builds facilities and private sector dispatch workers and operates the facility.
Whichever sector develops facilities for preprocessing and storage, unification of the fundamental functions of the facilities is essential in order to have a versatile system for domestic export, as well as to increase transport efficiency. For this, it is necessary and effective to have a guideline for facility development stating necessary facility, capacity of the facility, planning criteria, selection of machinery and equipment, environmental protection measures, etc.
Table 6-6 Improvement Measures in the Transport Preparation Stage Spatial
Characteristics Activity Policy Detailed Strategy by Implementing Sector
Public Sector Private Sector
Inland cities in islands with international port
Pretransport processing and storage
Construction of
preprocessing and storage
facility
Provide preferential treatment e.g., tax incentives
Develop facility
Operation of facility
Provide preferential treatment e.g., tax incentives
Operate facility
Outer island Pretransport processing and storage
Construction of
preprocessing Develop facility -

Data Collection Survey on Reverse Logistics in the Pacific Islands
174
and storage facility
Operation of facility
Provide preferential treatment e.g., tax incentives
Operate facility
(3) Domestic Transportation Stage
It is difficult to handle a RWG cargo by human power, and its transportation cost is one of the barriers to entering the global market. In general, there are two transportation stages for the RWG cargo. One is RWGs’ land transport between a local city and a central city in the main island. The other is RWGs’ marine transport from local islands to the main island. Hence, in a domestic transportation stage, an efficient transportation system without any loading of cargo or unloading is highly required. As mentioned above, RWG’s transportation covers not only marine transport but also land transportation. The team proposes a RORO system that enables to transport container and truck without any loading or unloading of cargo.
As for land transportation in the main island, improvement of route condition and introduction of a truck and a trailer are possible measures for efficient transportation. Public sector shall improve road condition such as paving and widening road, and/or shall introduce reduction or exemption of tax for private companies’ purchasing the tractor and trailer. Private recycling companies and land transportation companies shall be encouraged to introduce the tractor and trailer for transportation measures in order to mechanize and improve the efficiency of RWG cargo handling.
As for marine transportation between local islands and the main island, RORO system is an essential measure to transport RWGs. Introduction of a RORO ship for domestic shipping routes, construction of port facilities that can accommodate a RORO ship, and reduction of freight rate should be planned and prepared. In order to materialize the plan, public sector should support a private shipping company to replace the existing vessel with a RORO ship, and construct port facilities for the RORO ship. Public also shall offer a RORO ship or subsidize a private RORO ship purchase for RORO operation in remote islands route where private companies cannot serve lines independently due to the high cost operation. In addition, RWG collection requires environmental and sanitary improvement in the islands, and thus introduction of subsidy covering operational cost of domestic route is worth examining.
On the other hand, a private shipping company shall introduce a RORO ship for RORO transport to pursue efficient transport. Public sector support shall be available for the purchase of the RORO ship, if necessary. Furthermore, freight rate adjustment shall be examined by the private shipping company in order to alleviate the imbalance of import and export cargoes.
Finally, a trial demonstration of RWG transportation with the existing route and the ship will be carried out. Public and private sectors will work together on the trial. They can identify the problems

Data Collection Survey on Reverse Logistics in the Pacific Islands
175
for facilitating the RWG transport through the trial, and they can explore the feasibility of introducing reverse logistics in PICs.
In addition, volume of cargoes to/from local islands is small. There is a possibility of over investment when cargo handling facilities for twenty-feet container are introduced. At present, handy containers, less than twenty feet container capacity, are introduced in domestic routes in Samoa and Tonga. It is worth examining the feasibility of introducing these smaller-sized containers in all PICs. Public sector will conduct a feasibility study to introduce the handy container, and set standards for the handy container and prepare a port plan for the container. Private sector will follow the public sector’s study and will examine the feasibility of introducing the handy container and install the container cargo handling equipment and ship’s equipment, if possible.
Table 6-7 Improvement Measures for Domestic Transportation
Spatial Characteris
tics Activity Policy
Detailed Strategy by Implementing Sector
Public Sector Public Sector
International Port City
- - - -
Inland cities in islands with international port
Land transportation
Improvement of land transportation
+Road construction, and Improvement of road condition for RORO transportation
+Facilitation for introduction of a trailer, i.e. tax exemption when purchasing trailers
+Land transport operator purchases trailers and transport RWGs
Outer island Land transportation
Improvement of land transportation
+Road construction, and Improvement of road condition for RORO transportation
+Facilitation for introduction of a trailer, i.e. tax exemption when purchasing trailers
+Land transport operator purchases trailers and transport RWGs
Marine transportation
Improvement of marine transportation
+Trial demonstration of RWG transportation with an existing ship and its route
+ Freight rate alleviation measures
+Operational subsidy and public’s purchasing a ship in remote island route
+facilitation for replacement to a RORO Ship in main island routes
+Trial demonstration of RWG transportation
+Deployment RORO ship
+Freight adjustment for RWG cargo
Improvement of port facility
+Construction of port facility and navigation aid for RORO ship
None
Introduction of handy container
+Installment of cargo handling facilities for a handy container (set for handy container spec, yard pavement, folk-lift and other handling machine )
+introduction of handy container and handling equipment

Data Collection Survey on Reverse Logistics in the Pacific Islands
176
(4) Treatment Stage
All the RWG collected in outer islands and/or inland cities in islands with international port are subject to a treatment to add value at a recycling company’s plant in an international port city.
The main policies in the treatment stage are improvement of treatment and storage facilities and enhancement of environmental protection measures. For the facility improvement, private sector shall first identify the customer needs and quarantine regulation of the receiving countries to introduce an appropriate facility so that the RWM can be sold at higher prices. It is also needed to introduce new treatment technology to convert RWM into high value-added products, as well as to acquire recycling technology where possible. Public sector shall support private sector to upgrade their technique and/or introduce new technology. In regard to this, provision of technical guidance from Japanese recyclers to local recyclers would be effective, as in “Mottainai Project” in Tonga.
For environmental protection, Category I country has already introduced a permit and monitoring system for recycling companies, however, there is still room for improvement in implementation. Public sector shall ensure a thorough implementation of the existing monitoring system and oversee the recyclers to prevent inadequate treatment. Private companies shall practice the environmental protection measures in line with a national guideline.
Table 6-8 Improvement Measures for the Treatment Process
Spatial Characterist
ics Activity Policy
Detailed Strategy by Implementing Sector
Public sector Private sector
International port city
Enhancement of value added to products,
Storage
Improvement of treatment and storage facilities
Provide assistance in obtaining and upgrading of techniques
・Introduce appropriate facilities after identifying customer needs and quarantine regulation
・Acquire and introduce new technology ・Examine and introduce
recycling technology
Strengthening of environmental protection measures
Thoroughly implement monitoring
Implementation of environmental protection measures
(5) International Transportation Stage
It is essential to reduce the total marine transportation cost when exporting RWGs for foreign markets. To achieve this goal, it is necessary to enhance efficiency of port operation and to modernize port facilities and cargo handling equipment. In addition, as a high freight rate is caused by imbalance of volumes of import and export cargo, promotion of volume of export cargo might also improve efficiency of transportation in the PICs,

Data Collection Survey on Reverse Logistics in the Pacific Islands
177
In order to alleviate the present situation, public sector should take an action for development of capacity for port operation and cargo handling, and introduction of an IT system for port operation. Public sector should support construction of port facilities and improvement cargo handling equipment as well. In addition, promotion of cargo generation from the islands will be another option to moderate the freight rate from the islands. Besides recycling business, collection of RWG will contribute to improve sanitation in the island. Not only a recycling company but also public health authorities may work together to collect RWGs from the islands.
Private sector should work together with public sector to improve the efficiency of transportation. A port operator should improve the efficiency of terminal operation and introduce an IT system in port operation and modernize cargo handling equipment. An international shipping company should work together with a consigner and public sector for alleviating freight rate that is a burden for selling RWMs to the global market. The team estimated that export volume of RWM from Fiji will increase from 1,960TEU, in 2011 to 2,510TEU in 2020. This means RWMs might be an important export commodity for Fiji’s economy. Therefore, if RWMs supply is stabilized it may be possible to lower the freight rate although this will ultimately be determined by negotiations.
Table 6-9 Improvement Measures for International Transportation
Spatial Character
istics Activity Policy
Detailed Strategy by Implementing Sector
Public Sector Public Sector
International port city
International Marine transportation
Improvement of port operation
+Capacity development for cargo handling efficiency
+ Introduction of IT system for port operation
+Capacity development of cargo handling skill
+Introduction of IT system for port operation
Improvement and modernization of port facility and handling equipment
+Improvement of port facilities (berth, yard, stock house, and etc) for enhancing port efficiency
+Improvement of equipment for enhancing handling efficiency
Improvement of transport efficiency through export cargo
+Promotion of export cargoes by stimulating industry
+Promotion of export cargo including RWM
(6) Exporting and Selling Stage
When a recycling company sells RWM to foreign market, information on recycling business is essential. At present, private recyclers and interested individuals are searching information on quarantine regulation and buyers in foreign countries by themselves. Formation of a function that individuals can easily access the information on world market as well as regulation in the destination countries is highly expected.
To realize the plan, the public sector should establish a system that provides quarantine regulation on the destination countries and should inform the recycling companies on quarantine and customs regulation in the destination countries. The Public sector should work to collect the regulation

Data Collection Survey on Reverse Logistics in the Pacific Islands
178
information and to enhance skills to recycling agents for packaging and transporting RWM to meet the regulation, as well as to collect information on recycling business market.
Table 6-10 Improvement Measures in the Exporting and Selling Stage
Spatial Characteris
tics Activity Policy
Detailed Strategy by Implementing Sector
Public Sector Public Sector
International port city
Quarantine and selling
Learning regulation on destination countries
+Formulation of platform for providing quarantine and customs information in destination countries
+Providing quarantine and customs information to recycling company
+Collecting quarantine and other regulation information of RWM export
+Enhancement of skill for packing and exporting RWM
Accessing global market information
+Providing market information to recycling agent
+Collecting information of the market.
6.2.2 Category II Policies and Detailed Strategies
The countries of category II, Samoa, Vanuatu and Tonga, will implement required countermeasures under the policy “Public sector leads and works together with private recycling companies to improve reverse logistics system. Focusing on RMG which are economically feasible and aiming at fostering and sustaining private recycling agents.” aiming to improve existing reverse logistic in international port cities and establish reverse logistic in inland cities in islands with international port and outer islands. Existing reverse logistic for scrap metal such as discarded cars and white goods will be improved and their export will be maximized. As for waste PET bottle, papers and cardboard, reverse logistics system needs to established, as there are no existing ones. In addition, export of waste papers to Fiji which has a factory producing toilet paper from waste paper may be considered.
(1) Collection Stage
Countries of category II with support from SPREP are in various stages of formulating their national strategies for solid waste management. At first the governments will analyze the current situation and then formulate policy for collection of recyclable waste goods and their recycling. The policy is expected to stipulate targeted recyclable waste goods and their respective recycling rates . The following countermeasures are tentatively proposed to achieve the targets;
ü Strengthen partnership with recyclers and establish an association ü Implement economic incentives ü Strengthen regional cooperation among PICs ü Collect and provide relevant information of recycling activity ü Study on possibility of PPP (Public-Private Partnership) and

Data Collection Survey on Reverse Logistics in the Pacific Islands
179
ü Support RWG collection from outer islands Public and private sectors will implement RWG collection in line with the policy.
Institutional and legal set up are required to realize the policy. There are no recovery workshops of RWM in those countries and all RWMs are exported to foreign countries. Recyclers in those countries which follow the market principal encounter the limitation of the volume and targeted RWG because of high total cost for recycling including maritime transportation cost. Without any economic incentives from public sector, low value RWG could not be recycled
Institutional and legal set up based on the producer responsibility are not suitable to those countries which import most of commodities form foreign countries. It is more suitable to allocate responsibility to importers, dealers and consumers. These governments have tried to introduce levy system such as Container Deposit Legislation and Refund System and pay waste bag for general wastes. Besides, there are few measures of additional levy to cars and white goods. To reduce the waste amount and increase the recycling rate, the government should consider that importers, dealers and consumers will bear a part of cost for the recycling, such as 1) levy on vehicles and white goods; 2) subsidy for collection and recycling activities; and 3) preferential taxation for collection and recycling activities. One option for countries depending on imports is for their governments to levy a deposit on the imported goods to be included on custom duty at custom clearance. The deposit will be managed as Recycling Fund with the purpose of promoting RWG collection and recycling activity. In addition, Capacity Development of relevant government officers is required for the policy formulation and the legal set up.
Along with Category I, existing collection system will be improved and expanded in international port cities and inland cities in islands with international port. The Public sector will take the initiative to collect waste cans, papers, PET bottle, cars, heavy equipment and white goods. Particularly, papers and PET bottle are not collected due to lower market prices than that of scrap metal. Collection of those RWGs requires support from the public sector. With regard to the private sector, recyclers will cooperate with public sector and process RWG collected by the public sector. Dealers for vehicles and white goods will be expected to provide deposit funds for RWG to promote RWG collection carried out by public sector.
Collection system will be introduced in outer islands. In consideration of few collection systems for general waste in outer islands, at first public sector will start waste collection and then introduce a collection system for RWG. Recyclers may be reluctant to do business in the outer islands, and therefore the public sector will kick-start the effort through implementation of a pilot project for a RWG collection.
Table 6-11 Improvement Measures in the Collection Stage Spatial
Characteristics Activity Policy Detailed Strategy by Implementing Sector Public Sector Private Sector

Data Collection Survey on Reverse Logistics in the Pacific Islands
180
International Port City
Collection of RWGs
Expansion of Collection System
・Establish RWGs recycling strategy (recycling targets, identify target RWGs, etc.) ・Prepare the related legal framework (determine responsibilities of importer, dealers and consumers; introduce economic incentives) ・Develop capacities of related government authorities ・Implement separate collection (can, paper, pet bottles) ・Increase public awareness
・Recycling companies will process RWGs collected by public authorities ・Dealers of vehicles and white goods will arrange drop off points for waste vehicles and white goods
Inland cities in islands with international
port
Collection of RWGs
Introduction of Collection System
As above As above
Outer islands Collection of RWGs
Introduce collection system (include within solid waste collection)
・Develop related legislation ・Develop capacities of related government authorities ・Introduce waste collection ・Increase public awareness
・Obtain community cooperation through increased public awareness
(2) Transport Preparation Stage
Transport preparation stage includes preliminary shredding and dismantling, as well as primary storage of RWG collected in the outer islands or inland cities in islands with international port, before transporting to the recycling companies in the international port cities.
For the smooth transport, it is crucial to install facilities for preprocessing and storage. The project suggests that the public sector construct facility and private sector support its operation in the inland cities in islands with an international port. In outer islands, it is desirable that public sector conducts the development and operation of the facilities and private sector provide technical assistance in facility operation.
Even though the preprocessing and storage facilities are developed by public sector, it is still necessary and effective to have guidelines for the facility development (incl. necessary facility, capacity, planning criteria, selection of machinery and equipment) and environmental protection measures.
Table 6-12 Improvement Measures in the Transport Preparation Stage
Spatial Characteristics Activity Policy
Detailed Strategy by Implementing Sector Public sector Private sector
Inland cities in islands with international
port
Pre-transport processing and storage
Construction of
preprocessing and storage
facility
・ Secure land for the facility
・ Procurement of equipment
-

Data Collection Survey on Reverse Logistics in the Pacific Islands
181
Operation of facility
・ Provide assistance to private sector ・ Operate the facility
Outer islands Pre-transport processing and storage
Construction and operation
of preprocessing and storage
facility
・ Construct and operate preprocessing and storage facility
・ Provide technical guidance to the facility developed by public sector
(3) Domestic Transportation Stage
It is essential to secure smooth transportation between a main island and local islands in order to expand recycling system to local cities in the main island and the local islands. For land transportation in the main island, improvement of route condition and introduction of a truck and a trailer are possible measures for efficient transportation as we mentioned in category I. Public sector shall improve road condition such as paving and widening road and/or shall introduce reduction or exemption of tax for private companies’ purchasing the tractor and the trailer. Private recycling companies and land transportation companies shall be encouraged to introduce the tractor and the trailer for transportation measures in order to mechanize and improve the efficiency of cargo handling.
As for marine transportation, introduction of a RORO ship for domestic shipping routes, development of port facilities that can accommodate a RORO ship, and reduction of freight rate should be planned and prepared as we mentioned in category I. Public sector should support a private shipping company to replace the existing vessel with a RORO ship, and construct port facilities for the RORO ship. Specifically supports for remote island routes in Tonga and main island routes in Vanuatu should be considered.
On the other hand, a private shipping company shall introduce a RORO ship for RORO transport to pursue efficient transport. Public support should be available for the purchase of the RORO ship, if necessary. Furthermore, freight adjustment shall be examined by the private shipping company in order to alleviate the imbalance of import and export cargoes. Finally, a trial demonstration of RWG transportation with the existing route and the ship will be carried out. Public and private sectors will work together on this trial. They can identify the problems for facilitating RWG transport through the trial, and can explore feasibility of introducing reverse logistics. Finally, it is worth examining the feasibility of introducing the smaller-sized containers in all PICs as we proposed earlier in this report.
Table 6-13 Improvement Measures for the Transportation Stage
Spatial Character
istics Activity Policy
Detailed Strategy by Implementing Sector
Public Sector Public Sector
International Port City
- - - -
Inland Land Improvement +Road construction, and +Land transport operator

Data Collection Survey on Reverse Logistics in the Pacific Islands
182
cities in islands with international port
transportation of land transportation
Improvement of road condition for RORO transportation
+Facilitation for introduction of a trailer, i.e. tax exemption when purchasing trailers
purchases trailers and transport RWGs
Outer islands
Land transportation
Improvement of land transportation
+Road construction, and Improvement of road condition for RORO transportation
+Facilitation for introduction of a trailer, i.e. tax exemption when purchasing trailers
+Land transport operator purchases trailers and transport RWGs
Marine transportation
Improvement of marine transportation
+Trial demonstration of RWG transportation with an existing ship and its route
+ Freight rate alleviation measures
+Operational subsidy and public’s purchasing a ship in remote island route in Tonga
+facilitation for replacement to a RORO Ship in Vanuatu
+Trial demonstration of RWG transportation
+Deployment RORO ship
+Freight adjustment for RWG cargo
Improvement of port facility
+Construction of port facility and navigation aid for RORO ship in Main island routes in main island routes
None
Introduction of handy container
+Installment of cargo handling facilities for a handy container (set for handy container spec, yard pavement, folk-lift and other handling machine )
+introduction of handy container and handling equipment
(4) Treatment Stage
RWG collected in outer islands and in inland cities in islands with international port are subject to a treatment to add high value at a plant of recycling company in an international port city.
The main policies in the treatment stage are improvement of treatment and storage facilities and strengthening of environmental protection measures. With respect to the facility improvement, the role of public sector is to give assistance to private sector’s upgrading and/or introduction of technologies, as well as to construct a facility to treat and store the RWG from outer islands.
Private sector shall make a concerted effort to establish reverse logistics from outer islands by effectively using their own factory and/or treatment and storage facilities prepared by public sector. At the same time, private sector shall identify the customer needs and quarantine regulation of the receiving countries to introduce an appropriate facility, so that RWM can be sold at higher prices.
Furthermore, it is also needed to introduce new treatment technology to convert RWGs into high value-added products. For this, provision of technical guidance from Japanese recyclers to local recyclers is an effective way, as proved in “Mottainai Project” in Tonga.
To strengthen environmental protection measures, public sector shall introduce a permit and monitoring system for recyclers in reference to the system of Fiji and Japan, and also provide

Data Collection Survey on Reverse Logistics in the Pacific Islands
183
environmental education and/or support for technology acquisition in order to cultivate good recyclers. Private sector shall practice the environmental protection measures in line with the national guidelines.
Table 6-14 Improvement Measures in the Treatment Stage Spatial
Characteristics
Activity Policy Detailed Strategy by Implementing Sector
Public sector Private sector
International port city
Enhancement of value added to products,
storage
Improvement of treatment and storage facilities
û Provide assistance in obtaining and upgrading of technique û Install treatment/
storage facility for RWG from outer islands
・Introduce appropriate facilities after identifying customer needs and quarantine regulation
・Acquire and introduce new technology ・Actively utilize the treatment/storage facility prepared by public sector
Enhancement of value added to products,
storage
Strengthening of environmental protection measures
û Introduce a permit/monitoring system û Provide support in
environmental education and acquisition of techniques
Implement environmental protection measures
(5) International Transportation Stage
In category II, it is essential to follow plans and measures as we discussed in category I. In sum, it is necessary to enhance efficiency of port operation and to modernize port facility and cargo handling equipment. In addition, promotion of export cargo will also improve efficiency of transportation in the PICs, because high freight rate is caused by imbalance of volumes of import and export cargo.
The team estimated that total export volume of RWM in Samoa,Tonga and Vanuatu will reach to 900TEUs in 2020 which will be almost double compared to that in 2011.These country do not have a sufficient volume of export cargo, so RWMs might be a major commodity for export. Therefore, freight rate might be reduced if RMWs supply could be stabilized.
Table 6-15 Improvement Measures for International Transportation Stage
Spatial Character
istics Activity Policy
Detailed Strategy by Implementing Sector
Public Sector Public Sector
International port city
International Marine transportation
Improvement of port operation
+Capacity development for cargo handling efficiency
+ Introduction of IT system for port operation
+Capacity development of cargo handling skill
+Introduction of IT system for port operation
Improvement and modernization of port facility
+Improvement of port facilities (berth, yard, stock house, and etc) for enhancing port efficiency
None
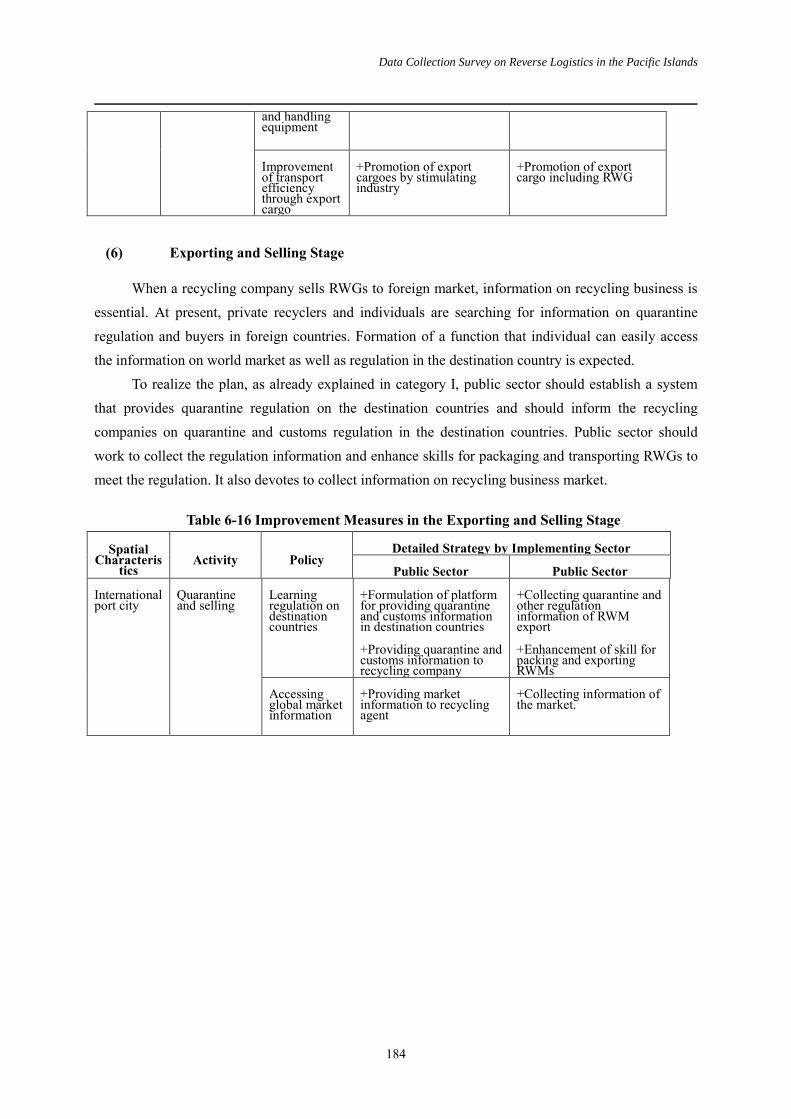
Data Collection Survey on Reverse Logistics in the Pacific Islands
184
and handling equipment
Improvement of transport efficiency through export cargo
+Promotion of export cargoes by stimulating industry
+Promotion of export cargo including RWG
(6) Exporting and Selling Stage
When a recycling company sells RWGs to foreign market, information on recycling business is essential. At present, private recyclers and individuals are searching for information on quarantine regulation and buyers in foreign countries. Formation of a function that individual can easily access the information on world market as well as regulation in the destination country is expected.
To realize the plan, as already explained in category I, public sector should establish a system that provides quarantine regulation on the destination countries and should inform the recycling companies on quarantine and customs regulation in the destination countries. Public sector should work to collect the regulation information and enhance skills for packaging and transporting RWGs to meet the regulation. It also devotes to collect information on recycling business market.
Table 6-16 Improvement Measures in the Exporting and Selling Stage
Spatial Characteris
tics Activity Policy
Detailed Strategy by Implementing Sector
Public Sector Public Sector
International port city
Quarantine and selling
Learning regulation on destination countries
+Formulation of platform for providing quarantine and customs information in destination countries
+Providing quarantine and customs information to recycling company
+Collecting quarantine and other regulation information of RWM export
+Enhancement of skill for packing and exporting RWMs
Accessing global market information
+Providing market information to recycling agent
+Collecting information of the market.

Data Collection Survey on Reverse Logistics in the Pacific Islands
185
6.2.3 Category III Policies and Detailed Strategies
The country of category III, Tuvalu, will implement required countermeasures under the policy of “Public sector should play a main role and involve private sector to establish reverse logistics system in a country.” The activities will be implemented only in an international port city.
(1) Collection Stage
The country of category III, Tuvalu, with support from SPREP and EU has formulated a national strategy for solid waste management. At first the government will analyze the current situation and then formulate policy for collection of recyclable waste goods and the recycling. The policy is expected to stipulate targeted recyclable waste goods and their recycling rate in each and tentatively following countermeasures to achieve the targets;
ü Strengthen partnership with recyclers and establish an association
ü Strengthen regional cooperation among PICs
ü Collect and provide relevant information of recycling activity
Public and private sectors will implement RWG collection in line with the policy.
Institutional and legal set up are required to realize the policy. Now EU prepares a basic law for solid waste management, Waste Operation and Public Act. The government has interest in levy system such as Container Deposit Legislation and Refund System. In addition, capacity development of relevant government officers who formulate the policy and prepare the legal basis is also required for promoting RWG collection.
It is necessary for country of category III to establish reverse logistics, and at first collection for cans and vehicles will be established in the international port city. Even though a processing workshop for RWG will be constructed in the landfill site under the EU funded project, the project does not include introduction of RWG collection. Therefore the public sector will implement collection for cans, vehicles, heavy equipment and white goods. The recyclers will cooperate with collection and recycling of RWG.
Table 6-17 Improvement Measures in the Collection Stage Spatial
Characteristics Activity Policy Detailed Strategy by Implementing Sector Public Sector Private Sector
International Port City
Collection of RWGs
Establishment of Collection System
・Establish RWGs recycling strategy (recycling targets, identify target RWGs, etc.) ・Prepare the related legal framework ・Implement separate collection (can, paper, pet
・Recycling companies will process RWGs collected by public authorities

Data Collection Survey on Reverse Logistics in the Pacific Islands
186
bottles) ・Increase public awareness
(2) Transport Preparation Stage
Category III shall initially focus on establishing reverse logistics in the international port city and does not target outer islands and inland cities in islands with an international port. Therefore, this project does not address the RWG transport preparation stage for category III.
(3) Domestic Transportation Stage
Category III shall initially focus on establishing reverse logistics in the international port city and does not target outer islands and inland cities in islands with an international port. Therefore, this project does not address the RWG transport preparation stage for category III.
(4) Treatment Stage
The main policies to improve treatment stage include improvement of treatment and storage facilities and enhancement of environmental protection measures. However, EU has already planned to construct a RWG treatment facility, which can realize “improvement of treatment and storage facility” if it is carried out as planned. In this case, due to the limited generation amount of RWG, the existing recycling company would not be able to continue its business. Public sector shall take some measures to avoid this, for instance, entrusting the facility operation to the existing recycling company.
For strengthening of environmental protection measures, public sector shall provide environmental education and/or support for technology acquisition to the operator of the waste treatment facility. The operator shall conduct environmental protection measures in accordance with the national guidance.
Table 6-18 Detailed Strategy by Implementing Sector in the Treatment Stage Spatial
Characteristics
Activity Policy Detailed Strategy by Implementing Sector
Public sector Private sector
International port city
Enhancement of value added to products,
Storage
Improvement and maintenance of treatment/storage facility
û Construct a treatment facility with aid from EU û Entrust operation of
the facility to existing recyclers
û Support treatment facility operation
Strengthening of environmental protection measures
û Provide support for environmental education and technical acquisition
û Implement environmental protection measures

Data Collection Survey on Reverse Logistics in the Pacific Islands
187
(5) International Transportation Stage
Due to all the international container to Tuvalu is transshipped in Suva port, Fiji, imbalance of large amount of import cargoes and few export cargoes in Tuvalu, and absolute small amount of cargo transportation, freight rate is the highest among PICs. In addition, a private recycling agent has little knowledge of RWG’s transportation and handling and processing.
A marine transportation agent should examine to alleviate the freight rate, especially export rate. If the marine agent’s support is far from the expectation, Tuvalu government or foreign donors should support to moderate freight rate. Tuvalu is located geographically remote, thus public sector support is highly needed. Next, it is expected that volume of annual cargo will be few, public sector should prepare stock yard for RWG to fill up twenty-feet container or examine introduction of a handy container that will make easy to export RWM from Tuvalu to a foreign country.
On the other hand, private should devote to enhance capacity of transporting and handling RWMs and obtain equipment maintenance skills.
Table 6-19 Improvement Measures for International Transportation Stage
Spatial Characteris
tics Activity Policy
Detailed Strategy by Implementing Sector
Public Sector Public Sector
International port city
International transportation
Moderation of freight rate
+Provide financial support for freight rate
+Examine the alleviation of freight rate, especially export cargo
Providing transportation and handling machine, and stock yard for RWG
+Providing transportation and cargo handling measures to private
+Providing stock yard for RWG
+ Introduction of handy container
Enhancing transportation and handling equipment skill
+Developing capacity of transportation skill and maintenance skill
+Enhancing operational skill for transporting and handling RWM
(6) Exporting and Selling Stage
When a recycling company sells RWMs to foreign market, information on recycling business is essential. At present, private recycler is searching information on quarantine regulation and buyers in foreign countries. Formation of a function that the recycler can easily access the information on world market as well as regulation in the destination countries is expected.
To realize the plan, as already explained in category I, public sector should establish system that provides quarantine regulation on the destination countries and should inform the recycling companies on quarantine and customs regulation in the destination countries. Public sector should work to collect the regulation information and enhance skills for packaging and transporting RWMs to meet the

Data Collection Survey on Reverse Logistics in the Pacific Islands
188
regulation. It also devotes to collect information on recycling business market.
Table 6-20 Improvement Measures in the Exporting and Selling Stage
Spatial Characteris
tics Activity Policy
Detailed Strategy by Implementing Sector
Public Sector Public Sector
International port city
Quarantine and selling
Learning regulation on destination countries
+Formulation of platform for providing quarantine and customs information in destination countries
+Providing quarantine and customs information to recycling company
+Collecting quarantine and other regulation information of RWM export
+Enhancement of skill for packing and exporting RWMs
Accessing global market information
+Providing market information to recycling agent
+Collecting information of the market.

Data Collection Survey on Reverse Logistics in the Pacific Islands
189
“6.2 Policies and Strategies to promote Reverse Logistics” is arranged according to the category.
Table 6-21 List of the detailed policies and strategies in the category I (Fiji)
Stage Spatial
Characteristics Activity
To promote reverse logistic business Policy
Detailed Strategy by Implementing Sector Support menu
Current state Problem Public sector Private sector JICA(Cooperation with an international
organization)
Collection
stage
International
Port City
Collection of
RWGs
・Public sector implements solid waste
management.
・Recyclers collect RWGs (cars, heavy
equipment, white goods, cans, PET
bottle, papers)
・Public sector does not provide separate
collection.
There are a lot of
uncollected RWGs.
Expansion of
collection of
RWGs
・Establish RWGs recycling strategy
(recycling targets, identify target
RWGs, etc.)
・ Prepare the related legal
framework (determine
responsibilities of importer, dealers
and consumers; introduce economic
incentives)
・ Implement separate collection
(can, paper, pet bottles)
・Increase public awareness
・Recycling companies will
collect waste vehicles, heavy
equipment and white goods
・Recycling companies will
process RWGs collected by
public authorities
・Dealers of vehicles and white
goods will arrange drop off
points for waste vehicles and
white goods
・Support for formulating policy on
RWG collection (cans, papers, PET
bottle, cars, heavy equipment and white
goods)
・Pilot project for collection of RWG
(cans, papers and PET bottle)
・Support for institutional and legal set up
・Training in Japan to officers from
presiding authority
Inland cities in
islands with
international
port
・Public sector implement solid waste
management in most of the inhabited
area.
・Recyclers collect scrap metals.
・Public sector does not provide separate
collection.
RWG collection by
recyclers shall be
strengthened and
promoted.
Establish a RWG
collection system As above As above As above
Outer Islands
・Public sector implements solid waste
management in city areas
・Recyclers collect scrap metals in some
limited areas
RWG collection by
recyclers shall be
strengthened and
promoted.
There are few recyclers if
any at all.
Introduce
collection system
(include within
solid waste
collection)
・Develop related legislation
・Develop capacities of related
government authorities
・Introduce waste collection
・Implement RWG collection pilot
project
・Increase public awareness
・ Obtain community
cooperation through increased
public awareness
・Support for institutional and legal set up
・Training in Japan for officers from
presiding authority
Transport
Preparation
Stage
Inland cities in
islands with
international
port
Pretransport
processing and
storage
RWG is roughly shredded for ease of
truck loading.
Preprocessing and storage
are required for ease of
transport.
Construction of
preprocessing
and storage
facility
Provide preferential treatment e.g.,
tax incentives Develop facility
'Formulation of guidelines on
construction of preprocessing and storage
facility
Operation of
facility
Provide preferential treatment e.g.,
tax incentives Operate facility
Outer Islands Pretransport
processing and
Pre-processing and storage are basically
not implemented due to lack of RWG
Preprocessing and storage
are required for ease of
Construction of
preprocessing Develop facility -

Data Collection Survey on Reverse Logistics in the Pacific Islands
190
storage collection. transport. and storage
facility
Operation of
facility
Provide preferential treatment e.g.,
tax incentives Operate facility
Domestic transportation stage
Inland cities in islands with international port
Land transportation
+Paved road is limited. Trucks and other large vehicles can only pass this road in a limited area. A truck and other large vehicles can pass the road in a limited area. +Tractors and trailers for carrying containers have not been widely introduced because of heavy taxation. Introduction of tractors and trailers that can carry a container is limited because of heavy taxation.
Collection of RWG is the first priority, however improvement of road condition and introduction of trucks and trailers are possible measures.
Improvement of land transportation
+Road construction, and Improvement of road condition for RORO transportation +Facilitation for introduction of trailers, i.e. tax exemption when purchasing trailers
+Land transport operator purchases trailers and transports RWGs
+Assistance in policy making through implementing a survey on introduction of unit load system on land transportation
Outer island Land transportation
+Little RWG transport is conducted because there is no collection of RWG in the islands or because of a shortage of paved roads. Transportation is implemented in island because of no collection of RWG in the islands, or shortage of paved road for RORO transport,. + Tractors and trailers for carrying containers have not been widely introduced because of heavy taxation. Introduction of a trailer and a truck is limited because of heavy taxation on purchasing them.
+ The collection of RWG is the first priority, however improvement of route condition and introduction of trailers and trucks are essential.
Improvement of land transportation
+ Road construction and improvement of road condition for RORO transportation. + Facilitation for introduction of trailers, i.e. tax exemption when purchasing trailers
+Land transport operator purchases trailers and transports RWGs
+Assistance in policy making through on implementing a survey on introduction of RORO system.
Marine transportation
+Private companies are operating main routes, while a public company is operating remote island route. +RORO system is introduced between Viti-Levu and Vanua-Levu. RWG is transported in the route. However no RWG is transported in the other islands as RWG is not collected in the islands; port facilities
+The collection of RWG is the first priority, however the development of port facilities that enable RORO transport, operation of RORO vessels, setting freight that enables RWG
Improvement of marine transportation
+Trial demonstration of RWG transportation with an existing ship and its route + Freight rate alleviation measures +Operational subsidy and s purchasing of ship by public sector in remote island route +facilitation for replacement to a RORO Ship in main island routes
+Trial demonstration of RWG transportation +Deployment RORO ship +Freight adjustment for RWG cargo
+Assistance in policy making through on implementing a survey on introduction of RORO system. +Financial support for introducing RORO vessels in the remote island routes.

Data Collection Survey on Reverse Logistics in the Pacific Islands
191
are poor as well. due to no collection of RWG in the islands, nor poor port facility for EORO transport. +A handy container is not introduced.
transport should be examined.. +As total volume of RWG is small, introduction of a handy container less than a 20 feet container should be examined.
Improvement of port facility
+Construction of port facility and navigation aid for RORO ship
None +To conduct a study on introducing RORO system in each county. +Financial support for port development that enables RORO transport.
Introduction of handy container
+Installment of cargo handling facilities for a handy container (set for handy container spec, yard pavement, fork-lift and other handling machines )
+Introduction of handy container and handling equipment
+Assistance in policy making for establishing a handy container standard, and introducing the container in PICs. +Financial support for introducing a handy container.
Treatment
Stage
International
Port City
Enhancement of
value added to
products,
Storage
Most recyclers cannot add sufficient
value to their RWM except for some
RWMs
・ Commercialization in
international markets are
required
・Improvement of work
conditions and mitigation
of environmental impacts
are required
Improvement of
treatment and
storage facilities
Provide assistance in obtaining and
upgrading of techniques
・ Introduce appropriate
facilities after identifying
customer needs and
quarantine regulation
・Acquire and introduce new
technology
・ Examine and introduce
recycling technology
・Technical support to recyclers to add
more value to their processed RWMs
and to enhance their efficiency
Strengthening of
environmental
protection
measures
Thoroughly implement monitoring
Implementation of
environmental protection
measures
・Strengthening monitoring system
International transportation
International port city
International Marine transportation
+ RWG is handled in Suva port, however cargo handling efficiency in Suva port is not good condition due to insufficient cargo handling equipment. This leads to longer cargo handling, dummurage of ship, and raises cost of cargo handling. +Since international container ships are part of a multi calling network, delay of cargo handling in one port adversely affect the entire shipping
+ It is necessary to reduce operational cost in port. +It is necessary to modernize port facility and cargo handling equipment, and to improve delay of cargo handling and ship schedule. +It is necessary to
Improvement of port operation
+Capacity development for cargo handling efficiency + Introduction of IT system for port operation
+Capacity development of cargo handling skill +Introduction of IT system for port operation
+Capacity building for improving cargo handling. +assistance for introducing IT system for port operation.
Improvement and modernization of port facility and handling equipment
+Improvement of port facilities (berth, yard, stock house, and etc) for enhancing port efficiency
+Improvement of equipment for enhancing handling efficiency
+financial support for improving port facility.

Data Collection Survey on Reverse Logistics in the Pacific Islands
192
schedule. +Imbalance of import and export cargo leads to inefficient transport.
improve efficiency of transport through gaining additional export cargoes.
Improvement of transport efficiency through export cargo
+Promotion of export cargoes by stimulating industry
+Promotion of export cargo including RWM
+ Implementing a survey on export cargo including first industry commodity and support for producers +Implementing a survey on RWG transport in the respect of improving environment in the islands.
Exporting and selling RWM stage
International port city
Quarantine and selling
+Recycling company sometimes does not obtain sufficient RWM’s information on destination country. +Individual is searching information and exporting GWMs by himself, he tends to be lack recycling market information.
+It is necessary to notice quarantine information on destination countries. +It is necessary to make access easier the global recycling market.
Learning regulation on destination countries
+Formulation of platform for providing quarantine and customs information in destination countries +Providing quarantine and customs information to recycling company
+Collecting quarantine and other regulation information of RWM export +Enhancement of skill for packing and exporting RWM
+Assistance for forming a framework on quarantine and customs information for exporting RWGs.
+Collecting information of the market.
+Assistance for enhancing skills to recycling agents for packaging and transporting RWGS to meet the regulation.
Accessing global market information
+Providing market information to recycling agent
+Collecting information of the market.

Data Collection Survey on Reverse Logistics in the Pacific Islands
193
Table 6-22 List of the detailed policies and strategies in the category II (Samoa,Tonga,Vanuatu)
Stage Spatial
Characteristics Activity
To promote reverse logistic business
Policy
Detailed Strategy by Implementing Sector Support menu
Current state Problem Public sector Private sector JICA(Cooperation with an international
organization)
Collection stage
International Port City
Collection of RWGs
・Public sector implements solid waste management. ・Recyclers collect scrap metals ・Public sector does not provide separate collection.
There are a lot of uncollected RWGs.
Expansion of Collection System
・Establish RWGs recycling strategy (recycling targets, identify target RWGs, etc.) ・Prepare the related legal framework (determine responsibilities of importer, dealers and consumers; introduce economic incentives) ・ Develop capacities of related government authorities ・ Implement separate collection (can, paper, pet bottles) ・Increase public awareness
・Public sector implements solid waste management. ・Recyclers collect scrap metals ・Public sector does not provide separate collection.
There are a lot of uncollected RWGs.
Inland cities in islands with international port
・Public sector implements solid waste management in most of the inhabited area. ・Recyclers collect scrap metals. ・Public sector does not provide separate collection.
RWG collection by recyclers shall be strengthened and promoted.
Introduction of Collection System
As above
・Public sector implements solid waste management in most of the inhabited area. ・Recyclers collect scrap metals. ・Public sector does not provide separate collection.
RWG collection by recyclers shall be strengthened and promoted.
Outer Islands
・Public sector implements solid waste management in the city areas ・There is no collection for scrap metals
RWG collection by recyclers shall be strengthened and promoted. There are no recyclers.
Introduce collection system (include within solid waste collection)
・Develop related legislation ・ Develop capacities of related government authorities ・Introduce waste collection ・Increase public awareness
・Public sector implements solid waste management in the city areas ・There is no collection for scrap metals
RWG collection by recyclers shall be strengthened and promoted. There are no recyclers.
Transport Preparation Stage
Inland cities in islands with international port
Pretransport processing and storage
RWG is roughly shredded for ease of truck loading.
Preprocessing and storage are required for ease of transport.
Construction of preprocessing and storage facility
・ Secure land for the facility ・ Procurement of equipment
-
・ Formulation of guidelines on construction of preprocessing and storage facility ・Construction of preprocessing and Operation of facility ・ Provide assistance to ・ Operate the facility

Data Collection Survey on Reverse Logistics in the Pacific Islands
194
private sector storage facility
Outer Islands Pretransport processing and storage
Pre-processing and storage are basically not implemented due to lack of RWG collection.
Preprocessing and storage are required for ease of transport.
Construction and operation of preprocessing and storage facility
・ Construct and operate preprocessing and storage facility
・ Provide technical guidance to the facility developed by public sector
Domestic transportation stage
Inland cities in islands with international port
Land transportation
+Paved road is limited. A truck and other large vehicles can pass the road in a limited area.
+Collection of RWG is the first priority, however improvement of road condition and introduction of trucks and trailers are possible measures.
Improvement of land transportation
+Road construction, and Improvement of road condition for RORO transportation +Facilitation for introduction of trailers, i.e. tax exemption when purchasing trailers
+Land transport operator purchases trailers and transports RWGs
+Assistance in policy making through implementing a survey on introduction of unit load system on land transportation
Outer island Land transportation
+Little RWG transport is conducted because there is no collection of RWG in the islands or because of a shortage of paved roads.
+ The collection of RWG is the first priority, however improvement of route condition and introduction of trailers and trucks are essential.
Improvement of land transportation
+ Road construction and improvement of road condition for RORO transportation in major outer islands. + Facilitation for introduction of trailers, i.e. tax exemption when purchasing trailers
+Land transport operator purchases trailers and transports RWGs
+Assistance in policy making through on implementing a survey on introduction of RORO system.
Marine transportation
+In Samoa, a privatized national shipping company is operating frequent marine service between two main islands. However there is no RWG transport between the islands. +In Vanuatu, middle or small shipping companies are operating. Deployed vessels are small and cannot carry RWG. +In Tonga, privatized national shipping company is operating. At present, there is no RWG transport among the islands, because of limited generation of RWG and poor port facilities in the islands. + Handy containers have already
+The collection of RWG is the first priority, however the development of port facilities that enable RORO transport, operation of RORO vessels, setting freight that enables RWG transport should be examined. +As total volume of RWG is small, introduction of a handy container less than a 20 feet container should be examined.
Improvement of marine transportation
+Trial demonstration of RWG transportation with an existing ship and its route + Freight rate alleviation measures such as operational subsidy and purchasing of ship by public sector in remote island route +In Tonga, assistance for purchasing RORO vessels and its operation in remote island routes. + In Vanuatu, assistance for replacement of RORO Vessels in major outer islands.
+Trial demonstration of RWG transportation +Deployment RORO ship +Freight adjustment for RWG cargo
+Assistance in policy making through on implementing a survey on introduction of RORO system. +Financial support for introducing RORO vessels in the remote island routes.

Data Collection Survey on Reverse Logistics in the Pacific Islands
195
been introduced in Samoa and Tonga. These are still premature stages. The specifications of the handy containers are different.
Improvement of port facility
+Construction of port facility and navigation aid for RORO ship in major outer islands
None +To conduct a study on introducing RORO system in each county. +Financial support for port development that enables RORO transport.
Introduction of handy containers
+Installment of cargo handling facilities for a handy container (set for handy container spec, yard pavement, fork-lift and other handling machines )
+Introduction of handy container and handling equipment
+Assistance in policy making for establishing a handy container standard, and introducing the container in PICs. +Financial support for introducing a handy container.
Treatment Stage
International Port City
Enhancement of value added to products, Storage
Most of recycler can not add sufficient value to their RWM except for some RWMs
・ Commercialization in international markets is required ・ Improvement of work conditions and mitigation of environmental impacts are required
Improvement of treatment and storage facilities
� Provide assistance in obtaining and upgrading of technique � Install treatment/ storage facility for RWG from outer islands
・ Introduce appropriate facilities after identifying customer needs and quarantine regulation ・Acquire and introduce new technology ・ Actively utilize the treatment/storage facility prepared by public sector
・Technical support to recyclers to add more value and to enhance their efficiency ・Construction of treatment and storage facility
Strengthening of environmental protection measures
� Introduce a permit/monitoring system � Provide support in environmental education and acquisition of techniques
Implement environmental protection measures
・Support for introduction of permission and monitoring system
International transportation stage
International port city
International transportation
+ Containerized RWGs are handled in Apia port in Samoa, Nukualofa port in Tonga, Portvilla port and EsprituSanto port in Vanuatu, however cargo handling efficiency in these ports are not good condition due to insufficient cargo handling equipment. This leads to longer cargo handling, dummurage
+ It is necessary to reduce operational cost in port. +It is necessary to modernize port facility and cargo handling equipment, and to improve delay of cargo handling and ship schedule.
Improvement of port operation
+Capacity development for cargo handling efficiency + Introduction of IT system for port operation
+Capacity development of cargo handling skill +Introduction of IT system for port operation
+Capacity building for improving cargo handling. +assistance for introducing IT system for port operation.
Improvement and modernization of port facility and handling equipment
+Improvement of port facilities (berth, yard, stock house, and etc) for enhancing port efficiency
+Improvement of equipment for enhancing handling efficiency
+financial support for improving port facility.
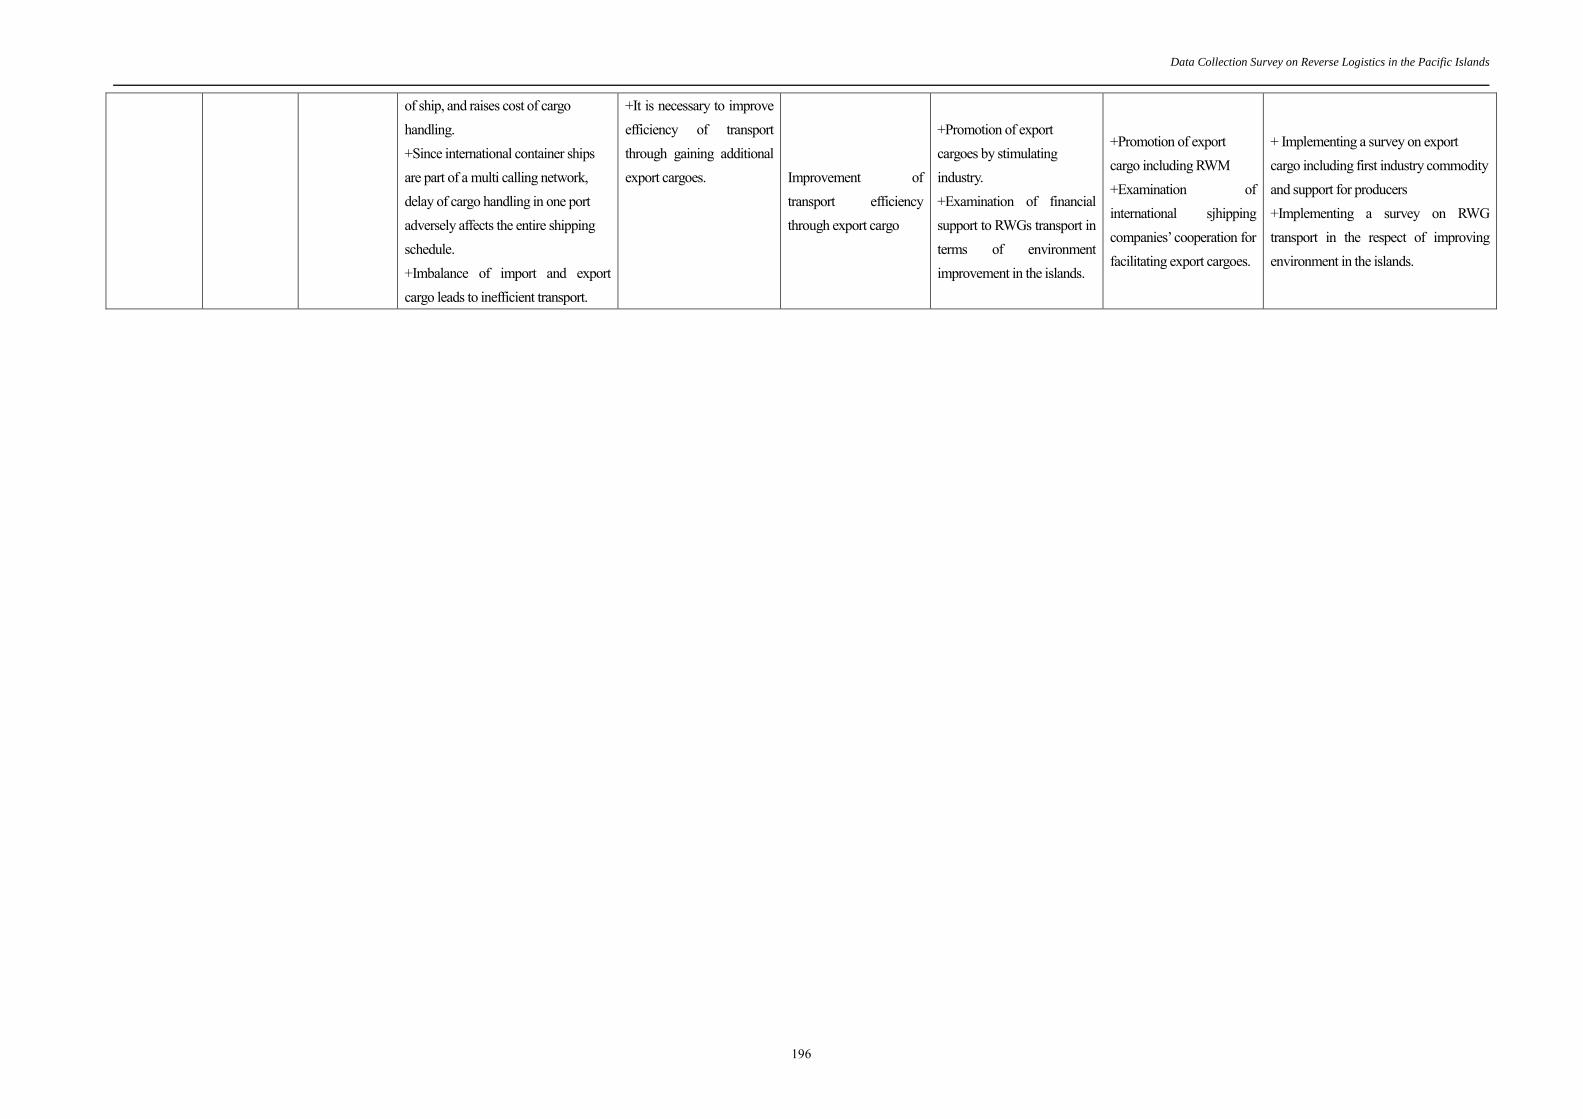
Data Collection Survey on Reverse Logistics in the Pacific Islands
196
of ship, and raises cost of cargo handling. +Since international container ships are part of a multi calling network, delay of cargo handling in one port adversely affects the entire shipping schedule. +Imbalance of import and export cargo leads to inefficient transport.
+It is necessary to improve efficiency of transport through gaining additional export cargoes. Improvement of
transport efficiency through export cargo
+Promotion of export cargoes by stimulating industry. +Examination of financial support to RWGs transport in terms of environment improvement in the islands.
+Promotion of export cargo including RWM +Examination of international sjhipping companies’ cooperation for facilitating export cargoes.
+ Implementing a survey on export cargo including first industry commodity and support for producers +Implementing a survey on RWG transport in the respect of improving environment in the islands.

Data Collection Survey on Reverse Logistics in the Pacific Islands
197
Table 6-23 List of the detailed policies and strategies in the category III (Tuvalu)
Stage Spatial
Characteristics Activity
To promote reverse logistic business Policy
Detailed Strategy by Implementing Sector Support menu
Current state Problem Public sector Private sector JICA(Cooperation with an international organization)
Collection stage International Port City
Collection of RWGs
・Public sector implements solid waste management. ・Recyclers collect scrap metals ・Recycler do business on a low scale level
There are a lot of uncollected RWG.
Establishment of Collection System
・ Establish RWGs recycling strategy (recycling targets, identify target RWGs, etc.) ・ Prepare the related legal framework ・ Implement separate collection (can, paper, pet bottles) ・ Increase public awareness
・Recycling companies will process RWGs collected by public authorities
・ Support for formulating policy on RWG collection (cans, cars and heavy equipment) ・Pilot project for collection of RWG ・Support for institutional and legal set up
Treatment Stage International Port City
Enhancement of value added to products, Storage
The recycler can not add sufficient value to their RWM
・ Commercialization in international markets is required ・Improvement of work conditions and mitigation of environmental impact are required
Improvement and maintenance of treatment/storage facility
� Construct a treatment facility with aid from EU � Entrust operation of the facility to existing recyclers
� Support treatment facility operation
・Technical support to recyclers to add more value and to enhance their efficiency
Strengthening of environmental protection measures
� Provide support for environmental education and technical acquisition
� Implement environmental protection measures
---
International transportation stage
International port city
International transportation
Funafuti is the only port where a container ship calls, however its cargo handling is conducted by a ship crane. In addition, cargoes are transshipped in Suva port, Fiji and there is a severe imbalance of import/export cargoes. This result is in a higher freight rate than other
It is necessary to reduce operational cost and secure stock yard, and maintain cargo handling equipment .
Improvement of marine freight rate
Examination of assistance for transshipment cargo
Examination of shipping companies’ assistance for facilitating exporting cargoes.
+Assistance for policy making assistance for improving transshipment.
Securing stock yard for RWGs
+Securing stock yard of RWGs
Enhancement of cargo + Grant for cargo +Capacity building on +Capacity building on cargo

Data Collection Survey on Reverse Logistics in the Pacific Islands
198
route in PICs and makes it difficult to export RWG from Tuvalu. , + Several container yards are scattered in the island. And operational duration of cargo handling machine is low due to poor maintenance.
handling equipment and maintenance skills.
handling equipment. +Capacity building on cargo handling equipment operation and maintenance. + Examination of introduction of a handy container
cargo handling equipment operation and maintenance.
handling equipment operation and maintenance.
Exporting and selling RWM stage
International port city
Quarantine and selling
+Recycling company sometimes does not obtain sufficient RWM’s information on destination country. +Even though individual companies search for information, and export GWMs by themselves, there tend to be a lack of recycling market information.
+It is necessary to notice quarantine information on destination countries. +It is necessary to make access easier the global recycling market.
Learning regulation on destination countries
+Formulation of platform for providing quarantine and customs information in destination countries +Providing quarantine and customs information to recycling company
+Collecting quarantine and other regulation information of RWM export +Enhancement of skill for packing and exporting RWM
+Assistance for forming a framework on quarantine and customs information for exporting RWGs.
+Collecting information of the market.
+Assistance for enhancing skills to recycling agents for packaging and transporting RWGS to meet the regulation.
Accessing global market information
+Providing market information to recycling agent
+Collecting information of the market.

Data Collection Survey on Reverse Logistics in the Pacific Islands
199
6.3 Road map for establishing reverse logistic system in PICs
The team proposed five year plans to implement measures mentioned in the previous sections.
Table 6-24 Road map for establishing reverse logistic system
The reverse logistic system is organized when a recycling flow is fully accomplished. The flow
contains following recycling activities such as collecting RWGs, preparing transportation, domestic transportation, processing, international transportation, export and selling. At present, each activity needs improvement. Thus public and private sectors should work together to deal the recycling activities simultaneously.
Next, the team proposed priority project that will be the most effective for improving the present status of RWG recycling.
Road Map of Project Ideas -- caverage of Category I and II--
Stage of Activities First Year Second Year Third Year Fourth Year Fifth Year Achievement Level
Techincal Support for Policy Preparationof RWM Collection
Implementation of Pilot Project I Implementation of Pilot Project II
Technical Support for Preparaton of Relevant Legislation
Training of Government Personnel in Japan
Collection Stage
Technical Support for Preparation of a Guideline for Pre-Treatment & Storage Facility
Support for Development of Storage Facility
Preparation of Transportation Stage
Technical Support for Policy Preparation of RORO Transportation System
Technical Support for Policy Preparation of Unit Load System in Land Transportation
Support for Introduction of RORO Vessel & Port facility
Technical Support for Policy Preparation of Introduction of Small Sized Container in PICs
Support for Introduction of Small-Sized Container
(Category-II)
Domestic Transportation Stage
Technical Support for Heightening of Added Value & Improvement of Efficiency
Support for Development of Treament& Storage Facility
Technical Support for Strenghening of Monitoring
Technical Support for Introduction of Business Permission & Monitoring System (Category-II)
Treatment Stage
Technical Support for Capacity Building for Improvement of Efficiency of Port Operation
Technical Support for Capacity Building in PICs
Support for Improvement of Port Facility
Technical Support for Increment of Export Cargo through Industrial Promotion
International Transportation Stage
Technical Support for Establishment of Providing System of Quarantine Information
Techinical Support for Acquisition of Skills for Control of QuanrantineExport & Selling Stage:similar items between Category I & II
・Realization of Segregation & Collection System in Local Town of Main Island & Remote Islands under Setting of Achievement Level of Collection (example: Establishment of Collection System of Plastic bottle, Pare & Cardboard in Category-II・Targeted Recycking Rate: C-I:present +5-10%、
C-II:+10% or or more、C-III:+A few percent
・Identification of Prioritized Remote Islands for Development of RoRo Facility and Implementation・Realization of Smooth Transportation through Operation of RoRo Vessels between Main Island and Remote Islands・Realization of Efficient Transportation of RWM throught Introduction of Small-Size Container in Domestic Shipping Lines
・Improvement of Operational Efficiency (handling container) by 1.5 times in Container Terminal・Improvement of Port Facility to cope with Increase of Containers
・Obtaining of Quanrantine Information and Realization of Smooth Export・Obtaining of Market Information of RWM and Realization of Sustainability of Recycling Business
Technical Support for Establishment of Providing System of RWM Market Information
・Category -I: Maximization of Export of Scrap Metals, Promotion of Exportation of Plastic Bottle, Maximization of Demestic Recycling & Promotion of Export of Paper & Cardboard・Category-II: Maximization of Export of ScrapMetals, Establishment of Export of Plastic Bottle, Establishment of Regional Export of Paper & Cardboard
・Secure Implementation of Pre-Treatment & Storage for smooth Domestic Transportation

Data Collection Survey on Reverse Logistics in the Pacific Islands
200
6.4 Proposal for priority projects
6.4.1 Basic Idea for Selecting Priority Projects
As described above, there are many measures to be taken to establish a reverse logistics, which can be classified into three main points: ensuring adequate quantity of RGW, reducing transport cost, and selling products at high price. As a solution, the project suggests to establish the reverse logistics system described in 6.1.1., in which RWG are collected from outer islands where there is no existing waste collection. This system also aims to encourage a multinational collaboration to secure the quantity of RWM and achieve economies of scale. In this context, the project suggests to prioritize the following project: 1) collection of RWGs in new areas (e.g., outer islands); 2) reduction of transport cost by improving cargo handling efficiency and domestic shipping; and 3) establishment of a system to offer information about quarantine and market. In alliance with SPREP and SPC, this information delivery system would also be an information platform for the several countries to collaborate. This system offers information such as market price of RWM in major exporting countries
(1) Solid Waste Management Sector
This Study proposes to establish a reverse logistics system that combines domestic transportation with international transportation. Domestic transportation is used to collect RWG from outer islands, such as discarded vehicles and heavy equipment observed in outer islands during the site survey. However, recyclers are reluctant to run a business in outer islands due to the limited generation amount of RWG and inadequate transport infrastructure. Therefore, it is suggested to conduct a RWG collection pilot project in order to establish a reverse logistics for RWM in outer islands. The project also includes development of pre-transport processing facility.
(2) Maritime and Ports Sector
Reduction of freight rate in marine transportation through improvement of port operation and modernization of domestic transportation is considered to be one of the support tools for forming a reverse logistics system. Initially, the support tools focus on RWG/RWM, not on general cargoes. In addition, the share of RWG/RWM is not large among the trade. However the improvement of RWG/RWM transport will eventually have a positive effect on conventional cargo transportation. Therefore, it is worth exploring the feasibility of improving the transport of not only RWG/RWM but also general cargo. There are two approaches in reducing the marine transportation cost; one is to save time and reduce cost of cargo handling by improving cargo handling operation in ports. Public sector is expected to play an important role in its effort. In particular, our team is proposing that international container terminals be improved, especially in Suva port and other international ports which handled a large number of containers in PICs.

Data Collection Survey on Reverse Logistics in the Pacific Islands
201
And the other is to improve the domestic transportation system. Truck and container transportation have not spread in PICs. It is essential for bulky cargoes like the RWG/RWM to introduce the unit load transportation system and to realize efficient transportation between a main island and local islands. The RWG/RWM is too large and heavy for laborers to handle by themselves. It is highly required to introduce machinery and pursue efficiency of transportation.
(3) Intra-sector projects for forming information platform
By forming information platform for collecting data on reverse logistics business, the present problems associated with reverse logistics business can be eased. A recycling company will be able to communicate with government authorities and private companies through the platform on reverse logistics. The platform will make it easier to develop new businesses on reverse logistics. For these reasons, our team proposes that an information platform be formed on reverse logistics that will cover both waste recycling field and transportation field. It will promote communication between relevant private companies and PICs and increase the possibility of introducing reverse logistics business.
6.4.2 The Priority Project and its Procedures
(1) Solid Waste Management Sector: Introduction of RWG Collection in New Areas(Outer islands) and Policy Making Support
a) Background
In terms of the development status of basic infrastructure and solid waste management system there is quite a large difference between outer islands and the main island with a capital city, even allowing for the wide population gap between them. Many islands do not have sufficient basic infrastructure such as road and port, and moreover, some islands do not even have regular waste collection. In such islands, there is little possibility for private company to run recycling business, and it is very difficult to promote reverse logistics for RWM unless there is a strong commitment of the public sector. Amongst others, the development of pre-transport processing facility and stock yard are essential for the transport of RWG to the main island.
b) Outlines of the Project
In this project, a pilot project is conducted to collect RWG in outer islands, transport to main islands to sell them to recyclers. The project examines the feasibility of and difficulties in developing reverse logistics from outer islands through the pilot project. The team will also make a policy proposal based on the lessons learnt.

Data Collection Survey on Reverse Logistics in the Pacific Islands
202
The pilot project will be conducted in Savaii islands, Samoa. Samoa is classified as Category II, where the public sector is expected to take the lead in improving reverse logistics in collaboration with private sector. Moreover, Savaii has five liners plying between the main island, Upolu, each day, which can be utilized in the pilot project. The population of the Savaii is about 45,000 as of 2006, which is predicted to generate a sufficient amount of RWGs for the pilot project. The Study estimates that a few thousands of scrap metals are generated a year if other waste metal is included.
The implementing agencies are Ministry of Natural Resource and Environment, and Ministry of Public Work and Transportation, because reverse logistics from outer islands cannot be established without a close cooperation and coordination between the said two agencies.
This pilot project is suggested to be implemented as a technical cooperation project, in which necessary machinery and equipment shall also be provided.
c) Framework of the Project and its Development
This technical cooperation project is proposed as a package type technical project that features the pilot project, identify the issues through the pilot project, and provide necessary support for policy making as well as technical guidance to improve treatment techniques.
① Implementation of the Pilot Project The proposed pilot project is to collect and store RWG in Savaii, Samoa, to transport RWG
from Salelologa wharf to Mulifanua wharf in Upolu Island, and to sell to recycling companies there. This project will establish an implementation plan of the pilot project and carry out the pilot project in collaboration with residents, recycling companies, and ferry companies. The pilot project can be outlines as in the table below.
Table 6-25 Outline of the Pilot Project (Tentative) Targeted RWG Vehicles, white goods, cans, other metal products
Generation amount and collection amount
In Savaii, it is estimated that a few thousand tons of metallic RWG (incl. vehicles, white goods, cans, other metal products) is generated yearly. The proposed pilot project aims to collect 10% of the generated amount (estimated to be a few hundred tons per year).
RWG collection method
Residents to bring targeted RWG items to stockyards Bulky RWG items e.g., vehicles, will be collected with support of the collection company entrusted waste collection by MNRE.
Pretransport processing facility
Prepare a stockyard near the Salelologa wharf, where collected RWG will be roughly dismantled before being loaded to truck

Data Collection Survey on Reverse Logistics in the Pacific Islands
203
Transport method Load RWG to truck in the stockyard, and transport it to a recycler in Upolu by a truck ferry
Installation of equipment
Machinery and equipment to dismantle bulky RWG (to be prepared by Japan) Stockyard (to be prepared by Samoa)
After the pilot project is completed, the Project Team will evaluate and analyze the result to identify the issues in developing a reverse logistics system. The Project Team will determine the countermeasures and establish a concrete policy and institutional framework, and draw up a road map.
② Policy making support through the pilot project The project will provide a support for policy to establish reverse logistics, including the
following: û Support for introduction of a permit and monitoring system for recyclers û Examination of deposit system as a responsibility of dealer and consumer û Introduction to the Japan’s recycling related laws and determination of applicability to Samoa û Establishment of national strategy on RWG collection
③ Assistance for Capacity Building of Recyclers and Enhancement of Value added to Product
RWG collected in the main islands and outer islands will be brought to a recycling factory to be processed, such as dismantling, crushing, and segregation. One of the measures to enhance reverse logistics business is to advance the recycler’s treatment technology and produce high value-added RWM to export. In Tonga, there is an on-going technical cooperation project funded by Japan. This project is called “Great Vava'u and Okinawa Mottainai Movement Project”, which has developed by Okinawa Citizens Recycling Movement to transfer the recycling technology to the local recyclers. This project also tries to improve the local recyclers’ treatment capacity by inviting some of them to Japan for training, and dispatching Japanese recyclers to give guidance.
④ Collaboration with SPREP and Realization of Pacific Regional Solid Waste Management Strategy 2010-2015
Our priority projects are deeply linked to some activities of the Pacific Regional Solid Waste Management Strategy introduced in Chapter 2. Therefore, the Project Team will collaborate with SPREP in implementing the pilot project, and consequently will contribute to the realization of the Pacific Regional Solid Waste Management strategy 2010-2015.
(2) Improvement of International Container Terminal Operations
a) Background of the Project At present, transport efficiency on the international shipping route is low due to the imbalance
Data Collection Survey on Reverse Logistics in the Pacific Islands
204
of import and export cargoes. In addition, cargo handling productivity at international container terminals in PICs is poor due to insufficient cargo handling equipment. This leads to longer cargo handing, demurrage of ship, and raises the cost of cargo handling. Furthermore, since international container ships are part of a multi calling network, delay of cargo handling in one port will adversely affect the entire shipping schedule, thereby increasing navigational cost. Accordingly, our team proposes the improvement of container cargo handlings in Suva port, Apia port and Nulualofa port respectively. Even though these attempts aim to improve container cargo handling, container carried RWG transportation cost will be eventually be reduced.
b) Outline of the Project i) Suva port in Fiji
Suva port is the largest port among the five countries. It handles 50,000 TEUs of international containers including 5,000 TEUs of transshipment cargoes annually. Containers are handled by ship cranes or two quay cranes in Suva terminal. Container handling by ship gear is unstable and productivity is only around 10 boxes per hour. This number is less than the world average. Constant demurrage occurs frequently due to poor quay crane operation and suspension of operation in rain. Technical assistance for improving the cargo handling operation in Suva port is urgently required.
ii) Apia port in Samoa Apia port is a gateway of Samoa. Since the port faces the open sea, it is susceptible to sea swells,
which often prevents smooth berthing and cargo handling at this port. One out of the two existing jetties is deteriorated and needs replacement. Containers are handled by ship cranes in Apia terminal. Container handling by ship gear is unstable and productivity is only around 8 boxes per hour. Technical assistance for improving the cargo handling operation is urgently required.
iii) Nulualofa port in Tonga Nukluolofa has two international wharves: wharf 1 is 13 meters in depth and 105 meters in
length and wharf 2 is 10-11 meters in depth and 114 meters in length. Which wharf can be used is decided based on the wind. Domestic wharf is 5-7 meters in depth and 114 meters in length. Container yard has not been paved and trafficability of trucks and cargo handling machines is poor. These spoil the efficiency and safety of cargo handling. The domestic terminal yard is limited while international terminal yard is relatively large. In order to increase capacity of cargo handling and safety of the port, terminal layout should be assessed.
c) Scope of the Project i) Suva port ,Fiji
Survey on cargo handling efficiency of container terminal: It is highly required to improve the efficiency of container terminal operation. At first JICA should consult with the Fiji government and dispatch container handling experts. The experts will conduct a survey of container cargo handling
Data Collection Survey on Reverse Logistics in the Pacific Islands
205
capacity in Suva port, identify issues and propose an improvement plan. A technical assistance for improving container cargo handling in Suva port: Based on the above
mentioned survey, JICA should develop a technical cooperation project for cargo handling improvement including grant aid of cargo handling machines.
ii) Apia port, Samoa Survey on cargo handling efficiency of container terminal: It is highly required to improve the
efficiency of container terminal operation. At first JICA should consult with the Samoa government and dispatch container handling experts and a port facility engineer. The experts will conduct a survey of container cargo handling capacity in Suva port, identify issues and propose an improvement plan. The engineer will conduct a survey on port facility durability.
A technical assistance for improving container cargo handling in Suva port: Based on the above mentioned survey, JICA should develop a technical cooperation project for cargo handling improvement and port facility rehabilitation. Grant aid for providing cargo handling machines and for rehabilitation of port facility should be considered.
iii) Nukualofa port in Tonga
Port terminal rehabilitation study: It is highly required to rehabilitate the terminal. Limited space of domestic terminal, poor performance of container handling and poor safety standards due to unpaved yard are identified is major problems. JICA should consult with the Tongan government, and dispatch container handling experts, conduct a survey on container handling and propose a technical assistance project.
(3) Development of Unit-Load System in Domestic Shipping
a) Background It is essential to introduce a unit load system for the transport of recycling waste goods, usually
bulky cargo, between the main island and local islands. By introducing a unit load system, it would become possible for bulky cargo to be transported with container and/or pallet and utilizing truck and container-trailer. As recycling waste goods are able to be handled the same as bulky cargo, transportation of recycling waste goods from local islands to the main island will be realized through the unit load system.
Furthermore, the possibility of introducing small sized containers, which have already been introduced in Tonga and Samoa, from the viewpoint of improvement of efficiency of recycling waste goods’ cargo transport between local islands and the main island should be examined.
Though each country is making efforts to develop port facilities in the islands, cargo are still forced to be loaded/unloaded offshore between a ship and a barge, and a unit load system is not yet developed in terms of port facilities and handling equipment. Furthermore, aids to navigation are

Data Collection Survey on Reverse Logistics in the Pacific Islands
206
insufficient on navigation routes with coral leaves which are an obstacle for navigation at night. In addition, many of the vessels going into service cannot cope with unit load type cargo.
On the other hand, to realize collection and transportation of recycling waste goods in local islands other than the main islands, introduction of a unit load system utilizing trucks and containers in domestic shipping is essential.
b) Outline of the Project In Fuji, port facilities and vessels accommodating a unit load system are already introduced
between the main island – Viti Levu – and the second largest island – Vanua Levu – and recycling waste goods are transported between two islands. In the next stage, introduction of a unit load system should be examined in other islands and remote islands in line with expansion of recycling waste goods’ collection system.
On the other hand, among the islands which were surveyed in Vanuatu, there is a small ramp in Malekula Island which is located in the central region, however, there is no space for cargo handling and storage. Tanna Island, which is located in the southern region, has no facility for accommodating a unit load system. These islands together with Efete Island and Espiritu-Santo Island where international ports are located form an axis for national development, and thus introduction of a unit load system among these islands should be examined in the first place. (The Asian Development Bank and New Zealand have pledged to extend a small port improvement project. Confirmation is required to ensure consistency and avoid duplication.)
Therefore, transportation demand of cargo between the main island and major local islands should be examined in Fiji, Vanuatu and Tonga (which a site survey could not be conducted) and then ports and navigation routes for introduction of a unit load system should be nominated and prioritized considering the status of road development in the island.
In addition, the necessity of modernizing the domestic shipping fleet which means introduction of RORO vessel should be examined, and if necessary, it should be considered whether official support will be extended or not.
c) Scope of the Project This project is to be conducted as a development study and its tentative title is “the study on
introduction of a unit load system in domestic shipping to facilitate recycling waste goods’ transportation”.
The study area is Fiji, Tonga and Vanuatu. Scope of the study is û To grasp the present status of domestic maritime transportation, û To examine the future demand of recycling waste goods and other cargo between the main
island and the major islands, û To nominate the priority routes for introduction of a unit load system, û To propose urgent projects and conduct feasibility study, and
Data Collection Survey on Reverse Logistics in the Pacific Islands
207
û To clarify the method of implementation of the urgent project
The term of the study is estimated to be range from 12 months to 18 months. Regarding the introduction of small sized containers, it is desirable to use it in plural countries because use in one country would not be effective. Therefore, a study for standardization of smaller-sized containers should be conducted aiming at introducing it in all Pacific Island countries. Implementation agencies are transportation sector and maritime and port sector, however, coordination with the waste management sector and private sector will be inevitable.
(4) Cross – Sectorial Field :Technical Cooperation Project for Development of Information Platform on Reverse Logistics
a) Background and Purpose of the Project There are several reasons why it is difficult to expand the reverse logistics business in the
Pacific Island countries. Small scales of the population, vulnerability of the economic base and remoteness from the major markets of recycling waste goods are among the major ones. SPREP and J-PRISM have been activate in the region in the field of urban and household waste, however, scrap, white goods and other recyclable waste goods which are objectives of reverse logistics are poorly handled by the government and each country has a different system of waste management even if a waste management system is partially introduced. On the other hand, most of the recycling companies are small businesses, therefore, they usually cannot obtain necessary information on recycling business in a timely manner and such companies cannot coordinate with each other to get information of reverse logistics from the government.
Under such a background, this project is a technical cooperation project to develop the information platform for reverse logistics in the Pacific Island countries. The purpose of the information platform is to collect, compile and provide the information necessary to facilitate reverse logistics business through establishment of close coordination among public and private sectors.
b) Outline and Scope of the Project The purpose of the project is to conduct a study for development of the information platform
and develop it as necessary to promote the reverse logistics business. Development of the information platform includes establishment of a collection. Items of the examination are; û kinds of necessary information and available existing information system, û method of collection, compilation and provision of the information, û proponent of management and operation of the information platform, û method of utilization and monitoring system, û procedure, time schedule and cost for development of the information platform,
and so on. To conduct these study, technical cooperation project will be extended and develop the information platform for reverse logistics business.
Data Collection Survey on Reverse Logistics in the Pacific Islands
208
Expected information necessary to promote the reverse logistics platform is û information for relevant laws and regulations on recycling business, û information of collection and storage of recycling waste goods, û information of port operation and management, û information of international and domestic maritime transportation, û information of quarantine of imported country, û information of recycling market, and so on.
Many agencies and organizations will be involved in development of the information platform. Public sector such as waste management sector, recycling business regulation sector, maritime and port sector, and custom and quarantine sector and so on, and private sector such as recycling companies, associations/groups of recycling business and related industries should cooperate with each other to develop the information platform
c) Implementation of the Project This project is implemented by JICA, however, the JICA project team will work together with
international organizations such as SPREP and SPC (Secretariat of the Pacific Community) which are playing an active role in the region and these organizations should play a key role in management and operation of the information platform.
For this reason, working groups which consists of SPREP, SPC, JICA and representatives from the Pacific Island countries will be set up and JICA project team will offer support and guidance from the technical point of view to develop the information platform. Successive implementation of workshops (one was held during this survey on reverse logistics) seems to be one of the effective methods to strengthen the relation and linkage among concerned agencies and people.

Data Collection Survey on Reverse Logistics in the Pacific Islands
209
Appendix Workshop on Improvement of Bulky Waste Recycling in the PICs through Reverse Logistics
JICA reverse logistic study team, comprised of OCDI and Yachiyo Engineering Co.,Ltd, and
J-PRISM held a workshop on the 26th and 27th of September, 2012 in Suva, Fiji.
(1) Background and Objectives of the Workshop
JICA reverse logistic study team, OCDI and Yachiyo Engineering Co.,Ltd, were commissioned by
JICA to carry out “A data collection survey to identify issues and develop plans to strengthen the
circulation of recycling materials by utilizing reverse logistics in Pacific Island Countries (PICs)”. In its
interim report the team showed preliminary estimates that some 75,000 tons of recyclable waste were
available for recycling in Fiji in 2011, and that of that amount 38,200 tons (51% of the total) were actually
recycled. The remaining amount was landfilled, abandoned or stored on private premises. The team is
proposing the introduction of source separation, improving the processing of recyclable materials both
economically and environmentally, and reducing transportation cost by improving cargo handing efficiency
in ports. The main objective of the workshop was to provide an opportunity for the stakeholders to
exchange information and opinions on bulky waste recycling with the aim of improving the bulky waste
recycling activities in the PICs through reverse logistics.
(2) Participants
More than 50 participants joined the workshop, including related government officials, recycling
companies, port authorities, and maritime transport companies from the five PICs covered under the study
(Fiji, Samoa, Tonga, Tuvalu, Vanuatu). Officials and experts from SPREP, JICA and JICA study team also
participated. This was the first time for various stakeholders related to bulky waste material recycling in the
PICs to gather together and discuss common issues.
(3) Input and outcomes of the workshop
The workshop on the 26th consisted of presentations from SPREP, JPRISM, YAMANAKA (a
recycling company in Japan) and JICA team in the morning session, while three groups discussed the
themes of; a) waste recycling, b) port and marine and c) public support in the afternoon session. The
workshop concluded with recommendations to enhance this important activity.
Main proposal for improving reverse logistics
a) Waste recycling: Market expansion, support from governments to improve recycling, dealears and
importers responsibility, improve the collection system, collection of other RWGs such as paper,
improvement of transportation sector’s.

Data Collection Survey on Reverse Logistics in the Pacific Islands
210
b) Marine transport: international route connection, improvement of domestic routes, terminal
operation improvement, information on recycling operations, expansion of RORO network.
c) Public support: raise public awareness on source separation, facilitate recycling companies activities,
monitoring environmental and health impacts at the yards, improve port facilities and operations.
On the following day (September 27th), participants visited a landfill site, a private recycling facility
and a container terminal in Suva, Fiji. A local TV covered whole two days and reported twice.

Data Collection Survey on Reverse Logistics in the Pacific Islands
211
①Workshop programme
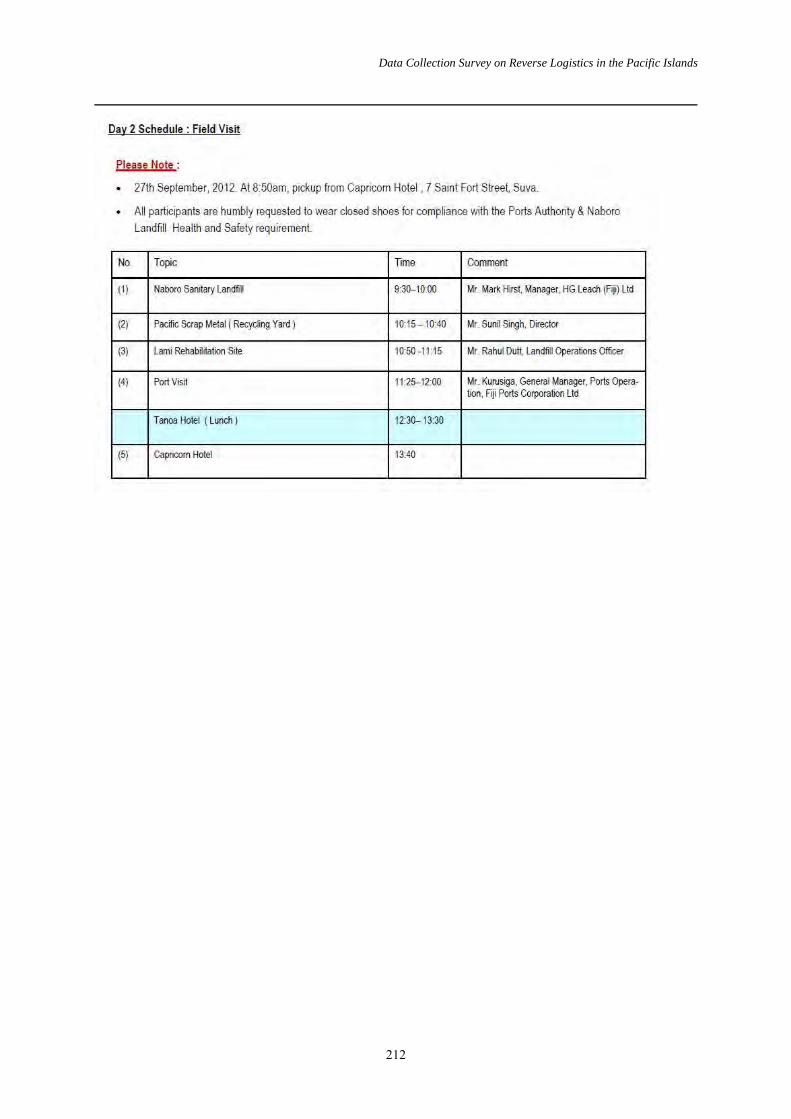
Data Collection Survey on Reverse Logistics in the Pacific Islands
212

Data Collection Survey on Reverse Logistics in the Pacific Islands
213
②List of workshop participants
1 Mr Setoa Apo Ministry of Natural Recourses and Environment Samoa2 Mr Lotomau Tomane Samoa Ports Authority Samoa3 Mr Ioane Sio Pacific Recycle Samoa4 Ms Mafile’o Masi Ministry of Environment & Climate Change Tonga5 Mr William Udarbe Tuikolovatu Gio Recycling Tonga6 Mr Filimone Tuikolovatu Gio Recycling Tonga7 Mr Viliami Vi Friendly Islands Shipping Agent,Tonga Tonga8 Ms Tepola Taulaga Ministry of Home Affairs Tuvalu9 Ms Carol Rovo Ministry of Land and Natural Resources Vanuatu10 Mr Andrew Hibgame Recycle Corp Vanuatu11 Ms Christina Hibgame Recycle Corp Vanuatu12 Mr Russell Mitchell Ifira Port Development Services Vanuatu13 Ms Taina Tagicakibau Ministry of Local Government, Urban development housing & Environment Fiji
14 Mr Raul DattDepartment of Environmet, Ministry of Local Government, Urban development housing &Environment
Fiji
15 Ms.Laisani LewanavanuaDepartment of Environmet, Ministry of Local Government, Urban development housing &Environment
Fiji
16 Mr Lote RasuqoliDepartment of Environmet, Ministry of Local Government, Urban development housing &Environment
Fiji
17 Mr Lui Naisara Transport Management Unit, Ministry of Works, Transport and Public Utilities Fiji18 Mr Naresh Narayan Suva City Fiji19 Mr Shalend Prem Singh Lautoka City Fiji20 Mr Sunil Singh Pacific Scrap Buyers Fiji21 Mr Jokini Taoi Port Terminal Limited. Fiji Ports Corporation Fiji22 Mr Ben Naidu Venu Shipping Fiji23 Mr Lesi Lopteti Venu Shipping Fiji24 Mr Ilaisa Labaibure Carpenters Shipping Fiji25 Mr Hector Smith Consort Shipping Fiji26 Mr Panapasa Vakatale Government Shipping Service Fiji27 Mr Samisoni Dabea Government Shipping Service Fiji28 Mr Bruce Tweed Secretariat of the Pacific Community Fiji29 Mr Alobi Bomo Rigam Secretariat of the Pacific Community Fiji30 Ms Esther Richard Secretariat of the Pacific Regional Environmental Programme (SPREP) Fiji31 Mr Hideaki Kuroki Embassy of Japan in Fiji Japan32 Mr Hiroshi Kogachi JICA Partnership Program(JPP) for"Great Vava'u and Okinawa Mottainai Project" Japan33 Mr Takeshi Kushima JICA Partnership Program(JPP) for"Great Vava'u and Okinawa Mottainai Project" Japan34 Mr Satoru Shirome JICA Partnership Program(JPP) for"Great Vava'u and Okinawa Mottainai Project" Japan35 Mr Naoki Yamada YAMANAKA Co. Ltd. Japan36 Mr Shiro Amano J-PRISM Japan37 Mr Hiromichi Kanou J-PRISM Japan38 Mr Ogawa Masayoshi J-PRISM Japan39 Mr Takashi Toyama JICA Tokyo Japan40 Mr Yutaka Fukase JICA Fiji Japan41 Mr Kentaro Yoshida JICA Fiji Japan42 Ms Frances Tavaiqia JICA Fiji Japan43 Mr Akira Koyama JICA team Japan44 Mr Takatoshi Arai JICA team Japan45 Mr Ichio Motono JICA Team Japan46 Mr Mahamoud Riad JICA Team Japan47 Mr Takayuki Iijima JICA Team Japan48 Ms Anshoo Ashika JICA Team Fiji49 Mr Sentiki Bati JICA Team Fiji50 Ms Vani Qoroya JICA Team Fiji

Data Collection Survey on Reverse Logistics in the Pacific Islands
214
③Group discussion
・Proposal
Group ABulky waste Recycling in PICs
Mr. Ioane Sio (Pacific Recycle, Samoa)Mr. William Udarbe Tuikolovatu (Gio Recycling, Tonga)Mr. Filimone Tuikolovatu (Gio Recycling, Tonga)Mr. Andrew Hibgame (Recycle Corp, Vanuatu)Mr. Lee, Managing Director (Sun & Bright Ltd. Fiji)Mr. Shalend Pren Singh (Lautoka City, Fiji)Ms Carol Rovo (Ministry of Land and Natural Resources, Vanuatu)Ms. Laisani Lewanvanua (Department of Environment, Fiji)ChairpersonFacilitater: Ms. Esther (SPREP)Support: Mr. T. Arai (JICA study team)

Data Collection Survey on Reverse Logistics in the Pacific Islands
215
・Proposal
Group BPotential for maritime transport reverse logistics support to recycling
Mr. Viliami Vi (Friendly Islands Shipping Agent, Tonga)Mr. Russell Mitchell (Ifra Port Development Services, Vanuatu)Mr. Panapasa Vakatale (Government Shipping Service, Fiji)Mr. Ben Naidu (Venu Shipping, Fiji)Mr. Lesi Lopteti (Venu Shipping, Fiji)Mr Ilaisa Labaibure (Carpenter Shipping)
Mr. Hector Smith (Consort Shipping, Fiji)Mr. Lui Naisara (Ministry of Works, Transport and Public Utilities, Fiji)Mr. Jokini Taoi (Ports terminal Limited, Fiji Ports Corporation, Fiji )
Mr. Alobi Bomo, SPCChairperson Mr Lui NaisaraFacilitater: Mr. Motono(JICA study team)Support: Ms. Esther (SPREP)
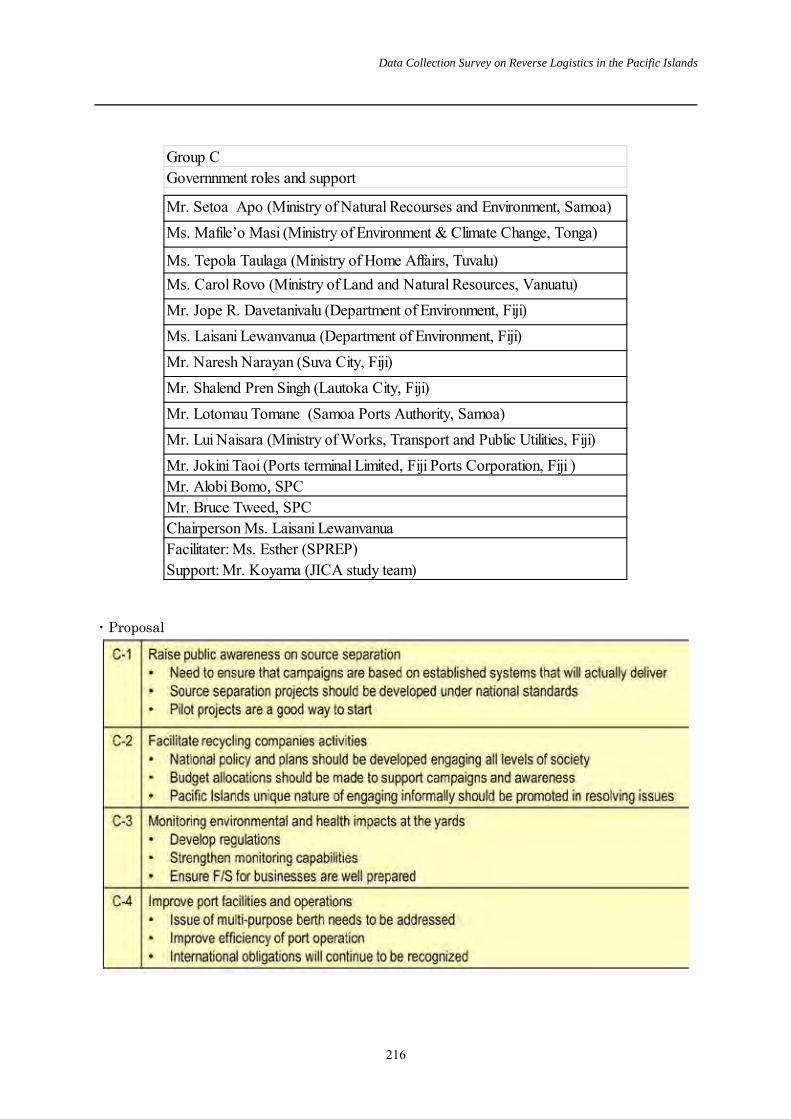
Data Collection Survey on Reverse Logistics in the Pacific Islands
216
・Proposal
Group CGovernnment roles and support
Mr. Setoa Apo (Ministry of Natural Recourses and Environment, Samoa)Ms. Mafile’o Masi (Ministry of Environment & Climate Change, Tonga)
Ms. Tepola Taulaga (Ministry of Home Affairs, Tuvalu)Ms. Carol Rovo (Ministry of Land and Natural Resources, Vanuatu)Mr. Jope R. Davetanivalu (Department of Environment, Fiji)Ms. Laisani Lewanvanua (Department of Environment, Fiji)Mr. Naresh Narayan (Suva City, Fiji)Mr. Shalend Pren Singh (Lautoka City, Fiji)Mr. Lotomau Tomane (Samoa Ports Authority, Samoa)Mr. Lui Naisara (Ministry of Works, Transport and Public Utilities, Fiji)Mr. Jokini Taoi (Ports terminal Limited, Fiji Ports Corporation, Fiji )Mr. Alobi Bomo, SPCMr. Bruce Tweed, SPC Chairperson Ms. Laisani LewanvanuaFacilitater: Ms. Esther (SPREP)Support: Mr. Koyama (JICA study team)

Data Collection Survey on Reverse Logistics in the Pacific Islands
217
④Status of workshop and field survey
Presentation in the workshop in the morning of 26th September)
Panel discussion in the workshop in the afternoon of 26th September
Field survey (left: Naboro Sanitary Landfill、right:Pacific Scrap Metal)