Nonexhaustive Cyclodextrin-Based Extraction Technique for the Evaluation of PAH Bioavailability
Upload
independentCategory
view
7download
0
Marine Pollution Bulletin 56 (2008) 1598–1608
Contents lists available at ScienceDirect
Marine Pollution Bulletin
journal homepage: www.elsevier.com/ locate /marpolbul
Survey of PAH in low density residential stormwater ponds in coastal South
Carolina: False dark mussels (Mytilopsis leucophaeata) as potential biomonitors
Alan T. Flemming a, John E. Weinstein b,*, Alan J. Lewitus c
a Masters of Science in Environmental Studies Program, 66 George Street, College of Charleston, Charleston, SC 29424, USAb Department of Biology, The Citadel, 171 Moultrie Street, Charleston, SC 29409, USAc NOAA Center for Sponsored Coastal Ocean Research, 1305 East West Hwy, Silver Spring, MD 20910, USA
a r t i c l e i n f o
Keywords:
Mussels
Mytilopsis leucophaeata
Polycyclic aromatic hydrocarbons
Stormwater runoff
Detention pond
South Carolina
0025-326X/$ - see front matter © 2008 Elsevier Lt
doi:10.1016/j.marpolbul.2008.05.018
* Corresponding author. Tel.: +1 843 953 7796; f
E-mail address: [email protected] (J.E
a b s t r a c t
The distribution of PAHs was studied in sediment and false dark mussels, Mytilopsis leucophaeata, of
three brackish stormwater retention ponds on Kiawah Island, a gated residential community and golf
resort. Impervious surface in pond watersheds ranged from 5 to 30%. Sediment concentrations were
lower than those found in other studies of suburban residential areas, and there were no significant
differences among ponds or seasons. Mean )PAH16 values for sediments in Ponds 67, 100, and 37 were
184.7 ± 101.3 ng g¡1, 67.5 ± 26.0 ng g¡1, and 84.3 ± 75.5 ng g¡1, respectively. Mussel )PAH16 concentrations
from Pond 67 in August (mean 734.5 ± 148.1 ng g¡1), and from Pond 37 in December (mean 1115.1 ± 87.7 ng
g¡1), were significantly higher than other ponds. Mean )PAH16 values for mussels in Ponds 67, 100, and,
37 were 555.9 ± 219.7 ng g¡1, 312.5 ± 99.1 ng g¡1 and 737.8 ± 419.8 ng g¡1, respectively. The mean biota-to-
sediment ratio was 7.6 ± 8.1. Isomer ratios generally suggested pyrogenic sources. False dark mussels are
a promising indicator species for PAH contamination because they are abundant, easy to sample, bioaccu-
mulate PAH profiles representative of the time-integrated sediment profiles, and their PAH levels are less
variable than either stormwater or sediment samples.
© 2008 Elsevier Ltd. All rights reserved.
1. Introduction
Stormwater management ponds, including detention and reten-
tion ponds, are a commonly used best management practice for
the control of stormwater runoff in the USA. In the state of South
Carolina alone, it is estimated that over 8,000 ponds have been
constructed (South Carolina Algal Ecology Lab, unpublished data,
2005). Their purpose is to reduce downstream impacts of storm-
water runoff by reducing runoff peaks, removing sediments and
pollutants, and enhancing overall stormwater quality through a
variety of physical, chemical, and biological processes. However,
the typical pond design results in the drainage of stormwater
directly from road and street surfaces through concrete pipes
into the ponds, thereby bypassing natural processes of contami-
nant removal. As suspended solids settle out on the pond bottom,
contaminants may accumulate in the sediments. If these contami-
nants are bioavailable to epibenthic and pelagic organisms in the
pond, they then could pose a risk to wildlife using the pond, such
as wetland bird species and overwintering ducks. Pond outflows
in coastal areas are often directly linked to tidal creeks and estu-
aries, thus they can have a significant impact on the water qual-
d. All rights reserved.
ax: +1 843 953 7264.
. Weinstein).
ity of these adjacent natural systems. Stormwater retention ponds
function as the interface between development and estuarine eco-
logical health as indicated by water quality, biodiversity and com-
plexity, resilience, and sustainability.
One important class of contaminant associated with these
stormwater management ponds are polycyclic aromatic hydrocar-
bons (PAHs) (Fernandez and Hutchinson, 1992; Marsalek and Mar-
salek, 1997; Marsalek et al., 2002; Kamalakkannan et al., 2004).
PAHs are organic compounds that consist of two or more aromatic
(benzene) rings. These compounds are a natural part of fossil
fuels, and are formed as products of incomplete combustion. Nat-
ural sources of PAHs in the environment include forest and grass
fires, volcanoes (Nagpal, 1993), and fossil fuels such as coal and
oil, where PAHs have formed as result of diagenetic processes. The
main anthropogenic sources of PAHs are coal combustion and vehi-
cle emissions (Dickhut et al., 2000). Other anthropogenic sources
include wood burning, industrial emissions, used motor oil and
fuel drips and spills, tire wear, asphalt, tar, small engine exhaust,
creosote, and waste incineration.
The PAHs quantified in this study were naphthalene (NAPT),
acenapthylene (ACNY), acenapthene (ACEN), fluorene (FLUR), phen-
anthrene (PHEN), anthracene (ANTH), fluoranthene (FLTH), pyrene
(PYR), benzo(a)anthracene (B[a]A), chrysene (CHRY), benzo(b)flu-
oranthene (B[b]F), benzo(k)fluoranthene (B[k]F), benzo(a)pyrene
(B[a]P), dibenz(a,h)anthracene (D[ah]A), benzo(g,h,i)perylene
A.T. Flemming et al. / Marine Pollution Bulletin 56 (2008) 1598–1608 1599
(B[ghi]P), and indeno(1,2,3,c,d)pyrene (INPY). The first six PAHs
listed (NAPT through ANTH) are considered low molecular weight
(LMW) PAHs, and the final ten PAHs listed (FLTH through INPY) are
considered high molecular weight (HMW) PAHs.
Mussels are commonly used as biomonitoring organisms for
PAH contamination in both marine and freshwater environments
(Utvik et al., 1999; Piccardo et al., 2001; O’Connor, 2002; Hellou et
al., 2005; Oros and Ross, 2005) because they are sessile, have high
filtration rates (de Lafontaine et al., 2000), bioaccumulate PAHs
(D’Adamo et al., 1997), and capture PAH profiles representative of
the time-integrated source in their tissues since they have limited
ability to biotransform PAHs (Baumard et al., 1998a; Naes et al.,
1998). Mussels are filter-feeding organisms that mainly accumu-
late soluble PAHs or PAHs associated with suspended solids (Baum-
ard et al., 1998a). As such, the PAH concentrations in their tissues
can be used to estimate that fraction of the total PAHs in the sys-
tem which are bioavailable (Richman and Somers, 2005).
The false dark mussel, Mytilopsis leucophaeata, is a member of
the family Dreissenidae and is closely related to the invasive zebra
mussel, Dreissena polymorpha (Therriault et al., 2004). Although
false dark mussels have not previously been used to study PAH
contamination, they are an ideal indicator organism for coastal
stormwater retention ponds because they are widespread and able
to colonize these brackish ponds quickly (Rajagopal et al., 2005a).
This mussel is epibenthic and is easy to collect because it uses bys-
sal threads to attach itself to solid substrates like concrete pipes or
submerged wood (Rajagopal et al., 2005b). The false dark mussel
is a euryhaline species that is native to North America and is found
in estuarine environments of the east coast from Florida to Massa-
chusetts (Marelli and Gray, 1983). It is most commonly found in
water with salinity ranging from 3 to 15 ppt (Claudi and Mackie,
1994). The false dark mussel grows quickly, approximately 1 mm
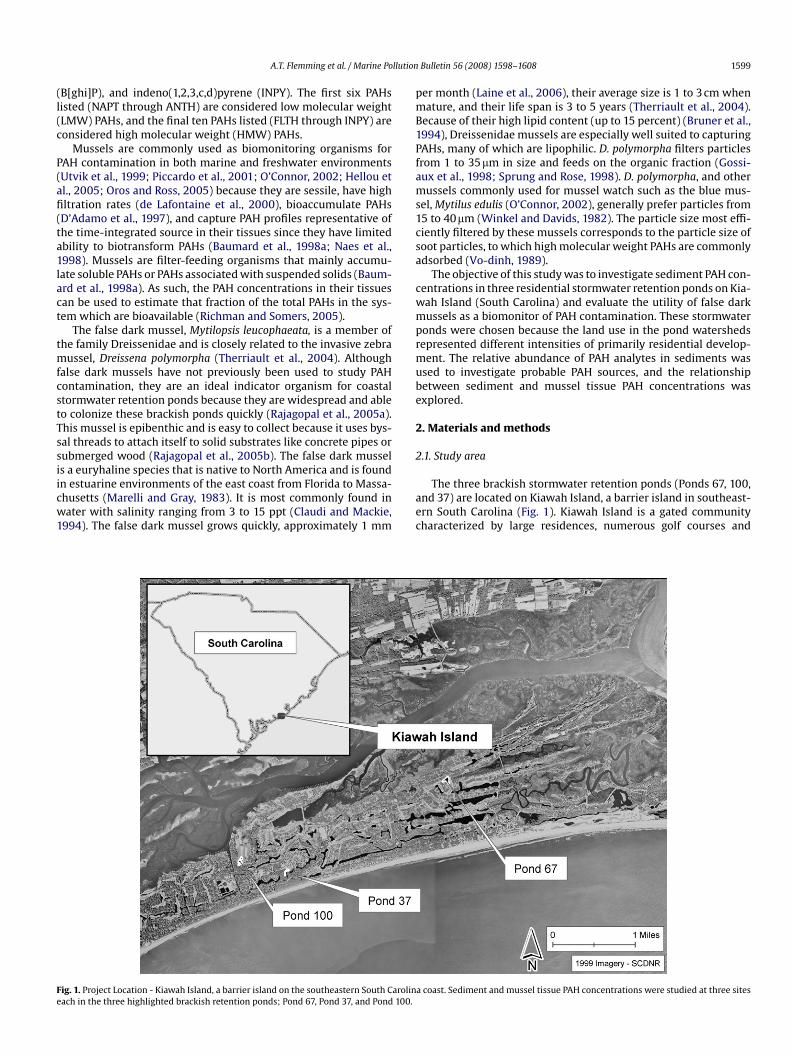
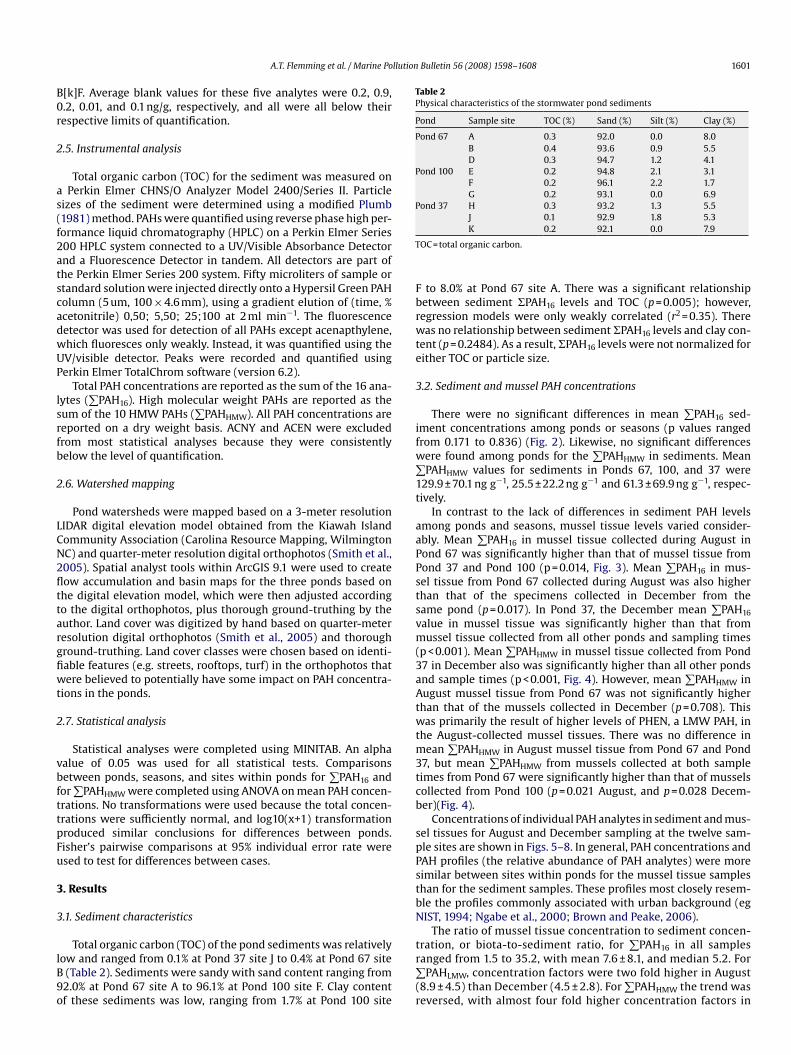
Fig. 1. Project Location - Kiawah Island, a barrier island on the southeastern South Caroli
each in the three highlighted brackish retention ponds; Pond 67, Pond 37, and Pond 100
per month (Laine et al., 2006), their average size is 1 to 3 cm when
mature, and their life span is 3 to 5 years (Therriault et al., 2004).
Because of their high lipid content (up to 15 percent) (Bruner et al.,
1994), Dreissenidae mussels are especially well suited to capturing
PAHs, many of which are lipophilic. D. polymorpha filters particles
from 1 to 35 lm in size and feeds on the organic fraction (Gossi-
aux et al., 1998; Sprung and Rose, 1998). D. polymorpha, and other
mussels commonly used for mussel watch such as the blue mus-
sel, Mytilus edulis (O’Connor, 2002), generally prefer particles from
15 to 40 lm (Winkel and Davids, 1982). The particle size most effi-
ciently filtered by these mussels corresponds to the particle size of
soot particles, to which high molecular weight PAHs are commonly
adsorbed (Vo-dinh, 1989).
The objective of this study was to investigate sediment PAH con-
centrations in three residential stormwater retention ponds on Kia-
wah Island (South Carolina) and evaluate the utility of false dark
mussels as a biomonitor of PAH contamination. These stormwater
ponds were chosen because the land use in the pond watersheds
represented different intensities of primarily residential develop-
ment. The relative abundance of PAH analytes in sediments was
used to investigate probable PAH sources, and the relationship
between sediment and mussel tissue PAH concentrations was
explored.
2. Materials and methods
2.1. Study area
The three brackish stormwater retention ponds (Ponds 67, 100,
and 37) are located on Kiawah Island, a barrier island in southeast-
ern South Carolina (Fig. 1). Kiawah Island is a gated community
characterized by large residences, numerous golf courses and
na coast. Sediment and mussel tissue PAH concentrations were studied at three sites
.
1600 A.T. Flemming et al. / Marine Pollution Bulletin 56 (2008) 1598–1608
intensive landscaping. There are a total of 136 brackish retention
ponds on Kiawah Island. These ponds are interconnected through
concrete drainage pipes and closely linked to tidal creeks. Only
approximately half of the residential lots on Kiawah Island have
been developed, and construction traffic and activity is significant.
Pond watershed areas and sampling locations are summarized
in Table 1 and described in more detail in following section. Sed-
iment and mussel samples were collected from three sites within
each pond (a total of twelve sample sites).
Pond 67 is surrounded by development that is typical for Kia-
wah Island, including residential lots and houses with average
sizes of 0.18 hectares (0.44 acres) and 310 m¡2 (3400 square feet)
respectively (calculated using data from Charleston County GIS,
2006), and a golf course fairway. The primary land cover categories
in the watershed of this pond are the landscaped areas around the
residences at 30 percent, and golf course turf at 29 percent. Activ-
ities observed in this watershed during the course of this study
included the construction of several new homes and intensive golf
course maintenance, including the use of lawn mowers and gas-
powered leaf blowers.
In this study, Ponds 37 and 100, which have very different devel-
opment patterns in their watersheds compared to Pond 67 (Table
1), were sampled in an attempt to relate the extent of watershed
development to PAH levels in sediments and mussels. Pond 37 rep-
resents a pond with a greater degree of development than Pond
67 (Table 1). This pond is surrounded by the parking lot of a large
resort hotel and is adjacent to the Kiawah Island Town Center. The
watershed of Pond 37 has a high percent impervious surface rela-
tive to the other watersheds in this study; nonetheless the primary
land cover categories in this watershed are landscaped areas at 42%
and undisturbed, primarily maritime forest and wetland, at 16%.
The contribution of impervious surfaces to the watershed of Pond
37 is 11% rooftops, 11% parking, 5% streets, and 4% sidewalks and
paved paths. In contrast, Pond 100 represents a pond with a lower
degree of development than Pond 67. This pond is surrounded pri-
marily by “natural” amenities such as golf course and landscaping.
There is relatively little residential development surrounding Pond
100, and the primary land cover categories for this watershed are
turf at 31% and landscaped at 23%, both entirely associated with
the golf course.
2.2. Sampling
Three sites each in Pond 67, Pond 37, and Pond 100 were sam-
pled. Pond surficial sediment and mussels were sampled twice in
all three ponds, once on August 2, 2005 and once on December 13,
2005. Sediment samples were also taken from Pond 67, on March
8, 2005. Samples were collected within 1 m of the pond edge, at a
depth of approximately 0.5 m. Sediment samples from the upper
1–2 cm of the pond bottom were collected using a stainless steel
spoon from several locations within an approximately 1-meter
square area. Sediment was gently lifted to the pond surface and
placed in an amber jar with a Teflon-lined cap. The jars were
Table 1
Summary of Kiawah Island pond watershed areas and percentage impervious sur-
face for the three ponds that were sampled at three sites each for sediment and
mussel tissue PAH concentrations
Pond Sample
sites
GPS coordinates Watershed area
(hectares)
Impervious
surface (%)
Pond 67 A, B, D 80 ° 3.69 W, 32 °37.19 N 5.87 16
Pond 100 E, F, G 80 ° 6.29 W, 32 °36.39 N 7.51 5
Pond 37 H, J, K 80 ° 5.69 W, 32 °36.19 N 46.6 30
GPS coordinates are for the approximate pond center.
placed on ice for transportation to the lab where they were refrig-
erated at 4 °C until processing within 48 h. Mussels were collected
from the pond bottom using a dip net at approximately the same
locations as the sediment samples. Mussels were separated from
organic debris and placed in resealable plastic bags. The bags were
placed on ice for transportation to the lab and refrigerated until
processing within 48 h.
2.3. Extraction and purification - sediment
Sediment samples were stirred in the collection jar and repli-
cate samples of approximately 2 grams were removed and placed
on aluminum foil, covered loosely, and allowed to dry overnight at
room temperature in the dark. The dry sediment was weighed, and
then homogenized using a mortar and pestle. The homogenized
sediment was ultrasonicated for 5 min in 10 ml of acetonitrile, then
centrifuged at 3000 rpm for 20 min in glass centrifuge tubes. The
supernatant was removed to a clean bottle. The remaining sedi-
ment was ultrasonicated and centrifuged with an additional 10 ml
of acetonitrile. Finally, the sediment was left to shake overnight in
another 5 ml acetonitrile. The combined supernatant was stored
at ¡20 °C until filtration of a subsample into 2 ml vials that were
sealed and stored at ¡80 °C until HPLC analysis.
Four samples (»0.5 g) of National Institute of Standards and
Technology (NIST) Standard Reference Material 1941a (NIST, 1994)
were processed by the same methods as the sediment samples
to determine extraction efficiencies. The average extraction effi-
ciency of )PAH16 was 86 ± 7%, the average extraction efficiency
of the 14 certified analytes was 86 ± 13%, and extraction efficiency
was greater than 60% for all analytes except ANTH at 59%. Using
similar methods to those outlined here, Kayali-Sayadi et al. (2000)
and Sun et al. (1998) obtained comparable efficiencies. Note that
ACNY and ACEN are uncertified components of the reference
material and were not detected in any sediment samples from
the stormwater retention ponds. Procedural blanks were analyzed
with every sample batch. Five PAHs were commonly detected
in sediments: NAPT, ACEN, FLTH, PYR, and B[k]F. Average blank
values for these five analytes were 2.9, 6.2, 2.5, 0.1 and, 1.0 ng/g,
respectively, and all were below their respective limits of quanti-
fication.
2.4. Extraction and purification - mussels
Mussel tissue was removed from the shells using a scalpel and
forceps, placed on aluminum foil or a glass dish, covered loosely,
and allowed to dry overnight at room temperature in the dark. Rep-
licate samples of approximately 20 average-sized mussels (approx-
imately 0.3 g dry tissue total) each were processed. Mussel tissue
was homogenized in 2 ml acetonitrile using a Biospec Products
Tissue Tearor Model 985–370 tissue homogenizer in an ice water
bath, and then centrifuged at 3000 rpm for 20 min in glass centri-
fuge tubes. A 2 ml subsample of the supernatant was removed and
stored in a sealed vial at ¡80 °C until HPLC analysis.
Mussels for use in quality assurance were collected during the
December sampling at site E, where PAH concentrations in mussel
tissue had been lowest during the August sampling. Two mussel
samples were spiked before homogenization with a certified stan-
dard PAH mixture (o2si, Charleston, South Carolina). The average
PAH concentrations from two unspiked replicates at site E were
subtracted from the recovered PAH concentrations in the spiked
samples before calculating extraction efficiencies. Extraction effi-
ciency of )PAH16 was 75 ± 11%, the average extraction efficiency of
the 16 individual analytes was 81 ± 29%, and extraction efficiency
was greater than 60% for all analytes except ACNY at 0%, PYR at
59%, and B[a]A at 43%. Five PAHs were also commonly detected in
procedural blanks for mussel tissue: NAPT, ACEN, FLTH, PYR, and
A.T. Flemming et al. / Marine Pollution Bulletin 56 (2008) 1598–1608 1601
Table 2
Physical characteristics of the stormwater pond sediments
Pond Sample site TOC (%) Sand (%) Silt (%) Clay (%)
Pond 67 A 0.3 92.0 0.0 8.0
B 0.4 93.6 0.9 5.5
D 0.3 94.7 1.2 4.1
Pond 100 E 0.2 94.8 2.1 3.1
F 0.2 96.1 2.2 1.7
G 0.2 93.1 0.0 6.9
Pond 37 H 0.3 93.2 1.3 5.5
J 0.1 92.9 1.8 5.3
K 0.2 92.1 0.0 7.9
TOC = total organic carbon.
B[k]F. Average blank values for these five analytes were 0.2, 0.9,
0.2, 0.01, and 0.1 ng/g, respectively, and all were all below their
respective limits of quantification.
2.5. Instrumental analysis
Total organic carbon (TOC) for the sediment was measured on
a Perkin Elmer CHNS/O Analyzer Model 2400/Series II. Particle
sizes of the sediment were determined using a modified Plumb
(1981) method. PAHs were quantified using reverse phase high per-
formance liquid chromatography (HPLC) on a Perkin Elmer Series
200 HPLC system connected to a UV/Visible Absorbance Detector
and a Fluorescence Detector in tandem. All detectors are part of
the Perkin Elmer Series 200 system. Fifty microliters of sample or
standard solution were injected directly onto a Hypersil Green PAH
column (5 um, 100 £ 4.6 mm), using a gradient elution of (time, %
acetonitrile) 0,50; 5,50; 25;100 at 2 ml min¡1. The fluorescence
detector was used for detection of all PAHs except acenapthylene,
which fluoresces only weakly. Instead, it was quantified using the
UV/visible detector. Peaks were recorded and quantified using
Perkin Elmer TotalChrom software (version 6.2).
Total PAH concentrations are reported as the sum of the 16 ana-
lytes ()PAH16). High molecular weight PAHs are reported as the
sum of the 10 HMW PAHs ()PAHHMW). All PAH concentrations are
reported on a dry weight basis. ACNY and ACEN were excluded
from most statistical analyses because they were consistently
below the level of quantification.
2.6. Watershed mapping
Pond watersheds were mapped based on a 3-meter resolution
LIDAR digital elevation model obtained from the Kiawah Island
Community Association (Carolina Resource Mapping, Wilmington
NC) and quarter-meter resolution digital orthophotos (Smith et al.,
2005). Spatial analyst tools within ArcGIS 9.1 were used to create
flow accumulation and basin maps for the three ponds based on
the digital elevation model, which were then adjusted according
to the digital orthophotos, plus thorough ground-truthing by the
author. Land cover was digitized by hand based on quarter-meter
resolution digital orthophotos (Smith et al., 2005) and thorough
ground-truthing. Land cover classes were chosen based on identi-
fiable features (e.g. streets, rooftops, turf) in the orthophotos that
were believed to potentially have some impact on PAH concentra-
tions in the ponds.
2.7. Statistical analysis
Statistical analyses were completed using MINITAB. An alpha
value of 0.05 was used for all statistical tests. Comparisons
between ponds, seasons, and sites within ponds for )PAH16 and
for )PAHHMW were completed using ANOVA on mean PAH concen-
trations. No transformations were used because the total concen-
trations were sufficiently normal, and log10(x+1) transformation
produced similar conclusions for differences between ponds.
Fisher’s pairwise comparisons at 95% individual error rate were
used to test for differences between cases.
3. Results
3.1. Sediment characteristics
Total organic carbon (TOC) of the pond sediments was relatively
low and ranged from 0.1% at Pond 37 site J to 0.4% at Pond 67 site
B (Table 2). Sediments were sandy with sand content ranging from
92.0% at Pond 67 site A to 96.1% at Pond 100 site F. Clay content
of these sediments was low, ranging from 1.7% at Pond 100 site
F to 8.0% at Pond 67 site A. There was a significant relationship
between sediment RPAH16 levels and TOC (p = 0.005); however,
regression models were only weakly correlated (r2 = 0.35). There
was no relationship between sediment RPAH16 levels and clay con-
tent (p = 0.2484). As a result, RPAH16 levels were not normalized for
either TOC or particle size.
3.2. Sediment and mussel PAH concentrations
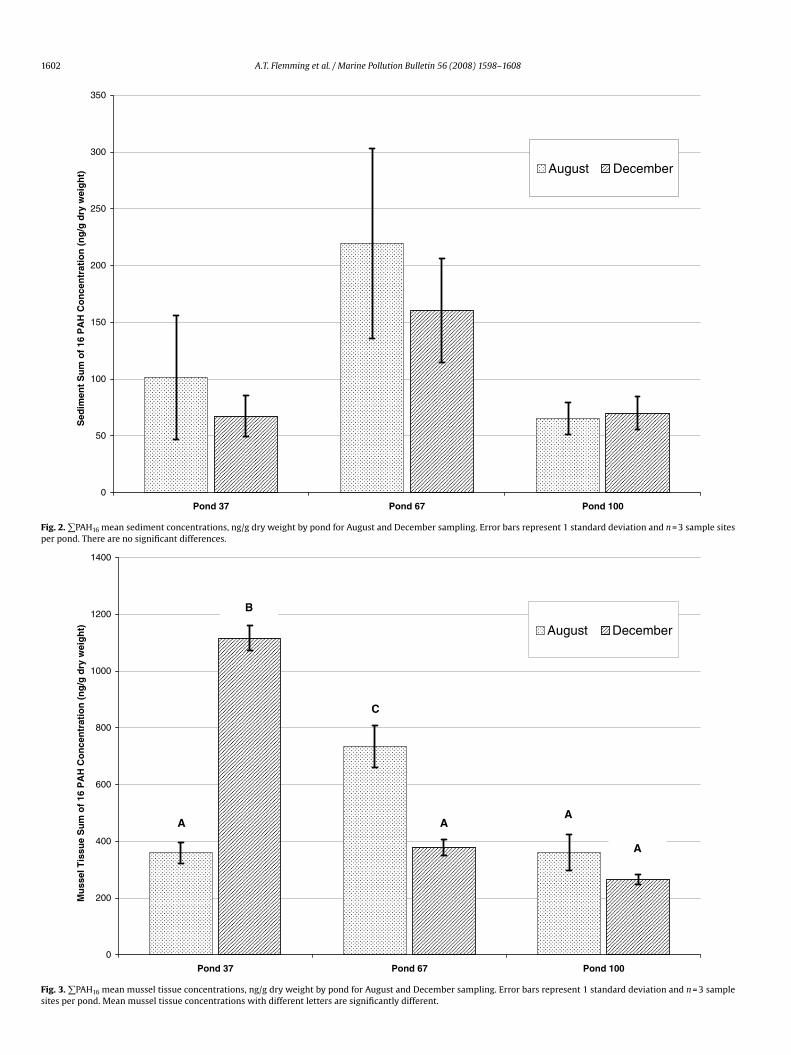
There were no significant differences in mean )PAH16 sed-
iment concentrations among ponds or seasons (p values ranged
from 0.171 to 0.836) (Fig. 2). Likewise, no significant differences
were found among ponds for the )PAHHMW in sediments. Mean
)PAHHMW values for sediments in Ponds 67, 100, and 37 were
129.9 ± 70.1 ng g¡1, 25.5 ± 22.2 ng g¡1 and 61.3 ± 69.9 ng g¡1, respec-
tively.
In contrast to the lack of differences in sediment PAH levels
among ponds and seasons, mussel tissue levels varied consider-
ably. Mean )PAH16 in mussel tissue collected during August in
Pond 67 was significantly higher than that of mussel tissue from
Pond 37 and Pond 100 (p = 0.014, Fig. 3). Mean )PAH16 in mus-
sel tissue from Pond 67 collected during August was also higher
than that of the specimens collected in December from the
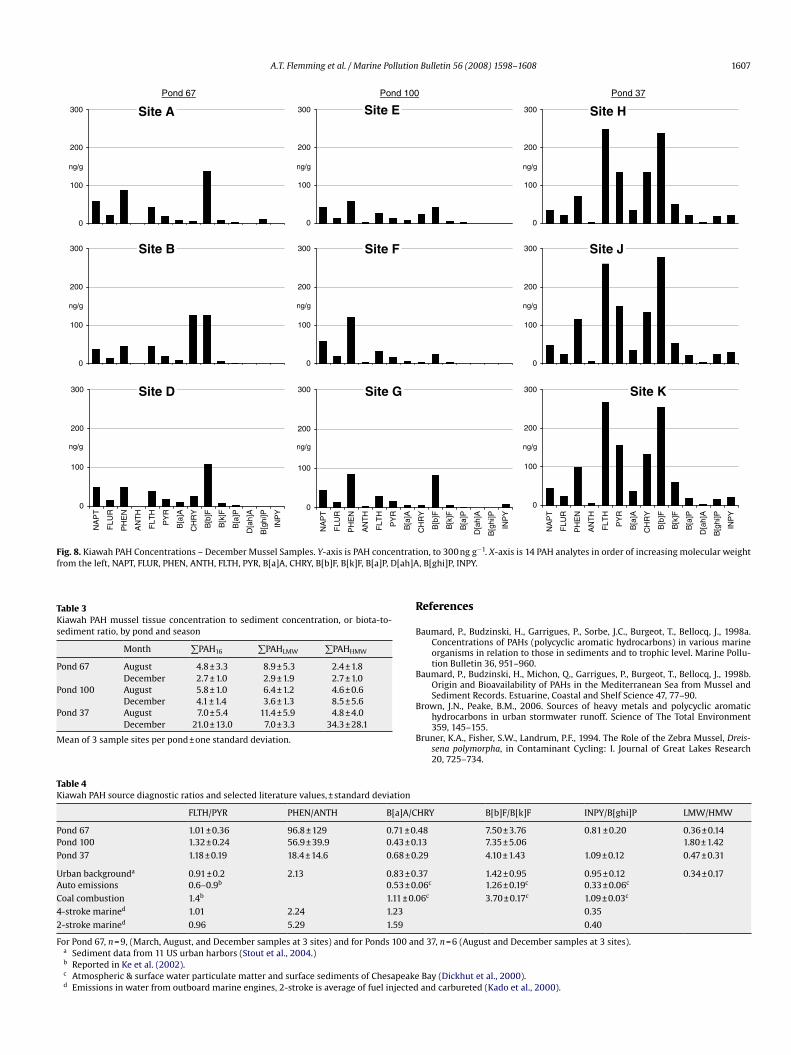
same pond (p = 0.017). In Pond 37, the December mean )PAH16
value in mussel tissue was significantly higher than that from
mussel tissue collected from all other ponds and sampling times
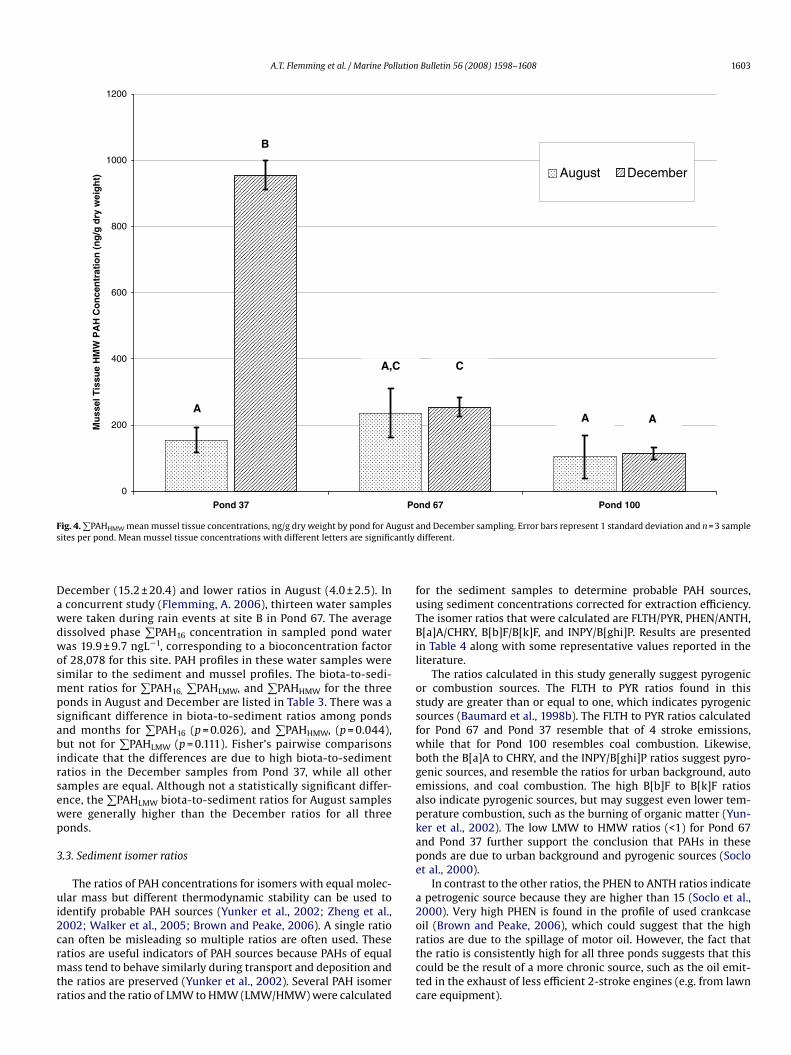
(p < 0.001). Mean )PAHHMW in mussel tissue collected from Pond
37 in December also was significantly higher than all other ponds
and sample times (p < 0.001, Fig. 4). However, mean )PAHHMW in
August mussel tissue from Pond 67 was not significantly higher
than that of the mussels collected in December (p = 0.708). This
was primarily the result of higher levels of PHEN, a LMW PAH, in
the August-collected mussel tissues. There was no difference in
mean )PAHHMW in August mussel tissue from Pond 67 and Pond
37, but mean )PAHHMW from mussels collected at both sample
times from Pond 67 were significantly higher than that of mussels
collected from Pond 100 (p = 0.021 August, and p = 0.028 Decem-
ber)(Fig. 4).
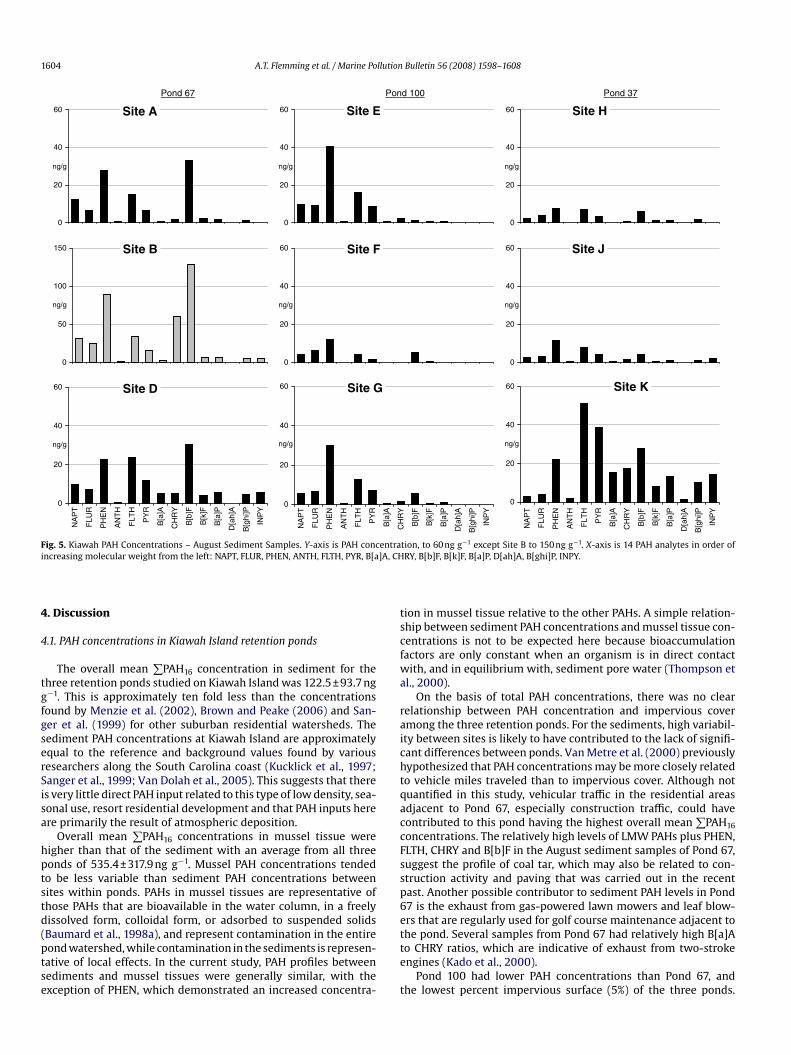
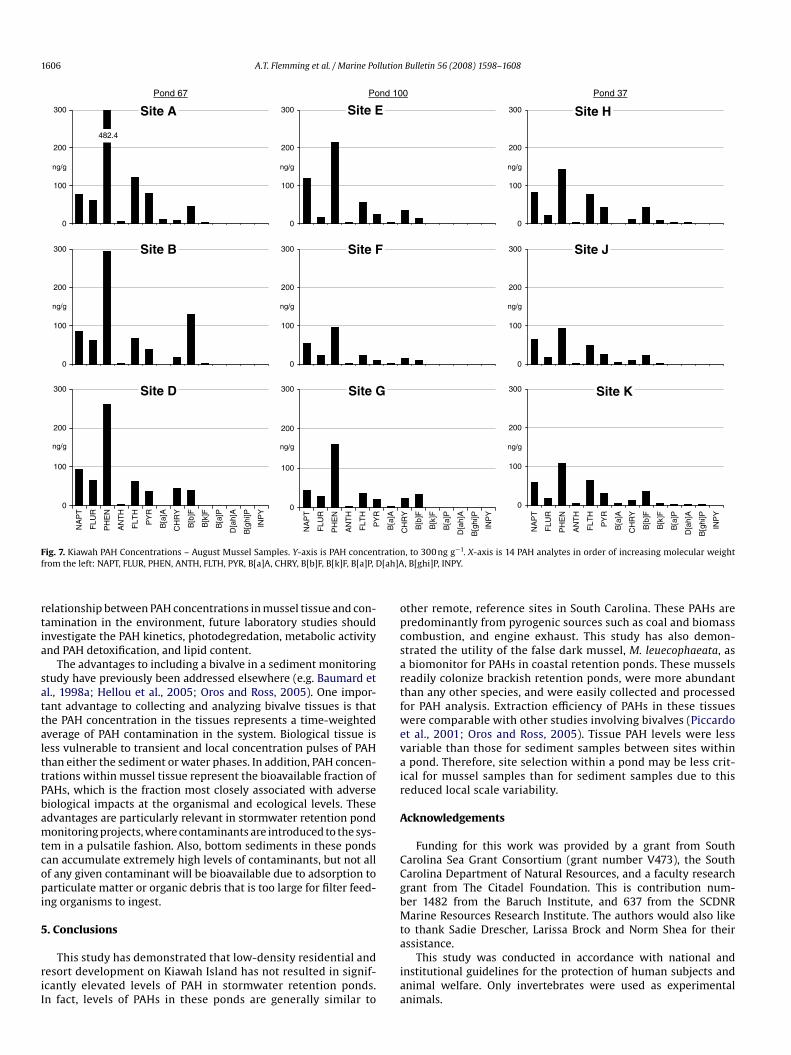
Concentrations of individual PAH analytes in sediment and mus-
sel tissues for August and December sampling at the twelve sam-
ple sites are shown in Figs. 5–8. In general, PAH concentrations and
PAH profiles (the relative abundance of PAH analytes) were more
similar between sites within ponds for the mussel tissue samples
than for the sediment samples. These profiles most closely resem-
ble the profiles commonly associated with urban background (eg
NIST, 1994; Ngabe et al., 2000; Brown and Peake, 2006).
The ratio of mussel tissue concentration to sediment concen-
tration, or biota-to-sediment ratio, for )PAH16 in all samples
ranged from 1.5 to 35.2, with mean 7.6 ± 8.1, and median 5.2. For
)PAHLMW, concentration factors were two fold higher in August
(8.9 ± 4.5) than December (4.5 ± 2.8). For )PAHHMW the trend was
reversed, with almost four fold higher concentration factors in
1602 A.T. Flemming et al. / Marine Pollution Bulletin 56 (2008) 1598–1608
0
50
100
150
200
250
300
350
Pond 37 Pond 67 Pond 100
Sed
imen
t S
um
of
16 P
AH
Co
nce
ntr
atio
n (
ng
/g d
ry w
eig
ht)
August December
Fig. 2. )PAH16 mean sediment concentrations, ng/g dry weight by pond for August and December sampling. Error bars represent 1 standard deviation and n = 3 sample sites
per pond. There are no significant differences.
0
200
400
600
800
1000
1200
1400
Pond 37 Pond 67 Pond 100
Mu
ssel
Tis
sue
Su
m o
f 16
PA
H C
on
cen
trat
ion
(n
g/g
dry
wei
gh
t)
August December
A
A
AA
C
B
Fig. 3. )PAH16 mean mussel tissue concentrations, ng/g dry weight by pond for August and December sampling. Error bars represent 1 standard deviation and n = 3 sample
sites per pond. Mean mussel tissue concentrations with different letters are significantly different.
A.T. Flemming et al. / Marine Pollution Bulletin 56 (2008) 1598–1608 1603
0
200
400
600
800
1000
1200
Pond 37 Pond 67 Pond 100
Mu
ssel
Tis
sue
HM
W P
AH
Co
nce
ntr
atio
n (
ng
/g d
ry w
eig
ht)
August December
AAA
CA,C
B
Fig. 4. )PAHHMW mean mussel tissue concentrations, ng/g dry weight by pond for August and December sampling. Error bars represent 1 standard deviation and n = 3 sample
sites per pond. Mean mussel tissue concentrations with different letters are significantly different.
December (15.2 ± 20.4) and lower ratios in August (4.0 ± 2.5). In
a concurrent study (Flemming, A. 2006), thirteen water samples
were taken during rain events at site B in Pond 67. The average
dissolved phase )PAH16 concentration in sampled pond water
was 19.9 ± 9.7 ngL¡1, corresponding to a bioconcentration factor
of 28,078 for this site. PAH profiles in these water samples were
similar to the sediment and mussel profiles. The biota-to-sedi-
ment ratios for )PAH16, )PAHLMW, and )PAHHMW for the three
ponds in August and December are listed in Table 3. There was a
significant difference in biota-to-sediment ratios among ponds
and months for )PAH16 (p = 0.026), and )PAHHMW, (p = 0.044),
but not for )PAHLMW (p = 0.111). Fisher’s pairwise comparisons
indicate that the differences are due to high biota-to-sediment
ratios in the December samples from Pond 37, while all other
samples are equal. Although not a statistically significant differ-
ence, the )PAHLMW biota-to-sediment ratios for August samples
were generally higher than the December ratios for all three
ponds.
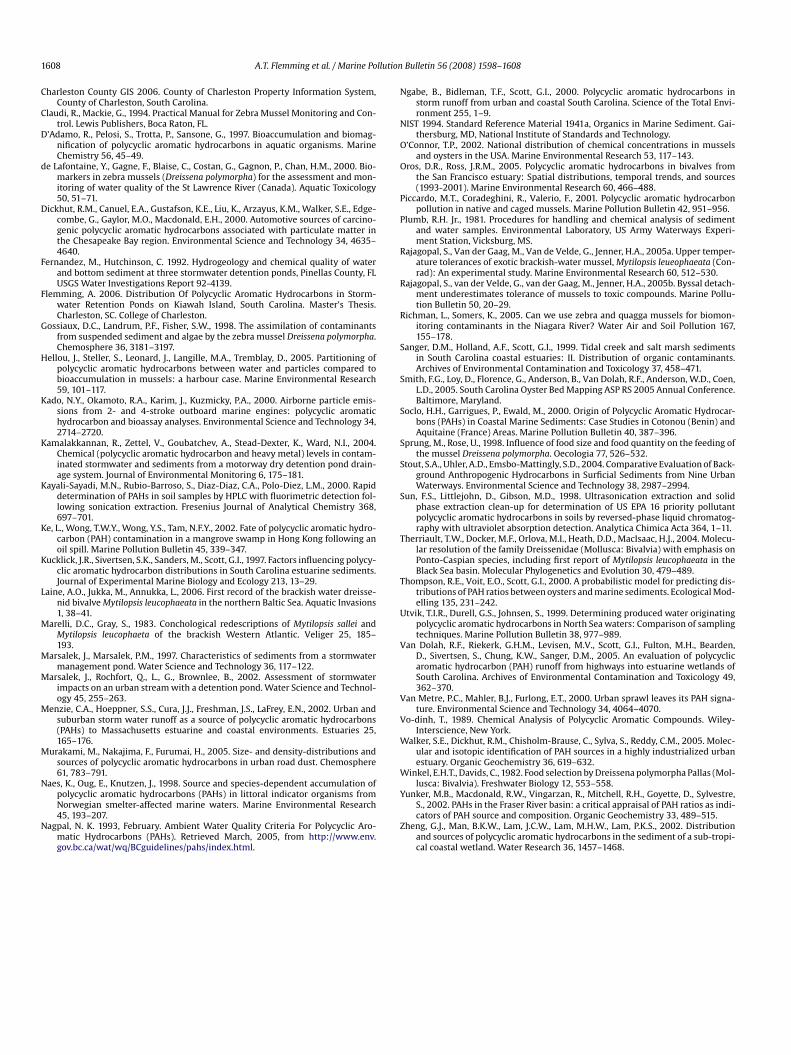
3.3. Sediment isomer ratios
The ratios of PAH concentrations for isomers with equal molec-
ular mass but different thermodynamic stability can be used to
identify probable PAH sources (Yunker et al., 2002; Zheng et al.,
2002; Walker et al., 2005; Brown and Peake, 2006). A single ratio
can often be misleading so multiple ratios are often used. These
ratios are useful indicators of PAH sources because PAHs of equal
mass tend to behave similarly during transport and deposition and
the ratios are preserved (Yunker et al., 2002). Several PAH isomer
ratios and the ratio of LMW to HMW (LMW/HMW) were calculated
for the sediment samples to determine probable PAH sources,
using sediment concentrations corrected for extraction efficiency.
The isomer ratios that were calculated are FLTH/PYR, PHEN/ANTH,
B[a]A/CHRY, B[b]F/B[k]F, and INPY/B[ghi]P. Results are presented
in Table 4 along with some representative values reported in the
literature.
The ratios calculated in this study generally suggest pyrogenic
or combustion sources. The FLTH to PYR ratios found in this
study are greater than or equal to one, which indicates pyrogenic
sources (Baumard et al., 1998b). The FLTH to PYR ratios calculated
for Pond 67 and Pond 37 resemble that of 4 stroke emissions,
while that for Pond 100 resembles coal combustion. Likewise,
both the B[a]A to CHRY, and the INPY/B[ghi]P ratios suggest pyro-
genic sources, and resemble the ratios for urban background, auto
emissions, and coal combustion. The high B[b]F to B[k]F ratios
also indicate pyrogenic sources, but may suggest even lower tem-
perature combustion, such as the burning of organic matter (Yun-
ker et al., 2002). The low LMW to HMW ratios (<1) for Pond 67
and Pond 37 further support the conclusion that PAHs in these
ponds are due to urban background and pyrogenic sources (Soclo
et al., 2000).
In contrast to the other ratios, the PHEN to ANTH ratios indicate
a petrogenic source because they are higher than 15 (Soclo et al.,
2000). Very high PHEN is found in the profile of used crankcase
oil (Brown and Peake, 2006), which could suggest that the high
ratios are due to the spillage of motor oil. However, the fact that
the ratio is consistently high for all three ponds suggests that this
could be the result of a more chronic source, such as the oil emit-
ted in the exhaust of less efficient 2-stroke engines (e.g. from lawn
care equipment).
1604 A.T. Flemming et al. / Marine Pollution Bulletin 56 (2008) 1598–1608
Pond 67
Site A
0
20
40
60
ng/g
Site B
0
50
100
150
ng/g
Site D
0
20
40
60
NA
PT
FLU
R
PH
EN
AN
TH
FLT
H
PY
R
B[a
]A
CH
RY
B[b
]F
B[k
]F
B[a
]P
D[a
h]A
B[g
hi]P
INP
Y
ng/g
Site E
0
20
40
60
ng/g
Site F
0
20
40
60
ng/g
Site G
0
20
40
60
NA
PT
FLU
R
PH
EN
AN
TH
FLT
H
PY
R
B[a
]A
CH
RY
B[b
]F
B[k
]F
B[a
]P
D[a
h]A
B[g
hi]P
INP
Y
ng/g
Site H
0
20
40
60
ng/g
Site J
0
20
40
60
ng/g
Site K
0
20
40
60
NA
PT
FLU
R
PH
EN
AN
TH
FLT
H
PY
R
B[a
]A
CH
RY
B[b
]F
B[k
]F
B[a
]P
D[a
h]A
B[g
hi]P
INP
Y
ng/g
Pond 100 Pond 37
Fig. 5. Kiawah PAH Concentrations – August Sediment Samples. Y-axis is PAH concentration, to 60 ng g¡1 except Site B to 150 ng g¡1. X-axis is 14 PAH analytes in order of
increasing molecular weight from the left: NAPT, FLUR, PHEN, ANTH, FLTH, PYR, B[a]A, CHRY, B[b]F, B[k]F, B[a]P, D[ah]A, B[ghi]P, INPY.
4. Discussion
4.1. PAH concentrations in Kiawah Island retention ponds
The overall mean )PAH16 concentration in sediment for the
three retention ponds studied on Kiawah Island was 122.5 ± 93.7 ng
g¡1. This is approximately ten fold less than the concentrations
found by Menzie et al. (2002), Brown and Peake (2006) and San-
ger et al. (1999) for other suburban residential watersheds. The
sediment PAH concentrations at Kiawah Island are approximately
equal to the reference and background values found by various
researchers along the South Carolina coast (Kucklick et al., 1997;
Sanger et al., 1999; Van Dolah et al., 2005). This suggests that there
is very little direct PAH input related to this type of low density, sea-
sonal use, resort residential development and that PAH inputs here
are primarily the result of atmospheric deposition.
Overall mean )PAH16 concentrations in mussel tissue were
higher than that of the sediment with an average from all three
ponds of 535.4 ± 317.9 ng g¡1. Mussel PAH concentrations tended
to be less variable than sediment PAH concentrations between
sites within ponds. PAHs in mussel tissues are representative of
those PAHs that are bioavailable in the water column, in a freely
dissolved form, colloidal form, or adsorbed to suspended solids
(Baumard et al., 1998a), and represent contamination in the entire
pond watershed, while contamination in the sediments is represen-
tative of local effects. In the current study, PAH profiles between
sediments and mussel tissues were generally similar, with the
exception of PHEN, which demonstrated an increased concentra-
tion in mussel tissue relative to the other PAHs. A simple relation-
ship between sediment PAH concentrations and mussel tissue con-
centrations is not to be expected here because bioaccumulation
factors are only constant when an organism is in direct contact
with, and in equilibrium with, sediment pore water (Thompson et
al., 2000).
On the basis of total PAH concentrations, there was no clear
relationship between PAH concentration and impervious cover
among the three retention ponds. For the sediments, high variabil-
ity between sites is likely to have contributed to the lack of signifi-
cant differences between ponds. Van Metre et al. (2000) previously
hypothesized that PAH concentrations may be more closely related
to vehicle miles traveled than to impervious cover. Although not
quantified in this study, vehicular traffic in the residential areas
adjacent to Pond 67, especially construction traffic, could have
contributed to this pond having the highest overall mean )PAH16
concentrations. The relatively high levels of LMW PAHs plus PHEN,
FLTH, CHRY and B[b]F in the August sediment samples of Pond 67,
suggest the profile of coal tar, which may also be related to con-
struction activity and paving that was carried out in the recent
past. Another possible contributor to sediment PAH levels in Pond
67 is the exhaust from gas-powered lawn mowers and leaf blow-
ers that are regularly used for golf course maintenance adjacent to
the pond. Several samples from Pond 67 had relatively high B[a]A
to CHRY ratios, which are indicative of exhaust from two-stroke
engines (Kado et al., 2000).
Pond 100 had lower PAH concentrations than Pond 67, and
the lowest percent impervious surface (5%) of the three ponds.
A.T. Flemming et al. / Marine Pollution Bulletin 56 (2008) 1598–1608 1605
Site A
0
20
40
60
ng/g
Site B67.0
0
20
40
60
ng/g
Site D
0
20
40
60
NA
PT
FLU
R
PH
EN
AN
TH
FLT
H
PY
R
B[a
]A
CH
RY
B[b
]F
B[k
]F
B[a
]P
D[a
h]A
B[g
hi]P
INP
Y
ng/g
Site E
0
20
40
60
ng/g
Site F
0
20
40
60
ng/g
Site G
0
20
40
60
NA
PT
FLU
R
PH
EN
AN
TH
FLT
H
PY
R
B[a
]A
CH
RY
B[b
]F
B[k
]F
B[a
]P
D[a
h]A
B[g
hi]P
INP
Y
ng/g
Site H
0
20
40
60
ng/g
Site J
0
20
40
60
ng/g
Site K
0
20
40
60
NA
PT
FLU
R
PH
EN
AN
TH
FLT
H
PY
R
B[a
]A
CH
RY
B[b
]F
B[k
]F
B[a
]P
D[a
h]A
B[g
hi]P
INP
Y
ng/g
Pond 67 Pond 100 Pond 37
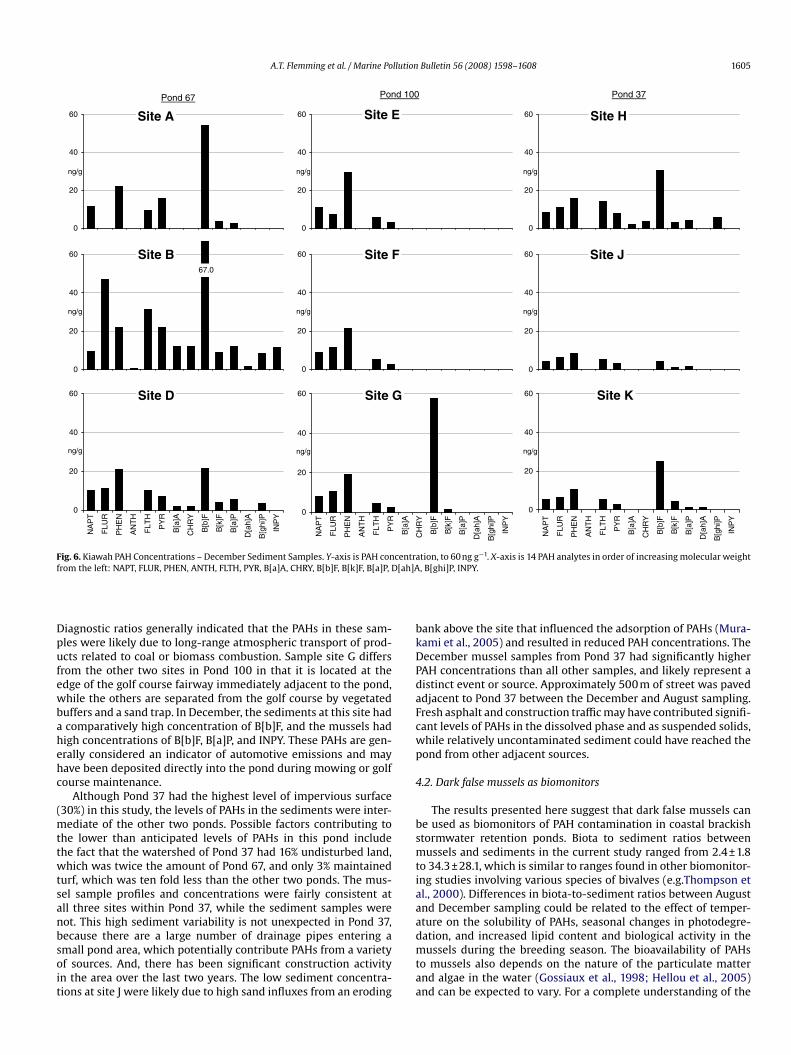
Fig. 6. Kiawah PAH Concentrations – December Sediment Samples. Y-axis is PAH concentration, to 60 ng g¡1. X-axis is 14 PAH analytes in order of increasing molecular weight
from the left: NAPT, FLUR, PHEN, ANTH, FLTH, PYR, B[a]A, CHRY, B[b]F, B[k]F, B[a]P, D[ah]A, B[ghi]P, INPY.
Diagnostic ratios generally indicated that the PAHs in these sam-
ples were likely due to long-range atmospheric transport of prod-
ucts related to coal or biomass combustion. Sample site G differs
from the other two sites in Pond 100 in that it is located at the
edge of the golf course fairway immediately adjacent to the pond,
while the others are separated from the golf course by vegetated
buffers and a sand trap. In December, the sediments at this site had
a comparatively high concentration of B[b]F, and the mussels had
high concentrations of B[b]F, B[a]P, and INPY. These PAHs are gen-
erally considered an indicator of automotive emissions and may
have been deposited directly into the pond during mowing or golf
course maintenance.
Although Pond 37 had the highest level of impervious surface
(30%) in this study, the levels of PAHs in the sediments were inter-
mediate of the other two ponds. Possible factors contributing to
the lower than anticipated levels of PAHs in this pond include
the fact that the watershed of Pond 37 had 16% undisturbed land,
which was twice the amount of Pond 67, and only 3% maintained
turf, which was ten fold less than the other two ponds. The mus-
sel sample profiles and concentrations were fairly consistent at
all three sites within Pond 37, while the sediment samples were
not. This high sediment variability is not unexpected in Pond 37,
because there are a large number of drainage pipes entering a
small pond area, which potentially contribute PAHs from a variety
of sources. And, there has been significant construction activity
in the area over the last two years. The low sediment concentra-
tions at site J were likely due to high sand influxes from an eroding
bank above the site that influenced the adsorption of PAHs (Mura-
kami et al., 2005) and resulted in reduced PAH concentrations. The
December mussel samples from Pond 37 had significantly higher
PAH concentrations than all other samples, and likely represent a
distinct event or source. Approximately 500 m of street was paved
adjacent to Pond 37 between the December and August sampling.
Fresh asphalt and construction traffic may have contributed signifi-
cant levels of PAHs in the dissolved phase and as suspended solids,
while relatively uncontaminated sediment could have reached the
pond from other adjacent sources.
4.2. Dark false mussels as biomonitors
The results presented here suggest that dark false mussels can
be used as biomonitors of PAH contamination in coastal brackish
stormwater retention ponds. Biota to sediment ratios between
mussels and sediments in the current study ranged from 2.4 ± 1.8
to 34.3 ± 28.1, which is similar to ranges found in other biomonitor-
ing studies involving various species of bivalves (e.g.Thompson et
al., 2000). Differences in biota-to-sediment ratios between August
and December sampling could be related to the effect of temper-
ature on the solubility of PAHs, seasonal changes in photodegre-
dation, and increased lipid content and biological activity in the
mussels during the breeding season. The bioavailability of PAHs
to mussels also depends on the nature of the particulate matter
and algae in the water (Gossiaux et al., 1998; Hellou et al., 2005)
and can be expected to vary. For a complete understanding of the
1606 A.T. Flemming et al. / Marine Pollution Bulletin 56 (2008) 1598–1608
Site A
482.4
0
100
200
300
ng/g
Site B
0
100
200
300
ng/g
Site D
0
100
200
300
NA
PT
FLU
R
PH
EN
AN
TH
FLT
H
PY
R
B[a
]A
CH
RY
B[b
]F
B[k
]F
B[a
]P
D[a
h]A
B[g
hi]P
INP
Y
ng/g
Site E
0
100
200
300
ng/g
Site F
0
100
200
300
ng/g
Site G
0
100
200
300
NA
PT
FLU
R
PH
EN
AN
TH
FLT
H
PY
R
B[a
]A
CH
RY
B[b
]F
B[k
]F
B[a
]P
D[a
h]A
B[g
hi]P
INP
Y
ng/g
Site H
0
100
200
300
ng/g
Site J
0
100
200
300
ng/g
Site K
0
100
200
300
NA
PT
FLU
R
PH
EN
AN
TH
FLT
H
PY
R
B[a
]A
CH
RY
B[b
]F
B[k
]F
B[a
]P
D[a
h]A
B[g
hi]P
INP
Y
ng/g
Pond 67 Pond 100 Pond 37
Fig. 7. Kiawah PAH Concentrations – August Mussel Samples. Y-axis is PAH concentration, to 300 ng g¡1. X-axis is 14 PAH analytes in order of increasing molecular weight
from the left: NAPT, FLUR, PHEN, ANTH, FLTH, PYR, B[a]A, CHRY, B[b]F, B[k]F, B[a]P, D[ah]A, B[ghi]P, INPY.
relationship between PAH concentrations in mussel tissue and con-
tamination in the environment, future laboratory studies should
investigate the PAH kinetics, photodegredation, metabolic activity
and PAH detoxification, and lipid content.
The advantages to including a bivalve in a sediment monitoring
study have previously been addressed elsewhere (e.g. Baumard et
al., 1998a; Hellou et al., 2005; Oros and Ross, 2005). One impor-
tant advantage to collecting and analyzing bivalve tissues is that
the PAH concentration in the tissues represents a time-weighted
average of PAH contamination in the system. Biological tissue is
less vulnerable to transient and local concentration pulses of PAH
than either the sediment or water phases. In addition, PAH concen-
trations within mussel tissue represent the bioavailable fraction of
PAHs, which is the fraction most closely associated with adverse
biological impacts at the organismal and ecological levels. These
advantages are particularly relevant in stormwater retention pond
monitoring projects, where contaminants are introduced to the sys-
tem in a pulsatile fashion. Also, bottom sediments in these ponds
can accumulate extremely high levels of contaminants, but not all
of any given contaminant will be bioavailable due to adsorption to
particulate matter or organic debris that is too large for filter feed-
ing organisms to ingest.
5. Conclusions
This study has demonstrated that low-density residential and
resort development on Kiawah Island has not resulted in signif-
icantly elevated levels of PAH in stormwater retention ponds.
In fact, levels of PAHs in these ponds are generally similar to
other remote, reference sites in South Carolina. These PAHs are
predominantly from pyrogenic sources such as coal and biomass
combustion, and engine exhaust. This study has also demon-
strated the utility of the false dark mussel, M. leuecophaeata, as
a biomonitor for PAHs in coastal retention ponds. These mussels
readily colonize brackish retention ponds, were more abundant
than any other species, and were easily collected and processed
for PAH analysis. Extraction efficiency of PAHs in these tissues
were comparable with other studies involving bivalves (Piccardo
et al., 2001; Oros and Ross, 2005). Tissue PAH levels were less
variable than those for sediment samples between sites within
a pond. Therefore, site selection within a pond may be less crit-
ical for mussel samples than for sediment samples due to this
reduced local scale variability.
Acknowledgements
Funding for this work was provided by a grant from South
Carolina Sea Grant Consortium (grant number V473), the South
Carolina Department of Natural Resources, and a faculty research
grant from The Citadel Foundation. This is contribution num-
ber 1482 from the Baruch Institute, and 637 from the SCDNR
Marine Resources Research Institute. The authors would also like
to thank Sadie Drescher, Larissa Brock and Norm Shea for their
assistance.
This study was conducted in accordance with national and
institutional guidelines for the protection of human subjects and
animal welfare. Only invertebrates were used as experimental
animals.
A.T. Flemming et al. / Marine Pollution Bulletin 56 (2008) 1598–1608 1607
Site A
0
100
200
300
ng/g
Site B
0
100
200
300
ng/g
Site D
0
100
200
300
NA
PT
FLU
R
PH
EN
AN
TH
FLT
H
PY
R
B[a
]A
CH
RY
B[b
]F
B[k
]F
B[a
]P
D[a
h]A
B[g
hi]P
INP
Y
ng/g
Site E
0
100
200
300
ng/g
Site F
0
100
200
300
ng/g
Site G
0
100
200
300
NA
PT
FLU
R
PH
EN
AN
TH
FLT
H
PY
R
B[a
]A
CH
RY
B[b
]F
B[k
]F
B[a
]P
D[a
h]A
B[g
hi]P
INP
Y
ng/g
Site H
0
100
200
300
ng/g
Site J
0
100
200
300
ng/g
Site K
0
100
200
300
NA
PT
FLU
R
PH
EN
AN
TH
FLT
H
PY
R
B[a
]A
CH
RY
B[b
]F
B[k
]F
B[a
]P
D[a
h]A
B[g
hi]P
INP
Y
ng/g
Pond 67 Pond 100 Pond 37
Fig. 8. Kiawah PAH Concentrations – December Mussel Samples. Y-axis is PAH concentration, to 300 ng g¡1. X-axis is 14 PAH analytes in order of increasing molecular weight
from the left, NAPT, FLUR, PHEN, ANTH, FLTH, PYR, B[a]A, CHRY, B[b]F, B[k]F, B[a]P, D[ah]A, B[ghi]P, INPY.
Table 3
Kiawah PAH mussel tissue concentration to sediment concentration, or biota-to-
sediment ratio, by pond and season
Month )PAH16 )PAHLMW )PAHHMW
Pond 67 August 4.8 ± 3.3 8.9 ± 5.3 2.4 ± 1.8
December 2.7 ± 1.0 2.9 ± 1.9 2.7 ± 1.0
Pond 100 August 5.8 ± 1.0 6.4 ± 1.2 4.6 ± 0.6
December 4.1 ± 1.4 3.6 ± 1.3 8.5 ± 5.6
Pond 37 August 7.0 ± 5.4 11.4 ± 5.9 4.8 ± 4.0
December 21.0 ± 13.0 7.0 ± 3.3 34.3 ± 28.1
Mean of 3 sample sites per pond ± one standard deviation.
Table 4
Kiawah PAH source diagnostic ratios and selected literature values, ± standard deviation
FLTH/PYR PHEN/ANTH B[a]A
Pond 67 1.01 ± 0.36 96.8 ± 129 0.71 ±
Pond 100 1.32 ± 0.24 56.9 ± 39.9 0.43 ±
Pond 37 1.18 ± 0.19 18.4 ± 14.6 0.68 ±
Urban backgrounda 0.91 ± 0.2 2.13 0.83 ±
Auto emissions 0.6–0.9b 0.53 ±
Coal combustion 1.4b 1.11 ±
4-stroke marined 1.01 2.24 1.23
2-stroke marined 0.96 5.29 1.59
For Pond 67, n = 9, (March, August, and December samples at 3 sites) and for Ponds 100 a Sediment data from 11 US urban harbors (Stout et al., 2004.) b Reported in Ke et al. (2002). c Atmospheric & surface water particulate matter and surface sediments of Chesapea d Emissions in water from outboard marine engines, 2-stroke is average of fuel inject
References
Baumard, P., Budzinski, H., Garrigues, P., Sorbe, J.C., Burgeot, T., Bellocq, J., 1998a. Concentrations of PAHs (polycyclic aromatic hydrocarbons) in various marine organisms in relation to those in sediments and to trophic level. Marine Pollu-tion Bulletin 36, 951–960.
Baumard, P., Budzinski, H., Michon, Q., Garrigues, P., Burgeot, T., Bellocq, J., 1998b. Origin and Bioavailability of PAHs in the Mediterranean Sea from Mussel and Sediment Records. Estuarine, Coastal and Shelf Science 47, 77–90.
Brown, J.N., Peake, B.M., 2006. Sources of heavy metals and polycyclic aromatic hydrocarbons in urban stormwater runoff. Science of The Total Environment 359, 145–155.
Bruner, K.A., Fisher, S.W., Landrum, P.F., 1994. The Role of the Zebra Mussel, Dreis-sena polymorpha, in Contaminant Cycling: I. Journal of Great Lakes Research 20, 725–734.
/CHRY B[b]F/B[k]F INPY/B[ghi]P LMW/HMW
0.48 7.50 ± 3.76 0.81 ± 0.20 0.36 ± 0.14
0.13 7.35 ± 5.06 1.80 ± 1.42
0.29 4.10 ± 1.43 1.09 ± 0.12 0.47 ± 0.31
0.37 1.42 ± 0.95 0.95 ± 0.12 0.34 ± 0.17
0.06c 1.26 ± 0.19c 0.33 ± 0.06c
0.06c 3.70 ± 0.17c 1.09 ± 0.03c
0.35
0.40
and 37, n = 6 (August and December samples at 3 sites).
ke Bay (Dickhut et al., 2000).
ed and carbureted (Kado et al., 2000).
1608 A.T. Flemming et al. / Marine Pollution Bulletin 56 (2008) 1598–1608
Charleston County GIS 2006. County of Charleston Property Information System,County of Charleston, South Carolina.
Claudi, R., Mackie, G., 1994. Practical Manual for Zebra Mussel Monitoring and Con-trol. Lewis Publishers, Boca Raton, FL.
D’Adamo, R., Pelosi, S., Trotta, P., Sansone, G., 1997. Bioaccumulation and biomag-nification of polycyclic aromatic hydrocarbons in aquatic organisms. MarineChemistry 56, 45–49.
de Lafontaine, Y., Gagne, F., Blaise, C., Costan, G., Gagnon, P., Chan, H.M., 2000. Bio-markers in zebra mussels (Dreissena polymorpha) for the assessment and mon-itoring of water quality of the St Lawrence River (Canada). Aquatic Toxicology50, 51–71.
Dickhut, R.M., Canuel, E.A., Gustafson, K.E., Liu, K., Arzayus, K.M., Walker, S.E., Edge-combe, G., Gaylor, M.O., Macdonald, E.H., 2000. Automotive sources of carcino-genic polycyclic aromatic hydrocarbons associated with particulate matter inthe Chesapeake Bay region. Environmental Science and Technology 34, 4635–4640.
Fernandez, M., Hutchinson, C. 1992. Hydrogeology and chemical quality of waterand bottom sediment at three stormwater detention ponds, Pinellas County, FLUSGS Water Investigations Report 92-4139.
Flemming, A. 2006. Distribution Of Polycyclic Aromatic Hydrocarbons in Storm-water Retention Ponds on Kiawah Island, South Carolina. Master’s Thesis.Charleston, SC. College of Charleston.
Gossiaux, D.C., Landrum, P.F., Fisher, S.W., 1998. The assimilation of contaminantsfrom suspended sediment and algae by the zebra mussel Dreissena polymorpha.Chemosphere 36, 3181–3197.
Hellou, J., Steller, S., Leonard, J., Langille, M.A., Tremblay, D., 2005. Partitioning ofpolycyclic aromatic hydrocarbons between water and particles compared to
bioaccumulation in mussels: a harbour case. Marine Environmental Research59, 101–117.
Kado, N.Y., Okamoto, R.A., Karim, J., Kuzmicky, P.A., 2000. Airborne particle emis-sions from 2- and 4-stroke outboard marine engines: polycyclic aromatichydrocarbon and bioassay analyses. Environmental Science and Technology 34,2714–2720.
Kamalakkannan, R., Zettel, V., Goubatchev, A., Stead-Dexter, K., Ward, N.I., 2004.Chemical (polycyclic aromatic hydrocarbon and heavy metal) levels in contam-inated stormwater and sediments from a motorway dry detention pond drain-age system. Journal of Environmental Monitoring 6, 175–181.
Kayali-Sayadi, M.N., Rubio-Barroso, S., Diaz-Diaz, C.A., Polo-Diez, L.M., 2000. Rapiddetermination of PAHs in soil samples by HPLC with fluorimetric detection fol-lowing sonication extraction. Fresenius Journal of Analytical Chemistry 368,697–701.
Ke, L., Wong, T.W.Y., Wong, Y.S., Tam, N.F.Y., 2002. Fate of polycyclic aromatic hydro-carbon (PAH) contamination in a mangrove swamp in Hong Kong following anoil spill. Marine Pollution Bulletin 45, 339–347.
Kucklick, J.R., Sivertsen, S.K., Sanders, M., Scott, G.I., 1997. Factors influencing polycy-clic aromatic hydrocarbon distributions in South Carolina estuarine sediments.Journal of Experimental Marine Biology and Ecology 213, 13–29.
Laine, A.O., Jukka, M., Annukka, L., 2006. First record of the brackish water dreisse-nid bivalve Mytilopsis leucophaeata in the northern Baltic Sea. Aquatic Invasions1, 38–41.
Marelli, D.C., Gray, S., 1983. Conchological redescriptions of Mytilopsis sallei andMytilopsis leucophaeta of the brackish Western Atlantic. Veliger 25, 185–193.
Marsalek, J., Marsalek, P.M., 1997. Characteristics of sediments from a stormwatermanagement pond. Water Science and Technology 36, 117–122.
Marsalek, J., Rochfort, Q., L., G., Brownlee, B., 2002. Assessment of stormwaterimpacts on an urban stream with a detention pond. Water Science and Technol-ogy 45, 255–263.
Menzie, C.A., Hoeppner, S.S., Cura, J.J., Freshman, J.S., LaFrey, E.N., 2002. Urban and
suburban storm water runoff as a source of polycyclic aromatic hydrocarbons(PAHs) to Massachusetts estuarine and coastal environments. Estuaries 25,165–176.
Murakami, M., Nakajima, F., Furumai, H., 2005. Size- and density-distributions andsources of polycyclic aromatic hydrocarbons in urban road dust. Chemosphere61, 783–791.
Naes, K., Oug, E., Knutzen, J., 1998. Source and species-dependent accumulation ofpolycyclic aromatic hydrocarbons (PAHs) in littoral indicator organisms fromNorwegian smelter-affected marine waters. Marine Environmental Research45, 193–207.
Nagpal, N. K. 1993, February. Ambient Water Quality Criteria For Polycyclic Aro-matic Hydrocarbons (PAHs). Retrieved March, 2005, from http://www.env.gov.bc.ca/wat/wq/BCguidelines/pahs/index.html.
Ngabe, B., Bidleman, T.F., Scott, G.I., 2000. Polycyclic aromatic hydrocarbons in storm runoff from urban and coastal South Carolina. Science of the Total Envi-ronment 255, 1–9.
NIST 1994. Standard Reference Material 1941a, Organics in Marine Sediment. Gai-thersburg, MD, National Institute of Standards and Technology.
O’Connor, T.P., 2002. National distribution of chemical concentrations in mussels and oysters in the USA. Marine Environmental Research 53, 117–143.
Oros, D.R., Ross, J.R.M., 2005. Polycyclic aromatic hydrocarbons in bivalves from the San Francisco estuary: Spatial distributions, temporal trends, and sources (1993-2001). Marine Environmental Research 60, 466–488.
Piccardo, M.T., Coradeghini, R., Valerio, F., 2001. Polycyclic aromatic hydrocarbon pollution in native and caged mussels. Marine Pollution Bulletin 42, 951–956.
Plumb, R.H. Jr., 1981. Procedures for handling and chemical analysis of sediment and water samples. Environmental Laboratory, US Army Waterways Experi-ment Station, Vicksburg, MS.
Rajagopal, S., Van der Gaag, M., Van de Velde, G., Jenner, H.A., 2005a. Upper temper-ature tolerances of exotic brackish-water mussel, Mytilopsis leueophaeata (Con-rad): An experimental study. Marine Environmental Research 60, 512–530.
Rajagopal, S., van der Velde, G., van der Gaag, M., Jenner, H.A., 2005b. Byssal detach-ment underestimates tolerance of mussels to toxic compounds. Marine Pollu-tion Bulletin 50, 20–29.
Richman, L., Somers, K., 2005. Can we use zebra and quagga mussels for biomon-itoring contaminants in the Niagara River? Water Air and Soil Pollution 167, 155–178.
Sanger, D.M., Holland, A.F., Scott, G.I., 1999. Tidal creek and salt marsh sediments in South Carolina coastal estuaries: II. Distribution of organic contaminants. Archives of Environmental Contamination and Toxicology 37, 458–471.
Smith, F.G., Loy, D., Florence, G., Anderson, B., Van Dolah, R.F., Anderson, W.D., Coen, L.D., 2005. South Carolina Oyster Bed Mapping ASP RS 2005 Annual Conference. Baltimore, Maryland.
Soclo, H.H., Garrigues, P., Ewald, M., 2000. Origin of Polycyclic Aromatic Hydrocar-bons (PAHs) in Coastal Marine Sediments: Case Studies in Cotonou (Benin) and Aquitaine (France) Areas. Marine Pollution Bulletin 40, 387–396.
Sprung, M., Rose, U., 1998. Influence of food size and food quantity on the feeding of the mussel Dreissena polymorpha. Oecologia 77, 526–532.
Stout, S.A., Uhler, A.D., Emsbo-Mattingly, S.D., 2004. Comparative Evaluation of Back-ground Anthropogenic Hydrocarbons in Surficial Sediments from Nine Urban Waterways. Environmental Science and Technology 38, 2987–2994.
Sun, F.S., Littlejohn, D., Gibson, M.D., 1998. Ultrasonication extraction and solid phase extraction clean-up for determination of US EPA 16 priority pollutant polycyclic aromatic hydrocarbons in soils by reversed-phase liquid chromatog-raphy with ultraviolet absorption detection. Analytica Chimica Acta 364, 1–11.
Therriault, T.W., Docker, M.F., Orlova, M.I., Heath, D.D., MacIsaac, H.J., 2004. Molecu-lar resolution of the family Dreissenidae (Mollusca: Bivalvia) with emphasis on Ponto-Caspian species, including first report of Mytilopsis leucophaeata in the Black Sea basin. Molecular Phylogenetics and Evolution 30, 479–489.
Thompson, R.E., Voit, E.O., Scott, G.I., 2000. A probabilistic model for predicting dis-tributions of PAH ratios between oysters and marine sediments. Ecological Mod-elling 135, 231–242.
Utvik, T.I.R., Durell, G.S., Johnsen, S., 1999. Determining produced water originating polycyclic aromatic hydrocarbons in North Sea waters: Comparison of sampling techniques. Marine Pollution Bulletin 38, 977–989.
Van Dolah, R.F., Riekerk, G.H.M., Levisen, M.V., Scott, G.I., Fulton, M.H., Bearden, D., Sivertsen, S., Chung, K.W., Sanger, D.M., 2005. An evaluation of polycyclic aromatic hydrocarbon (PAH) runoff from highways into estuarine wetlands of South Carolina. Archives of Environmental Contamination and Toxicology 49, 362–370.
Van Metre, P.C., Mahler, B.J., Furlong, E.T., 2000. Urban sprawl leaves its PAH signa-ture. Environmental Science and Technology 34, 4064–4070.
Vo-dinh, T., 1989. Chemical Analysis of Polycyclic Aromatic Compounds. Wiley-Interscience, New York.
Walker, S.E., Dickhut, R.M., Chisholm-Brause, C., Sylva, S., Reddy, C.M., 2005. Molec-ular and isotopic identification of PAH sources in a highly industrialized urban estuary. Organic Geochemistry 36, 619–632.
Winkel, E.H.T., Davids, C., 1982. Food selection by Dreissena polymorpha Pallas (Mol-lusca: Bivalvia). Freshwater Biology 12, 553–558.
Yunker, M.B., Macdonald, R.W., Vingarzan, R., Mitchell, R.H., Goyette, D., Sylvestre, S., 2002. PAHs in the Fraser River basin: a critical appraisal of PAH ratios as indi-cators of PAH source and composition. Organic Geochemistry 33, 489–515.
Zheng, G.J., Man, B.K.W., Lam, J.C.W., Lam, M.H.W., Lam, P.K.S., 2002. Distribution and sources of polycyclic aromatic hydrocarbons in the sediment of a sub-tropi-cal coastal wetland. Water Research 36, 1457–1468.
Copyright © 2022 FDOKUMEN