Survey of Innovation, Intellectual Property Creation and Usage among Singapore Firms
84
Transcript of Survey of Innovation, Intellectual Property Creation and Usage among Singapore Firms


SURVEY OF INNOVATION,INTELLECTUAL PROPERTY
CREATION & USAGE AMONG SINGAPORE FIRMS
PREPARED BY A/PROF WONG POH KAM
HO YUEN PING
ANNETTE SINGH
NUS ENTREPRENEURSHIP CENTRE
FOR IP ACADEMY (SINGAPORE)
FEBRUARY 2006

p_ii
CONTENT PAGE
CONTENTS
2 INTRODUCTION
3 SURVEY OBJECTIVES
3 SURVEY OVERVIEW
4 SAMPLE DEMOGRAPHICS
9 STATISTICAL ERROR BOUNDS
10 INNOVATION
10 INNOVATIVENESS OF FIRMS
13 INNOVATION ACTIVITIES AND EXPENDITURE
16 INNOVATION CO-OPERATION
19 PROBLEMS AND OBSTACLES IN INNOVATION
21 IP CREATION
22 PATENTS
26 NON-PATENT IP
28 USAGE OF OWN IP
28 USAGE OF PATENTS
34 USAGE OF NON-PATENT IP
36 USAGE OF EXTERNAL IP
36 LICENSING-IN OF PATENTS
39 LICENSING-IN OF NON-PATENT IP
43 INTERNAL ENVIRONMENT FOR IP CREATION AND IP STRATEGY
43 INTERNAL ENVIRONMENT FOR IP CREATION
45 IP STRATEGY
49 EXTERNAL ENVIRONMENT FOR IP CREATION AND USAGE
49 IP ENVIRONMENT OF SINGAPORE
49 USAGE OF IP FACILITATION SERVICES
52 IP ENFORCEMENT AND INFRINGEMENT

p_ iii
CONTENT PAGE
55 SUMMARY AND CONCLUSIONS
55 INNOVATION
55 IP CREATION AND USAGE
57 SINGAPORE’S IP ENVIRONMENT
57 POLICY IMPLICATIONS
59 REFERENCES
61 ANNEX A - SELECTED INNOVATION AND IP INDICATORS FOR SPECIFIC INDUSTRIES
66 ANNEX B - COMPARISON BETWEEN WEIGHTED AND UNWEIGHTED DATA
68 ANNEX C - ERROR BOUNDS
71 ANNEX D - CORRELATION MATRICES
73 ANNEX E - TESTS OF DIFFERENCES
74 ANNEX F - REGRESSION ANALYSIS
LIST OF FIGURES
10 Figure 2-1 Innovating firms (Firms that have introduced new product or process
innovation to the market in last 3 years)
11 Figure 2-2 Product and process innovators
12 Figure 2-3a Turnover (volume/output) from new/significantly improved products
(processes) introduced during the last three years (by sector)
12 Figure 2-3b Turnover (volume/output) from new/significantly improved products
(processes) introduced during the last three years (by employee size of firm)
15 Figure 2-4a Innovation intensity (% of sales spent on innovation activities) and R&D
intensity (% of sales spent on R&D activities) (by sector)
15 Figure 2-4b Innovation intensity (% of sales spent on innovation activities) and R&D
intensity (% of sales spent on R&D activities) (by employee size of firm)
16 Figure 2-5 Collaboration on innovation activities in the last three years
16 Figure 2-6 Parties involved in developing product innovations introduced within the
last three fiscal years

p_
CONTENT PAGE
iv
17 Figure 2-7 Parties involved in developing process innovations introduced within the
last three fiscal years
19 Figure 2-8 Government assistance/support for innovation activities in the last three
years
20 Figure 2-9 Types of government innovation assistance/support schemes received in
the last three years
22 Figure 3-1a Firms which have applied for patents (by sector)
22 Figure 3-1b Firms which have applied for patents(by innovativeness of firm)
23 Figure 3-2a Location of patent applications (by sector)
23 Figure 3-2b Location of patent applications (by innovativeness of firm)
24 Figure 3-3a Firms which own valid patents (by sector)
24 Figure 3-3b Firms which own valid patents (by innovativeness of firm)
24 Figure 3-4a Location of patents granted (by sector)
25 Figure 3-4b Location of patents granted (by innovativeness of firm)
25 Figure 3-5a Mean number of patents applied for and granted (by sector)
26 Figure 3-5b Mean number of patents applied for and granted (by innovativeness of
firm)
26 Figure 3-6a Ownership of non-patent IP (by sector)
26 Figure 3-6b Ownership of non-patent IP (by innovativeness of firm)
26 Figure 3-7a Types of non-patent IP owned (by sector)
27 Figure 3-7b Types of non-patent IP owned (by innovativeness of firm)
28 Figure 4-1a Usage of patents (by sector)
29 Figure 4-1b Usage of patents (by innovativeness of firm)
29 Figure 4-2a Revenue from using patents in-house (% of turnover) (by sector)
30 Figure 4-2b Revenue from using patents in-house (% of turnover) (by innovativeness
of firm)
30 Figure 4-3 Revenue from licensing patents to third parties (% of turnover)
34 Figure 4-4a Revenue from licensing out non-patent IP (% of turnover) (by sector)
34 Figure 4-4b Revenue from licensing-out non-patent IP (% of turnover) (by
innovativeness of firm)
36 Figure 5-1a Licensing-in of patents from third parties (by sector)
36 Figure 5-1b Licensing-in of patents from third parties (by innovativeness of firm)
37 Figure 5-2 Revenue from licensed-in patents1 (% of turnover)
38 Figure 5-3 Cost of licensing-in patents1 (% of revenue)
39 Figure 5-4a Licensing-in of non-patent IP (by sector)
40 Figure 5-4b Licensing-in of non-patent IP (by innovativeness of firm)
40 Figure 5-5a Types of non-patent IP licensed-in (by sector)

p_
CONTENT PAGE
v
40 Figure 5-5b Types of non-patent IP licensed-in (by innovativeness of firm)
41 Figure 5-6 Revenue from licensed-in non-patent IP1 (% of turnover)
43 Figure 6-1a Firms which give incentives for generation of patentable inventions
(sector)
43 Figure 6-1b Firms which give incentives for generation of patentable inventions (by
innovativeness of firm)
44 Figure 6-2a Have inventors of patents left firm? (% yes, by sector)
44 Figure 6-2b Have inventors of patents left firm? (% yes, by innovativeness of firm)
44 Figure 6-3 Parties in charge of IP matters
46 Figure 6-4a Relative importance of forms of IP protection in Singapore to enterprise
strategy for capturing commercial value from innovation (Mean score)
47 Figure 6-4b Relative importance of forms of IP protection abroad to enterprise
strategy for capturing commercial value from innovation (Mean score)
48 Figure 6-5 Effectiveness of IP strategies used as mechanisms to protect the
competitive advantage of enterprise’s innovation (% of firms rating IP strategy as
effective)
49 Figure 7-1 IP environment of Singapore
50 Figure 7-2 Use of IP facilitation services
50 Figure 7-3 Type of Singapore-based IP service providers used
51 Figure 7-4 Type of foreign-based IP service providers used
51 Figure 7-5 Usage of Singapore-based IP service providers
52 Figure 7-6 Satisfaction with Singapore-based IP services providers (Mean score by
users of service)
54 Figure 7-7 Action taken in IP disputes in the last three years
54 Figure 7-8 Ease of resolution of IP disputes in the last three years(Mean score by
those who have taken action)
61 Figure A-1 Innovating firms
62 Figure A-2 Product innovators
62 Figure A-3 Process innovators
63 Figure A-4 Firms which have applied for patents
63 Figure A-5 Firms which own valid patents
64 Figure A-6 Ownership of non-patent IP
64 Figure A-7 Licensing-in of patents from third parties
65 Figure A-8 Licensing-in of non-patent IP

p_
CONTENT PAGE
vi
LIST OF TABLES
4 Table 1-1 Profile of Returns
6 Table 1-2 Number of Employees in Respondent Firms
6 Table 1-3 Total Revenue in Respondent Firms
7 Table 1-4 Proportion of Total Revenues from Exports in Respondent Firms
7 Table 1-5a Respondent Firms by Ownership Status
8 Table 1-5b Ownership Status of Firms: Comparison between IP Survey Respondents
and A*STAR Survey Respondents
8 Table 1-6 Respondent Firms by Age
10 Table 2-1 Summary table of indicators of innovativeness
11 Table 2-2 Innovating firms: Singapore vs selected European countries
13 Table 2-3a Innovation activities undertaken in Singapore (by sector)
14 Table 2-3b Innovation activities undertaken overseas (by sector)
14 Table 2-4a Innovation activities undertaken in Singapore (by nationality of firm)
14 Table 2-4b Innovation activities undertaken overseas (by nationality of firm)
17 Table 2-5a Innovation collaboration partners in Singapore
18 Table 2-5b Innovation collaboration partners overseas
19 Table 2-6 Problems encountered in innovation
21 Table 3-1 Summary table of indicators of IP creation and usage
31 Table 4-1a Economic importance of patents (by sector)
31 Table 4-1b Economic importance of patents (by innovativeness of firm)
32 Table 4-2 Parties to whom patents are licensed-out
33 Table 4-3a Reasons for not utilizing patents (by sector)
33 Table 4-3b Reasons for not utilizing patents (by innovativeness of firm)
35 Table 4-4a Economic importance of non-patent IP (by sector)
35 Table 4-4b Economic importance of non-patent IP (by innovativeness of firm)
36 Table 5-1 Parties from whom firms license-in patents
38 Table 5-2a Economic importance of licensed-in patents (by sector)
39 Table 5-2b Economic importance of licensed-in patents (by innovativeness of firm)
41 Table 5-3a Economic importance of licensed-in non-patent IP (by sector)
41 Table 5-3b Economic Importance of non-Patent IP (by innovativeness of firm)
45 Table 6-1 Stage of IP strategy adoption
53 Table 7-1a Frequency with which firms have experienced IP infringement by external
parties in Singapore the last 3 years
53 Table 7-1b Frequency with which firms have experienced IP infringement by external
parties overseas the last 3 years

p_
CONTENT PAGE
vii
66 Table B-1 Comparison of sectoral distribution of sample and population
67 Table B-2 Comparison of weighted and unweighted data for selected indicators
68 Table C-1 Standard Error Bound Estimates of the Percentage of Innovating Firms
69 Table C-2 Standard Error Bound Estimates of the Percentage of Firms who Own
Patents
70 Table C-3 Standard Error Bound Estimates of the Mean Cumulative No. of Patents
Granted (In effect, not expired)
71 Table D-1 Indicators of Innovation and Patent Ownership
72 Table D-2 Indicators of Innovation, Patent Ownership and Stage of IP Strategy
73 Table E-1 Indicators of IP creation and usage in innovating vs non innovating firms
74 Table F-1 Regression with Dependent : Share of Revenue from new products/
services introduced in last 3 years
75 Table F-2 Regression with Dependent : Average growth in sales in last 3 fiscal years
p_2
INTRODUCTION
In September 2002 the Singapore government announced a strategy to develop the country into a
global IP hub. The strategy recognizes the critical importance of effective IP creation, management
and exploitation in the future competitiveness of the Singapore economy. A vibrant IP hub facilitates
effective commercialization of intellectual capital, and provides a key business infrastructure upon
which high value-adding knowledge-based industries can be built.
This project is a first attempt to estimate the economic significance of innovation and IP in Singapore
and to identify the factors that facilitate or hinder IP-related industry growth. IP is examined in three
stages –
(i) Innovation (the process of embodying knowledge and technology which might be protected
by IP in products or services)
(ii) IP Creation (the process of formalizing IP as enterprise assets);
(iii) IP Usage and Exploitation (the process using IP assets to create value);
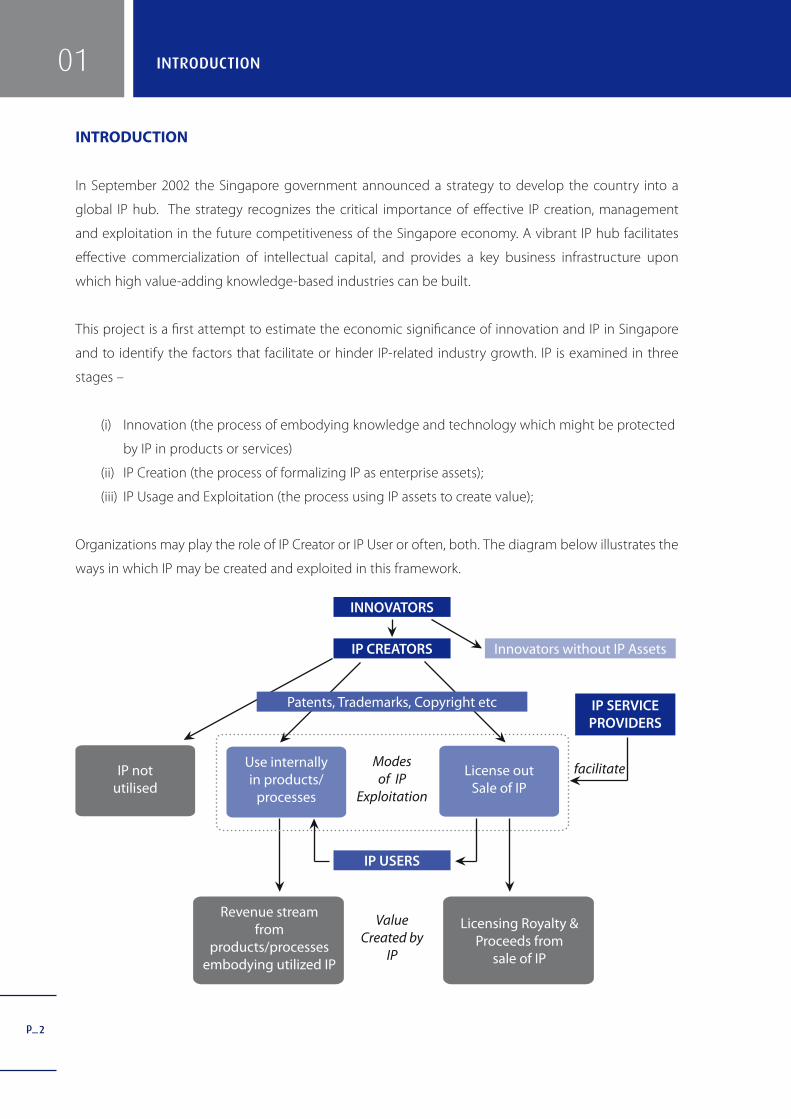
Organizations may play the role of IP Creator or IP User or often, both. The diagram below illustrates the
ways in which IP may be created and exploited in this framework.
����������
�����������
��������
����������������������������
�����������������������������������
���������������
����������������������
�����������
������������
���������������
��
�������������������
���������������������������������������
���������������������������������
����������
��������������������
����������������������������������
����������
01 INTRODUCTION

p_3
SURVEY OBJECTIVES
The IP Academy (IPA) commissioned the project team from the NUS Entrepreneurship Centre to conduct
a survey of innovation and IP creation and usage among the high-tech manufacturing and service
sectors in Singapore.
The objectives of the survey include:
• Identify the emerging structure, performance and development constraints of several key IP-
based industries in Singapore.
• Develop relevant indicators and baseline estimates on IP creation and usage for Singapore to
facilitate benchmarking in leading advanced countries in the world.
SURVEY OVERVIEW
Sampling Frame
The research framework for this study positions innovation activities as the basis for IP creation, as
presented in the framework diagram. Given the focus of the study on IP creation and usage, the base
for our survey should be firms with innovating activities, rather than all firms in Singapore. As such,
the most appropriate sampling frame should comprise firms involved in any form of innovation effort,
including firms that have successfully innovated new products/ services as well as those that might still
be in the early stages of innovation efforts.
One such existing database is the register of firms maintained by the Agency for Science, Technology and
Research (A*STAR) for the annual National Survey of R&D in Singapore. The A*STAR register comprises
organizations in Singapore that are known to perform R&D. The register is updated annually, using
information from the previous year R&D Survey as well as through a Preliminary Survey of organizations
that are potentially performing R&D but are not on the register. The list of organizations included in the
Preliminary Survey is compiled annually from various sources and includes all firms that are in receipt of
government R&D grants.
The sampling frame used in this study predominantly comprised firms in the A*STAR register for 2004,
augmented with other known knowledge-intensive firms and firms from knowledge-intensive industries,
including several university spin-offs1 . Following the A*STAR register, the full spectrum of manufacturing
and professional services were included, regardless of whether they fall within the classification of
1 We are grateful to A*STAR for their assistance in making the registry of organisations performing R&D available to us.
01INTRODUCTION

p_4
knowledge-based industries as defined by Toh et al (2002)2. This provides a better picture of IP creation
and usage in Singapore, given that such activities occur in all sectors of the economy, not merely those
typically considered to be IP-intensive.
Due to this focus on firms with innovation efforts, the sampling frame corresponds largely to knowledge
intensive sectors such as high-tech manufacturing and knowledge-based services such as ICT services.
Thus, the results in this report are not meant to be generalized to all firms in Singapore. However, the
results do give a reasonable depiction of the IP creation and usage amongst firms which are already
involved in some form of innovation efforts.
Survey Methodology
The survey instrument used is a structured self-administered questionnaire (see Annex G) designed
by the NEC research team. Data was collected by postal survey, with questionnaires being sent out
to approximately 2,500 firms. Telephone follow up was conducted to clarify doubtful or missing
information. Fieldwork was launched in April 2005 and closed in end July 2005 with a total of 188
responses achieved.
SAMPLE DEMOGRAPHICS
Table 1-1 Profile of Returns
SSIC 200 CLASSIFICATION OF INDUSTRIES (IN ACCORDANCE WITH A*STAR’S NATIONAL R&D SURVEY) INDUSTRY
SAMPLE POPULATION
NO. OF RETURNS
% DISTRIBUTION
% DISTRIBUTION
Manufacturing 94 50.0 49.3
242, 3211 Biomedical 4 2.1 2.6
31 Electronics 26 13.8 13.0
21092, 23, 24 (excluding 242), 25213, 261, 2699
Chemicals 6 3.2 7.6
25191-93, 25199, 25211, 25214-16, 25218-19, 2522, 28113, 2813, 2891-94, 28951, 28959, 28993, 28995, 28997-99, 29 (excluding 29231-32, 293-294), 301-303, 32 (excluding 32202)
Precision Engineering
36 19.1 15.4
(continued on next page)
2 See Toh, M.H., Tang H.C. and Choo, A. (2002). “Mapping Singapore’s knowledge-based economy”, Economic Survey of Singapore – Third Quarter 2002, Singapore: Ministry of Trade
and Industry. Toh et al provided a classification of knowledge-based and non-knowledge-based industries which itself was based on that used by the OECD.
01 INTRODUCTION

p_5
(continued from previous page)
25121, 29231-32, 2926, 331-334, 339
Transport Engineering
8 4.3 3.6
15-16, 17-20, 22, 21 (excluding 21092), 2511, 25122, 25194, 25212, 25217, 2691-95, 26991-95, 27, 28111-12, 28114, 28119, 2812, 28952, 28991-92, 28994, 28996, 293-4, 304-5, 309, 32202, 34-35
GeneralManufacturing
14 7.4 7.1
Services 94 50.0 50.7
731 R&D 20 10.6 7.1
64, 72 Post & Telecoms, IT
related34 18.1 17.0
65-66, 74 Financial and business
services18 9.6 8.6
45, 50-51, 55, 60-63, 70-71, 732, 75, 80, 85, 90-93, 95, 99 Other services 22 11.7 18.0
Total 188 100.0 100.0
Table 1-1 shows the distribution of returns and population distribution (where the population distribution
is assumed to follow the distribution of firms in the respondents to the A*STAR survey). A total of
188 returns were obtained: 94 from the manufacturing sector; and 94 were from the service sector.
In comparison with the population, the precision engineering industry and R&D services have been
slightly oversampled, and the chemicals industry and other services have been undersampled.
In order to ensure representativeness of the sample, weights are derived from a comparison of the
sample sectoral distribution with the sectoral distribution of the population of respondents to the
A*STAR survey. However, given the very close correspondence between the sample and population
distribution, there is little difference between weighted and unweighted results (see Annex B for a
comparison of weighted and unweighted results). As such, the unweighted results have been given in
this report unless otherwise stated.
01INTRODUCTION

p_6
Table 1-2 Number of Employees in Respondent Firms
NUMBER OF EMPLOYEESMANUFACTURING SERVICES ALL SECTORS
% OF FIRMS
Small firm 36.6 82.8 59.7
<10 8.6 39.8 24.2
10-49 28.0 43.0 35.5
Medium-sized firm 33.4 14.0 23.7
50-99 18.3 11.8 15.1
100-199 15.1 2.2 8.6
Large firm 30.2 3.2 16.7
200-499 15.1 2.2 8.6
500-999 9.7 0.0 4.8
1000+ 5.4 1.1 3.2
Total 100.0 100.0 100.0
Note: Numbers may not sum to exactly 100% due to rounding errors
More than half of responding firms have fewer than 50 employees (i.e. are small firms). Almost one-
quarter of firms are medium-sized, having between 50 to 199 employees, and 16.7% of firms are large
firms, having 200 or more employees.
Our sample has a high proportion of small firms within the service sector, whereas the manufacturing
sector has a more even distribution between small, medium and large firms
Table 1-3 Total Revenue in Respondent Firms
TOTAL REVENUE FOR LATEST FISCAL YEAR
MANUFACTURING SERVICES ALL SECTORS
% OF FIRMS
<$5 million 23.3 75.0 48.9
$5-$9.9 million 14.4 11.4 12.9
$10-$49.9 million 25.6 9.1 17.4
$50-$99.9 million 8.9 1.1 5.1
$100-$499 million 17.8 0.0 9.0
$500-$999 million 3.3 1.1 2.2
$1-$4.9 billion 4.4 1.1 2.8
$5 billion and above 2.2 1.1 1.7
Total 100.0 100.0 100.0
01 INTRODUCTION

p_7
Almost half of the responding firms have less than S$5 million in total revenue for their latest fiscal year.
The majority of these are service firms. Conversely, most of the 6.7% of responding firms with sales
revenues of at least $500 million are manufacturing firms.
Table 1-4 Proportion of Total Revenues from Exports in Respondent Firms
% OF TOTAL REVENUE FROM EXPORTS
MANUFACTURING SERVICES ALL SECTORS
% OF FIRMS
0% 12.4 27.5 19.5
>0-10% 11.2 18.8 14.8
>10-40% 12.4 13.8 13.0
>40-70% 20.2 17.5 18.9
>70% 43.8 22.5 33.7
Total 100.0 100.0 100.0
Almost one-fifth of the responding firms do not export at all, most of which are service firms. One-third
of responding firms have extensive export operations, with exports contributing more than 70% of their
total revenue.
Table 1-5a Respondent Firms by Ownership Status
MANUFACTURING SERVICES ALL SECTORS
% OF FIRMS
Foreign firm 30.9 32.2 31.5
Wholly foreign-owned firm 27.7 16.1 21.9
50% or less locally owned firm 3.2 16.1 9.6
Local firm 69.2 67.7 68.4
More than 50% locally owned firm 16.0 16.1 16.0
Wholly locally-owned firm 53.2 51.6 52.4
of which subsidiary or affiliate of a larger enterprise group
20.0 16.7 18.4
Total 100.0 100.0 100.0
Just over half of the responding firms are wholly locally-owned firms, of which 18.4% are subsidiaries
or affiliates of a larger enterprise group. About one-third are foreign-owned firms (i.e. are 50% or less
locally-owned, including those that are wholly foreign-owned). Both the manufacturing and service
sectors have equivalent proportions of foreign vs local ownership.
01INTRODUCTION

p_8
Of the foreign-owned firms, over one-quarter are US-owned, about one-third are Japanese-owned,
about one-fifth each are European-owned and almost one-fifth are owned by other Asian countries.
Table 1-5b Ownership Status of Firms: Comparison between IP Survey Respondents and A*STAR
Survey Respondents
FOREIGN FIRM LOCAL FIRM TOTAL
% OF FIRMS
IP Survey Respondents
Manufacturing 30.9 69.2 100
Services 32.2 67.7 100
All sectors 31.5 68.4 100
A*STAR Survey Respondents
Manufacturing 46.4 53.6 100
Services 29.1 70.9 100
All sectors 37.7 62.3 100
A comparison between the respondents to our survey and that of the A*STAR National R&D survey
reveals that for our survey, local firms are over-represented in the manufacturing sector, whereas they
are under-represented in the services sector. Overall, local firms are over-represented in our sample. It
should be noted however, that our definition of local and foreign firms differs slightly from that used
by A*STAR. A*STAR classifies firms as local if they are at least 30% locally owned, whereas we have only
classified firms as local if they are at least 50% locally owned.
Table 1-6 Respondent Firms by Age
MANUFACTURING SERVICES ALL SECTORS
% OF FIRMS
5 years or less 17.0 47.8 32.3
6-10 years 14.9 26.1 20.4
11-20 years 31.9 19.6 25.8
21-30 years 22.3 5.4 14.0
>30 years 13.8 1.1 7.5
Total 100.0 100.0 100.0
The service firms in our sample tend to be quite young. About one-third of the responding firms have
been established five years ago or less, and most of these are from the services sector. By contrast, the
01 INTRODUCTION

p_9
01INTRODUCTION
bulk of manufacturing respondents have been in operation for more than ten years.
STATISTICAL ERROR BOUNDS
Statistical estimates from survey data are subject to sampling error. This report shows the actual sample
statistics based on the collected data. As an indicator of the reliability of these sample estimates,
Annex C reports the 95% population and strata sampling error bounds for both proportion and mean
estimates.

p_10
INNOVATION
In this section, we present the summary findings on the innovation activities of firms, through which IP
assets may be created. We follow the convention of the European Community’s Community Innovation
Survey by defining “innovating firms” as those that have introduced a new product or service
onto the market for their own enterprise within the last 3 fiscal years. This measure of innovation
regards the innovation process as one that adds value to organizations through deployment and
commercialization.
Table 2-1 Summary table of indicators of innovativeness
MANUFACTURING SERVICES ALL SECTORS
% OF FIRMS
% of innovating firms 75.5 74.2 74.9
% of product innovators 67.0 66.7 66.8
%of process innovators 47.3 35.5 41.4
MANUFACTURING SERVICES ALL SECTORS
%
% of turnover from new/significantly improved products introduced duing last 3 years*
45.0 20.4 38.9
% of volume/output from new/significantly improved processes introduced during last 3 years*
8.0 24.2 12.0
Spending on innovation activities as % of sales*
6.3 1.2 4.8
In-house R&D spending as % of sales* 4.7 0.7 3.7
*Data has been weighted by sales size
INNOVATIVENESS OF FIRMS
Figure 2-1 Innovating firms (Firms that have introduced new product or process innovation to the
market in last 3 years)
all sectors
services
manufacturing
% OF FIRMS
74.9
74.2
75.5
02 INNOVATION

p_11
The survey reveals that three-quarters of firms are innovating firms, that is, they have introduced a
product or process innovation onto the market for their own enterprise within the last three years. The
remaining quarter of the firms may have engaged in innovating activities but have not yet launched
actual products/processes in the marketplace at the time of the survey3. Alternatively, they may be
developing innovations for other enterprises. Manufacturing and services are equally innovative as
measured by the proportion of innovating firms in each sector.
Figure 2-2 Product and process innovators
In general, product innovation in firms is more common than process innovation. 66.8% of firms have
introduced product innovations for their own enterprise in the last three years, whilst only 41.4% have
introduced process innovations in this period.
Although product innovation is equally common in the manufacturing and service sectors, process
innovation is more common in the manufacturing sector, due to the precision engineering industries.
Table 2-2 Innovating firms: Singapore vs selected European countries
MANUFACTURING SERVICES ALL SECTORS
% OF FIRMS
Singapore 75.5 74.2 74.9
Denmark 95.3 93.3 94.0
Finland 88.6 93.5 90.3
Netherlands 93.7 92.9 93.3
Norway 91.5 88.9 89.5
Sweden 84.0 85.5 84.7
Note: Data for Europe is for 2001, and only includes firms with innovation activity Source for European data: Calculated from Innovation in Europe: Results for the EU, Iceland and Norway, 2004 edition. Downloaded from ftp://ftp.cordis.lu/pub/innovation-smes/docs/results_from_cis3_for_eu_iceland_norway.pdf
all sectors
% OF FIRMS
41.466.8
services35.5
66.7
manufacturing47.3
67.0
ProcessInnovator
Product Innovator
3 This is indicated by the fact that a number of firms who have not introduced product or process innovations within the last three years reported that they nevertheless do engage
in innovation activities
02INNOVATION
p_12
In order to provide an international benchmark of Singapore firms’ innovation efforts, the proportion of
innovating firms in Singapore is compared with those of Denmark, Finland, Netherlands, Norway and
Sweden. Being small advanced countries, they provide a more realistic comparison for Singapore, itself
a small economy, than larger countries such as the United States and Japan. Furthermore, data is readily
available for these countries from the results of the Third Community Innovation Survey (CIS3), conducted
by the European Union in 2001.
The results show that the proportion of innovators in Singapore is relatively low. While 74.9% of firms
surveyed in Singapore have introduced a product/process innovation within the last three years, the
equivalent proportion ranged from 94.0% in Denmark to 84.7% in Sweden in 2001. This in fact may
be an overestimate of Singapore’s international standing, given that CIS3 covers all manufacturing and
service sectors, including low-tech, medium-tech and high-tech industries, while the Singapore survey
mainly covered the high-tech, knowledge-intensive sectors. Thus the innovation figures for Singapore
may be higher in comparison to Europe than they would otherwise be.
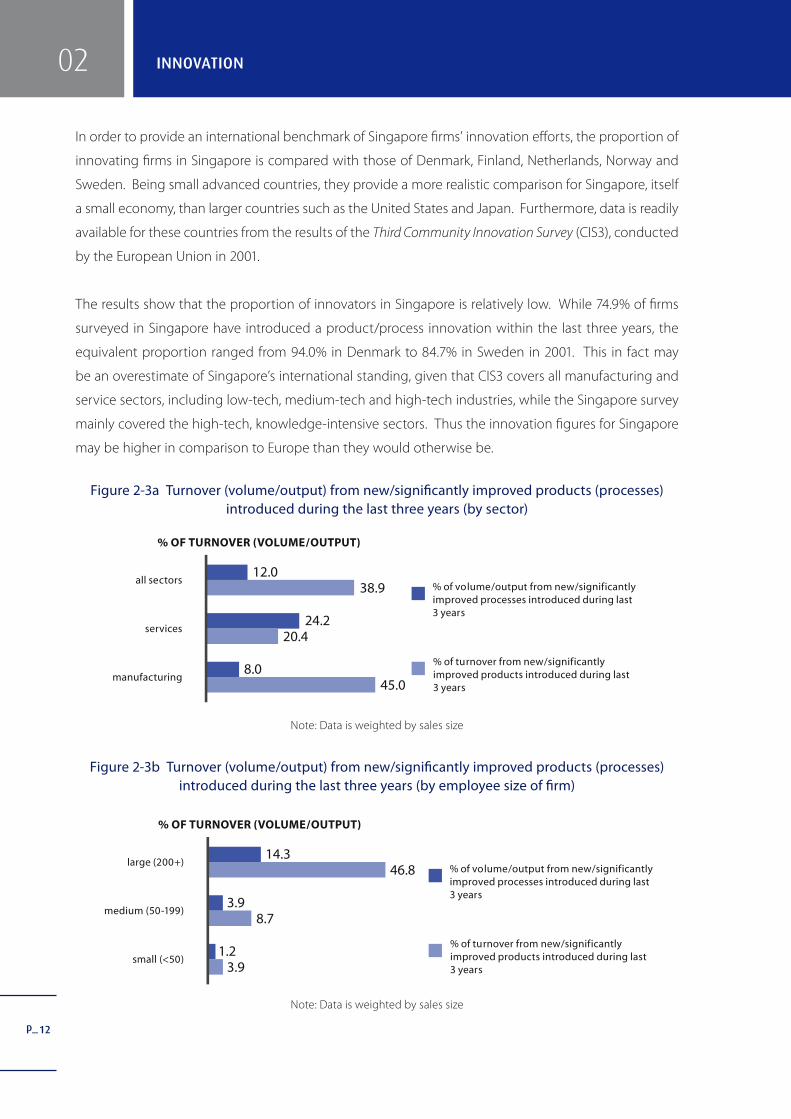
Figure 2-3a Turnover (volume/output) from new/significantly improved products (processes) introduced during the last three years (by sector)
Note: Data is weighted by sales size
Figure 2-3b Turnover (volume/output) from new/significantly improved products (processes) introduced during the last three years (by employee size of firm)
Note: Data is weighted by sales size
% OF TURNOVER (VOLUME/OUTPUT)
% of volume/output from new/significantlyimproved processes introduced during last 3 years
% of turnover from new/significantlyimproved products introduced during last 3 years
large (200+)14.3
46.8
medium (50-199)3.9
8.7
small (<50)1.2
3.9
02 INNOVATION
% OF TURNOVER (VOLUME/OUTPUT)
% of volume/output from new/significantlyimproved processes introduced during last 3 years
% of turnover from new/significantlyimproved products introduced during last 3 years
all sectors12.0
38.9
services24.2
20.4
manufacturing8.0
45.0

p_
03
13
Successful innovation does not end with the creation of a new product or process; it must also be
deployed. Commercialization is one means of deploying a product innovation. One measure, then, of
the success of an innovating firm is the proportion of turnover that comes from innovative products.
The survey revealed that on average, 38.9% of firms’ turnover comes from product innovations that
have been introduced in the last three years. Manufacturing firms and large firms have the highest
share of their turnover coming from product innovations.
Another means of deploying innovation is to incorporate process innovations into firms’ manufacturing
or service processes. This can be measured by the proportion of production volume/service output
that uses new/improved processes. On average, 12.0% of firms’ volume/output is generated from new/
improved processes introduced over the last three years. Service firms have a higher share of output
generated by process innovations than do manufacturing firms.
Regression analysis shows that commercialization of innovations is positively influenced by having
knowledge workers in the firm (proxied by the percentage of employees who are university graduates),
ownership of patents, and firms’ R&D intensity (See Annex F, Table F-1). Thus, undertaking innovation
activities such as R&D does boost implementing of innovations into the market. This in turn spurs
company growth, as average sales growth is found to be positively influenced by the share of turnover
contributed by new products/services introduced by firms (see Annex F, Table F-2)
INNOVATION ACTIVITIES AND EXPENDITURE
Table 2-3a Innovation activities undertaken in Singapore (by sector)
MANUFACTURING SERVICES ALL SECTORS
% OF INNOVATING FIRMS
Intramural R & D 66.7 66.7 66.7
Extramural R & D 21.7 14.9 18.4
Acquisition of machinery & equipment 68.1 36.4 52.6
Acquisition of other external knowledge 38.2 27.7 33.1
Training 72.1 63.6 67.9
Market introduction of innovations 53.6 56.7 55.1
Design, other preparations for production/deliveries
75.4 56.1 65.9
02INNOVATION

p_14
Table 2-3b Innovation activities undertaken overseas (by sector)
MANUFACTURING SERVICES ALL SECTORS
% OF INNOVATING FIRMS
Intramural R & D 11.6 15.2 13.3
Extramural R & D 10.1 6.0 8.1
Acquisition of machinery & equipment 23.2 12.1 17.8
Acquisition of other external knowledge 22.1 9.2 15.8
Training 22.1 18.2 20.1
Market introduction of innovations 20.3 31.3 25.7
Design, other preparations for production/deliveries
21.7 13.6 17.8
Table 2-4a Innovation activities undertaken in Singapore (by nationality of firm)
FOREIGN LOCAL
% OF INNOVATING FIRMS
Intramural R & D 54.5 72.5
Extramural R & D 13.3 20.9
Acquisition of machinery & equipment 56.8 50.5
Acquisition of other external knowledge 25.0 37.1
Training 75.0 64.4
Market introduction of innovations 48.9 58.2
Design, other preparations for production/deliveries
65.9 65.9
Table 2-4b Innovation activities undertaken overseas (by nationality of firm)
FOREIGN LOCAL
% OF INNOVATING FIRMS
Intramural R & D 20.5 9.9
Extramural R & D 13.3 5.5
Acquisition of machinery & equipment 18.2 17.6
Acquisition of other external knowledge 20.5 13.5
Training 29.5 15.6
Market introduction of innovations 24.4 26.4
Design, other preparations for production/deliveries
22.7 15.4
02 INNOVATION

p_15
0302INNOVATION
Training, in-house R&D and other preparations for implementing innovations are the most commonly
conducted innovation activities in Singapore, each undertaken by about two-thirds of innovating
firms. Firms still largely favor conducting their own R&D; outsourcing of R&D is relatively uncommon.
Innovation through the acquisition of existing machinery, equipment and knowledge is more common
amongst the manufacturing sector than the service sector.
The importance of proximity for innovation activities is reflected in the fact that a much lower proportion
of firms conduct their innovation overseas. Not surprisingly however, foreign-owned firms more
commonly conduct their innovation activities overseas than local firms. The most common innovation
activities conducted outside Singapore are market introduction of innovations and training.
Figure 2-4a Innovation intensity (% of sales spent on innovation activities) and R&D intensity (% of sales spent on R&D activities) (by sector)
Note: Data is weighted by sales size
Figure 2-4b Innovation intensity (% of sales spent on innovation activities) and R&D intensity
(% of sales spent on R&D activities) (by employee size of firm)
Note: Data is weighted by sales size
One measure of the intensity of firms’ innovation efforts is the percentage of their sales revenue that they
spend on such activities. On average, firms spend 4.8% of their sales revenue on innovation activities.
Most of this (3.7% of sales revenue) is spent on in-house R&D. Manufacturing firms and large firms are
the most innovation- and R&D-intensive, spending a larger proportion of their turnover on innovation
activities, including R&D, as compared to services firms and small and medium sized firms.
% OF SALES
In-house R&D spending as % of sales
Spending on innnovationactivities as % of sales
all sectors3.7
4.8
services0.7
1.2
manufacturing4.7
6.3
% OF SALES
In-house R&D spending as % of sales
Spending on innnovationactivities as % of sales
4.25.7
1.81.9
1.61.3
large (200+)
medium (50-199)
small (<50)

p_16
INNOVATION CO-OPERATION
Figure 2-5 Collaboration on innovation activities in the last three years
Interactions between actors in an innovation system are key determinants of its performance, for only
when these linkages are adequately developed will innovations be effectively developed and deployed
(Wong 2003). The firms have some way to go in this respect, with less than half of the innovating firms
having co-operation arrangements on innovation activities with other enterprises/institutions during
the last three fiscal years.
Figure 2-6 Parties involved in developing product innovations introduced within the last three fiscal years
02 INNOVATION
% OF INNOVATING FIRMS
all sectors
services
manufacturing
42.6
41.4
43.7
% OF PRODUCT INNOVATORS
All sectors
Services
Manufacturing
5.34.9
mainly other enterprisesor institutions
own enterprise in co-operationwith other enterprises/institutions
mainly own enterpriseor enterprise group
5.6
16.725.4
8.1
78.069.7
86.3

p_
Figure 2-7 Parties involved in developing process innovations introduced within the last three fiscal years
The limited degree of collaboration between firms is further reflected by the fact that most firms report
that the innovations introduced within the last three years have been developed on their own, or
within their enterprise group. More than three quarters of product and process innovators are in this
category. For product innovators however, the service sector appears to be more interdependent in
this respect, with one-quarter of its firms having introduced innovations which were jointly developed
in co-operation with other parties.
Table 2-5a Innovation collaboration partners in Singapore
MANUFACTURING SERVICES ALL SECTORS
% OF INNOVATING FIRMS WITH INNOVATING COLLABORATION
Universities or other HEIs 58.1 46.4 52.5
Government/public research institutes 51.6 50.0 50.8
Suppliers of equipment, materials, components or software
41.9 21.4 32.2
Clients or customers 22.6 32.1 27.1
Other enterprises within enterprise group 29.0 3.6 16.9
Commercial laboratories/R&D enterprises 25.8 7.1 16.9
Consultants 12.9 17.9 15.3
Competitors and other firms from same industry
9.7 3.6 6.8
Where innovation collaboration does take place, our survey shows that linkages between innovating firms
and the public sector are relatively well-developed. The most common co-operation arrangements for
firms are with local HEIs (higher education institutions) and the government/public research institutes/
centers (PRICs). This is encouraging, because the public R&D and tertiary education sectors are a main 17
0302INNOVATION
% OF PROCESS INNOVATORS
All sectors
Services
Manufacturing
5.29.1
mainly other enterprisesor institutions
own enterprise in co-operationwith other enterprises/institutions
mainly own enterpriseor enterprise group
2.3
18.818.2
19.3
76.072.7
78.4

p_18
source of basic research, and adequate linkages ensure that firms in the private sector have access to the
research conducted in universities/PRICs so they can apply it in developing their own innovations. It
also reflects that the measures implemented by A*STAR (Agency for Science, Technology and Research)
to increase collaborations between the sectors have had some success.
Amongst the private sector collaboration partners, the most commonly cited are suppliers and
customers. Collaboration with suppliers is relatively more common with manufacturing firms, while
collaboration with clients or customers is more common with service firms. These results are to be
expected, given the strong relationship that has developed in the manufacturing sector between MNC
buyers and local suppliers. In contrast, the service firms largely incorporate the knowledge-intensive
business services which support innovation in their clients and therefore require a higher level of co-
operation with them.
Table 2-5b Innovation collaboration partners overseas
MANUFACTURING SERVICES ALL SECTORS
% OF INNOVATING FIRMS WITH INNOVATION COLLABORATION
Suppliers of equipment, materials, components or software
35.5 17.9 27.1
Clients or customers 25.8 14.3 20.3
Other enterprises within enterprise group 22.6 7.1 15.3
Consultants 16.1 14.3 15.3
Commercial laboratories/R&D enterprises 6.5 14.3 10.2
Universities or other HEIs 12.9 7.1 10.2
Competitors and other firms from same industry
9.7 0.0 5.1
Government/public research institutes 6.5 3.6 5.1
Firms’ innovation activities are quite highly internationalized, with more than one-quarter of innovating
firms reporting innovation collaboration with parties overseas. Overseas partners are predominantly
business partners, both suppliers and customers/clients. On average, manufacturing firms appear to
have a higher level of internationalization in their innovation activities, usually having a higher incidence
of collaboration with overseas partners than service firms.
02 INNOVATION

p_19
0302INNOVATION
PROBLEMS AND OBSTACLES IN INNOVATION
Table 2-6 Problems encountered in innovation
MANUFACTURING SERVICES ALL SECTORS
MEAN SCORE
Economic Factors
Lack of appropriate sources of finance 3.39 3.68 3.54
Innovation costs too high 3.35 3.54 3.44
Excessive perceived economic risks 3.11 2.84 2.98
Internal Factors
Lack of qualified personnel 3.13 2.95 3.04
Lack of information on markets 2.87 2.97 2.92
Lack of information on technology 2.86 2.40 2.63
Organization rigidities within the enterprise
2.01 1.86 1.93
Other Factors
Lack of customer responsiveness to new goods or services
3.02 3.00 3.01
Insufficient flexibility of regulations or standards
2.48 2.27 2.38
Note: Scale from 0 = not relevant to 5 = extremely important
The main problems faced by firms in undertaking innovation are financial; a lack of adequate financing
and the high cost of innovation are considered to be the most important problems, both in the
manufacturing and the service sector. A lack of qualified personnel and lack of customer responsiveness
to new goods or services are also perceived to be important problems.
Figure 2-8 Government assistance/support for innovation activities in the last three years
% OF INNOVATING FIRMS
all sectors
services
manufacturing
44.3
47.8
40.8
p_20
Given that obtaining adequate financing is the biggest hurdle for firms’ innovation activities, government
support for innovation is particularly important. Less than half the innovating firms have received
government assistance/support for their innovation activities within the last three years. The sectors
are fairly even matched in this respect, although the service sector has a slight advantage, with 47.8%
of its innovating firms having received some kind government assistance compared to 40.8% in the
manufacturing sector.
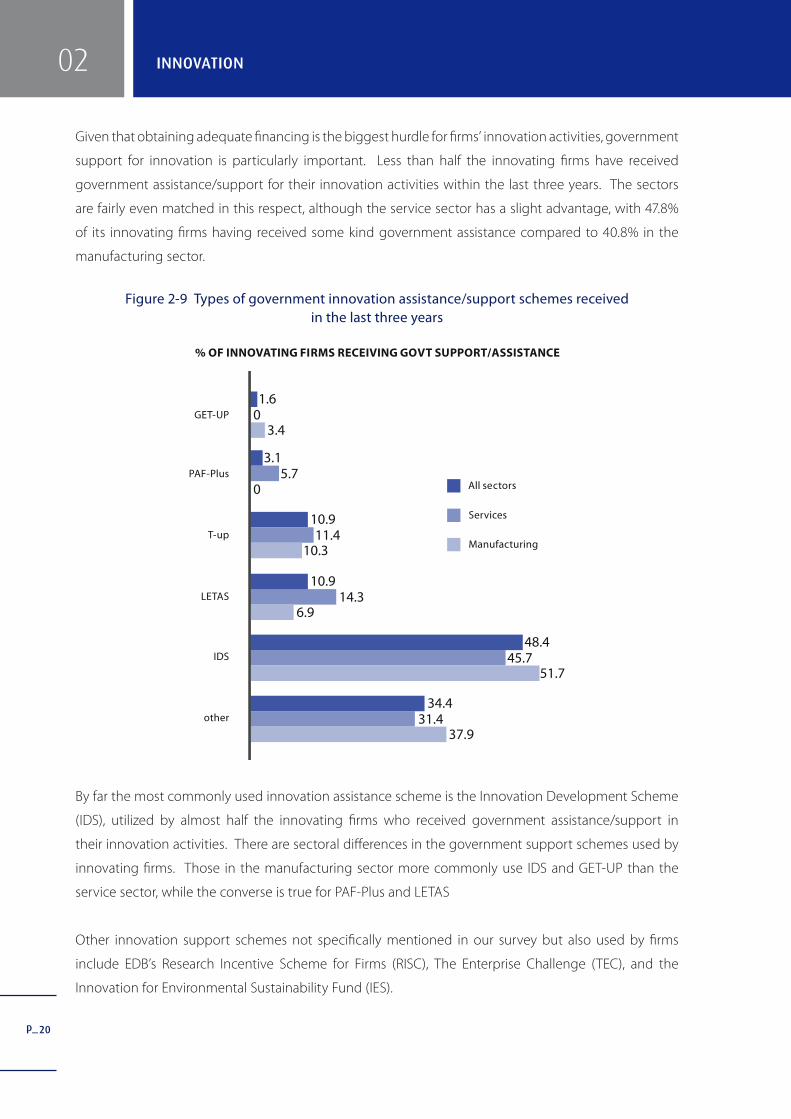
Figure 2-9 Types of government innovation assistance/support schemes received in the last three years
By far the most commonly used innovation assistance scheme is the Innovation Development Scheme
(IDS), utilized by almost half the innovating firms who received government assistance/support in
their innovation activities. There are sectoral differences in the government support schemes used by
innovating firms. Those in the manufacturing sector more commonly use IDS and GET-UP than the
service sector, while the converse is true for PAF-Plus and LETAS
Other innovation support schemes not specifically mentioned in our survey but also used by firms
include EDB’s Research Incentive Scheme for Firms (RISC), The Enterprise Challenge (TEC), and the
Innovation for Environmental Sustainability Fund (IES).
% OF INNOVATING FIRMS RECEIVING GOVT SUPPORT/ASSISTANCE
All sectors
Services
Manufacturing
14.3LETAS
IDS
other
GET-UP
PAF-Plus
T-up
6.9
10.911.4
10.9
10.3
48.445.7
51.7
34.431.4
37.9
3.15.7
1.60
0
3.4
02 INNOVATION

p_21
IP CREATION
In this section, the creation of IP assets is analyzed, focusing on patents. A patent is a property right in
the commercial use of a device and grants its holder legal ownership of a novel, nontrivial and useful
invention. This study emphasizes patent IP as patents represent innovations with high commercialization
value. An invention must demonstrate potential commercial value before a patent is granted. The table
below summarizes the findings on the indicators of IP creation and usage that will be discussed in
greater detail in this section and in section 4.
Table 3-1 Summary table of indicators of IP creation and usage
NON-INNOVATING
INNOVATING ALL FIRMS
% OF FIRMS
Firms which own IP 46.8 64.3 59.9
Firms which have applied for patents 21.3 43.2 37.6
Firms which own valid patents 12.8 33.1 28.0
Firms which own non-patent IP 40.4 51.4 48.7
Firms which license-in patent 10.6 20.1 17.7
Firms which license-in non-patent IP 12.8 16.5 15.6
NON-INNOVATING
INNOVATING ALL FIRMS
%
Contribution of patents utilized in-house (% of turnover in latest fiscal year covered by patent applications or patents granted)*
0.00 2.77 1.87
Contribution of patents licensed out (% of revenue in latest fiscal year contributed by royalties generated by licensing out to 3rd parties)*
0.00 0.02 0.01
Contribution of licensing non-patent IP to 3rd parties (% of revenue contributed by royalties)*
0.01 1.39 1.05
Contribution of products/services that use licensed-in patents (% of turnover in latest fiscal year)*
0.00 0.63 0.51
Contribution of products/services that use licensed-in non-patent IP (% of turnover in latest fiscal year)*
0.09 0.20 0.18
*Data is weighted by sales size Note 1: Innovating firms are those that have introduced a new product or service for their own enterprise within the last
03IP CREATION
p_22
three fiscal years. Thus it should not be assumed that non-innovating firms do not engage in innovation. On the contrary, they may also be actively undertaking in innovation activities and creating IP. Note 2: This report does not comprehensively test for statistical difference between estimates for non-innovating versus innovating firms. As an illustrative example, tests for difference in proportions reported in this table are presented in Annex E Table E-1.
PATENTS
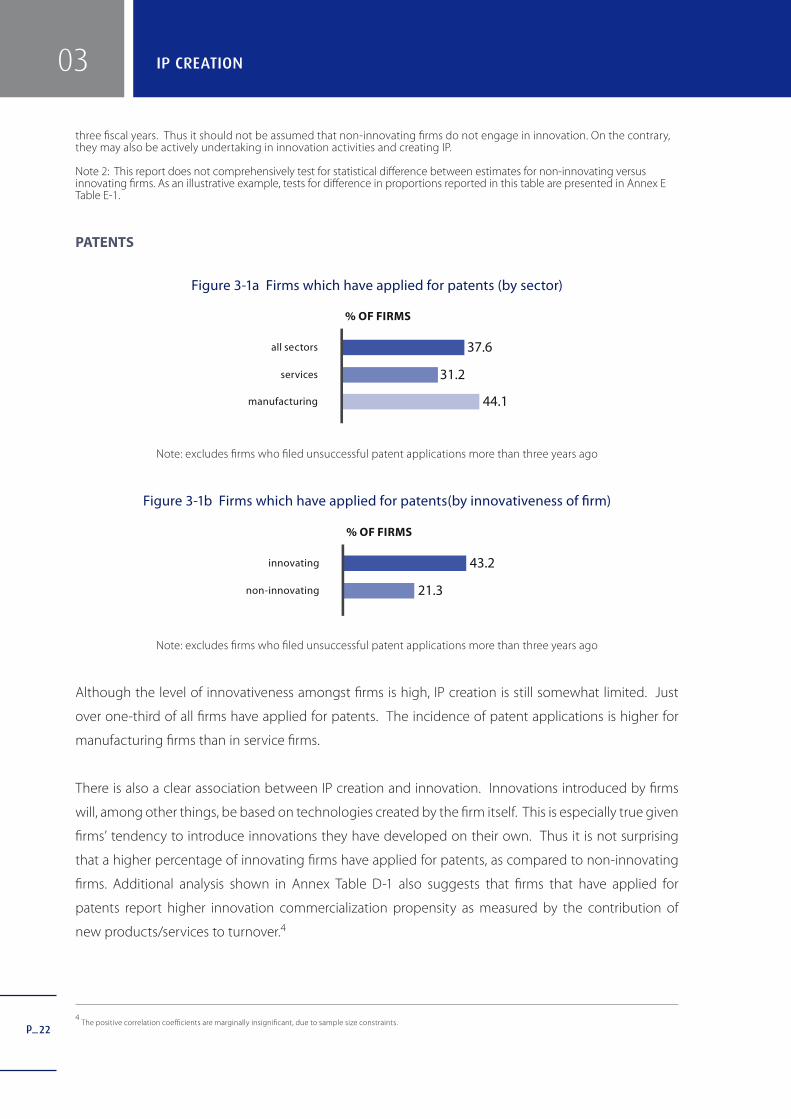
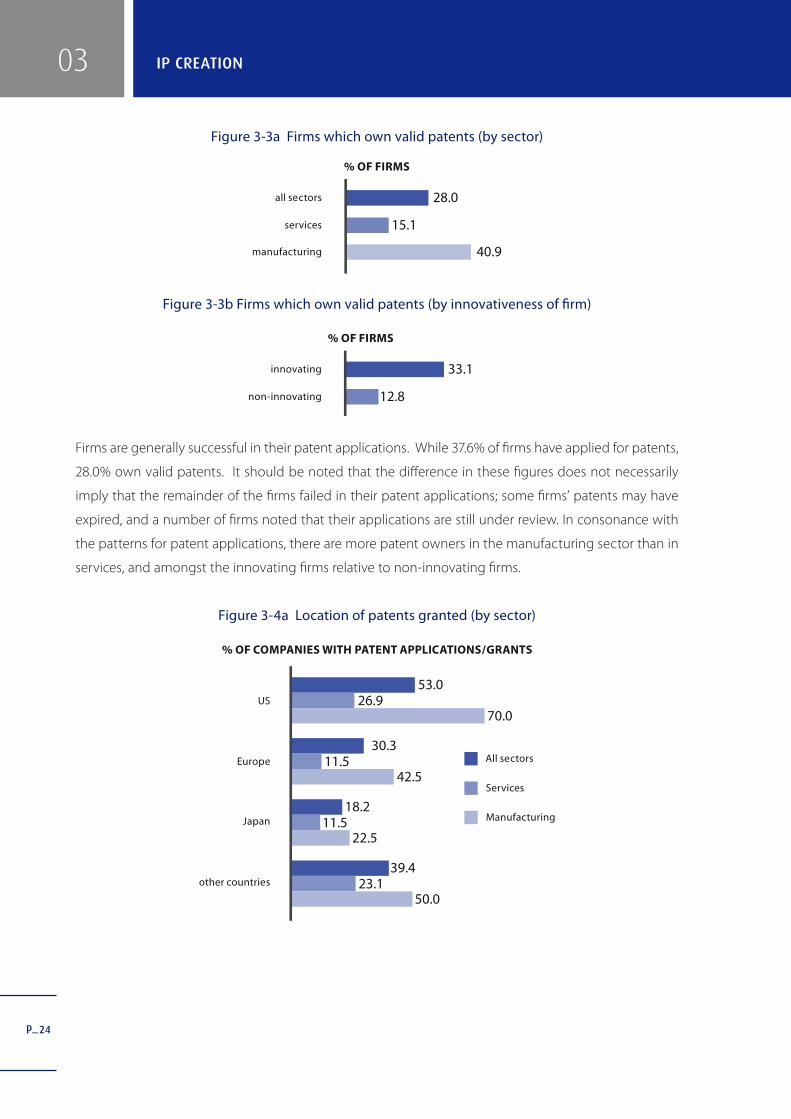
Figure 3-1a Firms which have applied for patents (by sector)
Note: excludes firms who filed unsuccessful patent applications more than three years ago
Figure 3-1b Firms which have applied for patents(by innovativeness of firm)
Note: excludes firms who filed unsuccessful patent applications more than three years ago
Although the level of innovativeness amongst firms is high, IP creation is still somewhat limited. Just
over one-third of all firms have applied for patents. The incidence of patent applications is higher for
manufacturing firms than in service firms.
There is also a clear association between IP creation and innovation. Innovations introduced by firms
will, among other things, be based on technologies created by the firm itself. This is especially true given
firms’ tendency to introduce innovations they have developed on their own. Thus it is not surprising
that a higher percentage of innovating firms have applied for patents, as compared to non-innovating
firms. Additional analysis shown in Annex Table D-1 also suggests that firms that have applied for
patents report higher innovation commercialization propensity as measured by the contribution of
new products/services to turnover.4
% OF FIRMS
all sectors
services
manufacturing
37.6
31.2
44.1
% OF FIRMS
innovating
non-innovating
43.2
21.3
4 The positive correlation coefficients are marginally insignificant, due to sample size constraints.
03 IP CREATION

p_23
Figure 3-2a Location of patent applications (by sector)
Figure 3-2b Location of patent applications (by innovativeness of firm)
Patent applications by the firms have a broad international scope. Although the US as the world’s largest
technology market is naturally the most frequently cited location, firms also commonly file patent
applications in Europe, Japan and other countries, with the ‘other’ countries including regional countries
such as Singapore, Hong Kong, Taiwan, China and Korea.
While a greater proportion of non-innovating firms have applied for patents in the US than innovating
firms, the reverse is true for all the other regions. However, it should be noted that the patents held by
non-innovating firms, who have not introduced a new product/service in the last three years, are on
average likely to be older than innovating firms. As such, their patent applications would on average
also have been filed earlier, and so this geographical pattern could be the result of the differing age of
patents rather than a reflection of innovating firms having a more global outlook in protecting their IP
through patenting.
% OF FIRMS WITH PATENT APPLICATIONS/GRANTS
Innovating
Non-innovating
61.050.0
54.240.0
45.830.0
81.490.0
other countries
Europe
Japan
US
03IP CREATION
����������������������������������������������
�����������
��������
�������������
�����������������������
������
�����
��
����
��������
����
��������
����
��������
����
p_24
Figure 3-3a Firms which own valid patents (by sector)
Figure 3-3b Firms which own valid patents (by innovativeness of firm)
Firms are generally successful in their patent applications. While 37.6% of firms have applied for patents,
28.0% own valid patents. It should be noted that the difference in these figures does not necessarily
imply that the remainder of the firms failed in their patent applications; some firms’ patents may have
expired, and a number of firms noted that their applications are still under review. In consonance with
the patterns for patent applications, there are more patent owners in the manufacturing sector than in
services, and amongst the innovating firms relative to non-innovating firms.
Figure 3-4a Location of patents granted (by sector)
% OF FIRMS
all sectors
services
manufacturing
28.0
15.1
40.9
% OF FIRMS
innovating
non-innovating
33.1
12.8
% OF COMPANIES WITH PATENT APPLICATIONS/GRANTS
All sectors
Services
Manufacturing
53.026.9
other countries
Europe
Japan
US
70.0
30.311.5
42.5
18.211.5
22.5
39.423.1
50.0
03 IP CREATION

p_25
Figure 3-4b Location of patents granted (by innovativeness of firm)
The locations of patents held by the firms are fairly well distributed around the world. Innovating
firms are more likely to own patents in countries outside the US than are non-innovating firms. Other
countries where firms own patents include Singapore, China, Hong Kong, Korea, Taiwan.
Figure 3-5a Mean number of patents applied for and granted (by sector)
Note: Excludes two firms with very high patenting activity. Including them would raise the mean number of patent applications to 23.7 for manufacturing and 16.3 for all sectors. Similarly, the mean number of patents granted over the last 3 years would increase to 16.9 for manufacturing and 11.0 for all sectors, and the mean cumulative number of patents granted (still in effect, not expired) would increase to 154.9 for manufacturing and 92.3 for all sectors. There would be no change to the means for the service sector.
% OF FIRMS WITH PATENT APPLICATIONS/GRANTS
Innovating
Non-innovating
53.650.0
33.910.0
19.610.0
41.130.0
other countries
Europe
Japan
US
NO. OF PATENTS
All sectors
Services
Manufacturing
11.23.8
total no. of patentsgranted over
last 3 years
total no. of patentapplications over
last 3 years
total cumulative no.of patents granted
(in effect, not expired) 16.7
5.82.5
8.3
9.45.9
12.1
03IP CREATION
p_26
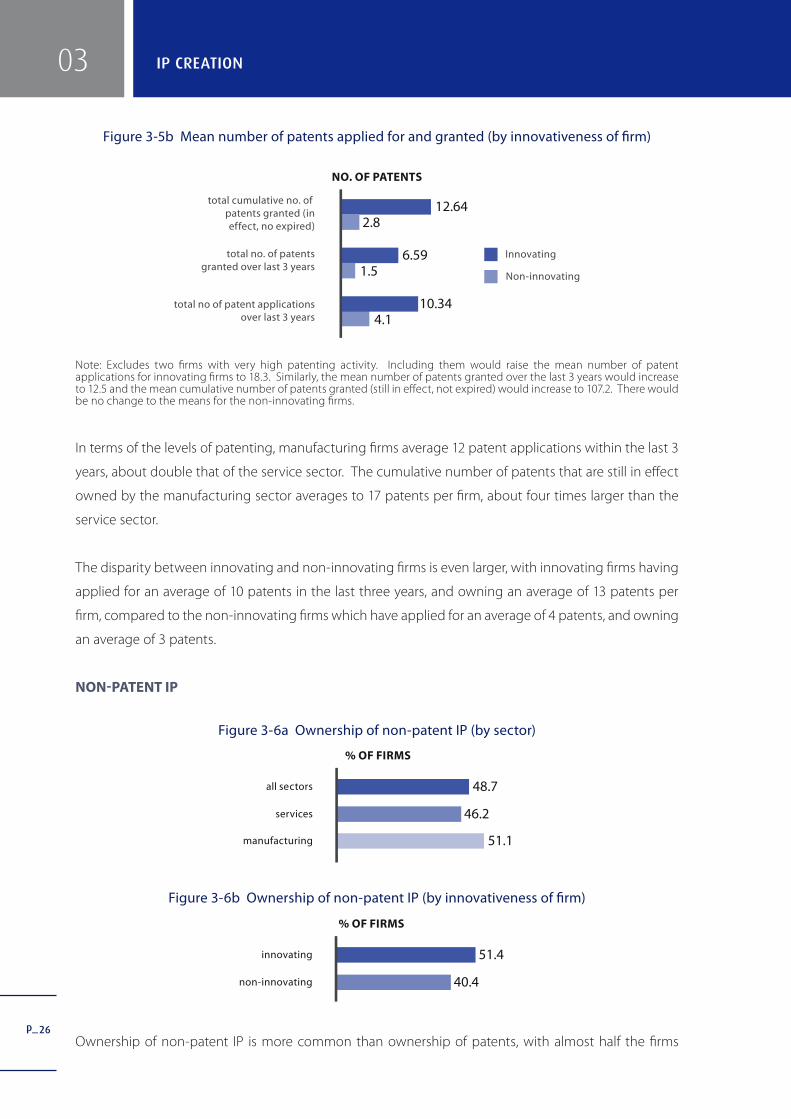
Figure 3-5b Mean number of patents applied for and granted (by innovativeness of firm)
Note: Excludes two firms with very high patenting activity. Including them would raise the mean number of patent applications for innovating firms to 18.3. Similarly, the mean number of patents granted over the last 3 years would increase to 12.5 and the mean cumulative number of patents granted (still in effect, not expired) would increase to 107.2. There would be no change to the means for the non-innovating firms.
In terms of the levels of patenting, manufacturing firms average 12 patent applications within the last 3
years, about double that of the service sector. The cumulative number of patents that are still in effect
owned by the manufacturing sector averages to 17 patents per firm, about four times larger than the
service sector.
The disparity between innovating and non-innovating firms is even larger, with innovating firms having
applied for an average of 10 patents in the last three years, and owning an average of 13 patents per
firm, compared to the non-innovating firms which have applied for an average of 4 patents, and owning
an average of 3 patents.
NON-PATENT IP
Figure 3-6a Ownership of non-patent IP (by sector)
Figure 3-6b Ownership of non-patent IP (by innovativeness of firm)
Ownership of non-patent IP is more common than ownership of patents, with almost half the firms
% OF FIRMS
all sectors
services
manufacturing
48.7
46.2
51.1
% OF FIRMS
innovating
non-innovating
51.4
40.4
03 IP CREATION
��������������
����������
��������������
��������
�������
��������
��������������������������������������������������������������
���������������������������������������������
������������������������������������������������

p_27
owning some form of non-patent IP. The sectors are fairly evenly matched in their incidence of non-
patent IP ownership, although the manufacturing sector does have a slight advantage over services.
Innovating firms are more likely to own non-patent IP than non-innovating firms, but the difference is
not as great as with patent ownership.
Figure 3-7a Types of non-patent IP owned (by sector)
Figure 3-7b Types of non-patent IP owned (by innovativeness of firm)
Trademarks are the most commonly owned form of non-patent IP, followed by copyright and trade
secrets. Sectoral differences are evident in the types of non-patent IP held by firms. Manufacturing
firms more commonly own trademarks and registered design, whereas service firms – largely due to the
IT services industry – more commonly owns copyright (including software).
% OF FIRMS
Innovating
Non-innovating
20.717.0
4.30
23.610.6
104.3
trade secrets
database rights
copyright(including software)
registered design
trademarks35.7
23.4
03IP CREATION
% OF FIRMS
All sectors
Services
Manufacturing
19.819.4trade secrets
database rights
copyright(including software)
registered design
trademarks
20.2
3.24.3
2.1
20.325.8
14.9
8.62.2
14.9
32.626.9
38.3

p_
04 USAGE OF OWN IP
USAGE OF OWN IP
In this section, we examine the extent to which IP assets, focusing on patents, are being commercialized
by firms. Broadly, IP may be commercialized in two ways: used internally to produce products or
services, or licensed out to other organizations for royalty income. Alternatively, IP assets may remain
uncommercialized by the firm if they are not utilized in any form.
USAGE OF PATENTS
In this section, we restrict our discussion to firms’ usage of patents that are still in effect (i.e. they have
not expired).
Figure 4-1a Usage of patents (by sector)
% OF PATENTS
All sectors
Services
Manufacturing
22.430.3not utilized
sold
used in-house andlicensed out
licensed-out only
used in-house only
20.4
0.000.0
33.533.0
33.6
0.70.0
0.9
43.336.7
45.0
0.0
28
p_29
04USAGE OF OWN IP
Figure 4-1b Usage of patents (by innovativeness of firm)
Firms appear to generate patents predominantly for their own use, rather than for generating income
through licensing-out or selling to others. About three-quarters of patents owned are used wholly
in-house, or simultaneously used in-house and licensed-out. It is rare for firms to solely license their
patents, and none of the firms reported selling their patents to others.
Manufacturing firms are more likely to use their patents wholly in-house. Almost half the patents
owned by the manufacturing sector are kept for this purpose, compared to 36.7% of patents belonging
to service firms. Service firms on the other hand are more likely to leave their patents unutilized (30.3%
of their patents are not utilized, compared to 20.4% of manufacturing patents).
Non-innovating firms also have a very high percentage (75%) of patents that are not being utilized.
Thus not only are non-innovating firms less likely to create IP (see Section 3), they are also less likely to
take advantage of the IP they do create.
Figure 4-2a Revenue from using patents in-house (% of turnover) (by sector)
% OF PATENTS
Innovating
Non-innovating
19.575.0
0.0
0.0
0.0
0.0
35.4
0.8
44.325.0
not utilized
sold
used in-house andlicensed out
licensed-out only
used in-house only
% OF FIRMS WITH VALID PATENTS
All sectors
Services
Manufacturing
30.038.5> 0%
0%
don’t know
27.0
20.023.1
18.9
50.0038.5
54.1

p_30
Figure 4-2b Revenue from using patents in-house (% of turnover) (by innovativeness of firm)
Figure 4-3 Revenue from licensing patents to third parties (% of turnover)
Note: No data is available for non-innovating firms, as none of the non-innovating firms in our sample reported
licensing-out their patents
It appears from our survey that firms have limited systems for tracking the results of their patent usage.
Half of the firms who own patents do not know how much of their revenue is generated by using
them in-house, and one-fifth do not know how much is generated by licensing them out. This is more
apparent with the manufacturing firms, although this could also be due to the fact that manufacturing
MNCs operating in Singapore sometimes have their IP managed by their head offices overseas. As
such, the data on the commercial results of their patent usage is not available to the Singapore office.
The lack of tracking is also more evident amongst non-innovating firms, two-thirds of whom reported
not knowing how much revenue is generated by the use of products/processes developed from their
patents.
% OF FIRMS WITH VALID PATENTS
All sectors
Services
Manufacturing
7.914.2> 0%
0%
don’t know
5.4
70.671.4
70.3
21.614.3
24.3
% OF FIRMS WITH VALID PATENTS
Innovating
Non-innovating
32.60.0
33.321.7
45.766.7
> 0%
0%
don’t know
04 USAGE OF OWN IP

p_31
Table 4-1a Economic importance of patents (by sector)
MANUFACTURING SERVICES ALL SECTORS
All firms
Contribution of patents utilized in-house (% of turnover in latest fiscal year covered by patent applications or patents granted)
4.13 0.20 1.87
Contribution of patents licensed out (% of revenue in latest fiscal year contributed by royalties generated by licensing out to 3rd parties)
0.01 0.02 0.01
Patent-owning firms only
Contribution of patents utilized in-house (% of turnover in latest fiscal year covered by patent applications or patents granted)
12.37 41.35 12.94
Contribution of patents licensed out (% of revenue in latest fiscal year contributed by royalties generated by licensing out to 3rd parties)
0.01 1.98 0.04
Note: Data is weighted by sales size
Table 4-1b Economic importance of patents (by innovativeness of firm)
NON -INNOVATING
INNOVATING
All firms
Contribution of patents utilized in-house (% of turnover in latest fiscal year covered by patent applications or patents granted)
0.00 2.77
Contribution of patents licensed out (% of revenue in latest fiscal year contributed by royalties generated by licensing out to 3rd parties)
0.00 0.02
Patent-owning firms only
Contribution of patents utilized in-house (% of turnover in latest fiscal year covered by patent applications or patents granted)
0.00 12.98
Contribution of patents licensed out (% of revenue in latest fiscal year contributed by royalties generated by licensing out to 3rd parties)
0.00 0.04
Note: Data is weighted by sales size
On average, technologies from patents used in firm products/processes contribute 1.9% of firms’
turnover (12.9% for firms which own valid patents). Thus in-house use of patents is a much greater
source of revenue contribution than licensing-out of patents, which only contributes 0.01% of firm’s
04USAGE OF OWN IP

p_32
turnover (or 0.04% for firms which own valid patents). Although patent ownership is more common in
the manufacturing sector than the service sector, patent-owning service firms are much more successful
in commercializing their patents than those in manufacturing, earning a higher average percentage of
revenue from using their patents in-house (41.4% for services vs 12.4% for manufacturing) and from
licensing them to third parties (2.0% for services vs 0.01% for manufacturing).
Additionally, it was found revenues generated by using patents in-house correlates with the degree
of innovation commercialization. None of the non-innovating firms reported earning revenue from
utilizing their patents. Furthermore, Annex Table D-1 shows that firms with higher rates of innovation
commercialization earn larger shares of turnover from patent applications or patents granted.5
Table 4-2 Parties to whom patents are licensed-out
MANUFACTURING SERVICES ALL SECTORS
% OF FIRMS WITH PATENTS LICENSED-OUT
Foreign-based firms in the same line of business 75.0 50.0 68.8
Foreign-based firms not in the same line of business
33.3 50.0 37.5
Parent firm or affiliated firm within the enterprise group
33.3 25.0 31.3
Sg-based firms not in the same line of business 8.3 25.0 12.5
Sg-based firms in the same line of business as the enterprises
0.0 0.0 0.0
Other firms 0.0 0.0 0.0
When firms do license-out their patents, they most commonly do so to foreign-based firms operating
in the same line of business. The manufacturing sector focuses its licensing-out operations heavily
on these firms, whereas those in the service sector tend to license-out to foreign firms regardless of
whether they are in the same line of business or not. It thus appears that manufacturing sector patents
are more specialized, whereas service sectors patents are more general and able to be applied to other
industries.
5 The positive correlation coefficients are marginally insignificant, due to sample size constraints.
04 USAGE OF OWN IP

p_33
Table 4-3a Reasons for not utilizing patents (by sector)
MANUFACTURING SERVICES ALL SECTORS
% OF FIRMS WITH NON-UTILIZING PATENTS
Technology no longer aligned with firm strategy 42.1 16.7 36.0
Other reason 36.8 33.3 36.0
Technology considered too risky to be successfully commercialized
26.3 0.0 20.0
Technology not prioritized internally 10.5 33.3 16.0
Firm lacks resources to utilize the patent(s) 10.5 33.3 16.0
Cannot find suitable partner or recipient to utilize patent
10.5 16.7 12.0
Market for technology does not meet firm’s financial criteria
5.3 0.0 4.0
Table 4-3b Reasons for not utilizing patents (by innovativeness of firm)
NON -INNOVATING
INNOVATING
% OF FIRMS WITH NON-UTILIZING PATENTS
Technology no longer aligned with firm strategy 0.0 40.9
Other reason 66.7 31.8
Technology not prioritized internally 0.0 18.2
Firm lacks resources to utilize the patent(s) 0.0 18.2
Technology considered too risky to be successfully commercialized
33.3 18.2
Cannot find suitable partner or recipient to utilize patent 33.3 9.1
Market for technology does not meet firm’s financial criteria 0.0 4.5
A number of firms reported that they own patents that are in effect but are not being commercialized.
Because the development of novel innovations carries risks and uncertainties, firms might, at some
point, strategically decide to define certain technologies as being non-significant for their current
competitive position. Such non-core technologies are not directly linked to the firm’s core business or
are not utilized in current or future products. Another possible reason for non-utilization is defensive
patenting, in which a firm files for a technology that it has no intention of using merely to prevent a
competitor from filing.
04USAGE OF OWN IP

p_34
In our survey, the most common reason for not utilizing patents is a mismatch between the technology
based on the patent and firm strategy. This appears to be a bigger problem for manufacturing than
for service firms, who most commonly cite resource constraints and a lack of priority placed on the
technology.
For non-innovating firms, non-utilization of patents is often the technology being perceived as too risky
for successful commercialization, or an inability to find suitable partners to use the patent.
Quite a number of firms cited other reasons for not utilizing their patents, including the immaturity of
the technology, the product from the technology being under design/development, and defensive
patenting.
USAGE OF NON-PATENT IP
Figure 4-4a Revenue from licensing out non-patent IP (% of turnover) (by sector)
Figure 4-4b Revenue from licensing-out non-patent IP (% of turnover) (by innovativeness of firm)
% OF FIRMS WHICH OWN NON-PATENT IP
All sectors
Services
Manufacturing
25.935.6> 0%
none
unable to tell
16.4
61.254.8
67.4
12.99.5
16.3
% OF FIRMS WHICH OWN NON-PATENT IP
Innovating
Non-innovating
30.0
72.2
11.2
58.2
11.916.7
> 0%
0%
don’t know
04 USAGE OF OWN IP
p_35
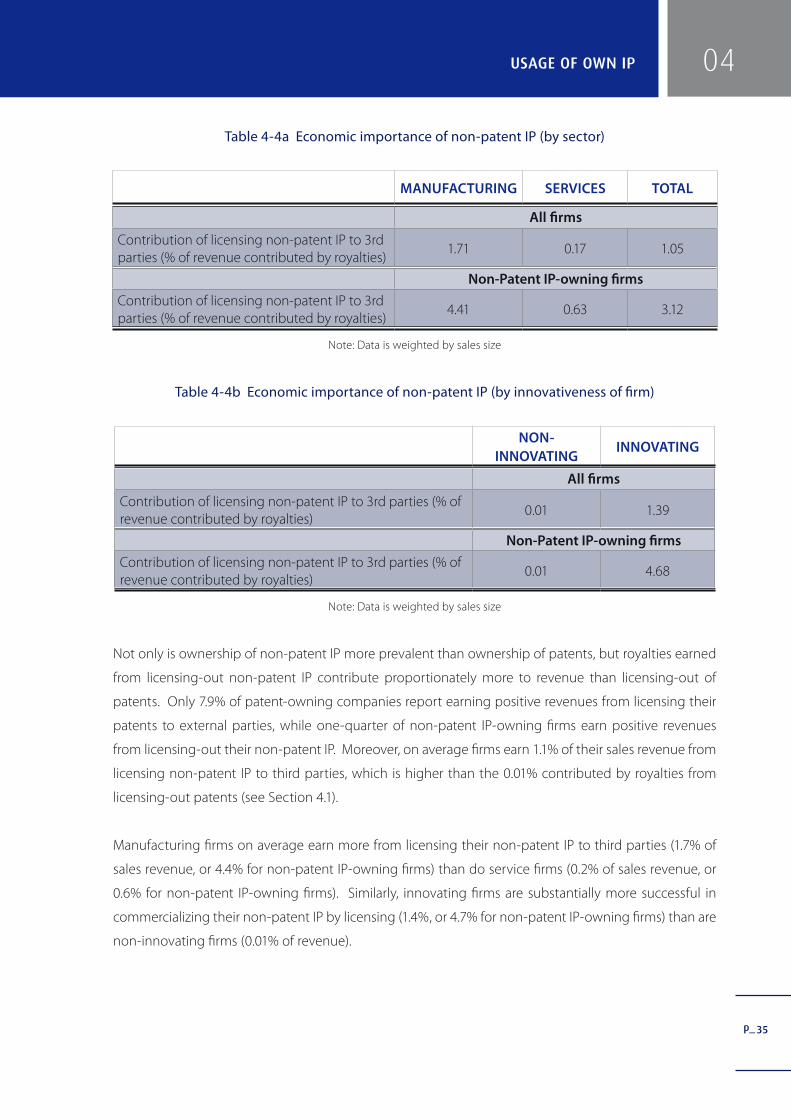
Table 4-4a Economic importance of non-patent IP (by sector)
MANUFACTURING SERVICES TOTAL
All firms
Contribution of licensing non-patent IP to 3rd parties (% of revenue contributed by royalties)
1.71 0.17 1.05
Non-Patent IP-owning firms
Contribution of licensing non-patent IP to 3rd parties (% of revenue contributed by royalties)
4.41 0.63 3.12
Note: Data is weighted by sales size
Table 4-4b Economic importance of non-patent IP (by innovativeness of firm)
NON-INNOVATING
INNOVATING
All firms
Contribution of licensing non-patent IP to 3rd parties (% of revenue contributed by royalties)
0.01 1.39
Non-Patent IP-owning firms
Contribution of licensing non-patent IP to 3rd parties (% of revenue contributed by royalties)
0.01 4.68
Note: Data is weighted by sales size
Not only is ownership of non-patent IP more prevalent than ownership of patents, but royalties earned
from licensing-out non-patent IP contribute proportionately more to revenue than licensing-out of
patents. Only 7.9% of patent-owning companies report earning positive revenues from licensing their
patents to external parties, while one-quarter of non-patent IP-owning firms earn positive revenues
from licensing-out their non-patent IP. Moreover, on average firms earn 1.1% of their sales revenue from
licensing non-patent IP to third parties, which is higher than the 0.01% contributed by royalties from
licensing-out patents (see Section 4.1).
Manufacturing firms on average earn more from licensing their non-patent IP to third parties (1.7% of
sales revenue, or 4.4% for non-patent IP-owning firms) than do service firms (0.2% of sales revenue, or
0.6% for non-patent IP-owning firms). Similarly, innovating firms are substantially more successful in
commercializing their non-patent IP by licensing (1.4%, or 4.7% for non-patent IP-owning firms) than are
non-innovating firms (0.01% of revenue).
04USAGE OF OWN IP

p_36
05 USAGE OF EXTERNAL IP
USAGE OF EXTERNAL IP
Firms might also choose to license-in technologies from other organizations. Technology licensing
activities facilitate technology transfer and knowledge sharing between licensees and licensors, and are
particularly effective for commercializing inventions originating from universities and public research
institutes. Licensing-in of external IP is also an effective method of technology acquisition for firms that
lack resources for in-house research and development functions.
LICENSING-IN OF PATENTS
Figure 5-1a Licensing-in of patents from third parties (by sector)
Figure 5-1b Licensing-in of patents from third parties (by innovativeness of firm)
Only a minority of firms (17.7%) license-in patents from third parties. Licensing-in is more common in
the manufacturing sector than in the services sector. Innovating firms are also more likely to license-
in patents than non-innovating firms, highlighting the importance of diffusion of technology and
knowledge in the innovation process.
Table 5-1 Parties from whom firms license-in patents
MANUFACTURING SERVICES ALL SECTORS
% OF FIRMS WHO LICENSE-IN PATENTS
Foreign-based firms in the same line of business as enterprise
47.4 35.7 42.4
Foreign-based firms not in the same line of business as enterprise
36.8 35.7 36.4
(continued on next page)
% OF FIRMS
all sectors
services
manufacturing
17.7
15.1
20.4
% OF FIRMS
innovating
non-innovating
20.1
10.6

p_37
05USAGE OF EXTERNAL IP
(continued from previous page)
Technology rights granted by external buyers for contract manufacturing or services
15.8 28.6 21.2
Parent firm or affiliated firm within the enterprise group
21.1 14.3 18.2
Foreign universities or public research institutes 10.5 21.4 15.2
Local universities or public research institutes 21.1 7.1 15.2
Singapore-based firms not in the same line of business
5.3 14.3 9.1
Singapore-based firms in the same line of business as the enterprises
0.0 14.3 6.1
Knowledge flows through licensing of patents appears to be stronger between Singapore-based and
foreign-based firms than amongst Singapore-based firms. Just as firms most commonly license-out
their patents to foreign-based firms (see Section 4.1), they also most commonly license-in patents from
foreign-based firms. Technology transfer from universities and PRICs via licensing is relatively rare,
although where it does occur, manufacturing firms are more likely to license-in from local universities/
PRICs, whereas service firms more commonly do so from foreign institutions.
Figure 5-2 Revenue from licensed-in patents1 (% of turnover)
1 Excludes patents licensed-in from parent firm and other affiliates, and technology rights granted by external buyers for
contract manufacturing or services
Firms are more careful to track the revenue generated from using licensed-in patents than they are with
patents they have created themselves. Only about 15% of firms who license in patents report that they
do not know how much this contributes to their revenue (compared to about two-thirds of firms who
license-out their patents, see Section 4.1).
���������������������������������
�����������
��������
�������������
������������
����
�����������
����
��������
����
�������
����

p_38
Figure 5-3 Cost of licensing-in patents1 (% of revenue)
1Excludes patents licensed-in from parent firm and other affiliates, and technology rights granted by
external buyers for contract manufacturing or services
Table 5-2a Economic importance of licensed-in patents (by sector)
MANUFACTURING SERVICES TOTAL
All firms
Contribution of products/services that use licensed-in patents (% of turnover in latest fiscal year)
0.73 0.10 0.51
Cost of licensing-in of patents (% of revenue in latest fiscal year)
1.36 0.08 0.95
Firms who license-in patents only
Contribution of products/services that use licensed-in patents (% of turnover in latest fiscal year)
1.67 11.86 1.78
Cost of licensing-in of patents (% of revenue in latest fiscal year)
2.65 10.20 2.71
Note: Data is weighted by sales size
% OF FIRMS WHO LICENSE-IN PATENTS
All sectors
Services
Manufacturing
55.849.9> 0%
none
do not know
60.0
26.542.9
7.1
15.0
17.6
25.0
05 USAGE OF EXTERNAL IP

p_39
Table 5-2b Economic importance of licensed-in patents (by innovativeness of firm)
NON -INNOVATING
INNOVATING
All firms
Contribution of products/services that use licensed-in patents (% of turnover in latest fiscal year)
0.00 0.63
Cost of licensing-in of patents (% of revenue in latest fiscal year) 0.04 1.15
Firms who license-in patents only
Contribution of products/services that use licensed-in patents (% of turnover in latest fiscal year)
0.00 1.78
Cost of licensing-in of patents (% of revenue in latest fiscal year) 0.89 2.75
Note: Data is weighted by sales size
On average, revenue generated by licensed-in patents contributes a very small proportion of firms’
turnover. Although almost half the firms who license-in patents report earning positive revenues from
them, overall they only contribute 0.5% of turnover (or 1.8% for firms who license-in patents).
Amongst firms which do license patents from third parties, service firms are more heavily dependent on
such external technology. A much greater percentage of their revenue (10.2%) goes to paying royalties
for licensed-in patents, and utilizing the patents contributes a greater share of their revenue (11.9%) than
for the manufacturing sector (2.7% and 1.7% respectively).
Overall, firms are not recovering the cost of their licensed-in patents, spending more on the royalties
(1.2% of turnover, or 2.8% for firms who license-in patents) than these technologies contribute (0.6% of
turnover, or 1.8% for firms who license-in patents). This is particularly evident for non-innovating firms,
none of which reported earning revenue from utilizing their licensed-in patents.
LICENSING-IN OF NON-PATENT IP
Figure 5-4a Licensing-in of non-patent IP (by sector)
% OF FIRMS
all sectors
services
manufacturing
15.6
20.4
10.8
05USAGE OF EXTERNAL IP

p_40
Figure 5-4b Licensing-in of non-patent IP (by innovativeness of firm)
As with licensing-in of patents, licensing-in non-patent IP is only practised by a minority of firms.
However, licensing-in of non-patent IP is more common in the services sector than in manufacturing,
and among innovating firms as compared to non-innovating firms.
Figure 5-5a Types of non-patent IP licensed-in (by sector)
Figure 5-5b Types of non-patent IP licensed-in (by innovativeness of firm)
% OF FIRMS
innovating
non-innovating
16.5
12.8
database rights
copyright(including software)
registered design
trademarks
% OF FIRMS
Innovating
Non-innovating
0.0
8.5
0.0
12.9
2.22.1
2.92.1
05 USAGE OF EXTERNAL IP
����������
�����������
��������
�������������
���������������������
�����������������������������
�����������������
����������
���
��������
���
���
���
���
������
���

p_41
Copyright (including software) is the form of non-patent IP most frequently licensed-in. The higher
propensity for service firms to license-in copyright is largely due to the IT service industry.
Figure 5-6 Revenue from licensed-in non-patent IP1 (% of turnover)
1 Excludes patented IP and copyright on general office productivity such as word processors
Table 5-3a Economic Importance of licensed-in non-patent IP (by sector)
MANUFACTURING SERVICES TOTAL
All firms
Contribution of products/services that use licensed-in non-patent IP (% of turnover in latest fiscal year)
0.16 0.23 0.18
Firms who license-in non-patent IP only
Contribution of products/services that use licensed-in non-patent IP (% of turnover in latest fiscal year)
3.78 15.40 5.30
Note: Data is weighted by sales size
Table 5-3b Economic Importance of non-Patent IP (by innovativeness of firm)
NON-INNOVATING
INNOVATING
All firms
Contribution of products/services that use licensed-in non-patent IP (% of turnover in latest fiscal year)
0.09 0.20
Firms who license-in non-patent IP only
Contribution of products/services that use licensed-in non-patent IP (% of turnover in latest fiscal year)
7.69 5.16
Note: Data is weighted by sales size
% OF FIRMS WHO LICENSE-IN NON-PATENT IP
All sectors
Services
Manufacturing
60.657.9> 0%
none
do not know
66.6
17.921.1
21.1
11.1
21.4
22.2
05USAGE OF EXTERNAL IP

p_42
Licensed-in non-patent IP contributes slightly less to firm turnover than licensed-in patents. Firms report
earning an average of 0.2% of their turnover from non-patent IP, compared to 0.5% from patents
As with licensed-in patents, the service sector is more heavily dependent on external non-patent IP.
Service firms which license-in non-patent IP report that doing so contributes 15.4% of their turnover,
compared to 3.8% for manufacturing firms. Non-innovating firms that have licensed in non-patent IP
report higher share of revenue contributed by such IP (7.7%) compared to firms who have introduced
innovation in the last 3 years (5.2%).
05 USAGE OF EXTERNAL IP

p_43
06INTERNAL ENVIRONMENT FOR IP CREATION AND IP STRATEGY
INTERNAL ENVIRONMENT FOR IP CREATION AND IP STRATEGY
Traditionally, IP has been viewed from a narrow, legalistic point of view. As IP becomes increasingly
recognized as an important source of value creation, the strategic management of IP as a business
asset has taken on new significance for firms. An effective internal environment for IP is one where
there is sound governance of IP issues, incentives for IP creation and exploitation and having a strategic
approach to managing IP assets.
INTERNAL ENVIRONMENT FOR IP CREATION
Figure 6-1a Firms which give incentives for generation of patentable inventions (sector)
Figure 6-1b Firms which give incentives for generation of patentable inventions
(by innovativeness of firm)
Overall, only about one-third of firms provide special incentives to staff who generate patentable
inventions. In this sense, manufacturing firms provide a more conducive environment for IP creation,
with proportionately more manufacturing firms giving incentives to their staff than service firms.
Similarly, innovating firms more commonly have incentive schemes for their staff than non-innovating
firms. Incentives usually take the form of monetary reward, either in terms of cash, profit-sharing or share
options. Some firms also give other forms of recognition such as awards or plaques.
����������
�����������
��������
�������������
����
����
����
����������
����������
��������������
����
����

p_44
Figure 6-2a Have inventors of patents left firm? (% yes, by sector)
Figure 6-2b Have inventors of patents left firm? (% yes, by innovativeness of firm)
Although manufacturing firms are more likely to have incentive schemes for their creation patentable
inventions, they also have a higher turnover of patent inventors. 59.0% of manufacturing firms which
have applied for or own patents report that the inventors of their patents have left the firm, compared
with only 32.1% for service firms. Innovating firms also have a higher turnover of patent inventors than
non-innovating firms.
Figure 6-3 Parties in charge of IP matters
Whether or not firms have specific departments or people in charge of IP matters is one indication of
the importance they place on managing IP and the resources they are able and willing to commit to
it. Almost half the firms have a person in charge of their IP matters, while 18.4% have a department
dedicated to IP matters. Manufacturing firms are more likely to have a person or a department in charge
of IP matters than service firms. This could be partially due to the fact that there is a higher proportion
of medium- and large-sized firms in our sample of the manufacturing sector and so they have more
resources to be able to commit to managing IP.
���������������������������������������������
�����������
��������
�������������
����
����
����
����������
��������������
����
����
���������������������������������������������
����������
���������������������������������������
����������������������������������������
���������������
�����
������������
�����
�����������������
�����
06 INTERNAL ENVIRONMENT FOR IP CREATION AND IP STRATEGY

p_45
Departments in charge of IP matters include legal, intellectual property, and R&D departments, while
people in charge of IP matters include CEOs, technical directors (CTOs and R&D managers), and finance
managers.
IP STRATEGY
Table 6-1 Stage of IP strategy adoption
NEVER CONSIDERED
CONSIDERED & REJECTED
CONSIDERINGPLANS TO
IMPLEMENTIN PLACE TOTAL
PERCENTAGE OF FIRMS
Protecting IP as cost effectively as possible
Manufacturing 29.7 5.5 22.0 8.8 34.1 100.0
Services 27.3 3.4 38.6 10.2 20.5 100.0
All sectors 28.5 4.5 30.2 9.5 27.4 100.0
Creating IP Portfolio to be used to limit competitors commercial activities
Manufacturing 39.6 3.3 22.0 11.0 24.2 100.0
Services 37.5 1.1 31.8 12.5 17.0 100.0
All sectors 38.5 2.2 26.8 11.7 20.7 100.0
Establishing income stream from 3rd party use of IP
Manufacturing 53.3 1.1 24.4 10.0 11.1 100.0
Services 37.5 3.4 33.0 14.8 11.4 100.0
All sectors 45.5 2.2 28.7 12.4 11.2 100.0Pursuing multiple strategy of licensing IP, spinning out new organizations or disposing of to other parties
Manufacturing 57.3 2.2 23.6 9.0 7.9 100.0
Services 56.8 1.1 26.1 10.2 5.7 100.0
All sectors 57.1 1.7 24.9 9.6 6.8 100.0Creating a documented strategy for management of IP
Manufacturing 50.0 1.1 27.3 11.4 10.2 100.0
Services 50.0 4.5 31.8 9.1 4.5 100.0
All sectors 50.0 2.8 29.5 10.2 7.4 100.0Minimizing tax liabilities through appropriate structuring of IP portfolio
Manufacturing 57.5 1.1 25.3 5.7 10.3 100.0
Services 62.5 2.3 26.1 5.7 3.4 100.0
All sectors 60.0 1.7 25.7 5.7 6.9 100.0
Overall, firms’ IP strategy adoption is still in the early stages. Most have not implemented IP strategies,
and very few (7.4%) have a documented strategy for managing their IP. Again, manufacturing firms are
more likely to have implemented the various strategies than service firms.
06INTERNAL ENVIRONMENT FOR IP CREATION AND IP STRATEGY

p_46
In term of IP strategies that have been adopted, firms focus on protecting their IP or extending their IP
to limit their competitors. Less emphasis is given to maximizing the use of their IP, e.g. by establishing
an income stream from third party use of IP or pursuing a multiple strategy of IP exploitation through
licensing, generating spin-offs, or disposing of IP to other parties.
A comprehensive IP strategy enhances the ability of firms to commercialise their IP assets. As seen in
Annex Table D-2, there is positive correlation between the extent of IP strategy implementation and
patent IP commercialization propensity, as measured by the contribution of patent applications and
patents to firms’ turnover6.
Figure 6-4a Relative importance of forms of IP protection in Singapore to enterprise strategy for capturing commercial value from innovation (Mean score)
6 The positive correlation coefficients are marginally insignificant, due to sample size constraints, as only 15 firms had reported the contribution of patents and patent applications
to turnover.
����
�����������
��������
�������������
�����������������
���������
�������������
�����������������
�������
����
��������
������������
��������
����
��������
����
� � � � �
����������������������������������������������
06 INTERNAL ENVIRONMENT FOR IP CREATION AND IP STRATEGY

p_47
Figure 6-4b Relative importance of forms of IP protection abroad to enterprise strategy for capturing commercial value from innovation (Mean score)
Although ownership of non-patent IP is more common than owning patents, firms view patents as the
most important form of IP protection for capturing commercial value from their innovation, both in
Singapore and overseas. Registered designs are considered the least important. There is little difference
between the sectors in how they perceive the importance of the various forms of IP, although the
service sector considers copyright as more important than manufacturing does, probably due to the
influence of the IT services sector.
Patents as a form of protection are viewed as more important outside of Singapore than it is within
Singapore. This might be indicative of the fact that many firms are internationalized and export to
overseas markets. This finding is also consistent with the observation that many firms have filed for
patents overseas, in particular the US.
����
�����������
��������
�������������
�����������������
���������
�������������
�����������������
�������
����
��������
������������
��������
����
��������
����
� � � � �
����������������������������������������������
06INTERNAL ENVIRONMENT FOR IP CREATION AND IP STRATEGY

p_48
Figure 6-5 Effectiveness of IP strategies used as mechanisms to protect the competitive
advantage of enterprise’s innovation (% of firms rating IP strategy as effective)
The ownership and exploitation of IP is perceived to be as relatively less effective than other strategies
for protecting the competitive advantage of firms’ innovations. Overall, firms cite developing superior
know-how as the most effective strategy, followed by creating a lead time advantage in innovations,
superior branding and superior sales or service (64%-70% of firms rated these strategies as effective or
extremely effective). In the manufacturing sector, IP as a form of duplication prevention was rated lower
in effectiveness than superior know and lead time advantage; and was rated as more effective than
secrecy and superior sales and service.
��������������������������������������������������������������������������������������������
����
����
�����������
��������
�������������
��������������������������������
�����������������
��������������������������������
�����������������
���������������
����
���������������������������������
����
��������
���������������������������������������
����
��������
����
��������
����
��������
��������
����
����
����
��������
����
��������������������
����������������������
06 INTERNAL ENVIRONMENT FOR IP CREATION AND IP STRATEGY
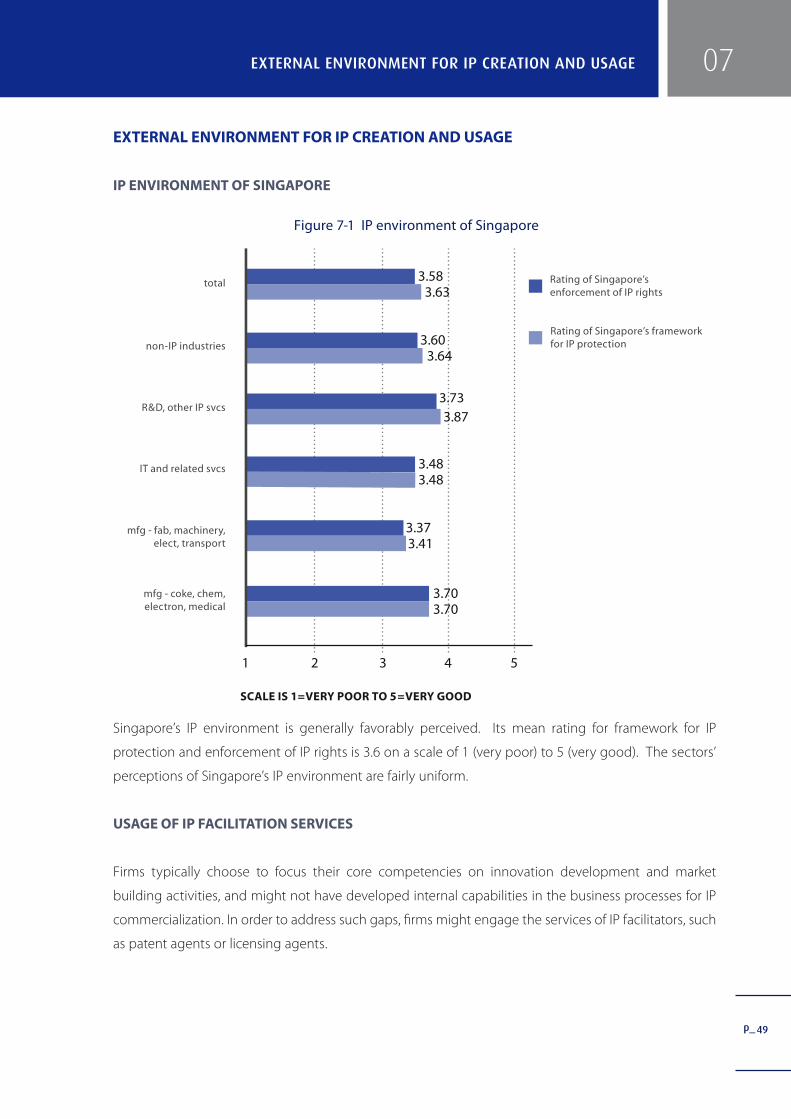
p_49
07EXTERNAL ENVIRONMENT FOR IP CREATION AND USAGE
EXTERNAL ENVIRONMENT FOR IP CREATION AND USAGE
IP ENVIRONMENT OF SINGAPORE
Figure 7-1 IP environment of Singapore
Singapore’s IP environment is generally favorably perceived. Its mean rating for framework for IP
protection and enforcement of IP rights is 3.6 on a scale of 1 (very poor) to 5 (very good). The sectors’
perceptions of Singapore’s IP environment are fairly uniform.
USAGE OF IP FACILITATION SERVICES
Firms typically choose to focus their core competencies on innovation development and market
building activities, and might not have developed internal capabilities in the business processes for IP
commercialization. In order to address such gaps, firms might engage the services of IP facilitators, such
as patent agents or licensing agents.
����
����������������������������������������������
����������������������������������������������������
����
��������
�����������������
�����
������������������
�������������������
�������������������������������������
����������������������������������
����
��������
��������
��������
� � � � �
�����������������������������������

p_50
Figure 7-2 Use of IP facilitation services
At the overall level, there does not seem to be any advantage in proximity for the use of IP-related
service providers. There is an equal propensity for firms to use foreign-based or locally-based IP service
providers. However, at the sectoral level, service firms more commonly use Singapore-based service
providers while manufacturing firms more frequently use foreign-based service providers. This latter
result could also be due to MNC subsidiaries in Singapore having their IP services fulfilled by their head
offices overseas.
Figure 7-3 Type of Singapore-based IP service providers used
����������
�����������������������������������������
������������������������������������
��������
��������
��������
�����������
��������
�������������
������������������������������������������������������
�����������
��������
�������������
��������
�������������
����������������
���������
����������������
����
������
���
��������
����
��������
����
07 EXTERNAL ENVIRONMENT FOR IP CREATION AND USAGE

p_51
Figure 7-4 Type of foreign-based IP service providers used
The most commonly used IP-related services providers are law firms and patent agents, for both in
Singapore and overseas. Amongst those who use Singapore-based service providers, patent agents
are more frequently used by the service sector, whereas law firms are most commonly used by
manufacturing firms.
Figure 7-5 Usage of Singapore-based IP service providers
�����������������������������������������������������������
�����������
��������
�������������
��������
�������������
����������������
���������
����������������
����
����
����
��������
����
��������
����
����
07EXTERNAL ENVIRONMENT FOR IP CREATION AND USAGE
������������������������������������������������������
����������������
����������������
���������
�������������
�������������������
�����������������������������������
����������
�����������������������������������������������
���������������������������������������������
������������
�����������������������������������������
�������������
������
�������
������
��������
�������
��������
������
�������
������
�������

p_52
Singapore-based IP-related service providers are generally used for the initial stages of managing firms’
IP portfolio, such as drafting and filing patents/trademarks applications or negotiation and drafting of
licensing agreements, or for periodic interventions, such as enforcing IP rights. Ongoing services such
as managing royalty and licensing agreements are less frequently used.
It appears that patent agents are not seen to have any advantage over law firms in the drafting and
filing of patents/trademark applications, as law firms are more commonly used for this service; however,
patent agents are more often used for identifying licensing or enforcement opportunities
Figure 7-6 Satisfaction with Singapore-based IP services providers (Mean score by users of service)
Singapore-based IP-related service providers are generally rated as satisfactory by those who use their
services. Satisfaction is higher for those services which are most commonly used, such as drafting and
filing of patents/trademarks applications, and negotiation and drafting of licensing agreements.
IP ENFORCEMENT AND INFRINGEMENT
The acquisition of IP rights is of little economic value to a firm if these rights cannot be enforced
effectively. The credibility of the national IP framework and system depends to a considerable extent
on the enforceability of IP rights conferred thereby. In this section, we examine the effectiveness of IP
����
�����������
��������
�������������
��������
���������������������������������������������
�����������������������������������������
�������������
�������������������
�����������������������������������������������
��������������������������������������������
������������
����
��������
��������
����
������������
��������
����
� � � � �
�������������������������������������������������
07 EXTERNAL ENVIRONMENT FOR IP CREATION AND USAGE

p_53
enforcement mechanisms by analyzing the incidence of IP infringement and the perceived ease of
dispute resolution.
Table 7-1a Frequency with which firms have experienced IP infringement by external parties in Singapore the last 3 years
MANUFACTURING SERVICES ALL SECTORS
MEAN SCORE
Counterfeiting/privacy 1.24 1.16 1.20
Breach of licensing agreement 1.12 1.20 1.16
Violation of patent rights 1.13 1.18 1.16
Violation of trademark rights 1.16 1.14 1.15
Violation of registered design rights 1.11 1.08 1.09
Violation of database rights 1.07 1.02 1.05
Note: Scale is from 1 (never experienced) to 5 (very frequent)
Table 7-1b Frequency with which firms have experienced IP infringement by external parties overseas the last 3 years
MANUFACTURING SERVICES ALL SECTORS
MEAN SCORE
Counterfeiting/privacy 1.38 1.13 1.25
Violation of patent rights 1.24 1.24 1.24
Violation of trademark rights 1.27 1.19 1.23
Breach of licensing agreement 1.13 1.25 1.19
Violation of registered design rights 1.16 1.14 1.15
Violation of database rights 1.07 1.05 1.06
Note: Scale is from 1 (never experienced) to 5 (very frequent)
Relatively few firms have experienced IP infringement, either in Singapore or overseas, although
it is slightly more common for firms to experience infringement overseas than in Singapore. For
the manufacturing sector, counterfeiting and piracy is the most frequently experienced form of IP
infringement, whereas for the service sector it is breaches of licensing agreements.
07EXTERNAL ENVIRONMENT FOR IP CREATION AND USAGE

p_54
07 EXTERNAL ENVIRONMENT FOR IP CREATION AND USAGE
Figure 7-7 Action taken in IP disputes in the last three years
Figure 7-8 Ease of resolution of IP disputes in the last three years (Mean score by those who have taken action)
12.0% of firms have taken some action to enforce their IP rights against infringement and 7.1% have
taken legal action to resolve other disputes about IP rights. Manufacturing firms more commonly take
action to enforce IP rights and resolve disputes than do service firms. On average, disputes were readily
resolved, although firms in the service sector find it more difficult to resolve their disputes than do
manufacturing firms. Not surprisingly, it is generally easier for firms to settle their disputes in Singapore
than when they are overseas.
����������
����������������������������������������������������������
����������������������������������������������������
���
���
����
���
�������
�����������
��������
�������������
���� �����������
��������
�������������
������������������������������������������������������������
���������������
�����������������������������������������������������������
���������������
����������������������������������������������������������������������
���������������������������������������������������������������������
��������
��������
����
����
����
��������
����
����
� � � � �
�������������������������������������������������
p_55
08SUMMARY AND CONCLUSIONS
SUMMARY AND CONCLUSIONS
INNOVATION
The survey revealed that among firms that are engaging in some form of innovation efforts, three-
quarters are classified as innovating firms, i.e. have introduced a product or process innovation for their
own enterprise within the last three years. There is a higher incidence of product innovation compared
to process innovation; two-thirds of firms have introduced a product innovation, while less than half
have introduced a process innovation. The types of innovation activities conducted by firms are diverse
and internationalized, including in-house R&D, acquiring existing innovations from elsewhere, and
training, both in Singapore and overseas. On average, 39% of firm revenue come from new/improved
products.
While a high proportion of firms with innovation activities have successfully innovated new products or
services, many still face barriers that impede innovation efforts. The main problem reported is obtaining
adequate financing to fund the high cost of innovation. A significant proportion of the surveyed
firms (44.3% of innovating firms) have already utilized some public financial assistance schemes for
innovation, especially the IDS scheme, but other schemes such as PAF-Plus and GET-UP, are only used
by a small minority of the surveyed firms. Another problem highlighted by the firms in their innovation
efforts pertains to the perceived lack of customer responsiveness to new goods/services. Firms’
incentives to innovate may be reduced in an environment which is conservative towards the adoption
of innovations.
IP CREATION AND USAGE
Relative to the extent of innovation, the level of IP creation is low. 60% of firms own some form of IP.
About one-third of firms have applied for patents, and only about 28% own patents that are still in
effect (have not expired). Ownership of non-patent IP is more widespread, with almost half the firms
owning some form of non-patent IP. Trademarks are the most commonly owned form of non-patent
IP. The results show that the proportion of firms who own IP is lower than the proportion that have
introduced innovations into the market; a significant proportion of innovating firms do not have IP
protection for their innovation. This may be due to a variety of reasons. Firms may not be aware of
the need for IP protection, or they may be aware of the need but not know how to use IP to protect
their innovations; alternatively firms’ innovations may be so minor or incremental that they cannot be
protected by IP rights.

p_56
Most patents (76.8%) generated are either used solely for developing the firms’ own products and
processes, or simultaneously used in-house and licensed out. It is also worth noting that a surprisingly
large proportion, almost one quarter, of patents are not utilized. The most common reasons for non-
utilization are a mismatch with corporate strategy and riskiness of the technology.
In-house usage of patents contributes more to firms’ revenues (1.9%) than licensing them to third
parties (0.01%). Licensing non-patent IP to third parties also contributes more to revenue (1.1%) than
licensing-out of patents. Innovating firms are more successful in generating revenue from their IP than
non-innovating firms.
Usage of external IP is relatively low. Less than one-third of firms license-in IP from third parties, although
innovating firms show a higher tendency to do so compared to non-innovating firms. Copyright is
the most common form of non-patent IP to be licensed-in. Licensed-in patent IP contributes more
to revenue (0.5%) than licensed-in patents (0.2%). Also, the service sector depends more heavily on
licensed-in IP for their revenue generation than does the manufacturing sector.
One shortcoming that has become apparent from the survey is that firms often do not fully track
their IP usage. Thus they do not know how much the technologies developed from their patents are
contributing to their revenue. Many also do not know how much royalties from licensed-out IP are
contributing to their revenue. A similar situation exists for licensed-in IP. Addressing this situation would
facilitate more accurate assessments of the efficacy of firms’ IP usage in Singapore.
Another shortcoming is that firms do not fully exploit their IP. There is a high percentage of patents
which are not being utilized, particularly for the non-innovating firms. Moreover, firms’ IP strategies
tend to focus on protecting their own IP and expanding their IP portfolio in order to limit competitors’
commercial activities. Relatively few try to maximize revenue generation from IP by pursuing multiple
strategies such as licensing, forming spin-offs and selling to third parties. Broadening their perspective
of IP exploitation would allow firms to derive more commercial benefit from their IP.
Consistent with the relatively low levels of IP creation and usage, it is observed that IP is generally not
accorded high strategic priority in firms. Overall, firms regard IP ownership and usage as being relatively
less effective as a strategy for protecting the competitive advantage of their innovations. Strategies
such as establishing lead time, superior know-how, branding and sales are rated as being more effective
than IP.
08 SUMMARY AND CONCLUSIONS

p_57
A related issue is that firms are generally in the very early stage of IP strategy adoption. Most firms have
not implemented IP strategies, and very few have a documented strategy for managing their IP. There is
positive correlation between the extent of IP strategy implementation and patent IP commercialization
propensity. This suggests that the lack of mature IP strategies is one factor hindering firms from
systematically using and exploiting their IP.
SINGAPORE’S IP ENVIRONMENT
Singapore’s IP environment is generally favorably perceived, both in terms of its framework for IP
protection and its enforcement of IP rights. This is reflected in firms’ experiences. Relatively few firms
have experienced violation of IP rights in Singapore, finding that infringement from overseas in more
common. Where firms’ IP rights are violated in Singapore, resolution is fairly smooth.
There is scope for further development of the IP service provider industry in Singapore. Singapore-
based IP service providers are generally rated as satisfactory. Thus, while they have not received low
ratings, neither are they rated very highly. Moreover, there is high proportion of firms that use foreign-
based service providers rather than those that are locally based. Given that IP service providers play an
important role in assisting firms’ management of IP, further development of this industry may facilitate
firms’ exploitation of their IP.
Although firms report that IP rights are adequately protected and enforced in Singapore, they do face
problems protecting their IP overseas. Firms more frequently experience infringement of their IP rights
overseas than in Singapore, and resolution of these disputes is more difficult.
POLICY IMPLICATIONS
Based on the survey findings presented, several broad policy implications can be derived. These may be
further refined and developed in more detail after seeking feedback on the study’s findings from both
policy makers and industry.
a) A review of existing government schemes would help to surface the reasons for the disparity in
the utilization of different government schemes. Certain schemes are found to be much more
heavily tapped than others and a review would identify ways of boosting participation in the
less-utilized schemes.
08SUMMARY AND CONCLUSIONS

p_58
b) Firms have highlighted several problems that may not have been fully addressed by the existing
government programs. The relevant authorities could therefore look into the possibility of either
revising current schemes or introducing new schemes to better address these concerns. For
example, one problem faced by innovating firms is the lack of customer responsiveness to new
goods/services, a demand-side issue that is not within the scope of existing assistance schemes
that are focused on solving supply-side problems. New programs to promote the adoption
of innovation by potential users could be introduced to address this gap. For example, the TEC
(The Enterprise Challenge) Scheme was introduced to encourage the public sector to trial-
test and adopt risky and unproven innovations. A similar scheme targeted at the private sector
could address the demand-side problems faced by innovative firms.
c) While most firms with innovation efforts have innovated new products or services, the majority
have not sought IP protection for their innovations. Firms also generally believe IP to be less
effective than other mechanisms, such as branding and lead time, for protecting their
competitive advantage. This might be due in part to firms’ innovations being too minor to be
protected by IP. To the extent that the lack of IP creation is caused by lack of awareness and
knowledge about IP, more education is needed to emphasize the importance of IP to firms with
innovation activities.
d) Many firms that own IP appear to not systematically track their IP portfolios. IP strategies in
most firms are also in the very early stages of development, which might indicate either lack
of scale or lack of knowledge to implement strategies for managing IP assets. This suggests a
need for assistance to be given to firms to build know-how and improve IP management
processes. Such assistance might be in the form of training and education programs or
facilitating partnerships between innovating firms and IP consultants and service providers.
e) There is room for further development of the local IP service industry. In particular, firms
indicated that amongst the locally-based IP service providers, licensing agents are the least
commonly used. This suggests a need for building capability and more professional development
in these niche areas.
f) To better assess the strengths and weaknesses of IP creation and usage in Singapore, it is
recommended that a follow-up study be carried out to benchmark Singapore’s IP creation and
usage profile and performance against a basket of relevant countries.
08 SUMMARY AND CONCLUSIONS

p_59
REFERENCES
REFERENCES
Brouwer, E. and A. Kleinknecht. (1999). “Innovative output, and a firm’s propensity to patent. An
exploration of CIS micro data”, Research Policy, 28 (6): 615-624.
Eurostat. (2004). Innovation in Europe: Results for the EU, Iceland and Norway. Data 1998-2001. Luxembourg:
Office for Official Publications of the European Communities. Downloaded from ftp://ftp.cordis.lu/pub/
innovation-smes/docs/results_from_cis3_for_eu_iceland_norway.pdf
Jones, G.K., A. Lanctot Jr. and H.J. Teegen. (2001). “Determinants and performance impacts of external
technology acquisition”, Journal of Business Venturing, 16(3): 255-283
Kim, Y.J and N.S. Vonortas. (2004). “Determinants of technology licensing”, Occasional Paper Series,
CSGOP-04-30, George Washington Center for the Study of Globalization.
Levin, R.C., A.K. Klevorick, R.R. Nelson, S.G. (1989). “Appropriating the Returns from Industrial Research and
Development”, Cowles Foundation Paper 714. Reprinted from Brookings Papers on Economic Activity, 3,
pp. 783-831, 1987.
MJI Business Solutions. Extracting Value from Intellectual Assets. Downloaded from http://www.
mjibusinesssolutions.com/SPSWebquestionnaire.rtf
Parhankangas, A., P. Holmlund and T. Kuusisto. (2003). “Managing non-core technologies: Experiences
from Finnish, Swedish and US corporations”, Technology Review, 149/2003, TEKES (National Technology
Agency), Helsinki.
Sattler, H. (2002). “Appropriability of product innovation: An empirical analysis for Germany”, Research
Papers on Marketing and Retailing, No. 3, University of Hamburg.
Science Innovation and Electronic Information Division, Statistics Canada. (2003). Survey of Innovation
2003, Statistics Canada.
Toh, M.H., Tang H.C. and Choo, A. (2002). “Mapping Singapore’s knowledge-based economy”, Economic
Survey of Singapore – Third Quarter 2002, Singapore: Ministry of Trade and Industry.
Wong, P.K. (2003). “From using to creating technology: The evolution of Singapore’s national innovation
system and the changing role of public policy”. In S. Lall and S. Urata (eds) Competitiveness, FDI

p_60
12
and Technological Activity in East Asia, p. 191-238. Cheltenham, UK; Northampton, US: Edward Elgar
Publishers.
Wong, P.K., M. Kiese, A. Singh and F. Wong (2003), ‘Pattern of innovation in the manufacturing sector of
Singapore’, Singapore Management Review, 25(1), 1-34.
Wong, P.K. and A. Singh (2004), ‘The pattern of innovation in the knowledge intensive business services
sector of Singapore’, Singapore Management Review, 26(1), 21-44.
Wong, P.K. and Y.P. Ho (2004), ‘Innovation in Singapore 1976 to 2002: A portrait using comparative
analysis of patents data’, NUS Entrepreneurship Centre Working Paper, WP2004-13, NUS Entrepreneurship
Centre, National University of Singapore.
REFERENCES
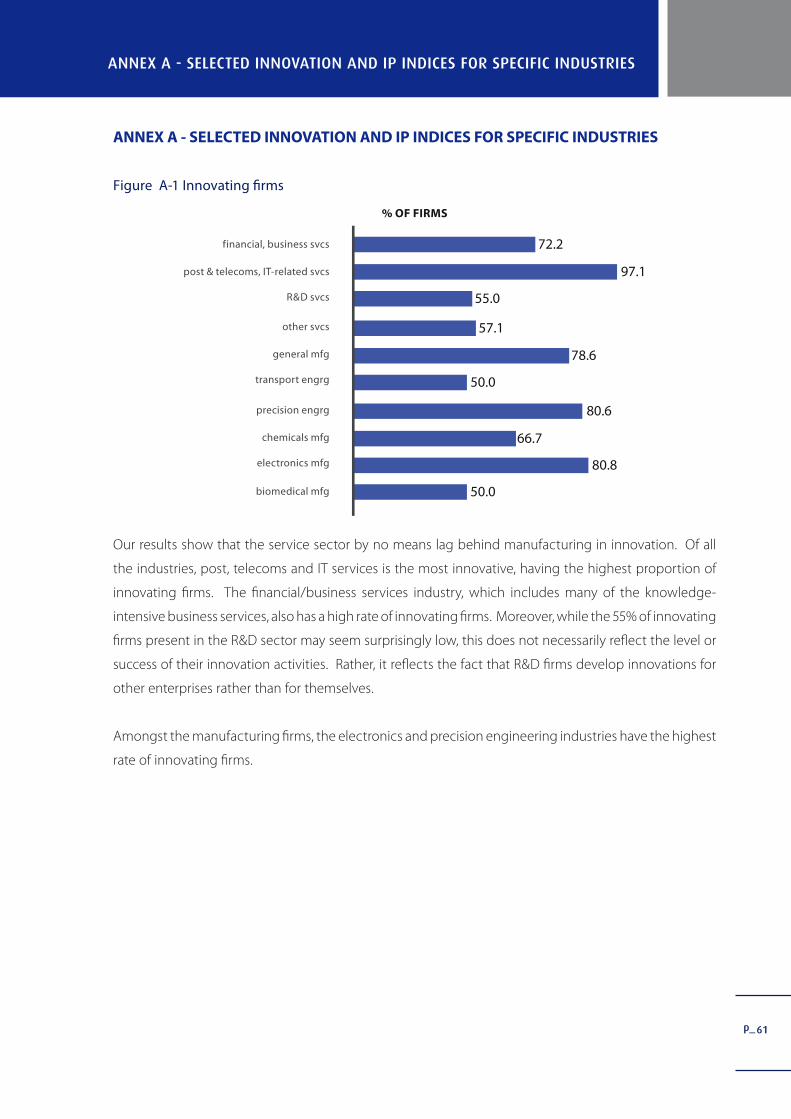
p_
ANNEX A - SELECTED INNOVATION AND IP INDICES FOR SPECIFIC INDUSTRIES
61
����
����
����������
������������������������
��������������������������������
��������
����������
�����������
���������������
���������������
�������������
���������������
��������������
����
����
����
����
����
����
����
����
ANNEX A - SELECTED INNOVATION AND IP INDICES FOR SPECIFIC INDUSTRIES
Figure A-1 Innovating firms
Our results show that the service sector by no means lag behind manufacturing in innovation. Of all
the industries, post, telecoms and IT services is the most innovative, having the highest proportion of
innovating firms. The financial/business services industry, which includes many of the knowledge-
intensive business services, also has a high rate of innovating firms. Moreover, while the 55% of innovating
firms present in the R&D sector may seem surprisingly low, this does not necessarily reflect the level or
success of their innovation activities. Rather, it reflects the fact that R&D firms develop innovations for
other enterprises rather than for themselves.
Amongst the manufacturing firms, the electronics and precision engineering industries have the highest
rate of innovating firms.

p_62
ANNEX A - SELECTED INNOVATION AND IP INDICES FOR SPECIFIC INDUSTRIES
Figure A-2 Product innovators
Figure A-3 Process innovators
Product innovators generally outnumber process innovators in each of the industries. One exception
to this is the precision engineering industries, which has an equal number of product and process
innovators, highlighting the importance of processes in this particular industry.
����������
����
����
����
����
����
����
����
����
����
����
������������������������
��������������������������������
��������
����������
�����������
���������������
���������������
�������������
���������������
��������������
����������
����
����
����
����
����
����
����
����
����
���
������������������������
��������������������������������
��������
����������
�����������
���������������
���������������
�������������
���������������
��������������

p_63
ANNEX A - SELECTED INNOVATION AND IP INDICES FOR SPECIFIC INDUSTRIES
Figure A-4 Firms which have applied for patents
Note: excludes firms who filed unsuccessful patent applications more than three years ago
The manufacturing industries, especially the high-tech industries of biomedical and electronics, are the
most active in filing patent applications. As would be expected, R&D services is the service industry
with the largest proportion of firms who have applied for patents.
Figure A-5 Firms which own valid patents
Note: Only includes firms whose patents are still in effect
����������
����
����
����
����
����
����
����
����
���
����
������������������������
��������������������������������
��������
����������
�����������
���������������
���������������
�������������
���������������
��������������
����������
����
����
����
���
����
����
����
����
���
����
��������������������������������
��������
������������������������
����������
�����������
���������������
���������������
�������������
���������������
��������������

p_64
ANNEX A - SELECTED INNOVATION AND IP INDICES FOR SPECIFIC INDUSTRIES
Given that the biomedical and electronics industries have the highest proportion of firms who have
applied for patents, it is not surprising that they also have the highest rate of patent owners. R&D
services have substantially fewer patent-owning firms as compared to those who have applied for
patents. However, this could be due to the age of the patent applications; if many of the firms in this
industry filed their patents in recent years, their applications may still be under review.
Figure A-6 Ownership of non-patent IP
Ownership of non-patent IP is fairly widespread amongst the different industries. The biomedical and
transport engineering industries have the highest proportion of firms who own non-patent IP, followed
by the post, telecoms and IT-related services and general manufacturing.
Figure A-7 Licensing-in of patents from third parties
����������
����
����
����
����
����
����
����
����
����
����
������������������������
��������������������������������
��������
����������
�����������
���������������
���������������
�������������
���������������
��������������
����������
���
���
����
����
����
���
����
����
���
����
������������������������
��������������������������������
��������
����������
�����������
���������������
���������������
�������������
���������������
��������������

p_65
ANNEX A - SELECTED INNOVATION AND IP INDICES FOR SPECIFIC INDUSTRIES
Figure A-8 Licensing-in of non-patent IP
The use of external IP through licensing-in patents is most common in the electronics manufacturing
and R&D services industries. Generally, licensing-in of non-patent IP is more common in the service
industries, particularly post, telecoms and IT-related services, and the financial/business services. This is
mainly due to their licensing of copyright, including software.
����������
���
���
����
����
����
����
���
���
����
���
������������������������
��������������������������������
��������
����������
�����������
���������������
���������������
�������������
���������������
��������������

p_66
ANNEX B - COMPARISON BETWEEN WEIGHTED AND UNWEIGHTED DATA
ANNEX B - COMPARISON BETWEEN WEIGHTED AND UNWEIGHTED DATA
DERIVATION OF WEIGHTING FACTORS
Weights are derived by computing the ratio of the population proportion to the sample proportion. A
generic derivation of a statistical weighting factor is shown below:
Where:
WTFi = weighting factor for sector i
Si = Number of respondents in sector i in survey sample
S = Total number of respondents in survey sample
Ni = Total number in sector i in the population
N = Total number in the population
In this study, the population was taken to be the firms identified by A*STAR for the National R&D Survey.
The sectoral distribution between our sample and the population is very close (see Table B-1)
Table B-1 Comparison of sectoral distribution of sample and population
SAMPLE POPULATION
% DISTRIBUTION
Manufacturing 50.0 49.3
Biomedical 2.1 2.6
Electronics 13.8 13.0
Chemicals 3.2 7.6
Precision Engineering 19.1 15.4
Transport Engineering 4.3 3.6
General manufacturing 7.4 7.1
Services 50.0 50.7
R&D 10.6 7.1
Post & Telecoms, IT related 18.1 17.0
Financial and business services 9.6 8.6
Other services 11.7 18.0
Total 100.0 100.0
� �� � �� �
� � �
� �
� � �
� �

p_67
Given the close correspondence between the sample and population distribution, there is little
difference between weighted and unweighted results (see Table B-2 for a comparison of weighted and
unweighted figures). Given this result, for ease of analysis, the unweighted results have been given in
this report
Table B-2 Comparison of weighted and unweighted data for selected indicators
MANUFACTURING SERVICES ALL SECTORS
% of innovating firms
Unweighted 75.5 74.2 74.9
Weighted 74.2 73.4 73.8
% of firms which own patents
Unweighted 40.9 15.1 28.0
Weighted 38.0 13.8 25.8
Total no. of patent applications over last 3 years
Unweighted 12.1 5.9 9.4
Weighted 12.0 5.4 9.3
Total no. of patents granted over last 3 years
Unweighted 8.3 2.5 5.8
Weighted 8.4 2.4 5.9
Total cumulative no. of patents granted (in effect, not expired)
Unweighted 16.7 3.8 11.2
Weighted 16.4 3.5 11.0
ANNEX B - COMPARISON BETWEEN WEIGHTED AND UNWEIGHTED DATA

p_68
ANNEX C - ERROR BOUNDS
Confidence intervals were calculated to give an indication of the true values of our data.
To calculate a 95% confidence interval for the sector proportion estimates, the following formula was
used:
To calculate a 95% confidence interval for the overall proportion estimates, the following formula was
used:
where:
pi = estimated proportion for sector i
ni = number of respondents from sector i
n = total number of respondents
fi = ni/Ni = sampling rate for sector i
Wi = Ni/N = weightage of sector i in total population
t = 1.96 for 95% confidence interval
Using these formulae, we estimate with a 95% confidence level that the true value of the percentage of
innovating firms for all sectors is 74.9% ± 5.5%. At the sectoral level, the true value of innovating firms
for the manufacturing sector is 75.5% ± 7.8%, and the true value of innovating firms for the service
sector is 74.2% ± 8.0% (see Table C-1)
Table C-1 Standard Error Bound Estimates of the Percentage of Innovating Firms
ESTIMATED PERCENTAGE OF INNOVATING FIRMS
95% CONFIDENCE BOUNDS
LOWER UPPER
Manufacturing 75.5% 67.7% 83.3%
Services 74.2% 66.2% 82.2%
All sectors 74.9% 69.4% 80.4%
ANNEX C - ERROR BOUNDS
��� � � � � � � � � � � � ����� �� � � � � � � � � � � � � � � �
� � � � � � � � � � � � � � � � � � � � � � � � � � � � � � � ��
��� ���� � � �
�� �
���
� � �
� � �� �� � � ��� � �� � � � � � � � � � � � � � � � � � � � � � � ��
�� ��
� ���� � ��� � ���� ��
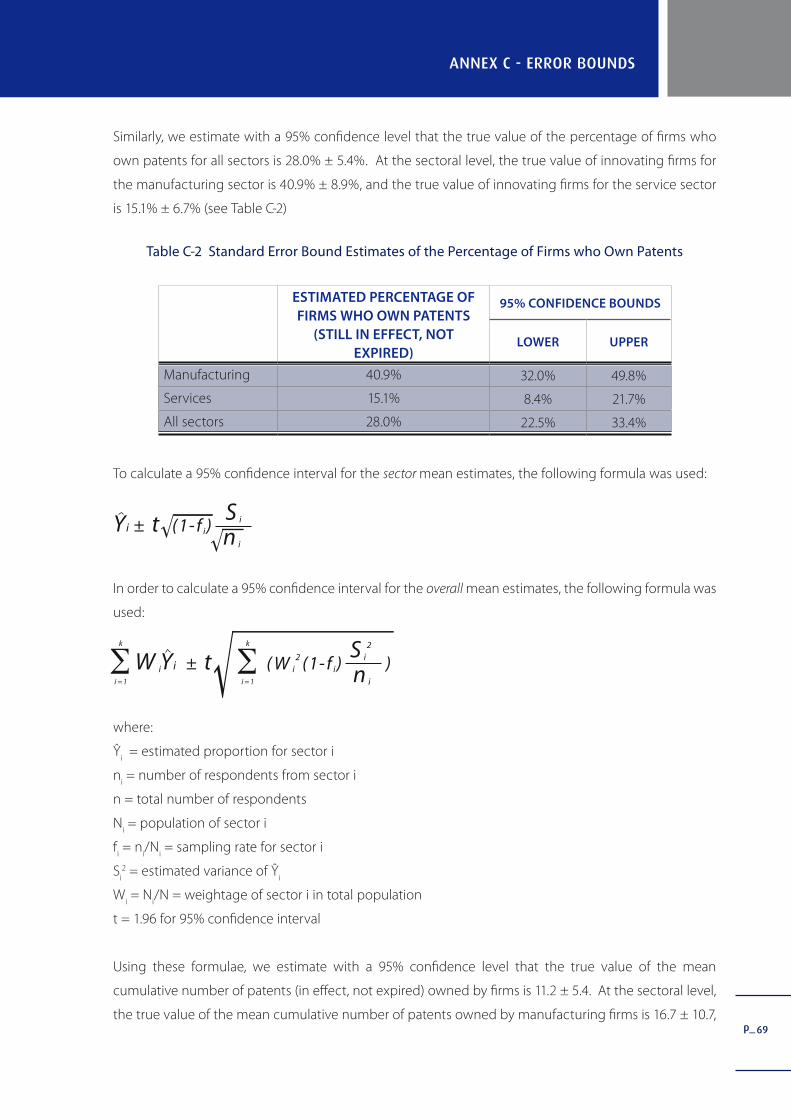
p_69
Similarly, we estimate with a 95% confidence level that the true value of the percentage of firms who
own patents for all sectors is 28.0% ± 5.4%. At the sectoral level, the true value of innovating firms for
the manufacturing sector is 40.9% ± 8.9%, and the true value of innovating firms for the service sector
is 15.1% ± 6.7% (see Table C-2)
Table C-2 Standard Error Bound Estimates of the Percentage of Firms who Own Patents
ESTIMATED PERCENTAGE OF FIRMS WHO OWN PATENTS
(STILL IN EFFECT, NOT EXPIRED)
95% CONFIDENCE BOUNDS
LOWER UPPER
Manufacturing 40.9% 32.0% 49.8%
Services 15.1% 8.4% 21.7%
All sectors 28.0% 22.5% 33.4%
To calculate a 95% confidence interval for the sector mean estimates, the following formula was used:
In order to calculate a 95% confidence interval for the overall mean estimates, the following formula was
used:
where:
Ŷi = estimated proportion for sector i
ni = number of respondents from sector i
n = total number of respondents
Ni = population of sector i
fi = n
i/N
i = sampling rate for sector i
Si2 = estimated variance of Ŷ
i
Wi = N
i/N = weightage of sector i in total population
t = 1.96 for 95% confidence interval
Using these formulae, we estimate with a 95% confidence level that the true value of the mean
cumulative number of patents (in effect, not expired) owned by firms is 11.2 ± 5.4. At the sectoral level,
the true value of the mean cumulative number of patents owned by manufacturing firms is 16.7 ± 10.7,
ANNEX C - ERROR BOUNDS
�� �� �� � � ��� � �� � � � � � � � � � � � � � � � � � � � � � ��� �
� ���
� � � � � � � � � �� ��� � � � �� � � � � � � � � � � � � �� ��� � �� � � � � � � � � � � � � � � � � � �� �
�
� � �
��
� � �
� ��
� ��

p_70
and the true value of the mean cumulative number of patents owned by the service sector is 3.8 ± 2.6
(see Table C-3).
Table C-3 Standard Error Bound Estimates of the Mean Cumulative No. of Patents Granted (In effect, not expired)
MEAN CUMULATIVE NO. OF PATENTS GRANTED (IN EFFECT,
NOT EXPIRED)
95% CONFIDENCE BOUNDS
LOWER UPPER
Manufacturing 16.7 6.1 27.4
Services 3.8 1.1 6.4
All sectors 11.2 5.8 16.6
ANNEX C - ERROR BOUNDS

p_71
ANNEX D - CORRELATION MATRICES
ANNEX D - CORRELATION MATRICES
Table D-1 Indicators of Innovation and Patent Ownership
INNOVATING FIRM?
% OF TURNOVER FROM NEW/SIG
IMPROVED PRODUCTS INTRODUCED DURING LAST 3 FISCAL YEARS
FIRM HAS APPLIED FOR
PATENTS
FIRM OWNS PATENTS
Innovating Firm? 1.000
% of turnover from new/sign improved products introduced during last 3 fiscal years
0.110 1.000
Firms has applied for patents
0.196 ** 0.147 1.000
Firm owns patents 0.197 ** -0.039 0.802 ** 1.000
Share of turnover in latest fiscal year covered by patent applications or patents granted
0.412
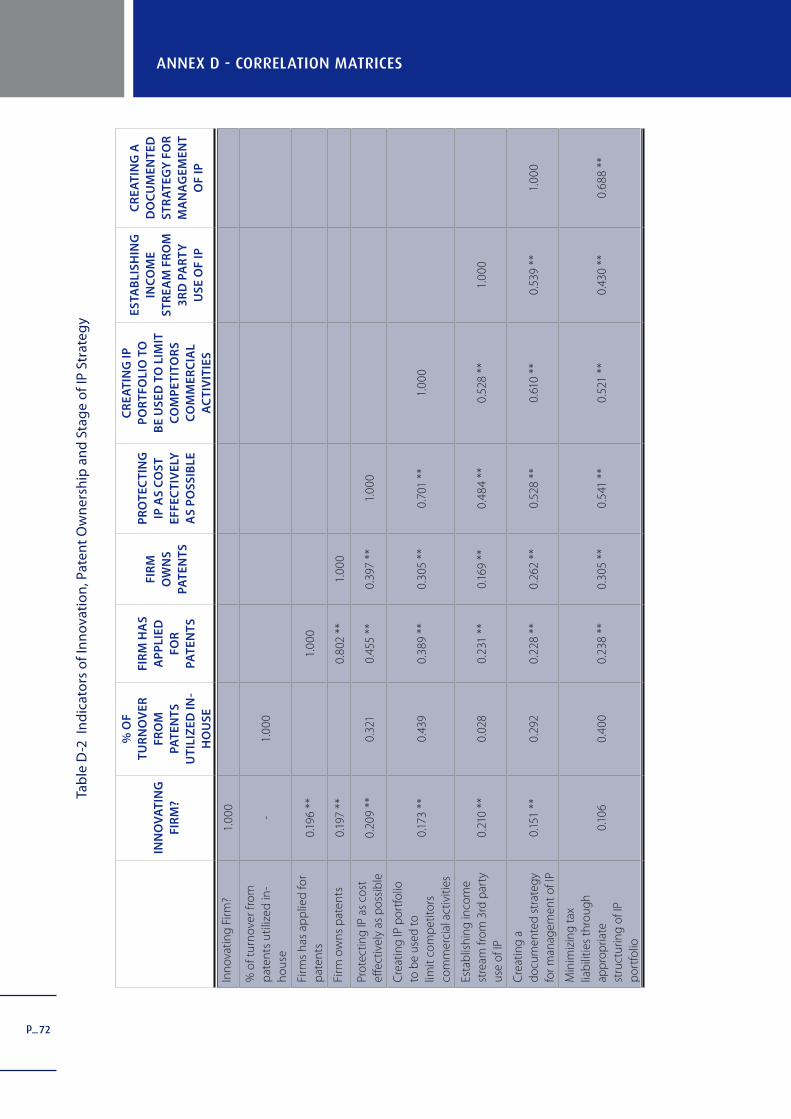
p_72
ANNEX D - CORRELATION MATRICESTa
ble
D-2
Ind
icat
ors
of In
nova
tion
, Pat
ent O
wne
rshi
p a
nd S
tag
e of
IP S
trat
egy
INN
OV
ATI
NG
FI
RM
?
% O
F TU
RN
OV
ER
FRO
M
PATE
NTS
U
TILI
ZED
IN-
HO
USE
FIR
M H
AS
APP
LIED
FO
R
PATE
NTS
FIR
M
OW
NS
PATE
NTS
PRO
TEC
TIN
G
IP A
S C
OST
EF
FEC
TIV
ELY
A
S P
OSS
IBLE
CR
EATI
NG
IP
PO
RTF
OLI
O T
O
BE
USE
D T
O L
IMIT
C
OM
PETI
TOR
S C
OM
MER
CIA
L A
CTI
VIT
IES
ESTA
BLI
SHIN
G
INC
OM
E ST
REA
M F
RO
M
3RD
PA
RT
Y
USE
OF
IP
CR
EATI
NG
A
DO
CU
MEN
TED
ST
RA
TEG
Y F
OR
M
AN
AG
EMEN
T O
F IP
Inno
vatin
g Fi
rm?
1.00
0
% o
f tur
nove
r fro
m
pat
ents
util
ized
in-
hous
e-
1.00
0
Firm
s ha
s ap
plie
d fo
r p
aten
ts0.
196
**1.
000
Firm
ow
ns p
aten
ts0.
197
**0.
802
**1.
000
Prot
ectin
g IP
as
cost
eff
ectiv
ely
as p
ossi
ble
0.20
9 **
0.32
1 0.
455
**0.
397
**1.
000
Cre
atin
g IP
por
tfolio
to
be
used
to
limit
com
petit
ors
com
mer
cial
act
iviti
es
0.17
3 **
0.43
9 0.
389
**0.
305
**0.
701
**1.
000
Esta
blis
hing
inco
me
stre
am fr
om 3
rd p
arty
us
e of
IP0.
210
**0.
028
0.23
1 **
0.16
9 **
0.48
4 **
0.52
8 **
1.00
0
Cre
atin
g a
docu
men
ted
stra
tegy
fo
r man
agem
ent o
f IP
0.15
1 **
0.29
2 0.
228
**0.
262
**0.
528
**0.
610
**0.
539
**1.
000
Min
imiz
ing
tax
liabi
litie
s th
roug
h ap
prop
riate
st
ruct
urin
g of
IP
port
folio
0.10
60.
400
0.23
8 **
0.30
5 **
0.54
1 **
0.52
1 **
0.43
0 **
0.68
8 **

p_73
ANNEX E - TESTS OF DIFFERENCES
ANNEX E - TESTS OF DIFFERENCES
Table E-1 Indicators of IP creation and usage in innovating vs non innovating firms
NON-INNOVATING INNOVATING Z-TEST FOR DIFFERENCE IN PROPORTIONS% OF FIRMS
IP creation indicators
Firms which have applied for patents 21.3 43.2 2.68 **
Firms which own patents 12.8 33.1 2.36 **
Firms which own non-patent IP 40.4 52.1 1.31
% whose patent usage contributes ≥2% of turnover
0.0 10.7 2.34 **
% whose royalties from licensing-out patents contribute ≥2% of turnover
0.0 2.9 1.17
% whose royalties from licensing-out non-patent IP contribute ≥2% of turnover
2.1 10.7 1.82 *
IP usage indicators
Firms which license-in patents 10.6 20.1 1.47
Firms which license-in non-patent IP 12.8 16.5 0.62
% whose products/services which use licensed-in patents contribute ≥2% of turnover
0.0 8.6 2.08 **
% whose products/services which use licensed-in non-patent IP contribute ≥2% of turnover
4.3 9.3 1.11 **
* significant at 10% ** significant at 5%

p_
ANNEX F - REGRESSION ANALYSIS
ANNEX F - REGRESSION ANALYSIS
Table F-1 Regression with Dependent : Share of Revenue from new products/services introduced in last 3 years
STANDARDIZED COEFFICIENTS
SIG.
(Constant) 0.939
Electronics / IT mfg 0.069 0.434
Chemicals & pharmaceuticals mfg 0.01 0.892
Other manufacturing 0.136 0.189
IT services 0.031 0.793
R&D and IP Services -0.034 0.754
Sales in last Fiscal Year 0.016 0.865
Foreign Company -0.013 0.875
Percentage of employees university graduates 0.17 * 0.084
Company owns patents 0.148 * 0.082
Share of Revenue from Patents in-house and licensed out -0.077 0.347
Spending on R&D as % of sales 0.574 ** 0
Adjusted R Square 0.337
F 7.429 p=0.00
Deg of Freedom 139
74

p_
Table F-2 Regression with Dependent : Average growth in sales in last 3 fiscal years
STANDARDIZED COEFFICIENTS
SIG.
(Constant) 0.58
Electronics / IT mfg 0.326 ** 0.003
Chemicals & pharmaceuticals mfg 0.182 ** 0.036
Other manufacturing 0.193 * 0.091
IT services 0.122 0.276
R&D and IP Services 0.037 0.729
Sales in last Fiscal Year -0.207 ** 0.05
Foreign Company -0.051 0.569
Share of revenue from new products/services introduced in last 3 years
0.28 ** 0.001
Adjusted R Square 0.115
F 3.525 p=0.001
Deg of Freedom 155
* significant at 5% ** significant at 1%
ANNEX F - REGRESSION ANALYSIS
75