Shrimp viral diseases in India and prospects of viral vaccines
Upload
khangminh22Category
view
0download
0
1
Surveillance of Viral Hepatitis in Hong Kong
- 2017 Update Report
Viral Hepatitis Control Office Special Preventive Programme
Centre for Health Protection Department of Health
December 2018

2
The information contained in this Report is up to year 2017 for the surveillance data, service statistics and published research findings.
Editorial Team:
Dr Kenny Chan Dr Rebecca Lam Dr Bonnie Wong Dr Priscilla Kwok Ms Wai Kit Chan Ms Phoebe Lam
Correspondence
Viral Hepatitis Control Office Special Preventive Programme 9/F, Kowloon Bay Health Centre 9 Kai Yan Street Kowloon Hong Kong
Telephone: (852) 2116 2888 Facsimile: (852) 2117 0809
Website: www.hepatitis.gov.hk E-mail: [email protected]
Comments and suggestions on this Report are most welcome. *pdf version of the report can be downloaded from www.hepatitis.gov.hk.

3
SURVEILLANCE OF VIRAL HEPATITIS IN HONG KONG
2017 UPDATE
CONTENTS CONTENTS 3
ACKNOWLEDGEMENTS 4
COMMENTARY 5
TABULATED RESULTS
Acute viral hepatitis under the disease notification system 23
Seroprevalence of hepatitis A and hepatitis E 42
Seroprevalence and vaccination coverage of hepatitis B 48
Seroprevalence of hepatitis C 72
Liver cancers 80
ABBREVIATIONS 85
REFERENCES 86

4
SURVEILLANCE OF VIRAL HEPATITIS IN HONG KONG
2017 UPDATE
ACKNOWLEDGEMENTS
The Special Preventive Programme wishes to thank the following agencies for their
contributions to the preparation of the 2017 Update Report:
Action for REACH OUT
CHC-Group Medical Practice
Chinese University of Hong Kong
Department of Medicine, Princess Margaret Hospital
Department of Microbiology, Prince of Wales Hospital
Department of Microbiology, Princess Margaret Hospital
Family Health Service, Department of Health
Family Planning Association of Hong Kong
Public Health Laboratory Services Branch, Centre for Health Protection, Department
of Health
Health Service of Baptist University of Hong Kong
Hong Kong Red Cross Blood Transfusion Service
Hong Kong Cancer Registry
Pamela Youde Nethersole Eastern Hospital
Surveillance & Epidemiology Branch, Centre for Health Protection, Department of
Health
TB and Chest Service, Centre for Health Protection, Department of Health
The University of Hong Kong

5
SURVEILLANCE OF VIRAL HEPATITIS IN HONG KONG
2017 UPDATE
COMMENTARY Surveillance Mechanisms of Viral Hepatitis in Hong Kong
1. Viral hepatitis is a statutory notifiable disease in Hong Kong. Locally, voluntary
reporting was started in as early as 1966 and, since 1974, the disease has become
notifiable. It was not until 1988 that the reported cases were classified by viral etiology,
namely hepatitis A, hepatitis B, non-A non-B hepatitis and unclassified hepatitis. In
1996, non-A non-B hepatitis was further categorised into hepatitis C, hepatitis E and
hepatitis (not elsewhere classified).
2. The extent of chronic infections resulting from some hepatitis, notably hepatitis B
and C, is determined by other mechanisms. Insight into the epidemiology of various
forms of hepatitis in Hong Kong can be gained by analytical interpretation of regular
statistics collected by health care or other institutions, and information generated from
various studies. This Report presents the latest findings from collation and analysis of
viral hepatitis data obtained from the disease notification system, service statistics,
seroprevalence studies and other research findings. Much as one hopes that the local
viral hepatitis picture can be painted accurately and fully, this is certainly limited by the
nature and availability of data. The presence of biases in data per se and their
interpretation need to be acknowledged in reading this Report.
Epidemiology of HAV and HEV 3. Hepatitis A virus (HAV) and hepatitis E virus (HEV) are both transmitted by the
faecal-oral route, albeit with different local epidemiology in the past two decades. Hong
Kong was once of intermediate endemicity for HAV [1, 2]. After 1988 when viral
hepatitis began to be reported according to etiologic agents, the largest epidemic of
hepatitis A occurred in 1992, with over 3,500 cases reported to the Department of
Health (DH) (Box 1). This represented a notification rate of 63 per 100,000 population
(Box 7) and since then, a gradual declining trend in HAV incidence has been observed.
This discernible decline in hepatitis A contributed to a parallel declining trend in overall

6
reported viral hepatitis since 2002 (Box 3). The case fatality rates from hepatitis A has
been low and ranged between 0 and 0.15% in the last two decades (Box 7).
4. From 2008 to 2017, the annual number of hepatitis A cases reported ranged from
43 to 138 (Box 1). In 2015, a review on 587 reported cases of hepatitis A from 2005
to 2014 was published by the Surveillance and Epidemiology Branch (SEB) of Centre
for Health Protection (CHP), Department of Health (DH). The male to female ratio was
1.2 to 1, with 75% aged below 40 years. The majority (70%) of cases required
hospitalisation, and two fatal cases were recorded. Both fatalities had multiple
comorbidities. The majority (76%) of the patients acquired the disease locally. 92%
were sporadic cases and 22 small clusters affecting two to four patients were identified,
at least 60% of which were clusters affecting members of the same household [3].
5. An increase in the number of cases was noted in 2015 when a total of 138 cases
were reported. The majority (75%) of the cases was reported from February to June.
The male to female ratio was 1.2 to 1, with a median age of 33 years (range: 3 to 83
years). There was no fatality. Except two cases studying in the same school and two
cases from same family, no epidemiological link was found. No single identifiable
source could explain the upsurge of cases [3].
6. In 2016, a total of 98 cases of hepatitis A were recorded, affecting 68 men and
30 women (male to female ratio 2.26:1) aged from 3 to 86 years (median 32 years).
Sixty-three cases (64.3%) acquired the infection locally. 85.7% required hospitalisation.
7. In late 2016, an unusual upsurge of acute hepatitis A infection affecting men who
have sex with men (MSM) with human immunodeficiency virus infection was noticed.
With retrospective investigations and prospective reporting, a total of 53 cases of
laboratory-confirmed HAV infection with clinical symptoms among individuals
identified as MSM were recorded between September 2015 and November 2017. The
age range was 20 to 55 years (median: 33 years). Forty-five (84.9%) required
hospitalisation and there were no fatalities. Thirty-seven cases (69.8%) were known
to be HIV-positive attending one of the three designated public HIV clinics. The
majority (96.2%) did not report history of HAV vaccination. Eighteen (33.9%) reported
travel history within the incubation period. Around one quarter of the cases had
concurrent diagnosis of other sexually transmitted infections including syphilis,
gonorrhea and chlamydia infection. Among the cases with specimen available for
laboratory analysis, forty-three (81.1%) had identical nucleotide sequences within the

7
genotyping window. Apart from one cluster affecting two patients who were sex
partners residing together, no other epidemiological linkage could be found. No
common food nor water source or social gathering was identified among these cases.
Epidemiological investigations suggested that the outbreak was contributed by
transmission by way of sexual contact between men, a high proportion of whom were
HIV-infected. HAV outbreaks among MSM communities were being reported during
the same period in some other regions with low HAV endemicity including Taiwan,
Europe and both North and South America [4].
8. Over the years, there has been an increase in the proportion of reported cases
over 35 years old. Although the majority were still below 44 years of age, the proportion
of reported cases that were aged 45 and above had increased from less than 10% in
the last two decades to 14%-25% since 2010 (Box 6).
9. In a local household study conducted in 2001, (Community Research Project for
Viral Hepatitis 2001, CRPVH), anti-HAV positivity was less frequent (P<0.001) across
all age groups among subjects >21 years old [2] than subjects in the same age groups
of another study conducted in late 1980s [5]. HAV prevalence has only increased
insignificantly in every 10-year age groups of people aged 21-50 when compared with
their corresponding 10-year younger age groups, signifying an aging cohort effect with
no major infections in the prior 10 years [2]. Similar conclusions can be drawn when
comparing the late 1980s findings with those of a late 1970s study on local HAV
seroprevalence [6]. Together, these three studies suggest that age-specific
prevalence of HAV has right-shifted locally since 1980s. As of 2001, anti-HAV was
present in about 20% of adults below 30 years old while it was over 80% in people
aged >=40 years in the general Chinese population (Box 20). Data from laboratory
surveillance performed by Public Health Laboratory Services Branch (PHLSB) every
five years had also shown that the seroprevalence of anti-HAV had remained below
40% among those younger than 30 years old in 2000, 2005 and 2010. From the
available data, the prevalence of hepatitis A infection has been falling in Hong Kong,
which echoes the finding of a higher median age in reported HAV cases that also
reflects the increased susceptibility of the adult population. The data also indicates
that Hong Kong has changed from a region with intermediate to very low endemicity
in the past three decades (Box 21) [7].
8
10. Besides an increasing prevalence with higher age, people born outside Hong
Kong were generally more likely to test positive for anti-HAV whereas the reverse was
true for people of non-labour work [2]. From the telephone interview part of the CRPVH
2001, some 11% of 4,564 subjects reported a history of HAV vaccination, about 80%
of whom had completed the course. More people less than 40 years old had received
the vaccination. Over 98% had the cost paid by themselves or covered by their
employers. In the latest serosurvey conducted by PHLSB in 2015, there was a
significant increase in the seroprevalence of anti-HAV in the younger age group, most
prominent among those aged 0-10 (Box 21). These findings may suggest an increase
in uptake of HAV vaccination in the community.
11. Cross-sectional surveys of anti-HAV at Kowloon Bay Integrated Treatment
Centre (ITC), the HIV specialist clinic under Department of Health, have been started
since 2007. The subjects consisted of all new HIV/AIDS patients who first attended
ITC between Jul 2007 and 2017 and convenience samples of all active HIV/AIDS
patients who first attended ITC before Jul 2007 (Box 22). The prevalence of anti-HAV
increased with age of HIV/AIDS patients, and the overall positivity rate among these
patients tested between 2007 and 2017 appeared to be comparable with that of the
2010 serosurvey data. Confounding factors, such as different levels of past infection,
immunodeficiency in HIV patients, history of HAV vaccination and difference in years
of testing, may have affected the results. Compared with patients acquiring HIV via
other routes, those infected via homosexual or bisexual routes were at the highest risk
of hepatitis A infection, as reflected by the lowest level of anti-HAV prevalence in this
group of patients (Box 23). Indeed, the increased susceptibility had manifested itself
during the upsurge of hepatitis A infection among MSM occurring in 2015 to 2017 [4].
As a result, the Scientific Committee on AIDS and STI, and Scientific Committee on
Vaccine Preventable Diseases had extended their recommendation for hepatitis A
vaccine to MSM in June 2017 [8].
12. The annual notification of hepatitis E infection increased from 11 in 1996 to a
record high of 150 in 2012 (Box 1). In the past five years, the number of reported cases
of hepatitis E ranged from 64 to 96. A seasonal pattern was observed with peak
infections reported from February to April (Box 15), indicating that infection was more
common during winter and spring seasons. Of 1271 cases reported, 838 (65.9%, Box
16) were male, giving male to female ratio of 1.9:1. The majority was adults, most of
whom were aged between 35 to 74 (Box 17). Fatalities were more common with acute
9
hepatitis E than with acute hepatitis A and the death rate reached as high as 0.44 per
million population in 2002 when three deaths attributable to acute hepatitis E infection
had occurred (Box 18).
13. In the CRPVH study conducted in 2001, 18.8% of adult subjects were found to
have serologic evidence of HEV infection. People in the 40-49 years age group had
the highest positivity rate of 24.1% (Box 24). Another local seroprevalence study on
anti-HEV using 450 serum samples submitted for virological investigation in 2008-
2009 in a local hospital found a higher rate of HEV IgG seropositivity [9]. The HEV IgG
seropositivity rate increased from 8% among 1-10 years old to >56% among those
aged over 80. The overall seropositivity rate was higher among male than female
(32.9% vs 24.4%, p=0.048). Despite the limitations of small sample size and bias
sampling in this study, the finding of an overall increase in the seropositivity rate is
compatible with the changing local epidemiology of Hepatitis E notified to Department
of Health in recent years.
14. The CHP reviewed all hepatitis E cases recorded between 2001 to 2010 [10]. Of
the 524 cases, the commonest presentations were tea-coloured urine, jaundice,
anorexia, fever, myalgia and nausea. 78.2% were hospitalised with a median stay of
7 days. A total of 12 cases were fatal (9 males and 3 females), age ranged from 53 to
82 (median age 67.5 years). The case fatality rate was 2.3%, which was comparable
with reported figures from other countries. None of the fatal cases were pregnant.
Most cases (99.4%) were sporadic infection and 87.4% acquired the disease locally.
A small family cluster involving 2 males (aged 15 and 44 years) was identified. The 2
victims had shared multiple high-risk food items at home during the incubation period.
It proved difficult to determine the exact source of infection of individual sporadic cases
as hepatitis E has a long incubation period of 15-64 days. Nonetheless,
epidemiological investigation has not identified any outbreak linked to a particular food
premises.
15. Another review of the acute hepatitis E cases recorded by CHP from 2012 to May
31 2017 showed a total of 554 cases, with age ranging from 15 to 96 years (median:
55 years) [11]. More males were affected than females (63.0% vs. 37.0%). More cases
were recorded in February and March. Most of the cases (83.8%) acquired the
infection locally. Symptomatology was similar with the cases from 2001 to 2010. Four
hundred and seventy-six (85.9%) patients required hospitalization with a median
length of stay of six days. Nine fatal cases were recorded, among whom 7 had

10
underlying illnesses, giving a case fatality rate of 1.6%. The age of the deceased
patients ranged from 59 to 79 years (median: 74 years). All cases were sporadic
infections, except for a pair of father and son who shared meals frequently during the
incubation period. None of the cases was related to outbreak involving food premises.
A significant proportion of the victims recalled consuming pig offals (37.5%) and
shellfish (29.4%) during the incubation period.
16. Another published study identified differences in epidemiology and clinical
features between sporadic hepatitis E and hepatitis A cases. Of 105 acute hepatitis A
and 24 hepatitis E patients seen at Princess Margaret Hospital (PMH) in 2002, HAV
patients were significantly younger (median age of 27 years) and had recent history of
shellfish consumption while HEV patients were older (median age = 53 year) and most
had a recent travel history. Moreover, whereas hepatitis A was milder and recovery
was uneventful, hepatitis E was more severe, associated with significant mortality and
frequently complicated by protracted coagulopathy and cholestasis [12].
17. A local study examined the genotype of 57 patients with acute HEV infection who
were admitted to Prince of Wales Hospital (PWH). Fifty-six patients (98%) were
Chinese. All cases were sporadic. No fulminant hepatitis was recorded and all patients
recovered. Phylogenetic analyses of the open reading frame ORF2 fragments from 46
patients and ORF1 fragments from 33 patients showed complete agreement, with
most (n= 45 [98%]) belonging to genotype 4. The remaining isolate was genotype 3
obtained from a woman who had no history of travel. Most of the Hong Kong isolates
clustered closely with a swine isolate reported from Guangxi Province, China [13].
18. Apart from pregnancy, coinfection with chronic Hepatitis B virus might be
associated with more fulminant clinical outcome in patients infected with Hepatitis E.
Among 3 cases of serious infection of Hepatitis E with acute liver failure reported to
DH in the first two months of 2012, one required liver transplantation and two passed
away. One of the deceased patients was tested positive for chronic hepatitis B
infection [14]. Moreover, a 10-year retrospective study on acute hepatitis E in local
hospitals showed that patients with chronic HBV acutely infected with hepatitis E had
a higher rate of liver failure, liver-related mortality and all-cause mortality, though the
association was not statistically significant [15].
19. There is evidence suggesting a zoonotic source of Hepatitis E in overseas studies,
and that pigs may be an important reservoir. In light of these observations, the Centre
for Food Safety conducted a risk assessment study titled “Hepatitis E Virus in Fresh

11
Pig Livers” [16] to determine the HEV prevalence in fresh pig liver samples obtained
in local markets. One hundred fresh pig liver samples were collected from pigs
slaughtered between mid-January and May. Sixteen (31%) out of 51 roaster pig
(around four months old) liver samples were positive for HEV, while none of the 49
porker pig (around six months old) liver samples tested positive. Partial sequences of
some HEV isolates from roaster pigs were identical to those from 7 among 48 local
human cases with date of onset from January to July 2009, as well as local cases
recorded in the past. The findings suggest the possibility of roaster pigs as one of the
sources of local human hepatitis E infections.
20. One HEV vaccine was licensed in China in December 2011 for use in people
aged at or older than 16 years old [17]. To date, it has not been licensed in other
countries or territories. It has been shown to have high efficacy against hepatitis E in
healthy adults of 16 to 65 years old in China. Data is however limited on its impact on
the overall disease incidence and reduction of mortality in the general population
where disease is endemic. Therefore, in the absence of sufficient information, World
Health Organization (WHO) has not made recommendation on its incorporation in
national programmes [17].
Pattern of Hepatitis B in Various Communities and its Significance
21. The number of reported acute hepatitis B virus (HBV) infections has been
decreasing over the last decade, from 137cases reported in 2000 to 33 cases reported
in 2017 (Box 1). In an epidemiologic study of acute HBV by the Department of Health
and Hong Kong Red Cross Blood Transfusion Service (HKRCBTS), 149 of 351 eligible
subjects recruited from 2000 to 2003 participated in risk factor assessment with or
without blood screening. Repeat blood donors who tested positive for HBsAg for the
first time and were then confirmed IgM anti-HBc positive were reported as having acute
HBV. There were 43 such clients, yielding an incidence rate of HBV seroconversion in
repeat donors as 9.4/100,000 (n=148,366), 9.3/100,000 (n=150,420), 4.6/100,000
(n=151,410) and 3.5/100,000 (n=143,230) in 2000, 2001, 2002 and 2003 respectively.
Nearly 70% of the study subjects were male; 99% were Chinese and the mean age
was 31 years. Over half could not have risk factor of acute HBV determined despite
undergoing a standardised questionnaire interview by nurses. Sexual contact was
assessed to be the commonest risk (85%) in the rest. Of 124 subjects who had
hepatitis B screening at 6 months post-IgM anti-HBc positivity, 50% developed anti-
HBs while 9.7% were HBsAg positive. Although these results could suggest a higher

12
rate of HBV chronicity than what was previously reported in the literature, they have
to be interpreted with caution owing to the relative small number of samples,
incompleteness of data and potential biases from the subjects sampling and other
study design.
22. Determining the seroprevalence of hepatitis B surface antigen (HBsAg) sheds
light on how common chronic HBV infection is in different communities, as well as
informing its chronic disease burden. The various adult communities can be
categorised into 3 groups according to the risk of contracting HBV:
(a) without apparent risk: blood donors, pre-marital/ pre-pregnancy service
users, antenatal women, police officers, new health care workers (HCW)
(b) with undetermined risk: clients seeking post-exposure management and
tuberculosis patients
(c) with apparent risk: drug users, HIV/AIDS patients and female sex workers
23. A majority of the available seroprevalence data in different populations were
limited to overall positivity rate of HBV markers. Still, temporal trend can be discerned
as most have yearly data for the past decade or so. Several features on the current
pattern of HBV could be observed from the serologic investigations, namely
(a) chronic HBV infection is in a general declining trend in community groups
without apparent risk of contracting HBV
(b) HBV prevalence increases with increasing age, and
(c) chronic HBV infection is commoner in male than female.
24. A word of caution in the interpretation of data though, is that testing for HBV
markers has been performed for a variety of reasons in different communities, with
heterogeneous mix of population characteristics.
Seroprevalence of adult communities without apparent risks 25. The temporal decline of chronic HBV infection has been most obvious in new
blood donors and police officers. For new blood donors, the HBsAg prevalence follows
a continual falling trend since early 1990s, from 8% in 1990 to 0.9%in year 2017 (Box
25). The trend is even more obvious among the 16-19 years age group where the
prevalence is as low as 0.3% in both female and male (Box 26). A similar trend was
observed among police officers where the HBsAg prevalence falls from 7.9% in 1997

13
to 1.4% in 2017 (Box 32), with the lowest prevalence of 0.5% among those aged 20
or less (Box 33). A falling trend was also observed in other community groups without
apparent HBV risk, albeit less prominent (Box 42, 43).
26. The HBsAg prevalence in antenatal mothers has been decreasing from over 10%
in the early 1990s to 5.0% in 2017 (Box 29). As compared with other groups without
apparent risk, the overall HBsAg prevalence in antenatal mothers is higher and
confounded by the place of birth. A study of 2480 pregnant women attending the
Maternal and Child Health Centre (MCHC) of DH in 1996 found a 13.1% in those born
in Mainland China as compared to 8.4% in local mothers [18]. Data from Virus Unit,
Department of Health also showed a higher prevalence of 12.5% and 13.8% in the
subset of non-resident expectant mothers versus the overall positivity rate of 8.5% and
8.6% in 2004 and 2005 respectively. The prevalence in pre-marital/ pre-pregnancy
package service users has dropped from 9.6% in 1990 to remain static in the range of
4.8% to 6.9% in the past decade (Box 28). The prevalence in newly recruited health
care workers as determined at pre-HBV vaccination screening also showed a
decreasing trend from 5.9% in 2001 to 3.5% in 2017 among female, and from 6.1% in
2001 to 2.4% in 2017 among male (Box 35).
Seroprevalence of adult communities with undetermined risk 27. Of 874 tuberculosis patients attended TB & Chest Clinics, DH between March
and May in 2015, 74 (8.5%, Box 36) were detected HBsAg positive, with the highest
prevalence rate in the middle age group (40-59 years old: 10%, Box 37) followed by
the more elderly group (>= 60 years old: 8.8%, Box 37). The HBsAg positivity rate was
also found to be higher in male clients (10%) than in female (5.7%, Box 36). Both the
age (Box 37) and gender pattern (Box 36) were consistently observed over the last
decade. Among clients attended for post exposure management, HBsAg rate was
found higher in non-health care workers than in health care workers (Box 38), which
may be partly explained by the success of pre-employment vaccination programme
for healthcare workers.
Seroprevalence of adult communities with apparent risk
28. The HBsAg prevalence in HIV/AIDS patients under care of DH was in the range
of 5.6% to 11.3% in the past decade (Box 40). Due to underlying immunosuppression
and shared routes of transmission, HIV/AIDS patients are more likely to be chronically
infected with HBV [19]. The HBsAg prevalence in female sex workers attending the

14
clinic of Action for REACH OUT tested between 2007 to 2011 ranged from 5.0% to
10.4% (Box 43). The data regarding prevalence of HBsAg in drug users was difficult
to interpret because of the small number of subjects since 2006 (Box 39). Overall, the
difference in HBsAg prevalence between groups with or without apparent risk of
contracting HBV has not been prominent in the past few years.
Genotypes of Hepatitis B and their Disease Course
29. Different HBV genotypes have been identified with distinct geographic distribution
and association with different clinical outcomes. Local studies indicated that
genotype C was the commonest genotype and genotype B was the second. A study
of 776 chronic hepatitis B patients seen at the University of Hong Kong Liver clinic
from 1999 to mid-2003 found that genotype C was the commonest (486, 62.6%),
followed by genotype B (252, 32.5%), with a majority of genotype B belonged to
subgroup Ba [20]. Another study of 426 chronic HBV patients recruited consecutively
from 1997 to mid-2000 at the Hepatitis clinic of Prince of Wales Hospital (PWH) found
a prevalence of 57% (242) and 42% (179) of genotypes C and B respectively [21].
30. A study of 49 HBV genotype C ethnic Chinese patients under the care of the PWH
Hepatitis Clinic identified 2 distinct groups with different epidemiological distribution
and virologic characteristics – 80% being genotype “Cs” (found mostly in Southeast
Asia) and 20% “Ce” (predominated in Far East) [22]. In addition, subgenotype Cs
appears to be more common in Hong Kong than other parts of China. In the recent
analysis of a cohort of patients with HBeAg-negative chronic liver disease from three
different parts of China (Beijing, Shanghai and Hong Kong), 69% of genotype C
patients in Hong Kong belonged to sub genotype Cs whereas 97% of genotype C HBV
in Shanghai and Beijing belonged to subgenotype Ce (P< 0.0001) [23].
31. Regarding HBV disease course, local studies suggested that patients infected
with genotype C have a higher risk of cirrhosis and HCC development [21, 24], as well
as more severe histological fibrosis [25]. A recent meta-analysis concluded that
genotype C hepatitis B virus was associated with a higher risk of HCC than other major
hepatitis B virus genotypes [26]. Among HBV genotype C, subgenotype Cs appears
to carry a worse prognosis than subgenotype Ce [23]. In a local study by the Chinese
University of Hong Kong, patients infected by subgenotype Cs had the lowest serum
albumin and highest alanine aminotransferase levels compared with subgenotypes Ce
and Ba. And, patients infected by subgenotype Cs also had more severe histological

15
necroinflammation than subgenotype Ce [23]. However, the meta-analysis did not find
significant difference in the risk of HCC between HBV-infected patients with
subgenotype Ce and Cs [26].
32. Nevertheless, in a study of end-stage HBV-related liver disease patients requiring
transplantation, those with genotype B had significantly more pre-transplant acute flare
and worse liver function while genotype C patients had a greater risk and severity of
recurrence due to lamivudine-resistant mutants [27].
33. In a case control study, it was concluded that HCC patients had a significantly
higher prevalence of core promoter mutations and genotype C but the association with
HCC is mediated via the former [28]. A study of 5080 chronic HBV patients focusing
on familial HCC found 22 such families, giving a prevalence of 4.3 families/1000 HBV
carriers [29]. Age of onset of HCC is significantly younger in familial HCC than sporadic
cases, and it progressively decreased down the generations, suggesting an
anticipation phenomenon.
Hepatitis B Vaccination
34. Occurrence of new HBV infection is dependent on the interplay of multiple factors,
including size of HBV pool, proportion of susceptible population and chance of
exposure to the virus. The universal vaccination programme for newborns, increased
vaccination coverage in adults, practice of universal precaution in health care settings,
screening of blood donors and promotion of safer sex all contributed to the reduced
HBV incidence in Hong Kong. [30].
35. A 16-year follow up study of 1112 neonates born to HBsAg-positive mothers who
received HBV vaccine and hepatitis B immunoglobulin at different schedules
demonstrated the long term protective efficacy of immunisation [31]. Upon completion
of the vaccination schedules, 92.6% developed antibody against surface antigen (anti-
HBs) seroconversion. Thirty-nine (3.5%) babies were tested positive for HBsAg and
had become chronic carriers, 35 of which (89.7%) occurred before one year of age. At
the end of the 16th year, 610 subjects (54.9%) returned for blood test evaluation.
Although the anti-HBs seroconversion rate dropped to 33.3% at the 16th year and a
total of 90 (8%) vaccinees developed anti-HBc seroconversion, none was found to
have breakthrough infection to become chronic HBV infection. At the 30th year of
follow-up, 246 (22.1%) vaccines returned for blood tests [32]. The anti-HBs

16
seroconversion rate was maintained at 37.4% at the 30th year. Although two and one
subjects developed anti-HBc seroconversion at the 21st and 25th year respectively,
there was no new development of HBsAg positivity detected. These findings
demonstrated the long-term protective efficacy of neonatal hepatitis B immunization
among high risk individuals up to at least 30 years. In another study comparing three
different HBV vaccine regimens without boosters given to 318 HBV negative children
recruited at age 3 months to 11 years and followed up annually, no subjects tested
positive for HBsAg up to 18 years of follow up (88 subjects). A total of 88 anamnestic
responses with significant increase in anti-HBs titers were documented in 70 subjects;
3 subjects had benign breakthrough HBV infection with isolated anti-HBc
seroconversion [33].
36. Universal neonatal HBV vaccination programme has been in place in Hong Kong
since 1988. The coverage rate for the birth dose of HBV vaccine among infants born
locally from 2010 to 2017 was consistently above 99% (unpublished DH data). There
is generally a slight decline in the coverage rate for the second or the third dose. The
drop may be related to two factors: some local-births have returned to Mainland after
delivery and did not attend MCHC for services, and some babies received the vaccine
in the private sector instead of MCHC.
37. DH has been conducting immunisation coverage surveys (ICS) every two or three
years starting from 2001 to determine immunisation the coverage rates of all vaccines,
including HBV vaccination among children aged 2 to 5 years and attending pre-primary
institutions including kindergartens and child care centers. Results from ICS
conducted in 2001, 2003, 2006, 2009 and 2012 confirmed high coverage rates of
hepatitis B vaccination [34, 35, 36]. In the latest round of ICS conducted in 2015
(unpublished DH data), a total of 8723 children enrolled in 51 pre-primary institutions
participated in the survey, reaching an overall response rate of 81.3%. Similar to
previous years, the 2015 survey demonstrated a satisfactorily high coverage rate of
HBV vaccination (Box 44).
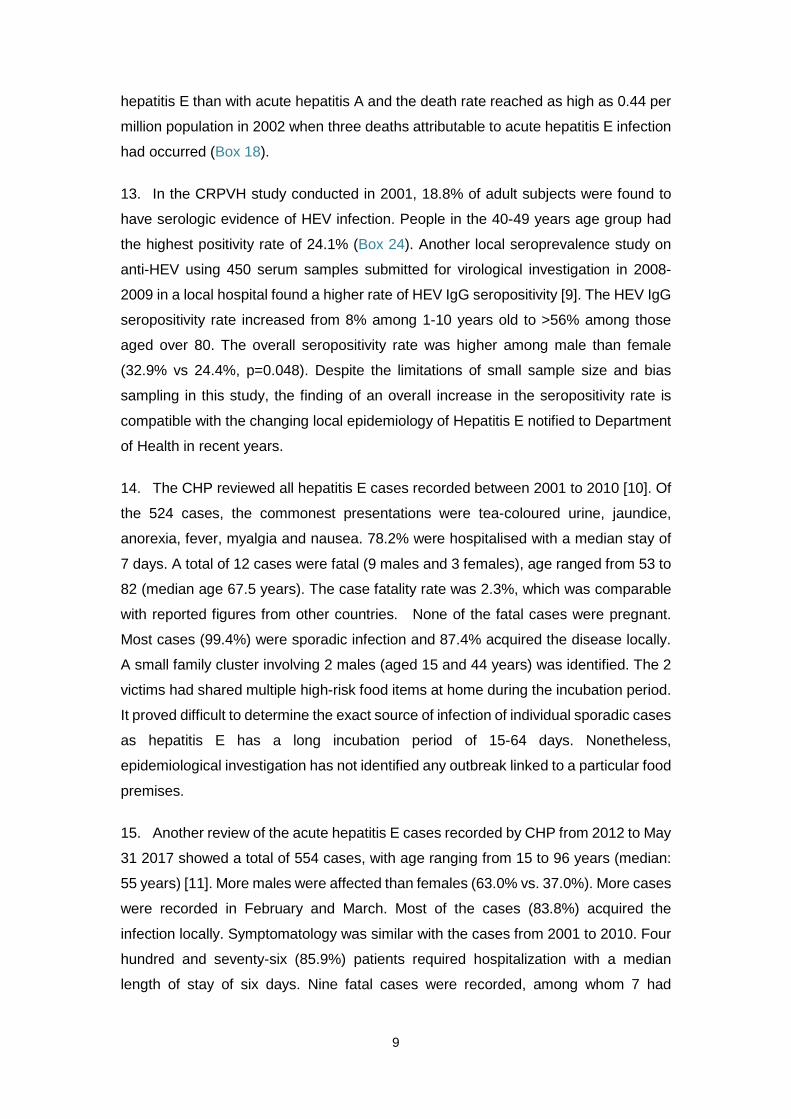
38. Apart from universal neonatal HBV vaccination programme, supplementary
Primary 6 vaccination programme was introduced in 1998. The coverage rate for three
doses of HBV vaccine had been consistently above 99% in the past decade but
showed a slight decline in 2015/16 to 97.9% for the third dose. Of note, this coincided
with a change of survey methodology in 2015 and an underestimation of the actual
coverage was possible (Box 45). With a high coverage of the neonatal HBV

17
vaccination programme, the number of Primary 6 students eligible for HBV vaccination
continued to decrease in the past decade (from 17 171 in 2000/01 to 707 in 2016/17).
The number of students who did not receive the third dose vaccination remained stable
at a few hundred per year.
39. In 2009, a HBsAg seroprevalence study was conducted among 1913 children
aged 12 to 15 years (unpublished DH data). The study found an HBsAg
seroprevalence of 0.78% (95% confidence interval 0.39-1.16%, Box 46) in these
children who were born after the implementation of universal neonatal HBV
vaccination programme. This result showed that Hong Kong had already achieved a
time-bound goal of reducing chronic HBV infection rate to less than 2% among 5 year-
old children by the year of 2012, as set by the Western Pacific Regional Office (WPRO)
of the WHO. In July 2011, Hong Kong was verified by WPRO as having successfully
achieved the goal of HBV control. Based on the same study findings, Hong Kong was
also verified as of June 2013 as having met the goal of achieving a seroprevalence of
less than 1%.
40. In the CRPVH 2001 study, about 16% of the telephone-interviewed subjects
reported a history of HBV vaccination, with a higher frequency in persons below 50
years of age. Some 83% of them reported having completed the vaccination course.
Over 99% had the cost paid by them or borne by their employers. In another recent
local survey by face-to-face questionnaire interview on over 1900 adult Chinese, fifty-
eight percent (n=1151) of the subjects had been tested for HBV during adulthood.
Among those tested negative for HBV infection, fifty-eight percent (n=506) of them
reported subsequent HBV vaccination [37]. Age, occupation, having children, and
family monthly income, were independent factors associated with vaccination in the
study. Overall, the persistent significant level of HBsAg seroprevalence in the local
population, though declining, means a significant disease burden in the years to come.
Current Situation of Hepatitis C
41. From 2002 to 2017, a total of 127 cases of acute hepatitis C infection were
reported to DH under the statutory notification system (Box 1), with one to fourteen
cases reported annually from 2002 to 2015, and a record high of 39 cases in 2016. A
review by the Centre for Health Protection entitled “Hepatitis C in Hong Kong, 2008 to
2011” [38] showed that among the 22 laboratory confirmed acute hepatitis C cases
reported to DH from January 2008 to October 2011, there were 17 males and 5

18
females, most (86%) acquired the infection locally. The median age was 47.5 years.
Majority (86%) was ethnic Chinese. Five (23%) of them reported history of injecting
drug use while no particular risk factor was identified for the remaining cases.
42. Of the 39 cases in 2016, 31 were male (79%), with age ranged from 23 to 94
years (median: 42 years). Thirteen (33%) required hospitalisation and no fatalities
were recorded. With regard to the potential risk exposures, one case reported having
tattoo procedure and two cases were identified as injecting drug users. Two cases
reported to have sexual partners who were HCV carriers. Among the 31 male cases
reported, 23 (74%) were known men who have sex with men. There was also one
case who had history of repeated hospital admissions and had received multiple
transfusions of blood product during the incubation period. Epidemiological
investigation and contact tracing did not identify other acute hepatitis C cases and the
source of infection in this case could not be determined. For the rest of the cases, no
epidemiological linkage was identified and all cases were regarded as sporadic. There
have been overseas reports of rising incidence of sexual transmission of HCV among
men who have sex with men [39]. Further study and monitoring is required of the
possibility that this is also the case for Hong Kong.
43. Although HCV shares similar transmission routes with hepatitis B, the
epidemiology of two infections are different in Hong Kong. While HBV is still prevalent
in many populations in Hong Kong, HCV prevails only in isolated communities.
44. Data from new blood donors who were mostly adolescents and young adults in
the last decade suggested that HCV prevalence was around 0.1% locally, with the
figure in 2017 being 0.06% (95% confidence interval; 0.03 - 0.08%) (Box 47). Findings
of the household study of the entire spectrum of adult age groups conducted in 2001
further supported the uncommon occurrence of HCV infection among general
population in Hong Kong; the overall positive rate was 0.3% in 936 subjects (95%
confidence interval, 0.07%-0.94%) (Box 49). From 1999 to 2016, 10 of 2294 (0.4%)
clients who attended the Therapeutic Prevention Clinic (TPC) at Integrated Treatment
Centre (ITC) of CHP, DH for post-exposure management were tested positive for anti-
HCV. Nine (90%) cases were non-HCW and all cases were already HCV infected at
time of injury (Box 50).
45. From studies published in the early 1990s, it was shown that anti-HCV was more
commonly found in injecting drug users (IDU, 66.8%), haemophilia (56%),
haemodialysis (4.6%) and other patients requiring frequent blood/blood product

19
transfusions but not persons at risk through sexual contact [40]. In a more recent
analysis of HCV positive blood donors, of those with identifiable risk factors, history of
blood transfusion (43.7%) was the most common risk factor, followed by intravenous
drug use (34.9%) and tattoo (28.6%). The source of infection was unknown in more
than half of the respondents in the study [41].
46. A survey in 2011 of haemophiliacs under local public care found 100 of 222
patients (45%) infected with hepatitis C [42]. Another study conducted for 51
haemodialysis patients found that 8 (16%) were positive for anti-HCV by second
generation enzyme immunoassay and 1 (2%) for HCV RNA alone, giving an overall
infection rate of 18% [43]. This study also found a new infection rate of 4.9% per
patient-year upon longitudinal follow up of 19 months.
47. Injecting drug use has been an important route of HCV acquisition. Results of
testing non-random samples from drug users under treatment showed a HCV positive
rate of 74% in 1988/1989 and 46% in 2000/2001 (Box 51). An HCV seroprevalence
study in 2006 conducted in methadone clinics targeting IDU echoed the high
prevalence rate of HCV in this community [44]. Of 567 IDU participants recruited in
2006, the prevalence of anti-HCV was 85% (95% confidence interval 82.5 – 88.3%).
Another study in 2011 involving 622 IDU recruited at their gathering places found a
similar figure of 81.7% (95% confidence interval 78.6 - 84.7%) infected with HCV [45].
In this study, the majority (84.7%) were male with a median age of 53 years. The
median heroin injection duration was 25 years. Injection duration, current or recent
injection, ever sharing injecting equipment and concomitant use of other drugs e.g.
midazolam were independent factors associated with HCV infection in the two studies.
In the recent New Life New Liver Project, which provided targeted HCV screening and
education to ex-IDU in the community, 56% of 234 subjects screened were HCV
positive. The number needed to screen to detect one patient with positive HCV was
1.8 (95% confidence interval 1.6-2.0) [46].
48. HIV/AIDS patients, with a proportion being IDU, is another group with consistent
data showing a comparatively high HCV prevalence (Box 52, 53). From 2000 to 2017,
HCV/HIV coinfection among new patients attending ITC ranged from 1.5% to 24.8%.
The decreasing trend of anti-HCV seroprevalence was largely attributed to the
decreasing proportion of new patients acquiring HIV via injecting drug use. The
prevalence rate appears to be higher in male than female patients, likely related to the
differential risk of parenteral and blood product exposure (Box 52). While HCV

20
infection was present in 1.7–6.3% of HIV/AIDS patients infected due to sexual contact,
HCV was nearly universal in patients infected through drug injection (Box 53). It should
be noted that, among male patients who acquired HIV via heterosexual contact and
tested anti-HCV positive, 60.0% (30 out of 50 subjects) had a past history of injecting
drug use (Box 53). Among those heterosexual male HIV infected patients without
history of injecting drug use, the prevalence of anti-HCV was 3%.
49. There has been overseas data supporting sexual transmission of HCV among
HIV-infected men who have sex with men [47]. The anti-HCV prevalence of subjects
who contracted HIV via homosexual or bisexual contact in the ITC HIV/AIDS patient
cohort has remained below 2% from screening since 2005. However, this figure has
shown an increasing trend since 2012 with the number of individuals with HCV/HIV
coinfection at the time of HIV diagnosis rising from 16 (1.3%) in 2013, to 50 (2.1%) in
2017 (Box 53).
50. From July to November 2013, ITC identified seven cases of recent HCV infection
in Chinese HIV-infected MSM [48]. Five of the seven cases were also diagnosed to
have recent syphilis infection during the period. None of them had history of injecting
drug use. Phylogenetic analyses revealed that all cases belonged to the same
genotype (genotype 3) although investigation showed no apparent linkage on their
sexual exposure. An analysis on HIV-infected MSM attending ITC who had HCV
seroconversion in the period 1999-2013 was subsequently performed [49]. Fourteen
(1.1%) patients seroconverted, with an overall incidence rate of 0.22 per 100 patient-
years. The incidence rate increased from 0.13 per 100 patient-years before 2002 to
0.19 per 100 patient years in 2002-2007 and 0.47 per 100 patient-years in 2008-2013.
Genotype 3 was most commonly detected. Compared with the non-seroconverters,
the seroconverters were of higher education level and had prior history of sexually
transmitted infection. The overall higher HCV prevalence, and the increasing incidence
of HCV among HIV-positive MSM, coupled with the hastened liver disease progression
in HIV-infected patients [50], would no doubt result in a unique HCV/HIV coinfection
that demands further attention.
51. Since 2003, laboratory surveillance for HCV in Hong Kong was enhanced to
monitor the trend of anti-HCV among selected population groups, including blood
donors from HKRCBTS, and selected in-patients from the Princess Margaret Hospital
(PMH) and Prince of Wales Hospital (PWH, joined since 2005). Some 180,000-
260,000 new and repeated blood donors of HKRCBTS were tested for anti-HCV each

21
year, among which the prevalence was consistently low at less than 0.1% since 2003.
Whereas among the selected hospital patients tested in the past eleven years, the
overall anti-HCV prevalence was 2.3% (Box 54). Anti-HCV was most commonly found
in drug users, of which 51.8% were found positive, followed by patients with history of
blood transfusion at 9.0%. Overall, the male-to-female ratio of HCV positive subjects
was about 2.3 to 1, with a mean age of 51.4 years old (Box 55).
Genotypes of Hepatitis C 52. Genotypic studies in Hong Kong has identified that 1b and 6a were the prevalent
HCV genotypes locally, a scenario different from that in western countries where 1a
predominated [51]. In an early study of 212 blood donors tested anti-HCV positive from
1991 to 1994, the commonest genotype found was 1b (58.8%), followed by 6a (27.0%)
[52]. In another study of hospitalized patients with HCV testing for clinical indications
1b was the commonest type found in patients with chronic liver diseases and chronic
renal failure [53]. According to a local study of patients on renal replacement therapy,
the predominant genotype was 1b, followed by 1a and 6a [54]. Yet, the commonest
genotype in intravenous drug users was genotype 6. A retrospective analysis of 106
intravenous drug users and 949 non-drug users with samples collected between
December 1998 and May 2004 also confirmed the significant high prevalence of
genotype 6a in drug users (58.5%) followed by 1b (33.0%), in contrast to 63.6% for 1b
and 23.6% for 6a in non-drug users [55]. Besides intravenous drug use, age and sex
were independent factors associated with HCV genotypes in this study. In a
methadone clinic-based study published in 2011, out of 273 IDUs with different periods
of initiating injection, 52% had genotype 6a and 38% had 1b. Both genotypes 1b and
6a were prevalent among older injectors, while subtype 3a was more common in
young injectors and those initiating injection more recently during 1995-2006.
Moreover, phylogenetic analysis revealed no specific clustering of any subtype or
genotype, which did not suggest any outbreak of HCV among the study population.
The extensive use of methadone widely available since 1980s may have protected
Hong Kong from the emergence of HCV clusters among injection drug users [56].
53. For the HIV-infected MSM attending ITC who were diagnosed with acute HCV
infection between 2009 to 2014, genotype 3a was the most prevalent (63.6%),
followed by 1a (18.2%) and 6a (9.1%). The high prevalence of genotype 3a in MSM
was in stark contrast to its rarity among HCV-infected IDU in Hong Kong. Phylogenetic
analyses revealed a monophyletic HCV-3a cluster with members all diagnosed

22
between 2013 and 2014, and a homologous pair with HCV-6a genotype. However,
there was no temporal or genetic clustering of the corresponding HIV sequences [57].
54. The natural history of 138 HCV genotype 1 patients (median age: 50 years) was
compared with that of 78 HCV genotype 6 patients (median age: 46.5 years) in Queen
Mary Hospital [58]. Both genotypes share a similar natural history based on liver
biochemistry, HCV viral load, and probability of cirrhotic complications and mortality
after a median follow-up period of over 5 years.
Liver Cancer – Major Morbidity and Mortality from Viral Hepatitis
55. Chronic HBV and HCV infection are important risk factors for cirrhosis and liver
cancer. Globally 788 000 people died of liver cancer in 2015, and HBV and HCV
accounted for approximately 80% of liver cancer cases [59]. Local studies showed that
75-80% of hepatocellular cancers in Hong Kong were related to chronic HBV infection,
and 3-6% cases were related to chronic HCV infection. HBV and HCV co-infection
accounted for another 0.4-3% [60]. Among 76 liver transplants performed in Queen
Mary Hospital due to cirrhosis from 1999 to 2000, 51 and 7 were related to hepatitis B
and C respectively [61].
56. Apart from chronic HBV and HCV infection, other risk factors for liver cancer
include excessive alcohol consumption and consumption of aflatoxin contaminated
food. In Hong Kong, the age-standardised incidence rate and death rate of liver cancer
is higher in male.
57. According to the data from the Hong Kong Cancer Registry [62], liver cancer,
including neoplasm of liver and intrahepatic bile ducts, was the fourth commonest
cancer in men and tenth commonest cancer in women in 2016. There were 1810 new
registered cases of liver cancer, with 1391 cases of males and 419 cases of females
(male to female ratio was about 3.3 to 1). There was a downward trend for the age-
standardized incidence rate for both male and female in the past decade (Box 57).
The figures were 23 for male and 5.7 for female per 100 000 standard population in
2016.
58. In 2016, liver cancer was the third leading cause of cancer deaths in Hong Kong.
There were 1540 registered mortality from liver cancer. There was a downward trend
for the age-standardized mortality rate for both sexes in the past decade (Box 59). The
figures were 18 for male and 4.9 for female per 100 000 standard population in 2016
[62].

23
SURVEILLANCE OF VIRAL HEPATITIS IN HONG KONG
2017 UPDATE
Acute viral hepatitis under the disease notification system
Tabulated results Box Title Page Box 1. Number of cases of viral hepatitis reported to the Department of
Health between 1974 and 2017 (Data source: CHP, DH) 24
Box 2. Reported cases of viral hepatitis from 1966 to 2017 (Data source: CHP, DH)
25
Box 3. Breakdown of viral hepatitis by aetiology reported from 1996 to 2017 (Data source: CHP, DH)
26
Hepatitis A Box 4. Number of hepatitis A cases reported from 2003 to 2017 (Data
source: CHP, DH) 27
Box 5. Sex distribution of hepatitis A cases reported from 2003 to 2017 (Data source: CHP, DH)
28
Box 6. Age distribution by proportion of reported cases of hepatitis A, 1989-2017 (Data source: CHP, DH)
29
Box 7. Notification rates and death rates of hepatitis A, 1988 - 2017 (Data source: CHP, DH)
30
Hepatitis B Box 8. Number of hepatitis B cases reported from 1995 to 2017 (Data
source: CHP, DH) 31
Box 9. Sex distribution of hepatitis B cases reported from 1995 to 2017 (Data source: CHP, DH)
32
Box 10. Age distribution of hepatitis B cases reported from 1995 to 2017 (Data source: CHP, DH)
33
Hepatitis C Box 11. Number of hepatitis C cases reported from 2002 to 2017 (Data
source: CHP, DH) 34
Box 12. Sex distribution of hepatitis C cases reported from 2005 to 2017 (Data source: CHP, DH)
35
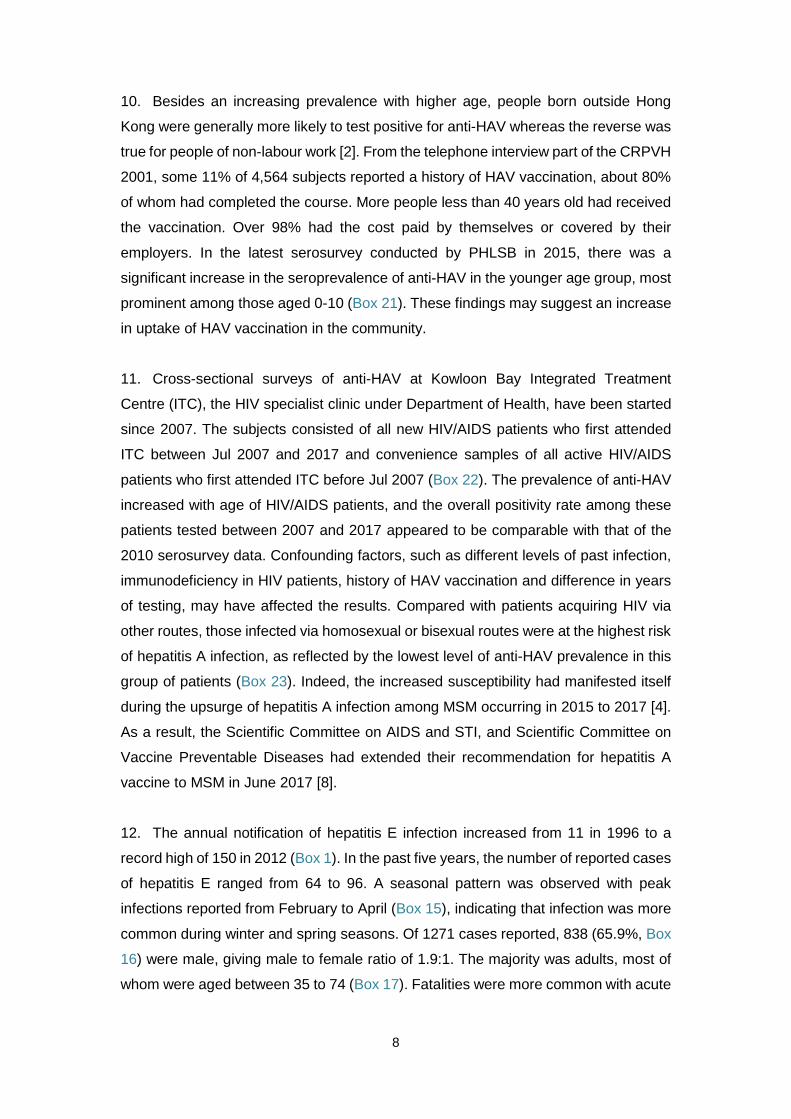
Box 13. Age distribution of hepatitis C cases reported from 2005 to 2017 (Data source: CHP, DH)
36
Hepatitis E Box 14. Number of reported hepatitis E cases reported from 1996 to
2017 (Data source: CHP, DH) 37
Box 15. Mean and median plot of reported cases of hepatitis E by month from 1997 to 2017 (Data source: CHP, DH)
38
Box 16. Sex distribution of hepatitis E cases reported from 1996 to 2017 (Data source: CHP, DH)
39
Box 17. Age distribution by proportion of reported cases of hepatitis E from 1996 to 2017 (Data source: CHP, DH)
40
Box 18. Notification rates and death rates of hepatitis E from 1996 to 2017 (Data source: CHP, DH)
41

24
Box 1. Number of cases of viral hepatitis reported to the Department of Health between 1974 and 2017 (Data source: CHP, DH)
Year A B NANB C E
Un-classifie
d
Hepatitis (not elsewhere
classified) Total
1974 notifiable since 1974 639
1975 1761 1976 969 1977 1008 1978 1230 1979 964 1980 1554 1981 1738 1982 1814 1983 1783 1984 1780 1985 1601 1986 1425 1987 1554 1988 1187 250 465 496 2398 1989 618 136 154 324 1232 1990 1362 178 183 261 1984 1991 1297 150 200 154 1801 1992 3626 157 301 273 4357 1993 874 116 203 80 1273 1994 557 112 125 41 835 1995 491 102 55 18 666 1996 264 144 - - 11 - 58 477 1997 595 100 - - 4 - 37 736 1998 474 145 - - 16 - 29 664 1999 426 152 - - 8 - 31 617 2000 505 137 - - 11 - 30 683 2001 494 134 - - 26 - 23 677 2002 267 121 - 4 28 - 10 430 2003 107 98 - - 19 - 8 232 2004 121 134 - 1 38 - 6 300 2005 64 105 - 1 34 - 0 204 2006 76 123 - 2 34 - 0 235 2007 69 74 - 1 65 - 0 209 2008 71 83 - 3 90 - - 247 2009 64 80 - 3 73 - - 220 2010 65 73 - 11 118 - - 267 2011 46 70 - 5 119 - - 240 2012 43 47 - 3 150 - - 243 2013 44 40 - 10 90 - - 184 2014 46 41 - 12 93 - - 192 2015 138 29 - 14 84 - - 265 2016 98 37 - 39 96 - - 270 2017 117 33 - 18 64 - - 232

25
Box 2. Reported cases of viral hepatitis from 1966 to 2017 (Data source: CHP, DH)
Case definition: Hepatitis A – positive for anti-HAV IgM Hepatitis B – positive for anti-HBc IgM Hepatitis C – positive for anti-HCV Hepatitis E - positive for anti-HEV
0
500
1972
1973
1974
1975
1976
1977
1978
1979
1980
1981
1982
1983
1984
1000
1500
2000
2500
3000
3500
4000
4500
5000
1966
1967
1968
1969
1970
1971
1985
1986
1987
1988
1989
1990
1991
1992
1993
1994
1995
1996
1997
1998
1999
2000
2001
2002
2003
2004
2005
2006
2007
2008
2009
2010
2011
2012
2013
2014
2015
2016
2017
No.
of c
ases
repo
rted
Year
A
B
NANB
C
E
Un-classified
Hepatitis (not elsewhere classified)
Total

26
Box 3. Breakdown of viral hepatitis by aetiology reported from 1996 to 2017 (Data source: CHP, DH)
0
100
200
300
400
500
600
700
800
1996 1997 1998 1999 2000 2001 2002 2003 2004 2005 2006 2007 2008 2009 2010 2011 2012 2013 2014 2015 2016 2017
No.
of c
ases
repo
rted
Year
A
B
C
E
Hepatitis (notelsewhere classified)
Total

27
HEPATITIS A Box 4. Number of hepatitis A cases reported from 2003 to 2017 (Data source: CHP, DH)
107
121
64
76
69
71
6465
4643 44
46
138
98
117
0
20
40
60
80
100
120
140
160
2003 2004 2005 2006 2007 2008 2009 2010 2011 2012 2013 2014 2015 2016 2017
No.
of c
ases
repo
rted
Year
Hepatitis A

28
HEPATITIS A
Box 5. Sex distribution of hepatitis A cases reported from 2003 to 2017 (Data source: CHP, DH)
2003 2004 2005 2006 2007 2008 2009 2010 2011 2012 2013 2014 2015 2016 2017 TotalFemale 39 42 24 33 28 32 29 37 19 17 23 24 63 30 28 468Male 68 79 40 43 41 39 35 28 27 26 21 22 75 68 89 701Total 107 121 64 76 69 71 64 65 46 43 44 46 138 98 117 1169
0%
10%
20%
30%
40%
50%
60%
70%
80%
90%
100%
Year

29
HEPATITIS A
Box 6. Age distribution by proportion of reported cases of hepatitis A, 1989-2017 (Data source: CHP, DH)
1989 1990 1991 1992 1993 1994 1995 1996 1997 1998 1999 2000 2001 2002 2003 2004 2005 2006 2007 2008 2009 2010 2011 2012 2013 2014 2015 2016 2017>84 0% 0% 0% 0% 0% 0% 0% 0% 0% 0% 0% 0% 0% 0% 0% 0% 0% 3% 0% 1% 0% 0% 0% 0% 0% 0% 0% 1% 0%75-84 0% 0% 0% 0% 0% 0% 0% 0% 0% 0% 0% 0% 0% 0% 1% 1% 0% 5% 6% 0% 0% 2% 7% 0% 2% 0% 1% 0% 2%65-74 0% 0% 0% 0% 0% 0% 0% 0% 0% 0% 0% 1% 1% 1% 0% 2% 3% 1% 1% 0% 0% 0% 2% 2% 2% 2% 2% 0% 0%55-64 0% 0% 0% 0% 0% 0% 0% 0% 0% 0% 0% 1% 0% 1% 3% 1% 2% 3% 1% 3% 3% 3% 2% 5% 7% 4% 4% 4% 4%45-54 1% 1% 1% 1% 1% 2% 2% 2% 2% 2% 2% 3% 1% 2% 3% 5% 8% 5% 3% 8% 2% 12% 11% 7% 11% 11% 13% 16% 19%35-44 2% 7% 7% 6% 7% 5% 8% 7% 10% 9% 12% 14% 14% 16% 27% 31% 25% 21% 30% 20% 22% 26% 17% 9% 27% 20% 23% 19% 27%25-34 33% 36% 39% 34% 36% 35% 34% 36% 38% 38% 37% 38% 38% 36% 37% 28% 33% 32% 35% 27% 41% 26% 35% 35% 20% 28% 28% 41% 33%15-24 46% 44% 45% 43% 45% 44% 40% 38% 37% 38% 34% 35% 34% 36% 22% 25% 16% 18% 13% 15% 20% 15% 9% 12% 11% 15% 21% 11% 9%5-14 13% 9% 9% 11% 10% 13% 15% 16% 11% 12% 13% 7% 11% 7% 6% 7% 14% 11% 9% 20% 13% 14% 15% 30% 14% 20% 5% 6% 5%<5 3% 1% 0% 5% 1% 1% 1% 2% 2% 1% 1% 1% 1% 0% 1% 1% 0% 1% 1% 6% 0% 2% 2% 0% 5% 0% 2% 1% 1%
0%10%20%30%40%50%60%70%80%90%
100%
Year

30
HEPATITIS A
Box 7. Notification rates and death rates of hepatitis A, 1988 - 2017 (Data source: CHP, DH)
0
0.1
0.2
0.3
0.4
0.5
0.6
0.7
0.8
0
10
20
30
40
50
60
70
1988
1989
1990
1991
1992
1993
1994
1995
1996
1997
1998
1999
2000
2001
2002
2003
2004
2005
2006
2007
2008
2009
2010
2011
2012
2013
2014
2015
2016
2017
Death rate Notification rate (per 100 000 population)
Year
Notification rate(per 100 000 popn)
Death rate(per Mn popn)
(per 1 000 000 population)

31
HEPATITIS B
Box 8. Number of hepatitis B cases reported from 1995 to 2017 (Data source: CHP, DH)
102
144
100
145152
137 134121
98
134
105
123
74
83 80 7370
47
4041
29
37
33
0
20
40
60
80
100
120
140
160
1995 1996 1997 1998 1999 2000 2001 2002 2003 2004 2005 2006 2007 2008 2009 2010 2011 2012 2013 2014 2015 2016 2017
No.
of c
ases
repo
rted
Year
Hepatitis B

32
HEPATITIS B Box 9. Sex distribution of hepatitis B cases reported from 1995 to 2017 (Data source: CHP, DH)
1995 1996 1997 1998 1999 2000 2001 2002 2003 2004 2005 2006 2007 2008 2009 2010 2011 2012 2013 2014 2015 2016 2017 TotalFemale 28 38 27 36 39 32 27 35 33 31 26 36 15 17 24 13 23 12 10 13 7 14 13 549Male 74 106 73 109 113 105 107 86 65 103 79 87 59 66 56 60 47 35 30 28 22 23 20 1553Total 102 144 100 145 152 137 134 121 98 134 105 123 74 83 80 73 70 47 40 41 29 37 33 2102
0%
10%
20%
30%
40%
50%
60%
70%
80%
90%
100%
Year

33
HEPATITIS B Box 10. Age distribution of hepatitis B cases reported from 1995 to 2017 (Data source: CHP, DH)
1995 1996 1997 1998 1999 2000 2001 2002 2003 2004 2005 2006 2007 2008 2009 2010 2011 2012 2013 2014 2015 2016 2017>=65 0% 2% 2% 1% 3% 2% 1% 2% 4% 1% 5% 3% 3% 2% 5% 7% 6% 4% 8% 2% 3% 3% 3%55-64 3% 3% 3% 3% 3% 4% 1% 7% 6% 3% 9% 5% 7% 5% 11% 4% 11% 6% 3% 17% 7% 8% 9%45-54 7% 9% 9% 10% 12% 6% 13% 14% 7% 13% 13% 13% 22% 17% 18% 23% 17% 26% 25% 10% 24% 24% 21%35-44 13% 19% 21% 22% 19% 23% 22% 21% 26% 25% 24% 24% 31% 30% 25% 34% 29% 30% 35% 39% 31% 24% 48%25-34 33% 31% 31% 32% 32% 35% 31% 24% 33% 34% 29% 37% 28% 39% 30% 32% 31% 26% 23% 32% 28% 32% 18%15-24 43% 33% 32% 30% 29% 28% 31% 31% 24% 23% 21% 18% 9% 7% 11% 0% 6% 9% 8% 0% 7% 8% 0%<1-14 1% 3% 2% 3% 2% 1% 1% 1% 0% 0% 0% 0% 0% 0% 0% 0% 0% 0% 0% 0% 0% 0% 0%
0%
10%
20%
30%
40%
50%
60%
70%
80%
90%
100%
Year

34
HEPATITIS C
Box 11. Number of hepatitis C cases reported from 2002 to 2017 (Data source: CHP, DH)
40 1 1 2 1
3 3
11
5
310
1214
39
18
05
1015202530354045
2002 2003 2004 2005 2006 2007 2008 2009 2010 2011 2012 2013 2014 2015 2016 2017
No.
of c
ases
repo
rted
Year
Hepatitis C

35
HEPATITIS C
Box 12. Sex distribution of hepatitis C cases reported from 2005 to 2017 (Data source: CHP, DH)
2005 2006 2007 2008 2009 2010 2011 2012 2013 2014 2015 2016 2017 TotalFemale 1 1 0 0 1 3 1 1 0 1 0 8 1 18Male 0 1 1 3 2 8 4 2 10 11 14 31 17 104Total 1 2 1 3 3 11 5 3 10 12 14 39 18 122
0%
10%
20%
30%
40%
50%
60%
70%
80%
90%
100%
Year
36
HEPATITIS C
Box 13. Age distribution of hepatitis C cases reported from 2005 to 2017 (Data source: CHP, DH)
2005 2006 2007 2008 2009 2010 2011 2012 2013 2014 2015 2016 2017>=65 0% 50% 0% 0% 33% 18% 0% 0% 10% 0% 0% 13% 0%55-64 0% 0% 100% 33% 67% 18% 0% 0% 20% 8% 0% 5% 11%45-54 100% 0% 0% 0% 0% 18% 60% 67% 10% 25% 7% 15% 22%35-44 0% 50% 0% 67% 0% 18% 20% 33% 40% 33% 29% 26% 17%25-34 0% 0% 0% 0% 0% 18% 0% 0% 10% 33% 57% 31% 39%15-24 0% 0% 0% 0% 0% 9% 20% 0% 10% 0% 7% 10% 11%<1-14 0% 0% 0% 0% 0% 0% 0% 0% 0% 0% 0% 0% 0%
0%
10%
20%
30%
40%
50%
60%
70%
80%
90%
100%
Year

37
HEPATITIS E
Box 14. Number of reported hepatitis E cases reported from 1996 to 2017 (Data source: CHP, DH)
11
4
16 811
26 28
19
38
3434
65
90
73
118119
150
90
93
84
96
64
0
20
40
60
80
100
120
140
160
1996 1997 1998 1999 2000 2001 2002 2003 2004 2005 2006 2007 2008 2009 2010 2011 2012 2013 2014 2015 2016 2017
No.
of c
ases
repo
rted
Year
Hepatitis E

38
HEPATITIS E
Box 15. Mean and median plot of reported cases of hepatitis E by month from 1997 to 2017 (Data source: CHP, DH)
0.0
2.0
4.0
6.0
8.0
10.0
12.0
Jan Feb Mar Apr May Jun Jul Aug Sep Oct Nov Dec
Mean
Median

39
HEPATITIS E
Box 16. Sex distribution of hepatitis E cases reported from 1996 to 2017 (Data source: CHP, DH)
1996 1997 1998 1999 2000 2001 2002 2003 2004 2005 2006 2007 2008 2009 2010 2011 2012 2013 2014 2015 2016 2017 TotalFemale 0 1 1 0 3 7 11 5 11 5 15 20 29 30 40 42 53 36 34 29 31 30 433Male 11 3 15 8 8 19 17 14 27 29 19 45 61 43 78 77 97 54 59 55 65 34 838Total 11 4 16 8 11 26 28 19 38 34 34 65 90 73 118 119 150 90 93 84 96 64 1271
0%
10%
20%
30%
40%
50%
60%
70%
80%
90%
100%
Year

40
HEPATITIS E
Box 17. Age distribution by proportion of reported cases of hepatitis E from 1996 to 2017 (Data source: CHP, DH)
1996 1997 1998 1999 2000 2001 2002 2003 2004 2005 2006 2007 2008 2009 2010 2011 2012 2013 2014 2015 2016 2017>84 0% 0% 0% 0% 0% 4% 0% 0% 3% 0% 0% 0% 0% 1% 0% 0% 1% 0% 2% 2% 2% 3%75-84 9% 0% 0% 0% 0% 4% 0% 11% 18% 6% 9% 3% 9% 10% 8% 7% 12% 10% 9% 5% 6% 5%65-74 0% 0% 0% 13% 9% 12% 18% 16% 13% 12% 21% 5% 13% 11% 16% 8% 11% 14% 11% 19% 23% 16%55-64 0% 0% 13% 25% 27% 15% 14% 16% 13% 24% 9% 14% 12% 23% 24% 27% 24% 33% 28% 31% 24% 19%45-54 9% 25% 25% 25% 9% 23% 32% 16% 24% 32% 29% 38% 32% 27% 26% 29% 25% 23% 32% 24% 19% 25%35-44 36% 25% 38% 13% 9% 27% 25% 32% 18% 12% 21% 29% 16% 15% 13% 19% 19% 9% 13% 12% 13% 25%25-34 36% 50% 19% 25% 45% 15% 11% 11% 11% 15% 3% 6% 12% 8% 11% 8% 7% 4% 5% 6% 10% 6%15-24 9% 0% 6% 0% 0% 0% 0% 0% 0% 0% 6% 3% 4% 4% 2% 2% 0% 6% 0% 1% 3% 2%5-14 0% 0% 0% 0% 0% 0% 0% 0% 0% 0% 0% 2% 1% 0% 0% 0% 0% 0% 0% 0% 0% 0%<5 0% 0% 0% 0% 0% 0% 0% 0% 0% 0% 3% 0% 0% 0% 0% 0% 0% 0% 0% 0% 0% 0%
0%10%20%30%40%50%60%70%80%90%
100%
Year

41
HEPATITIS E
Box 18. Notification rates and death rates of hepatitis E from 1996 to 2017 (Data source: CHP, DH)
0
0.05
0.1
0.15
0.2
0.25
0.3
0.35
0.4
0.45
0.5
0
0.5
1
1.5
2
2.5
1996 1997 1998 1999 2000 2001 2002 2003 2004 2005 2006 2007 2008 2009 2010 2011 2012 2013 2014 2015 2016 2017
Death rate (per Mn popn)
Notification rate(per 100 000 popn)
Year
Notification rate(per 100 000 popn)
Death rate(per Mn popn)

42
SURVEILLANCE OF VIRAL HEPATITIS IN HONG KONG
2017 UPDATE
Seroprevalence of hepatitis A and hepatitis E Tabulated results
Box Title Page
Box 19. Prevalence of anti-HAV in a collection of studies/testing between 1978 and 2009 (Data sources: Multiple sources)
43
Box 20. Prevalence of anti-HAV in participants of Community Research Project for Viral Hepatitis (CRPVH) 2001 (Data source: DH)
44
Box 21. Prevalence of anti-HAV in individuals with blood collected for serological diagnosis of conditions unrelated to hepatitis (Data source: PHLSB, CHP, DH)
44
Box 22. Prevalence of anti-HAV at baseline screening of HIV/AIDS patients attending ITC from Jul 2007 to 2017 (Data source: ITC, CHP, DH)
45
Box 23. Prevalence of anti-HAV per HIV risk at baseline screening of HIV/AIDS patients attending ITC from Jul 2007 to 2017 (Data source: ITC, CHP, DH)
46
Box 24. Prevalence of anti-HEV in participants of Community Research Project for Viral Hepatitis (CRPVH) 2001 (Data source: DH)
47

43
HEPATITIS A Box 19. Prevalence of anti-HAV in a collection of studies/testing between 1978 and 2009 (Data sources: Multiple sources)
Age groups 1978 1987 1989 1993^ 1995 1996 1998 2000 2001 2001 2002 2003 2004 2005 2006 2007 2008 2009
0 – 20 12.9% (0 - 10) 44.8% (11 - 20)
5.3% (0 - 10) 17.1% (11 - 20)
6.8% (0 - 10) 11.2% (11 - 20)
59.4% (M) 53.3% (F) 8.3% - (0 - 10)
7.0% (11 - 20) 6.1% 5.4% 9.3% 4.58% - (0 - 10) 12.5% (11 - 20) 5.3% 10.3% 14.7% 15.4% 20.0% 14.3% 16.7% 25.0%
21 – 30 75.0% 53.8% 58.8% 59.4% (M) 53.3% (F) 11.3% - 11.8% 7.6% 17.5% 13.2% 26.8% 12.6% 13.2% 21.0% 28.2% 25.8% 19.4% 26.3% 30.3%
31 – 40 82.9% 85.1% 83.5% 59.4% (M) 53.3% (F) 49.0% - 37.7% 40.8% 35.0% 41.3% 53.2% 46.7% 52.4% 43.8% 35.7% 50.0% 37.5% 47.4% 36.4%
>40 91.1% 94.7% 91.1% (41 - 50) 93.9% (>50)
94.5% (M) 91.0% (F) 70.5% - 58.6% 66.7% 60.0% 71.1% 88.3% (41 - 50)
97.7% (>50) 58.1% 100.0% 50.0% 72.7% 80.0% 62.5% 71.4% 26.7%
Data source A B C D E F E E E E G E E E E E E E E
^Figure is the average of age 0 – 40
Data sources:
A. Study on left-over sera of 362 subjects, by Tsang et al of the University of Hong Kong [6]
B. Study on stored sera of 702 healthy subjects, by Chin et al of the University of Hong Kong [5]
C. Study on 1028 serum samples collected from individuals attending a health exhibition, by Lim et al of Department of Health. [63]
D. Seroprevalence results reported in the press by Lai et al of the University of Hong Kong. [64]
E. Pre-vaccination screening on students and staff of City University of Hong Kong: 553 (1995), 669 (1996), 608 (1998), 395 (2000), 592 (2001), 371 (2002),
students and staff of Baptist University of Hong Kong 240 (2001), 259 (2002), 153 (2003), 55 (2004), 77 (2005), 53 (2006), 54 (2007), 70(2008),63(2009)
and students and staff of Lingnan University 125 (2003), 84 (2004). [Data from CHC-Group Medical Practice]
F. Seroprevalence study in school children by Lee et al of the Chinese University of Hong Kong. [65]
G. Community Research Project on Viral Hepatitis 2001. [2]

44
HEPATITIS A
Box 20. Prevalence of anti-HAV in participants of Community Research Project for Viral Hepatitis (CRPVH) 2001 (Data source: DH)
Age group No. Tested Anti-HAV +ve (%)
18-29 137 27 (19.7%) 30-39 223 116 (52.0%) 40-49 291 248 (85.2%) 50-59 170 161 (94.7%)
60 & over 115 113 (98.3%) All 936 665 (71.0%)
Box 21. Prevalence of anti-HAV in individuals with blood collected for serological diagnosis of conditions unrelated to hepatitis (Data source: PHLSB, CHP, DH)
Year
Age group (years)
0-10 11-20 21-30 31-40 41-50 51-60 >60
No. tested % No.
tested % No. tested % No.
tested % No. tested % No.
tested % No. tested %
2000 420 8 190 19 200 31 190 59 100 95 - - - - 2005 200 8 181 18 187 35 200 54 100 83 100 98 - - 2010 96 16 100 22 100 37 95 54 100 64 100 91 100 100 2015 160 49 162 49 122 53 127 51 99 59 70 86 58 97
Year 2000 Year 2005 Year 2010 Year 20150-10 8% 8% 16% 49%11-20 19% 18% 22% 49%21-30 31% 35% 37% 53%31-40 59% 54% 54% 51%41-50 95% 83% 64% 59%51-60 98% 91% 86%>60 100% 97%
0%
20%
40%
60%
80%
100%
Prev
alen
ceAg
e gr
oup
(yea
rs)
- -
-

45
HEPATITIS A Box 22. Prevalence of anti-HAV at baseline screening of HIV/AIDS patients attending ITC from Jul 2007 to 2017 (Data source: ITC, CHP, DH)
Year (No. of patients) Age No. tested Anti-HAV +ve (%)
2007 Jul-Dec (n=308)
<20 0 0 (0.0%) 20-29 64 28 (43.8%) 30-39 202 89 (44.1%) 40-49 30 17 (56.7%) >=50 12 10 (83.3%)
2008 (n=506)
<20 2 1 (50.0%) 20-29 101 39 (38.6%) 30-39 282 142 (50.4%) 40-49 77 49 (63.6%) >=50 44 42 (95.5%)
2009 (n=228)
<20 2 0 (0.0%) 20-29 58 23 (39.7%) 30-39 91 43 (47.3%) 40-49 52 31 (59.6%) >=50 25 23 (92.0%)
2010 (n=222)
<20 3 0 (0.0%) 20-29 41 18 (43.9%) 30-39 82 49 (59.8%) 40-49 54 34 (63.0%) >=50 42 35 (83.3%)
2011 (n=208)
<20 2 0 (0.0%) 20-29 45 18 (40.0%) 30-39 57 29 (50.9%) 40-49 66 44 (66.7%) >=50 38 34 (89.5%)
2012 (n=361)
<20 6 0 (0.0%) 20-29 64 18 (28.1%) 30-39 105 44 (41.9%) 40-49 111 70 (63.1%) >=50 75 56 (74.7%)
2013 (n=432)
<20 5 2 (40.0%) 20-29 90 21 (23.3%) 30-39 102 44 (43.1%) 40-49 112 65 (58.0%) >=50 123 107 (87.0%)
2014 (n=375)
<20 8 1 (12.5%) 20-29 135 42 (31.1%) 30-39 96 42 (43.8%) 40-49 68 32 (47.1%) >=50 68 58 (85.3%)

46
HEPATITIS A
Year (No. of patients) Age No. tested Anti-HAV +ve (%)
2015 (n=378)
<20 13 6 (46.2%) 20-29 113 31 (27.4%) 30-39 118 54 (45.8%) 40-49 69 43 (62.3%) >=50 65 60 (92.3%)
2016 (n=344)
<20 4 0 (0.0%) 20-29 106 24 (22.6%) 30-39 121 46 (38.0%) 40-49 57 30 (52.6%) >=50 56 45 (80.4%)
2017 (n=394)
<20 10 4 (40.0%) 20-29 115 30 (26.1%) 30-39 109 43 (39.4%) 40-49 74 45 (60.8%) >=50 86 67 (77.9%)
Box 23. Prevalence of anti-HAV per HIV risk at baseline screening of HIV/AIDS patients attending ITC from Jul 2007 to 2017 (Data source: ITC, CHP, DH)
HIV risk No. tested Anti-HAV +ve (%)
Heterosexual male 720 514 (71.4%)
Heterosexual female 463 351 (75.8%)
Homo/Bi-sexual 2316 859 (37.1%)
Drug user 193 165 (85.5%)
Blood/blood product recipient 24 18 (75.0%)
Perinatal 9 0 (0.0%)
Undetermined 31 21 (67.7%)
Total 3756 1928 (51.3%)

47
HEPATITIS E
Box 24. Prevalence of anti-HEV in participants of Community Research Project for Viral Hepatitis (CRPVH) 2001 (Data source: DH)
Age group No. Tested Anti-HEV +ve (%)
18-29 137 11 (8.0%) 30-39 222 32 (14.4%) 40-49 290 70 (24.1%) 50-59 170 39 (22.9%)
60 & over 115 24 (20.9%) All 934 176 (18.8%)

48
SURVEILLANCE OF VIRAL HEPATITIS IN HONG KONG
2017 UPDATE
Seroprevalence and vaccination coverage of hepatitis B
Tabulated results
Box Title Page
Box 25. Prevalence of HBsAg in new blood donors from 1990 to 2017 (Data source: HKRCBTS)
50
Box 26. HBsAg prevalence and its sex and age breakdown in new blood donors in 2017 (Data source: HKRCBTS)
51
Box 27. HBsAg prevalence among university students/staff (Data source: City University Health Centre (till 2002), Baptist University Health Centre (2001 to 2009) & Lingnan University Health Service (2003 and 2004)
51
Box 28. HBsAg prevalence from the FPAHK’s Clinical Services (Data source: FPA)
52
Box 29. HBsAg prevalence in antenatal women from 1990 to 2017 (Data source: FHS and PHLSB, CHP, DH)
53
Box 30. HBsAg prevalence and age breakdown of antenatal mothers from 1990 to 2017 (Data source: FHS, DH)
54
Box 31. Number of antenatal mothers with positive HBsAg by age, from 1990 to 2017 (Date source: FHS, DH)
55
Box 32
Prevalence of hepatitis B markers in police officers, by sex from 1996 to 2006 and 2012 to 2017 (Data source: DH)
56
Box 33. Prevalence of hepatitis B markers in police officers, by age from 1996 to 2006 and 2012 to 2017 (Data source: DH)
58
Box 34. Prevalence of HBsAg from the Community Research Project on Viral Hepatitis (CRPVH) 2001 (Data source: DH)
59
Box 35. Prevalence of HBsAg in newly recruited health care workers of DH from 2001 to 2017 (Data source: DH)
60
Box 36. HBsAg prevalence among tuberculosis patients treated at chest clinics from 2005 to 2015 (March to May) (Data source: TB and Chest Service, CHP, DH)
61
Box 37. HBsAg prevalence, stratified by age, among tuberculosis patients treated at chest clinics from 2005 to 2015 (March to May) (Data source: TB and Chest Service, CHP, DH)
62
Box 38. Prevalence of hepatitis B markers in persons attending Therapeutic Prevention Clinic of Integrated Treatment Centre (ITC) for post-exposure management, from July 1999 to 2016 (Data source: ITC, CHP, DH)
63
Box 39. Prevalence of hepatitis B markers in drug users from 1990 to 2010 (Data source: PHLSB, CHP, DH)
64

49
Box 40. Prevalence of HBsAg at baseline screening of HIV/AIDS patients attending ITC from 2000 to 2017 (Data source: ITC, CHP, DH)
65
Box 41. Prevalence of HBV infection per HIV risk at baseline screening of HIV/AIDS patients attending ITC from 2000 to 2017 (Data source: ITC, CHP, DH)
66
Box 42. HBsAg prevalence (%) in new blood donors, pre-marital screening and antenatal women from 1990 to 2017 (Data source: multiple sources)
67
Box 43. HBsAg prevalence (%) in other selected populations from 1990 to 2017 (Data source: multiple sources)
68
Box 44. Hepatitis B immunisation coverage rates among children aged 2 to 5 by year of birth (Data source: ref 34, 35, 36 & unpublished DH data)
69
Box 45. Cumulative statistics of the supplementary hepatitis B vaccination programme for Primary 6 students from the school years 2000 to 2017 (Data source: DH)
70
Box 46. HBsAg seroprevalence by age among children aged 12 to 15 years in 2009 (Data source: unpublished data of DH)
71

50
HEPATITIS B
Box 25. Prevalence of HBsAg in new blood donors from 1990 to 2017 (Data source: HKRCBTS)
1990 1991 1992 1993 1994 1995 1996 1997 1998 1999 2000 2001 2002 2003 2004 2005 2006 2007 2008 2009 2010 2011 2012 2013 2014 2015 2016 2017% HBsAg +ve 8 8 7.4 6.7 5.9 6 5.6 5.2 4.9 4.4 4.2 4 3.6 3.2 2.9 2.6 2.2 1.8 1.8 1.6 1.2 1.1 1.1 1.1 0.8 1 0.8 0.9
0
1
2
3
4
5
6
7
8
9
Prev
alen
ce %
Year

51
HEPATITIS B
Box 26. HBsAg prevalence and its sex and age breakdown in new blood donors in 2017 (Data source: HKRCBTS)
Male Female
Age Group No. tested HBsAg +ve (%) No. tested HBsAg +ve (%)
16-19 6667 22 (0.3%) 8366 21 (0.3%) 20-29 3770 31 (0.8%) 4220 21 (0.5%) 30-39 1907 50 (2.6%) 2856 39 (1.4%) 40-49 1107 32 (2.9%) 2101 39 (1.9%) >49 611 17 (2.8%) 1190 16 (1.3%) Total 14062 152 (1.1%) 18733 136 (0.7%)
Box 27. HBsAg prevalence among university students/staff (Data source: City University Health Centre (till 2002), Baptist University Health Centre (2001 to 2009) & Lingnan University Health Service (2003 and 2004)
Aged below 21 Aged 21 – 30 Aged < 30
Year Total no. of cases
HBsAg +ve (%)
Total no. of cases
HBsAg +ve (%)
Total no. of cases
HBsAg +ve (%)
1994 305 7 (2.3%) 830 29 (3.5%) 1135 36 (3.2%) 1995 324 10 (3.1%) 768 33 (4.3%) 1092 43 (3.9%) 1996 348 4 (1.1%) 762 30 (3.9%) 1110 34 (3.1%) 1998 371 5 (1.3) 608 21 (3.5%) 979 26 (2.7%) 2000 230 7 (3.0%) 391 12 (3.1%) 621 19 (3.1%) 2001 508 13 (2.6%) 814 28 (3.4%) 1322 41 (3.1%) 2002 266 10 (3.8%) 483 13 (2.7%) 749 23 (3.1%) 2003 121 5 (4.1%) 214 8 (3.7%) 335 13 (3.9%) 2004 114 3 (2.6%) 217 4 (1.8%) 331 7 (2.1%) 2005 57 1 (1.8%) 115 0 (0.0%) 172 1 (0.6%) 2006 26 3 (11.5%) 104 1 (1.0%) 130 4 (3.1%) 2007 16 0 (0.0%) 82 1 (1.2%) 98 1 (1.0%) 2008 18 0 (0.0%) 82 1 (1.2%) 100 1 (1.0%) 2009 8 0 (0.0%) 56 0 (0.0%) 64 0 (0.0%)

52
HEPATITIS B
Box 28. HBsAg prevalence from the FPAHK’s Clinical Services (Data source: FPA)
Note: 1990-2010 only contain pre-marital check up Start from 2011 contain both pre-marital and pre-pregnancy check up
1990 1991 1992 1993 1994 1995 1996 1997 1998 1999 2000 2001 2002 2003 2004 2005 2006 2007 2008 2009 2010 2011 2012 2013 2014 2015 2016 2017
% HBsAg +ve 9.6 9.6 9.3 8.7 7.3 7.9 7.9 7.6 6.8 6.7 5.6 5.1 6.9 7.1 7.4 6.8 7.4 7.1 6.4 6.9 6.5 6.4 6.9 6.3 5.5 5.3 6.2 4.8
Total no. of cases 17251 19142 18445 19193 16466 16798 19959 17109 13163 12686 15348 16611 15077 13489 13773 11772 11831 9787 10669 9553 14137 13163 12191 13850 13117 11325 11091 10101
0
1
2
3
4
5
6
7
8
9
10
Prev
alen
ce %
Year

53
HEPATITIS B
Box 29. HBsAg prevalence in antenatal women from 1990 to 2017 (Data source: FHS and PHLSB, CHP, DH)
1990 1991 1992 1993 1994 1995 1996 1997 1998 1999 2000 2001 2002 2003 2004 2005 2006 2007 2008 2009 2010 2011 2012 2013 2014 2015 2016 2017%HBsAg +ve 11.3 10.9 10.8 10.1 10 9.7 9.7 9.3 9 8.8 8.9 9.2 9 8.8 8.5 8.6 8.4 8.5 8.4 8.2 7.9 7.4 7 6.6 6.2 5.7 5.2 5No. tested 31749 30075 31394 34221 32470 30962 31508 25892 24678 23934 19090 23356 22198 21433 22113 21244 22528 26533 27345 26935 27762 32180 31192 29820 31699 34527 30972 27882
0
2
4
6
8
10
12
Prev
alen
ce %
Year

54
HEPATITIS B
Box 30. HBsAg prevalence and age breakdown of antenatal mothers from 1990 to 2017 (Data source: FHS, DH)
No. tested (% HBsAg +ve) according to age group of antenatal mothers
Year <20* 20-24 25-29 30-34 >34 1990 1044 (10.3%) 4671 (13.4%) 15228 (10.7%) 7639 (12.6%) 2780 (12.9%) 1991 987 (10.7%) 4620 (10.7%) 13151 (10.4%) 8168 (11.5%) 3063 (11.8%) 1992 928 (9.6%) 5065 (11.4%) 13093 (10.6%) 8788 (10.6%) 3470 (11.7%) 1993 984 (9.0%) 5589 (10.5%) 12345 (10.3%) 9395 (11.6%) 3798 (11.0%) 1994 951 (7.8%) 5723 (9.8%) 11590 (9.7%) 10158 (10.6%) 3998 (10.4%) 1995 922 (8.4%) 4979 (9.7%) 10619 (9.6%) 10112 (9.8%) 4283 (10.3%) 1996 842 (7.8%) 4765 (10.3%) 10137 (9.5%) 9759 (9.5%) 5908 (10.6%) 1997 902 (7.1%) 4207 (9.3%) 8895 (9.6%) 7982 (9.3%) 3897 (9.3%) 1998 911 (5.8%) 3887 (9.2%) 8507 (9.3%) 7418 (8.8%) 3851 (9.3%) 1999 794 (7.7%) 3777 (8.6%) 8068 (9.3%) 7196 (8.2%) 3975 (9.3%) 2000 618 (6.8%) 2974 (10.1%) 6466 (9.5%) 5818 (8.0%) 3192 (8.7%) 2001 659 (7.3%) 3516 (9.5%) 8330 (10.1%) 6936 (8.3%) 3915 (9.0%) 2002 484 (5.0%) 2829 (9.7%) 9120 (9.7%) 6351 (8.5%) 3414 (8.1%) 2003 548 (4.9%) 2880 (9.9%) 7614 (9.4%) 6789 (8.3%) 3602 (8.2%) 2004 510 (6.1%) 2854 (8.4%) 7161 (8.9%) 7732 (8.6%) 3856 (8.1%) 2005 445 (3.4%) 2753 (8.9%) 6063 (9.5%) 7869 (8.6%) 4114 (7.4%) 2006 516 (4.8%) 2590 (8.0%) 6271 (8.7%) 8637 (8.6%) 4514 (8.4%) 2007 520 (4.0%) 2929 (8.4%) 7301 (9.3%) 10232 (8.7%) 5551 (7.5%) 2008 533 (3.2%) 2968 (8.0%) 7652 (8.6%) 10354 (8.8%) 5838 (8.0%) 2009 434 (3.2%) 2830 (8.7%) 7444 (9.3%) 10156 (7.9%) 6071 (7.7%) 2010 446 (2.2%) 2903 (8.0%) 7817 (8.5%) 10211 (7.9%) 6385 (7.6%) 2011 447 (2.5%) 2898 (6.5%) 9010 (8.1%) 12273 (7.3%) 7552 (7.5%) 2012 463 (2.6%) 2467 (4.4%) 8161 (7.5%) 12664 (7.2%) 7437 (7.1%) 2013 423 (5.0%) 2237 (4.1%) 7526 (6.8%) 12466 (6.7%) 7168 (7.3%) 2014 366 (0.8%) 2252 (2.8%) 7901 (6.3%) 13488 (6.4%) 7692 (6.9%) 2015 409 (1.0%) 2439 (2.6%) 8589 (4.7%) 14434 (6.2%) 8656 (6.8%) 2016 328 (2.1%) 2123 (2.0%) 7580 (4.1%) 13018 (5.7%) 7923 (6.6%) 2017 274 (0.7%) 1897 (2.2%) 6624 (3.5%) 11476 (5.5%) 7611 (6.3%)
* Figures before year 2001 refer to age group 15-19; figures after year 2001 refer to age group <20

55
HEPATITIS B
Box 31 Number of antenatal mothers with positive HBsAg by age, from 1990 to 2017 (Date source: FHS, DH)
0
500
1000
1500
2000
2500
3000
3500
400019
9019
9119
9219
9319
9419
9519
9619
9719
9819
9920
0020
0120
0220
0320
0420
0520
0620
0720
0820
0920
1020
1120
1220
1320
1420
1520
1620
17
No.
of c
ases
Year<20* 20-24 25-29 30-34 >34
Age group (years)

56
HEPATITIS B Box 32. Prevalence of hepatitis B markers in police officers, by sex from 1996 to 2006 and 2012 to 2017 (Data source: DH)
Note: Data was not available from 2007-Feb 2012 * For a period between Mar-Dec 2012
0
5
10
1996 1997 1998 1999 2000 2001 2002 2003 2004 2005 2006 2012* 2013 2014 2015 2016 2017
Prev
alen
ce %
Year
HBsAg in police officers
Male Female
0
20
40
60
1996 1997 1998 1999 2000 2001 2002 2003 2004 2005 2006 2012* 2013 2014 2015 2016 2017
Prev
alen
ce %
Year
Anti-HBs in police officers
Male Female

57
HEPATITIS B
Male Female All
Year No. tested
HBsAg +ve (%)
Anti-HBs +ve (%)
No. tested
HBsAg +ve (%)
Anti-HBs +ve (%)
No. tested HBsAg +ve (%) Anti-HBs +ve
(%)
1996 2080 138 (6.6%) 740 (35.6%) 413 15 (3.6%) 113 (27.4%) 2493 153 (6.1%) 853 (34.2%) 1997 4227 346 (8.2%) 1489 (35.2%) 472 26 (5.5%) 152 (32.2%) 4699 372 (7.9%) 1641 (34.9%) 1998 2316 177 (7.6%) 678 (29.3%) 284 16 (5.6%) 74 (26.1%) 2600 193 (7.4%) 752 (28.9%) 1999 1399 93 (6.6%) 424 (30.3%) 322 17 (5.3%) 91 (28.3%) 1721 110 (6.4%) 515 (29.9%) 2000 1300 83 (6.4%) 395 (30.4%) 244 3 (1.2%) 65 (26.6%) 1544 86 (5.6%) 460 (29.8%) 2001 1058 69 (6.5%) 330 (31.2%) 221 6 (2.7%) 78 (35.3%) 1279 75 (5.9%) 408 (31.9%) 2002 1374 77 (5.6%) 416 (30.3%) 270 10 (3.7%) 81 (30%) 1644 87 (5.3%) 497 (30.2%) 2003 1415 69 (4.9%) 388 (27.4%) 259 8 (3.1%) 71 (27.4%) 1674 77 (4.6%) 459 (27.4%) 2004 1105 58 (5.2%) 361 (32.7%) 188 5 (2.7%) 79 (42%) 1293 63 (4.9%) 440 (34%) 2005 1613 68 (4.2%) 562 (34.8%) 323 13 (4.0%) 137 (42.4%) 1936 81 (4.2%) 699 (36.1%) 2006 195 9 (4.6%) 74 (37.9%) 44 2 (4.5%) 20 (45.5%) 239 11 (4.6%) 94 (39.3%) 2012* 1494 49 (3.3%) 635 (42.5%) 338 6 (1.8%) 165 (48.8%) 1832 55 (3.0%) 800 (43.7%) 2013 1812 52 (2.9%) 751 (41.4%) 506 13 (2.6%) 207 (40.9%) 2318 65 (2.8%) 958 (41.3%) 2014 2267 59 (2.6%) 847 (37.4%) 560 15 (2.7%) 230 (41.1%) 2827 74 (2.6%) 1077 (38.1%) 2015 2563 71 (2.8%) 972 (37.9 %) 621 17 (2.7%) 263 (42.4%) 3184 88 (2.8%) 1235 (38.8%) 2016 2450 49 (2.0%) 796 (32.5%) 561 9 (1.6%) 191 (34.0%) 3011 58 (1.9%) 987 (32.8%) 2017 2477 36 (1.5%) 768 (31.0%) 706 9 (1.3%) 228 (32.3%) 3183 45 (1.4%) 996 (31.3%)
Note: Data was not available from 2007-Feb 2012 * For a period between Mar-Dec 2012

58
HEPATITIS B Box 33. Prevalence of hepatitis B markers in police officers, by age from 1996 to 2006 and 2012 to 2017 (Data source: DH)
Age group <20 21-30 31-40 41-50 >50
Year No. tested
% HBsAg
+ve
% Anti-HBs +ve
No. tested
% HBsAg
+ve
% Anti-HBs +ve
No. tested
% HBsAg
+ve
% Anti-HBs +ve
No. tested
% HBsAg
+ve
% Anti-HBs +ve
No. tested
% HBsAg
+ve
% Anti-HBs +ve
1996 17 0.0 35.3 733 4.8 24.4 1155 6.8 32.9 544 5.9 49.6 44 18.2 40.9 1997 15 6.7 46.7 1494 6.1 25.4 2081 7.3 35.0 999 11.4 46.6 110 13.6 55.5 1998 387 5.9 20.7 969 5.5 25.0 828 8.3 30.8 356 12.4 40.4 60 6.7 51.7 1999 270 4.4 24.1 799 6.1 27.5 428 6.8 31.8 202 8.9 42.1 22 9.1 40.9 2000 72 4.2 22.2 746 6.4 24.3 460 4.3 31.3 242 5.8 44.6 24 4.2 45.8 2001 68 4.4 30.9 602 5.8 28.4 339 5.6 30.7 225 6.2 40.0 45 8.9 48.9 2002 145 4.8 29.7 697 4.9 25.3 443 3.6 29.6 307 9.1 37.5 52 3.8 61.5 2003 72 1.4 16.7 702 4.8 22.9 505 4.6 26.5 357 5.0 38.1 38 2.6 42.1 2004 8 0.0 37.5 466 5.2 35.6 441 3.4 28.6 321 5.9 39.6 57 8.8 31.6 2005 80 1.3 52.5 791 3.8 32.7 533 4.3 31.0 427 4.2 43.3 105 8.6 45.7 2006 0 - - 39 0.0 51.3 86 5.8 36.0 90 4.4 36.7 24 8.3 41.7 2012* 267 0.7 20.2 1169 2.1 47.3 122 6.6 53.3 203 5.9 47.8 71 11.3 43.7 2013 393 0.0 24.4 1635 2.7 43.8 95 4.2 57.9 133 11.3 46.6 62 3.2 46.8 2014 456 0.7 24.8 1789 1.9 37.8 188 6.4 48.9 280 6.4 51.1 114 6.1 46.5 2015 455 0.9 24.8 2077 2.4 38.9 221 5.4 50.7 309 5.5 46.9 122 4.1 47.5 2016 428 0.5 17.3 2250 1.6 33.2 154 5.2 53.2 125 7.2 49.6 54 3.7 42.6 2017 391 0.5 21.2 2594 1.3 31.7 182 2.2 46.7 13 38.5 30.8 3 0.0 66.7
Note: Data was not available from 2007-Feb 2012 * For a period between Mar-Dec 2012

59
HEPATITIS B
Box 34. Prevalence of HBsAg from the Community Research Project on Viral Hepatitis (CRPVH) 2001 (Data source: DH)
Male Female Total
Age Group No. tested
HBsAg +ve (%)
No. tested
HBsAg +ve (%)
No. tested
HBsAg +ve (%)
18-30 72 6 (8.3%) 87 6 (6.9%) 159 12 (7.5%) 31-40 93 5 (5.4%) 144 20 (13.9%) 237 25 (10.5%) 41-50 100 20 (20.0%) 183 10 (5.5%) 283 30 (10.6%)
51 & Over 111 8 (7.2%) 146 7 (4.8%) 257 15 (5.8%) Total 376 39 (10.4%) 560 43 (7.7%) 936 82 (8.8%)

60
HEPATITIS B
Box 35. Prevalence of HBsAg in newly recruited health care workers of DH from 2001 to 2017 (Data source: DH)
0
1
2
3
4
5
6
7
2001 2003 2005 2007 2009 2011 2013 2015 2017
Prev
alen
ce %
Year
Male Female
Male Female Year No. tested HBsAg +ve (%) No. tested HBsAg +ve (%) 2001 440 27 (6.1%) 613 36 (5.9%) 2002 499 23 (4.6%) 730 38 (5.2%) 2003 373 20 (5.4%) 531 27 (5.1%) 2004 307 13 (4.2%) 644 37 (5.7%) 2005 396 22 (5.6%) 956 51 (5.3%) 2006 220 8 (3.6%) 449 25 (5.6%) 2007 204 8 (3.9%) 102 4 (3.9%) 2008 232 7 (3.0%) 187 9 (4.8%) 2009 226 14 (6.2%) 328 14 (4.3%) 2010 307 15 (4.9%) 239 10 (4.2%) 2011 370 12 (3.2%) 233 3 (1.3%) 2012 318 18 (5.7%) 377 12 (3.2%) 2013 282 8 (2.8%) 418 19 (4.5%) 2014 261 3 (1.1%) 370 13 (3.5%) 2015 324 8 (2.5%) 391 15 (3.8%) 2016 278 8 (2.9%) 409 16 (3.9%) 2017 291 7 (2.4%) 452 16 (3.5%)

61
HEPATITIS B Box 36. HBsAg prevalence among tuberculosis patients treated at chest clinics from 2005 to 2015 (March to May) (Data source: TB and Chest Service, CHP, DH)
Male Female Total
Year No. tested
HBsAg +ve (%)
No. tested
HBsAg +ve (%)
No. tested
HBsAg +ve (%)
2005 442 52 (11.8%) 242 17 (7.0%) 684 69 (10.1%) 2006 821 97 (11.8%) 446 27 (6.1%) 1267 124 (9.8%) 2007 768 96 (12.5%) 420 29 (6.9%) 1188 125 (10.5%) 2008 648 62 (9.6%) 382 30 (7.9%) 1030 92 (8.9%) 2009 759 73 (9.6%) 438 30 (6.8%) 1197 103 (8.6%) 2010 669 64 (9.6%) 353 22 (6.2%) 1022 86 (8.4%) 2011 674 77 (11.4%) 382 29 (7.6%) 1056 106 (10.0%) 2012 651 59 (9.1%) 367 27 (7.4%) 1018 86 (8.4%) 2013 664 70 (10.5%) 369 25 (6.8%) 1033 95 (9.2%) 2014 598 60 (10.0%) 393 24 (6.1%) 991 84 (8.5%) 2015 560 56 (10.0%) 314 18 (5.7%) 874 74 (8.5%)
2
4
6
8
10
12
14
2005 2006 2007 2008 2009 2010 2011 2012 2013 2014 2015
Prev
alen
ce %
Year
Male Female

62
HEPATITIS B Box 37. HBsAg prevalence, stratified by age, among tuberculosis patients treated at chest clinics from 2005 to 2015 (March to May) (Data source: TB and Chest Service, CHP, DH)
Age group 0-19 20-39 40-59 ≥60 Total
Year No. tested HBsAg +ve (%) No.
tested HBsAg +ve (%) No. tested HBsAg +ve (%) No.
tested HBsAg +ve (%) No. tested HBsAg +ve (%)
2005 31 1 (3.2%) 168 11 (6.5%) 204 34 (16.7%) 281 23 (8.2%) 684 69 (10.1%) 2006 47 2 (4.3%) 314 21 (6.7%) 402 57 (14.2%) 504 44 (8.7%) 1267 124 (9.8%) 2007 57 1 (1.8%) 287 20 (7.0%) 374 60 (16.0%) 470 44 (9.4%) 1188 125 (10.5%) 2008 26 1 (3.8%) 256 14 (5.5%) 316 42 (13.3%) 432 35 (8.1%) 1030 92 (8.9%) 2009 45 0 (0.0%) 275 22 (8.0%) 370 56 (15.1%) 507 25 (4.9%) 1197 103 (8.6%) 2010 34 0 (0.0%) 224 15 (6.7%) 315 39 (12.4%) 449 32 (7.1%) 1022 86 (8.4%) 2011 35 0 (0.0%) 259 18 (6.9%) 303 45 (14.9%) 459 43 (9.4%) 1056 106 (10.0%) 2012 32 0 (0.0%) 261 21 (8.0%) 315 32 (10.2%) 410 33 (8.0%) 1018 86 (8.4%) 2013 54 1 (1.9%) 228 13 (5.7%) 320 41 (12.8%) 431 40 (9.3%) 1033 95 (9.2%) 2014 34 1 (2.9%) 211 8 (3.8%) 313 36 (11.5%) 433 39 (9.0%) 991 84 (8.5%) 2015 30 0 (0.0%) 187 13 (7.0%) 260 26 (10.0%) 397 35 (8.8%) 874 74 (8.5%)

63
HEPATITIS B Box 38. Prevalence of hepatitis B markers in persons attending Therapeutic Prevention Clinic of Integrated Treatment Centre (ITC) for post-exposure management, from July 1999 to 2016 (Data source: ITC, CHP, DH)
Health care workers Non- Health care workers Total
Year No. tested
HBsAg +ve (%)
Anti-HBs +ve (%)
No. tested
HBsAg +ve (%)
Anti-HBs +ve (%)
No. tested
HBsAg +ve (%)
Anti-HBs +ve (%)
Jul-Dec 1999 23 2 (8.7%) 11 (47.8%) 87 13 (14.9%) 41 (47.1%) 110 15 (13.6%) 52 (47.3%)
2000 77 5 (6.5%) 56 (72.7%) 217 20 (9.2%) 91 (41.9%) 294 25 (8.5%) 147 (50.0%) 2001 103 2 (1.9%) 78 (75.7%) 313 20 (6.4%) 143 (45.7%) 416 22 (5.3%) 221 (53.1%) 2002 99 9 (9.1%) 62 (62.6%) 252 22 (8.7%) 133 (52.8%) 351 31 (8.8%) 195 (55.6%) 2003 96 6 (6.3%) 66 (68.8%) 201 24 (11.9%) 81 (40.3%) 297 30 (10.1%) 147 (49.5%) 2004 66 4 (6.1%) 41 (62.1%) 182 15 (8.2%) 97 (53.3%) 248 19 (7.7%) 138 (55.6%) 2005 49 3 (6.1%) 31 (63.3%) 206 13 (6.3%) 99 (48.1%) 255 16 (6.3%) 130 (51.0%) 2006 54 6 (11.1%) 33 (61.1%) 289 15 (5.2%) 151 (52.2%) 343 21 (6.1%) 184 (53.6%) 2007 54 1 (1.9%) 45 (83.3%) 228 18 (7.9%) 88 (38.6%) 282 19 (6.7%) 133 (47.2%) 2008 54 2 (3.7%) 39 (72.2%) 235 20 (8.5%) 111 (47.2%) 289 22 (7.6%) 150 (51.9%) 2009 56 1 (1.8%) 41 (73.2%) 297 22 (7.4%) 138 (46.5%) 353 23 (6.5%) 179 (50.7%) 2010 47 1 (2.1%) 33 (70.2%) 245 10 (4.1%) 137 (55.9%) 292 11 (3.8%) 170 (58.2%) 2011 54 1 (1.9%) 35 (64.8%) 270 12 (4.4%) 159 (58.9%) 324 13 (4.0%) 194(59.9%) 2012 70 2 (2.9%) 54 (77.1%) 311 16 (5.1%) 173 (55.6%) 381 18 (4.7%) 227 (59.6%) 2013 82 1 (1.2%) 64 (78.0%) 313 15 (4.8%) 149 (47.6%) 395 16 (4.1%) 213 (53.9%) 2014 79 3 (3.8%) 58 (73.4%) 330 9 (2.7%) 180 (54.5%) 409 12 (2.9%) 238 (58.2%) 2015 85 1 (1.2%) 66 (77.6%) 311 10 (3.2%) 172 (55.3%) 396 11 (2.8%) 238 (60.1%) 2016 118 2 (1.7%) 82 (69.5%) 343 12 (3.5%) 155 (45.2%) 461 14 (3.0%) 237 (51.4%) Total 1266 52 (4.1%) 895 (70.7%) 4630 286 (6.2%) 2298 (49.6%) 5896 338 (5.7%) 3193 (54.2%)

64
HEPATITIS B Box 39. Prevalence of hepatitis B markers in drug users from 1990 to 2010 (Data source: PHLSB, CHP, DH)
Year No. tested HBsAg (%+ve)
Anti-HBs (%+ve)
Anti-HBc* (%+ve)
Any marker (%+ve)
1990 1067 13.4 59.0 15.7 90.8 1991 1517 14.4 54.4 20.5 89.3 1992 832 13.9 49.0 21.4 84.4 1993 744 14.4 43.4 16.4 69.2 1994 607 12.9 38.1 13.5 64.1 1995 190 10.5 36.8 12.1 58.9 1996 358 8.7 43.0 12.6 62.8 1997 290 6.6 36.2 15.9 53.4 1998 290 10.0 43.4 7.9 59.3 1999 725 11.2 44.8 13.8 67.2 2000 892 11.4 42.5 15.8 67.8 2001 654 11.6 41.3 17.3 70.2 2002 553 12.7 43.0 16.6 72.3 2003 198 10.1 42.4 12.6 65.2 2004 45 11.1 57.8 4.4 73.3 2005 26 11.5 46.2 11.5 69.2 2006 6 33.3 50.0 16.7 100.0 2007 11 0.0 81.8 9.1 90.9 2008 7 28.6 28.6 14.3 71.4 2009 11 9.1 72.7 9.1 100.0 2010 12 8.3 58.3 8.3 100.0
*Anti-HBc was not tested in specimens that were HBsAg positive

65
HEPATITIS B Box 40. Prevalence of HBsAg at baseline screening of HIV/AIDS patients attending ITC from 2000 to 2017 (Data source: ITC, CHP, DH)
Male Female Total
Year No. tested HBsAg +ve (%) No.
tested HBsAg +ve
(%) No.
tested HBsAg +ve
(%) 2000 57 6 (10.5%) 17 1 (5.9%) 74 7 (9.5%) 2001 75 11 (14.7%) 23 1 (4.3%) 98 12 (12.2%) 2002 112 14 (12.5%) 22 1 (4.5%) 134 15 (11.2%) 2003 93 12 (12.9%) 15 2 (13.3%) 108 14 (13.0%) 2004 115 20 (17.4%) 23 2 (8.7%) 138 22 (15.9%) 2005 132 8 (6.1%) 29 1 (3.4%) 161 9 (5.6%) 2006 188 26 (13.8%) 22 3 (13.6%) 210 29 (13.8%) 2007 216 27 (12.5%) 27 1 (3.7%) 243 28 (11.5%) 2008 203 22 (10.8%) 33 1 (3.0%) 236 23 (9.7%) 2009 170 16 (9.4%) 27 1 (3.7%) 197 17 (8.6%) 2010 160 20 (12.5%) 34 2 (5.9%) 194 22 (11.3%) 2011 167 17 (10.2%) 33 2 (6.1%) 200 19 (9.5%) 2012 226 27 (11.9%) 44 2 (4.5%) 270 29 (10.7%) 2013 263 15 (5.7%) 41 2 (4.9%) 304 17 (5.6%) 2014 301 24 (8.0%) 31 1 (3.2%) 332 25 (7.5%) 2015 328 20 (6.1%) 26 0 (0.0%) 354 20 (5.6%) 2016 304 22 (7.2%) 25 3 (12.0%) 329 25 (7.6%) 2017 326 28 (8.6%) 33 1 (3.0%) 359 29 (8.1%)
0
2
4
6
8
10
12
14
16
18
20
2000 2001 2002 2003 2004 2005 2006 2007 2008 2009 2010 2011 2012 2013 2014 2015 2016 2017
Prev
alen
ce %
Year
Male Female

66
HEPATITIS B Box 41. Prevalence of HBV infection per HIV risk at baseline screening of HIV/AIDS patients attending ITC from 2000 to 2017 (Data source: ITC, CHP, DH)
HIV risk No. tested HBsAg +ve (%) Anti-HBs +ve (%) Heterosexual male 797 93 (11.7%) 371 (46.5%)
Heterosexual female 472 27 (5.7%) 202 (42.8%) Homo/Bi-sexual 2356 198 (8.4%) 1267 (53.8%)
Drug user 259 41 (15.8%) 123 (47.5%) Blood/blood product recipient 14 0 (0%) 5 (35.7%)
Perinatal 9 0 (0%) 2 (22.2%) Undetermined 34 3 (8.8%) 14 (41.2%)
Total 3941 362 (9.2%) 1984 (50.3%)
02468
1012141618
Drug
use
r
Hete
rose
xual
mal
e
Hom
o/Bi
-sex
ual
Hete
rose
xual
fem
ale
Bloo
d/bl
ood
prod
uct
reci
pien
t
Perin
atal
Und
eter
min
ed
Prev
alen
ce o
f HBs
Ag %
HIV Risk

67
HEPATITIS B Box 42. HBsAg prevalence (%) in new blood donors, pre-marital screening and antenatal women from 1990 to 2017 (Data source: multiple sources)
Year New blood donors Pre-marital screening Antenatal women 1990 8.0 9.6 11.3 1991 8.0 9.6 10.9 1992 7.4 9.3 10.8 1993 6.7 8.7 10.1 1994 5.9 7.3 10.0 1995 6.0 7.9 9.7 1996 5.6 7.9 9.7 1997 5.2 7.6 9.3 1998 4.9 6.8 9.0 1999 4.4 6.7 8.8 2000 4.2 5.6 8.9 2001 4.0 5.1 9.2 2002 3.6 6.9 9.0 2003 3.2 7.1 8.8 2004 2.9 7.4 8.5 2005 2.6 6.8 8.6 2006 2.2 7.4 8.4 2007 1.8 7.1 8.5 2008 1.8 6.4 8.4 2009 1.6 6.9 8.2 2010 1.2 6.5 7.9 2011 1.1 6.4 7.4 2012 1.1 6.9 7.0 2013 1.1 6.3 6.6 2014 0.8 5.5 6.2 2015 1.0 5.3 5.7 2016 0.8 6.2 5.2 2017 0.9 4.8 5.0
0
2
4
6
8
10
12
New blood donors Pre-marital screening Antenatal women
Prev
alen
ce %
1990 1991 1992 1993 1994 1995 1996 1997 1998 1999
2000 2001 2002 2003 2004 2005 2006 2007 2008 2009
2010 2011 2012 2013 2014 2015 2016 2017

68
HEPATITIS B
Box 43 HBsAg prevalence (%) in other selected populations from 1990 to 2017 (Data source: multiple sources)
Year University students/staff (aged 21-30)
Police officers
Health care workers
Drug users Female sex workers HIV/AIDS patients Tuberculosis patients TPC patients
1990 - - - 13.4 - - - - 1991 - - 6.2 14.4 - - - - 1992 - - - 13.9 - - - - 1993 - - 4.4 14.4 - - - - 1994 3.5 - - 12.9 - - - - 1995 4.3 - 7.0 10.5 6.8^ - - - 1996 3.9 6.1 4.2 8.7 6.8^ - - - 1997 - 7.9 - 6.6 6.8^ - - - 1998 3.5 7.4 - 10.0 6.8^ - - - 1999 - 6.4 2.2 11.2 - - - 13.6* 2000 3.1 5.6 5.4 11.4 - 9.5 - 8.5 2001 3.4 5.9 6.0 11.6 - 12.2 - 5.3 2002 2.7 5.3 5.0 12.7 - 11.2 - 8.8 2003 3.7 4.6 5.2 10.1 - 13 - 10.1 2004 1.8 4.9 5.3 - - 15.9 - 7.7 2005 - 4.2 5.4 - - 5.6 10.1 6.3 2006 1.0 4.6 4.9 - - 13.8 9.8 6.1 2007 1.2 - 3.9 - 10.4** 11.5 10.5 6.7 2008 1.2 - 3.8 - 9.0 9.7 8.9 7.6 2009 0.0 - 5.1 - 6.5 8.6 8.6 6.5 2010 - - 4.6 - 5.0 11.3 8.4 3.8 2011 - - 2.5 - 7.2*** 9.5 10.0 4.0 2012 - 3.0**** 4.3 - - 10.7 8.4 4.7 2013 - 2.8 3.9 - - 5.6 9.2 4.1 2014 - 2.6 2.5 - - 7.5 8.5 2.9 2015 - 2.8 3.2 - - 5.6 8.5 2.8 2016 - 1.9 3.5 - - 7.6 - 3.0 2017 - 1.4 3.1 - - 8.1 - -
*For a period between Jul-Dec 1999; **For a period between Aug-Dec 2007, *** For a period between Jan-Jul 2011, **** For a period between Mar-Dec 2012 ^Figure is the average of 1995-1998

69
HEPATITIS B
Box 44. Hepatitis B immunisation coverage rates among children aged 2 to 5 by year of birth (Data source: ref 34, 35, 36 & unpublished DH data)
Year of Survey Year of Birth First dose (%) Second dose (%) Third dose (%)
2001 1995 99.5 99.5 99.1 1996 99.1 99 98.6
2003 1997 99.5 99.3 99.1 1998 99.9 99.9 99.6 1999 100 100 99.7
2006 2000 99.9 99.8 99.6 2001 99.9 99.9 99.6 2002 99.9 99.8 99.5
2009
2003 99.9 99.8 99.5 2004 99.9 99.9 99.8 2005 99.7 99.7 99.5 2006 100 100 99.7
2012
2006 99.6 99.5 99.0 2007 99.8 99.8 99.3 2008 99.8 99.8 99.3 2009 100 100 98.8
2015
2009 99.7 99.6 99.2 2010 99.6 99.6 99.2 2011 99.6 99.5 99.2 2012 100 100 99.2
70
HEPATITIS B
Box 45. Cumulative statistics of the supplementary hepatitis B vaccination programme for Primary 6 students from the school years 2000 to 2017 (Data source: DH)
2000- 2001
2001- 2002
2002- 2003
2003- 2004
2004- 2005
2005- 2006
2006- 2007
2007- 2008
2008- 2009
2009- 2010
2010- 2011
2011- 2012
2012- 2013
2013- 2014
2014- 2015
2015- 2016
2016- 2017
Cumulative no. of Primary 6 students 85612 86052 86515 86208 83974 83164 81818 77273 73757 67310 63332 63394 57487 54845 52013 51009 52843
First Dose Cumulative no. eligible for vaccination 17171 15479 14245 10625 8433 6648 6351 6204 5165 4698 3736 2509 2376 1992 1797 982 707
Cumulative no. administered 16985 15333 14084 10519 8313 6591 6262 6095 5043 4520 3563 2318 2237 1810 1606 729 542
Acceptance rate (at the present campaign) 98.90% 99.10% 98.90% 99.00% 98.60% 99.10% 98.60% 98.20% 97.60% 96.2% 95.4% 92.4% 94.1% 90.9% 89.4% 74.2% 76.7%
Coverage rate (for the whole Primary 6 population) 99.80% 99.80% 99.80% 99.90% 99.80% 99.90% 99.90% 99.90% 99.80% 99.7% 99.7% 99.7% 99.8% 99.7% 99.6% 98.4% 98.6%
Second Dose Cumulative no. eligible for vaccination 17182 15485 14250 10626 8545 6710 6392 6243 5165 4698 3787 2573 2432 2033 1825 1025 749
Cumulative no. administered 16890 15206 13800 10341 8185 6573 6278 6068 4969 4398 3516 2286 2203 1718 1578 675 534 Acceptance rate (at the present campaign) 98.30% 98.20% 96.80% 97.30% 95.80% 98.00% 98.20% 97.20% 96.20% 93.6% 92.8% 88.8% 90.6% 84.5% 86.5% 65.9% 71.3%
Coverage rate (for the whole Primary 6 population) 99.70% 99.70% 99.50% 99.70% 99.60% 99.80% 99.80% 99.80% 99.70% 99.5% 99.6% 99.5% 99.6% 99.4% 99.5% 98.2% 98.5%
Third Dose Cumulative no. eligible for vaccination 17771 16119 14918 11222 9300 7397 6986 6741 5575 5032 4104 2825 2692 2283 2096 1307 1065
Cumulative no. administered 16741 14947 13999 10069 8478 6965 6607 6273 4817 4409 *3526 2344 2232 1777 1708 835 771
Acceptance rate (at the present campaign) 94.20% 92.70% 93.80% 89.70% 91.20% 94.20% 94.60% 93.10% 86.40% 87.6% 85.9% 83.0% 82.9% 77.8% 81.5% 63.9% 72.4%
Coverage rate (for the whole Primary 6 population) 98.80% 98.60% 98.90% 98.70% 99.00% 99.50% 99.50% 99.40% 99.00% 99.1% 99.1% 99.2% 99.2% 99.1% 99.3% 97.9% 98.3%

71
HEPATITIS B
Box 46. HBsAg seroprevalence by age among children aged 12 to 15 years in 2009 (Data source: unpublished data of DH)
0%
1%
2%
3%
12 13 14 15
HBs
Ag s
erop
reva
lenc
e
Age

72
SURVEILLANCE OF VIRAL HEPATITIS IN HONG KONG
2017 UPDATE
Seroprevalence of hepatitis C Tabulated results
Box Title Page
Box 47. Anti-HCV prevalence in new blood donors, 1991 to 2017 (Data source: HKRCBTS)
73
Box 48. Anti-HCV prevalence and its sex and age breakdown in new blood donors in 2017 (Data source: HKRCBTS)
74
Box 49. Prevalence of anti-HCV in participants of Community Research Project on Viral Hepatitis (CRPVH) 2001 (Data source: DH)
75
Box 50. Prevalence of anti-HCV at baseline screening of injured persons attending Therapeutic Prevention Clinic of Integrated Treatment Centre (ITC), from July 1999 to 2016 (Data source: ITC, CHP, DH)
75
Box 51. Prevalence of anti-HCV in drug users on rehabilitation (Data source: PHLSB, CHP, DH)
76
Box 52. Prevalence of anti-HCV at baseline screening of HIV/AIDS patients attending ITC from 2000 to 2017 (Data source: ITC, CHP, DH)
76
Box 53. Prevalence of anti-HCV per HIV risk at baseline screening of HIV/AIDS patients attending ITC from 2000 to 2017 (Data source: ITC, CHP, DH)
77
Box 54. Prevalence of anti-HCV from screening of blood donors and clinical testing of patients in 2 hospital clusters under Hospital Authority from 2007 to 2017 (Data source: HKRCBTS, PMH Microbiology Laboratory, PWH Microbiology Laboratory)
78
Box 55. Characteristics of anti-HCV positive subjects detected at HKRCBTS and 2 hospital clusters under Hospital Authority from 2005 to 2017 (Data source: HKRCBTS, PMH Microbiology Laboratory, PWH Microbiology Laboratory)
79

73
HEPATITIS C
Box 47. Anti-HCV prevalence in new blood donors, 1991 to 2017 (Data source: HKRCBTS)
1991 1992 1993 1994 1995 1996 1997 1998 1999 2000 2001 2002 2003 2004 2005 2006 2007 2008 2009 2010 2011 2012 2013 2014 2015 2016 2017
% Anti-HCV +ve 0.04 0.06 0.1 0.06 0.07 0.06 0.09 0.07 0.1 0.06 0.07 0.08 0.07 0.09 0.1 0.08 0.1 0.11 0.1 0.09 0.1 0.08 0.09 0.08 0.08 0.06 0.06
No. of new donors 48769 43674 36146 38077 39778 40875 40419 43756 40960 41166 43415 42292 36732 41679 42643 40029 40287 40909 38679 41953 45298 42068 40220 38156 36171 35848 32795
0
0.02
0.04
0.06
0.08
0.1
0.12
Prev
alen
ce %
Year

74
HEPATITIS C
Box 48. Anti-HCV prevalence and its sex and age breakdown in new blood donors in 2017 (Data source: HKRCBTS)
Male Female Age Group No. tested Anti-HCV +ve (%) No. tested Anti-HCV +ve (%)
16-19 6667 1 (0.01%) 8366 1 (0.01%) 20-29 3770 1 (0.03%) 4220 0 (0.00%) 30-39 1907 6 (0.31%) 2856 2 (0.07%) 40-49 1107 2 (0.18%) 2101 3 (0.14%) >49 611 2 (0.33%) 1190 1 (0.08%) Total 14062 12 (0.09%) 18733 7 (0.04%)

75
HEPATITIS C
Box 49. Prevalence of anti-HCV in participants of Community Research Project on Viral Hepatitis (CRPVH) 2001 (Data source: DH)
Age group No. Tested Anti-HCV +ve (%) 18-29 137 0 (0.0%) 30-39 223 1 (0.4%) 40-49 291 0 (0.0%) 50-59 170 2 (1.2%)
60 & over 115 0 (0.0%) All 936 3 (0.3%)
Box 50. Prevalence of anti-HCV at baseline screening of injured persons attending Therapeutic Prevention Clinic of Integrated Treatment Centre (ITC), from July 1999 to 2016 (Data source: ITC, CHP, DH)
Health care workers Non- Health care workers Total
Year No. tested
Anti-HCV +ve (%)
No. tested
Anti-HCV +ve (%)
No. tested
Anti-HCV +ve (%)
Jul-Dec 1999 2 0 (0.0%) 3 0 (0.0%) 5 0 (0.0%) 2000 15 0 (0.0%) 20 1 (5.0%) 35 1 (2.9%) 2001 22 0 (0.0%) 50 1 (2.0%) 72 1 (1.4%) 2002 27 0 (0.0%) 50 1 (2.0%) 77 1 (1.3%) 2003 18 0 (0.0%) 43 0 (0.0%) 61 0 (0.0%) 2004 17 0 (0.0%) 40 0 (0.0%) 57 0 (0.0%) 2005 10 0 (0.0%) 57 0 (0.0%) 67 0 (0.0%) 2006 33 0 (0.0%) 139 0 (0.0%) 172 0 (0.0%) 2007 36 0 (0.0%) 118 0 (0.0%) 154 0 (0.0%) 2008 23 0 (0.0%) 126 3 (2.4%) 149 3 (2.0%) 2009 25 0 (0.0%) 161 1 (0.6%) 186 1 (0.5%) 2010 25 0 (0.0%) 131 0 (0.0%) 156 0 (0.0%) 2011 17 0 (0.0%) 145 0 (0.0%) 162 0 (0.0%) 2012 37 0 (0.0%) 154 0 (0.0%) 191 0 (0.0%) 2013 26 0 (0.0%) 162 1 (0.6%) 188 1 (0.5%) 2014 29 0 (0.0%) 157 0 (0.0%) 186 0 (0.0%) 2015 34 0 (0.0%) 150 0 (0.0%) 184 0 (0.0%) 2016 47 1 (2.1%) 145 1 (0.7%) 192 2 (1.0%) Total 443 1 (0.2%) 1851 9 (0.5%) 2294 10 (0.4%)

76
HEPATITIS C
Box 51. Prevalence of anti-HCV in drug users on rehabilitation (Data source: PHLSB, CHP, DH)
Year No. tested Anti-HCV +ve (%)
1988/1989 134 99 (73.9%) 2000/2001 210 97 (46.2%)
Box 52. Prevalence of anti-HCV at baseline screening of HIV/AIDS patients attending ITC from 2000 to 2017 (Data source: ITC, CHP, DH)
Male Female Total
Year No. tested
Anti-HCV +ve (%)
No. tested
Anti-HCV +ve (%)
No. tested
Anti-HCV +ve (%)
2000 54 5 (9.3%) 15 0 (0.0%) 69 5 (7.2%) 2001 72 9 (12.5%) 22 1 (4.5%) 94 10 (10.6%) 2002 118 9 (7.6%) 23 1 (4.3%) 141 10 (7.1%) 2003 89 13 (14.6%) 14 0 (0.0%) 103 13 (12.6%) 2004 108 21 (19.4%) 21 3 (14.3%) 129 24 (18.6%) 2005 137 19 (13.9%) 31 1 (3.2%) 168 20 (11.9%) 2006 187 49 (26.2%) 23 3 (13.0%) 210 52 (24.8%) 2007 215 41 (19.1%) 27 1 (3.7%) 242 42 (17.4%) 2008 201 40 (19.9%) 33 3 (9.1%) 234 43 (18.4%) 2009 168 33 (19.6%) 27 1 (3.7%) 195 34 (17.4%) 2010 163 15 (9.2%) 33 0 (0.0%) 196 15 (7.7%) 2011 168 12 (7.1%) 33 4 (12.1%) 201 16 (8.0%) 2012 226 10 (4.4%) 45 2 (4.4%) 271 12 (4.4%) 2013 264 11 (4.2%) 40 0 (0.0%) 304 11 (3.6%) 2014 301 5 (1.7%) 31 0 (0.0%) 332 5 (1.5%) 2015 327 14 (4.3%) 26 1 (3.8%) 353 15 (4.2%) 2016 299 21 (7.0%) 25 0 (0.0%) 324 21 (6.5%) 2017 331 16 (4.8%) 32 1 (3.1%) 363 17 (4.7%)

77
HEPATITIS C
Box 53. Prevalence of anti-HCV per HIV risk at baseline screening of HIV/AIDS patients attending ITC from 2000 to 2017 (Data source: ITC, CHP, DH)
HIV risk No. tested Anti-HCV +ve (%)
Heterosexual male 792 50* (6.3%)
Heterosexual female 468 8 (1.7%)
Homo/Bi-sexual 2354 50 (2.1%)
Drug user 258 252 (97.7%)
Blood/blood product recipient 14 4 (28.6%)
Perinatal 9 0 (0.0%)
Undetermined 34 1 (2.9%)
Total 3929 365 (9.3%)
*30 out of 50 had a past history of injecting drug use

78
HEPATITIS C
Box 54. Prevalence of anti-HCV from screening of blood donors and clinical testing of patients in 2 hospital clusters under Hospital Authority from 2007 to 2017 (Data source: HKRCBTS, PMH Microbiology Laboratory, PWH Microbiology Laboratory)
2007 2008 2009 2010 2011 2012 2013 2014 2015 2016 2017 Overall
Category No. tested
Anti- HCV
+ve (%)
No. tested
Anti- HCV
+ve (%)
No. tested
Anti- HCV
+ve (%)
No. tested
Anti- HCV
+ve (%)
No. tested
Anti- HCV
+ve (%)
No. tested
Anti- HCV
+ve (%)
No. tested
Anti- HCV
+ve (%)
No. tested
Anti- HCV +ve
(%)
No. tested
Anti- HCV +ve
(%)
No. tested
Anti- HCV +ve
(%)
No. tested
Anti- HCV +ve
(%)
No. tested
Anti- HCV +ve
(%)
1. BLOOD DONATION 205682 42 (< 0.1%) 211963 52
(< 0.1%) 231375 47 (< 0.1%) 226775 40
(< 0.1%) 234444 51 (< 0.1%) 243525 37
(< 0.1%) 247069 46 (< 0.1%) 254087 31
(< 0.1%) 260429 33 (< 0.1%) 257262 28
(< 0.1%) 243667 25 (< 0.1%) 2616278 432
(< 0.1%)
2. SCREENING
Pre-transplant 31 1 (3.2%) 18 0
(0.0%) 48 1 (2.1%) 68 2
(2.9%) 80 0 (0.0%) 96 0
(0.0%) 82 0 (0.0%) 111 1
(0.9%) 118 0 (0.0%) 108 0
(0.0%) 128 0 (0.0%) 888 5
(0.6%)
Drug users 118 29 (24.6%) 134 66
(49.3%) 154 93 (60.4%) 116 75
(64.7%) 84 61 (72.6%) 103 53
(51.5%) 112 63 (56.3%) 114 66
(57.9%) 124 51 (41.1%) 81 41
(50.6%) 87 38 (43.7%) 1227 636
(51.8%)
Needlestick injuries 546 6 (1.1%) 542 6
(1.1%) 574 5 (0.9%) 550 5
(0.9%) 559 4 (0.7%) 592 6
(1.0%) 610 4 (0.7%) 537 6
(1.1%) 494 3 (0.6%) 516 5
(1.0%) 667 9 (1.3%) 6187 59
(1.0%) Haemodialysis/ peritoneal dialysis 1706 37
(2.2%) 1656 31 (1.9%) 1936 34
(1.8%) 2016 36 (1.8%) 2251 34
(1.5%) 2452 34 (1.4%) 2449 37
(1.5%) 2569 34 (1.3%) 2535 48
(1.9%) 2613 34 (1.3%) 3557 60
(1.7%) 25740 419 (1.6%)
Post-renal transplant 413 19 (4.6%) 470 21
(4.5%) 650 19 (2.9%) 680 25
(3.7%) 722 18 (2.5%) 737 17
(2.3%) 718 16 (2.2%) 692 15
(2.2%) 863 18 (2.1%) 541 6
(1.1%) 708 9 (1.3%) 7194 183
(2.5%) Haematology (pre-chemotherapy) 223 0
(0.0%) 260 5 (1.9%) 262 2
(0.8%) 344 6 (1.7%) 399 1
(0.3%) 415 4 (1.0%) 444 2
(0.5%) 472 2 (0.4%) 489 4
(0.8%) 533 2 (0.4%) 687 6
(0.9%) 4528 34 (0.8%)
Rheumatology (pre-methotrexate) 210 1
(0.5%) 332 1 (0.3%) 396 5
(1.3%) 430 1 (0.2%) 464 2
(0.4%) 449 2 (0.4%) 471 4
(0.8%) 580 3 (0.5%) 689 5
(0.7%) 730 5 (0.7%) 1285 3
(0.2%) 6036 32 (0.5%)
History of blood transfusion 125 12
(9.6%) 197 18 (9.1%) 263 32
(12.2%) 239 21 (8.8%) 168 19
(11.3%) 197 17 (8.6%) 275 28
(10.2%) 224 22 (9.8%) 222 15
(6.8%) 166 14 (8.4%) 292 16
(5.5%) 2368 214 (9.0%)
Pre-vaccination 1 0 (0.0%) 1 0
(0.0%) 5 0 (0.0%) 0 0
(0.0%) 0 0 (0.0%) 0 0
(0.0%) 0 0 (0.0%) 0 0
(0.0%) 0 0 (0.0%) 0 0
(0.0%) 0 0 (0.0%) 7 0
(0.0%)
TOTAL (2) 3373 105 (3.1%) 3610 148
(4.1%) 4288 191 (4.5%) 4443 171
(3.8%) 4727 139 (2.9%) 5041 133
(2.6%) 5161 154 (3.0%) 5299 149
(2.8%) 5534 144 (2.6%) 5288 107
(2.0%) 7411 141 (1.9%) 54175 1582
(2.9%)
3. *CLINICAL INDICATION 4054 179
(4.4%) 5984 215 (3.6%) 7971 216
(2.7%) 8661 262 (3.0%) 8196 293
(3.6%) 9815 308 (3.1%) 10911 323
(3.0%) 11229 316 (2.8%) 12360 351
(2.8%) 15472 383 (2.5%) 15889 329
(2.1%) 110542 3175 (2.9%)
4. OTHERS OR UNKNOWN 8131 229
(2.8%) 8297 128 (1.5%) 7472 131
(1.8%) 8269 102 (1.2%) 8835 132
(1.5%) 9026 131 (1.5%) 9615 136
(1.4%) 11213 150 (1.3%) 10836 107
(1.0%) 10701 125 (1.2%) 15527 171
(1.1%) 107922 1542 (1.4%)
TOTAL (2+3+4) 15558 513 (3.0%) 17891 491
(2.7%) 19731 538 (2.7%) 21373 535
(2.5%) 21758 564 (2.6%) 23882 572
(2.4%) 25687 613 (2.4%) 27741 615
(2.2%) 28730 602 (2.1%) 31461 615
(2.0%) 38827 641 (1.7%) 272639 6299
(2.3%)
*includes suspected hepatitis, work up for liver function derangement and others

79
HEPATITIS C
Box 55. Characteristics of anti-HCV positive subjects detected at HKRCBTS and 2 hospital clusters under Hospital Authority from 2005 to 2017 (Data source: HKRCBTS, PMH Microbiology Laboratory, PWH Microbiology Laboratory)
2005
(n=624) 2006
(n=542) 2007
(n=555) 2008
(n=543) 2009
(n=585) 2010
(n=575) 2011
(n=615) 2012
(n=609) 2013
(n=659) 2014
(n=646) 2015
(n=635) 2016
(n=643) 2017
(n=666) Overall
(n=7897) No. (%) No. (%) No. (%) No. (%) No. (%) No. (%) No. (%) No. (%) No. (%) No. (%) No. (%) No. (%) No. (%) No. (%)
Lab
HKRCBTS 49 (7.9%) 35 (6.5%) 40 (7.2%) 49 (9.0%) 43 (7.4%) 38 (6.6%) 50 (6.6%) 35 (5.7%) 43 (6.5%) 31 (4.8%) 33 (5.2%) 28 (4.4%) 25 (3.8%) 499 (6.3%)
PMH 229 (36.7%)
142 (26.2%) 89 (16.0%) 208
(38.3%) 273
(46.7%) 271
(47.1%) 280
(47.1%) 298
(48.9%) 279
(42.3%) 297
(46.0%) 354
(55.7%) 372
(57.9%) 340
(51.1%) 3432
(43.5%)
PWH 346 (55.4%)
365 (67.3%)
426 (76.8%)
286 (52.7%)
269 (46.0%)
266 (46.3%)
285 (46.3%)
276 (45.3%)
337 (51.1%)
318 (49.2%)
248 (39.1%)
243 (37.8%)
301 (45.2%)
3966 (50.2%)
Sex
Male 413 (66.2%)
390 (72.0%)
377 (67.9%)
378 (69.6%)
415 (70.9%)
405 (70.4%)
434 (70.4%)
438 (71.9%)
464 (70.4%)
440 (68.1%)
434 (68.3%)
453 (70.5%)
454 (68.2%)
5495 (69.6%)
Female 211 (33.8%)
152 (28.0%)
178 (32.1%)
165 (30.4%)
170 (29.1%)
170 (29.6%)
181 (29.6%)
171 (28.1%)
195 (29.6%)
206 (31.9%)
201 (31.7%)
190 (29.5%)
211 (31.7%)
2401 (30.4%)
Unknown 0 (0.0%) 0 (0.0%) 0 (0.0%) 0 (0.0%) 0 (0.0%) 0 (0.0%) 0 (0.0%) 0 (0.0%) 0 (0.0%) 0 (0.0%) 0 (0.0%) 0 (0.0%) 1 (0.2%) 1 (0.0%)
Age at diagnosis
Mean 46.8 47.4 50.3 49.8 52.9 51.2 50.8 51.1 51.0 52.0 54.0 54.6 55.7 51.4 S.D. 15.9 16.6 16.3 17.9 16.9 17 16.5 16.3 16.6 16.2 15.5 15.5 15.1 16.3
Range 0 - 87 0 - 101 0 - 94 0 - 88 1 - 102 0 – 90 0 - 90 0 - 99 0 – 113 0 – 95 1 – 95 0-97 0-94 0 - 113
Category
Blood donation 50 (8.0%) 35 (6.5%) 42 (7.6%) 52 (9.6%) 47 (8.0%) 40 (7.0%) 51 (8.3%) 37 (6.1%) 46 (7.0%) 31 (4.8%) 33 (5.2%) 28 (4.4%) 25 (3.8%) 517 (6.5%)
Pre-transplant 2 (0.3%) 0 (0.0%) 1 (0.2%) 0 (0.0%) 1 (0.2%) 2 (0.3%) 0 (0.0%) 0 (0.0%) 0 (0.0%) 1 (0.2%) 0 (0.0%) 0 (0.0%) 0 (0.0%) 7 (0.1%)
Drug users 144 (23.1%) 59 (10.9%) 29 (5.2%) 66 (12.2%) 93 (15.9%) 75 (13.0%) 61 (9.9%) 53 (8.7%) 63 (9.6%) 66 (10.2%) 51 (8.0%) 41 (6.4%) 38 (5.7%) 839 (10.6%)
Needlestick injuries 8 (1.3%) 7 (1.3%) 6 (1.1%) 6 (1.1%) 5 (0.9%) 5 (0.9%) 4 (0.7%) 6 (1.0%) 4 (0.6%) 6 (0.9%) 3 (0.5%) 5 (0.8%) 9 (1.4%) 74 (0.9%)
Pre-haemodialysis/ peritoneal dialysis 40 (6.4%) 35 (6.5%) 37 (6.7%) 31 (5.7%) 34 (5.8%) 36 (6.3%) 34 (5.5%) 34 (5.6%) 37 (5.6%) 34 (5.3%) 48 (7.6%) 34 (5.3%) 60 (9.0%) 494 (6.3%)
Post-renal transplant 17 (2.7%) 18 (3.3%) 19 (3.4%) 21 (3.9%) 19 (3.2%) 25 (4.3%) 18 (2.9%) 17 (2.8%) 16 (2.4%) 15 (2.3%) 18 (2.8%) 6 (0.9%) 9 (1.4%) 218 (2.8%)
Haematology 3 (0.5%) 1 (0.2%) 0 (0.0%) 5 (0.9%) 2 (0.3%) 6 (1.0%) 1 (0.2%) 4 (0.7%) 2 (0.3%) 2 (0.3%) 4 (0.6%) 2 (0.3%) 6 (0.9%) 38 (0.5%)
Pre-methotrexate 1 (0.2%) 1 (0.2%) 1 (0.2%) 1 (0.2%) 5 (0.9%) 1 (0.2%) 2 (0.3%) 2 (0.3%) 4 (0.6%) 3 (0.5%) 5 (0.8%) 5 (0.8%) 3 (0.5%) 34 (0.4%)
History of blood transfusion 12 (1.9%) 11 (2.0%) 12 (2.2%) 18 (3.3%) 32 (5.5%) 21 (3.7%) 19 (3.1%) 17 (2.8%) 28 (4.2%) 22 (3.4%) 15 (2.4%) 14 (2.2%) 16 (2.4%) 237 (3.0%)
Clinical Indication 155 (24.8%)
170 (31.4%)
179 (32.3%)
215 (39.6%)
216 (36.9%)
262 (45.6%)
293 (47.6%)
308 (50.6%)
323 (49.0%)
316 (48.9%)
351 (55.3%)
383 (59.6%)
329 (49.4%)
3500 (44.3%)
Others or unknown 192 (30.8%)
205 (37.8%)
229 (41.3%)
128 (23.6%)
131 (22.4%)
102 (17.7%)
132 (21.5%)
131 (21.5%)
136 (20.6%)
150 (23.2%)
107 (16.9%)
125 (19.4%)
171 (25.7%)
1939 (24.6%)

80
SURVEILLANCE OF VIRAL HEPATITIS IN HONG KONG
2017 UPDATE
Liver cancers
Tabulated results
Box Title Page
Box 56. Hong Kong liver cancer statistics, number of new cases by gender from 2001 - 2016 (Data source: Hong Kong Cancer Registry, Hospital Authority)
81
Box 57. Hong Kong liver cancer statistics, number of new cases and incidence rate by age and gender, from 2001 – 2016 (Data source: Hong Kong Cancer Registry, Hospital Authority)
82
Box 58. Hong Kong liver cancer mortality statistics by gender from 2001 - 2016 (Data source: Hong Kong Cancer Registry, Hospital Authority)
83
Box 59. Hong Kong liver cancer mortality statistics, by age and gender, from 2001 – 2016 (Data source: Hong Kong Cancer Registry, Hospital Authority)
84

81
Liver Cancer
Box 56. Hong Kong liver cancer statistics, number of new cases by gender from 2001 - 2016 (Data source: Hong Kong Cancer Registry, Hospital Authority)
2001 2002 2003 2004 2005 2006 2007 2008 2009 2010 2011 2012 2013 2014 2015 2016
Female 324 343 390 385 425 414 386 426 447 465 459 426 445 478 435 419 Male 1313 1233 1264 1278 1324 1331 1304 1319 1385 1398 1399 1364 1407 1369 1356 1391 Total 1637 1576 1654 1663 1749 1745 1690 1745 1832 1863 1858 1790 1852 1847 1791 1810
200
400
600
800
1000
1200
1400
2001 2002 2003 2004 2005 2006 2007 2008 2009 2010 2011 2012 2013 2014 2015 2016
No.
of c
ases
Year
Male Female

82
Liver Cancer Box 57. Hong Kong liver cancer statistics, number of new cases and incidence rate by age and gender, from 2001 – 2016 (Data source: Hong Kong Cancer Registry, Hospital Authority)
0-19 20-44 45-64 65+ Crude rate ASR
Male Female Total Male Female Total Male Female Total Male Female Total Male Female Total Male Female Total
Year N I N I N I N I N I N I N I N I N I N I N I N I CR CR CR ASR ASR ASR
2001 4 0.5 1 0.1 5 0.3 130 9.5 26 1.7 156 5.3 590 76.9 86 12.1 676 45.7 589 169.3 211 52.0 800 106.2 40.0 9.4 24.4 32.7 7.4 20.1
2002 4 0.5 2 0.3 6 0.4 130 9.7 17 1.1 147 5.1 534 67.1 79 10.5 613 39.5 565 157.6 245 58.5 810 104.2 37.6 9.9 23.4 30.0 7.4 18.6
2003 6 0.8 2 0.3 8 0.5 110 8.4 25 1.6 135 4.7 581 70.5 100 12.6 681 42.1 567 154.5 263 61.4 830 104.4 38.8 11.2 24.6 30.3 8.2 19.1
2004 2 0.3 1 0.1 3 0.2 121 9.4 18 1.2 139 4.9 554 64.6 91 10.9 645 38.1 601 159.2 275 62.3 876 107 39.1 10.9 24.5 29.6 7.8 18.4
2005 2 0.3 0 0 2 0.1 110 8.7 21 1.4 131 4.7 605 67.5 110 12.4 715 40.1 607 157.8 294 65.3 901 107.9 40.6 12.0 25.7 29.9 8.3 18.9
2006 6 0.8 1 0.1 7 0.5 88 7.1 21 1.4 109 3.9 637 68.5 109 11.8 746 40.2 600 152.6 283 61.7 883 103.6 40.7 11.5 25.4 29.3 8.0 18.4
2007 2 0.3 1 0.2 3 0.2 83 6.8 13 0.8 96 3.5 621 64.7 95 9.8 716 37.1 598 148.3 277 59.1 875 100.3 39.7 10.6 24.4 27.9 7.1 17.2
2008 1 0.1 1 0.2 2 0.1 90 7.5 24 1.6 114 4.2 636 64 135 13.2 771 38.3 592 144.6 266 56.2 858 97.2 40.1 11.6 25.1 27.4 7.6 17.2
2009 2 0.3 2 0.3 4 0.3 87 7.4 20 1.3 107 4 695 68 131 12.3 826 39.6 601 143.8 294 61.1 895 99.6 42.2 12.1 26.3 27.9 7.7 17.5
2010 0 0 4 0.7 4 0.3 78 6.7 23 1.5 101 3.8 711 67.9 140 12.6 851 39.5 609 142.4 298 60.7 907 98.7 42.4 12.5 26.5 27.1 8.1 17.3
2011 6 0.9 3 0.5 9 0.7 85 7.4 22 1.5 107 4 694 65 122 10.7 816 36.9 614 140.1 312 62.0 926 98.4 42.4 12.2 26.3 26.8 7.5 16.8
2012 2 0.3 1 0.2 3 0.2 69 6.0 25 1.6 94 3.5 654 60.6 108 9.2 762 33.9 639 140.1 292 55.7 931 95.0 41.0 11.1 25.0 25.1 6.5 15.5
2013 6 1 2 0.3 8 0.7 64 5.6 19 1.2 83 3.1 698 64.3 126 10.6 824 36.2 639 134.5 298 54.7 937 91.9 42.2 11.6 25.8 25.4 6.9 15.8
2014 3 0.5 1 0.2 4 0.3 69 6 17 1.1 86 3.2 644 59.2 130 10.8 774 33.7 653 131.7 330 58.1 983 92.4 40.9 12.3 25.5 23.8 6.9 15
2015 1 0.2 2 0.3 3 0.3 51 4.4 14 0.9 65 2.4 621 57.2 107 8.7 728 31.5 683 131.3 312 52.5 995 89.3 40.3 11.1 24.6 22.7 6.2 14.1
2016 1 0.2 2 0.4 3 0.3 64 5.6 9 0.6 73 2.7 679 62.6 118 9.5 797 34.2 647 119.2 290 46.8 937 80.6 41.2 10.6 24.7 23 5.7 13.9
Average 3 0.4 2 0.3 5 0.3 89 7.3 20 1.3 109 4.0 635 65.2 112 11.0 746 37.5 613 143.9 284 57.7 897 97.7 40.6 11.3 25.1 27.2 7.2 16.9
Notes: I: Incidence rate per 100000 population N: No. of new cases by selected age groups ASR: Age-standardized rate (per 100000 population) is calculated based on the reference standard population used CR: Crude rate per 100000 population

83
Liver Cancer
Box 58. Hong Kong liver cancer mortality statistics by gender from 2001 - 2016 (Data source: Hong Kong Cancer Registry, Hospital Authority)
2001 2002 2003 2004 2005 2006 2007 2008 2009 2010 2011 2012 2013 2014 2015 2016 Female 353 291 337 341 387 387 351 383 416 417 396 460 401 436 432 405 Male 1071 1090 1075 1076 1119 1075 1098 1116 1072 1113 1140 1045 1123 1149 1139 1135 Total 1424 1381 1412 1417 1506 1462 1449 1499 1488 1530 1536 1505 1524 1585 1571 1540
200
300
400
500
600
700
800
900
1000
1100
1200
2001 2002 2003 2004 2005 2006 2007 2008 2009 2010 2011 2012 2013 2014 2015 2016
No.
of c
ases
Year
Male Female

84
Liver Cancer
Box 59. Hong Kong liver cancer mortality statistics, by age and gender, from 2001 – 2016 (Data source: Hong Kong Cancer Registry, Hospital Authority)
0-19 20-44 45-64 65+ Crude rate ASR
Male Female Total Male Female Total Male Female Total Male Female Total Male Female Total Male Female Total
Year N I N I N I N I N I N I N I N I N I N I N I N I CR CR CR ASR ASR ASR
2001 3 0.4 2 0.3 5 0.3 101 7.4 16 1 117 4 434 56.6 74 10.4 508 34.3 533 153.2 261 64.4 794 105.4 32.6 10.3 21.2 26.8 7.8 17.1
2002 3 0.4 1 0.1 4 0.3 98 7.3 15 1 113 3.9 425 53.4 51 6.7 476 30.7 564 157.3 224 53.5 788 101.4 33.2 8.4 20.5 26.4 5.9 16.1
2003 2 0.3 0 0 2 0.1 80 6.1 15 1 95 3.3 436 52.9 69 8.7 505 31.2 557 151.8 253 59 810 101.8 33 9.7 21 25.6 6.8 15.9
2004 2 0.3 0 0 2 0.1 66 5.1 15 1 81 2.9 428 49.9 69 8.2 497 29.3 580 153.6 257 58.2 837 102.2 32.9 9.7 20.9 24.7 6.6 15.4
2005 0 0 1 0.1 1 0.1 93 7.4 17 1.1 110 3.9 432 48.2 75 8.5 507 28.5 594 154.4 294 65.3 888 106.4 34.3 10.9 22.1 24.8 7.2 15.8
2006 2 0.3 0 0 2 0.1 49 3.9 12 0.8 61 2.2 420 45.2 64 6.9 484 26.1 604 153.6 311 67.8 915 107.4 32.9 10.8 21.3 23.3 6.7 14.7
2007 3 0.4 0 0 3 0.2 57 4.7 7 0.5 64 2.3 470 49 62 6.4 532 27.6 568 140.8 282 60.1 850 97.5 33.4 9.7 21 23.1 5.9 14.2
2008 1 0.1 0 0 1 0.1 68 5.7 17 1.1 85 3.1 480 48.3 82 8 562 27.9 567 138.5 284 60 851 96.4 33.9 10.4 21.5 22.9 6.3 14.3
2009 2 0.3 0 0 2 0.2 43 3.7 10 0.7 53 2 442 43.3 95 8.9 537 25.7 585 140 311 64.7 896 99.7 32.6 11.3 21.3 21.2 6.7 13.7
2010 0 0 0 0 0 0 35 3 15 1 50 1.9 474 45.3 89 8 563 26.1 604 141.2 313 63.8 917 99.8 33.8 11.2 21.8 21.2 6.5 13.6
2011 1 0.2 1 0.2 2 0.2 52 4.5 8 0.5 60 2.2 462 43.3 72 6.3 534 24.1 625 142.6 315 62.6 940 99.9 34.5 10.5 21.7 21.2 5.9 13.2
2012 0 0 1 0.2 1 0.1 50 4.3 10 0.7 60 2.2 431 39.9 95 8.1 526 23.4 564 123.7 354 67.6 918 93.7 31.4 12 21 18.9 6.5 12.4
2013 3 0.5 1 0.2 4 0.3 38 3.3 13 0.8 51 1.9 437 40.2 82 6.9 519 22.8 645 135.8 305 56.0 950 93.1 33.7 10.4 21.2 19.4 5.6 12.1
2014 2 0.3 0 0 2 0.2 48 4.2 11 0.7 59 2.2 469 43.1 71 5.9 540 23.5 629 126.8 354 62.3 983 92.4 34.3 11.2 21.9 19.4 5.7 12.2
2015 1 0.2 1 0.2 2 0.2 37 3.2 6 0.4 43 1.6 427 39.4 76 6.2 503 21.8 674 129.6 349 58.7 1023 91.8 33.8 11.0 21.5 18.4 5.4 11.6
2016 1 0.2 1 0.2 2 0.2 39 3.4 7 0.5 46 1.7 445 41.1 75 6.0 520 22.3 650 119.7 322 51.9 972 83.6 33.6 10.2 21.0 18.0 4.9 11.0
Average 2 0.2 <1 0.1 2 0.2 60 4.9 12 0.8 72 2.6 445 45.6 75 7.4 520 26.1 596 140.0 299 60.8 896 97.6 33.4 10.5 21.3 22.0 6.2 13.8
Notes: I: Mortality rate per 100000 population N: No. of death cases by selected age groups ASR: Age-standardized rate (per 100000 population) is calculated based on the reference standard population used CR: Crude rate per 100000 population

85
SURVEILLANCE OF VIRAL HEPATITIS IN HONG KONG
2017 UPDATE
ABBREVIATIONS
AIDS Acquired immune deficiency syndrome Anti-HAV Antibody against hepatitis A virus Anti-HBc Antibody against hepatitis B core antigen Anti-HBs Antibody against hepatitis B surface antigen Anti-HCV Antibody against hepatitis C virus Anti-HEV Antibody against hepatitis E virus BUHC Baptist University Health Centre CHP Centre for Health Protection CRPVH Community Research Project on Viral Hepatitis CUHC City University Health Centre CUHK Chinese University of Hong Kong DH Department of Health FHS Family Health Service FPA Family Planning Association HBsAg Hepatitis B surface antigen HAV Hepatitis A virus HBV Hepatitis B virus HCC Hepatocellular carcinoma HCV Hepatitis C virus HCW Health care worker HEV Hepatitis E virus HIV Human immunodeficiency virus HKRCBTS Hong Kong Red Cross Blood Transfusion Service IgM Immunoglobulin M IDU Injecting drug users ITC Integrated Treatment Centre LUHC Lingnan University Health Centre MCHC MSM
Maternal and Child Health Centre Men who have sex with men
PHIS Public Health Information System PHLSB Public Health Laboratory Services Branch PMH Princess Margaret Hospital PWH Prince of Wales Hospital SEB Surveillance and Epidemiology Branch TPC Therapeutic Prevention Clinic

86
SURVEILLANCE OF VIRAL HEPATITIS IN HONG KONG
2017 UPDATE
REFERENCES
1. Gust ID. The epidemiology of viral hepatitis. In: Vyas GN, Dienstag JL, Hoofnagle JH, editors: Viral Hepatitis and Liver Disease. Orlando: Grune & Stratton;1984. p. 415-21.
2. Wong KH, Liu YM, Ng PS, et al. Epidemiology of hepatitis A and hepatitis E infection and their determinants in adult Chinese community in Hong Kong. J Med Virol 2004;72:538-44.
3. Poon C, Ho B. Update of Hepatitis A in Hong Kong. CD Watch 2015;12:14.
4. Centre for Health Protection, Department of Health. Summary on the recent upsurge of hepatitis A infection among MSM in Hong Kong. CD Watch 2017;14:24.
5. Chin KP, Lok ASF, Wong LSK, et al. Current seroepidemiology of hepatitis A in Hong Kong. J Med Virol 1991;34:191-3.
6. Tsang CW, Chan CL. Epidemiology of viral hepatitis in Hong Kong. In: New trends in peptic ulcer and chronic hepatitis-Part II. Chronic Hepatitis. Tokyo: Excerpta Medica;1987. p. 43-50.
7. Centre for Health Protection, Department of Health. Seroprevalence rates of hepatitis A virus antibodies. (Available at https://www.chp.gov.hk/en/statistics/data/10/641/701/3936.html. Accessed 14 September 2017)
8. Scientific Committee on AIDS and STI and Scientific Committee on Vaccine Preventable Diseases. Statement on hepatitis A vaccination and men who have sex with men. June 2017 (Available at https://www.chp.gov.hk/files/pdf/statement_on_hav_and_msm_201706.pdf. Accessed 30 October 2018)
9. Chiu DM, Chan MC, Yeung AC. Seroprevalence of hepatitis E virus in Hong Kong, 2008-2009. J Med Virol. 2013;85(3):459-61.
10. Centre for Health Protection, Department of Health. Review of hepatitis E infection (2001-2010). CD Watch 2011;8:1.
11. Centre for Health Protection, Department of Health. Update of hepatitis E infection in Hong Kong. CD Watch 2017;14:13.
12. Chau TN, Lai ST, Tse C, et al. Epidemiology and clinical features of sporadic hepatitis E as compared with hepatitis A. Am J Gastroenterol 2006;101:292-6.
13. Lam WY, Chan RCW, Sung JJY, et al. Genotype distribution and sequence variation of hepatitis E virus, Hong Kong. Emerging Infectious Diseases 2009;15:792-4.

87
14. Centre for Health Protection, Department of Health. Update in hepatitis E infection in Hong Kong. CD Watch 2012;9:5.
15. Chow CW, Tsang SW, Tsang OT, et al. Comparison of acute hepatitis E infection outcome in patients with and without chronic hepatitis B infection: a 10 year retrospective study in three regional hospitals in Hong Kong. J Clin Virol. 2014;60(1):4-10.
16. Centre for Food Safety, Food and Environmental Hygiene Department. Hepatitis E Virus in Fresh Pig Livers. Risk Assessment Studies Report HKSAR 2010;44:39.
17. Hepatitis E vaccine: WHO position paper, May 2015. Available at http://www.who.int/wer/2015/wer9018.pdf. Accessed on 14 September 2015.
18. Kwan LC, Ho YY, Lee SS. The declining HBsAg carriage rate in pregnant women in Hong Kong. Epidemiol Infect 1997;119:281-3.
19. Cooley L, Sasadeusz J. Clinical and virological aspects of hepatitis B co-infection in individuals infected with human immunodeficiency virus type-1. J Clin Virol 2003;26:185-93.
20. Yuen MF, Sablon E, Tanaka Y, et al. Epidemiological study of hepatitis B virus genotypes, core promoter and precore mutations of chronic hepatitis B infection in Hong Kong. J Hepatol 2004;41:119-25.
21. Chan HL, Hui AY, Wong ML, et al. Genotype C hepatitis B virus infection is associated with an increased risk of hepatocellular carcinoma. Gut 2004;53:1494-8.
22. Chan HL, Tsui SK, Tse CH, et al. Epidemiological and virological characteristics of 2 subgroups of hepatitis B virus genotype C. J Infect Dis 2005;191:2022-32.
23. Zhu L, Tse CH, Wong VSW, et al. A complete genomic analysis of hepatitis B virus genotypes and mutations in HbeAg-negative chronic hepatitis B in China. J Viral Hepatol 2008;15:449-58.
24. Chan HL, Tse CH, Mo G, et al. High viral load and hepatitis B virus subgenotype Ce are associated with increased risk of hepatocellular carcinoma. J Clin Oncol 2008;26:177-82.
25. Chan HL, Wong GL, Tse CH et al. Hepatitis B virus genotype C is associated with more severe liver fibrosis than genotype B. Clin Gastroenterol Hepatol 2009;7:1361-6.
26. Wong GL, Chan HL, Yiu KK, et al. Meta-analysis: The association of hepatitis B virus genotypes and hepatocellular carcinoma. Aliment Pharmacol Ther. 2013;37:517-26.
27. Lo CM, Cheung CK, Lau GK, et al. Significance of hepatitis B virus genotype in liver transplantation for chronic hepatitis B. Am J Transplant 2005;5:1893-900.
28. Yuen MF, Tanaka Y, Mizokami M, et al. Role of hepatitis B virus genotypes Ba and C, core promoter and precore mutations on hepatocellular carcinoma: a case control study. Carcinogenesis 2004;25:1593-8.
29. Chan AO, Yuen MF, Lam CM, et al. Prevalence and characteristics of familial hepatocellular carcinoma caused by chronic hepatitis B infection in Hong Kong. Aliment Pharmacol Ther 2004;19:401-6.

88
30. Ho CF, Wong KH,Chan CW, et al. Current pattern and course of acute hepatitis B virus infection in Hong Kong. J Gastroenterol Hepatol 2003;19:602-3.
31. Young BWY, Lee SS, Lim WL, et al. The long-term efficacy of plasma-derived hepatitis B vaccine in babies born to carrier mothers. J Viral Hepatol 2003;10:23-30.
32. Lin AWC, Wong KH. Long-term protection of neonatal hepatitis B vaccination in a 30-year cohort in Hong Kong. J Hepatol 2013:59:1363-4.
33. Yuen MF, Lim WL, Chan AO, et al. 18-year follow-up study of a prospective randomized trial of hepatitis B vaccinations without booster doses in children. Clin Gastroenterol Hepatol 2004;2:941-5.
34. Tse W, Mok T. Survey on Immunisation coverage among children aged two to five. Public Health & Epidemiology Bulletin 2002;11:13-8.
35. Tse WKM, Yeung SWT. Immunisation coverage among children aged two to five: an update. Public Health & Epidemiology Bulletin 2004;13:7-15.
36. Wu T, Chan SK, Kung KH, et al. Immunization coverage among children aged two to five: findings of the 2006 survey. Public Health & Epidemiology Bulletin 2007:16:57-68.
37. Chung PW, Suen SH, Chan OK, et al. Awareness and knowledge of hepatitis B infection and prevention and the use of hepatitis B vaccination in the Hong Kong adult Chinese population. Chin Med J 2012;125:422-7.
38. Centre for Health Protection, Department of Health. Hepatitis C in Hong Kong, 2008 to 2011. CD Watch 2011;8:25.
39. Hagan H, Jordan AE, Neurer J, et al., Incidence of sexually transmitted hepatitis C virus infection in HIV-positive men who have sex with men. AIDS 2015 Nov;29(17):2335-45.
40. Chan GCB, Lim WL, Yeoh EK. Prevalence of hepatitis C infection in Hong Kong. J Gastroen Hepatol 1992;7:117-20.
41. Wong HK, Lee CK, Leung JN, et al. Risk factor analysis of hepatitis C virus infection among Chinese blood donors in Hong Kong. Transfus Med 2012 Apr;22(2):133-6.
42. Au WY, Lee V, Kho B, et al. A synopsis of current haemophilia care in Hong Kong. Hong Kong Med J 2011 Jun;17(3):189-94.
43. Chan TM, Lok AS, Cheng IK, et al. Prevalence of hepatitis C virus infection in hemodialysis patients: a longitudinal study comparing the results of RNA and antibody assays. Hepatology 1993;17:5-8.
44. Lee KCK, Lim WWL, Lee SS. High prevalence of HCV in a cohort of injectors on methadone substitution treatment. J Clin Virol 2008;41:297-300.
45. Wong NS, Chan PC, Lee SS, et al., A multilevel approach for assessing the variability of hepatitis C prevalence in injection drug users by their gathering places. Int J Infect Dis 2013 Mar;17(3):e193-8.

89
46. Wong VW, Wong GL, Chim AM, et al., Targeted hepatitis C screening among ex-
injection drug users in the community J Gastroenterol Hepatol. 2014 Jan; 29(1): 116-20.
47. Centers for Disease Control and Prevention (CDC). Sexual Transmission of
Hepatitis C Virus Among HIV-Infected Men Who Have Sex with Men --- New York City, 2005--2010. MMWR Morb Mortal Wkly Rep. 2011 Jul 22;60:945-50.
48. Lin A, Wong P, Lo J. A case series of hepatitis C infection and syphilis among HIV positive men who have sex with men. Communicable Disease Watch 2014; 11.
49. Lin AWC, Wong KH, Chan K, More safer sex intervention needed for HIV-positive MSM with higher education level for prevention of sexually transmitted hepatitis C. Poster presentation P 131; HIV Drug Therapy Glasgow 2014.
50. Monga HK, Rodriguez-Barradas MC, Breaux K, et al. Hepatitis C virus infection-related morbidity and mortality among patients with human immunodeficiency virus infection. Clin Infect Dis 2001;33:240-7.
51. Delwart E, Slikas E, Stramer SL, et al. Genetic Diversity of Recently Acquired and Prevalent HIV, Hepatitis B Virus and Hepatitis C Virus Infections in US Blood Donars. JID 2012; 205:875-85.
52. Prescott LE, Simmonds P, Lai CL, et al. Detection and clinical features of hepatitis C virus type 6 infections in blood donors from Hong Kong. J Med Virol 1996;50:168-75.
53. Wong DA, Tong LK, Lim W. High prevalence of hepatitis C virus genotype 6 among certain risk groups in Hong Kong. Eur J Epidemiol 1998;14:421-6.
54. Chan TM, Lau JYN, Wu PC, et al. Hepatitis C virus genotypes in patients on renal replacement therapy. Nephrol Dial Transplant 1998;13:731-4.
55. Zhou DX, Tang JW, Chu IM, et al. Hepatitis C virus genotype distribution among intravenous drug user and the general population in Hong Kong. J Med Virol 2006;78:574-81.
56. Chan D, Lee SS, Lee KC. The effects of widespread methadone treatment on the molecular epidemiology of hepatitis C virus infection among injecting drug users in Hong Kong. J Med Virol 2011;83:1187-94.

90
57. Chan DP, Lin AW, Wong KH, et al., Diverse origins of hepatitis C virus in HIV co-infected men who have sex with men in Hong Kong. Virol J. 2015; 12:120
58. Seto WK, Lai CL, Fung J, et al. Natural history of chronic hepatitis C: genotype 1 versus genotype 6. J Hepatol 2010;53:444-8.
59. World Health Organization. Cancer fact sheet. (Available at http://www.who.int/mediacentre/factsheets/fs297/en/. Accessed on 2 September 2017)
60. Yuen MF, Hou JL, Chutaputti A, et al. Hepatocellular carcinoma in the Asia Pacific Region. J Gastroent Hepatol 2009;24:346-353.
61. Lo CM, Fan ST, Liu CL, et al. Ten-year experience with liver transplantation at Queen Mary Hospital: retrospective study. Hong Kong Med J 2002;8:240-4.
62. Hong Kong Cancer Registry, Hospital Authority. (Available at http://www3.ha.org.hk/cancereg/pdf/overview/Summary%20of%20CanStat%202016.pdf. Accessed on 28 December 2018)
63. Lim WL, Yeoh EK. Hepatitis A vaccination. Lancet 1992;339:304.
64. Lai CL. Hepatitis A risk heightened. Data quoted in United Daily News dated 10 June 1994.
65. Lee A, Cheng F, Lau L, et al. Changing hepatitis A epidemiology among Hong Kong Chinese adolescents: what are the implications? Public Health 1999; 113:185-8.
Copyright © 2022 FDOKUMEN