
Surface Structure Formation in Direct Chill (DC) Casting of Al ...
11
Surface Structure Formation in Direct Chill (DC) Casting of Al Alloys NAZLIN BAYAT 1 and TORBJO ¨ RN CARLBERG 1,2 1.—Department of Natural Science, Mid Sweden University, Holmgatan 10, 851 70 Sundsvall, Sweden. 2.—e-mail: [email protected] The aim of this study is to increase the understanding of the surface zone formation during direct chill (DC) casting of aluminum billets produced by the air slip technology. The depth of the shell zone, with compositions deviating from the bulk, is of large importance for the subsequent extrusion productivity and quality of final products. The surface microstructures of 6060 and 6005 aluminum alloys in three different surface appearances—defect free, wavy surface, and spot defects—were studied. The surface microstructures and outer appearance, segregation depth, and phase formation were investigated for the mentioned cases. The results were discussed and explained based on the exudation of liquid metal through the mushy zone and the fact that the exudated liquid is contained within a surface oxide skin. Outward solidifica- tion in the surface layer was quantitatively analyzed, and the oxide skin movements explained meniscus line formation. Phases forming at different positions in the segregation zone were analyzed and coupled to a cellular solidification in the exudated layer. INTRODUCTION The direct chill (DC) casting technique to produce semifinished aluminum castings, in other words billets for extrusion and ingots for rolling, was developed in the 1930s. 1 The principle, which is still valid, is a two-stage cooling with a primary cooling at a mold surface followed by water spraying directly on the surface. 2–4 Improvements on this technique have mainly focused on changes to the primary cooling, where a water-cooled metal mold has been replaced by different techniques to mini- mize cooling at this stage. The drive for develop- ment comes from the profile extrusion industry, which can increase the productivity and quality of extruded profiles by improving the billet surface appearance and structure. 5,6 Hot top casting sup- ported by airflow against the casting surface during the primary cooling is currently the standard pro- cedure to achieve acceptable billet surfaces. The goal is to minimize the depth of the surface segre- gation zone, which is the governing factor for the appearance of different phases in the surface region. Billet surface quality is evaluated by quantifying surface appearance, segregation zone thickness, and occurrence of large Mg 2 Si and b-particles near the surface. The surface segregation is a macroseg- regation defined as a heterogeneous distribution of alloying elements with long-range compositional differences between the outside and inside of this area. 7–9 Surface segregation in DC cast billets has been discussed in the literature (for example, References. 4 and 10–13). Specifically, the formation of the so-called lapping surface or Bergmann zones 4 with a wavy or banded surface appearance has been the subject of different theories. 6,10 It is, however, important to distinguish between older types of casting techniques where primary cooling occurs through direct contact with a cooled metal mold and the modern air-slip technique. Although this tech- nique gives a much thinner segregation zone, the concentration of alloy elements at the surface is about five to six times higher than the bulk con- centration at smooth surfaces without lapping. 13 Therefore, the formation of the segregation zone, also at smooth defect-free surfaces, must be dis- cussed. The industrial development of the casting tech- nique to improve surface appearance has not always been based on an understanding of how the surface zone is formed. Structural observations, JOM, Vol. 66, No. 5, 2014 DOI: 10.1007/s11837-014-0950-y Ó 2014 The Minerals, Metals & Materials Society 700 (Published online April 22, 2014)
-
Upload
khangminh22 -
Category
Documents
-
view
4 -
download
0
Transcript of Surface Structure Formation in Direct Chill (DC) Casting of Al ...

Surface Structure Formation in Direct Chill (DC) Castingof Al Alloys
NAZLIN BAYAT1 and TORBJORN CARLBERG1,2
1.—Department of Natural Science, Mid Sweden University, Holmgatan 10, 851 70 Sundsvall,Sweden. 2.—e-mail: [email protected]
The aim of this study is to increase the understanding of the surface zoneformation during direct chill (DC) casting of aluminum billets produced by theair slip technology. The depth of the shell zone, with compositions deviatingfrom the bulk, is of large importance for the subsequent extrusion productivityand quality of final products. The surface microstructures of 6060 and 6005aluminum alloys in three different surface appearances—defect free, wavysurface, and spot defects—were studied. The surface microstructures andouter appearance, segregation depth, and phase formation were investigatedfor the mentioned cases. The results were discussed and explained based onthe exudation of liquid metal through the mushy zone and the fact that theexudated liquid is contained within a surface oxide skin. Outward solidifica-tion in the surface layer was quantitatively analyzed, and the oxide skinmovements explained meniscus line formation. Phases forming at differentpositions in the segregation zone were analyzed and coupled to a cellularsolidification in the exudated layer.
INTRODUCTION
The direct chill (DC) casting technique to producesemifinished aluminum castings, in other wordsbillets for extrusion and ingots for rolling, wasdeveloped in the 1930s.1 The principle, which is stillvalid, is a two-stage cooling with a primary coolingat a mold surface followed by water sprayingdirectly on the surface.2–4 Improvements on thistechnique have mainly focused on changes to theprimary cooling, where a water-cooled metal moldhas been replaced by different techniques to mini-mize cooling at this stage. The drive for develop-ment comes from the profile extrusion industry,which can increase the productivity and quality ofextruded profiles by improving the billet surfaceappearance and structure.5,6 Hot top casting sup-ported by airflow against the casting surface duringthe primary cooling is currently the standard pro-cedure to achieve acceptable billet surfaces. Thegoal is to minimize the depth of the surface segre-gation zone, which is the governing factor for theappearance of different phases in the surface region.Billet surface quality is evaluated by quantifyingsurface appearance, segregation zone thickness,and occurrence of large Mg2Si and b-particles near
the surface. The surface segregation is a macroseg-regation defined as a heterogeneous distribution ofalloying elements with long-range compositionaldifferences between the outside and inside of thisarea.7–9
Surface segregation in DC cast billets has beendiscussed in the literature (for example, References.4 and 10–13). Specifically, the formation of theso-called lapping surface or Bergmann zones4 with awavy or banded surface appearance has been thesubject of different theories.6,10 It is, however,important to distinguish between older types ofcasting techniques where primary cooling occursthrough direct contact with a cooled metal mold andthe modern air-slip technique. Although this tech-nique gives a much thinner segregation zone, theconcentration of alloy elements at the surface isabout five to six times higher than the bulk con-centration at smooth surfaces without lapping.13
Therefore, the formation of the segregation zone,also at smooth defect-free surfaces, must be dis-cussed.
The industrial development of the casting tech-nique to improve surface appearance has notalways been based on an understanding of how thesurface zone is formed. Structural observations,
JOM, Vol. 66, No. 5, 2014
DOI: 10.1007/s11837-014-0950-y� 2014 The Minerals, Metals & Materials Society
700 (Published online April 22, 2014)

macrosegregation models, and composition mappinghave not been tied together in a comprehensiveway to describe the surface zone formation. Thisarticle is focused on understanding the formationof the surface segregation at the quantitative levelfor both smooth defect-free surfaces and surfaceswith lapping (Fig. 1a and b, respectively). This isdone as a comparison between some of the mostfrequently produced alloys applied in the extrusionindustry.
Different types of spot defects (Fig. 1c) also occurduring air-slip casting, which are generallyregarded as the results of oxide fragments releasingfrom the top plate. The formation of such spots isalso part of the study, as the microscopic observa-tions of the spots give information of generalimportance for the surface formation.
EXPERIMENTAL PROCEDURE
Microstructures and surface segregation of 6060and 6005 Al alloy with a smooth, wavy appearanceand spot defects were investigated. The composi-tions of mentioned alloys are given in Table I.
The samples were cut transverse to the surfaceand along the growth direction, and then they weremounted and polished. The cutting plane of spotdefects ran through the center of the spot. The wavydefect sample was cut in the vertical direction to thewaves, i.e., along the billet.
Surface segregation of the mentioned sampleswas studied by a light optic microscope (LOM). Ascanning electron microscope (SEM) was used toobserve the directly unprepared surface structures.The microstructures and formed phases of samplesfrom six billets were compared, and different seg-regation thicknesses, phases, and microstructures
were analyzed. Different phases were analyzed byenergy-dispersive x-ray spectroscopy (EDX).
RESULTS
In Fig. 2a and b, the surface segregations of thedefect-free billets for both 6060 and 6005 are illus-trated in cuts along the interfaces. In these smooth(defect free) surfaces, the segregation thickness isuniform and it is about 50–70 lm and 120–150 lmfor 6060 and 6005 alloys, respectively. The surfacesegregation depths around defects are not uniform,which can be seen at both wavy surfaces and spotdefects (Fig. 2c through f). The segregation zonedepths vary strongly in the wavy defect samples(Fig. 2c and d), which are 20–100 lm and30–200 lm in 6060 and 6005 alloys, respectively. InFigs. 2e and f, it can be seen that the segregation atsome distances from a spot is thicker than at thecenter of the spot.
In the wavy samples for both alloys, so-calledmeniscus lines can be observed. These lines seem tostart just after the bottom of a valley (at the arrowin Fig. 2c) and bend inward when the surface startsto perturb. By comparing Fig. 2c and d, the menis-cus line promotion inward is deeper in the 6005alloy, even though the valleys on the surface are notas deep as in the 6060 alloy sample. It is also obvi-ous that at the starting point of a meniscus line, inthe valleys, the exudation of high-alloy elements isnegligible or does not exist at all, which can be seenjust before the arrow in Fig. 2c.
Figure 3a and b shows smooth defect-free sur-faces from 6060 and 6005 billets, respectively,viewed by SEM directly on unprepared samples.Light phases in broom-like (fan-shaped)14 appear-ance dominate the structure, and the fan shapes are
Fig. 1. The stereo light microscope images: (a) smooth surface, (b) wavy surface, and (c) spot defects.
Table I. Chemical compositions of 6060 and 6005 Al alloys
Alloy Si Fe Cu Mn Mg Cr Zn Ti
6005 0.65 0.22 0.08 0.15 0.54 0.001 0.15 0.0376060 0.41 0.19 0.002 0.02 0.47 0.0006 0.004 0.016
Surface Structure Formation in Direct Chill (DC) Casting of Al Alloys 701

more obvious in the 6060 alloy. In the background ofboth alloys, but more clearly seen in the 6005, acellular structure is visible, where cells or dendritetips have grown toward the surface. In 6060(Fig. 3a), the cells are elongated and the light pha-ses are sometimes aligned to the intercellularregions.
In Fig. 3c, from the 6060 alloy, and Fig. 3d, fromthe 6005 alloy, a more detailed view of the surfacephases is shown together with the EDX spectra.Figure 3c shows the light plate-like phase, andFig. 3d shows phases filling out the intercellulargrooves. The Fe:Si ratios, recalculated to at.%, arefor the plate-like phases about 1:1 (Fig. 3c), and for
Fig. 2. Microstructures in cross sections along the growth direction from: (a) smooth surface of 6060; (b) smooth surface of 6005; (c) wavysurface in 6060, growth direction to the right; (d) wavy surface in 6005, growth direction to the left; (e) spot defect in 6060; and (f) spot defect in6005 Al alloys.
Bayat and Carlberg702
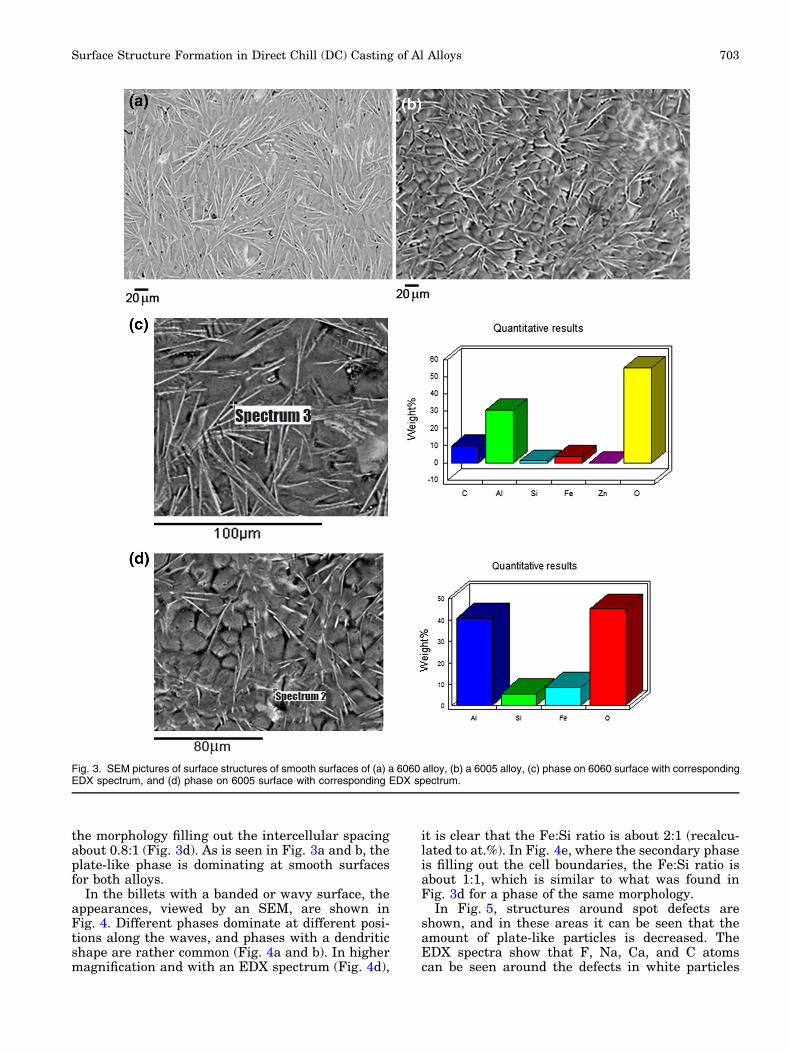
the morphology filling out the intercellular spacingabout 0.8:1 (Fig. 3d). As is seen in Fig. 3a and b, theplate-like phase is dominating at smooth surfacesfor both alloys.
In the billets with a banded or wavy surface, theappearances, viewed by an SEM, are shown inFig. 4. Different phases dominate at different posi-tions along the waves, and phases with a dendriticshape are rather common (Fig. 4a and b). In highermagnification and with an EDX spectrum (Fig. 4d),
it is clear that the Fe:Si ratio is about 2:1 (recalcu-lated to at.%). In Fig. 4e, where the secondary phaseis filling out the cell boundaries, the Fe:Si ratio isabout 1:1, which is similar to what was found inFig. 3d for a phase of the same morphology.
In Fig. 5, structures around spot defects areshown, and in these areas it can be seen that theamount of plate-like particles is decreased. TheEDX spectra show that F, Na, Ca, and C atomscan be seen around the defects in white particles
Fig. 3. SEM pictures of surface structures of smooth surfaces of (a) a 6060 alloy, (b) a 6005 alloy, (c) phase on 6060 surface with correspondingEDX spectrum, and (d) phase on 6005 surface with corresponding EDX spectrum.
Surface Structure Formation in Direct Chill (DC) Casting of Al Alloys 703

Fig. 4. SEM pictures of surface structures of wavy surfaces of (a) a 6060 alloy, (b) a 6005 alloy, (c) protruding tip in wave on 6060 surface, (d)phase on 6060 surface with corresponding EDX spectrum, and (e) phase on 6005 surface with corresponding EDX spectrum.
Bayat and Carlberg704
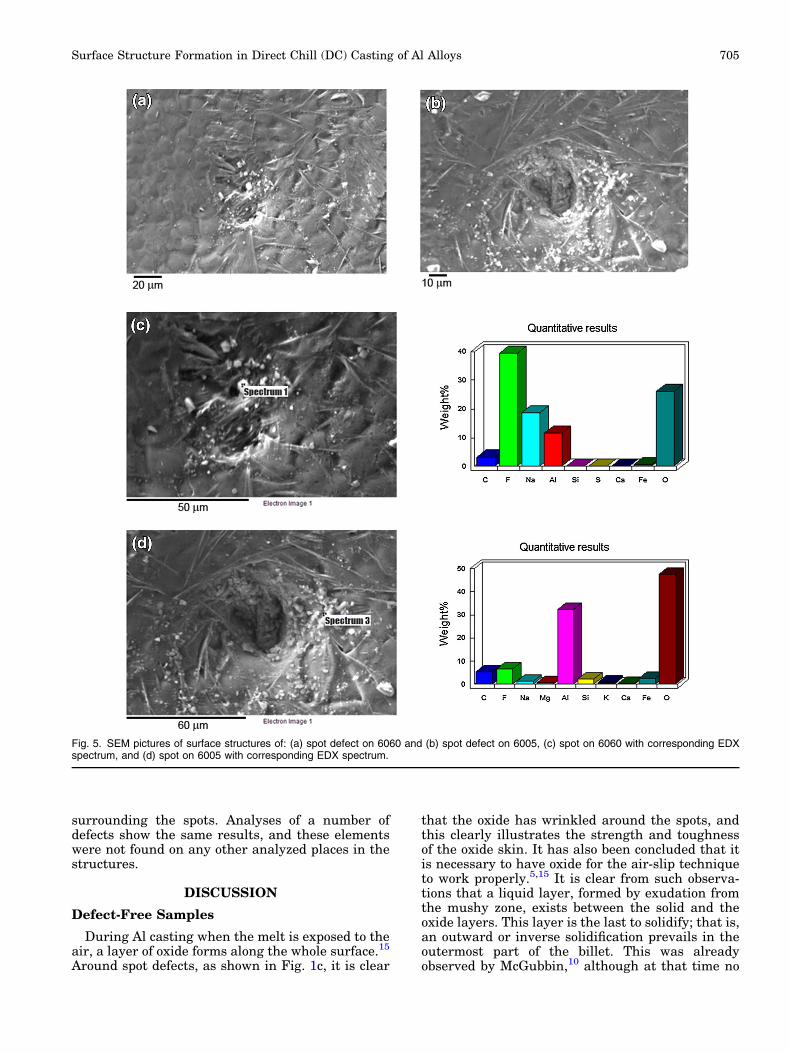
surrounding the spots. Analyses of a number ofdefects show the same results, and these elementswere not found on any other analyzed places in thestructures.
DISCUSSION
Defect-Free Samples
During Al casting when the melt is exposed to theair, a layer of oxide forms along the whole surface.15
Around spot defects, as shown in Fig. 1c, it is clear
that the oxide has wrinkled around the spots, andthis clearly illustrates the strength and toughnessof the oxide skin. It has also been concluded that itis necessary to have oxide for the air-slip techniqueto work properly.5,15 It is clear from such observa-tions that a liquid layer, formed by exudation fromthe mushy zone, exists between the solid and theoxide layers. This layer is the last to solidify; that is,an outward or inverse solidification prevails in theoutermost part of the billet. This was alreadyobserved by McGubbin,10 although at that time no
Fig. 5. SEM pictures of surface structures of: (a) spot defect on 6060 and (b) spot defect on 6005, (c) spot on 6060 with corresponding EDXspectrum, and (d) spot on 6005 with corresponding EDX spectrum.
Surface Structure Formation in Direct Chill (DC) Casting of Al Alloys 705

air-slip technique was used. The same thing wasalso pointed out for air-slip DC casting by Benumet al.11 However, in both those papers, the focus wason segregation at wavy surfaces, as illustrated herein Fig. 1c, and the consequences of the outwardsolidification were not penetrated. A totally consis-tent understanding of the surface zone formation,both for smooth and wavy surfaces, has thereforenot been published previously. The consequences ofthe inverse solidification in the surface zone will beanalyzed in the following and coupled to recentquantitative data of surface segregation.6,13
At smooth surfaces, the segregation zone has arelatively constant thickness (Fig. 2a and b), indi-cating that this type of surface is obtained when thepressure fluctuations in the melt, and thus themeniscus movements, are minimized. At such con-ditions, the melt, exudated from the mushy zone tothe layer between the oxide and the coherent solid,is relatively constant in time. The thickness of thelayer will depend on the metal head pressure, whichnormally is larger for larger diameters.11,16,17 Thelayer thickness depends even more so on the type ofalloy allowing for an increased segregation layer forlarger solidification intervals, as shown by modelingin Ref. 6 and as is seen if Fig. 2a and b are com-pared.
The typical structure of the outer part of thesegregation zone is directed solidification, some-times at a slightly tilted angle, toward the surface,in Fig. 2a and b. Looking at the structure directly onthe outer surface (Fig. 3, specifically Fig. 3b and d),a cellular growth front is revealed. This shows thatthe outer part of the segregation layer is solidifyingoutward with a cellular interface. It is, however, notclear if the visible segregation zone in transversecuts is the same as the total thickness of the exu-dation layer. In Ref. 13, the concentration profiles inthe surface zone were measured and it was gener-ally observed that the concentration started toincrease at about 400 lm, while the cellular struc-ture started closer to the surface. It is not likely, forthe studied alloys, that the exudation layer is aslarge as 400 lm, as the air gap formed due to solid-ification shrinkage will be smaller.6,18 Under certainconditions, for example higher alloyed billets andhigher metal pressure, the whole air gap can befilled, but in the cases discussed in this article, withsmooth surfaces, this is not the case and the liquidlayer is thinner. It is instead likely that the pointwhere the cellular growth starts is close to thethickness of the exudated layer. In the followingdiscussion, some theoretical estimations will bedone to further understand the solidification in theactual zone. During the outward solidification, seg-regation occurring at the front should follow amicrosegregation pattern. If measured concentrationprofiles are studied,6,13 then a strongly increasingconcentration toward the surface indicates a segre-gation following a simple Scheil plot. However, it isnot possible to fit a Scheil curve directly to a surface
segregation profile as the profile is a result of firstmicrosegregation between dendrite arms and grainsat the same time as liquid is pressed out (the exu-dated layer), and subsequently that layer solidifiesin a directional cellular mode. In Fig. 6, theunmodified Scheil equation has been used to plotpossible surface profiles, and in Fig. 6b, data havebeen added from an experimental profile of 6005alloy.13 To reasonably fit the data, it must be as-sumed that the solidification of the exudated layer,200 lm thick in the actual measured profile,13 startswhen the solid fraction reaches 85%. By doing this, arelatively good fit is obtained, but the surface con-tents are lower than the calculated. The calculationassumes a planar front and that all solute is rejectedoutward, but the solidification is cellular and thusthe segregation should not be as strong as the the-oretical prediction, which explains the difference.
Fig. 6. (a) Scheil equation calculation for 6060 and (b) Scheilequation calculation and experimental results for 6005 alloy.
Bayat and Carlberg706
It can be concluded that the strong accumulationof alloying elements to the surface can be describedby segregation during outwards solidification.
From Fig. 2, it seems that a planar interface isbroken down and becomes cellular at a certain stageduring outward growth, which can be treated by thetheory for constitutional super cooling:19
G
R� �mlC0 1� Kð Þ
KDl; Planar interface: (2)
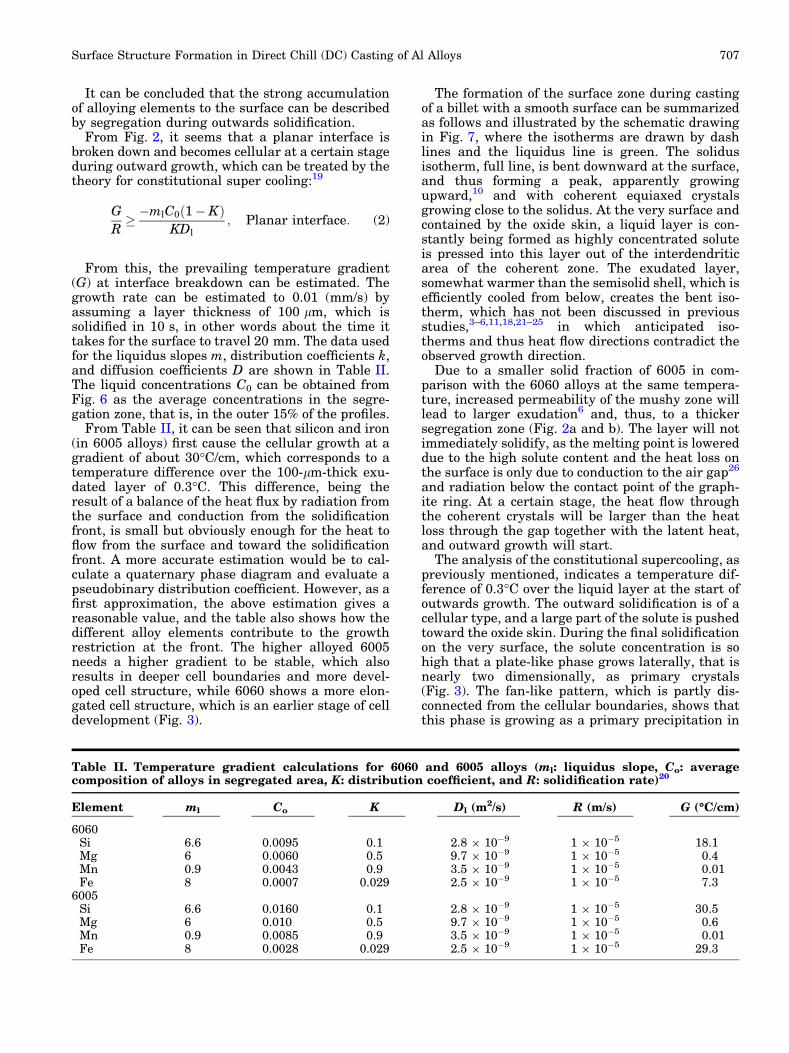
From this, the prevailing temperature gradient(G) at interface breakdown can be estimated. Thegrowth rate can be estimated to 0.01 (mm/s) byassuming a layer thickness of 100 lm, which issolidified in 10 s, in other words about the time ittakes for the surface to travel 20 mm. The data usedfor the liquidus slopes m, distribution coefficients k,and diffusion coefficients D are shown in Table II.The liquid concentrations C0 can be obtained fromFig. 6 as the average concentrations in the segre-gation zone, that is, in the outer 15% of the profiles.
From Table II, it can be seen that silicon and iron(in 6005 alloys) first cause the cellular growth at agradient of about 30�C/cm, which corresponds to atemperature difference over the 100-lm-thick exu-dated layer of 0.3�C. This difference, being theresult of a balance of the heat flux by radiation fromthe surface and conduction from the solidificationfront, is small but obviously enough for the heat toflow from the surface and toward the solidificationfront. A more accurate estimation would be to cal-culate a quaternary phase diagram and evaluate apseudobinary distribution coefficient. However, as afirst approximation, the above estimation gives areasonable value, and the table also shows how thedifferent alloy elements contribute to the growthrestriction at the front. The higher alloyed 6005needs a higher gradient to be stable, which alsoresults in deeper cell boundaries and more devel-oped cell structure, while 6060 shows a more elon-gated cell structure, which is an earlier stage of celldevelopment (Fig. 3).
The formation of the surface zone during castingof a billet with a smooth surface can be summarizedas follows and illustrated by the schematic drawingin Fig. 7, where the isotherms are drawn by dashlines and the liquidus line is green. The solidusisotherm, full line, is bent downward at the surface,and thus forming a peak, apparently growingupward,10 and with coherent equiaxed crystalsgrowing close to the solidus. At the very surface andcontained by the oxide skin, a liquid layer is con-stantly being formed as highly concentrated soluteis pressed into this layer out of the interdendriticarea of the coherent zone. The exudated layer,somewhat warmer than the semisolid shell, which isefficiently cooled from below, creates the bent iso-therm, which has not been discussed in previousstudies,3–6,11,18,21–25 in which anticipated iso-therms and thus heat flow directions contradict theobserved growth direction.
Due to a smaller solid fraction of 6005 in com-parison with the 6060 alloys at the same tempera-ture, increased permeability of the mushy zone willlead to larger exudation6 and, thus, to a thickersegregation zone (Fig. 2a and b). The layer will notimmediately solidify, as the melting point is lowereddue to the high solute content and the heat loss onthe surface is only due to conduction to the air gap26
and radiation below the contact point of the graph-ite ring. At a certain stage, the heat flow throughthe coherent crystals will be larger than the heatloss through the gap together with the latent heat,and outward growth will start.
The analysis of the constitutional supercooling, aspreviously mentioned, indicates a temperature dif-ference of 0.3�C over the liquid layer at the start ofoutwards growth. The outward solidification is of acellular type, and a large part of the solute is pushedtoward the oxide skin. During the final solidificationon the very surface, the solute concentration is sohigh that a plate-like phase grows laterally, that isnearly two dimensionally, as primary crystals(Fig. 3). The fan-like pattern, which is partly dis-connected from the cellular boundaries, shows thatthis phase is growing as a primary precipitation in
Table II. Temperature gradient calculations for 6060 and 6005 alloys (ml: liquidus slope, Co: averagecomposition of alloys in segregated area, K: distribution coefficient, and R: solidification rate)20
Element ml Co K Dl (m2/s) R (m/s) G (�C/cm)
6060Si 6.6 0.0095 0.1 2.8 9 10�9 1 9 10�5 18.1Mg 6 0.0060 0.5 9.7 9 10�9 1 9 10�5 0.4Mn 0.9 0.0043 0.9 3.5 9 10�9 1 9 10�5 0.01Fe 8 0.0007 0.029 2.5 9 10�9 1 9 10�5 7.3
6005Si 6.6 0.0160 0.1 2.8 9 10�9 1 9 10�5 30.5Mg 6 0.010 0.5 9.7 9 10�9 1 9 10�5 0.6Mn 0.9 0.0085 0.9 3.5 9 10�9 1 9 10�5 0.01Fe 8 0.0028 0.029 2.5 9 10�9 1 9 10�5 29.3
Surface Structure Formation in Direct Chill (DC) Casting of Al Alloys 707

the surface layer. The EDX analysis, showing aFe:Si ratio of 1:1, and the plate-like shape indicatesthat this phase is b-phase of the type (Al5FeSi). It isclear that this phase dominates for both 6060 and6005 alloys in the top layer of smooth surfaces.
Wavy Defect Samples
When the wavy defect surfaces (Figs. 1b, 2c andd) are formed, the meniscus is moving due to peri-odic variations in the metal head pressure. Thelength of the waves is 3–4 mm, which correspondsto about 2 s at normal casting speed and can be
coupled to the frequency of the ‘‘rocking’’ of theliquid in the casting table. ‘‘Rocking’’ is an effect ofbubbling when the gas, pressed through thegraphite ring, is escaped through the liquid in themold top.
When a clear wavy surface or ‘‘lapping’’ occurs onthe surface, a ‘‘meniscus line’’ effect can be observedin the structure (Fig. 2c and d). When the pressureof the melt decreases, the meniscus is movingdownward, and the crystals in the mushy zone arecompressed against the coherent solid by the oxide-covered surface (as is shown in Fig. 8a). Therefore,the meniscus line will be a nearly linear grainboundary line contrasting to all other grain bound-aries, which are randomly connected (Fig. 2c and d).Along the line, there might also be some increasedamount of solute pressed out as the crystals aremoved together. The lower part of the meniscus linenear the surface may solidify without any exudatedlayer and thus with minimum surface segregation(Fig. 2c).
When the metal pressure increases again, themeniscus is lifted and new liquid moves into thespace between the meniscus line and meniscus itself(Fig. 8b). This melt may already contain somefloating crystals and equiaxed solidification begins.The increased pressure will make the surface, withits oxide layer, bulge out, and thus the wavy surfacewith the typical lapping lines is formed. The solidi-fication of these zones can proceed in different ways,either as equiaxed growth followed by outwardsolidification, or if the surfaces at the bulged tipscontact the graphite ring, the outward solidificationmight not occur. The zones will be segregationzones with higher solute content, and the thick-nesses of these zones are clearly larger for the wavysurfaces than for smooth surfaces. In Ref. 13, whereconcentration profiles at different surfaces weremeasured, clear variations could be revealed. Theaforementioned different solidification possibilities
Fig. 8. Schematic model of meniscus line formation during DC casting: (a) floating crystals are pressed by meniscus and (b) meniscus line hasformed after pressure reduction.
Fig. 7. Schematic drawing of billet solidification during DC casting.
Bayat and Carlberg708
of the segregation layer can explain the foundvariations, and the most important factors for thethickness of the segregated layer are the (I) alloycontent and (II) metal head pressure and amplitudeof the pressure variations. The casting temperatureis, as long as freezing of the meniscus is avoided, ofsmaller importance for the surface segregation, andno differences could be revealed in this study oftemperature effects.
Another factor that can influence the exudationand cause non-uniformity at the surface is crackingof the oxide layer, which allows fresh metal to comeoutside of the oxide layer. The melt may then fill thegap between billet and graphite ring and formanother type of surface. This was, to some extent,discussed in Refs. 6 and 11 but appears more readilyin higher alloyed billets than those discussed in thisarticle. This phenomena has also been correlated tothe surface tension and the plasticity of themeniscus, and some alloy elements can reducethe surface tension and thus the strength of themeniscus.12
The surface phases studied by SEM on the wavysurfaces are somewhat different from what wasfound on the smooth surface. On the latter, theplate-like beta phase was completely dominating,but on the wavy surfaces, beta phase still exists buttogether with other phases (Fig. 4).
Figure 4a shows a lower magnification view of thetop of a wave, showing from corner to corner. In theupper-right corner, the beta phase is dominating,but on the diagonal on the top of the wave, thestructure is different. Two structure features can beregularly seen, namely dendritic-like phases, whichseem to have grown independently from the cellularunderlying structure and are very thin. They seemto have been growing in a two-dimensional patternon the very surface (Fig. 4b and d). A phase of an-other morphology is filling the areas around thecells (Fig. 4e). Furthermore, a larger tip sticking outof the surface can be observed (Fig. 4c). The EDXanalysis reveals Fe:Si ratios (recalculated to at.%)for the dendritic phases in Fig. 4d of about 2:1,indicating that these phases are a-phase with apossible composition of Al8Fe2Si,27 while the phasein Fig. 4e is closer to beta with a ratio of 1:1.
The different phases that appear can be under-stood by the fact that Fe has a small distributioncoefficient, and if solute from the latest stages of thesolidification are pressed into some regions, theFe:Si ratio will be high and the alpha phase will beformed. Also, the difference between the two alloysis important, as the Si content in 6005 is higher atthe start and the Fe:Si ratio will be kept lower, alsoafter segregation, which will promote beta phaseformation. It could also be seen in the cell bound-aries (Fig. 4e) that more beta phase occured in the6005 alloy. This is in agreement with what wasfound in transverse cuts close to the surface,11 inthat phases occuring in cell boundaries in 6005 arebeta phase.
Spot Defect Samples
At the spot defects, the oxide skin seems to bepinned to the solid, and the exudated layer is notable to form a continuous liquid layer at the spots(Figs. 1c, 2e and f). Especially in Fig. 1c, it looks asthough there is a pressure on the oxide skin fromthe exudation liquid, while the pinning seems toresist the pressure. These types of spot defects oftenappearing along lines parallel to the billet growthdirection, so-called ‘‘snail trails,’’ and it is commonlyregarded as oxide defects. In Ref. 28 it was shownthat it is possible to provoke these defects by intro-ducing disturbances on the top plate (transitionplate). When the liquid flow along the top plate wasdisturbed, lines of spot defects occurred on the billetsurface.
In the EDX spectra in Fig. 5, it is clear that theelements F and Na are present at high concentra-tions around these spots, indicating that they mayplay an important role in the spot defect occurrence.F and Na are elements that can be found in cryolite(Na3AlF6), which is the base for the electrolytic bathin primary aluminum production.29,30 It has oftenbeen speculated what effects the bath rests, follow-ing the aluminum to the cast house, can have on thecasting. Here, it can be seen as clear evidence that Fand Na are involved in spot defect formation.
The mechanism of spot defect formation might bethat disturbances of the flow will make the liquid,with its oxide skin, contact the graphite ring inter-mittently. Furthermore, during contact, coolingincreases and solid nucleates come in contact withthe oxide skin. Later, this solid nucleus will be partof the coherent crystals forming the start of theshell, but as liquid is exudated to the surface layer,the solid at these spots is connected to the skin andonly the skin around the spots is bulged out.
The roll of the F and Na can be that they weakenthe oxide and thus improve the contact betweenliquid aluminum and the graphite ring. Maybe thespot defects can also form without bath rests in themelt, as they are rather frequently occurring, butthe existence of these elements probably makes thecasting more sensitive to disturbances along the topplate.
CONCLUSION
Exudation of melt from the mushy zone duringbillet air-slip casting occurs against a flexible oxideskin, thus forming a surface layer, which solidifiesoutward.
The outward solidification is cellular, with moreelongated cells for the 6060 alloy and more roundedfor 6005. The cellular growth gives a strong segre-gation to the outermost layer at the oxide skin withconcentrations 5–6 times higher than bulk level.
When the meniscus is not fluctuating, because ofsmall pressure variations in the table, a smoothbillet surface is obtained, but still exudation to alayer of constant thickness occurs.
Surface Structure Formation in Direct Chill (DC) Casting of Al Alloys 709

When the meniscus is fluctuating, because ofmoderate pressure variations in the table, the exu-dation layer thickness becomes periodic and largerthan at a smooth surface, but for 6060 and 6005alloys, the layer normally stays within the oxide skin.
At smooth surfaces, the outermost layer is domi-nated by b-phase, while at the wavy surfaces alsoa-phase at different morphologies appears.
The fluctuating meniscus with its oxide skincompresses the floating crystals against the coher-ency zone, thus forming the meniscus line effect.
Impurities such as NaF and KF affect the surfacetensions of involved phases and cause the oxide skinto pin the solid shell, which lead to spot defects onthe billet surface.
ACKNOWLEDGEMENTS
The European Development Fund is acknowl-edged for financial support, and Kubikenborg Alu-minium AB is acknowledged for providing materialsand for stimulating discussions of casting practices.
REFERENCES
1. W. Schneider, Light Metals 2002, ed. W. Schneider (War-rendale, PA: TMS, 2002), pp. 433–437.
2. D.G. Eskin, V.I. Savran, and L. Katgerman, Metall. Mater.Trans. A 36A, 1965 (2005).
3. J.W. Evans and W.K. Jones, Light Metals 2002, ed. W.Schneider (Warrendale, PA: TMS, 2012), pp. 669–679.
4. W.J. Bergmann, Metall. Trans. 1, 3361 (1970).5. F. Iverson (Ph.D. Dissertation, NTNU, Trondheim, 2002).6. D. Mortensen, B.R. Henriksen, M. Hamdi, and H.G. Fjaer,
Light Metals 2008, ed. D.H. DeYoung (Warrendale, PA:TMS, 2008), pp. 773–779.
7. A.V. Reddy and C. Beckermann, Metall. Mater. Trans. B28B, 479 (1997).
8. W.R. Osorio, J.E. Spinelli, I.L. Ferreira, and A. Garcia,Electrochim. Acta 52, 3256 (2007).
9. A.P. Boeira, I.L. Ferreira, and A. Garcia, Mater. Sci. Eng. A435, 150 (2006).
10. J.G. McGubbin, Light Metals 1975, ed. R. Rentsch (War-rendale, PA: TMS, 1975), pp. 137–159.
11. S. Benum, A. Hakonsen, J.E. Hafsas, and J. Sivertsen, LightMetals 1999, ed. C.E. Eckert (Warrendale, PA: TMS, 1999),pp. 737–742.
12. I.F. Bainbridge, J.A. Taylor, and A.K. Dahle, Light Metals2004, ed. A.T. Tabereaux (Warrendale, PA: TMS, 2004),pp. 693–698.
13. M. Erdegren and T. Carlberg, Light Metals 2011, ed. S.J.Lindsay (Warrendale, PA: TMS, 2011), pp. 675–680.
14. H. Fredriksson and U. Akerlind, Materials ProcessingDuring Casting, 1st ed. (Chichester, UK: Wiley, 2006),p. 148.
15. J.M. Ekenes, Light Metals 1991, ed. E. Rooy (Warrendale,PA: TMS, 1991), pp. 933–939.
16. J.F. Grandfield and P.T. McGlade, Mater. Forum 20, 29(1996).
17. R. Nadella, D.G. Eskin, Q. Du, and L. Katgerman, Prog.Mater Sci. 53, 421 (2008).
18. M. Hamdi, A. Mo, D. Mortensen, and H.G. Fjaer, LightMetals 2002, ed. W. Schneider (Warrendale, PA: TMS,2002), pp. 695–702.
19. W.A. Tiller, K.A. Jackson, J.W. Rutter, and B. Chalmers,Acta Metall. 1, 383 (1953).
20. Y. Du, Y.A. Chang, B. Huang, W. Gong, Z. Jin, H. Xu, Z.Yuan, Y. Lio, Y. He, and F.Y. Xie, Mater. Sci. Eng. A 363,140 (2003).
21. M. Hamdi and A. Mo, Light Metals 2008, ed. D.H. DeYoung(Warrendale, PA: TMS, 2008), pp. 765–771.
22. H.J. Thevik, A. Mo, and T. Rusten, Metall. Mater. Trans. B30B, 135 (1999).
23. M. Zaloznik and B. Sarler, Mater. Sci. Eng. A 413–414, 85(2005).
24. Q. Du, D.G. Eskin, and L. Katgerman, Metall. Mater. Trans.A 38A, 180 (2007).
25. C. Beckermann, Int. Mater. Rev. 47, 243 (2002).26. A. Prasad and I. Bainbridge, Metall. Mater. Trans. A 44A,
3099 (2013).27. N.C.W. Kuijpers, F.J. Vermolen, C. Vuik, and S.V. Zwaag,
Mater. Forum 28, 1040 (2004).28. T. Carlberg and A.E.W. Jarfors, Metall. Mater. Trans. B
45B, 175 (2014).29. A. Silny and T.A. Utigard, Light Metals 1997, ed. R. Huglen
(Warrendale, PA: TMS, 1997), pp. 871–878.30. C. Dupuis and J.P. Martin, Light Metals 1997, ed. R. Huglen
(Warrendale, PA: TMS, 1997), pp. 857–864.
Bayat and Carlberg710