Surface Effects in the Pressure-Induced Structural Transformation of a ZnO Nanorod
21
Surface Effects in the Pressure-Induced Structural Transformation of a ZnO Nanorod Journal: Zeitschrift für Anorganische und Allgemeine Chemie Manuscript ID: zaac.200900260.R1 Wiley - Manuscript type: Article Date Submitted by the Author: 29-Jul-2009 Complete List of Authors: Frenzel, Johannes; TU Dresden, Physikalische Chemie Seifert, Gotthard; TU Dresden, Physikalische Chemie Zahn, Dirk; MPI CPfS Keywords: structural transformations, nucleation processes, surface effects Wiley-VCH ZAAC
-
Upload
ruhr-uni-bochum -
Category
Documents
-
view
3 -
download
0
Transcript of Surface Effects in the Pressure-Induced Structural Transformation of a ZnO Nanorod

Surface Effects in the Pressure-Induced Structural
Transformation of a ZnO Nanorod
Journal: Zeitschrift für Anorganische und Allgemeine Chemie
Manuscript ID: zaac.200900260.R1
Wiley - Manuscript type: Article
Date Submitted by the
Author: 29-Jul-2009
Complete List of Authors: Frenzel, Johannes; TU Dresden, Physikalische Chemie
Seifert, Gotthard; TU Dresden, Physikalische Chemie
Zahn, Dirk; MPI CPfS
Keywords: structural transformations, nucleation processes, surface effects
Wiley-VCH
ZAAC

Surface Effects in the Pressure-Induced
Structural Transformation of a ZnO Nanorod
Johannes Frenzel1,2, Gotthard Seifert2 and Dirk Zahn1*
1 Dresden, Max-Planck-Institut für Chemische Physik fester Stoffe 2 Dresden, Technische Universität, Institut für Physikalische Chemie * [email protected] Bei der Redaktion eingegangen am
Dedicated to Prof. Matrin Jansen on the occasion of his 60th birthday.
Page 1 of 20
Wiley-VCH
ZAAC
123456789101112131415161718192021222324252627282930313233343536373839404142434445464748495051525354555657585960
1
Abstract
We report on molecular dynamics simulations of an atomistic zinc oxide nanorod model
embedded in a pressure medium. The transformation of the nanorod from the wurtzite to
the rocksalt structure is investigated using both ‘brute-force’ over-pressurization and
transition path sampling at a much lower pressure. The latter approach yields the
underlying mechanisms at more realistic conditions and reveals the interplay of the
morphogenesis of the rocksalt-type structure domains with shape deformation of the
overall nanorod. Surface effects are observed to not only influence dedicated nucleation
sites but also impose control mechanisms to phase growth and to specific shape
deformation.
Page 2 of 20
Wiley-VCH
ZAAC
123456789101112131415161718192021222324252627282930313233343536373839404142434445464748495051525354555657585960

2
Introduction
While for many decades the investigation of high-pressure polymorphs has focused on
bulk materials, the advance of nanocrystal research has recently opened a new
perspective to this field. After the first demonstration of the size dependence of first order
solid-solid transitions [1], Alivisatos and coworkers elaborated a series of further
phenomena related to the finite size of nanoparticles. The latter include critical delimiters
for nanocrystal metastability [2], and nanorod fracture [3]. Moreover, the importance of
shape deformation for exploring the mechanisms of wurtzite-rocksalt transformations
was demonstrated [4].
Complementing the experimental efforts, molecular dynamics simulations represent a
promising tool, in particular, for the investigation of the transformation mechanisms.
While this approach offers femto-second resolution at the atomistic level of detail, an
important limitation to the exploration of first-order transitions originates from the short
simulation time scales accessible. To enforce the crossing of nucleation barriers within
pico to nano-seconds, conventional approaches refer to a considerable degree of over-
pressurization. By now, this method was applied in a large series of simulation studies,
including the wurtzite→rocksalt transition of nano crystal models [5,6].
A typical shortcoming of such ‘brute-force’ molecular dynamics simulations is related to
the strong driving of the process kinetics which –for studies in the bulk- were shown to
severely bias the mechanistic analyses [7]. To overcome this limitation, we recently
Page 3 of 20
Wiley-VCH
ZAAC
123456789101112131415161718192021222324252627282930313233343536373839404142434445464748495051525354555657585960

3
demonstrated the suitability of the transition path sampling (TPS) approach for tackling
nucleation barrier crossing in solid-solid transformations [8].
Moreover, in 2007, Dellago and coworkers pioneered TPS simulations of solid-solid
transitions in nanoparticles at the example of a Cd528Se528 nanocrystal [9]. In concordance
to previous TPS simulations related to bulk CdSe [10], also for the nanocrystal strong
evidence for a layer sliding mechanism was obtained. Dellago and coworkers could
furthermore observe preferential nucleation at the surface, followed by domain growth
via subsequent (100) layer sliding [9]. Though limited by the small size of the
nanoparticle model, some insights into the competition of the up and down shifting of
(100) planes could be obtained.
In the present work, the interplay of shape deformation with structural motif nucleation
and domain growth is explored in further detail. From this we wish to explore the role of
interface/surface energy minimization and its implications to the nanoparticle shape after
transforming to the rocksalt structure. This requires the modeling of sufficiently large
nanocrystal models to reduce the tendency towards coupling of the atomic displacements
inherent to particularly small nanoparticles. Moreover, the role of different (over-
)pressurization is explored by contrasting the TPS approach to ‘brute-force’ molecular
dynamics simulations.
Page 4 of 20
Wiley-VCH
ZAAC
123456789101112131415161718192021222324252627282930313233343536373839404142434445464748495051525354555657585960

4
Simulation Details
Our studies are based on a periodic simulation system comprising of a nanorod embedded
in a solution of spherical particles acting as a medium to exert hydrostatic pressure (fig.
1). The particles of the surrounding medium intact via Lennard-Jones (lj) type potentials,
only. To hinder crystallization of the pressurization medium, the solution was prepared of
two types of particles Plj1 and Plj
2 with different van-der-Waals radii of 5 and 6 Å,
respectively. This choice was motivated by performing 1 nanosecond molecular
dynamics simulations of the pure Plj1 / Plj
2 liquid which did not exhibit crystallization at a
pressure of 10 GPa.
The ZnO force-field was chosen from Lewis and Catlow [11]. We performed structure
optimizations at 0 Kelvin of the wurtzite and the rocksalt modification and calculated the
coexistence pressure as 5.8 GPa. A full list of all interaction potentials is provided in
table 1 [11,12]. The molecular dynamics simulations were performed at constant pressure
(9 to 6 GPa) and constant temperature (300 K) using a time-step of 0.1 fs.
Within the TPS scheme [13,14], the molecular dynamics simulations are focused on
relatively short time-sketches in which the process of interest occurs, and largely ignore
the ‘waiting’ time required for the observation of spontaneous nucleation events. Starting
from an initial transformation pathway needed as a prerequisite, TPS creates further
transition routes in an iterative manner. This corresponds to a Monte-Carlo sampling of
the trajectory space of pathways. The first transformation pathway was obtained by
Page 5 of 20
Wiley-VCH
ZAAC
123456789101112131415161718192021222324252627282930313233343536373839404142434445464748495051525354555657585960
5
applying sufficiently large pressure and exploring the atomic movement from a 14 ps
molecular dynamics simulations. Several pressure values were tested and at 9 GPa the
transformation was found to occur spontaneously. However, as known from the Oswald
rule of phases, the extreme driving forces used in such ‘brute-force’ approaches typically
lead to the fastest, rather than the thermodynamically preferred mechanistic route.
Nevertheless, by using such pathways as a starting point to TPS iterations, realistic
transition routes may be obtained after convergence of the Monte-Carlo sampling in
trajectory space [15,16,17]. The TPS procedure works at a much larger range of driving
forces (for processes such as reactions in solution no external driving is needed at all).
Performing TPS at 9 GPa only provides variations of the trajectory illustrated in figure 1
and does not allow additional insights. However, by lowering the simulation pressure to 6
GPa we could investigate the phase transition at conditions for which 100 ps straight-
forward molecular dynamics simulations did not show spontaneous transformation. More
importantly, the reduction to more realistic external driving leads to mechanistic changes
which may be too subtle to be observed from over-pressurization. The mechanistic
analysis as described in the following is based on 800 TPS iterations of which 109 were
identified as successful transformation routes. During the automated sampling procedure,
the average (nearest-neighbor, rij ≤ 2.5 Å) coordination number was used as an order
parameter for discriminating different crystal structures.
Page 6 of 20
Wiley-VCH
ZAAC
123456789101112131415161718192021222324252627282930313233343536373839404142434445464748495051525354555657585960

6
Results
In anology to previous findings for bulk ZnO/CdSe and CdSe nanorods [9,10], the
wurtzite→rocksalt transformation was found to occur via a two-step process comprising
of a wurtzite→h-MgO transition and subsequent transformation to the rocksalt structure.
The former step reflects a simple axial compression along the [001] direction. In the
following, we focus on the second step, i.e. the h-MgO→rocksalt transition for which a
peculiar interplay of phase nucleation and growth with the shape and structure of the
nanorod was observed. This phenomenon originates to the sliding of (100) layers
occurring during the transformation which –depending on their implementation- may
give rise to drastic shape changes.
For the simulation runs performed at 9 GPa, almost all layer sliding events may be
characterized by alternating parallel and anti-parallel (100) layer shifts. As a
consequence, the hexagonal shape of the (001) faces of the nanorod is largely preserved
and a rocksalt structure type nanorod of a hexagonal prismatic habitus is formed (fig.1).
The corresponding surface structure displays a large density of imperfections such as
steps and notches. Both are unfavorable in potential energy and should give rise to
different nanocrystal morphologies. We explored profiles of the potential energy for the
rocksalt structure type nanocrystals obtained from transition path sampling at 6 GPa.
Figure 2 clearly shows the importance of the surface structure for the local potential
energy profile. Moreover, the disfavoring of steps and notches may be identified as a
surface effect acting on the h-MgO→rocksalt transformation.
Page 7 of 20
Wiley-VCH
ZAAC
123456789101112131415161718192021222324252627282930313233343536373839404142434445464748495051525354555657585960

7
While this subtle effect is overrun at 9 GPa (i.e. the conditions at which the starting
pathway #1 was prepared), at more modest driving of the transition process (6 GPa), the
surface effect takes a significant role leading to a different type of transformation routes.
This evolution of transition pathways gives rise to drastic changes in the nanocrystal
shape aiming at more smooth surfaces. Along this line, the overall mechanism of (100)
layer sliding is preserved, whilst the sequence of up and down shifts is changed
considerable from the antiparallel shuffling observed for bulk models [10,18]. Indeed,
only the very first onset of rocksalt domain nucleation occurs via antiparallel layer sliding
moves (fig. 3). Once a rocksalt domain -including patches of the nanorod surfaces- is
established, the systems tendency to avoid surface stress controls the direction of the
layer shifting during further phase growth. The latter involves a series of parallel
displacements which give rise to the formation of smooth nanorod surface patches.
Accordingly, the final shape of the nanorod much depends on the morphogenesis of
phase nucleation and growth. As the h-MgO type nanorod corresponds to an ideal
hexagonal prism with smooth surfaces, the very initial stage of nucleation, i.e. the
shifting of three adjacent (100) layers, requires the formation of ridges irrespective of
parallel or antiparallel layer shifting. The surface effect discussed above hence does not
yet apply and the atomic displacements follow the same mechanism as observed for bulk
models with periodic boundaries. Indeed, from the perspective of a very initial phase
nucleus the embedding nanocrystal of a few nm dimensions appears quite akin to a bulk
structure. This picture changes drastically as soon as a first patch of rocksalt-type
Page 8 of 20
Wiley-VCH
ZAAC
123456789101112131415161718192021222324252627282930313233343536373839404142434445464748495051525354555657585960

8
nanocrystal surface is established. After the shifting of the first three (100) layers, all
further displacements of adjacent layers follow the direction of the previous one. As a
consequence, the initial nucleation site is ‘marked’ by a kink in the nanorod surface,
whilst further phase growth involves smooth surface patches, only.
Page 9 of 20
Wiley-VCH
ZAAC
123456789101112131415161718192021222324252627282930313233343536373839404142434445464748495051525354555657585960

9
Conclusion
In conclusion, we reported on transition path sampling molecular dynamics simulations
of the wurtzite to rocksalt transformation of zinc oxide nanorod model embedded by a
pressure medium. By choosing sufficiently large nanorod dimensions and by
discrimination of different pressure conditions, a detailed mechanistic picture of phase
nucleation and growth is elaborated. The latter is governed by a simple and widely
transferable rule, i.e. the minimization of stress by formation of favorable (smooth)
surfaces. The study confirms the dominant role of surfaces (and associated surface free
energy) on determing the transformation pathwayand we expect our findings to be of
general relevance to displacive structural transitions in nanocrystals.
Acknowledgements
We thank Jamshed Anwar for helpful discussions and acknowledge high-performance
computing resources provided by the ZIH Dresden.
Page 10 of 20
Wiley-VCH
ZAAC
123456789101112131415161718192021222324252627282930313233343536373839404142434445464748495051525354555657585960

10
References
[1] S.H. Tolbert, A.P. Alivisatos, Science 1994, 265, 373.
[2] C-C Chen, A.B. Herhold, C.S. Johnson, A.P. Alivisatos, Science 1997, 276, 398.
[3] D. Zaziski, S. Prilliman, E.C. Scher, M. Casula, J. Wickham, S.M. Clark, A.P.
Alivisatos, Nano Letters 2004, 4, 943.
[4] J.N. Wickham, A.B. Herold, A.P. Alivisatos, Phys. Rev. Lett. 2000, 84, 923.
[5] B.J. Morgan, P.A. Madden, Nano Letters 2004, 4, 1581.
[6] B.J. Morgan, P.A. Madden, Phys.Chem.Chem.Phys. 2006, 8, 3304.
[7] D. Zahn, J. Solid State Chem. 2004, 177, 3590.
[8] D. Zahn, S. Leoni, Phys. Rev. Lett. 2004, 92, 250201.
[9] M. Grünwald, C. Dellago, P.L. Geissler, J. Chem. Phys. 2007, 127, 154718.
[10] D. Zahn, Y. Grin, S. Leoni, Phys. Rev. B 2005, 72, 064110.
[11] G.V. Lewis, C.R.A. Catlow, J.Phys. C: Solid State Phys. 1985, 18, 1149.
[12] S.L. Mayo, B.D. Olafson, W.A. Goddard III, J. Phys. Chem. 1990, 94, 8897.
[13] P.G. Bolhuis, C. Dellago, D. Chandler, Faraday Discuss. 1998, 110, 421.
[14] C. Dellago, P.G. Bolhuis, F.S. Csajka, D. Chandler, J. Chem. Phys. 1998, 108, 1964.
[15] D. Zahn, Phys. Rev. Lett. 2004, 92, 40801.
[16] D. Zahn, Phys. Rev. Lett. 2004, 93, 227801.
[17] D. Zahn, J. Chem. Theory Comput. 2006, 2, 107.
[18] S.E. Boulfelfel, S. Leoni, Phys. Rev. B 2008, 78, 125204.
Page 11 of 20
Wiley-VCH
ZAAC
123456789101112131415161718192021222324252627282930313233343536373839404142434445464748495051525354555657585960

11
i – j A / kJmol-1 ρρρρ / Å C / Å6 kJmol-1 qi⋅⋅⋅⋅qj / e
2 Zn .. Zn 0.0 0.0 0.0 4 O .. O 2196420.11 0.149 10825.65 4 Zn .. O 67568.65 0.3372 0.0 - 4
Tables 1: For the Zn2+.. O2- interactions the Buckingham-type potential of Lewis and
Catlow (top) was applied. To model all other interactions Lennard-Jones type potentials
and standard mixing rules were used.
i σii / Å εεεεii / kJ mol-1 Plj
1 5 1.0 Plj
2 6 1.0 Zn2+ 0.69 0.05857742 O2- 3.2 1.04602529
Page 12 of 20
Wiley-VCH
ZAAC
123456789101112131415161718192021222324252627282930313233343536373839404142434445464748495051525354555657585960
12
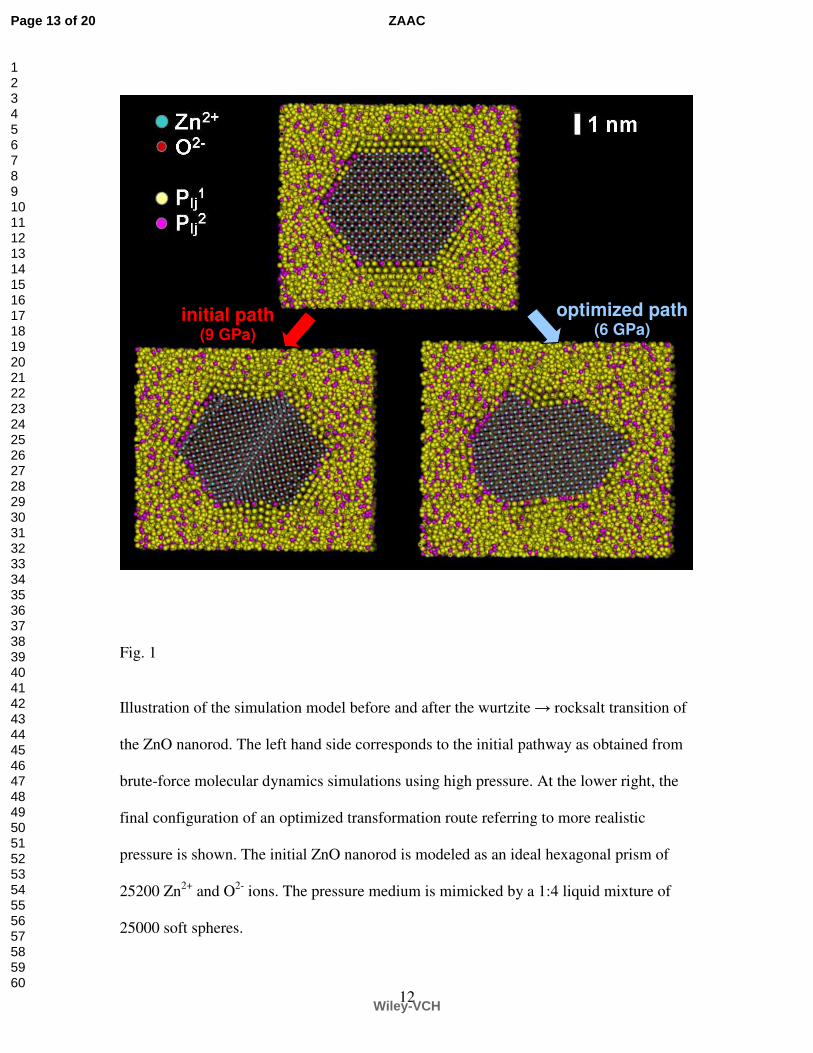
Fig. 1
Illustration of the simulation model before and after the wurtzite → rocksalt transition of
the ZnO nanorod. The left hand side corresponds to the initial pathway as obtained from
brute-force molecular dynamics simulations using high pressure. At the lower right, the
final configuration of an optimized transformation route referring to more realistic
pressure is shown. The initial ZnO nanorod is modeled as an ideal hexagonal prism of
25200 Zn2+ and O2- ions. The pressure medium is mimicked by a 1:4 liquid mixture of
25000 soft spheres.
optimized path (6 GPa)
initial path (9 GPa)
Page 13 of 20
Wiley-VCH
ZAAC
123456789101112131415161718192021222324252627282930313233343536373839404142434445464748495051525354555657585960

13
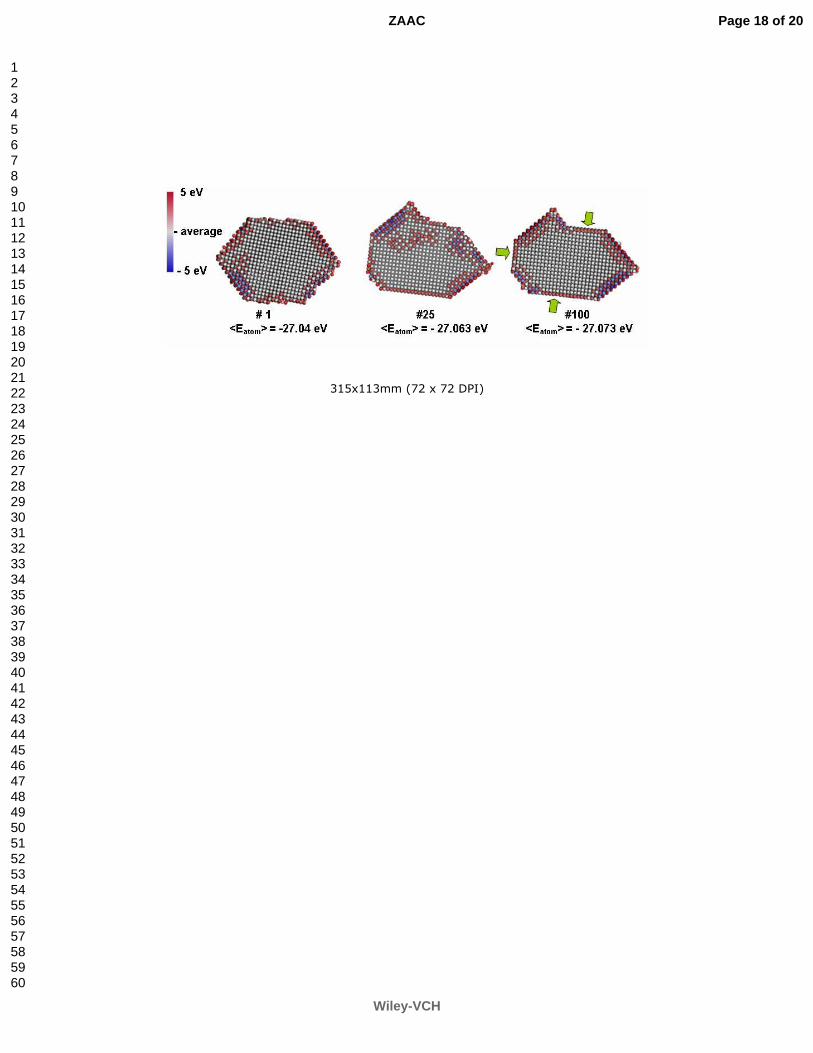
Fig. 2
Energy distribution of rocksalt type structures as obtained from transition path sampling
at 6 GPa. For all atoms the incorporation energy ∆Ei=Enanorod-Eatom i removed was compared
to its average value of -27 eV. To illustrate local stress, the atoms are colored according
to ∆∆Ei=∆Ei+27eV. In the course of the optimization of wurtzite → rocksalt transition
routes, the total energy of the nanorod model decreases and the overall shape experiences
considerable changes. Along this line, notched surfaces are reorganized in favor of
smooth (100) (indicated by green arrows) and (110) faces. This gives rise to specific
implementations of the layer shifting mechanism as shown in figure 3. All energy values
refer to the isolated nanorod. The overall shape effect comprises the surface energy (of
the nanorod in vacuum) and an interface energy term which depends on the choice of the
pressure medium.
5 eV
- 5 eV
- average
# 1 #25 #100 <Eatom> = -27.04 eV <Eatom> = - 27.063 eV <Eatom> = - 27.073 eV
Page 14 of 20
Wiley-VCH
ZAAC
123456789101112131415161718192021222324252627282930313233343536373839404142434445464748495051525354555657585960

14
Fig. 3
Snapshots of an optimized wurtzite → rocksalt transition route illustrating the nucleation
and growth of the rocksalt structure and its interplay with the shape of the nanorod
model. Along the horizontal direction, several atomic rows are highlighted to help the
visualization of the (100) layer shifting mechanism and its interplay with shape
deformation. To avoid the formation of notched surfaces, antiparallel layer shifting as
observed for the beginning of the nucleation process is disfavored. Later stages of phase
growth are found to follow a uniform sliding of layers.
0.5 ps 1 ps 5 ps
Page 15 of 20
Wiley-VCH
ZAAC
123456789101112131415161718192021222324252627282930313233343536373839404142434445464748495051525354555657585960

15
Fig. 4:
Same snapshot as shown in the center of figure 3 (1 ps), but illustrating the wurtzite-
rocksalt transition along the c-axis of the nanorod. The atomic shifting occurs at fastest
rate along the c-axis, and leads to the shuffling of layer patches rather than individual
columns.
1 nm
Page 16 of 20
Wiley-VCH
ZAAC
123456789101112131415161718192021222324252627282930313233343536373839404142434445464748495051525354555657585960

302x249mm (72 x 72 DPI)
Page 17 of 20
Wiley-VCH
ZAAC
123456789101112131415161718192021222324252627282930313233343536373839404142434445464748495051525354555657585960
315x113mm (72 x 72 DPI)
Page 18 of 20
Wiley-VCH
ZAAC
123456789101112131415161718192021222324252627282930313233343536373839404142434445464748495051525354555657585960

285x90mm (72 x 72 DPI)
Page 19 of 20
Wiley-VCH
ZAAC
123456789101112131415161718192021222324252627282930313233343536373839404142434445464748495051525354555657585960

295x227mm (72 x 72 DPI)
Page 20 of 20
Wiley-VCH
ZAAC
123456789101112131415161718192021222324252627282930313233343536373839404142434445464748495051525354555657585960