Surface behavior of myelin monolayers
11
Ž . Biochimica et Biophysica Acta 1370 1998 127–137 Surface behavior of myelin monolayers Rafael G. Oliveira, Reyna O. Calderon, Bruno Maggio ) ´ Departamento de Quımica Biologica-CIQUIBIC, Facultad de Ciencias Quımicas, UniÕersidad Nacional de Cordoba, Ag. Postal 4, ´ ´ ´ ´ CC 61, 5000 Cordoba, Argentina ´ Received 26 August 1997; revised 17 October 1997; accepted 24 October 1997 Abstract Myelin can be spread as a stable monomolecular layer, with reproducible properties, at the air–water interface. The major lipids and proteins of myelin are represented in this monolayer in molar ratios similar to those in the original membrane. A well-defined collapse point of the myelin monolayer occurs at ca. 46 mNrm. At a surface pressure of ca. 20 mNrm, the surface pressure–molecular area isotherm of the myelin monolayer shows a change in its compressibility, exhibited as a diffuse but reproducible inflection with a clearly marked change of the surface compressional modulus; the surface potential–area curve shows a change of slope at the same surface pressure. The myelin monolayer shows considerable hysteresis during the first compression–decompression cycle; no detectable protein unfolding under expansion; and decreased hysteresis after the first cycle. The average molecular areas, the inflection at 20 mNrm, the variation of the surface potential per unit of molecular surface density, and the hysteresis properties of the myelin monolayer indicate that this membrane undergoes changes of intermolecular organization mostly ascribed to the protein fraction, above a lateral surface pressure of ca. 20 mNrm. The behavior is consistent with a surface pressure-dependent relocation of protein components in the film. This has marked effects on the stability, molecular packing, and dipolar organization of the myelin interface. q 1998 Elsevier Science B.V. Keywords: Myelin; Monolayer; Hysteresis; Biomembrane monolayer 1. Introduction Ž . Monomolecular layers monolayers at the air– water interface have been widely used in order to study properties of purified membrane components and their simple mixtures under controlled inter- w x molecular organization 1,2 . On the other hand, pio- neering work regarding formation of monolayers from vesiculated lipid bilayers and from vesicles of whole-cell membranes was described many years ago w x 3,4 . More recently, we carried out the preparation ) Corresponding author. Fax: 54-51-334074. and characterization of a monomolecular layer pre- pared from a plasma membrane of neuronal origin using a highly purified axolemma subcellular fraction w x 5,6 . In addition, planar supported films, derived from this monolayer, were used to study the biologi- cal response of Schwann cells cultured upon the supported axolemma monolayer with different well- defined intermolecular organizations. The Schwann cell response was reflected by changes in prolifera- tion, shape, growth pattern, and in the differential exposure of surface antigens, depending on the sur- wx face organization of axolemma 6 . In this work, we have characterized the surface behavior of a monomolecular layer prepared from 0005-2736r98r$19.00 q 1998 Elsevier Science B.V. All rights reserved. Ž . PII S0005-2736 97 00254-X
-
Upload
independent -
Category
Documents
-
view
3 -
download
0
Transcript of Surface behavior of myelin monolayers

Ž .Biochimica et Biophysica Acta 1370 1998 127–137
Surface behavior of myelin monolayers
Rafael G. Oliveira, Reyna O. Calderon, Bruno Maggio )´Departamento de Quımica Biologica-CIQUIBIC, Facultad de Ciencias Quımicas, UniÕersidad Nacional de Cordoba, Ag. Postal 4,´ ´ ´ ´
CC 61, 5000 Cordoba, Argentina´
Received 26 August 1997; revised 17 October 1997; accepted 24 October 1997
Abstract
Myelin can be spread as a stable monomolecular layer, with reproducible properties, at the air–water interface. Themajor lipids and proteins of myelin are represented in this monolayer in molar ratios similar to those in the originalmembrane. A well-defined collapse point of the myelin monolayer occurs at ca. 46 mNrm. At a surface pressure of ca.20 mNrm, the surface pressure–molecular area isotherm of the myelin monolayer shows a change in its compressibility,exhibited as a diffuse but reproducible inflection with a clearly marked change of the surface compressional modulus; thesurface potential–area curve shows a change of slope at the same surface pressure. The myelin monolayer showsconsiderable hysteresis during the first compression–decompression cycle; no detectable protein unfolding under expansion;and decreased hysteresis after the first cycle. The average molecular areas, the inflection at 20 mNrm, the variation of thesurface potential per unit of molecular surface density, and the hysteresis properties of the myelin monolayer indicate thatthis membrane undergoes changes of intermolecular organization mostly ascribed to the protein fraction, above a lateralsurface pressure of ca. 20 mNrm. The behavior is consistent with a surface pressure-dependent relocation of proteincomponents in the film. This has marked effects on the stability, molecular packing, and dipolar organization of the myelininterface. q 1998 Elsevier Science B.V.
Keywords: Myelin; Monolayer; Hysteresis; Biomembrane monolayer
1. Introduction
Ž .Monomolecular layers monolayers at the air–water interface have been widely used in order tostudy properties of purified membrane componentsand their simple mixtures under controlled inter-
w xmolecular organization 1,2 . On the other hand, pio-neering work regarding formation of monolayers fromvesiculated lipid bilayers and from vesicles ofwhole-cell membranes was described many years agow x3,4 . More recently, we carried out the preparation
) Corresponding author. Fax: 54-51-334074.
and characterization of a monomolecular layer pre-pared from a plasma membrane of neuronal originusing a highly purified axolemma subcellular fractionw x5,6 . In addition, planar supported films, derivedfrom this monolayer, were used to study the biologi-cal response of Schwann cells cultured upon thesupported axolemma monolayer with different well-defined intermolecular organizations. The Schwanncell response was reflected by changes in prolifera-tion, shape, growth pattern, and in the differentialexposure of surface antigens, depending on the sur-
w xface organization of axolemma 6 .In this work, we have characterized the surface
behavior of a monomolecular layer prepared from
0005-2736r98r$19.00 q 1998 Elsevier Science B.V. All rights reserved.Ž .PII S0005-2736 97 00254-X

( )R.G. OliÕeira et al.rBiochimica et Biophysica Acta 1370 1998 127–137128
central nervous system myelin, the typical differenti-ated plasma membrane of oligodendroglial origin.
2. Materials and methods
2.1. Myelin Õesicles and lipids
Highly purified myelin was prepared from bovinew xspinal cord 7 . Myelin vesiculation was carried out
w xusing the method of Wutrich and Steck 8 . Briefly,one volume of packed myelin was gently dispersed in100 volumes of phosphate buffer saline 1 mM, pH 8,containing 2 mgrml dithiotreitol and gently stirred at48C for 18 h. The suspension was centrifuged at25 000 = g for 30 min.The pellet was resuspended inthe same buffer to a final protein concentration of0.24 mgrml, and passed five times through a 26 Gneedle fitted to a glass syringe. Vesiculation wasensured by entrapment of 25 mM carboxyfluoresceinand measurement of its fluorescence enhancement bydilution dequenching after adding Na-deoxycholateŽ .1% final concentration to the myelin vesicles in a
w xspectrofluorometer cuvette while stirring 5,9 .Total lipids from whole myelin, or from monolay-
ers collected as indicated below, were extracted andw xpartitioned as described previously 10 . The lower
phase after Folch’s partition was dried under nitrogenŽ .and redissolved in chloroform–methanol 2 : 1 .
Phospholipid phosphorous was measured by the mod-w xified micro-procedure of Bartlett 11 . For individual
lipid analysis, 12 mg of total lipids were analyzed byHPTLC developed with chloroform–methanol–waterŽ . w x70 : 30 : 4 as described by Coetzee et al. 12 . Indi-vidual lipids were visualized with Cu-acetate reagentw x13 and quantified by scanning densitometryŽ .Shimadzu CS-930 densitometer, Shimadzu, Japan .Standard curves of purified lipid standards were runon the same plate as the samples and calibrationcurves were constructed for each major myelin lipid
w xspecies 13 . Cholesterol was determined enzymati-Žcally with a commercial kit GT Laboratorios, Ar-
.gentina .Sodium dodecyl sulfate polyacrylamide gel elec-
Ž .trophoresis SDS-PAGE was performed on ca. 1 mgof protein from myelin vesicles or from collected
Žmonolayers. The material from the monolayer and,as a control for recovery assays, from myelin vesicles
that were diluted to the same final concentration as.the film material was concentrated by ultrafiltration
Ž .Centriprep-10 concentrators, Amicon, Beverly, MA .The concentrated samples were layered onto 13%
Žpolyacrylamide stacking gel was 4% polyacryl-. w xamide according to Laemmli 14 . Protein standards
were simultaneously separated on the same gel slab.Visualization was performed with a silver stain pro-
w xcedure 15 . The molecular weights of the majorprotein bands were ascribed after calibration withmolecular weight markers. The relative amounts ofindividual bands were determined by densitometryŽ .Shimadzu CS-930 densitometer, Shimadzu, Japan .Absolute amounts of proteins were determined by the
w xmethod of Lowry 16 in the presence of 0.2% sodiumdodecyl sulfate using bovine serum albumin as stan-dard.
2.2. Preparation of myelin monolayers
Myelin vesicles were spread at the air–water inter-w xface, as described before for axolemma 5 . In brief,
Ž .the vesicles 0.24 mg proteinrml were allowed toŽ .flow down approximate rate 10 mlrmin a 5 mm
diameter wetted glass rod positioned at an angle of458 across the aqueous surface in a compartmentŽ .80 ml of a specially designed thermostated Teflon-coated trough, with multiple compartments, filled
w xwith 10 mM Tris hydroxymethyl aminomethanebuffer in 100 mM NaCl, 20 mM CaCl , adjusted to2
pH 7.4 with HCl. Monolayers from the extractedlipid fraction were spread directly from their chloro-
Ž . w xform-methanol 2 : 1 solutions 17 . The temperaturewas maintained at 25"28C. A 12 ml aliquot of
Žvesicle suspension or of purified lipid fraction 10–. 217 nmol lipid were spread onto a surface of 80 cm .
ŽThe surface pressure Wilhelmy method via pla-.tinized-Pt plate , the area enclosing the monolayer,
Žand the surface potential via millivoltmeter with241 .air-ionizing Am plate and calomel electrode pair
Žwere automatically measured with the control unitMonofilmmeter with Film Lift, Mayer Feintechnique,
.Gottingen, Germany and recorded continuously andsimultaneously with a double channel X-Y-Yrecorder. The spreading rate of the vesiculated myelinmembrane against a constant surface pressure of2 mNrm was 33"3 cm2rmin, similar to that of
w xother membranes 5,18 .

( )R.G. OliÕeira et al.rBiochimica et Biophysica Acta 1370 1998 127–137 129
In order to collect the monolayers, vesicles werespread on the surface of a trough compartment com-municated by a narrow and shallow slit with anothercompartment filled with fresh buffer. After spreading,the film was free-energy-shocked by sudden expan-sion to twice the initial area. This causes furtherspreading of residual vesicles adsorbed to the inter-
w xface 5,18 . Subsequently, the film was washed bytransferring it over a compartment with fresh buffer,checking that the area covered by the film at collapsewas that expected from the known amount of mate-rial initially spread on the basis of the previouslyobtained surface pressure–molecular area isotherm.The film transfer eliminates membranous materialthat would not spread or that remained loosely asso-
w xciated to the interface 5,19 .For protein and lipid analysis, about 70 monolay-
ers were recovered by aspiration into a small glassvial fitted with a 25 G needle and a suction outlet.The monolayers were recovered in the collapsed statesince this resulted in the collection of a lower amountof subphase which simplifies the subsequent concen-tration step. The complete aspiration of the mono-layer was directly ascertained by the decay of thesurface pressure to zero, measured at the surface of
the compartment over which collection was done.Similar results were obtained with washed monolay-ers collected at surface pressures between 10–20 mNrm; however, in these conditions the amountof subphase volume collected was unavoidably largeand this complicated the concentration step.
The surface behavior of the monolayer was charac-terized by recording isothermally, at 25"28C, thefollowing: surface pressure, surface potential, surfacepotential normalized per unit of molecular surface
Ždensity usually denominated surface potentialrmole-w x.cule 20–22 as functions of the molecular area, and
Žby the adsorption isotherm surface pressure as a.function of time, at constant area . The routine com-
pression rate was ca. 41 cm2rmin, no significantdifferences were obtained between compression ratesfrom 24 cm2rmin up to 104 cm2rmin. The meanmolecular area, surface pressure, and surface poten-tial in different independent experiments were within"0.015 nm2, "1 mNrm and "10 mV. Repro-ducibility of the limiting molecular area of the sur-face pressure– and surface potential–molecular areaisotherms under expansion and recompression cyclesindicates that no further material is lost or incorpo-rated into the monolayer. The expansion and recom-
Table 1Membrane recovery and lipid distribution a
bŽ .Vesicles Spread monolayer Yield %
Ž .Protein mg 2.88 1.56 54.0Ž .Total Lipids mg 9.57 5.66 59.1
Ž .Total Phospholipids nmol 6.20 3.52 56.8
Vesicles Spread monolayer
mmolrmg protein %total lipid Phosph. mmolrmg protein %total lipid %Phosph.
Total phospholipid 2.15 42 100 2.26 38 100SPM 0.46 21.4 0.54 23.7PC 0.36 16.6 0.42 18.4PE 1.02 47.6 0.89 39.4PS 0.31 14.2 0.42 18.4Cholesterol 1.89 37 2.49 42Cerebrosides 0.82 16 0.89 15Sulfatides 0.26 5 0.18 3Cholrphosph 0.88 1.11
a Among different experiments, maximum SEM was "3% for proteins, "11% for total and individual lipids, with respect to the averagevalues given above. Abbreviations: SPM, sphingomyelin; PC, phosphatidylcholine; PE, phosphatidylethanolamine; PS, phosphatidylser-ine; Chol., cholesterol; Phosph., total phospholipid.b The column labelled ‘‘Yield’’ is the amount of material recovered from the monolayer with respect to that present in the amount of
Ž .vesicles spread taken as 100% , and represents a mean over 70 films collected.

( )R.G. OliÕeira et al.rBiochimica et Biophysica Acta 1370 1998 127–137130
pression cycles also provide information on the hys-teresis properties of myelin.
The average molecular area of myelin monolayerswas calculated from the mole fraction of the majorlipid and protein fractions present in the monolayerŽ .Table 1 determined as described above. Number-
w xaveraged molecular weight 23 of the total lipid andŽprotein fraction mixtures 628 Da and 25.00 kDa, re-
.spectively were used to obtain the mean number ofmolecules at the surface. The features contributed bythe total protein fraction to those of the myelin filmcan be directly calculated from the known isothermsof whole myelin and that of the total lipid fractionw x5–20 . The surface behavior of the total proteinfraction was obtained, at each surface pressure, ac-
Ž . Ž .cording to Eqs. 1 – 3 :
A yA =XM L LP PA s 1Ž .P P XP
DVrn yDVrn =XM L LP PDVrn s 2Ž .P P XP
DV sDVrn =A 3Ž .P P PP P P
xwhere, taken at a constant surface pressure P , AP P
is the mean molecular area of the total protein frac-xtion; A the mean molecular area of the totalM P
xmyelin film, A the mean molecular area of theL P
xtotal lipid fraction, DVrn the mean surface po-P P
tentialrmolecule of the total protein fraction,xDVrn the mean surface potentialrmolecule ofM P
xthe total myelin film, DVrn the mean surfaceL P
xpotentialrmolecule of the total lipid fraction, DVP P
the mean surface potential of the total protein frac-tion, and X is the corresponding mole fraction of thetotal protein and total lipid components in the mono-layer.
3. Results and discussion
3.1. Yield of myelin membrane material in the mono-layer
The recovery of proteins in the myelin monolayerrepresents a yield of 54% with respect to the amountof protein present in the aliquot of membrane vesicle
Ž .suspension spread onto the surface Table 1 . Total
phospholipid spread with a similar yield of 56.8%.Thus, similar to what was previously found for ax-
w xolemma 5 , the phospholipidrprotein ratio present inmyelin vesicles is maintained when the membranewas spread as a monolayer.
All lipid species found in the myelin monolayerare represented at comparable mole fractions to those
Ž .in the original myelin vesicle preparation Table 1 .Compared to the yield of 26.6%, previously reported
w xfor axolemma monolayers 5 , the recovery of totalphospholipids in the myelin monolayer is higher.Similar to axolemma, PE is moderately depleted inthe myelin monolayer while PS and cholesterol areslightly increased, and the myelin monolayer containsthe entire range of protein species present in the
Ž .vesicle membrane Fig. 1 . The high molecular weightŽ .material at the top of the gel in lane 1 monolayer
Ž .and 2 ultrafiltrated vesicles in Fig. 1 is probably duew xto some protein aggregation 24 occurring during the
sample concentration step by ultrafiltration; myelinvesicles that were not submitted to concentrationŽ .lane 3 do not show aggregation.
3.2. Surface behaÕior of monolayers from the totallipid fraction
Ž .Fig. 2 a shows the surface pressure, the surfacepotential and the surface potentialrmolecule of the
Fig. 1. SDS-PAGE of myelin vesicles and myelin monolayers.Numbers on the left show position of molecular weight markers.Lane 1 – myelin monolayer; lane 2 – myelin vesicles concen-trated by ultrafiltration; and lane 3 – myelin vesicles not concen-trated.
( )R.G. OliÕeira et al.rBiochimica et Biophysica Acta 1370 1998 127–137 131
Fig. 2. Compression isotherms of myelin. The variation of theŽ . Ž .surface pressure , surface potential - - - and surface
Ž .potentialrmolecule P P P as a function of the mean molecularŽ . Ž . Ž .area. a – lipid fraction; b – total myelin; and c – calculated
isotherms for the total protein fraction. No further increases ofsurface pressure were observed above the plateau pressure point,even after reducing the film area to one third of the limitingmolecular area for both the lipid fraction and whole myelin
Ž .monolayer. The inset in b represents the variation of the surfacew Ž .xcompressional modulus K mNrm as a function of the mean
molecular area of the myelin monolayer.
total lipid fraction from the lower phase of Folch’spartition performed on the material collected from themonolayer, similar curves were obtained for the totallipid fraction extracted from the original myelin vesi-
Ž .cles. The isotherm in Fig. 2 a shows a compressionbehavior that is characteristic of an expanded liquidstate, with a collapse pressure point and an equilib-rium spreading pressure of 42–44 mNrm, limiting
molecular area of 0.365 nm2 and maximum surfacepotential of 343 mV and 1.25 fV cm2rmolecule. Thesurface pressure–molecular area isotherm of the totallipid fraction from myelin is more condensed than
w xthat derived from axolemma 5 . A smooth gradualdecrease of the surface potentialrmolecule is ob-served under compression that is comparable to that
w xfound for the total lipid fraction of axolemma 5 .This type of variation, common to several lipids,indicates little reorientation or relocation of dipolar
w xcomponents during changes in packing 22 .
3.3. Surface behaÕior of whole myelin monolayersand the total protein fraction
The compression isotherm of the myelin mono-Ž .layer is shown in Fig. 2 b . The isotherm of whole
myelin is displaced to larger mean molecular areas, itis more compressible, and the surface potential
Ž .reaches slightly higher values 367 mV at a highercollapse pressure point than that of the lipid fraction.The myelin monolayer shows a change of compress-ibility in the surface pressure–molecular area isothermoccurring at ca. 20 mNrm and a molecular area ofca. 60–65 nm2, clearly emphasized by the variationof the surface compressional modulus with the mean
Ž Ž ..molecular area see inset in Fig. 2 b . The values ofthe compressional modulus correspond to a liquid
w xinterface 25 , exhibiting a transition between a moreexpanded to a more condensed state. The variation inthe compressional modulus is also reflected as achange in the slope of the surface potential–molecu-lar area curve occurring at the same molecular areaŽ Ž . .Fig. 2 b , dashed line . Also, a marked inflectionoccurring above about 20 mNrm is clearly apparent
Ž .in the adsorption isotherm Fig. 3 . Compared tow xaxolemma 5 , the isotherm of the myelin monolayer
is more similar to that exhibited by the total lipidfraction, it is displaced to smaller mean molecularareas at all surface pressures and it is more con-densed as indicated by its higher compressional mod-ulus at all molecular areas. This might have beenexpected on the basis of the lower content in proteinsof myelin; on a weight basis, the lipidrprotein ratio
Ž .is 3.63 in the myelin monolayer see Table 1 com-w xpared to 0.99 in axolemma 5 .
ŽThe equilibrium spreading pressure pressure pointat which bulk phase myelin and spread monolayer are

( )R.G. OliÕeira et al.rBiochimica et Biophysica Acta 1370 1998 127–137132
Fig. 3. Adsorption isotherm of total myelin. Myelin vesiclesŽ . Ž2.4 mg protein were injected into a stirred compartment sub-
2.phase 18ml and surface area 18 cm .
.in equilibrium of the myelin monolayer is between45–47 mNrm, as determined by depositing excessmaterial at the interface and following the surfacepressure variation with time. Within experimentalerror this is comparable to the collapse pressure pointŽ .46 mNrm , which represents a surface pressure pointat which two different structural phases, the mono-
w xlayer and the collapsed phase coexist 1,20 . If thefilm compression was stopped at the collapse point,
Žthe surface pressure remained constant within."1 mNrm with time. Also, the collapse pressure
coincides with the maximum surface pressure of ca.46 mNrm attainable by spontaneous formation of amonolayer from the adsorption and spreading of ma-
Žterial from vesicles injected into the subphase Fig..3 , or from myelin dissolved in chloroform–methanol
Ž . Ž .2 : 1 see below . For monolayers in the liquid statethe equilibrium spreading pressure is the same as the
w xcollapse pressure 20,26 . It has long been shown thatthe mesomorphic state of myelin at room temperature
w xcorresponds to that of a liquid-crystalline phase 27in which its membrane components exhibit a lateralmobility similar to that observed in other fluid mem-
w xbranes 28 . The similarity between myelin collapsepressure and equilibrium spreading pressure supportsthe fact that the monolayer is in the liquid state at thetemperature used in our studies; this is also revealed
by the values of the surface compressional modulusw x25 . Our observations suggest that myelin can existat high surface pressures in a state of stable equilib-rium between at least two different interfacial ar-rangements, a closely packed monolayer state and the
Ž w x.collapsed bulk usually multilayered 1,20 phaseŽ .see Section 3.4 .
Wet myelin dissolves completely in 19 volumes ofŽ . w xchloroform–methanol 2 : 1 29 , although some of
Žits high molecular weight protein components mostly.Wolfgram proteins tend to aggregate when this solu-
w xtion is left to stand for a period of time 30 . FreshlyŽ .dissolved myelin in chloroform–methanol 2 : 1 , im-
mediately spread from this solution, gave the sameŽisotherm with the same limiting molecular area,
.surface potential, and collapse pressure as that ob-tained by spreading the aqueous suspension of vesi-cles as described in Section 2. This is indicative thatthe surface free energy shock of the vesicles duringthe spreading procedure results in the same surfaceorganization as when the components reorganize atthe surface from their solution in organic solvent; italso shows that the interfacial intermolecular organi-
Žzation acquired in the myelin film is very stable see.below since it is independent of the initial physical
state of the material spread. This is similar to otherw x w xprotein 31 and lipid-protein systems 32 , in which
the isotherms of monolayers spread from differentŽorganic solvents and aqueous dispersions vesicles in
.the case of lipid–protein systems lead to a similarw xfinal interfacial behavior 33 . Also, apart from the
reproducible limiting molecular areas under succes-sive compression–expansion cycles mentioned above,the similarity between the isotherms spread fromvesicles or from the organic solvent solution indicatesthat there is no further spreading from vesicles after
Ž .the surface free energy shock see Section 2 sincevesicles are not present in the chloroform–methanolsolution of myelin. If the latter solution was notspread immediately after preparing, the isothermsbecome progressively different and irreproducible,probably due to a slow aggregation of protein compo-nents that can be visually observed in the organicsolvent.
On the basis of the measured lipid and proteinmole fractions in the myelin monolayer, the surfacebehavior contributed by the total protein fraction wasdirectly calculated from the known isotherms of total
( )R.G. OliÕeira et al.rBiochimica et Biophysica Acta 1370 1998 127–137 133
myelin and the total lipid fraction as described inSection 2. The surface pressure – surfacepotentialrmolecule-area isotherms of the proteinfraction clearly emphasize, as a marked discontinuity,the change in compressibility and variation of thesurface potentialrmolecule shown at ca. 20 mNrm in
Ž Ž ..the isotherm of whole myelin see Fig. 2 c . Theisotherm corresponding to the total protein fractionindicates a compressibility characteristic of liquid-ex-
w xpanded protein monolayers 31 . At ca. 20 mNrmand a molecular area of ca. 20 nm2, a rather abruptchange of intermolecular organization occurs. This isalso reflected by a considerable reorientation andror
Žrelocation of overall protein molecular dipoles mea-sured in the direction perpendicular to the surfacew x.20–22 as indicated by the marked step in thesurface potentialrmolecule-area curve. The changesoccurring in the resultant dipoles of the protein frac-tion in the myelin monolayer under compression are
w xmore abrupt than in axolemma 5 . Above 20 mNrm,the monolayer of the total protein fraction of myelinshows no further change of surface potential and aconstant compressibility. A wide variety of protein
w xmonolayers including myelin basic proteins 31 , andw xFolch’s proteolipid 34 show collapse pressure points
near 20 mNrm; further compression of these proteinmonolayers beyond this pressure leads to essentiallylinear increases of the surface pressure and no addi-tional changes of surface potential and compressibil-
w xity 31,33 .
3.4. Hysteresis and stability of myelin monolayers
Although little studied, the occurrence of hystere-sis under successive compression and decompressioncycles is a common phenomena in monolayers at the
w xaqueous–air interface 1,35,36 . These effects arisefrom a balance among cohesion phenomena and vis-coelastic properties of the interface that have differ-ent reversibility properties. In essence, these phenom-ena indicate that different molecular arrangementscan be obtained depending on whether the energy andkinetic barriers for intermolecular cohesion are differ-ent to those involved in the hydrophilic–hydrophobicbalance and polar head group–subphase interactionthat determine molecular dispersion through interfa-
w xcial spreading 1,36 . Thus, the presence of hysteresisis related to the stability of closely packed liquid-con-
densed states formed under compression and theirtendency to undergo reversible reorganization to theirinitial liquid-expanded states under expansion, during
Žthe time of the experiment Carrer and Maggio,.unpublished results .
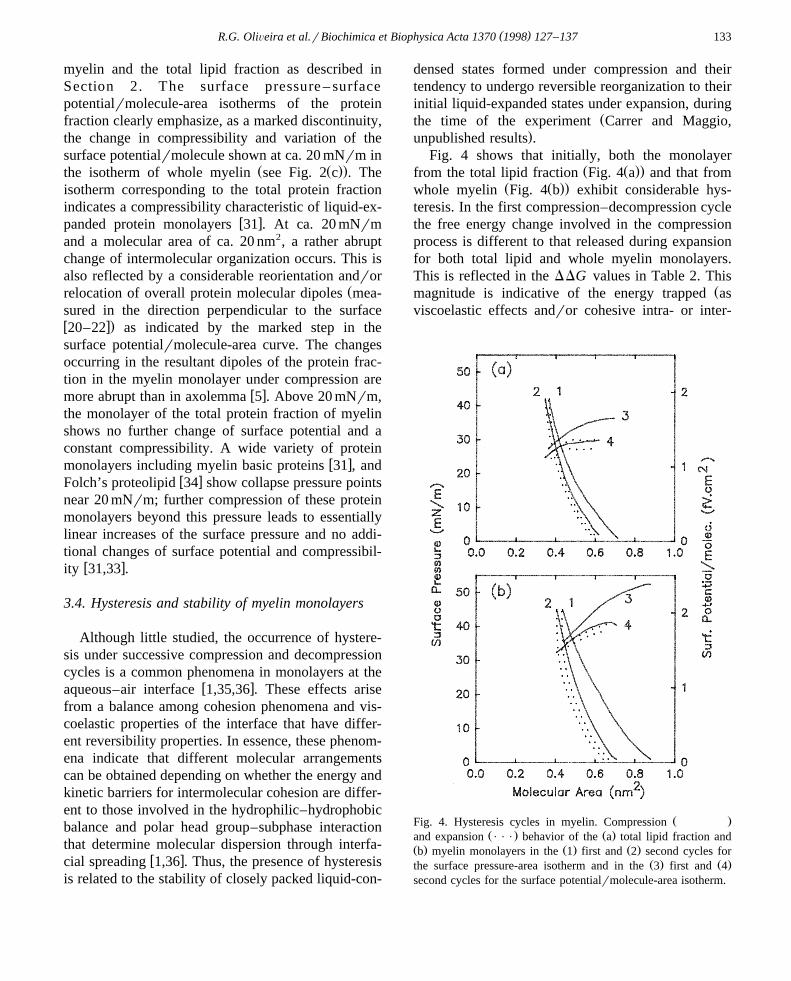
Fig. 4 shows that initially, both the monolayerŽ Ž ..from the total lipid fraction Fig. 4 a and that from
Ž Ž ..whole myelin Fig. 4 b exhibit considerable hys-teresis. In the first compression–decompression cyclethe free energy change involved in the compressionprocess is different to that released during expansionfor both total lipid and whole myelin monolayers.This is reflected in the DDG values in Table 2. This
Žmagnitude is indicative of the energy trapped asviscoelastic effects andror cohesive intra- or inter-
Ž .Fig. 4. Hysteresis cycles in myelin. CompressionŽ . Ž .and expansion P P P behavior of the a total lipid fraction and
Ž . Ž . Ž .b myelin monolayers in the 1 first and 2 second cycles forŽ . Ž .the surface pressure-area isotherm and in the 3 first and 4
second cycles for the surface potentialrmolecule-area isotherm.

( )R.G. OliÕeira et al.rBiochimica et Biophysica Acta 1370 1998 127–137134
Table 2Free energy of compression and expansion a
DG DG 1st DDG DG DG 2nd DDGcom exp recom reexp
Lipid q0.794 y0.509 q0.285 q0.649 y0.519 q0.130FractionTotal q1.068 y0.442 q0.626 q0.685 y0.448 q0.237Myelin
aThe free energy of compression and expansion between theŽsurface pressures of 2 and 42 mNrm DG values expressed in
.Kcalrmol are calculated from the areas under the surface pres-sure–area isotherms. DDG is the difference between the DGcom
and DG . The first and second DDG represent the free energyexp
trapped in the monolayer during the first and second cycle ofhysteresis, respectively, as shown in Fig. 4. Abbreviations; com:compression, exp: expansion, recom: recompression, reexp: reex-pansion.
. Žmolecular energies in a monolayer Carrer and Mag-.gio, unpublished results . In the first hysteresis cycle,
DDG for the whole myelin monolayer is more thantwice the value obtained for the total lipid fractionŽ .Table 2 . Clearly, the total protein fraction adds asubstantial element of structural asymmetry in thecohesive interactions of the interface.
Recompression of the films leads to considerablevariation in the characteristics of the isotherm and in
Ž .their hysteresis behavior see Fig. 4 , especially forthe whole myelin monolayer. As shown in Table 2the free energy taken up during recompression of thewhole myelin monolayer is much smaller, and that of
Žthe lipid fraction is only moderately reduced com-.pared to that involved in the first compression , so
that both become similar in the second cycle. Thefree energy released in the second expansion is essen-tially unaltered. This causes the DDG values of thesecond hysteresis cycle to become smaller and simi-lar for both the myelin and lipid fraction than thosefound in the first cycle. These results emphasize theinfluence of total proteins in the initial behavior ofthe monolayer from whole myelin. A marked andirreversible intermolecular reorganization occurs dur-ing the first compression at a surface pressure of ca.20 mNrm, that is mostly contributed by the protein
Ž .fraction andror by its interaction with lipids .If the compression of the whole myelin monolayer
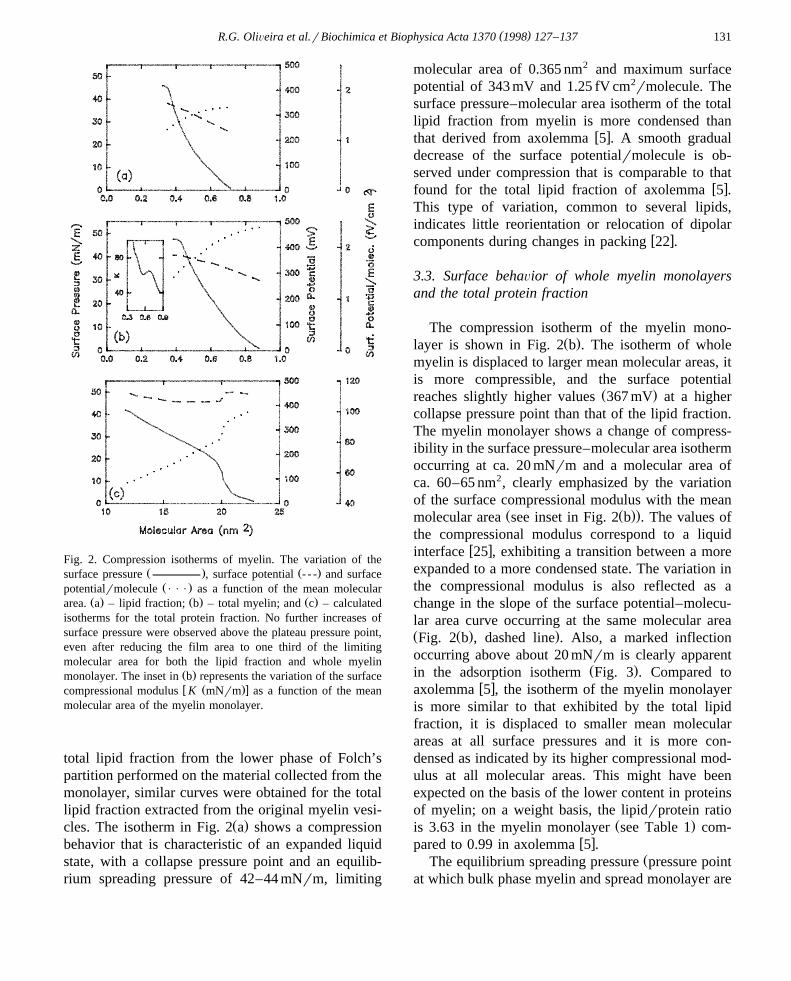
is carried out up to only 16 mNrm before expanding,little hysteresis and no major differences between the
Žfirst and second cycles were observed Fig. 5, com-
Ž ..pare also with Fig. 4 b . If, after this, a third cycle ofhysteresis is carried out by compressing the same
Ž .myelin monolayer up to collapse data not shown ,then the surface behavior and the DDG value are
Ž .similar to the findings described in Fig. 4 b andTable 2. This indicates that the protein fraction un-dergoes reorganization during the first compression,only if the surface pressure reaches values above20 mNrm. The behavior of the myelin monolayer inthe second compression becomes more similar to thatof the lipid fraction, although still having a signifi-cantly different compressibility and magnitude of the
Ž .surface potentialrmolecule see below . This indi-cates that the protein components remain in a state oforganization, different than the initial one, and inwhich they contribute very differently to the molecu-lar packing and surface electrostatics. Calculation ofthe surface pressure–molecular area isotherm of the
Ž .protein fraction under the expansion process Fig. 6reveals a rather incompressible isotherm in ranges ofmolecular area changes that are largely reduced com-pared to those obtained in the first compression. Thisalso points to a considerable reorganization of theprotein components in the myelin monolayer submit-ted to a first compression at )20 mNrm.
Fig. 5. Hysteresis of myelin monolayer compressed below20 mNrm. Curve numbers as in Fig. 4. A third cycle of compres-
Ž .sion–expansion not shown carried out by compressing the filmup to 40 mNrm after the second cycle gave a hysteresis behavior
Ž . Ž .similar to that shown in Fig. 4 b see text .

( )R.G. OliÕeira et al.rBiochimica et Biophysica Acta 1370 1998 127–137 135
Fig. 6. Calculated isotherm of the protein fraction under expan-sion after the first compression up to above 30mNrm.
Typical myelin proteins such as Folch–Lees prote-olipid and myelin basic protein acquire a state ofmaximum close packing in pure protein monolayersat surface pressures between 12 and 20 mNrmw x31,34,37 either by surface spreading or adsorptionfrom the subphase. Moreover, the stability of proteinmolecules is increased and its molecular area furtherreduced if they are closely packed in mixed monolay-
w xers with lipids 31 in which the lipid–protein interac-tions also lead to a maximum compaction of the lipid
w xcross-sectional area 38 . These previous observationsin mixed monolayers of purified proteins and lipidsof myelin, including myelin glycosphingolipids, andthe hysteresis properties described in this work lendsupport to an interpretation based on a protein- andsurface pressure-mediated reorganization of themyelin monolayer. This is reflected by the acquisitionof an irreversible closely packed state of myelin,mediated by the protein components, when the inter-face is compressed above 20 mNrm, probably byfacilitating close interaction with the lipid fraction. Ithas previously been shown that highly favorable in-teractions exist between myelin proteins and typicalmyelin lipids, leading to increased interfacial stabilityof both components, with reductions of the mean
w xmolecular area and surface potentialrmolecule 38 .On the other hand, proteins appear to contribute to aninitial more expanded state of spread myelin before
compressing it above 20 mNrm. Thus, it is temptingto speculate that myelin proteins may act as surfacecompensators for the transition between a liquid-ex-panded and a liquid-condensed state of myelin, de-pending on the lateral surface pressure: maintaining aliquid-expanded reversible state whenever the surfacepressure fluctuates below 20 mNrm or facilitating anirreversible, liquid-condensed, closely packed statethat can potentially acquire monolayer–multilayerequilibrium when the surface pressure exceeds20 mNrm.
The hysteresis properties are also exhibited by thesurface potentialrmolecule. These also indicate thatthe molecular reorganization of the monolayer occur-ring in the first compression is maintained and ‘‘re-membered’’ when it is subsequently expanded. Asshown in Fig. 4, during the first compression theoverall resultant dipoles that determine the surfacepotential of the myelin monolayer and that of thetotal lipid fraction undergo increased reorientationandror relocation beyond molecular packing areas of0.62 nm2 and 0.50 nm2, respectively, correspondingfor both films to a surface pressures of ca. 20 mNrm.Also, Fig. 4 shows that the dipolar reorganizationoccurring during the first expansion is much less thanthat observed during the first compression; no mean-ingful differences are introduced by further cycles ofrecompression–reexpansion. Fig. 4 shows that, inhysteresis cycles subsequent to the first, the variationof surface potentialrmolecule with the moleculararea of the myelin monolayer becomes similar to thatfound for the total lipid fraction, although remainingwith a considerable difference in magnitude due tothe presence of the rearranged protein dipoles.
It is important to note that molecules are notdesorbed from the interface during the hysteresiscycles. This is concluded from the similar limitingmolecular areas obtained near collapse in successivecycles; also, the magnitude of the surfacepotentialrmolecule of the whole myelin monolayerafter the second compression and thereafter staysconsiderably above that of the total lipid fraction; thisindicates that the rearranged protein dipoles remain atthe interface. Excellent reproducibility of the hystere-sis cycles is obtained even if the monolayer was leftfor 10 min at 0.5 mNrm, before recompressing afterthe first expansion. No increase of surface pressuredue to the well-known process of interfacial unfold-

( )R.G. OliÕeira et al.rBiochimica et Biophysica Acta 1370 1998 127–137136
ing of proteins is observed, even before the firstcompression, when the monolayer is left uncom-pressed for 30 min at the low pressure. This is differ-ent from the behavior of monolayers prepared from
w xother cell membranes 18 and from that of axolemmaw xmonolayers that was reported previously 5 . With
more simple binary lipid–protein mixtures, we havepreviously reported that interactions of several pro-teins, including myelin basic protein, with myelinlipids and glycolipids in monolayers resulted in asurface compaction and stabilization of the proteincomponents in the mixed lipid–protein monolayerw x31,38,39 . In axolemma, reproducible hysteresis cy-cles were found when the film was immediatelycompressed after expansion indicating that, differentto myelin, the changes in molecular organization ofthe total protein fraction of axolemma are not stabi-lized by close packing with lipids. Furthermore, andagain different to myelin, if the axolemma monolayerwas left at pressures -5 mNrm for more than 5 min,continuous increases of surface pressure due to pro-tein unfolding were observed, after which the
w xisotherms were no longer reproducible 5 .
4. Conclusions
In this work, we have achieved for the first timethe formation of a monomolecular layer from themyelin membrane. It has thus been possible to havemeasurements of the mean molecular packing area,surface electrostatics, and compressibility propertiesof myelin and of its major lipid and protein fractionsunder well-defined compression and expansion condi-tions.
ŽTaken together the initial compression isotherm ofthe whole myelin monolayer, that of the total lipidfraction, the compression isotherm of the total proteinfraction, the features of the second compression ofthe myelin monolayer, and the expansion isotherm of
.the total protein fraction , our results indicate that themarked reorganization of the myelin membrane oc-curring )20 mNrm is not reversible and is mostlydue to the protein fraction. Our observations indicatethat myelin can form a remarkably stable interface at
Žhigh surface pressures i.e. )30–35 mNrm, such asw x.those present in cell membranes 40 and that it can
Žacquire under compression or spontaneously by ad-
.sorption a state of equilibrium between a closelyŽpacked, organized monolayer and a bulk multi-
.layered structure. Spontaneous bilayer and multi-layer formation at the air–water interface was re-ported in pure lipid systems and in complex lipid
w xmixtures 41 . The behavior found herein for themyelin monolayer provides a physico-chemical basisfor the spontaneous formation and maintenance of aremarkably stable multilayered biological structure ofmyelin.
Acknowledgements
This work was supported in part by SECyT-UNC,CONICOR, CONICET and Fundacion Antorchas,´Argentina. Rafael G. Oliveira is a Fellow and BrunoMaggio is Principal Career Investigator from CON-ICET. Reyna O. Calderon is currently Assistant Pro-´fessor at the 1a. Catedra de Embriologıa, Histologıa y´ ´ ´Genetica, Facultad de Ciencias Medicas, Universidad´ ´Nacional de Cordoba, Argentina.´
References
w x1 K.S. Birdi, Lipid and Biopolymers Monolayers at LiquidInterfaces, Plenum Press, New York, 1989.
w x Ž .2 B. Maggio, Prog. Biophys. Molec. Biol. 62 1994 55–117.w x Ž .3 R. Verger, F. Pattus, Chem. Phys. Lipids 16 1976 285–291.w x4 F. Pattus, C. Rothen, M. Streit, P. Zahler, Biochim. Bio-
Ž .phys. Acta 647 1981 29–39.w x5 O.R. Calderon, B. Maggio, T.J. Neuberger, G.H. DeVries, J.´
Ž .Neurosci. Res. 34 1993 206–218.w x6 O.R. Calderon, B. Maggio, T.J. Neuberger, G.H. DeVries, J.´
Ž .Neurosci. Res. 40 1995 349–358.w x7 J.E. Haley, F.G. Samuels, R.W. Leeden, Cel. Mol. Neuro-
Ž .biol. 1 1981 175–178.w x Ž .8 C. Wutrich, A.J. Steck, Biochim. Biophys. Acta 640 1981
195–206.w x Ž .9 B. Maggio, R.K. Yu, Biochim. Biophys. Acta 1112 1992
105–114.w x Ž .10 B. Maggio, F.A. Cumar, Brain Res. 77 1974 297–307.w x Ž .11 G.R. Barlett, J. Biol. Chem. 234 1959 466–468.w x12 T. Coetzee, N. Fujita, J. Dupree, R. Shi, A. Blight, K.
Ž .Suzuki, R. Suzuki, B. Popko, Cell 86 1996 209–219.w x Ž .13 L.J. Macala, R.K. Yu, S. Ando, J. Lipid Res. 24 1983
1243–1250.w x Ž .14 U.K. Laemmli, Nature 227 1970 680–685.w x Ž .15 J.H. Morrisey, Anal. Biochem. 117 1981 307–310.w x16 O.H. Lowry, N.J. Rosebrough, A.L. Farr, R.J. Randall, J.
Ž .Biol. Chem. 193 1951 265–275.

( )R.G. OliÕeira et al.rBiochimica et Biophysica Acta 1370 1998 127–137 137
w x Ž .17 B. Maggio, T. Ariga, R.K. Yu, Biochem. 29 1990 8729–8734.
w x Ž .18 Th. Schurholz, H. Schindler, Eur. J. Biophys. 20 199171–78.
w x19 I.D. Bianco, G.D. Fidelio, R.K. Yu, B. Maggio, Biochem.Ž .30 1991 1709–1714.
w x Ž .20 G.L. Gaines, in: I. Prigogine Ed. , Insoluble Monolayers atLiquid-Gas Interfaces, Interscience Monographs on PhysicalChemistry, John Wiley and Sons, New York, 1996.
w x21 B. Maggio, F.A. Cumar, R. Caputto, Biochem. J. 171Ž .1978 559–565.
w x22 B. Maggio, in: M.J. Allen, S.F. Cleary, A.E. Sowers, F.M.Ž .Hawkridge Eds. , Charge and Field Effect in Biosystems-III,
Birkhauser, Boston, 1992, pp. 69–80.w x23 K.E. VanHolde, Physical Biochemistry, 2nd ed., Prentice
Hall Inc., Englewood Cliffs, New Jersey, 1985.w x24 P. Morell, R.C. Wiggins, M.J. Gray, Anal. Biochem. 68
Ž .1975 148–154.w x Ž .25 D.F. Sears, R.E. Stark, in: L.M. Prince, D.F. Sears Eds. ,
Biological Horizons in Surface Science, Acad. Press, NewYork, 1973, pp. 1–33.
w x26 K. Larsson, in: F.D. Gunstone, J.L. Harwood, F.B. PadleyŽ .Eds. , The Lipid Handbook, 2nd ed., Chapman and Hall,London, 1994, pp. 419–422.
w x Ž .27 D. Chapman, Quart. Rev. Biophys. 8 1975 185–235.w x28 A. Mattus, S. de Petris, M.C. Raff, Nature New Biol. 244
Ž .1973 278–280.w x29 L.A. Autilio, W.T. Norton, R.D. Terry, J. Neurochem. 11
Ž .1964 17–27.w x Ž .30 F. Gonzales-Sastre, J. Neurochem. 17 1970 1049–1056.w x31 G.D. Fidelio, B. Maggio, F.A. Cumar, An. Asoc. Quim.
Ž .Argen. 74 1986 801–813.w x32 K. Nag, J. Perez-Gil, A. Cruz, N.H. Rich, M.W. Keough,
Ž .Biophys. J. 71 1996 1356–1363.w x Ž .33 F. MacRichtie, Adv. Protein Chem. 32 1978 283–326.w x34 Y. London, R.A. Demel, W.S.H. Geurts van Kessel, F.G.A.
Vossemberg, L.L.M. van Deenen, Biochim. Biophys. ActaŽ .311 1973 520–530.
w x Ž .35 M. Galdston, D.O. Shah, Biochim. Biophys. Acta 137 1967255–263.
w x Ž .36 D. Lusted, Biochim. Biophys. Acta 307 1973 270–278.w x Ž .37 G. Colacicco, Ann. N.Y. Acad. Sci. 195 1972 224–261.w x38 G.D. Fidelio, B. Maggio, F.A. Cumar, Chem. Phys. Lipids
Ž .35 1984 231–245.w x Ž .39 B. Maggio, Neurochem. Res. 22 1997 475–481.w x Ž .40 D. Marsh, Biochim. Biophys. Acta 1286 1996 183–223.w x Ž .41 N.L. Gershfeld, Biochim. Biophys. Acta 988 1989 335–
350.