Importance of reactant mass transfer in the reproducible preparation of self-assembled monolayers
11
Importance of reactant mass transfer in the reproducible preparation of self-assembled monolayers Grant A. Edwards 1 , Adam Johan Bergren 2 , Erik J. Cox 3 , Marc D. Porter 4, * Ames Laboratory-U.S.D.O.E., Department of Chemistry, and The Institute for Combinatorial Chemistry, Iowa State University, Ames, IA 50011, United States article info Article history: Received 3 January 2008 Received in revised form 26 May 2008 Accepted 2 June 2008 Available online 7 June 2008 Keywords: Self-assembled monolayers Growth kinetics Thiolates Alkanethiol Nucleation and growth rate Deposition geometry Diffusion Electron-transfer kinetics Infrared spectroscopy abstract This paper examines the role of reactant mass transfer in the preparation of monolayers derived by the chemisorption of thiols on gold and related systems. As a starting point, equations are derived that relate the total impingement of thiol molecules, specifically n-hexanethiol, onto a gold surface for two sub- strate/deposition vessel geometries. The first model is based on a construct that delivers the reactant to the surface by linear diffusion. The second geometry mimics the case in which hemispherical mass transport is a critical component in the diffusional delivery of reactants. The relationships describe the effects of thiol concentration and immersion time solely on the impingement of the reactant on the gold surface with respect to both deposition geometries. With these predictive equations as guides, adlayer formation is followed by using infrared reflection-absorption spectroscopy, contact angle measurements, and assessments of heterogeneous electron-transfer kinetics. This work demonstrates that, in addition to pretreatment protocols of the substrate surface, the mode of reactant mass transport must be carefully considered and controlled in order to repetitively yield adlayers with comparable structures and, there- fore, interfacial properties. Both the total impingement and the rate of impingement of the reactant are found to be major contributors, which implicates the role of nucleation and growth in ultimately dictat- ing subtle, but important differences in the interfacial properties of the adlayer. Ó 2008 Elsevier B.V. All rights reserved. 1. Introduction Self-assembled monolayers (SAMs) present an effective con- struct for the systematic manipulation of interfacial properties [1–7]. Among possible systems, ‘‘thiols on gold” have attracted considerable attention, owing to ease of preparation, stability, and structural definition [8–12]. The average [8,10,12–15] and localized [16–18] structure of alkanethiolate monolayers have, as a consequence, been heavily characterized. Importantly, a sur- vey of recent literature shows a wide variability in the conditions used to prepare these systems [19–35]. Truong and Rowntree [35,36], for example, utilized thiol concentrations between 0.2 and 2 lM and deposition times from minutes to several days to investigate adsorption kinetics. In contrast, concentrations as high as 30 mM and deposition times of 24 h have been used [33,34]. Research has also demonstrated the importance of the surface crystallinity [29,37,38] and roughness [39] of the underlying sub- strate with respect to the structural characteristics of the resulting adlayer. It is well recognized that the interfacial properties of a SAM formed under ostensibly identical conditions, but in different laboratories, can vary even though there is not an immediately apparent origin for these observations [40]. This disparity is espe- cially problematic in electrochemistry because of the extraordinary sensitivity of heterogeneous electron-transfer reaction rates to the differences in the size and shape of extremely small (i.e., nanome- ter-sized or less) defects [41]. Other measures of adlayer properties (e.g., wettability [12,42–44]) have also suffered from reproducibil- ity challenges. To gain control over reproducibility, the underlying factors that affect the structural evolution of the adlayer must be more fully understood, placing a premium on the ability to trace structural details back to potentially subtle differences in prepara- tive procedures. In this work, we show that the reproducible fabri- cation of SAMs can be improved by the careful control of assembly conditions. We believe that the results herein, which are linked to the structural evolution of the adlayer during formation, serve, at least in part, as an explanation of the differences in the findings reported by various laboratories. 0022-0728/$ - see front matter Ó 2008 Elsevier B.V. All rights reserved. doi:10.1016/j.jelechem.2008.06.003 * Corresponding author. E-mail addresses: [email protected] (G.A. Edwards), [email protected] (A.J. Bergren), [email protected] (M.D. Porter). 1 Present address: Northern Kentucky University, Highland Heights, KY 41099, United States. 2 Present address: National Institute for Nanotechnology, University of Alberta, Edmonton, Alberta, Canada T6G 2M9. 3 Present address: IMRE, 3 Research Link, 117602 Singapore, Singapore. 4 Present address: Departments of Chemistry and of Chemical Engineering, University of Utah, Salt Lake City, UT 84112, United States. Journal of Electroanalytical Chemistry 622 (2008) 193–203 Contents lists available at ScienceDirect Journal of Electroanalytical Chemistry journal homepage: www.elsevier.com/locate/jelechem
-
Upload
independent -
Category
Documents
-
view
3 -
download
0
Transcript of Importance of reactant mass transfer in the reproducible preparation of self-assembled monolayers
Journal of Electroanalytical Chemistry 622 (2008) 193–203
Contents lists available at ScienceDirect
Journal of Electroanalytical Chemistry
journal homepage: www.elsevier .com/locate / je lechem
Importance of reactant mass transfer in the reproducible preparationof self-assembled monolayers
Grant A. Edwards 1, Adam Johan Bergren 2, Erik J. Cox 3, Marc D. Porter 4,*
Ames Laboratory-U.S.D.O.E., Department of Chemistry, and The Institute for Combinatorial Chemistry, Iowa State University, Ames, IA 50011, United States
a r t i c l e i n f o a b s t r a c t
Article history:Received 3 January 2008Received in revised form 26 May 2008Accepted 2 June 2008Available online 7 June 2008
Keywords:Self-assembled monolayersGrowth kineticsThiolatesAlkanethiolNucleation and growth rateDeposition geometryDiffusionElectron-transfer kineticsInfrared spectroscopy
0022-0728/$ - see front matter � 2008 Elsevier B.V. Adoi:10.1016/j.jelechem.2008.06.003
* Corresponding author.E-mail addresses: [email protected] (G.A. Edw
(A.J. Bergren), [email protected] (M.D. Porter).1 Present address: Northern Kentucky University,
United States.2 Present address: National Institute for Nanotechn
Edmonton, Alberta, Canada T6G 2M9.3 Present address: IMRE, 3 Research Link, 117602 Si4 Present address: Departments of Chemistry an
University of Utah, Salt Lake City, UT 84112, United St
This paper examines the role of reactant mass transfer in the preparation of monolayers derived by thechemisorption of thiols on gold and related systems. As a starting point, equations are derived that relatethe total impingement of thiol molecules, specifically n-hexanethiol, onto a gold surface for two sub-strate/deposition vessel geometries. The first model is based on a construct that delivers the reactantto the surface by linear diffusion. The second geometry mimics the case in which hemispherical masstransport is a critical component in the diffusional delivery of reactants. The relationships describe theeffects of thiol concentration and immersion time solely on the impingement of the reactant on the goldsurface with respect to both deposition geometries. With these predictive equations as guides, adlayerformation is followed by using infrared reflection-absorption spectroscopy, contact angle measurements,and assessments of heterogeneous electron-transfer kinetics. This work demonstrates that, in addition topretreatment protocols of the substrate surface, the mode of reactant mass transport must be carefullyconsidered and controlled in order to repetitively yield adlayers with comparable structures and, there-fore, interfacial properties. Both the total impingement and the rate of impingement of the reactant arefound to be major contributors, which implicates the role of nucleation and growth in ultimately dictat-ing subtle, but important differences in the interfacial properties of the adlayer.
� 2008 Elsevier B.V. All rights reserved.
1. Introduction
Self-assembled monolayers (SAMs) present an effective con-struct for the systematic manipulation of interfacial properties[1–7]. Among possible systems, ‘‘thiols on gold” have attractedconsiderable attention, owing to ease of preparation, stability,and structural definition [8–12]. The average [8,10,12–15] andlocalized [16–18] structure of alkanethiolate monolayers have,as a consequence, been heavily characterized. Importantly, a sur-vey of recent literature shows a wide variability in the conditionsused to prepare these systems [19–35]. Truong and Rowntree[35,36], for example, utilized thiol concentrations between 0.2and 2 lM and deposition times from minutes to several days toinvestigate adsorption kinetics. In contrast, concentrations as high
ll rights reserved.
ards), [email protected]
Highland Heights, KY 41099,
ology, University of Alberta,
ngapore, Singapore.d of Chemical Engineering,ates.
as 30 mM and deposition times of 24 h have been used [33,34].Research has also demonstrated the importance of the surfacecrystallinity [29,37,38] and roughness [39] of the underlying sub-strate with respect to the structural characteristics of the resultingadlayer.
It is well recognized that the interfacial properties of a SAMformed under ostensibly identical conditions, but in differentlaboratories, can vary even though there is not an immediatelyapparent origin for these observations [40]. This disparity is espe-cially problematic in electrochemistry because of the extraordinarysensitivity of heterogeneous electron-transfer reaction rates to thedifferences in the size and shape of extremely small (i.e., nanome-ter-sized or less) defects [41]. Other measures of adlayer properties(e.g., wettability [12,42–44]) have also suffered from reproducibil-ity challenges. To gain control over reproducibility, the underlyingfactors that affect the structural evolution of the adlayer must bemore fully understood, placing a premium on the ability to tracestructural details back to potentially subtle differences in prepara-tive procedures. In this work, we show that the reproducible fabri-cation of SAMs can be improved by the careful control of assemblyconditions. We believe that the results herein, which are linked tothe structural evolution of the adlayer during formation, serve, atleast in part, as an explanation of the differences in the findingsreported by various laboratories.
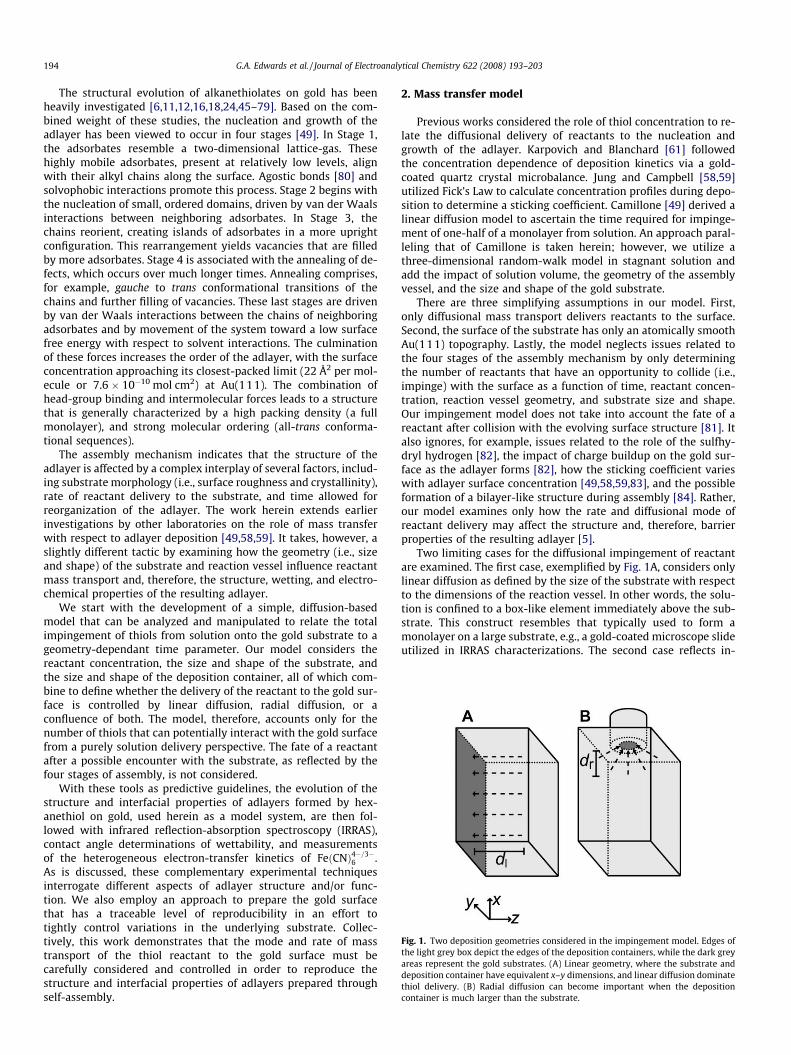
Fig. 1. Two deposition geometries considered in the impingement model. Edges ofthe light grey box depict the edges of the deposition containers, while the dark greyareas represent the gold substrates. (A) Linear geometry, where the substrate anddeposition container have equivalent x–y dimensions, and linear diffusion dominatethiol delivery. (B) Radial diffusion can become important when the depositioncontainer is much larger than the substrate.
194 G.A. Edwards et al. / Journal of Electroanalytical Chemistry 622 (2008) 193–203
The structural evolution of alkanethiolates on gold has beenheavily investigated [6,11,12,16,18,24,45–79]. Based on the com-bined weight of these studies, the nucleation and growth of theadlayer has been viewed to occur in four stages [49]. In Stage 1,the adsorbates resemble a two-dimensional lattice-gas. Thesehighly mobile adsorbates, present at relatively low levels, alignwith their alkyl chains along the surface. Agostic bonds [80] andsolvophobic interactions promote this process. Stage 2 begins withthe nucleation of small, ordered domains, driven by van der Waalsinteractions between neighboring adsorbates. In Stage 3, thechains reorient, creating islands of adsorbates in a more uprightconfiguration. This rearrangement yields vacancies that are filledby more adsorbates. Stage 4 is associated with the annealing of de-fects, which occurs over much longer times. Annealing comprises,for example, gauche to trans conformational transitions of thechains and further filling of vacancies. These last stages are drivenby van der Waals interactions between the chains of neighboringadsorbates and by movement of the system toward a low surfacefree energy with respect to solvent interactions. The culminationof these forces increases the order of the adlayer, with the surfaceconcentration approaching its closest-packed limit (22 Å2 per mol-ecule or 7.6 � 10�10 mol cm2) at Au(111). The combination ofhead-group binding and intermolecular forces leads to a structurethat is generally characterized by a high packing density (a fullmonolayer), and strong molecular ordering (all-trans conforma-tional sequences).
The assembly mechanism indicates that the structure of theadlayer is affected by a complex interplay of several factors, includ-ing substrate morphology (i.e., surface roughness and crystallinity),rate of reactant delivery to the substrate, and time allowed forreorganization of the adlayer. The work herein extends earlierinvestigations by other laboratories on the role of mass transferwith respect to adlayer deposition [49,58,59]. It takes, however, aslightly different tactic by examining how the geometry (i.e., sizeand shape) of the substrate and reaction vessel influence reactantmass transport and, therefore, the structure, wetting, and electro-chemical properties of the resulting adlayer.
We start with the development of a simple, diffusion-basedmodel that can be analyzed and manipulated to relate the totalimpingement of thiols from solution onto the gold substrate to ageometry-dependant time parameter. Our model considers thereactant concentration, the size and shape of the substrate, andthe size and shape of the deposition container, all of which com-bine to define whether the delivery of the reactant to the gold sur-face is controlled by linear diffusion, radial diffusion, or aconfluence of both. The model, therefore, accounts only for thenumber of thiols that can potentially interact with the gold surfacefrom a purely solution delivery perspective. The fate of a reactantafter a possible encounter with the substrate, as reflected by thefour stages of assembly, is not considered.
With these tools as predictive guidelines, the evolution of thestructure and interfacial properties of adlayers formed by hex-anethiol on gold, used herein as a model system, are then fol-lowed with infrared reflection-absorption spectroscopy (IRRAS),contact angle determinations of wettability, and measurementsof the heterogeneous electron-transfer kinetics of FeðCNÞ4�=3�
6 .As is discussed, these complementary experimental techniquesinterrogate different aspects of adlayer structure and/or func-tion. We also employ an approach to prepare the gold surfacethat has a traceable level of reproducibility in an effort totightly control variations in the underlying substrate. Collec-tively, this work demonstrates that the mode and rate of masstransport of the thiol reactant to the gold surface must becarefully considered and controlled in order to reproduce thestructure and interfacial properties of adlayers prepared throughself-assembly.
2. Mass transfer model
Previous works considered the role of thiol concentration to re-late the diffusional delivery of reactants to the nucleation andgrowth of the adlayer. Karpovich and Blanchard [61] followedthe concentration dependence of deposition kinetics via a gold-coated quartz crystal microbalance. Jung and Campbell [58,59]utilized Fick’s Law to calculate concentration profiles during depo-sition to determine a sticking coefficient. Camillone [49] derived alinear diffusion model to ascertain the time required for impinge-ment of one-half of a monolayer from solution. An approach paral-leling that of Camillone is taken herein; however, we utilize athree-dimensional random-walk model in stagnant solution andadd the impact of solution volume, the geometry of the assemblyvessel, and the size and shape of the gold substrate.
There are three simplifying assumptions in our model. First,only diffusional mass transport delivers reactants to the surface.Second, the surface of the substrate has only an atomically smoothAu(111) topography. Lastly, the model neglects issues related tothe four stages of the assembly mechanism by only determiningthe number of reactants that have an opportunity to collide (i.e.,impinge) with the surface as a function of time, reactant concen-tration, reaction vessel geometry, and substrate size and shape.Our impingement model does not take into account the fate of areactant after collision with the evolving surface structure [81]. Italso ignores, for example, issues related to the role of the sulfhy-dryl hydrogen [82], the impact of charge buildup on the gold sur-face as the adlayer forms [82], how the sticking coefficient varieswith adlayer surface concentration [49,58,59,83], and the possibleformation of a bilayer-like structure during assembly [84]. Rather,our model examines only how the rate and diffusional mode ofreactant delivery may affect the structure and, therefore, barrierproperties of the resulting adlayer [5].
Two limiting cases for the diffusional impingement of reactantare examined. The first case, exemplified by Fig. 1A, considers onlylinear diffusion as defined by the size of the substrate with respectto the dimensions of the reaction vessel. In other words, the solu-tion is confined to a box-like element immediately above the sub-strate. This construct resembles that typically used to form amonolayer on a large substrate, e.g., a gold-coated microscope slideutilized in IRRAS characterizations. The second case reflects in-
G.A. Edwards et al. / Journal of Electroanalytical Chemistry 622 (2008) 193–203 195
stances in which radial diffusion may dominate the delivery ofreactant. It mimics the situation in which the gold substrate ismuch smaller than any of the dimensions of the solution-contain-ing vessel. This configuration, represented by Fig. 1B, therefore,mimics that often employed when coating much smaller sub-strates, like those used in electrochemical experiments.
As a starting point, the variables employed in both cases are de-fined: C is the thiol concentration in bulk solution; C0 defines thelimiting surface concentration for a thiolate monolayer on atomi-cally smooth Au(111) (7.6 � 10�10 mol cm�2) [82]; A is the sub-strate surface area; and D stands for the diffusion coefficient ofthe reactant in ethanol (5.0 � 10�6 cm2 s�1) [49,58]. We also intro-duce a fractional factor, v, to represent the number of monolayersthat would form solely based on reactant impingement (e.g., a v of0.50 represents the impingement of 3.8 � 10�10 moles of reactanton a 1.0 cm2 Au(1 1 1) surface).
The volume element (V) of a homogenous solution that containsthe required number of reactants for a given value of v can be writ-ten as
V ¼ vC0AC
; ð1Þ
which creates a reaction vessel of arbitrary dimensions. It is, how-ever, the relative size and shape of the reaction vessel with respectto the substrate that dictates the actual shape of the volume ele-ment and, thus, the dominant mode of diffusional mass transfer.The rest of this section details the development of the two modelsand then examines possible implications of their differences onadlayer formation.
2.1. Linear diffusion model
The model geometry in Fig. 1A assumes linear diffusion controlsthe delivery of reactant to the substrate. The geometry follows thatused to form monolayers on a gold-coated glass microscope slidein a staining jar, which has a volume of �75 mL and internaldimensions of 7.6 � 2.5 � 2.5 cm. An immersed glass microscopeslide, which has a rectangular shape (7.6 � 2.5 cm), therefore,leaves little room for the delivery of thiols beyond its edges (i.e., lit-tle contribution from nonlinear diffusion). This construct leads toan artificial volume element with two dimensions dictated bythe length and width of the substrate. The third dimension is de-fined by the thickness (dL) of the solution required to yield a vol-ume that contains the number of reactants as required by v. Thevalue for V in this case is
V ¼ AdL: ð2Þ
By equating Eqs. (1) and (2), we get
dL ¼vC0
C: ð3Þ
This equation indicates that as long as dL is smaller than the z-dimension of the deposition container, the number of thiols presentin the volume element is sufficient to satisfy that required by v.
The next step considers the role of diffusional mass transport.The average time t (units: s) required for a molecule to become dis-placed a distance x (units: cm) through Brownian motion [85] is gi-ven by
x ¼ffiffiffiffiffiffiffiffi6Dtp
: ð4Þ
If we then equate dL in Eq. (3) to x in Eq. (4), the average time (tL)required for the transport of molecules from the entire volume ele-ment to the substrate via linear diffusion is
tL ¼v2C2
0
6DC2 : ð5Þ
Eq. (5) predicts that it would take �320 min for one monolayer ofreactants (v = 1.0) to impinge the substrate at a thiol concentrationof 1.0 lM, and that the reaction vessel must support a solution layerthickness of at least 0.76 cm. For comparison, the immersion of aslide in a 1.0 mM thiol solution for 12 h equates to a v of �1500and a solution layer thickness of �1.1 cm.
2.2. Radial diffusion model
For the construct in Fig. 1B, the lateral dimensions of the sub-strate are much smaller than those of the reaction vessel. This ap-proach to adlayer formation can, therefore, have a strongcontribution from radial diffusion. In this setup, the parameter dR
carves out an artificial hemispherical container such that
V ¼ 2pd3R
3: ð6Þ
If dR is then connected to the volume of solution required to sat-isfy v, equating Eqs. (1) and (6) gives:
dR ¼ffiffiffiffiffiffiffiffiffiffiffiffiffiffiffi3vC0A
2pC3
r: ð7Þ
Finally, by applying the three-dimensional random-walk modelto Eq. (7), the average radial diffusion time parameter (tR) is
tR ¼1
6D3vC0A
2pC
� �2=3
: ð8Þ
Eq. (8) is rigorously valid only when radial diffusion controls thedelivery of thiols to the gold surface. In practice, however, a purelyradial model is inappropriate for small values of dR or tR since ahemispherical diffusion layer has not fully developed. While some-what arbitrary, we have set the lower useable limit for dR to be atleast five times the electrode radius (re) but smaller than the depo-sition container. This conservative estimate, we believe, will en-sure that radial diffusion is the dominant form of reactant masstransfer and lead to a reasonable calculation of impingement. Forthe gold electrodes employed herein (re = 0.080 cm), this require-ment dictates that dR is P0.40 cm, which equates through Eq. (4)to a minimum immersion time of 90 min.
Using the input parameters used as an example for the lineardiffusion model above (thiol concentration of 1.0 lM and v = 1.0)and a substrate area of 0.020 cm2, the radial model results in areaction vessel radius of over 0.19 cm and a much smaller valuefor tR (21 min). However, neither value meets the requirementsset for the reliable application of the radial model. In contrast, toachieve a v-value of unity at a deposition time of 320 min, a thiolconcentration of only 0.020 lM is needed; these conditions trans-late to a dR of 0.76 cm, which meets the constraints set forthearlier.
2.3. Model comparison
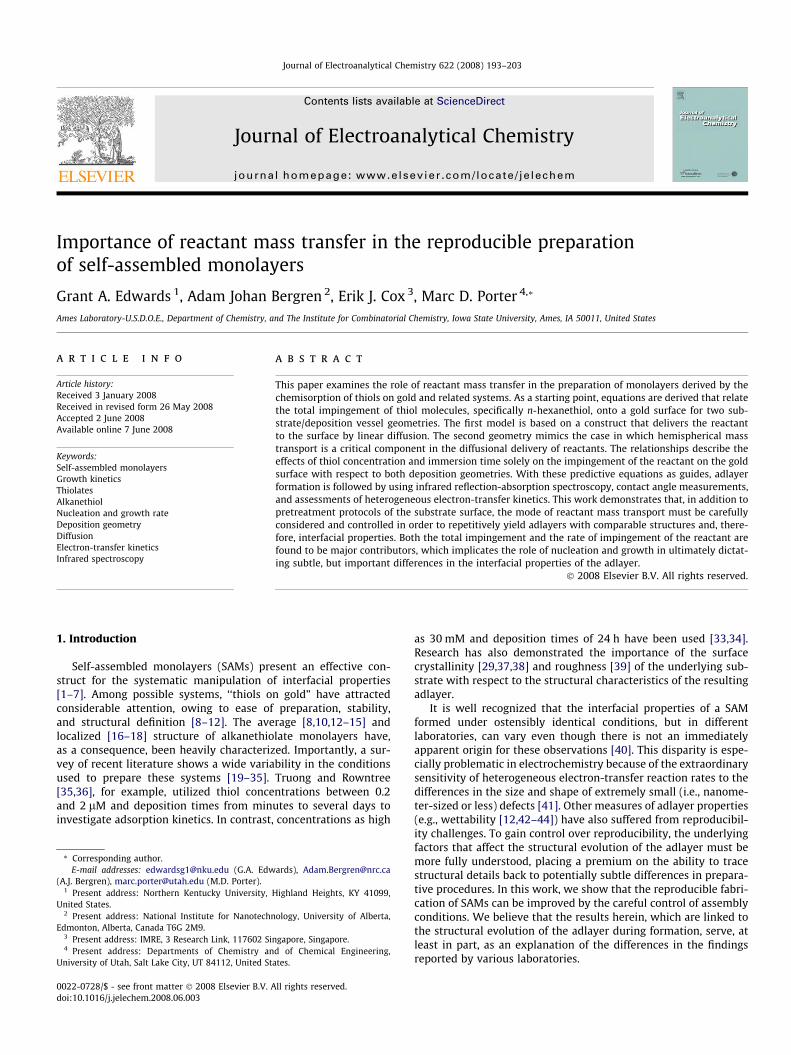
A few of the more informative predictions of the two models arepresented in Fig. 2. These plots show relationships between C, v,and t. Fig. 2A, C, and E depict projections of the linear diffusion mod-el, whereas those in Fig. 2B, D, and F are for the radial diffusion mod-el. All the results in Fig. 2 were generated to closely match theexperimental conditions that are used later in this report; however,the insights are generally applicable to most diffusion-controlleddepositions. In addition, Table 1 summarizes the proportionalitiesof each variable, which are cross-referenced to the plots in Fig. 2.We note before discussing these relationships that the linear modelis independent of A. The radial model, in contrast, exhibits a strongdependence on A, which originates from the diffusional delivery ofreactants from beyond the edges of the disk-shaped substrate.
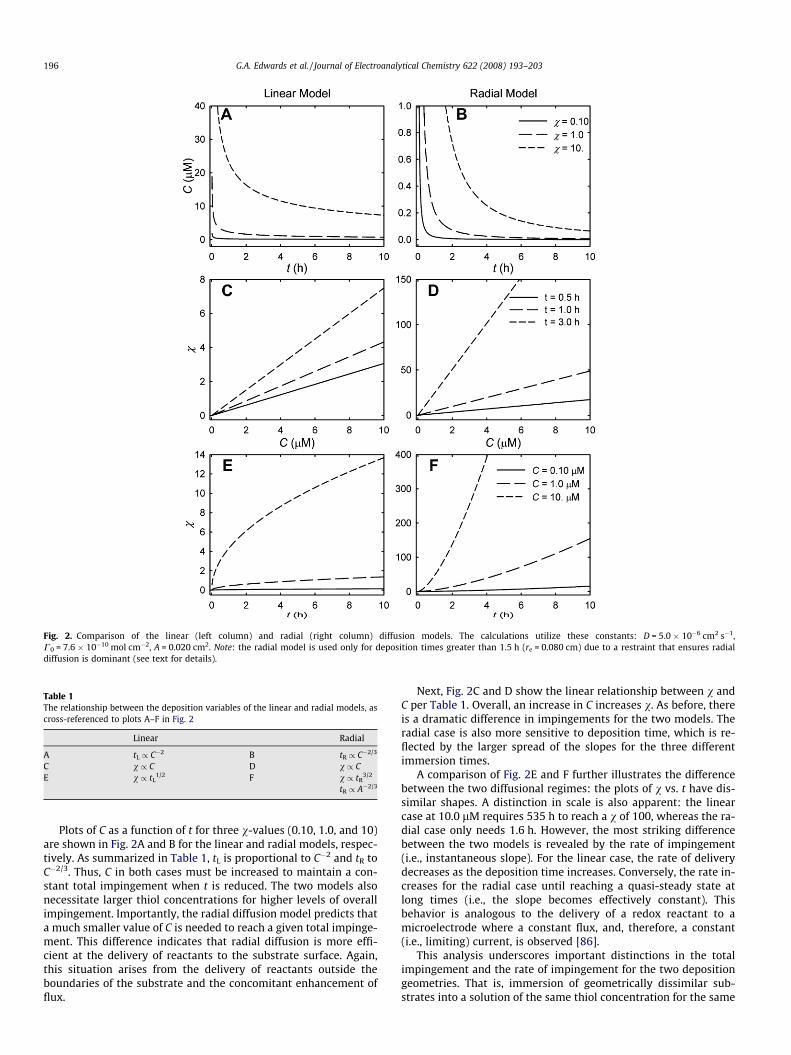
Fig. 2. Comparison of the linear (left column) and radial (right column) diffusion models. The calculations utilize these constants: D = 5.0 � 10�6 cm2 s�1,C0 = 7.6 � 10�10 mol cm�2, A = 0.020 cm2. Note: the radial model is used only for deposition times greater than 1.5 h (re = 0.080 cm) due to a restraint that ensures radialdiffusion is dominant (see text for details).
Table 1The relationship between the deposition variables of the linear and radial models, ascross-referenced to plots A–F in Fig. 2
Linear Radial
A tL / C�2 B tR / C�2/3
C v / C D v / CE v / tL
1/2 F v / tR3/2
tR / A�2/3
196 G.A. Edwards et al. / Journal of Electroanalytical Chemistry 622 (2008) 193–203
Plots of C as a function of t for three v-values (0.10, 1.0, and 10)are shown in Fig. 2A and B for the linear and radial models, respec-tively. As summarized in Table 1, tL is proportional to C�2 and tR toC�2/3. Thus, C in both cases must be increased to maintain a con-stant total impingement when t is reduced. The two models alsonecessitate larger thiol concentrations for higher levels of overallimpingement. Importantly, the radial diffusion model predicts thata much smaller value of C is needed to reach a given total impinge-ment. This difference indicates that radial diffusion is more effi-cient at the delivery of reactants to the substrate surface. Again,this situation arises from the delivery of reactants outside theboundaries of the substrate and the concomitant enhancement offlux.
Next, Fig. 2C and D show the linear relationship between v andC per Table 1. Overall, an increase in C increases v. As before, thereis a dramatic difference in impingements for the two models. Theradial case is also more sensitive to deposition time, which is re-flected by the larger spread of the slopes for the three differentimmersion times.
A comparison of Fig. 2E and F further illustrates the differencebetween the two diffusional regimes: the plots of v vs. t have dis-similar shapes. A distinction in scale is also apparent: the linearcase at 10.0 lM requires 535 h to reach a v of 100, whereas the ra-dial case only needs 1.6 h. However, the most striking differencebetween the two models is revealed by the rate of impingement(i.e., instantaneous slope). For the linear case, the rate of deliverydecreases as the deposition time increases. Conversely, the rate in-creases for the radial case until reaching a quasi-steady state atlong times (i.e., the slope becomes effectively constant). Thisbehavior is analogous to the delivery of a redox reactant to amicroelectrode where a constant flux, and, therefore, a constant(i.e., limiting) current, is observed [86].
This analysis underscores important distinctions in the totalimpingement and the rate of impingement for the two depositiongeometries. That is, immersion of geometrically dissimilar sub-strates into a solution of the same thiol concentration for the same
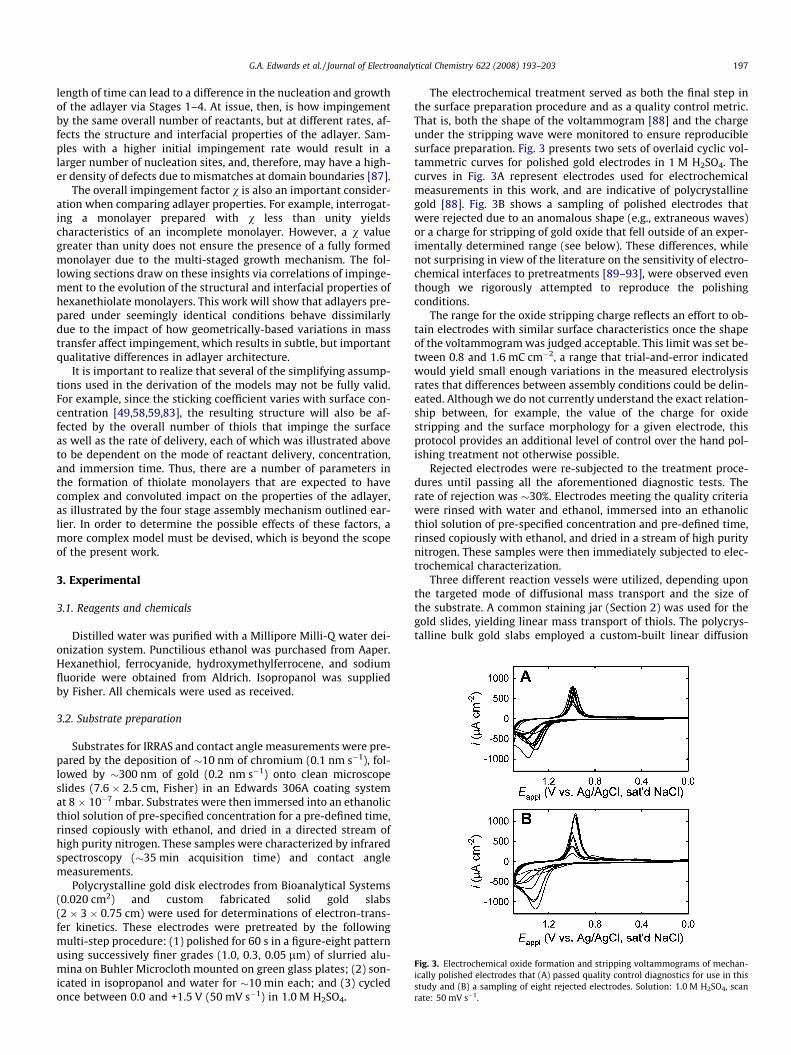
Fig. 3. Electrochemical oxide formation and stripping voltammograms of mechan-ically polished electrodes that (A) passed quality control diagnostics for use in thisstudy and (B) a sampling of eight rejected electrodes. Solution: 1.0 M H2SO4, scanrate: 50 mV s�1.
G.A. Edwards et al. / Journal of Electroanalytical Chemistry 622 (2008) 193–203 197
length of time can lead to a difference in the nucleation and growthof the adlayer via Stages 1–4. At issue, then, is how impingementby the same overall number of reactants, but at different rates, af-fects the structure and interfacial properties of the adlayer. Sam-ples with a higher initial impingement rate would result in alarger number of nucleation sites, and, therefore, may have a high-er density of defects due to mismatches at domain boundaries [87].
The overall impingement factor v is also an important consider-ation when comparing adlayer properties. For example, interrogat-ing a monolayer prepared with v less than unity yieldscharacteristics of an incomplete monolayer. However, a v valuegreater than unity does not ensure the presence of a fully formedmonolayer due to the multi-staged growth mechanism. The fol-lowing sections draw on these insights via correlations of impinge-ment to the evolution of the structural and interfacial properties ofhexanethiolate monolayers. This work will show that adlayers pre-pared under seemingly identical conditions behave dissimilarlydue to the impact of how geometrically-based variations in masstransfer affect impingement, which results in subtle, but importantqualitative differences in adlayer architecture.
It is important to realize that several of the simplifying assump-tions used in the derivation of the models may not be fully valid.For example, since the sticking coefficient varies with surface con-centration [49,58,59,83], the resulting structure will also be af-fected by the overall number of thiols that impinge the surfaceas well as the rate of delivery, each of which was illustrated aboveto be dependent on the mode of reactant delivery, concentration,and immersion time. Thus, there are a number of parameters inthe formation of thiolate monolayers that are expected to havecomplex and convoluted impact on the properties of the adlayer,as illustrated by the four stage assembly mechanism outlined ear-lier. In order to determine the possible effects of these factors, amore complex model must be devised, which is beyond the scopeof the present work.
3. Experimental
3.1. Reagents and chemicals
Distilled water was purified with a Millipore Milli-Q water dei-onization system. Punctilious ethanol was purchased from Aaper.Hexanethiol, ferrocyanide, hydroxymethylferrocene, and sodiumfluoride were obtained from Aldrich. Isopropanol was suppliedby Fisher. All chemicals were used as received.
3.2. Substrate preparation
Substrates for IRRAS and contact angle measurements were pre-pared by the deposition of �10 nm of chromium (0.1 nm s�1), fol-lowed by �300 nm of gold (0.2 nm s�1) onto clean microscopeslides (7.6 � 2.5 cm, Fisher) in an Edwards 306A coating systemat 8 � 10�7 mbar. Substrates were then immersed into an ethanolicthiol solution of pre-specified concentration for a pre-defined time,rinsed copiously with ethanol, and dried in a directed stream ofhigh purity nitrogen. These samples were characterized by infraredspectroscopy (�35 min acquisition time) and contact anglemeasurements.
Polycrystalline gold disk electrodes from Bioanalytical Systems(0.020 cm2) and custom fabricated solid gold slabs(2 � 3 � 0.75 cm) were used for determinations of electron-trans-fer kinetics. These electrodes were pretreated by the followingmulti-step procedure: (1) polished for 60 s in a figure-eight patternusing successively finer grades (1.0, 0.3, 0.05 lm) of slurried alu-mina on Buhler Microcloth mounted on green glass plates; (2) son-icated in isopropanol and water for �10 min each; and (3) cycledonce between 0.0 and +1.5 V (50 mV s�1) in 1.0 M H2SO4.
The electrochemical treatment served as both the final step inthe surface preparation procedure and as a quality control metric.That is, both the shape of the voltammogram [88] and the chargeunder the stripping wave were monitored to ensure reproduciblesurface preparation. Fig. 3 presents two sets of overlaid cyclic vol-tammetric curves for polished gold electrodes in 1 M H2SO4. Thecurves in Fig. 3A represent electrodes used for electrochemicalmeasurements in this work, and are indicative of polycrystallinegold [88]. Fig. 3B shows a sampling of polished electrodes thatwere rejected due to an anomalous shape (e.g., extraneous waves)or a charge for stripping of gold oxide that fell outside of an exper-imentally determined range (see below). These differences, whilenot surprising in view of the literature on the sensitivity of electro-chemical interfaces to pretreatments [89–93], were observed eventhough we rigorously attempted to reproduce the polishingconditions.
The range for the oxide stripping charge reflects an effort to ob-tain electrodes with similar surface characteristics once the shapeof the voltammogram was judged acceptable. This limit was set be-tween 0.8 and 1.6 mC cm�2, a range that trial-and-error indicatedwould yield small enough variations in the measured electrolysisrates that differences between assembly conditions could be delin-eated. Although we do not currently understand the exact relation-ship between, for example, the value of the charge for oxidestripping and the surface morphology for a given electrode, thisprotocol provides an additional level of control over the hand pol-ishing treatment not otherwise possible.
Rejected electrodes were re-subjected to the treatment proce-dures until passing all the aforementioned diagnostic tests. Therate of rejection was �30%. Electrodes meeting the quality criteriawere rinsed with water and ethanol, immersed into an ethanolicthiol solution of pre-specified concentration and pre-defined time,rinsed copiously with ethanol, and dried in a stream of high puritynitrogen. These samples were then immediately subjected to elec-trochemical characterization.
Three different reaction vessels were utilized, depending uponthe targeted mode of diffusional mass transport and the size ofthe substrate. A common staining jar (Section 2) was used for thegold slides, yielding linear mass transport of thiols. The polycrys-talline bulk gold slabs employed a custom-built linear diffusion
198 G.A. Edwards et al. / Journal of Electroanalytical Chemistry 622 (2008) 193–203
reaction vessel; the gold slabs were placed into one end of the ves-sel and bathed in solution, resulting in reactant diffusion along thelong dimension of the vessel. Polycrystalline gold disk electrodeswere immersed in solutions in glass jars of various dimensionsdepending on the required dR, the most common of which was atypical scintillation vial. The electrodes were suspended from thelid of the vial and positioned near the middle of the vessel.
3.3. Infrared reflection–absorption spectroscopy
Infrared spectra were acquired with a Nicolet 740 FT-IR spec-trometer, equipped with a liquid nitrogen cooled mercury cad-mium telluride detector, using p-polarized light incident at 80�.The sample chamber was purged with nitrogen for 20 min beforedata collection. Spectra were obtained by referencing 1024 samplescans to 1024 background scans at 4 cm�1 resolution (zero filled to2 cm�1) with Happ-Genzel apodization. Background spectra used agold slide coated with perdeuterated octadecanethiolate.
3.4. Contact angle measurements
Advancing (ha) contact angles were determined using a Rame-Hart Model 100-00 115 goniometer and deionized water. A�5 lL drop of water was dispensed onto the substrate, with ha
measured by slowly pulling the pipette tip away from the dropwhile increasing the volume of the drop.
3.5. Electrochemistry
Electrochemical measurements were carried out using a CHInstruments model 660B potentiostat and a three-electrode cellthat housed a silver/silver chloride, saturated sodium chlorideelectrode (Ag/AgCl, saturated NaCl) as the reference electrodeand a flame-cleaned, coiled platinum wire auxiliary electrode.Electrolyte solutions were degassed with high purity nitrogen for�10 min, with a blanket of nitrogen maintained over the solutionthroughout the experiments.
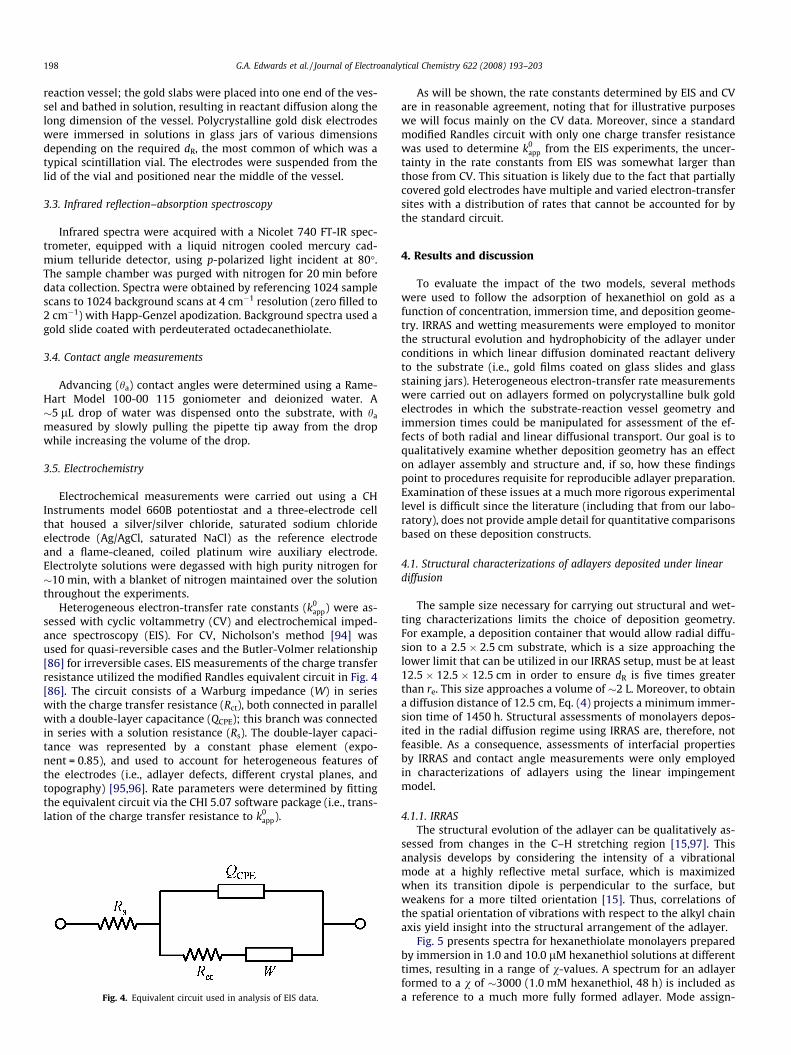
Heterogeneous electron-transfer rate constants (k0app) were as-
sessed with cyclic voltammetry (CV) and electrochemical imped-ance spectroscopy (EIS). For CV, Nicholson’s method [94] wasused for quasi-reversible cases and the Butler-Volmer relationship[86] for irreversible cases. EIS measurements of the charge transferresistance utilized the modified Randles equivalent circuit in Fig. 4[86]. The circuit consists of a Warburg impedance (W) in serieswith the charge transfer resistance (Rct), both connected in parallelwith a double-layer capacitance (QCPE); this branch was connectedin series with a solution resistance (Rs). The double-layer capaci-tance was represented by a constant phase element (expo-nent = 0.85), and used to account for heterogeneous features ofthe electrodes (i.e., adlayer defects, different crystal planes, andtopography) [95,96]. Rate parameters were determined by fittingthe equivalent circuit via the CHI 5.07 software package (i.e., trans-lation of the charge transfer resistance to k0
app).
Fig. 4. Equivalent circuit used in analysis of EIS data.
As will be shown, the rate constants determined by EIS and CVare in reasonable agreement, noting that for illustrative purposeswe will focus mainly on the CV data. Moreover, since a standardmodified Randles circuit with only one charge transfer resistancewas used to determine k0
app from the EIS experiments, the uncer-tainty in the rate constants from EIS was somewhat larger thanthose from CV. This situation is likely due to the fact that partiallycovered gold electrodes have multiple and varied electron-transfersites with a distribution of rates that cannot be accounted for bythe standard circuit.
4. Results and discussion
To evaluate the impact of the two models, several methodswere used to follow the adsorption of hexanethiol on gold as afunction of concentration, immersion time, and deposition geome-try. IRRAS and wetting measurements were employed to monitorthe structural evolution and hydrophobicity of the adlayer underconditions in which linear diffusion dominated reactant deliveryto the substrate (i.e., gold films coated on glass slides and glassstaining jars). Heterogeneous electron-transfer rate measurementswere carried out on adlayers formed on polycrystalline bulk goldelectrodes in which the substrate-reaction vessel geometry andimmersion times could be manipulated for assessment of the ef-fects of both radial and linear diffusional transport. Our goal is toqualitatively examine whether deposition geometry has an effecton adlayer assembly and structure and, if so, how these findingspoint to procedures requisite for reproducible adlayer preparation.Examination of these issues at a much more rigorous experimentallevel is difficult since the literature (including that from our labo-ratory), does not provide ample detail for quantitative comparisonsbased on these deposition constructs.
4.1. Structural characterizations of adlayers deposited under lineardiffusion
The sample size necessary for carrying out structural and wet-ting characterizations limits the choice of deposition geometry.For example, a deposition container that would allow radial diffu-sion to a 2.5 � 2.5 cm substrate, which is a size approaching thelower limit that can be utilized in our IRRAS setup, must be at least12.5 � 12.5 � 12.5 cm in order to ensure dR is five times greaterthan re. This size approaches a volume of �2 L. Moreover, to obtaina diffusion distance of 12.5 cm, Eq. (4) projects a minimum immer-sion time of 1450 h. Structural assessments of monolayers depos-ited in the radial diffusion regime using IRRAS are, therefore, notfeasible. As a consequence, assessments of interfacial propertiesby IRRAS and contact angle measurements were only employedin characterizations of adlayers using the linear impingementmodel.
4.1.1. IRRASThe structural evolution of the adlayer can be qualitatively as-
sessed from changes in the C–H stretching region [15,97]. Thisanalysis develops by considering the intensity of a vibrationalmode at a highly reflective metal surface, which is maximizedwhen its transition dipole is perpendicular to the surface, butweakens for a more tilted orientation [15]. Thus, correlations ofthe spatial orientation of vibrations with respect to the alkyl chainaxis yield insight into the structural arrangement of the adlayer.
Fig. 5 presents spectra for hexanethiolate monolayers preparedby immersion in 1.0 and 10.0 lM hexanethiol solutions at differenttimes, resulting in a range of v-values. A spectrum for an adlayerformed to a v of �3000 (1.0 mM hexanethiol, 48 h) is included asa reference to a much more fully formed adlayer. Mode assign-
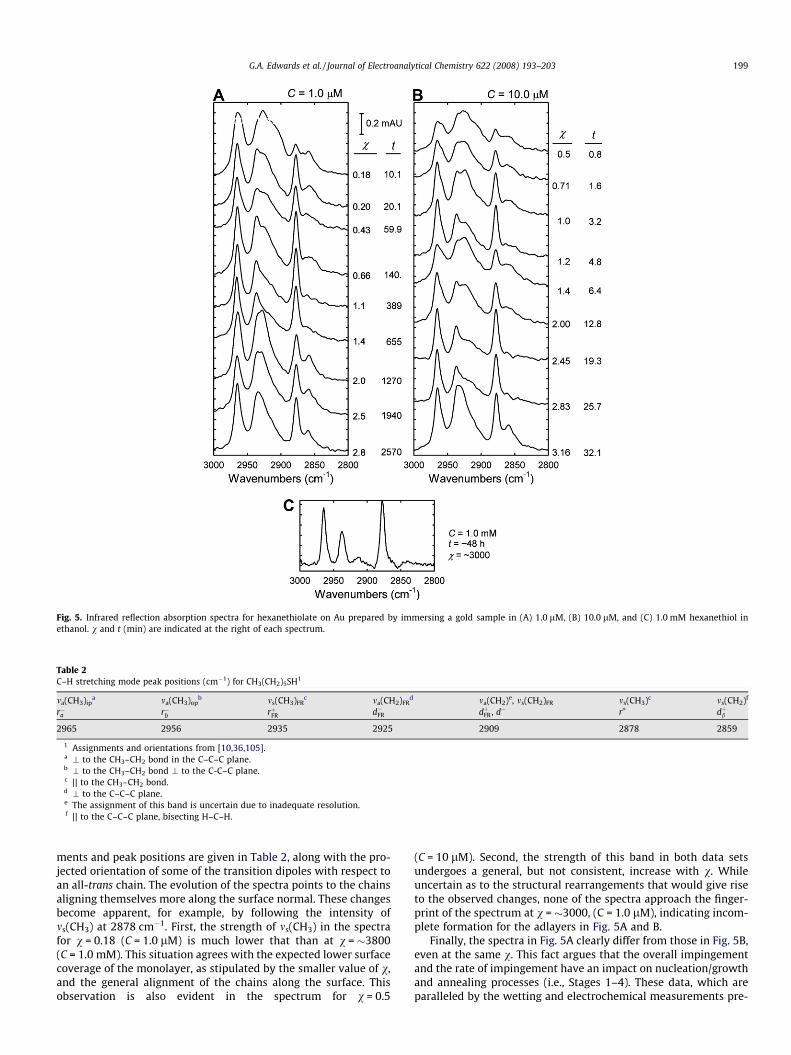
Fig. 5. Infrared reflection absorption spectra for hexanethiolate on Au prepared by immersing a gold sample in (A) 1.0 lM, (B) 10.0 lM, and (C) 1.0 mM hexanethiol inethanol. v and t (min) are indicated at the right of each spectrum.
Table 2C–H stretching mode peak positions (cm�1) for CH3(CH2)5SH1
ma(CH3)ipa ma(CH3)op
b ms(CH3)FRc ma(CH2)FR
d ma(CH2)e, ms(CH2)FR ms(CH3)c ms(CH2)f
r�a r�b rþFR d�FR dþFR , d� r+ dþb
2965 2956 2935 2925 2909 2878 2859
1 Assignments and orientations from [10,36,105].a \ to the CH3–CH2 bond in the C–C–C plane.b \ to the CH3–CH2 bond \ to the C-C–C plane.c || to the CH3–CH2 bond.d \ to the C–C–C plane.e The assignment of this band is uncertain due to inadequate resolution.f || to the C–C–C plane, bisecting H–C–H.
G.A. Edwards et al. / Journal of Electroanalytical Chemistry 622 (2008) 193–203 199
ments and peak positions are given in Table 2, along with the pro-jected orientation of some of the transition dipoles with respect toan all-trans chain. The evolution of the spectra points to the chainsaligning themselves more along the surface normal. These changesbecome apparent, for example, by following the intensity ofms(CH3) at 2878 cm�1. First, the strength of ms(CH3) in the spectrafor v = 0.18 (C = 1.0 lM) is much lower that than at v = �3800(C = 1.0 mM). This situation agrees with the expected lower surfacecoverage of the monolayer, as stipulated by the smaller value of v,and the general alignment of the chains along the surface. Thisobservation is also evident in the spectrum for v = 0.5
(C = 10 lM). Second, the strength of this band in both data setsundergoes a general, but not consistent, increase with v. Whileuncertain as to the structural rearrangements that would give riseto the observed changes, none of the spectra approach the finger-print of the spectrum at v = �3000, (C = 1.0 lM), indicating incom-plete formation for the adlayers in Fig. 5A and B.
Finally, the spectra in Fig. 5A clearly differ from those in Fig. 5B,even at the same v. This fact argues that the overall impingementand the rate of impingement have an impact on nucleation/growthand annealing processes (i.e., Stages 1–4). These data, which areparalleled by the wetting and electrochemical measurements pre-
200 G.A. Edwards et al. / Journal of Electroanalytical Chemistry 622 (2008) 193–203
sented below, demonstrate that adlayers prepared using differentthiol concentrations do not necessarily reach comparable struc-tures, even when the overall impingements are the same. More-over, these findings reinforce the important conclusion that bothreactant concentration and deposition time are central to thereproducible modification of surface architectures.
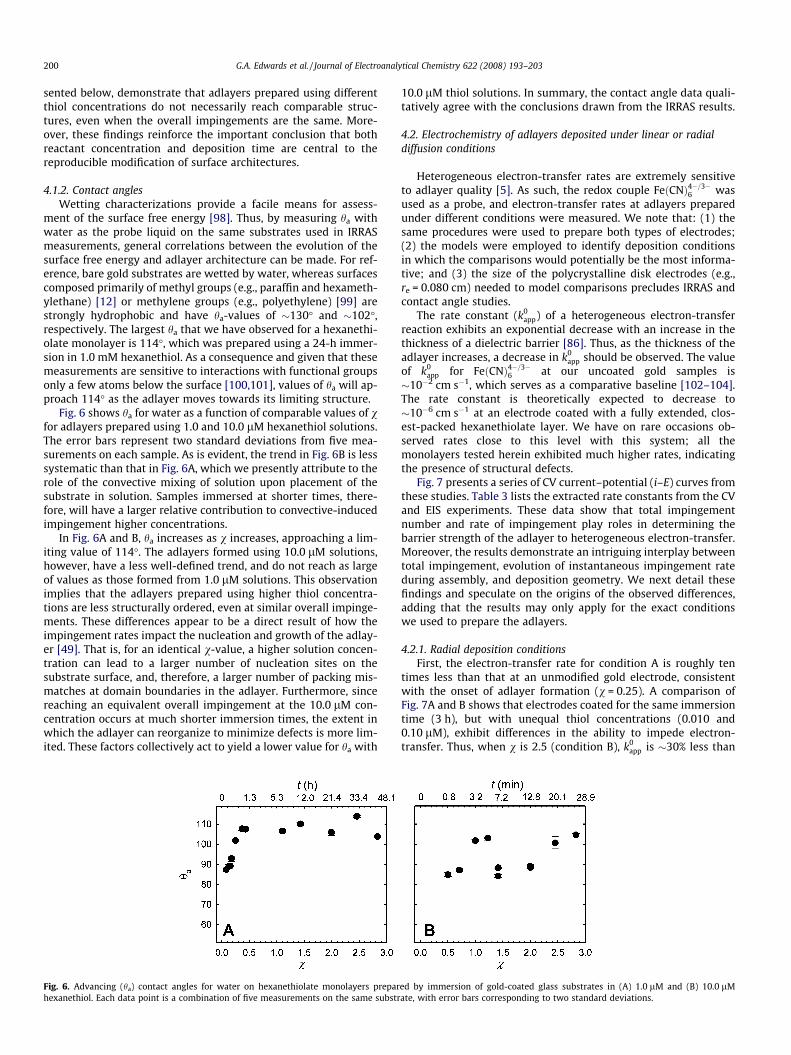
4.1.2. Contact anglesWetting characterizations provide a facile means for assess-
ment of the surface free energy [98]. Thus, by measuring ha withwater as the probe liquid on the same substrates used in IRRASmeasurements, general correlations between the evolution of thesurface free energy and adlayer architecture can be made. For ref-erence, bare gold substrates are wetted by water, whereas surfacescomposed primarily of methyl groups (e.g., paraffin and hexameth-ylethane) [12] or methylene groups (e.g., polyethylene) [99] arestrongly hydrophobic and have ha-values of �130� and �102�,respectively. The largest ha that we have observed for a hexanethi-olate monolayer is 114�, which was prepared using a 24-h immer-sion in 1.0 mM hexanethiol. As a consequence and given that thesemeasurements are sensitive to interactions with functional groupsonly a few atoms below the surface [100,101], values of ha will ap-proach 114� as the adlayer moves towards its limiting structure.
Fig. 6 shows ha for water as a function of comparable values of vfor adlayers prepared using 1.0 and 10.0 lM hexanethiol solutions.The error bars represent two standard deviations from five mea-surements on each sample. As is evident, the trend in Fig. 6B is lesssystematic than that in Fig. 6A, which we presently attribute to therole of the convective mixing of solution upon placement of thesubstrate in solution. Samples immersed at shorter times, there-fore, will have a larger relative contribution to convective-inducedimpingement higher concentrations.
In Fig. 6A and B, ha increases as v increases, approaching a lim-iting value of 114�. The adlayers formed using 10.0 lM solutions,however, have a less well-defined trend, and do not reach as largeof values as those formed from 1.0 lM solutions. This observationimplies that the adlayers prepared using higher thiol concentra-tions are less structurally ordered, even at similar overall impinge-ments. These differences appear to be a direct result of how theimpingement rates impact the nucleation and growth of the adlay-er [49]. That is, for an identical v-value, a higher solution concen-tration can lead to a larger number of nucleation sites on thesubstrate surface, and, therefore, a larger number of packing mis-matches at domain boundaries in the adlayer. Furthermore, sincereaching an equivalent overall impingement at the 10.0 lM con-centration occurs at much shorter immersion times, the extent inwhich the adlayer can reorganize to minimize defects is more lim-ited. These factors collectively act to yield a lower value for ha with
Fig. 6. Advancing (ha) contact angles for water on hexanethiolate monolayers preparhexanethiol. Each data point is a combination of five measurements on the same substr
10.0 lM thiol solutions. In summary, the contact angle data quali-tatively agree with the conclusions drawn from the IRRAS results.
4.2. Electrochemistry of adlayers deposited under linear or radialdiffusion conditions
Heterogeneous electron-transfer rates are extremely sensitiveto adlayer quality [5]. As such, the redox couple FeðCNÞ4�=3�
6 wasused as a probe, and electron-transfer rates at adlayers preparedunder different conditions were measured. We note that: (1) thesame procedures were used to prepare both types of electrodes;(2) the models were employed to identify deposition conditionsin which the comparisons would potentially be the most informa-tive; and (3) the size of the polycrystalline disk electrodes (e.g.,re = 0.080 cm) needed to model comparisons precludes IRRAS andcontact angle studies.
The rate constant (k0app) of a heterogeneous electron-transfer
reaction exhibits an exponential decrease with an increase in thethickness of a dielectric barrier [86]. Thus, as the thickness of theadlayer increases, a decrease in k0
app should be observed. The valueof k0
app for FeðCNÞ4�=3�6 at our uncoated gold samples is
�10�2 cm s�1, which serves as a comparative baseline [102–104].The rate constant is theoretically expected to decrease to�10�6 cm s�1 at an electrode coated with a fully extended, clos-est-packed hexanethiolate layer. We have on rare occasions ob-served rates close to this level with this system; all themonolayers tested herein exhibited much higher rates, indicatingthe presence of structural defects.
Fig. 7 presents a series of CV current–potential (i–E) curves fromthese studies. Table 3 lists the extracted rate constants from the CVand EIS experiments. These data show that total impingementnumber and rate of impingement play roles in determining thebarrier strength of the adlayer to heterogeneous electron-transfer.Moreover, the results demonstrate an intriguing interplay betweentotal impingement, evolution of instantaneous impingement rateduring assembly, and deposition geometry. We next detail thesefindings and speculate on the origins of the observed differences,adding that the results may only apply for the exact conditionswe used to prepare the adlayers.
4.2.1. Radial deposition conditionsFirst, the electron-transfer rate for condition A is roughly ten
times less than that at an unmodified gold electrode, consistentwith the onset of adlayer formation (v = 0.25). A comparison ofFig. 7A and B shows that electrodes coated for the same immersiontime (3 h), but with unequal thiol concentrations (0.010 and0.10 lM), exhibit differences in the ability to impede electron-transfer. Thus, when v is 2.5 (condition B), k0
app is �30% less than
ed by immersion of gold-coated glass substrates in (A) 1.0 lM and (B) 10.0 lMate, with error bars corresponding to two standard deviations.
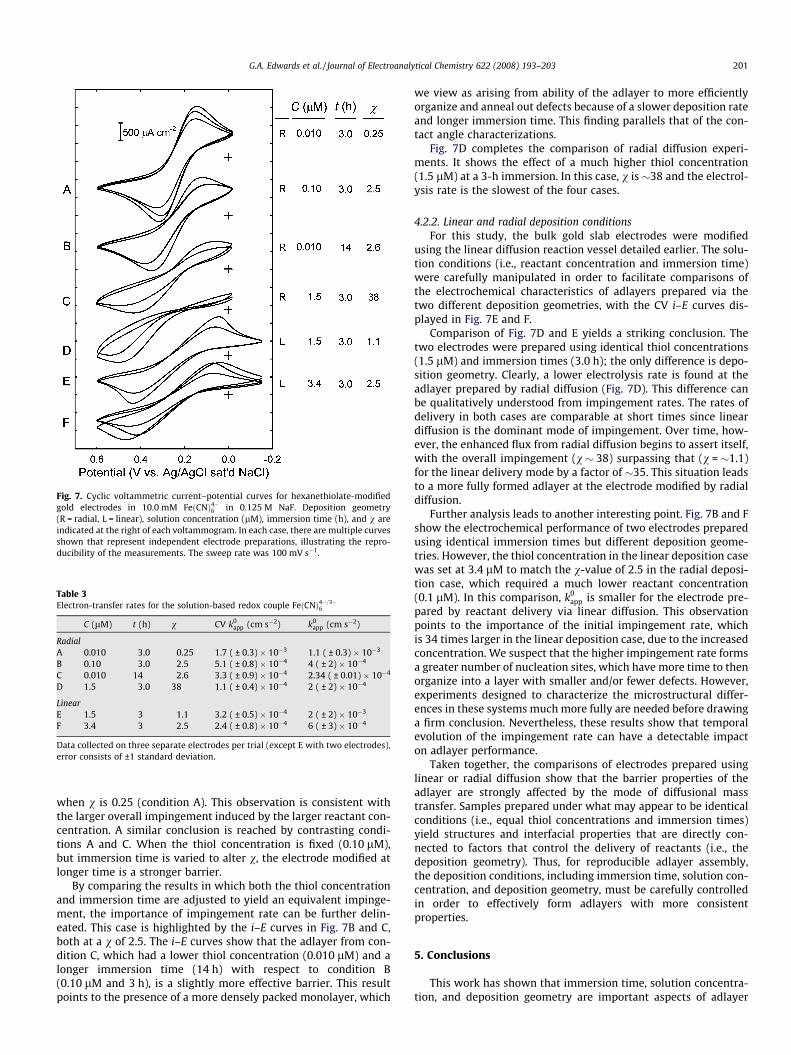
Fig. 7. Cyclic voltammetric current–potential curves for hexanethiolate-modifiedgold electrodes in 10.0 mM FeðCNÞ4�6 in 0.125 M NaF. Deposition geometry(R = radial, L = linear), solution concentration (lM), immersion time (h), and v areindicated at the right of each voltammogram. In each case, there are multiple curvesshown that represent independent electrode preparations, illustrating the repro-ducibility of the measurements. The sweep rate was 100 mV s�1.
Table 3Electron-transfer rates for the solution-based redox couple FeðCNÞ4�=3�
6
C (lM) t (h) v CV k0app (cm s�2) k0
app (cm s�2)
RadialA 0.010 3.0 0.25 1.7 ( ± 0.3) � 10�3 1.1 ( ± 0.3) � 10�3
B 0.10 3.0 2.5 5.1 ( ± 0.8) � 10�4 4 ( ± 2) � 10�4
C 0.010 14 2.6 3.3 ( ± 0.9) � 10�4 2.34 ( ± 0.01) � 10�4
D 1.5 3.0 38 1.1 ( ± 0.4) � 10�4 2 ( ± 2) � 10�4
LinearE 1.5 3 1.1 3.2 ( ± 0.5) � 10�4 2 ( ± 2) � 10�3
F 3.4 3 2.5 2.4 ( ± 0.8) � 10�4 6 ( ± 3) � 10�4
Data collected on three separate electrodes per trial (except E with two electrodes),error consists of ±1 standard deviation.
G.A. Edwards et al. / Journal of Electroanalytical Chemistry 622 (2008) 193–203 201
when v is 0.25 (condition A). This observation is consistent withthe larger overall impingement induced by the larger reactant con-centration. A similar conclusion is reached by contrasting condi-tions A and C. When the thiol concentration is fixed (0.10 lM),but immersion time is varied to alter v, the electrode modified atlonger time is a stronger barrier.
By comparing the results in which both the thiol concentrationand immersion time are adjusted to yield an equivalent impinge-ment, the importance of impingement rate can be further delin-eated. This case is highlighted by the i–E curves in Fig. 7B and C,both at a v of 2.5. The i–E curves show that the adlayer from con-dition C, which had a lower thiol concentration (0.010 lM) and alonger immersion time (14 h) with respect to condition B(0.10 lM and 3 h), is a slightly more effective barrier. This resultpoints to the presence of a more densely packed monolayer, which
we view as arising from ability of the adlayer to more efficientlyorganize and anneal out defects because of a slower deposition rateand longer immersion time. This finding parallels that of the con-tact angle characterizations.
Fig. 7D completes the comparison of radial diffusion experi-ments. It shows the effect of a much higher thiol concentration(1.5 lM) at a 3-h immersion. In this case, v is �38 and the electrol-ysis rate is the slowest of the four cases.
4.2.2. Linear and radial deposition conditionsFor this study, the bulk gold slab electrodes were modified
using the linear diffusion reaction vessel detailed earlier. The solu-tion conditions (i.e., reactant concentration and immersion time)were carefully manipulated in order to facilitate comparisons ofthe electrochemical characteristics of adlayers prepared via thetwo different deposition geometries, with the CV i–E curves dis-played in Fig. 7E and F.
Comparison of Fig. 7D and E yields a striking conclusion. Thetwo electrodes were prepared using identical thiol concentrations(1.5 lM) and immersion times (3.0 h); the only difference is depo-sition geometry. Clearly, a lower electrolysis rate is found at theadlayer prepared by radial diffusion (Fig. 7D). This difference canbe qualitatively understood from impingement rates. The rates ofdelivery in both cases are comparable at short times since lineardiffusion is the dominant mode of impingement. Over time, how-ever, the enhanced flux from radial diffusion begins to assert itself,with the overall impingement (v � 38) surpassing that (v = �1.1)for the linear delivery mode by a factor of �35. This situation leadsto a more fully formed adlayer at the electrode modified by radialdiffusion.
Further analysis leads to another interesting point. Fig. 7B and Fshow the electrochemical performance of two electrodes preparedusing identical immersion times but different deposition geome-tries. However, the thiol concentration in the linear deposition casewas set at 3.4 lM to match the v-value of 2.5 in the radial deposi-tion case, which required a much lower reactant concentration(0.1 lM). In this comparison, k0
app is smaller for the electrode pre-pared by reactant delivery via linear diffusion. This observationpoints to the importance of the initial impingement rate, whichis 34 times larger in the linear deposition case, due to the increasedconcentration. We suspect that the higher impingement rate formsa greater number of nucleation sites, which have more time to thenorganize into a layer with smaller and/or fewer defects. However,experiments designed to characterize the microstructural differ-ences in these systems much more fully are needed before drawinga firm conclusion. Nevertheless, these results show that temporalevolution of the impingement rate can have a detectable impacton adlayer performance.
Taken together, the comparisons of electrodes prepared usinglinear or radial diffusion show that the barrier properties of theadlayer are strongly affected by the mode of diffusional masstransfer. Samples prepared under what may appear to be identicalconditions (i.e., equal thiol concentrations and immersion times)yield structures and interfacial properties that are directly con-nected to factors that control the delivery of reactants (i.e., thedeposition geometry). Thus, for reproducible adlayer assembly,the deposition conditions, including immersion time, solution con-centration, and deposition geometry, must be carefully controlledin order to effectively form adlayers with more consistentproperties.
5. Conclusions
This work has shown that immersion time, solution concentra-tion, and deposition geometry are important aspects of adlayer
202 G.A. Edwards et al. / Journal of Electroanalytical Chemistry 622 (2008) 193–203
preparation that must be carefully controlled to create modifiedsurfaces exhibiting a reproducible structure and function. The re-sults indicate that the structure and function of monolayers pre-pared by self-assembly depends on the details of mass transfer.For a given deposition geometry, where either linear or radial dif-fusion dominates the delivery of reactant, the thiol concentrationdetermines the impingement rate while the immersion time con-trols the total impingement number. However, the evolution ofthese parameters is markedly different in the two depositiongeometries considered. That is, the initial, intermediate, and over-all impingement rates are quite different for the two geometries,leading to differences in adlayer structure and function even whencare is taken to maintain other variables constant. Thus, the diffi-culties in obtaining reproducible adlayer properties for films pre-pared under ostensibly identical conditions, as discussed by Maand Lennox [40], can be explained at least in part by the workherein, which demonstrates that the structure and properties ofself-assembled monolayers are sensitive to deposition geometry,solution concentration, and immersion time. Moreover, we haveshown that reproducible function can be obtained, as assessedusing heterogeneous electron-transfer kinetics, by carefully con-sidering and controlling these variables. Our models may also haveapplicability to other deposition systems, like metal plating. Thesepossibilities, along with investigations of the role of substratemicrostructure, are currently being investigated.
Acknowledgements
This work was supported, in part, by Eastman Chemical and theAmes Laboratory-US DOE. G.A.E. gratefully acknowledges a Cono-co-Phillips graduate research fellowship. A.J.B. gratefully acknowl-edges a Proctor and Gamble fellowship. The Ames Laboratory isoperated by Iowa State University for the U.S. Department of En-ergy under Contract W-7405-ENG-82.
References
[1] R.W. Murray, in: A.J. Bard (Ed.), Electroanalytical Chemistry, vol. 1, MarcelDekker, Inc., New York, 1984, p. 191.
[2] Molecular design of electrodes surfaces, R.W. Murray (Ed.), Techniques ofChemistry, vol. XXII, John Wiley & Sons, Inc., New York, 1992.
[3] C.-J. Zhong, M.D. Porter, Anal. Chem. 67 (1995) 709A.[4] A. Ulman, An Introduction to Ultrathin Organic Films from Langmuir-Blodgett
to Self-Assembly, Academic Press, San Diego, CA, 1991.[5] H.O. Finklea, in: R.A. Meyers (Ed.), Electroanalytical Chemistry, vol. 11, John
Wiley & Sons, Ltd., Chichester, 2000, p. 10090.[6] A. Ulman, Chem. Rev. 96 (1996) 1533.[7] J.C. Love, L.A. Estroff, J.K. Kriebel, R.G. Nuzzo, G.M. Whitesides, Chem. Rev. 105
(2005) 1103.[8] M.D. Porter, T.B. Bright, D.L. Allara, C.E.D. Chidsey, J. Am. Chem. Soc. 109
(1987) 3559.[9] C.A. Widrig, C. Chung, M.D. Porter, J. Electroanal. Chem. 310 (1991) 335.
[10] M.M. Walczak, C. Chung, S.M. Stole, C.A. Widrig, M.D. Porter, J. Am. Chem. Soc.113 (1991) 2370.
[11] C.-J. Zhong, R.C. Brush, J. Andregg, M.D. Porter, Langmuir 15 (1999) 518.[12] C.D. Bain, E.B. Troughton, Y.-T. Tao, J. Evall, G.M. Whitesides, R.G. Nuzzo, J. Am.
Chem. Soc. 111 (1989) 321.[13] P.E. Laibinis, M.A. Fox, J.P. Folkers, G.M. Whitesides, Langmuir 7 (1991) 3167.[14] P.E. Laibinis, G.M. Whitesides, D.L. Allara, Y.-T. Tao, A.N. Parikh, R.G. Nuzzo, J.
Am. Chem. Soc. 113 (1991) 7152.[15] D.L. Allara, R.G. Nuzzo, Langmuir 1 (1985) 52.[16] G.E. Poirier, E.D. Pylant, Science 272 (1996) 1145.[17] R.L. McCarley, D.J. Dunaway, R.J. Willicut, Langmuir 9 (1993) 2775.[18] S. Xu, S.J.N. Cruchon-Dupeyrat, J.C. Garno, G.-Y. Liu, G.K. Jennings, T.-H. Yong,
P.E. Laibinis, J. Chem. Phys. 108 (1998) 5002.[19] H. Aoki, Y. Umezawa, Analyst 128 (2003) 681.[20] D. Mandler, I. Turyan, Electroanalysis 8 (1996) 207.[21] I. Turyan, D. Mandler, Anal. Chem. 69 (1997) 894.[22] I. Turyan, D. Mandler, Anal. Chem. 66 (1994) 58.[23] P.T. Radford, M. French, S.E. Creager, Anal. Chem. 71 (1999) 5101.[24] F. Forouzan, A.J. Bard, M.V. Mirkin, Israel J. Chem. 37 (1997) 155.[25] J.F. Smalley, S.W. Feldberg, C.E.D. Chidsey, M.R. Linford, M.D. Newton, Y.-P.
Liu, J. Phys. Chem. 99 (1995) 13141.[26] J.J. Sumner, K.S. Weber, L.A. Hockett, S.E. Creager, J. Phys. Chem. B 104 (2000)
7449.
[27] B. Liu, A.J. Bard, M.V. Mirkin, S.E. Creager, J. Am. Chem. Soc. 126 (2004) 1485.[28] S.E. Creager, P.T. Radford, J. Electroanal. Chem. 500 (2001) 21.[29] L.V. Protsailo, W.R. Fawcett, Electrochim. Acta 45 (2000) 3497.[30] D.A. Brevnov, H.O. Finklea, H.V. Ryswyk, J. Electroanal. Chem. 500 (2001) 100.[31] A.M. Becka, C.J. Miller, J. Phys. Chem. 96 (1992) 2657.[32] A.M. Becka, C.J. Miller, J. Phys. Chem. 97 (1993) 6233.[33] C. Miller, P. Cuendet, M. Grätzel, J. Phys. Chem. 95 (1991) 877.[34] C. Miller, M. Grätzel, J. Phys. Chem. 95 (1991) 5225.[35] K.D. Truong, P.A. Rowntree, Prog. Surf. Sci. 50 (1995) 207.[36] K.D. Truong, P.A. Rowntree, J. Phys. Chem. 100 (1996) 19917.[37] M.M. Walczak, C.A. Alves, B.D. Lamp, M.D. Porter, J. Electroanal. Chem. 396
(1995) 103.[38] C.-J. Zhong, J. Zak, M.D. Porter, J. Electroanal. Chem. 421 (1997) 9.[39] S.E. Creager, L.A. Hockett, G.K. Rowe, Langmuir 8 (1992) 854.[40] F. Ma, R.B. Lennox, Langmuir 16 (2000) 6188.[41] O. Chailapakul, R.M. Crooks, Langmuir 11 (1995) 1329.[42] R.H. Dettre, R.E. Johnson, Adv. Chem. Ser. 43 (1964) 136.[43] P. Gupta, K. Loos, A. Korniakov, C. Spagnoli, M.K. Cowman, A. Ulman, Angew.
Chem., Int. Ed. 43 (2004) 520.[44] G.M. Whitesides, P.E. Laibinis, Langmuir 6 (1990) 87.[45] C.D. Bain, G.M. Whitesides, J. Am. Chem. Soc. 111 (1989) 7164.[46] F. Bensebaa, R. Voicu, L. Huron, T.H. Ellis, E. Kruus, Langmuir 13 (1997) 5335.[47] H.A. Biebuyck, C.D. Bain, G.M. Whitesides, Langmuir 10 (1994) 1825.[48] M. Buck, M. Grunze, F. Eisert, J. Fischer, F. Träger, J. Vac. Sci. Technol. A 10
(1992) 926.[49] N. Camillone III, Langmuir 20 (2004) 1199.[50] M. Cohen-Atiya, D. Mandler, J. Electroanal. Chem. 550–551 (2003) 267.[51] O. Dannenberger, M. Buck, M. Grunze, J. Phys. Chem. B 103 (1999) 2202.[52] A. Eberhardt, P. Fenter, P. Eisenberger, Surf. Sci. 397 (1998) L285.[53] M. Godin, P.J. Williams, V. Tabard-Cossa, O. Laroche, L.Y. Beaulieu, R.B.
Lennox, P. Grütter, Langmuir 20 (2004) 7090.[54] G. Hahner, C. Wöll, M. Buck, M. Grunze, Langmuir 9 (1993) 1955.[55] M. Himmelhaus, F. Eisert, M. Buck, M. Grunze, J. Phys. Chem. B 104 (2000)
576.[56] K. Hu, A.J. Bard, Langmuir 14 (1998) 4790.[57] Ch. Jung, O. Dannenberger, Y. Xu, M. Buck, M. Grunze, Langmuir 14 (1998)
1103.[58] L.S. Jung, C.T. Campbell, J. Phys. Chem. B 104 (2000) 11168.[59] L.S. Jung, C.T. Campbell, Phys. Rev. Lett. 84 (2000) 5164.[60] L.S. Jung, C.T. Campbell, T. Chinowsky, M.M.N. Mar, S.S. Yee, Langmuir 14
(1998) 5636.[61] D.S. Karpovich, G.J. Blanchard, Langmuir 10 (1994) 3315.[62] M. Kawasaki, T. Sato, T. Tanaka, K. Takao, Langmuir 16 (2000) 1719.[63] H.J. Kim, S. Kwak, Y.S. Kim, B.I. Seo, E.R. Kim, H. Lee, Thin Sold Films 327–329
(1998) 191.[64] D.J. Lavrich, S.M. Wetterer, S.L. Bernasek, G. Scoles, J. Phys. Chem. B 102
(1998) 3456.[65] R.G. Nuzzo, F.A. Fusco, D.L. Allara, J. Am. Chem. Soc. 109 (1987) 2358.[66] W. Pan, C.J. Durning, N.J. Turro, Langmuir 12 (1996) 4469.[67] K.A. Peterlinz, R. Georgiadis, Langmuir 12 (1996) 4731.[68] D. Qu, M. Morin, J. Electroanal. Chem. 524–525 (2002) 77.[69] N. Sandhyarani, T. Pradeep, Int. Rev. Phys. Chem. 22 (2003) 221.[70] H.M. Schessler, D.S. Karpovich, G.J. Blanchard, J. Am. Chem. Soc. 118 (1996)
9645.[71] F. Schreiber, J. Phys.: Condens. Mat. 16 (2004) R881.[72] F. Schreiber, A. Eberhardt, T.Y.B. Leung, P. Schwartz, S.M. Wetterer, D.J.
Lavrich, L. Berman, P. Fenter, P. Eisenberger, G. Scoles, Phys. Rev. B 57 (1998)12476.
[73] D.K. Schwartz, Ann. Rev. Phys. Chem. 52 (2001) 107.[74] P. Schwartz, F. Schreiber, P. Eisenberger, G. Scoles, Surf. Sci. 423 (1999) 208.[75] R. Subramanian, V. Lakshminarayanan, Electrochim. Acta 45 (2000) 4501.[76] S. Xu, P.E. Laibinis, G.-Y. Liu, J. Am. Chem. Soc. 120 (1998) 9356.[77] R. Yamada, K. Uosaki, Langmuir 13 (1997) 5218.[78] R. Yamada, K. Uosaki, Langmuir 14 (1998) 855.[79] C.S.-C. Yang, L.J. Richter, J.C. Stephenson, K.A. Briggman, Langmuir 18 (2002)
7549.[80] R.L. Sobocinski, J.E. Pemberton, Langmuir 8 (1992) 2049.[81] R.J. White, H.S. White, Anal. Chem. 77 (2005) 214A.[82] C.-J. Zhong, N.T. Woods, G.B. Dawson, M.D. Porter, Electrochem. Commun. 1
(1999) 17.[83] E. AlShamaileh, J. Phys. Sci. 1 (2007) 1.[84] J.-B.D. Green, M.T. McDermott, M.D. Porter, L.M. Siperko, J. Phys. Chem. 99
(1995) 10960.[85] S. Chandrasekhar, Rev. Mod. Phys. 15 (1943) 1.[86] A.J. Bard, L.R. Faulkner, Electrochemical Methods: Fundamentals and
Applications, John Wiley & Sons, Inc., New York, 2001.[87] J.-B.D. Green, in: Chemistry, Ph.D., Iowa State University, Ames, IA, 1996, p.
141.[88] D. Dickertmann, J.W. Schultze, K.J. Vetter, J. Electroanal. Chem. 55 (1974) 429.[89] E. Bishop, P.H. Hitchcock, Analyst 98 (1973) 475.[90] R.F. Carvalhal, R.S. Freire, L.T. Kubota, Electroanalysis 17 (2005) 1251.[91] L.-H. Guo, J.S. Facci, G. McLendon, R. Mosher, Langmuir 10 (1994) 4588.[92] M.-Y. Tsai, J.-C. Lin, J. Colloid Interf. Sci. 238 (2001) 259.[93] Z. Yang, A. Gonzalez-Cortes, G. Jourquin, J.-C. Vire, J.-M. Kauffmann, J.-L.
Delplancke, Biosens. Bioelectron. 10 (1995) 789.[94] R.S. Nicholson, Anal. Chem. 37 (1965) 1351.

G.A. Edwards et al. / Journal of Electroanalytical Chemistry 622 (2008) 193–203 203
[95] E. Boubour, R.B. Lennox, Langmuir 16 (2000) 4222.[96] P. Diao, D. Jiang, X. Cui, D. Gu, R. Tong, B. Zhong, J. Electroanal. Chem. 464
(1999) 61.[97] R.G. Snyder, H.L. Strauss, C.A. Elliger, J. Phys. Chem. 86 (1982) 5145.[98] K. Kolasinski, Surface Science: Foundations of Catalysis and Nanoscience, John
Wiley & Sons Ltd., New York, 2001.[99] S.R. Holmes-Farley, R.H. Reamey, T.J. McCarthy, J. Deutch, G.M. Whitesides,
Langmuir 1 (1985) 725.
[100] E.G. Shafrin, W.A. Zisman, J. Phys. Chem. 66 (1962) 740.[101] C.D. Bain, G.M. Whitesides, J. Am. Chem. Soc. 110 (1988) 5897.[102] A.J. Bergren, M.D. Porter, J. Electroanal. Chem. 585 (2005) 172.[103] A.J. Bergren, M.D. Porter, J. Electroanal. Chem. 591 (2006) 189.[104] A.J. Bergren, M.D. Porter, J. Electroanal. Chem. 599 (2007) 12.[105] M.J. Hostetler, W.L. Manner, G.S. Girolami, R.G. Nuzzo, J. Phys. Chem. 99
(1995) 15269.


![Self-assembled monolayers of parent and derivatized [n]staffane-3,3(n-1)-dithiols on polycrystalline gold electrodes](https://static.fdokumen.com/doc/165x107/6328c589ce2aaeab5c0256a0/self-assembled-monolayers-of-parent-and-derivatized-nstaffane-33n-1-dithiols.jpg)