
Use of ground penetrating radar to map subsurface archaeological features in an urban area
Upload
independentCategory
view
2download
0
Grandjean et al., submitted to J. African Earth Sci. on Remote Sensing App. In Geol
1
Grandjean G., Paillou Ph., Baghdadi N., Heggy E., August T. , and Lasne Y., 2006. Surface and subsurface structural mapping using low frequency radar. A synthesis of the Mauritania and Egyptian experiments. Journal of African Earth Sciences (JAES), vol. 44, pp. 220-228.
Surface and subsurface structures mapping using low frequency radar. A synthesis of the
Mauritanian and Egyptian experiments
1G. Grandjean,
2Ph. Paillou,
1N.Baghdadi,
3E.Heggy,
2T.August, et
2Y.Lasne
1BRGM, Orléans, France ([email protected]).
2Observatoire Astronomique de Bordeaux, Floirac, France
3Université du Caire, Egypte.
Abstract
Satellite imagery allows high-precision coverage of broad areas while significantly reducing exploration costs. It provides
valuable information for geological mapping and mineral exploration, since it brings out structures such as lineaments, faults,
lithological contacts, etc. Particularly, the use of radar imagery constitutes a very useful complement to optical images, especially as
Grandjean et al., submitted to J. African Earth Sci. on Remote Sensing App. In Geol
2
regards the surface but also the subsurface structures detection. Actually, in desert areas, radar waves penetrate the dry surface
sand layer and highlight concealed geological structures or fossil river systems. We present here a synthesis of two experiments
designed to compare the contribution of radar and optical images to geological exploration. Studied sites were in the regions of
Akjoujt in Mauritania and Bir Safsaf in Egypt. In the case of subsurface penetration of the radar wave into the sand layer, the
geological radar or GPR (Ground Penetrating Radar) is a use to confirm the volume-related origin of the backscattering. The
confirmation technique consists in correlating the reflectivity of the GPR section with the backscattering of the radar image. Several
sites were studied in the both regions above-cited. Radar imagery, clearly demonstrates their capacity for high-precision detection
of surface geological structures, whether they are vein-type, lithological, or paleohydrogeological in nature. Their value is evident for
arid environments, where outcrops can be distinguished on the basis of their specific roughness. We also confirmed in that work
that low frequency radar (L-band) can retrieve information about subsurface structures down to a couple of meters deep, where
optical sensors cannot.
Introduction
Exploration for natural resources inevitably involves the mapping of geological structures; the extent of the areas to be
mapped and the optimization of cartographic surveying thus become significant issues. Satellite imagery allows high-precision
coverage of broad areas while significantly reducing exploration costs. It provides valuable information for geological mapping and
mineral exploration, since it brings out structures such as lineaments, faults, lithological contacts, etc., and enables identification of
mineral occurrences through analysis of their spectral signatures. In recent years, numerous optical sensors equipped with imaging
devices for acquiring a variety of spectral and radiometric information have been launched (SPOT, LANDSAT, ASTER, HYPERION,
etc.); this has led to improvements in geological interpretation (Emran et al., 1996; Kettles et al., 2000; Hubbard et al., 2003; Kruse
et al., 2003). Similarly, the contribution of SAR (Synthetic Aperture Radar) imagery has proved to be particularly useful. Radar
sensors provide valuable information on geological structure and lithology, by giving geologists data that characterize the
Grandjean et al., submitted to J. African Earth Sci. on Remote Sensing App. In Geol
3
geomorphological landscape. The use of radar imagery constitutes a very useful complement to optical images, especially as
regards surface but also subsurface structures. In desert areas, radar waves penetrate the dry surface sand layer and highlight
concealed geological structures or fossil river systems (Farr et al., 1986; Schaber et al., 1986; Schaber et al., 1997; Paillou et al.,
2003; Grandjean et al., in press).
The originality of our approach lies in the combination of GPR (Ground-Penetrating Radar) and SAR data providing a
quantitative interpretation of SAR backscattering from GPR reflectivity. GPR is thus used to derive geometrical and dielectric
characteristics of the subsurface structures. This technique was successfully demonstrated over the Assal region in the Republic of
Djibouti (Paillou et al., 2001) and the Pyla sand dune in France (Grandjean et al., 2001), where we accurately quantified the
penetration capabilities of microwaves, particularly L and P-bands.
This work was designed to compare the contribution to geological exploration of radar and optical images at different sites in
the regions of Akjoujt in Mauritania and Bir Safsaf in Egypt. For each site, we first compare the SAR polarimetric L-band images
with optical ones. In some places where microwaves penetration is supposed to occur, we compare SAR backscattering with GPR
reflectivity in order to discern between surface or subsurface backscattering processes. We first analyze the Mauritania experiment,
mainly concerned with surface interactions, and discuss on the contribution of radar techniques to geological mapping. In a second
part, we focus on the Egypt experiment, where microwaves penetration was observed and validated using GPR. These results,
presented as a synthesis of the work realized within the last four years, open the way for the mapping of subsurface heterogeneities
such as lithology variations, moisture, or sedimentary structures.
The Mauritania experiment
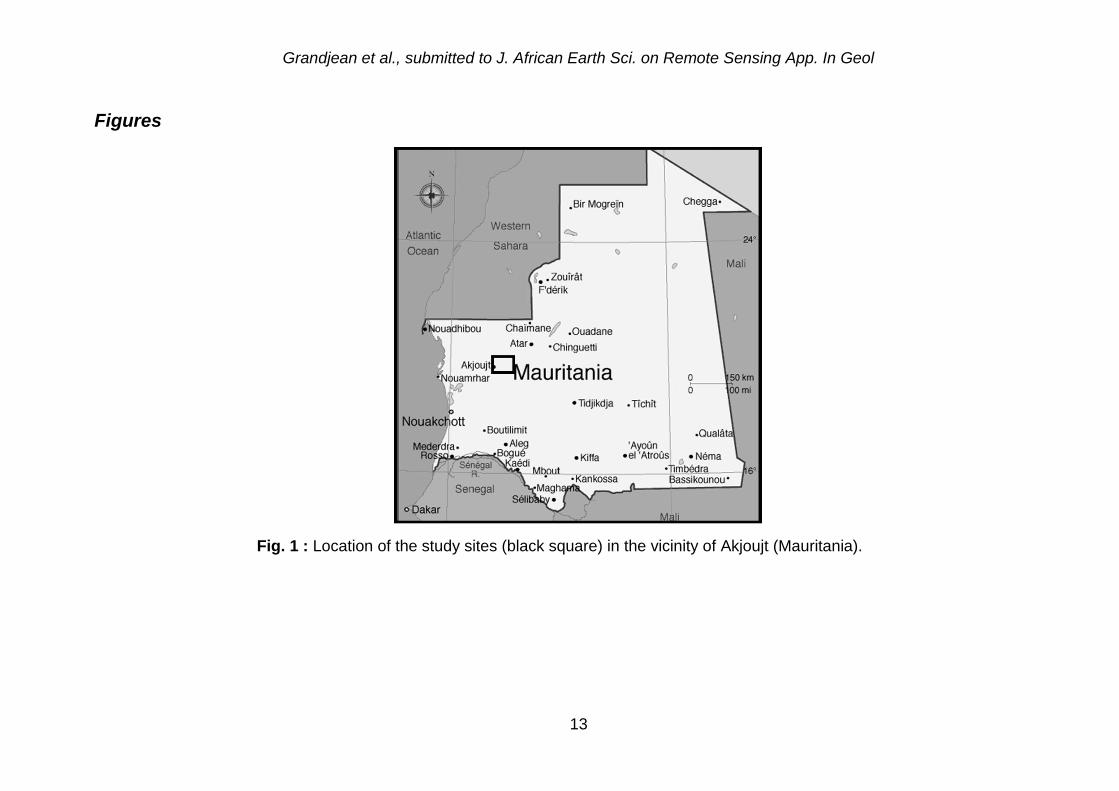
In Mauritania (Fig.1), three representative sites were selected in the southwestern part of the Precambrian Reguibat Shield (an
autochthonous domain) at the boundary with tectonic units of the Mauritanides chain (an allochthonous domain). At the first site,
located at the southern end of the Amsaga area, the Archean basement is composed of migmatitic gneiss and granite belonging to
Grandjean et al., submitted to J. African Earth Sci. on Remote Sensing App. In Geol
4
the Rag el Abiod migmatitic complex (Barrère, 1967). This basement is cut by basic dolerite veins belonging to several cycles of
various ages (Paleoproterozoic, Mesoproterozoic, Neoproterozoic, and Mesozoic). The second site is located in sedimentary
formations made up of Cambrian-Ordovician units, near an ESE-WNW-trending tectonic contact that corresponds to the boundary
between the autochthonous units in the north and the para-autochthonous and allochthonous units in the south. The third site,
located some 20 km west of the second, corresponds to a partially sand-covered wadi environment.
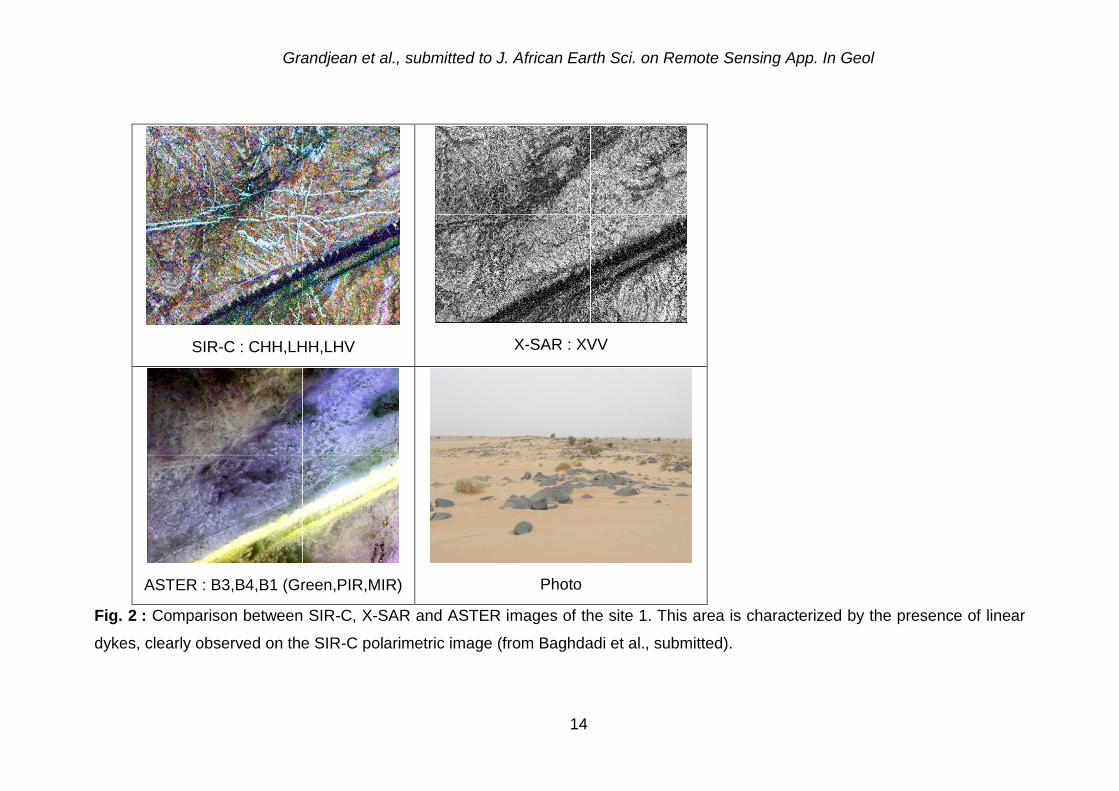
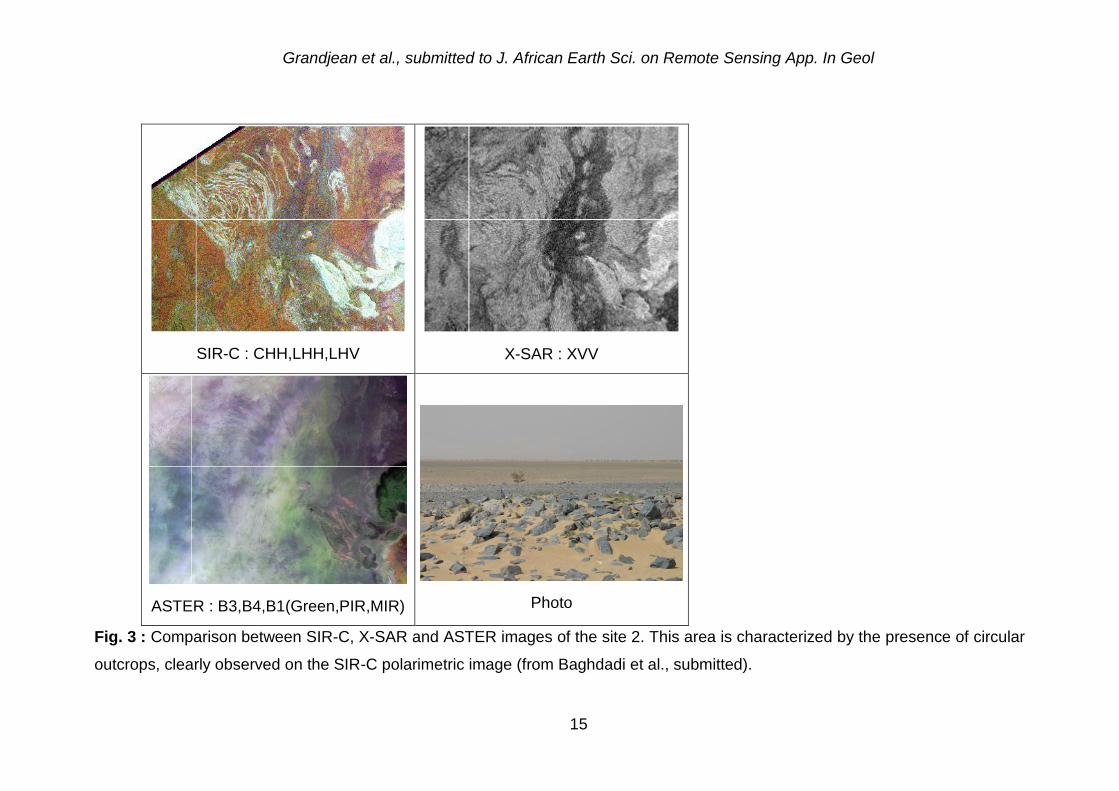
Figures 2, 3, and 4 illustrate the responses of the radar (SIR-C, X-SAR) and optical (ASTER) sensors over the three study
sites. For sites 1 and 2, we note a good mapping of surface structures represented by a significant surface roughness (presence of
pebbles and micro-relief), with the radar signal increasing strongly with surface roughness. The results confirm the fact that the
sensitivity of the radar signal to surface roughness increases with wavelength. For this reason, the results obtained with the SIR-C
sensor are better in the L-band (wavelength about 23 cm) than in the C-band (wavelength about 6 cm). The X-band (wavelength
about 3 cm) of the X-SAR sensor appears unsuitable, owing to its very weak signal dynamics. Although discrimination is better in
HH polarization than in HV polarization, using the C-band, the polarization effect does not seem to be crucial. Optical imagery offers
a low mapping potential when compared with L- or C-band radar images. In fact, the linear dykes are not detected by the optical
images. Similarly, the circular structures at the second site are hard to interpret on the optical images.
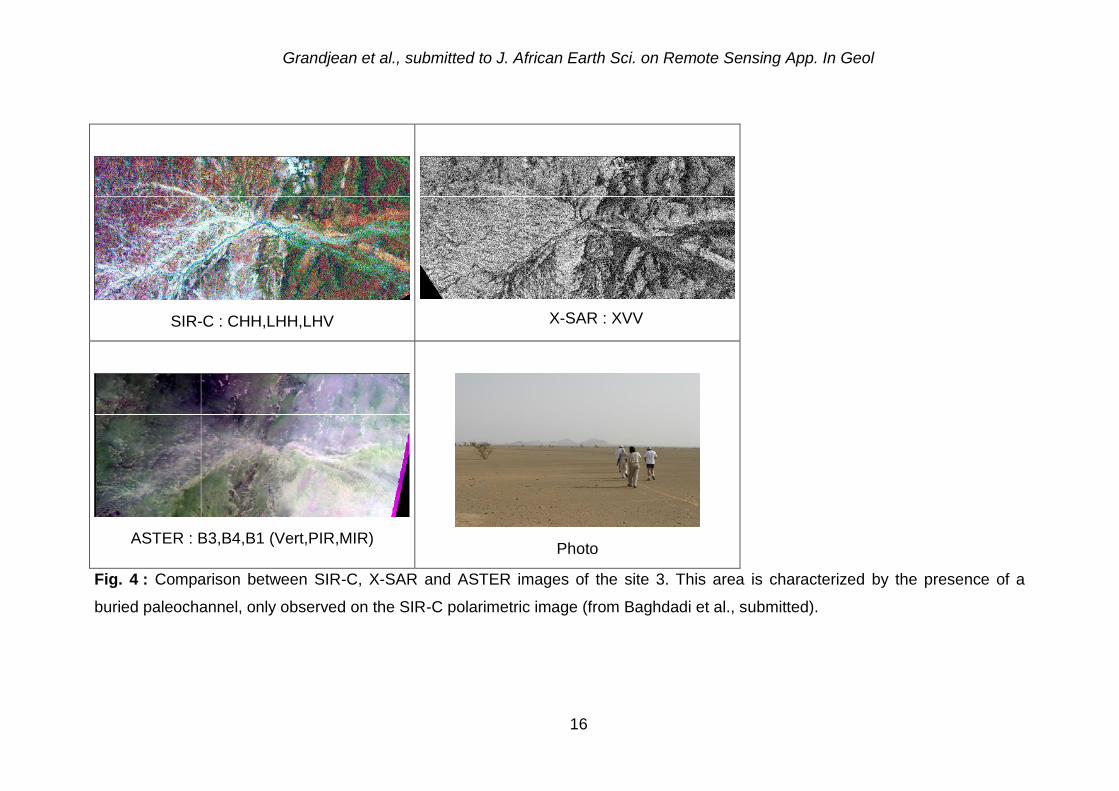
At site 3, we observe a strong backscattering from the river bed. This strong response could be due neither to surface
roughness nor to the presence of moisture, but the surface is very smooth, and covered with fine sand. This response is probably
due to a volume scattering caused by subsurface penetration of the radar wave (into the sand layer). To confirm the volume-related
origin of the backscattering, GPR is used for sounding the subsurface because it enables the local detection and mapping of
structures concealed by the sand. The confirmation technique consists in correlating the reflectivity of the GPR section with the
backscattering of the radar image. Since their level of correlation is satisfactory, we thereby conclude that the origin of the
backscattering lies within the first 50 cm, as indicated by the GPR. This information was also confirmed in the field by examining the
types of deposit present. Beneath the layer of eolian sand, a few centimeters thick, the deposits are clayey and contain grains of
Grandjean et al., submitted to J. African Earth Sci. on Remote Sensing App. In Geol
5
millimeter size. At the place where the greatest backscattering was observed, the grains reach centimeter size. Therefore, this layer
must indeed be responsible for the observed signal. We will develop a more quantitative comparison between SAR and GPR
signals in the next section, purely dedicated to the study of subsurface effects on radar images.
The Egypt experiment
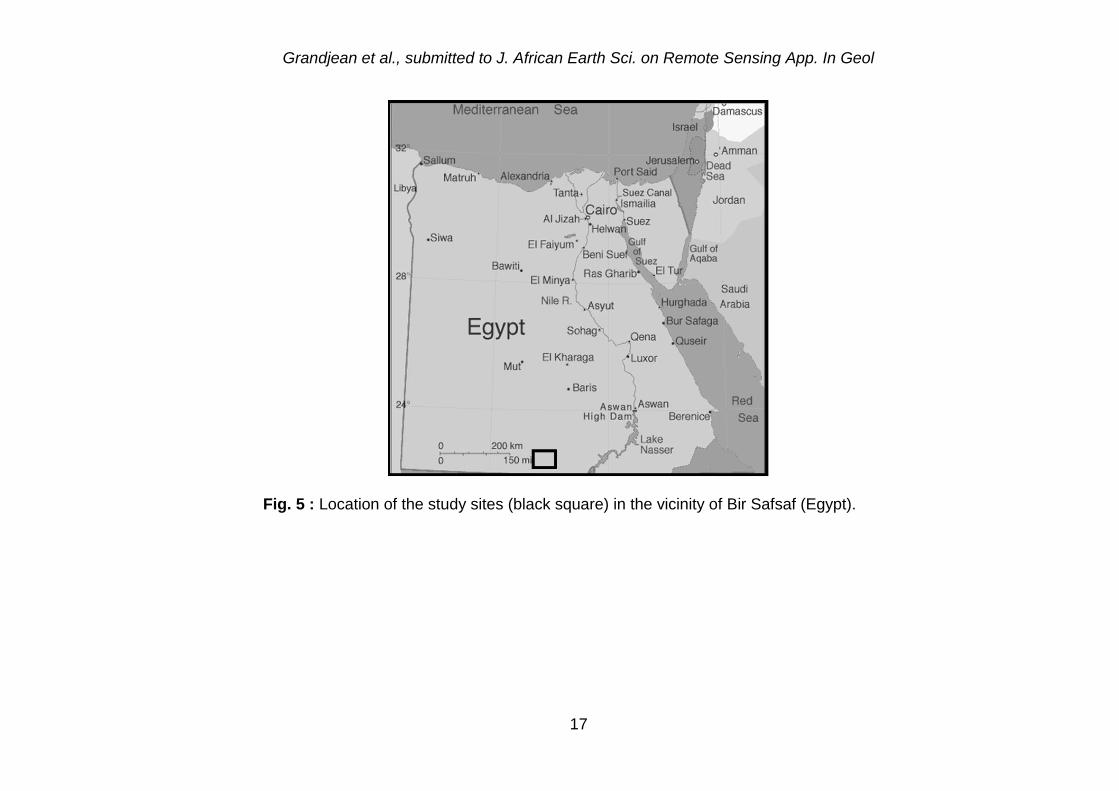
The Bir Safsaf region is located in the southern Egyptian desert, known as the Dard el-Arba’in Desert (Fig.5). Middle to late
Mesozoic, continental to shallow-marine sediments are covered by active aeolian deposits and quaternary soils referred to as the
Selima Sand Sheet (Issawi, 1972; Maxwell et al., 2001). It is part of the “Uweinat Uplift” which extends from Gebel Uweinat in the
West to Bir Safsaf in the East, underlying an area of about 40,000 km² in which crystalline rocks are exposed (Schandelmeier et al.,
1983). It separates the deep intra-cratonic Dakhla basin from the more shallow basins of Northern Sudan. The northern part of the
Bir Safsaf formation consists of magmatic rocks of mainly granitic composition, with complex intrusive relationships (hornblende-
bearing gneisses, porphyritic granite, abundant dykes). The southern part is mainly composed of red and subordinate grey colored,
medium to coarse grained gneisses and migmatites, and the composition of rocks is mainly granitic. Bir Safsaf outcrops generally
rise a couple of meter above the surrounding plains, and are sometimes hard to observe on Landsat scenes. The typical landscape
is a flat plain, floored by quartzitic sandstones, interbedded shales, and conglomerates of the “Nubia Sandstone” of late Cretaceous
age with outcrops of granite and granitic gneiss of the African Shield of Precambrian age (Schaber et al., 1986). The superficial
sand sheet of the sediment cover is a centimeter to a meter thick eolian deposit covered by a thin lag of quartz granules or small
pebbles. It overlies the granitic bedrock and alluvium containing medium to coarse sand, and calcified pebble gravel (Maxwell et al.,
2001). Structural trends in the Bir Safsaf region are mainly constituted of East-West normal faults.
Bir Safsaf is one of the desert site where sand-buried paleodrainage channels of middle Tertiary to Quaternary age were
discovered using L-band radar images from the SIR-A mission (McCauley et al., 1982; McCauley et al., 1986). Schaber et al. (1986,
1997) have shown from field investigations that the dry sand sheet that covers the Bir Safsaf region can be penetrated by L-band
Grandjean et al., submitted to J. African Earth Sci. on Remote Sensing App. In Geol
6
frequencies down to one meter. This was also confirmed by laboratory measurements of radar transmission through sand (Williams
and Greeley, 2001). They have shown that widespread alluvial deposits represent the last stage of filling of a former, regionally
extensive, river-valley network that by Quaternary time was reduced to isolated depressions of very low relief. According to
McCauley (1986), field research along the late Quaternary river networks strongly suggests that human occupation sites were
controlled by the patterns of fluvial environments along ephemeral run-off channels. One of the main paleodrainage systems
discovered on SIR-A images, and later confirmed on SIR-B and SIR-C scenes, lies south of Bir Safsaf near Wadi Safsaf. It presents
a complex of channels, each less than 1 km wide, inset into the broader alluvial valley. Large quantities of authigenic calcium
carbonate has formed in surface alluvium during the climatic fluctuations of the late Quaternary, probably generated through
groundwater deposition and mineralization, rhizoliths around plant roots, and calcic soil formation. McCauley and Schaber (1986)
observed various morphologic types for the calcium carbonate found in alluvium, among which irregulary-shaped nodules
(containing more than 70% CaCO3) and vermicular rhizoliths play a key role in backscattered radar signal.
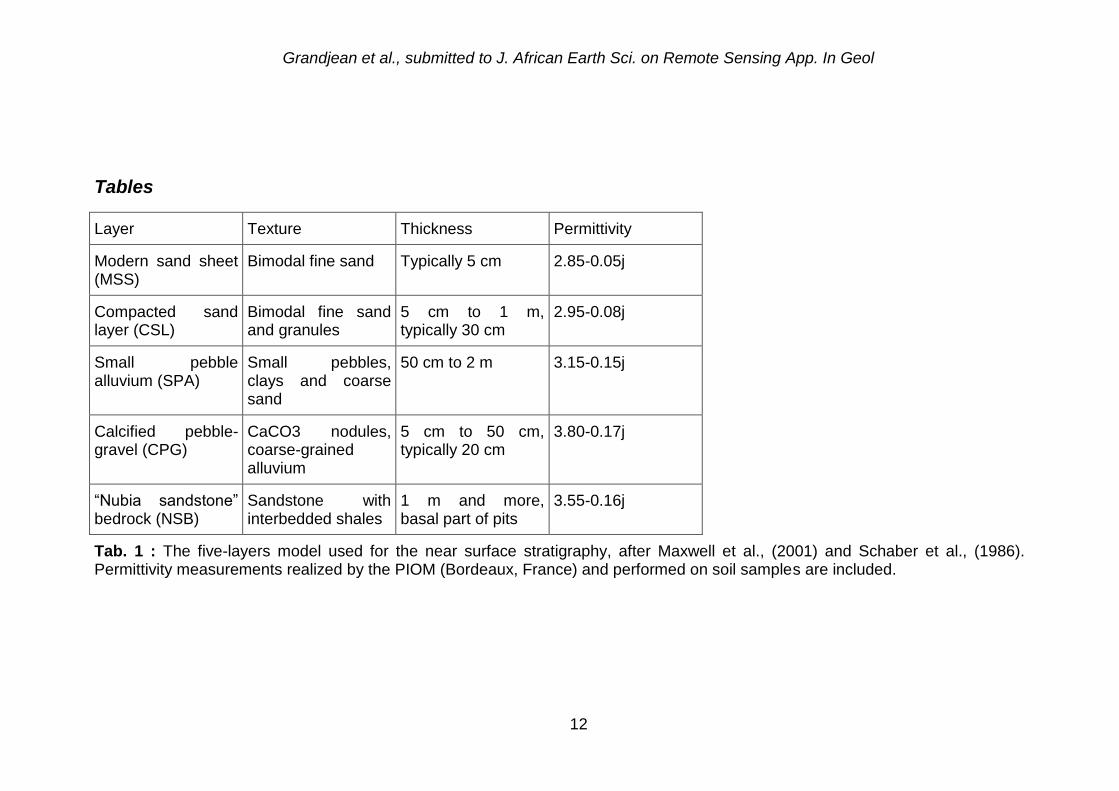
For our further analysis of both SAR and GPR data, we shall consider a simplified model of the near surface stratigraphy that
is consistent with the backscattered radar signal and the regional geology. The five-layers model used is presented in Table 1, the
radar interface (i.e. the place where most of the incident signal is backscattered) being located at the interface between the
compacted sand layer – CSL – and the calcified pebble-gravel – CPG. As it was described by Schaber et al. (1986, 1997), the
incident radar wave penetrates the first modern sand sheet – MSS – and compacted sand layers, and is reflected and diffused by
the rougher CPG layer that generally covers the “Nubia sandstone” bedrock – NSB. Observed paleodrainage channels are
generally filled with small pebble alluvium – SPA, sometimes containing CPG and sandstone gravels. This simple model for the
near surface is also consistent with recent studies by Maxwell et al. (2001), concluding that the actual landscape is a combination of
an initial fluvial landscape inherited from Tertiary erosion, and climatic cycling during the Quaternary that formed the low relief
aeolian surface. As the first sand layers are rather transparent for the radar, sand deposits that could produce surface changes
have a low effect on the backscattered signal. The main part is the backscattered radar signal being due to a buried interface, it
Grandjean et al., submitted to J. African Earth Sci. on Remote Sensing App. In Geol
7
should be very stable with time, also leading to very high coherence values in interferometric SAR data as will be shown in the
following.
We used SIR-C data acquired during the Space Radar Laboratory mission 1 in April 1994. These data have been calibrated by
JPL for radar backscatter coefficient 0, and are full polarimetric (i.e. HH, HV, VH, and VV polarizations are available). We extracted
parts of 114.4 data take, acquired on April 16, 1994, for both C and L bands. The incidence angle was around 45 degrees with a
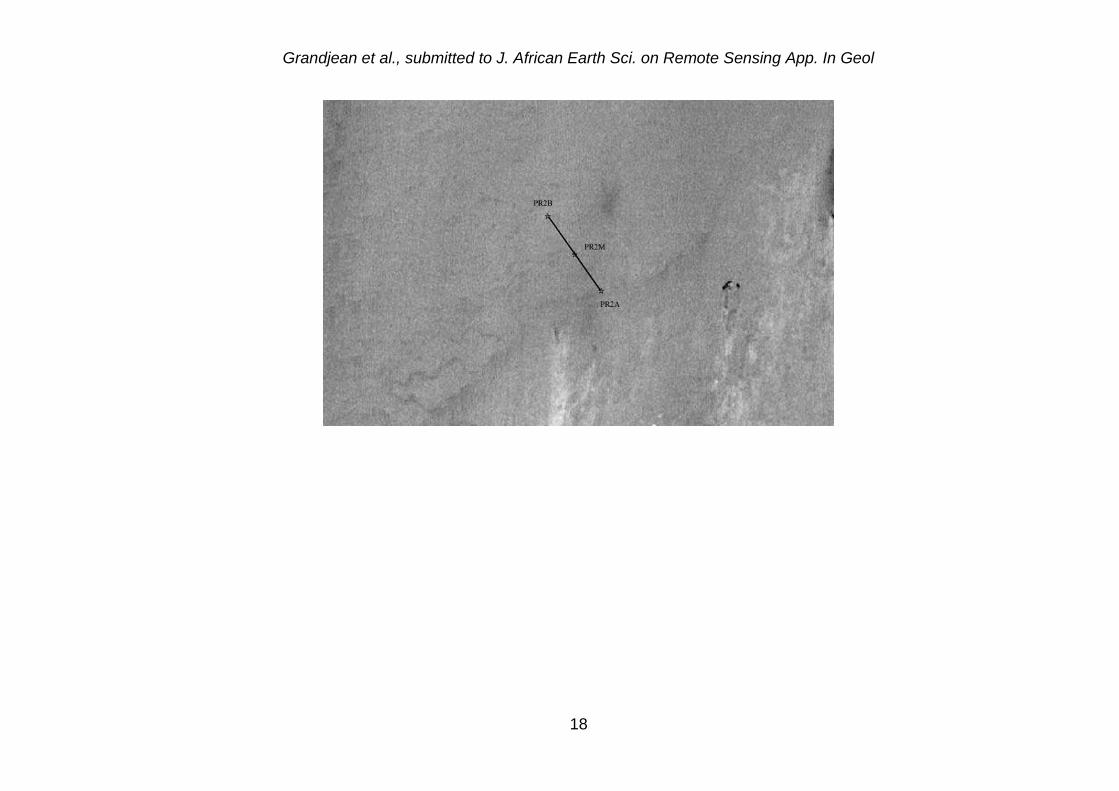
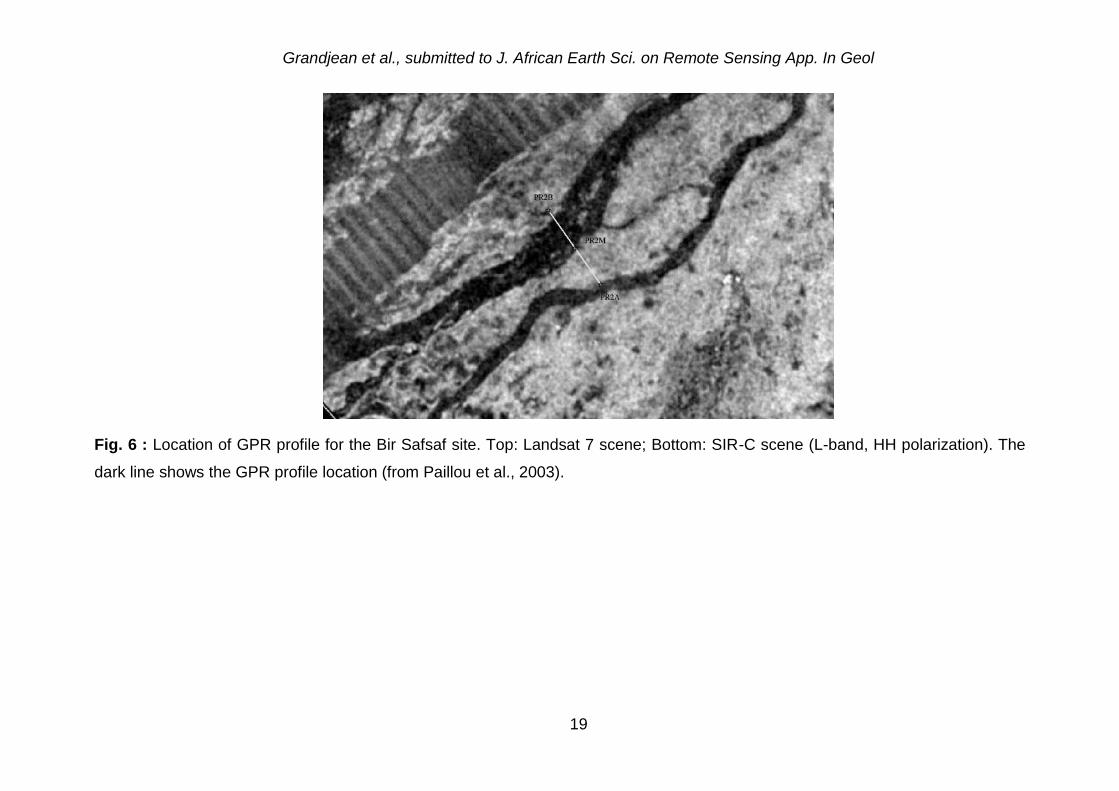
pixel size of 12.5 meters. Figure 6 shows the LANDSAT 7 scene and the corresponding SIR-C image (L-band; HH) related to the
Bir Safsaf site. The comparison of these two images clearly shows the interest of radar data compared to optical ones. To relate the
contrasted values of the backscattering signal to a surface – roughness effects – or subsurface – penetration effects – origin, we
used the GPR to sound the soil down to few meters deep along a profile crossing the southern anomaly (dark area).
The profile was recorded at both 500 MHz and 900 MHz frequencies using two different antennas in monostatic mode, i.e. the
transmitter and the receiver antennas located at the same place. While the antennas are pulled along the profile, a radar impulsion
is emitted by the transmitter, which determines the central frequency and the bandwidth of the signal. The wave propagates into the
ground and is recorded at the receiver, after it has been reflected and diffracted by the soil dielectric contrasts. For a given
antennas position, a GPR recording, i.e. a scan, represents the time variations of the electric field reflected from the ground. In
order to compare the backscattered power 0 derived from SIR-C data to GPR profiles, we need to compute a new quantity
representing, for each position, the total power at the receiver antenna. This quantity is computed by integrating in time the absolute
value of the electric field reflected from the ground. To take into account the pixel size of SIR-C images (12.5m), profiles were
averaged along the profile over a distance window of 12 m. We then computed for each averaged scan located at the position (x),
the quantity Pw taken as the integral of the instantaneous amplitude, i.e. the envelope of the electric field (Grandjean et al., in
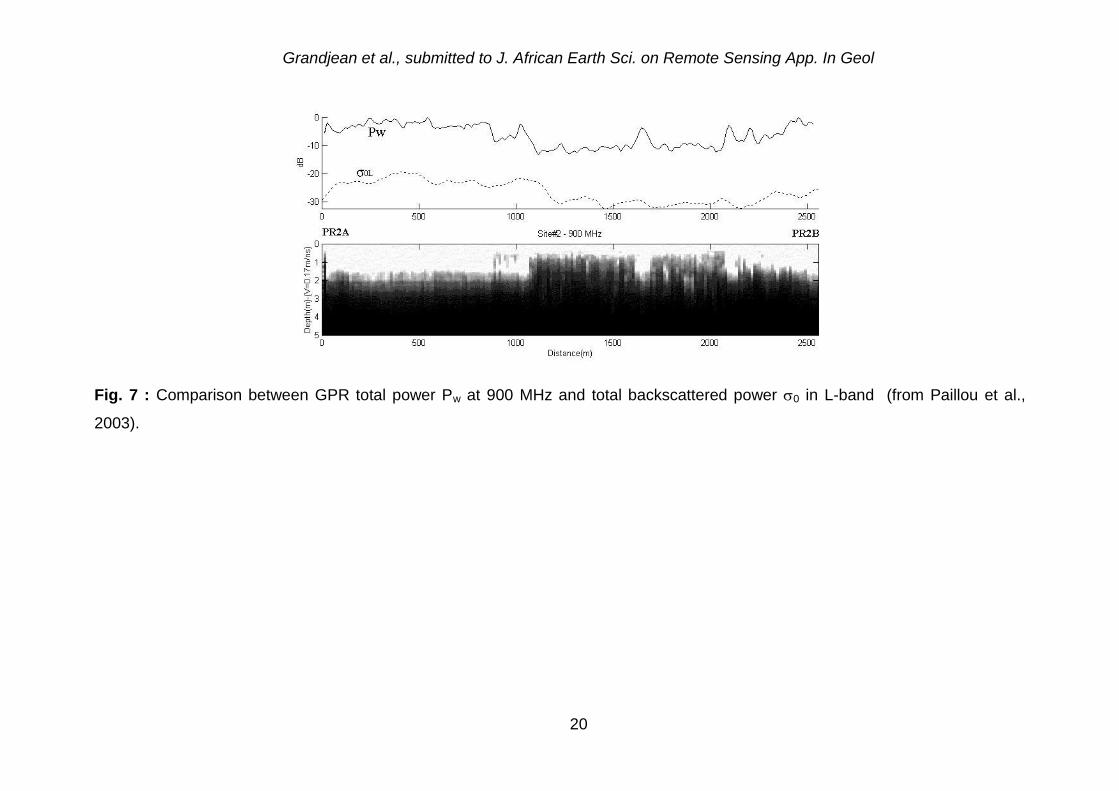
press). Fig.7 presents the comparison between the Pw profile extracted from 900 MHz GPR data, and the 0 one extracted from L-
band SIR-C data. The total power in SAR images mainly contains the diffuse component of the backscattering since we have a
Grandjean et al., submitted to J. African Earth Sci. on Remote Sensing App. In Geol
8
side-looking system, while the total power extracted from GPR data contains both the diffuse and specular components (nadir-
looking system). It can be noticed that the average trend in Pw and 0 profiles look comparable, since it corresponds to the diffuse
backscattered component in both case. The Pw curves show in addition some sharp peaks, that can be attributed to a local specular
response of buried scatterers (rocks contained in sedimentary layers or located at the interface between two layers). The average
20 dB difference between the Pw and 0 curves is due to the fact that GPR data are not calibrated in absolute. This first quantitative
comparison between the backscattered power in GPR and SAR data should allow to estimate SAR profiles from the averaged GPR
total power (and vice versa). This method provides a valuable tool to help the interpretation of SAR images, that cover large areas,
from selected GPR acquisitions in the same field.
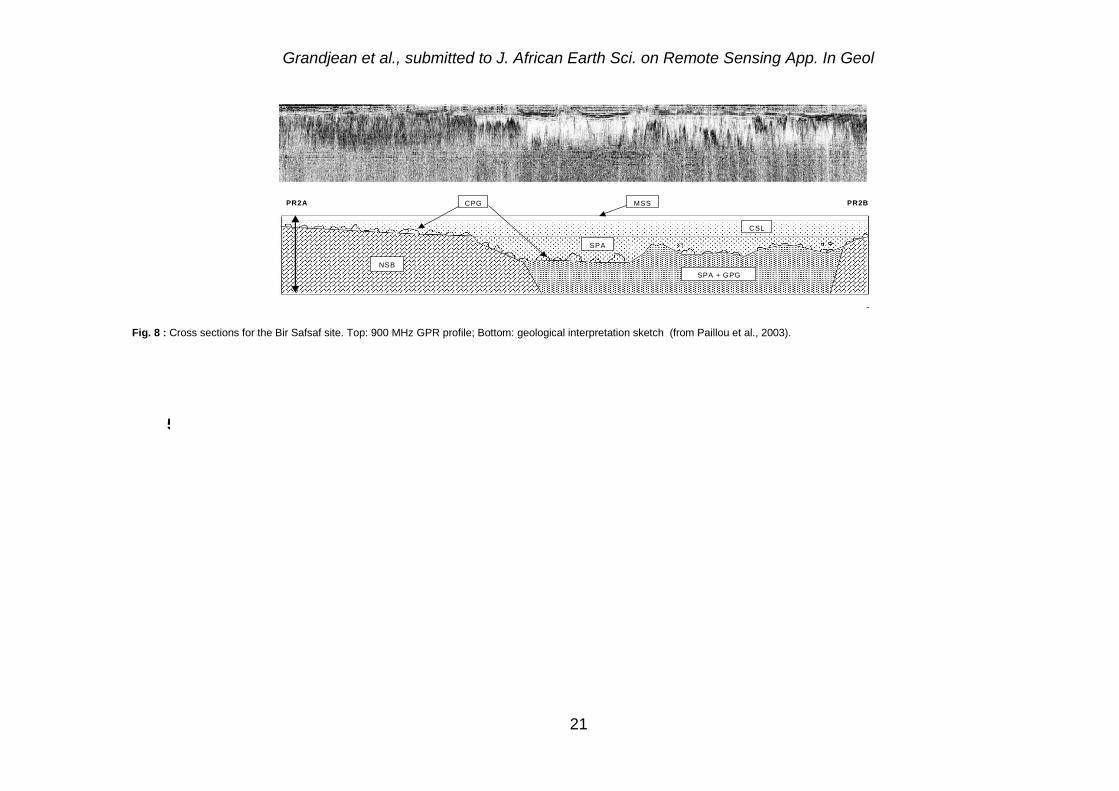
Fig.8 (bottom) presents the geological interpretation resulting from the analysis of the GPR section (top) and SAR data. We
can clearly observe the paleodrainage channel appearing in the northern part. It strongly contrasts with the “bank”, on the southern
part that presents a strong backscattered radar signal due to the rough interface at the top of NSB layer. From correlations between
GPR section and some geological information, this channel is filled with two different sedimentary deposits, with some calcified
pebble-gravel (CPG) at the interface. The upper layer is composed of SPA, absorbing the incident radar wave and presenting a low
radar return, while the lower layer contains alluvium mixed with CPG. The rough interface located between these two layers which
fill the upper paleodrainage channel is responsible for some backscattered power that can be observed in both SAR and GPR data.
Conclusion
These two experiments showed that spatial techniques, and especially radar imagery, have a capacity for high-precision
detection of geological structures, whether they are vein-type, lithological, or paleohydrogeological in nature. Their value is evident
for arid environments, where outcrops can be distinguished on the basis of their specific roughness, and concealed structures on
the basis of the volume and/or subsurface backscattering that they generate. The numerous veins mapped in the Akjoujt region
using SAR images provide an invaluable contribution to the current geological map. In addition, they allow geological structures
Grandjean et al., submitted to J. African Earth Sci. on Remote Sensing App. In Geol
9
seen at specific locations on the ground to be integrated into a comprehensive interpretation. We also confirmed in that work that
low frequency radar (L-band) can retrieve information about subsurface structures down to a couple of meters deep, where other
sensors (optical) cannot. The use of GPR systems allowed us to confirm the presence of buried paleodrainage channels that were
observed more than 10 years ago by McCauley and Schaber. We have shown that the average trend of the total power computed
from GPR data at 900 MHz can be compared to the backscattered power extracted from L-band SAR images, opening the way to
new interpretations of SAR images using GPR acquisitions. The quantitative analysis of both C and L-band SAR and 500 and 900
MHz GPR data allowed us to derive detailed geological descriptions of the subsurface structures, leading to new interpretations of
the local geological context and revealing unknown deep structures. Future work will consists in acquiring airborne L and P-band
SAR images over selected regions in order to benefit from a higher spatial resolution and establish potentials of the P-band (435
MHz), as compared to 500 MHz GPR profiles, to detect deeper subsurface structures down to 5 meters.
Acknowledgments
Authors would like to acknowledge JPL/NASA for providing SIR-C data. They also thank the University of Cairo, the Egyptian
Geological Survey, the Mining Authorities of Mauritania for their support in organizing field expeditions. This work was funded by
BRGM (French geological survey), CNES (French space agency) and PNTS (French national remote sensing program) .
References
N. Baghdadi, D. Lahondère, G. Grandjean, P. Paillou, and Y. Lasne, 2004. Apport de l’imagerie satellitaire radar pour l’exploration
géologique et minière en zones arides. Submitted to Compte Rendu de l’Académie des Sciences.
Grandjean et al., submitted to J. African Earth Sci. on Remote Sensing App. In Geol
10
J. Barrère, 1967. Le groupe précambrien de l’Amsaga entre Atar et Akjoujt (Mauritanie). Etude d’un métamorphisme profond et de
ses relations avec la migmatisation. Mémoires Bureau Recherches Géologiques et Minières, no. 42, 275 p.
A. Emran, M. Hakdaoui, and J. Chorowicz, 1996. Anomalies on geologic maps from multispectral and textural classification : the
Bleida mining district (Morocco). Remote Sensing of Environment, 57, 1, pp.13-21.
T.G. Farr, C. Elachi, P. Hartl, and K. Chowdhury, 1986. Microwave penetration and attenuation in desert soils: a field experiment
with the Shuttle imaging radar. IEEE Transactions on Geoscience and Remote Sensing, 24, 4, pp. 590-594.
G. Grandjean, P. Paillou, P. Dubois, T. August-Bernex, N. Baghdadi, and J. Achache, 2001. Subsurface structures detection by
combining L-band polarimetric SAR and GPR data: Example of the Pyla Dune (France). IEEE Transactions on Geoscience
and Remote Sensing, vol. 39, no. 6, pp. 1245-1258,
G. Grandjean, P. Paillou, and N. Baghdadi, 2004. A volume scattering model for coupled interpretation of Ground-Penetrating
Radar (GPR) and Synthetic Aperture Radar. Journal of Subsurface Sensing Technologies and Applications, in press.
B.E. Hubbard, J.K. Crowley, and D.R. Zimbelman, 2003. Comparative alteration mineral mapping using visible to shortwave infrared
(0.4-2.4 m) Hyperion, ALI, and ASTER imagery. IEEE Transactions on Geoscience and Remote Sensing, 41, 6, pp. 1401-
1410.
B. Issawi, 1972. Review of upper Cretaceous-lower Tertiary stratigraphy in central and southern Egypt. American Association of
Petrolium Geological Bulletin, vol. 56, pp. 1448-1463.
I.M. Kettles, A.N. Rencz, and S.D. Bauke, 2000. Integrating landsat, geologic, and airborne gamma ray data as an aid to surficial
geology mapping and mineral exploration in the Manitouwadge area, Ontario Source. Photogrammetric Engineering and
Remote Sensing, 66, 4, pp. 437-445.
F.A. Kruse, J.W. Boardman, and J.F. Huntington, 2003. Comparison of airborne hyperspectral data and EO-1 Hyperion for mineral
mapping. IEEE Transactions on Geoscience and Remote Sensing, 41, 6, pp. 1388-1400.
Grandjean et al., submitted to J. African Earth Sci. on Remote Sensing App. In Geol
11
J. F. McCauley, G. G. Schaber, C. S. Breed, et al.1982. Subsurface valleys and geoarchaeology of Egypt and Sudan revealed by Radar, Science, vol. 218, pp. 1004-1020.
J. F. McCauley, C. S. Breed, G. G. Schaber, C. V. Haynes, W. P. McHugh, B. Issawi, and A. El Kilani, 1986. Paleodrainages of the
Eastern Sahara – The radar rivers revisited (SIR-A/B implications for a mid-tertiary trans-African drainage system). IEEE
Trans. Geosci. Remote Sensing, vol. GE-24, no. 4, pp. 624-648.
T. A. Maxwell, C. V. Haynes Jr., 2001. Sand sheet dynamics and Quaternary landscape evolution of the Selima Sand Sheet,
southern Egypt,. Quaternary Science Reviews, vol. 20, pp. 1623-1647.
P. Paillou, G. Grandjean, J.-M. Malézieux, G. Ruffié, E. Heggy, D. Piponnier, P. Dubois, and J. Achache, 2001. Performances of
Ground Penetrating Radars in arid volcanic regions: Consequences for Mars subsurface exploration. Geophys. Res. Letters,
vol. 28, no. 5, pp. 911-914,
P. Paillou, G. Grandjean, N. Baghdadi, E. Heggy, T. August-Bernex, and J. Achache, 2003. Subsurface imaging in South-Central
Egypt using low-frequency radar: Bir-Safsaf revisited. IEEE Transactions on Geoscience and Remote Sensing, 41, 7, pp.
1672-1684.
G.G. Schaber, J.F. McCauley, C.S. Breed, and G.R. Olhoeft, 1986. Shuttle imaging radar : physical controls on signal penetration
and subsurface scattering in the eastern Sahara. IEEE Transactions on Geoscience and Remote Sensing, 24, 4, pp. 603-623.
G.G. Schaber, J.F. McCauley, and C.S. Breed, 1997. The use of multifrequency and polarimetric SIR-C/X-SAR data in geologic
studies of Bir-Safsaf, Egypt. IEEE Transactions on Geoscience and Remote Sensing, 59, pp. 337-363.
H. Schandelmeier, A. Richter, and G. Franz, 1983. Outline of the geology of magmatic and metamorphic units between Gebel
Uweinat and Bir Safsaf (SW Egypt / NW Sudan). J. African Earth Science, vol. 1, no. 3-4, pp. 275-283.
K. K. Williams, and R. Greeley, 2001. Radar attenuation by sand: Laboratory measurements of radar transmission. IEEE Trans.
Geosci. Remote Sensing, vol. 39, no. 11, pp. 2521-2526.
Grandjean et al., submitted to J. African Earth Sci. on Remote Sensing App. In Geol
12
Tables
Layer Texture Thickness Permittivity
Modern sand sheet (MSS)
Bimodal fine sand Typically 5 cm 2.85-0.05j
Compacted sand layer (CSL)
Bimodal fine sand and granules
5 cm to 1 m, typically 30 cm
2.95-0.08j
Small pebble alluvium (SPA)
Small pebbles, clays and coarse sand
50 cm to 2 m 3.15-0.15j
Calcified pebble-gravel (CPG)
CaCO3 nodules, coarse-grained alluvium
5 cm to 50 cm, typically 20 cm
3.80-0.17j
“Nubia sandstone” bedrock (NSB)
Sandstone with interbedded shales
1 m and more, basal part of pits
3.55-0.16j
Tab. 1 : The five-layers model used for the near surface stratigraphy, after Maxwell et al., (2001) and Schaber et al., (1986). Permittivity measurements realized by the PIOM (Bordeaux, France) and performed on soil samples are included.
Grandjean et al., submitted to J. African Earth Sci. on Remote Sensing App. In Geol
13
Figures
Fig. 1 : Location of the study sites (black square) in the vicinity of Akjoujt (Mauritania).
Grandjean et al., submitted to J. African Earth Sci. on Remote Sensing App. In Geol
14
SIR-C : CHH,LHH,LHV
X-SAR : XVV
ASTER : B3,B4,B1 (Green,PIR,MIR)
Photo
Fig. 2 : Comparison between SIR-C, X-SAR and ASTER images of the site 1. This area is characterized by the presence of linear
dykes, clearly observed on the SIR-C polarimetric image (from Baghdadi et al., submitted).
Grandjean et al., submitted to J. African Earth Sci. on Remote Sensing App. In Geol
15
SIR-C : CHH,LHH,LHV
X-SAR : XVV
ASTER : B3,B4,B1(Green,PIR,MIR)
Photo
Fig. 3 : Comparison between SIR-C, X-SAR and ASTER images of the site 2. This area is characterized by the presence of circular
outcrops, clearly observed on the SIR-C polarimetric image (from Baghdadi et al., submitted).
Grandjean et al., submitted to J. African Earth Sci. on Remote Sensing App. In Geol
16
SIR-C : CHH,LHH,LHV
X-SAR : XVV
ASTER : B3,B4,B1 (Vert,PIR,MIR)
Photo
Fig. 4 : Comparison between SIR-C, X-SAR and ASTER images of the site 3. This area is characterized by the presence of a
buried paleochannel, only observed on the SIR-C polarimetric image (from Baghdadi et al., submitted).
Grandjean et al., submitted to J. African Earth Sci. on Remote Sensing App. In Geol
17
Fig. 5 : Location of the study sites (black square) in the vicinity of Bir Safsaf (Egypt).
Grandjean et al., submitted to J. African Earth Sci. on Remote Sensing App. In Geol
18
Grandjean et al., submitted to J. African Earth Sci. on Remote Sensing App. In Geol
19
Fig. 6 : Location of GPR profile for the Bir Safsaf site. Top: Landsat 7 scene; Bottom: SIR-C scene (L-band, HH polarization). The
dark line shows the GPR profile location (from Paillou et al., 2003).
Grandjean et al., submitted to J. African Earth Sci. on Remote Sensing App. In Geol
20
Fig. 7 : Comparison between GPR total power Pw at 900 MHz and total backscattered power 0 in L-band (from Paillou et al.,
2003).
Grandjean et al., submitted to J. African Earth Sci. on Remote Sensing App. In Geol
21
MSS
CSL
CPG
SPA
SPA + GPG
NSB
5
m
PR2A PR2B
Fig. 8 : Cross sections for the Bir Safsaf site. Top: 900 MHz GPR profile; Bottom: geological interpretation sketch (from Paillou et al., 2003).
5
m
Copyright © 2022 FDOKUMEN