Use of ground penetrating radar to map subsurface archaeological features in an urban area
9
69 Use of Ground Penetrating Radar to Map Subsurface Moisture Variations in an Urban Area Giovanni Leucci, Sergio Negri, Maria Teresa Carrozzo and Luigia Nuzzo Osservatorio di Fisica e Chimica della Terra e dell'Ambiente (OFCTA), Dipartimento di Scienza dei Materiali— Universita' di Lecce, via per Arnesano, 73100 LECCE, ITALIA, Tel +39-0832-320549, Fax +39-0832-320548, E-mail gianni. leucci @ unile.it ABSTRACT The range of Ground Penetrating Radar (GPR) applications is very wide and diverse. GPR provides high-resolution continuos profiles, and has been used in various fields (environmental prob- lems, geology, geotechnical engineering, archaeology etc.). This paper describes a test application of GPR in an urban area (Mesagne, Apulia, Italy) for the detection of underground water pipes and to obtain a map of the moisture in the ground around them. Some authors have proven that GPR can be used effectively, although only as a reconnaissance tool, for studies of moisture in the subsurface. Electromagnetic wave velocity in the subsurface depends on moisture via the dielectric properties of the wet material. The free volumetric water content can be determined from the dielectric constant of subsurface terrain by an empirical relation proposed by Topp et al. (1980). GPR wave velocity determination can be carried out by means of several methods. In this paper the hyperbolic anomalies caused by small inhomogeneities and underground water pipes have been considered. The velocity analysis per- mitted a qualitative estimation of the volumetric water content near the pipe network and the location of possible leaks. Introduction GPR represents a powerful tool for environmental and hydrogeological studies. The GPR method can detect superficial bodies with a relative efficiency depending on the field context, the dielectric properties of the host ma- terial and the nature and size of the bodies (Davis and Annan, 1989). The scale of resolvable features can range from a few centimeters to ten or more meters, depending on the frequency band of the operating antennas. There- fore a careful selection among the available antennas is needed with regard to the aims of the survey (Annan and Cosway, 1994). Numerous studies describe efficient GPR techniques for detecting and imaging underground pipes, voids, etc. and to determine subsurface moisture (Annan etal, 1990; Du and Rummel, 1994; Mellet, 1995; Grand- jean et al, 2000). However, since each technique is gen- erally considered individually in a specific context, it is difficult to compare the results because of different field conditions. The objective of this work is to verify the capabilities of GPR in an urban area for detecting underground utilities (water pipes) and for evaluating their integrity state {i.e., water losses). The test area is inside the historical centre of Mesagne, near Brindisi (Apulia, Italy). This site is affected by hydrogeological subsidence mainly caused by an old leaking water pipe network and the almost superficial water table. The GPR survey, by means of time slice represen- tation, made it possible to map the water pipe network, while the velocity analysis permitted a qualitative estima- tion of the volumetric water content near the network itself and thus gave an indication of the presence of possible water losses. Outline of the Problem The surveyed site is located in the historical centre of Mesagne near Brindisi (Apulia, Italy) (Fig. 1). According to the geological map (Fig. 2) the uppermost meters of soil are constituted by yellowish clayey sands poorly cemented (Geological Map of Italy, 1970). The water table is located at an average depth of about 4 m from the ground level. The site is generally affected by hydrogeological subsi- dence caused by: 1) the variability of the level of the superficial water table (from about 3 m to about 5 m in depth); 2) the losses of the old water pipes and drainage system; 3) the uncontrolled drawing from numerous wells; 4) the presence of man-made and natural cavities. These are the main causes of the static trouble of some buildings. In fact the geological substrate is consti- tuted by sands of the transgressive Post-Calabrian units, which are mainly melted and affected by degradation pro- JEEG, June 2002, Volume 7, Issue 2, pp. 69-77 Downloaded 08 Nov 2012 to 151.56.228.170. Redistribution subject to EEGS license or copyright; see Terms of Use at http://segdl.org/eegsrc/
Transcript of Use of ground penetrating radar to map subsurface archaeological features in an urban area
69
Use of Ground Penetrating Radar to Map Subsurface Moisture Variations in an Urban Area
Giovanni Leucci, Sergio Negri, Maria Teresa Carrozzo and Luigia Nuzzo Osservatorio di Fisica e Chimica della Terra e dell'Ambiente (OFCTA), Dipartimento di Scienza dei Materiali—
Universita' di Lecce, via per Arnesano, 73100 LECCE, ITALIA, Tel +39-0832-320549, Fax +39-0832-320548, E-mail gianni. leucci @ unile.it
ABSTRACT
The range of Ground Penetrating Radar (GPR) applications is very wide and diverse. GPR provides high-resolution continuos profiles, and has been used in various fields (environmental problems, geology, geotechnical engineering, archaeology etc.).
This paper describes a test application of GPR in an urban area (Mesagne, Apulia, Italy) for the detection of underground water pipes and to obtain a map of the moisture in the ground around them. Some authors have proven that GPR can be used effectively, although only as a reconnaissance tool, for studies of moisture in the subsurface. Electromagnetic wave velocity in the subsurface depends on moisture via the dielectric properties of the wet material. The free volumetric water content can be determined from the dielectric constant of subsurface terrain by an empirical relation proposed by Topp et al. (1980). GPR wave velocity determination can be carried out by means of several methods. In this paper the hyperbolic anomalies caused by small inhomogeneities and underground water pipes have been considered. The velocity analysis permitted a qualitative estimation of the volumetric water content near the pipe network and the location of possible leaks.
Introduction
GPR represents a powerful tool for environmental and hydrogeological studies. The GPR method can detect superficial bodies with a relative efficiency depending on the field context, the dielectric properties of the host material and the nature and size of the bodies (Davis and Annan, 1989). The scale of resolvable features can range from a few centimeters to ten or more meters, depending on the frequency band of the operating antennas. Therefore a careful selection among the available antennas is needed with regard to the aims of the survey (Annan and Cosway, 1994). Numerous studies describe efficient GPR techniques for detecting and imaging underground pipes, voids, etc. and to determine subsurface moisture (Annan etal, 1990; Du and Rummel, 1994; Mellet, 1995; Grand-jean et al, 2000). However, since each technique is generally considered individually in a specific context, it is difficult to compare the results because of different field conditions.
The objective of this work is to verify the capabilities of GPR in an urban area for detecting underground utilities (water pipes) and for evaluating their integrity state {i.e., water losses). The test area is inside the historical centre of Mesagne, near Brindisi (Apulia, Italy). This site is affected by hydrogeological subsidence mainly caused by an old leaking water pipe network and the almost superficial water
table. The GPR survey, by means of time slice representation, made it possible to map the water pipe network, while the velocity analysis permitted a qualitative estimation of the volumetric water content near the network itself and thus gave an indication of the presence of possible water losses.
Outline of the Problem
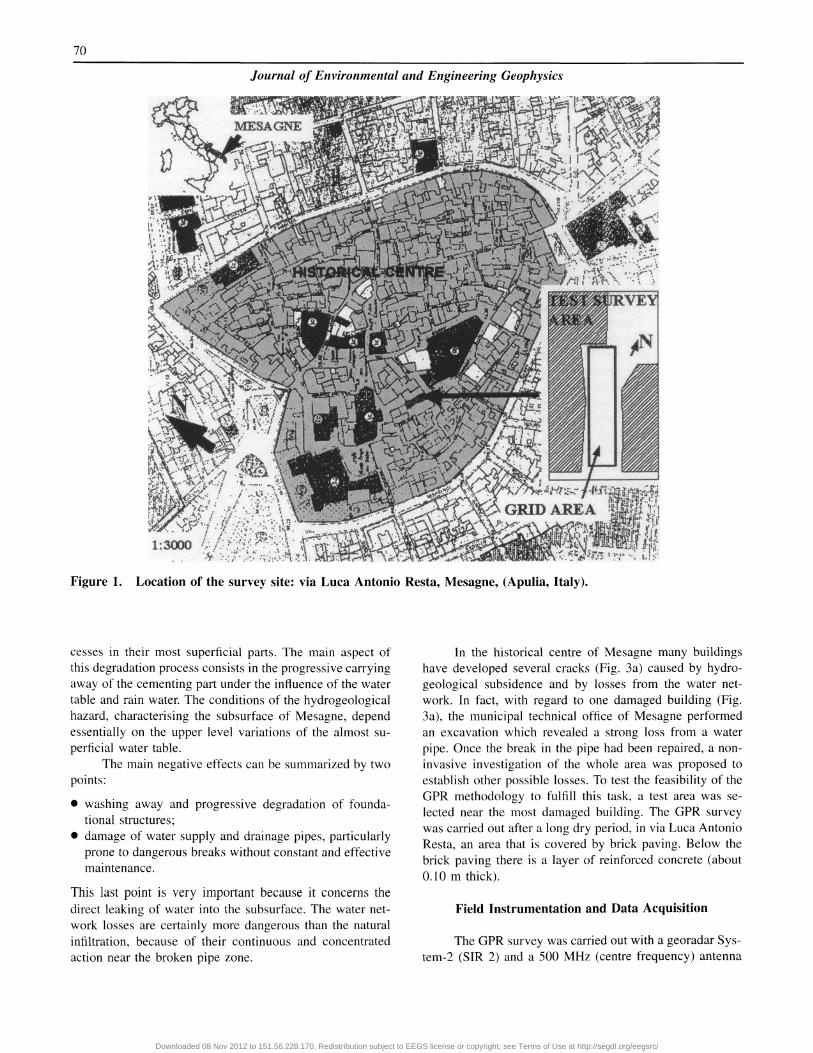
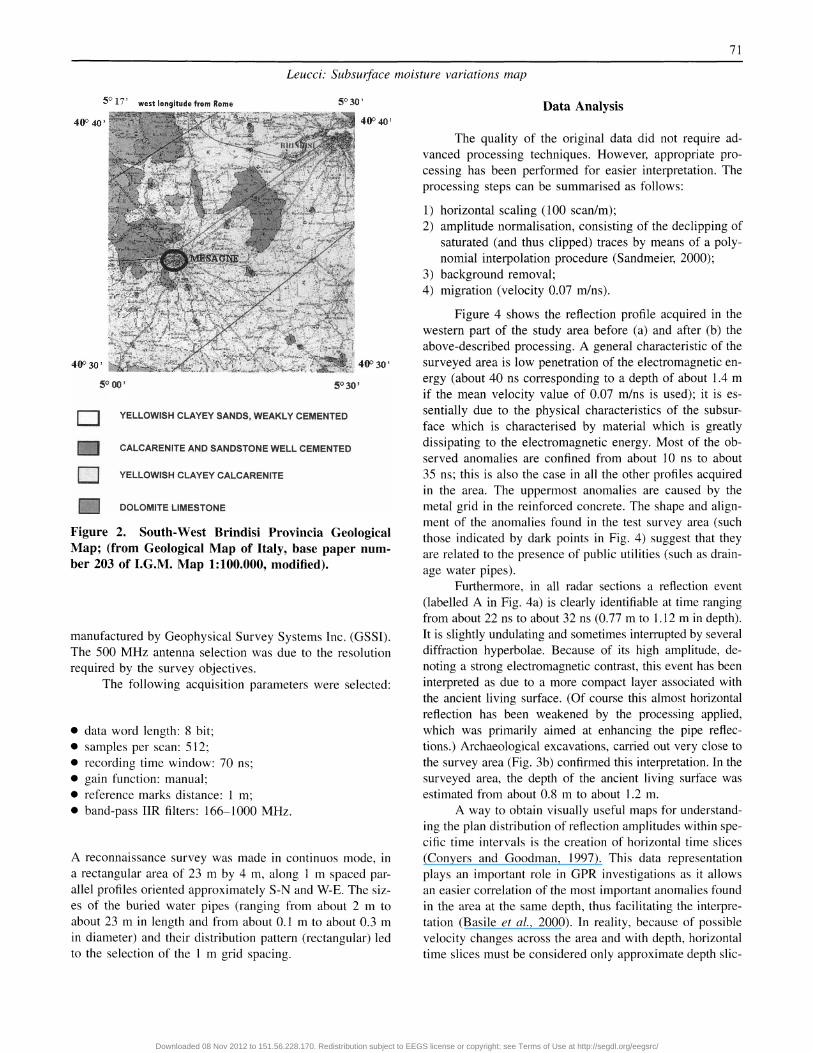
The surveyed site is located in the historical centre of Mesagne near Brindisi (Apulia, Italy) (Fig. 1). According to the geological map (Fig. 2) the uppermost meters of soil are constituted by yellowish clayey sands poorly cemented (Geological Map of Italy, 1970). The water table is located at an average depth of about 4 m from the ground level. The site is generally affected by hydrogeological subsidence caused by:
1) the variability of the level of the superficial water table (from about 3 m to about 5 m in depth);
2) the losses of the old water pipes and drainage system; 3) the uncontrolled drawing from numerous wells; 4) the presence of man-made and natural cavities.
These are the main causes of the static trouble of some buildings. In fact the geological substrate is constituted by sands of the transgressive Post-Calabrian units, which are mainly melted and affected by degradation pro-
JEEG, June 2002, Volume 7, Issue 2, pp. 69-77
Downloaded 08 Nov 2012 to 151.56.228.170. Redistribution subject to EEGS license or copyright; see Terms of Use at http://segdl.org/eegsrc/
70
Journal of Environmental and Engineering Geophysics
Figure 1. Location of the survey site: via Luca Antonio Resta, Mesagne, (Apulia, Italy).
cesses in their most superficial parts. The main aspect of this degradation process consists in the progressive carrying away of the cementing part under the influence of the water table and rain water. The conditions of the hydrogeological hazard, characterising the subsurface of Mesagne, depend essentially on the upper level variations of the almost superficial water table.
The main negative effects can be summarized by two points:
• washing away and progressive degradation of foundational structures;
• damage of water supply and drainage pipes, particularly prone to dangerous breaks without constant and effective maintenance.
This last point is very important because it concerns the direct leaking of water into the subsurface. The water network losses are certainly more dangerous than the natural infiltration, because of their continuous and concentrated action near the broken pipe zone.
In the historical centre of Mesagne many buildings have developed several cracks (Fig. 3a) caused by hydro-geological subsidence and by losses from the water network. In fact, with regard to one damaged building (Fig. 3a), the municipal technical office of Mesagne performed an excavation which revealed a strong loss from a water pipe. Once the break in the pipe had been repaired, a noninvasive investigation of the whole area was proposed to establish other possible losses. To test the feasibility of the GPR methodology to fulfill this task, a test area was selected near the most damaged building. The GPR survey was carried out after a long dry period, in via Luca Antonio Resta, an area that is covered by brick paving. Below the brick paving there is a layer of reinforced concrete (about 0.10 m thick).
Field Instrumentation and Data Acquisition
The GPR survey was carried out with a georadar Sys-tem-2 (SIR 2) and a 500 MHz (centre frequency) antenna
Downloaded 08 Nov 2012 to 151.56.228.170. Redistribution subject to EEGS license or copyright; see Terms of Use at http://segdl.org/eegsrc/
71
Leucci: Subsurface moisture variations map
Data Analysis
Figure 2. South-West Brindisi Provincia Geological Map; (from Geological Map of Italy, base paper number 203 of I.G.M. Map 1:100.000, modified).
manufactured by Geophysical Survey Systems Inc. (GSSI). The 500 MHz antenna selection was due to the resolution required by the survey objectives.
The following acquisition parameters were selected:
data word length: 8 bit; samples per scan: 512; recording time window: 70 ns; gain function: manual; reference marks distance: 1 m; band-pass IIR filters: 166-1000 MHz.
A reconnaissance survey was made in continuos mode, in a rectangular area of 23 m by 4 m, along 1 m spaced parallel profiles oriented approximately S-N and W-E. The sizes of the buried water pipes (ranging from about 2 m to about 23 m in length and from about 0.1 m to about 0.3 m in diameter) and their distribution pattern (rectangular) led to the selection of the 1 m grid spacing.
The quality of the original data did not require advanced processing techniques. However, appropriate processing has been performed for easier interpretation. The processing steps can be summarised as follows:
1) horizontal scaling (100 scan/m); 2) amplitude normalisation, consisting of the declipping of
saturated (and thus clipped) traces by means of a polynomial interpolation procedure (Sandmeier, 2000);
3) background removal; 4) migration (velocity 0.07 m/ns).
Figure 4 shows the reflection profile acquired in the western part of the study area before (a) and after (b) the above-described processing. A general characteristic of the surveyed area is low penetration of the electromagnetic energy (about 40 ns corresponding to a depth of about 1.4 m if the mean velocity value of 0.07 m/ns is used); it is essentially due to the physical characteristics of the subsurface which is characterised by material which is greatly dissipating to the electromagnetic energy. Most of the observed anomalies are confined from about 10 ns to about 35 ns; this is also the case in all the other profiles acquired in the area. The uppermost anomalies are caused by the metal grid in the reinforced concrete. The shape and alignment of the anomalies found in the test survey area (such those indicated by dark points in Fig. 4) suggest that they are related to the presence of public utilities (such as drainage water pipes).
Furthermore, in all radar sections a reflection event (labelled A in Fig. 4a) is clearly identifiable at time ranging from about 22 ns to about 32 ns (0.77 m to 1.12 m in depth). It is slightly undulating and sometimes interrupted by several diffraction hyperbolae. Because of its high amplitude, denoting a strong electromagnetic contrast, this event has been interpreted as due to a more compact layer associated with the ancient living surface. (Of course this almost horizontal reflection has been weakened by the processing applied, which was primarily aimed at enhancing the pipe reflections.) Archaeological excavations, carried out very close to the survey area (Fig. 3b) confirmed this interpretation. In the surveyed area, the depth of the ancient living surface was estimated from about 0.8 m to about 1.2 m.
A way to obtain visually useful maps for understanding the plan distribution of reflection amplitudes within specific time intervals is the creation of horizontal time slices (Conyers and Goodman, 1997). This data representation plays an important role in GPR investigations as it allows an easier correlation of the most important anomalies found in the area at the same depth, thus facilitating the interpretation (Basile et al, 2000). In reality, because of possible velocity changes across the area and with depth, horizontal time slices must be considered only approximate depth slic-
Downloaded 08 Nov 2012 to 151.56.228.170. Redistribution subject to EEGS license or copyright; see Terms of Use at http://segdl.org/eegsrc/

72
Journal of Environmental and Engineering Geophysics
Figure 3. Photos: a) example of cracks (labeled L) developed in several buildings in via Luca Antonio Resta, Mesagne, (Apulia, Italy), b) archaeological excavations carried out very close to the survey area. The Ancient Living Surface is at depths ranging from about 0.7 m to about 2 m.
es. However, this is generally sufficient for most common alies were observed. The selected two-way time interval applications. In the present work the time slice technique corresponds to a soil layer, approximately 0.50 m thick, has been used to display the amplitude variations within the located between 0.7 and 1.2 m in depth, where presumably 20-34 ns time window, where the majority of pipe anom- the water network was lodged. The slice shown in Fig. 5
Downloaded 08 Nov 2012 to 151.56.228.170. Redistribution subject to EEGS license or copyright; see Terms of Use at http://segdl.org/eegsrc/

73
Leucci: Subsurface moisture variations map
Figure 4. Comparison between data set (500 MHz antenna) before (a) and after (b) processing. Dark points are hyperbolic anomalies associated with buried pipes. A is a reflection interpreted as due to a more compact layer associated with the ancient living surface. C is the electromagnetic response of a reinforced concrete metal grid.
was obtained using the processed data from the two sets of orthogonal profiles. Several events are visible as high amplitude anomalies (dark region) that could be interpreted as drainage water pipes (reconstructed with dark lines in Fig. 5; also shown one the surface locations of the road drainage wells, T). Another high amplitude anomaly (labelled W) is visible in the north-eastern portion of the slice; this anomaly represents a refilled well as documented by local witnesses.
Velocity Analysis and Moisture Map
The electromagnetic wave (e.m.w.) velocity plays an important role in defining shallow subsurface water content. For the frequency band of GPR, the velocity of the e.m. waves propagating in the ground depends on the relative dielectric permittivity (or the real part of the dielectric constant, K) of the material by the simplified equation
where c is the e.m.w. velocity in the empty space (0.30 m/ ns).
Hence K can be determined directly from e.m.w. velocity. The K of pure water is about 80, while that of common dry geological material is between 4 and 10. If only a small amount of water is contained in the material, the K increases considerably and, conversely, the e.m.w. velocity will decrease significantly. Thus the measure of the K is a good measure of the water content in the ground. Several mixing formulae have been both theoretically and empirically developed for the dielectric response of heterogeneous mixtures such as water-saturated soils. One such mixing formula is the complex refractive index method (CRIM) equation, which is often used in interpretation of electromagnetic logging data (Greaves et al, 1996).
Topp et al. (1980) used a wide range of soil samples with varying degrees of water saturation to obtain the following empirical relationship between K and the volumetric soil water content (w):
v = c/KL (1)
Downloaded 08 Nov 2012 to 151.56.228.170. Redistribution subject to EEGS license or copyright; see Terms of Use at http://segdl.org/eegsrc/

74
Journal of Environmental and Engineering Geophysics
w = - 5 . 3 1 0 2 + 2.92-10-2-(K) - 5.5- 10"4-(K)2
+ 4.3-10-6-(K)3 (2)
Figure 5. Time slice for the 20-34 ns time window (0.7 m-1.2 m depth). T represents anomalies related to the road drainage wells visible from the surface. Dark lines represents the drainage water pipes. W represents the anomaly related to the refill well.
which was found to be nearly independent of soil texture, soil bulk density, temperature and soil salinity.
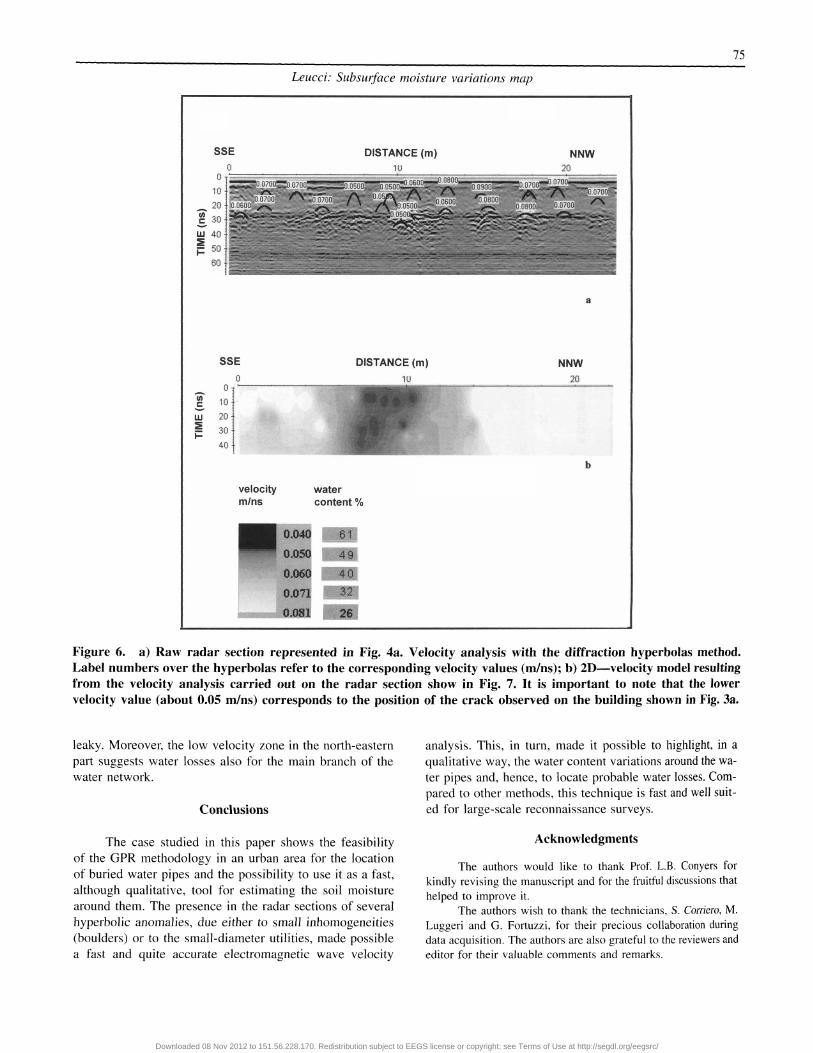
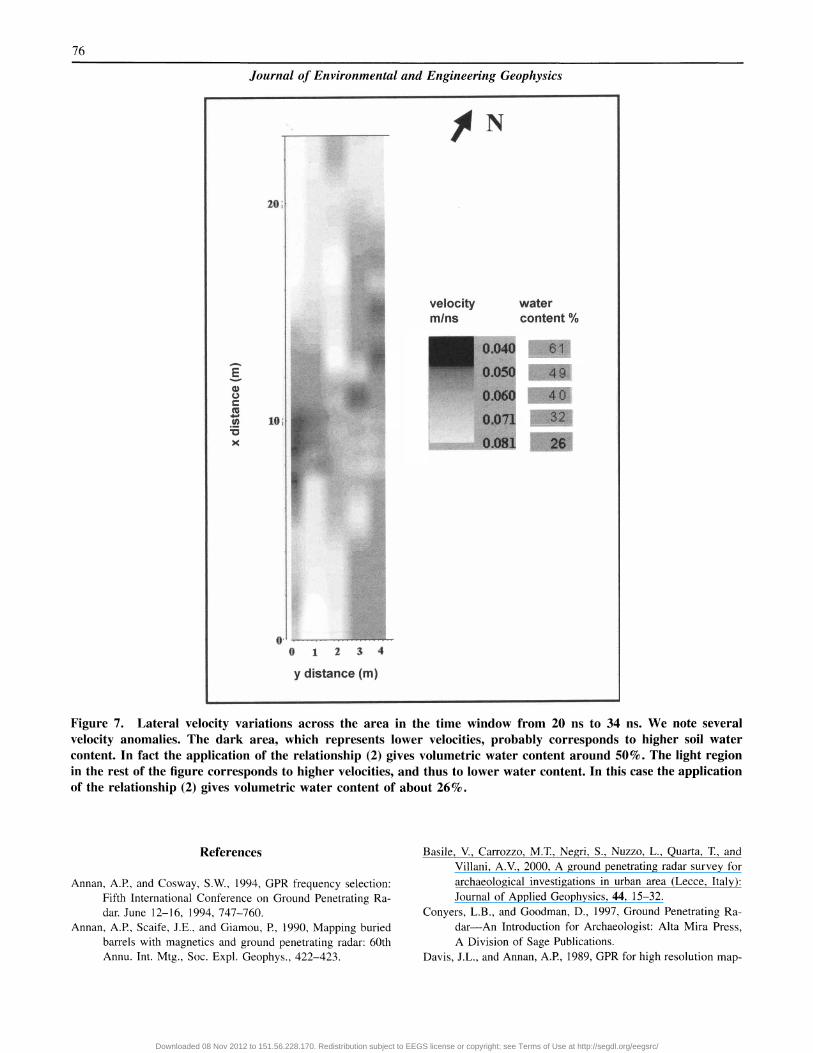
Electromagnetic wave velocity can be estimated from GPR data in several ways; the conventional method involves Common Depth-Point (CDP) and Wide-Angle Reflection and Refraction (WARR) data set. Both methods require two antennas in separate units and relatively long acquisition times. In the first case, both antennas are simultaneously moved apart on either side of the mid-point of the profile. In the second case, one antenna remains stationary while the other is moved along the profile direction. The e.m.w. velocity can be more quickly and easily determined from the reflection profiles acquired in continuous mode, using the characteristic hyperbolic shape of the reflection from a point source. In our data set several hyperbolic reflections (Fig. 4a), which allow an accurate velocity analysis, are present. Figure 6a shows an example of velocity analysis performed, with a computer algorithm (Sandmeier, 2000), on our data set. The application of this method points out both vertical (in time and, hence in depth) and lateral velocity variations from 0.05 m/ns to 0.08 m/ns. An average velocity of 0.07 m/ns results over the survey area in general. In Fig. 6b an example of velocity variation with time (for the first 40 ns) is shown for the same profile shown in the previous figures. This 2D velocity model was derived from the previously determined velocity values (Fig. 6a) using a special interpolation that is done as follows: all actual velocities are summed up for every point in the x-t range according to the square of their distance to the x-t-point (Sandmeier, 2000). In this figure it is important to note that the lower velocity value (about 0.05 m/ns) corresponds to the position of the crack observed on the building shown in Fig. 3a. In order to determine lateral velocity variations across the area in close proximity to the water network, the e.m.w. velocity was also displayed as a time slice, employing the same time window (20 to 34 ns) previously used and a similar (x-y) interpolation procedure (Fig. 7). We note several velocity anomalies. The dark area, which represents lower velocities, corresponds most likely to higher soil water content. In fact the application of the empirical Topp formula gives volumetric water content of around 50%. The light region in the rest of the figure corresponds to higher velocities, and thus to lower water content. In this case the application of the empirical Topp formula gives volumetric water content of about 26%. The lower velocity zone in the westernmost part of the area corresponds both to the position of the cracks observed on the facade of the house (Fig. 3a), as previously outlined, and to the location of pipes probably connecting the drainage wells; this may be explained by the fact that the water pipes in these points are probably still
Downloaded 08 Nov 2012 to 151.56.228.170. Redistribution subject to EEGS license or copyright; see Terms of Use at http://segdl.org/eegsrc/
Leucci: Subsurface moisture variations map
Figure 6. a) Raw radar section represented in Fig. 4a. Velocity analysis with the diffraction hyperbolas method. Label numbers over the hyperbolas refer to the corresponding velocity values (m/ns); b) 2D—velocity model resulting from the velocity analysis carried out on the radar section show in Fig. 7. It is important to note that the lower velocity value (about 0.05 m/ns) corresponds to the position of the crack observed on the building shown in Fig. 3a.
leaky. Moreover, the low velocity zone in the north-eastern part suggests water losses also for the main branch of the water network.
Conclusions
The case studied in this paper shows the feasibility of the GPR methodology in an urban area for the location of buried water pipes and the possibility to use it as a fast, although qualitative, tool for estimating the soil moisture around them. The presence in the radar sections of several hyperbolic anomalies, due either to small inhomogeneities (boulders) or to the small-diameter utilities, made possible a fast and quite accurate electromagnetic wave velocity
analysis. This, in turn, made it possible to highlight, in a qualitative way, the water content variations around the water pipes and, hence, to locate probable water losses. Compared to other methods, this technique is fast and well suited for large-scale reconnaissance surveys.
Acknowledgments
The authors would like to thank Prof. L.B. Conyers for kindly revising the manuscript and for the fruitful discussions that helped to improve it.
The authors wish to thank the technicians, S. Corriero, M. Luggeri and G. Fortuzzi, for their precious collaboration during data acquisition. The authors are also grateful to the reviewers and editor for their valuable comments and remarks.
Downloaded 08 Nov 2012 to 151.56.228.170. Redistribution subject to EEGS license or copyright; see Terms of Use at http://segdl.org/eegsrc/
76
Journal of Environmental and Engineering Geophysics
Figure 7. Lateral velocity variations across the area in the time window from 20 ns to 34 ns. We note several velocity anomalies. The dark area, which represents lower velocities, probably corresponds to higher soil water content. In fact the application of the relationship (2) gives volumetric water content around 50%. The light region in the rest of the figure corresponds to higher velocities, and thus to lower water content. In this case the application of the relationship (2) gives volumetric water content of about 26%.
References
Annan, A.P., and Cosway, S.W., 1994, GPR frequency selection: Fifth International Conference on Ground Penetrating Radar. June 12-16, 1994, 747-760.
Annan, A.P, Scaife, J.E., and Giamou, P., 1990, Mapping buried barrels with magnetics and ground penetrating radar: 60th Annu. Int. Mtg., Soc. Expl. Geophys., 422-423.
Basile, V., Carrozzo, M.T., Negri, S., Nuzzo, L., Quarta, T., and Villani, A.V., 2000, A ground penetrating radar survey for archaeological investigations in urban area (Lecce, Italy): Journal of Applied Geophysics, 44, 15-32.
Conyers, L.B., and Goodman, D., 1997, Ground Penetrating Radar—An Introduction for Archaeologist: Alta Mira Press, A Division of Sage Publications.
Davis, J.L., and Annan, A.P, 1989, GPR for high resolution map-
Downloaded 08 Nov 2012 to 151.56.228.170. Redistribution subject to EEGS license or copyright; see Terms of Use at http://segdl.org/eegsrc/

77
Leucci: Subsurface moisture variations map
ping of soil and rock stratigraphy, Geophysical Prospecting, 37, 531-551.
Du, S., and Rummel, R, 1994, Reconnaissance studies of moisture in the subsurface with GPR: Fifth International Conference on Ground Penetrating Radar. June 12-16, 1994, 1224-1248.
Geological Map of Italy (base paper number 203 of Military Geographical Institute Map 1:100.000, modified).
Grandjean, G., Gourry, J.C., and Bitri, A., 2000, Evaluation of GPR techniques for civil-engineering applications: Study on a test site: Journal of Applied Geophysics, 45, 141-156.
Greaves, R.J., Lesmes, D.R, Lee, J.M., and Toksoz, N., 1996,
Velocity variations and water content estimated from muli-offset, ground-penetrating radar: Geophysics, 61, 683-695.
Mellet, J.S., 1995, Ground penetrating radar applications in engineering, environmental management, and geology: Journal of Applied Geophysics, 33, 157-166.
Sandmeier, K.J., 2000, Reflexw 2.1 manual: Sandmeier Software, Zipser Strabe 1, D-76227 Karlsruhe Germany.
Topp, G.C., Davis, J.L., and Annan, A.R, 1980, Electromagnetic Determination of Soil Water Content: Measurements in Coaxial Transmission Lines: Water Resources Research, Vol. 16, N. 3, 574-582.
Downloaded 08 Nov 2012 to 151.56.228.170. Redistribution subject to EEGS license or copyright; see Terms of Use at http://segdl.org/eegsrc/