Supporting Simulation-based Decision Making with the Use of AHP Analysis
10
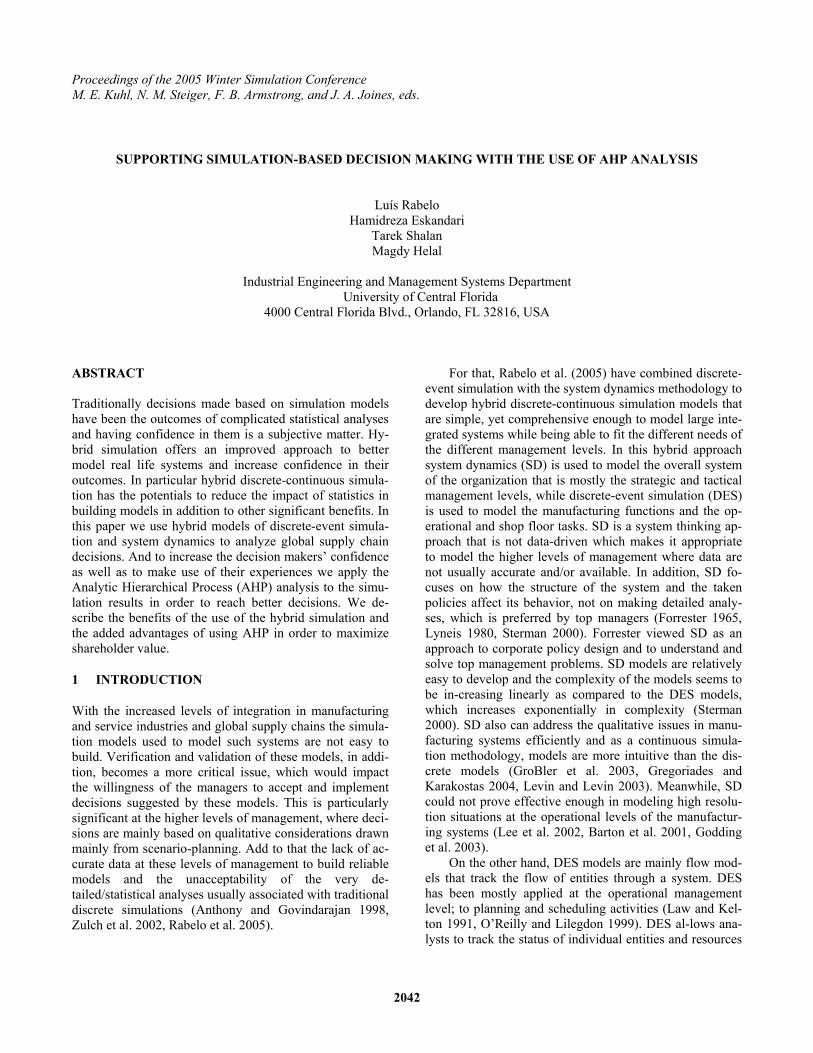
Proceedings of the 2005 Winter Simulation Conference M. E. Kuhl, N. M. Steiger, F. B. Armstrong, and J. A. Joines, eds. ABSTRACT Traditionally decisions made based on simulation models have been the outcomes of complicated statistical analyses and having confidence in them is a subjective matter. Hy- brid simulation offers an improved approach to better model real life systems and increase confidence in their outcomes. In particular hybrid discrete-continuous simula- tion has the potentials to reduce the impact of statistics in building models in addition to other significant benefits. In this paper we use hybrid models of discrete-event simula- tion and system dynamics to analyze global supply chain decisions. And to increase the decision makers’ confidence as well as to make use of their experiences we apply the Analytic Hierarchical Process (AHP) analysis to the simu- lation results in order to reach better decisions. We de- scribe the benefits of the use of the hybrid simulation and the added advantages of using AHP in order to maximize shareholder value. 1 INTRODUCTION With the increased levels of integration in manufacturing and service industries and global supply chains the simula- tion models used to model such systems are not easy to build. Verification and validation of these models, in addi- tion, becomes a more critical issue, which would impact the willingness of the managers to accept and implement decisions suggested by these models. This is particularly significant at the higher levels of management, where deci- sions are mainly based on qualitative considerations drawn mainly from scenario-planning. Add to that the lack of ac- curate data at these levels of management to build reliable models and the unacceptability of the very de- tailed/statistical analyses usually associated with traditional discrete simulations (Anthony and Govindarajan 1998, Zulch et al. 2002, Rabelo et al. 2005). For that, Rabelo et al. (2005) have combined discrete- event simulation with the system dynamics methodology to develop hybrid discrete-continuous simulation models that are simple, yet comprehensive enough to model large inte- grated systems while being able to fit the different needs of the different management levels. In this hybrid approach system dynamics (SD) is used to model the overall system of the organization that is mostly the strategic and tactical management levels, while discrete-event simulation (DES) is used to model the manufacturing functions and the op- erational and shop floor tasks. SD is a system thinking ap- proach that is not data-driven which makes it appropriate to model the higher levels of management where data are not usually accurate and/or available. In addition, SD fo- cuses on how the structure of the system and the taken policies affect its behavior, not on making detailed analy- ses, which is preferred by top managers (Forrester 1965, Lyneis 1980, Sterman 2000). Forrester viewed SD as an approach to corporate policy design and to understand and solve top management problems. SD models are relatively easy to develop and the complexity of the models seems to be in-creasing linearly as compared to the DES models, which increases exponentially in complexity (Sterman 2000). SD also can address the qualitative issues in manu- facturing systems efficiently and as a continuous simula- tion methodology, models are more intuitive than the dis- crete models (GroBler et al. 2003, Gregoriades and Karakostas 2004, Levin and Levin 2003). Meanwhile, SD could not prove effective enough in modeling high resolu- tion situations at the operational levels of the manufactur- ing systems (Lee et al. 2002, Barton et al. 2001, Godding et al. 2003). On the other hand, DES models are mainly flow mod- els that track the flow of entities through a system. DES has been mostly applied at the operational management level; to planning and scheduling activities (Law and Kel- ton 1991, O’Reilly and Lilegdon 1999). DES al-lows ana- lysts to track the status of individual entities and resources SUPPORTING SIMULATION-BASED DECISION MAKING WITH THE USE OF AHP ANALYSIS Luís Rabelo Hamidreza Eskandari Tarek Shalan Magdy Helal Industrial Engineering and Management Systems Department University of Central Florida 4000 Central Florida Blvd., Orlando, FL 32816, USA 2042
Transcript of Supporting Simulation-based Decision Making with the Use of AHP Analysis
Proceedings of the 2005 Winter Simulation Conference M. E. Kuhl, N. M. Steiger, F. B. Armstrong, and J. A. Joines, eds.
SUPPORTING SIMULATION-BASED DECISION MAKING WITH THE USE OF AHP ANALYSIS
Luís Rabelo Hamidreza Eskandari
Tarek Shalan Magdy Helal
Industrial Engineering and Management Systems Department
University of Central Florida 4000 Central Florida Blvd., Orlando, FL 32816, USA
ABSTRACT Traditionally decisions made based on simulation models have been the outcomes of complicated statistical analyses and having confidence in them is a subjective matter. Hy-brid simulation offers an improved approach to better model real life systems and increase confidence in their outcomes. In particular hybrid discrete-continuous simula-tion has the potentials to reduce the impact of statistics in building models in addition to other significant benefits. In this paper we use hybrid models of discrete-event simula-tion and system dynamics to analyze global supply chain decisions. And to increase the decision makers’ confidence as well as to make use of their experiences we apply the Analytic Hierarchical Process (AHP) analysis to the simu-lation results in order to reach better decisions. We de-scribe the benefits of the use of the hybrid simulation and the added advantages of using AHP in order to maximize shareholder value.
1 INTRODUCTION
With the increased levels of integration in manufacturing and service industries and global supply chains the simula-tion models used to model such systems are not easy to build. Verification and validation of these models, in addi-tion, becomes a more critical issue, which would impact the willingness of the managers to accept and implement decisions suggested by these models. This is particularly significant at the higher levels of management, where deci-sions are mainly based on qualitative considerations drawn mainly from scenario-planning. Add to that the lack of ac-curate data at these levels of management to build reliable models and the unacceptability of the very de-tailed/statistical analyses usually associated with traditional discrete simulations (Anthony and Govindarajan 1998, Zulch et al. 2002, Rabelo et al. 2005).
20
For that, Rabelo et al. (2005) have combined discrete-event simulation with the system dynamics methodology to develop hybrid discrete-continuous simulation models that are simple, yet comprehensive enough to model large inte-grated systems while being able to fit the different needs of the different management levels. In this hybrid approach system dynamics (SD) is used to model the overall system of the organization that is mostly the strategic and tactical management levels, while discrete-event simulation (DES) is used to model the manufacturing functions and the op-erational and shop floor tasks. SD is a system thinking ap-proach that is not data-driven which makes it appropriate to model the higher levels of management where data are not usually accurate and/or available. In addition, SD fo-cuses on how the structure of the system and the taken policies affect its behavior, not on making detailed analy-ses, which is preferred by top managers (Forrester 1965, Lyneis 1980, Sterman 2000). Forrester viewed SD as an approach to corporate policy design and to understand and solve top management problems. SD models are relatively easy to develop and the complexity of the models seems to be in-creasing linearly as compared to the DES models, which increases exponentially in complexity (Sterman 2000). SD also can address the qualitative issues in manu-facturing systems efficiently and as a continuous simula-tion methodology, models are more intuitive than the dis-crete models (GroBler et al. 2003, Gregoriades and Karakostas 2004, Levin and Levin 2003). Meanwhile, SD could not prove effective enough in modeling high resolu-tion situations at the operational levels of the manufactur-ing systems (Lee et al. 2002, Barton et al. 2001, Godding et al. 2003).
On the other hand, DES models are mainly flow mod-els that track the flow of entities through a system. DES has been mostly applied at the operational management level; to planning and scheduling activities (Law and Kel-ton 1991, O’Reilly and Lilegdon 1999). DES al-lows ana-lysts to track the status of individual entities and resources
42

Rabelo, Eskandri, Shaalan, and Helal
and to estimate numerous performance measures under a wide range of operating conditions. How-ever, it only es-tablishes estimates of and correlations among variables and performance measures using statistics. Understanding the differences between correlation and causality is not always easy, especially when modeling the contemporary large-sized integrated manufacturing systems. DES also has been criticized for being a data demanding technique. Data can be available for most of the manufacturing activities but when dealing with business level decisions, data is not usually available or available as rough estimates and ap-proximations. This makes DES not appropriate for investi-gating many business decisions or the interactions between business and production branches of the enterprise. Inves-tigating these interactions is inevitable in the current inte-grated manufacturing systems. And as mentioned, at the higher management levels, the detailed approaches of DES are not well appropriate. (Anthony and Govindarajan 1998, Baines and Harrison 1999, Zulch et al. 2002).In the current paper we utilize the SD-DES hybrid simulation approach to model a value chain system. The value chain system is the traditional production/assembly supply chain system with service components added to it. SD is used to model the extended enterprise system while DES is used to model the manufacturing and service sub-systems. The hybrid simulation works by having SD esti-mates the demand for the product and the service, quality of each, reactions of the customers, investment issues, overhead costs, and new product and service development functions. This data is exported to the DES models to as-sess the performance of the manufacturing and service fa-cilities and estimate the associated costs. Costs and units produced as well as services that could be offered are fed back to SD to re-evaluate the overall performance of the entire system. The models are used to assess a number of alternatives for outsourcing the manufacturing function or keeping it in-house.
Since SD is the main model while DES models are ba-sically subsystems of it, the output of the value chain simu-lation is the projected performance of the enterprise for a period of five future years, which comes from SD. For top level managers to make such decisions, various trade-offs are considered by them, which include the social and po-litical situations as well as future technological impact of outsourcing. Simulations can not handle such trade-offs satisfactorily, especially when they are based on many judgmental and qualitative considerations in additions to quantitative data. To support managers in deciding using the simulation results while being able to utilize their ex-periences and consider other related trade-offs we propose using the analytical hierarchy process (AHP) analysis to make the final decision. Thus simulation out-put conceptu-ally provides better quantification of the alternatives and their future projections while AHP allows decision makers to incorporate other trade-offs as well as overcome the po-
20
tential limitations inherent in any simulation model. In ad-dition, the feeling that the decisions are made by the man-agers with their own personal experiences and qualitative assessments increase the level of confidence in these deci-sions. For this purpose we utilize an enhanced form of the AHP analysis in this paper.
Since in real applications using AHP the pair wise comparisons are usually subject to judgmental errors and are , sometimes, inconsistent and conflicting with each other, the weight point estimates provided by the eigenvec-tor method are necessarily approximates. The uncertainty associated with subjective judgmental errors may affect the rank order of decision alternatives. A new stochastic ap-proach is employed for handling the propagation of uncer-tainty in the AHP and for capturing the uncertain behavior of the global AHP weights. This approach could help deci-sion makers get insights into how the imprecision in judg-ment ratios may affect their choice toward the best solution and how the best alternative(s) may be identified with cer-tain confidence. This enhances the confidence of decision makers in the outcome of an ensuing AHP synthesis (Saaty and Vargas 1987, Zahir 1991, Saaty 1994, Rosenbloom 1996) .
In the following sections, we give a brief definition of the value chain system and then describe the development of the SD-DES simulation models of it. We then describe the outsourcing situation and the use of the hybrid model in evaluating the alternatives. We, then, describe how the modified AHP analysis is used to make the final decisions and discuss the advantages of the use of this modified AHP over making the decisions based on simulation results only.
2 THE VALUE CHAIN SYSTEM
Supply chains can be defined as "life cycle processes sup-porting physical, informational, financial, and knowledge flows for moving products and services from suppliers to end-users” (Ayers 2002; Mentzer 2004). The strategic management of these supply chains has one major goal: the creation of value for both customers (Nix 2001) and chain members (Murman 2002). For customers, this value comes in the form of high quality products; for the chain members, it comes in the form of increased profits.
A recent survey reports that the full potential of these benefits, especially for the chain members, has not been realized (Poirier 2004). We believe that generating and sustaining growth are keys to realizing that potential. Process innovation, product development, outsourcing, and global expansion are part of a new strategy for achieving this goal. In this paper, adding a service component to the traditional production/assembly supply chain is called a value chain. There are important decisions for this value chain. Hybrid simulation can support this decision-making by using system dynamics to capture the financial, global
43

Rabelo, Eskandri, Shaalan, and Helal
economy, and more qualitative elements and discrete-event simulation to simulate the discrete and stochastic elements such as manufacturing (Rabelo et al. 2005).We applied hybrid simulation to an actual value chain of a construction equipment corporation that has two stra-tegic business units. The name of the company has been omitted and some of the information has been disguised. The first Strategic Business Unit (SBU1) manufactures ex-isting products; the second Strategic Business Unit (SBU2) provides services for existing products and generates new services when needed. The top management of this organi-zation had three different alternatives to make a decision:
1. Alternative A: To keep SBU1 and SBU2 under
the enterprise and in continental USA. 2. Alternative B: To outsource the majority of the
manufacturing of SBU1 to South East Asia (but to keep the core competency of design, and new product and service development in house) and keep SBU2 under the organization.
3. Alternative C: To outsource the majority of the manufacturing to China (but to keep final manu-facturing performance testing in Continental USA and the core competencies of design, and new product and service development in house) and keep SBU2 under the organization.
For top management of this organization, the evalua-
tion of alternatives is done based on four major considera-tions: profitability, customer satisfaction, responsiveness, and political stability based on recent scenario planning sessions. Profitability in the model is simply measured as the net total profits after all costs. If the company is profit-able then 30% of profits is used to pay taxes. Then, from the net income, one third is used for dividends and the rest is used to improve performance. The DES sections of the hybrid model of the value chain system estimated product and services costs while other considerations for new product and service development costs and general admini-stration costs are handled in the SD section of the model. Customer satisfaction is measured using different dimen-sions based on returns mainly, and other related factors, as a part of the SD section.
Yet the political circumstances related to the two out-sourcing options were not parts of the simulation model. Decision makers had to assess them themselves. In this re-gard, China was considered relatively stable and strongly emerging economical superpower, which offers a trustable business environment. Meanwhile other parts in Southeast Asia were seen as experiencing few instabilities due to some military and violence activities in addition to less stable governments in some places as compared to China. Added to that was the economical crises that has hit south-east Asia less than a decade ago, and still in the memory. The responsiveness was described as the average lead time
20
required for the replenishment of a single unit produced at any of the proposed three locations.
AHP was able to support the different weights of these factors and then make the analysis of each alternative based on those factors (see Figure 1). But before that, an analysis of the hybrid modeling results were provided to top management to discern the behavior of the two units, their relationships to one another, and their interactions with the marketplace under the different conditions. We discuss this analysis and the lessons learned.
Figure 1. The Hierarchy Structure of the Supply Chain Se-lection Problem
2.1 Hybrid Modeling of the Value Chain
We adopted the SD model of the value chain with two supply chain components (one for manufacturing/assembly and the other one for service) that was introduced and vali-dated in Rabelo et al. (2004). That generic has the follow-ing units (see Figure 2):
1. Group 1: Strategic Business Unit 1 (SBU 1)
Manufacturing. 2. Group 2: Strategic Business Unit 2 (SBU 2) Ser-
vices. 3. Group 3: Customer Request for Proposals. 4. Group 4: Customer Acquisition, Loss, and Recov-
ery. As the SD model did not have the finer details of the
different supply chains with their respective components (e.g., manufacturing facilities) and elements of variation, this was added using one set of discrete models, three models capturing the supply chain of the manufacturing organization and its respective alternatives, and one to rep-resent the supply chain of the service organization. In addi-tion, other groups of stocks and flows related to the finan-cial environment to calculate costs and profits and the productivity and human resources of the new product and service development organizations were added to the ge-neric SD model.
Profitability Responsiveness
Customer Satisfaction
Political Stability
Alternative A
Alternative B
Alternative C
Best Value Chain Selection
44
Rabelo, Eskandri, Shaalan, and Helal
SBU 1 AvailableProducts wo ServiceProduct
Development
SBU1 ConceptProposals
CustomerRequests forProposals
SatisfiedCustomers
SBU 2 Services forCurrent Products
ServiceDevelopment
% WinningConceptProposals
WinningProposals
ActualCustomers
SBU 2Successful
OrdersFulfilled %
SBU1Satisfaction
Factor
SBU2Satisfaction
Factor
Average Time toDevelop SBU1
Products
Time toDevelop SBU2
Services
SBU1 ResponseRate to Customer
Requests
AverageProductLifetime
Quality ofSBU2
ServicesQuality of
SBU1Products
RFP percustomerFactor
Time to RetireServices
Average Produc tper RFP
PotentialCustomers
Converting
Total PotentialMarket
PotentialCustomer
Concentration
Contacts withCustomers
SociabilityContacts of
non-customerswith customers
WOMConversions
Fruitfulness
Relative winningproposals
Effec t of relativewinning proposals on
fruitfulness f
Normal fruitfulness
% of Total PotentialMarket that areInitial Customers
Initial Available Productswo Service
SBU 1 AvailableProducts w Service
ProductTransition
ProductRetirement
Services perProduct Ratio
Initial AvailableProducts w Service
SBU 2 Services forDiscontinued Produc tsService
Transition
ServiceRetirement
Initial Services forDiscontinued Products
Disgruntled FormerCustomers
Customerloss
Time to LoseCustomers
Customerrecovery
Time to RecoverFormer Customers
InitialDisgruntled
FormerCustomers
Effec t on Time to LoseCustomers due to SBU 2Customer Satisfaction f
Normal Timeto Lose
Customers
NormalFraction of
Customers atRisk
Effec t on Fraction of Customers atRisk due to SBU 1 Customer
Satisfaction f
Effect on Time to LoseCustomers due to SBU 1Customer Satisfaction f
Effec t on Fraction of Customers atRisk due to SBU 2 Customer
Satisfaction f
<SBU1 SatisfactionFactor>
<SBU2 SatisfactionFactor>
SBU 1Successful
OrdersFulfilled %
SBU 2 Services
SBU 1 Manufacturing
Customer Request for Proposals
Customer Acquisition, Loss, and Recovery
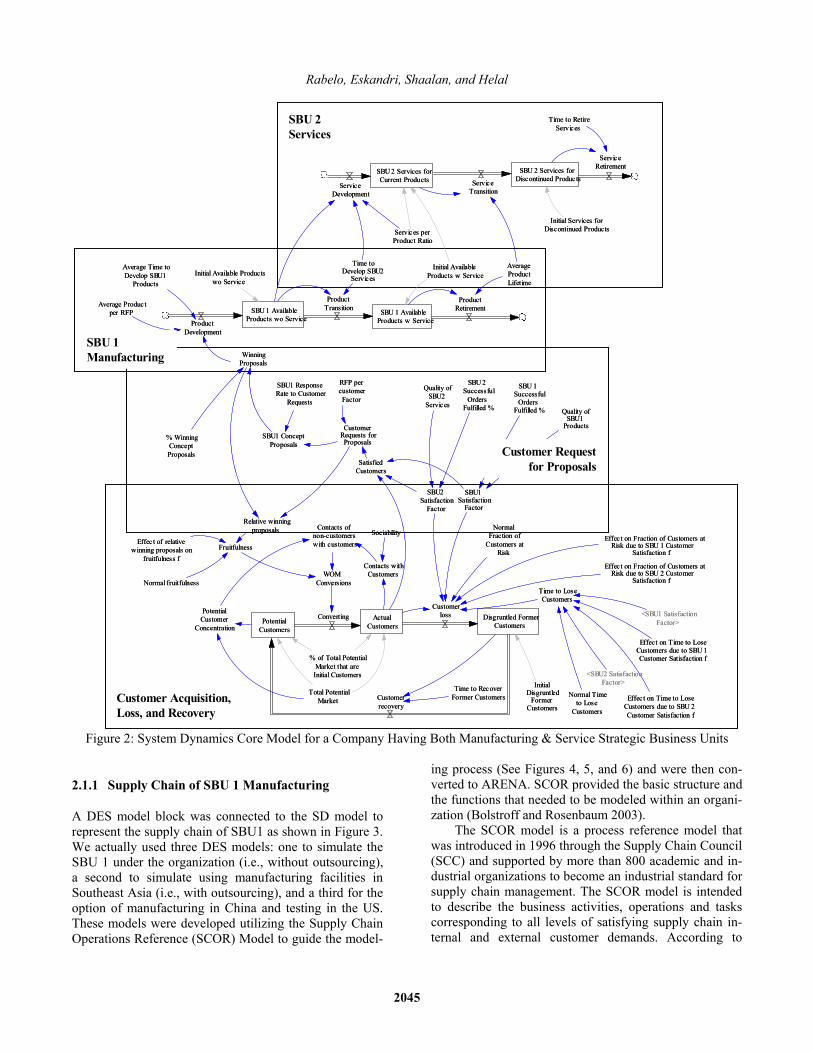
Figure 2: System Dynamics Core Model for a Company Having Both Manufacturing & Service Strategic Business Units
2.1.1 Supply Chain of SBU 1 Manufacturing
A DES model block was connected to the SD model to represent the supply chain of SBU1 as shown in Figure 3. We actually used three DES models: one to simulate the SBU 1 under the organization (i.e., without outsourcing), a second to simulate using manufacturing facilities in Southeast Asia (i.e., with outsourcing), and a third for the option of manufacturing in China and testing in the US. These models were developed utilizing the Supply Chain Operations Reference (SCOR) Model to guide the model-
20
ing process (See Figures 4, 5, and 6) and were then con-verted to ARENA. SCOR provided the basic structure and the functions that needed to be modeled within an organi-zation (Bolstroff and Rosenbaum 2003). The SCOR model is a process reference model that was introduced in 1996 through the Supply Chain Council (SCC) and supported by more than 800 academic and in-dustrial organizations to become an industrial standard for supply chain management. The SCOR model is intended to describe the business activities, operations and tasks corresponding to all levels of satisfying supply chain in-ternal and external customer demands. According to
45
Rabelo, Eskandri, Shaalan, and Helal
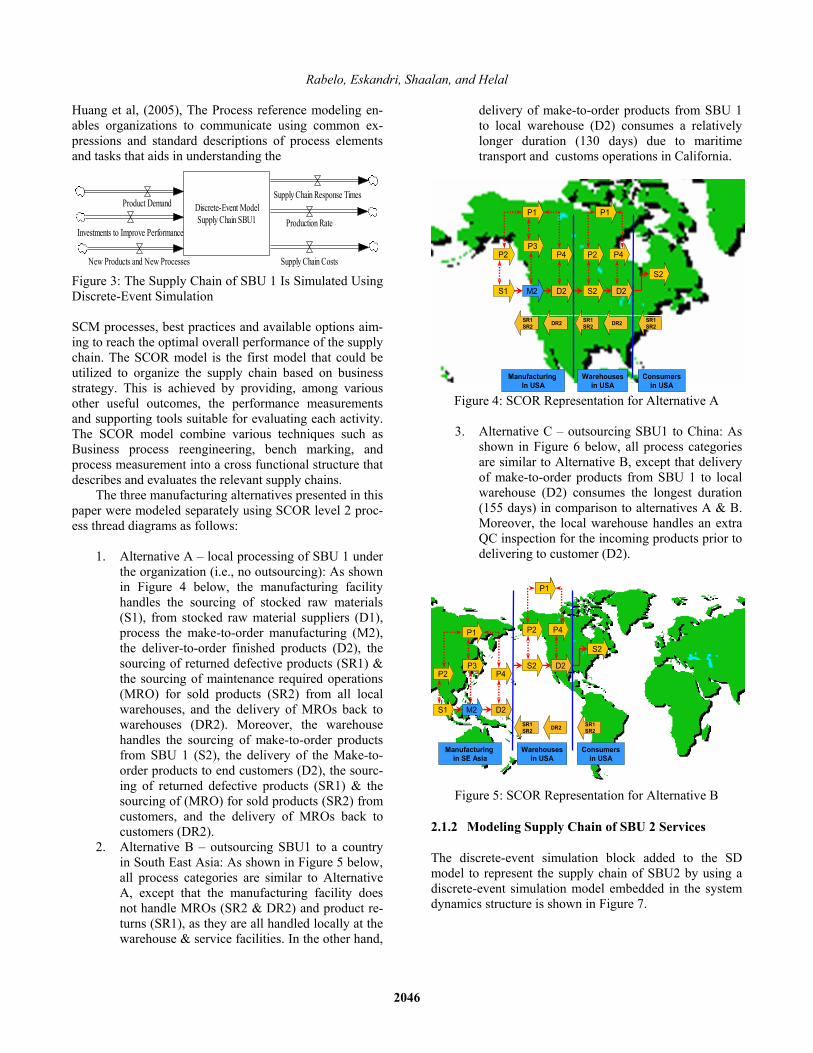
Huang et al, (2005), The Process reference modeling en-ables organizations to communicate using common ex-pressions and standard descriptions of process elements and tasks that aids in understanding theDiscrete-Event ModelSupply Chain SBU1
Product Demand
Production Rate
Supply Chain Costs
Supply Chain Response Times
Investments to Improve Performance
New Products and New Processes Figure 3: The Supply Chain of SBU 1 Is Simulated Using Discrete-Event Simulation
SCM processes, best practices and available options aim-ing to reach the optimal overall performance of the supply chain. The SCOR model is the first model that could be utilized to organize the supply chain based on business strategy. This is achieved by providing, among various other useful outcomes, the performance measurements and supporting tools suitable for evaluating each activity. The SCOR model combine various techniques such as Business process reengineering, bench marking, and process measurement into a cross functional structure that describes and evaluates the relevant supply chains.
The three manufacturing alternatives presented in this paper were modeled separately using SCOR level 2 proc-ess thread diagrams as follows:
1. Alternative A – local processing of SBU 1 under the organization (i.e., no outsourcing): As shown in Figure 4 below, the manufacturing facility handles the sourcing of stocked raw materials (S1), from stocked raw material suppliers (D1), process the make-to-order manufacturing (M2), the deliver-to-order finished products (D2), the sourcing of returned defective products (SR1) & the sourcing of maintenance required operations (MRO) for sold products (SR2) from all local warehouses, and the delivery of MROs back to warehouses (DR2). Moreover, the warehouse handles the sourcing of make-to-order products from SBU 1 (S2), the delivery of the Make-to-order products to end customers (D2), the sourc-ing of returned defective products (SR1) & the sourcing of (MRO) for sold products (SR2) from customers, and the delivery of MROs back to customers (DR2).
2. Alternative B – outsourcing SBU1 to a country in South East Asia: As shown in Figure 5 below, all process categories are similar to Alternative A, except that the manufacturing facility does not handle MROs (SR2 & DR2) and product re-turns (SR1), as they are all handled locally at the warehouse & service facilities. In the other hand,
20
delivery of make-to-order products from SBU 1 to local warehouse (D2) consumes a relatively longer duration (130 days) due to maritime transport and customs operations in California.
S1 M2 D2
Manufacturing In USA
P2P3
P4
P1
Warehousesin USA
Consumersin USA
S2 D2
P2 P4
P1
S2
SR1SR2
SR1SR2 DR2SR1
SR2 DR2
Figure 4: SCOR Representation for Alternative A
3. Alternative C – outsourcing SBU1 to China: As
shown in Figure 6 below, all process categories are similar to Alternative B, except that delivery of make-to-order products from SBU 1 to local warehouse (D2) consumes the longest duration (155 days) in comparison to alternatives A & B. Moreover, the local warehouse handles an extra QC inspection for the incoming products prior to delivering to customer (D2).
S1 M2 D2
Manufacturing in SE Asia
P2P3
P4
P1
Warehousesin USA
Consumersin USA
S2 D2
P2 P4
P1
S2
SR1SR2
SR1SR2 DR2
S1 M2 D2
Manufacturing in SE Asia
P2P3
P4
P1
Warehousesin USA
Consumersin USA
S2 D2
P2 P4
P1
S2
SR1SR2
SR1SR2 DR2
Figure 5: SCOR Representation for Alternative B
2.1.2 Modeling Supply Chain of SBU 2 Services
The discrete-event simulation block added to the SD model to represent the supply chain of SBU2 by using a discrete-event simulation model embedded in the system dynamics structure is shown in Figure 7.
46

Rabelo, Eskandri, Shaalan, and Helal
S1 M2 D2
Manufacturing In China
P2P3
P4
P1
Warehousesin USA
Consumersin USA
S2 D2
P2 P4
P1
S2
SR1SR2
SR1SR2 DR2
S1 M2 D2
Manufacturing In China
P2P3
P4
P1
Warehousesin USA
Consumersin USA
S2 D2
P2 P4
P1
S2
SR1SR2
SR1SR2 DR2
Figure 6: SCOR Representation for Alternative C
2.1.3 Modeling Supply Chain of SBU 1 Manufacturing
We began by modeling a causal loop diagram for the profits and related to costs and the rate of investments. This causal loop is based on the comments provided by the managers of the consulted businesses such as:
1. The members of the Service Staff usually have to
travel constantly to service customers (some-times over the World). This traveling causes high turn over rates.
2. Having a good ratio of “Services Staff/Customer” usually means good customer service. This has increased the number of cus-tomers (“word of mouth”).
3. More investments in the service organization (SBU 2) cause more investments in service staff and more development of services. Investments in service staff increase the recruitment and training of the service force. Recruitment and training of the service force take more resources than the development of services.
4. More services, more customers, and more prod-ucts increase the sales and therefore profit in the organization.
5. It is important to invest in the services and prod-uct organizations. However, it is essential to keep a balance. Services are very dependent on “good” products.
Discrete-Event Model Supply Chain SBU2
Service Demand Service Rate
Supply Chain Costs (Service)
Supply Chain Response Times(Service)
Investments to Improve Performance
New Services and New Processes
Figure 7: The Supply Chain of SBU 2 Is Simulated Using Discrete-Event Simulation
204
2.2 Hybrid Modeling Mechanics
According to Jay Forrester (Forrester 1965), a manufac-turing system consists of five types of flows: Order flow, material flow, money flow, personnel flow, and the capi-tal equipment flow. All these are interconnected and inte-grated using a network of feedback information. These flows and the information network represent the grossly different types of variables that will be encountered in the system. Some of the variables will be in the DES models while some will be in the SD model. The information flowing between models and among the various kinds of flows will relate and define the relationships among the various parameters for the models to interact. For the pur-pose of the current paper we modified and extended the value chain SD model shown in Figure 2 by adding the performance assessment in terms of profits and customer satisfaction. Causal relationships representing the modifi-cations are depicted in Figure 8.
ProfitsCosts -
Rate of Investments inServices (SBU 2)
Rate of Investments inProduct Development
(SBU 1)
--
-
Allocation of Profitsfor SBU1
+
+
Rate of Investments inDevelopment of Services
(SBU 2)
Rate of Investmentsin Services Staff
(SBU 2)
+
+
-
SBU 2AvailableServices
+
SBU 1AvailableProducts
+
Services Staff(SBU 2)
+
Turn Over Rate ofServices Staff (SBU
2)
-
Ratio of ServicesStaff (SBU 2) per
customer+
Customers+
Sales+
+
CustomersLoss
-
--
+
+
Figure 8: Causal Loops for Extensions to the Model of Figure 2
Since the model encompasses the three levels of de-cision making in many simulations then there will be overlapping of data used for the hybrid model constitu-ents. For example current capacity is used at the opera-tional levels and the production planning at the tactical level as well as in strategic planning to plan for potential capacity needs. Some data will be used in different forms and resolutions. For example machine productivity is a detailed data at the operational levels, where the speed and conditions of each machine must be known. At the SD level only gross productivity is needed to be known. Types of data can be represented as in Figure 9. It shows that some data are common (A), some are unique for cer-tain uses at certain system parts (D), some are used as is at more than a level (G and F) and some can be used in different forms at different levels (C and B).
7
Rabelo, Eskandri, Shaalan, and Helal
As mentioned some data are used in different forms at different levels or for different uses. This is a result of fact that data requirements at the various levels are not the same in terms of the level of details and frequency of use. Data are more detailed at the operational levels that at higher levels. The SD level requires aggregated data. Ag-gregation and disaggregation processes are needed to communicate such levels. In addition, the SD model sends periodically information and commands to the DES mod-els. Some of the mathematical relationships that map the stocks-and-flows model follow are supplied by the dis-crete event simulation models based on a polling fre-quency using the Nyquist theorem. One important issues in the replications required and the intervals.
A
B
D
C C'
B' F
G
Strategic
TacticalOperational
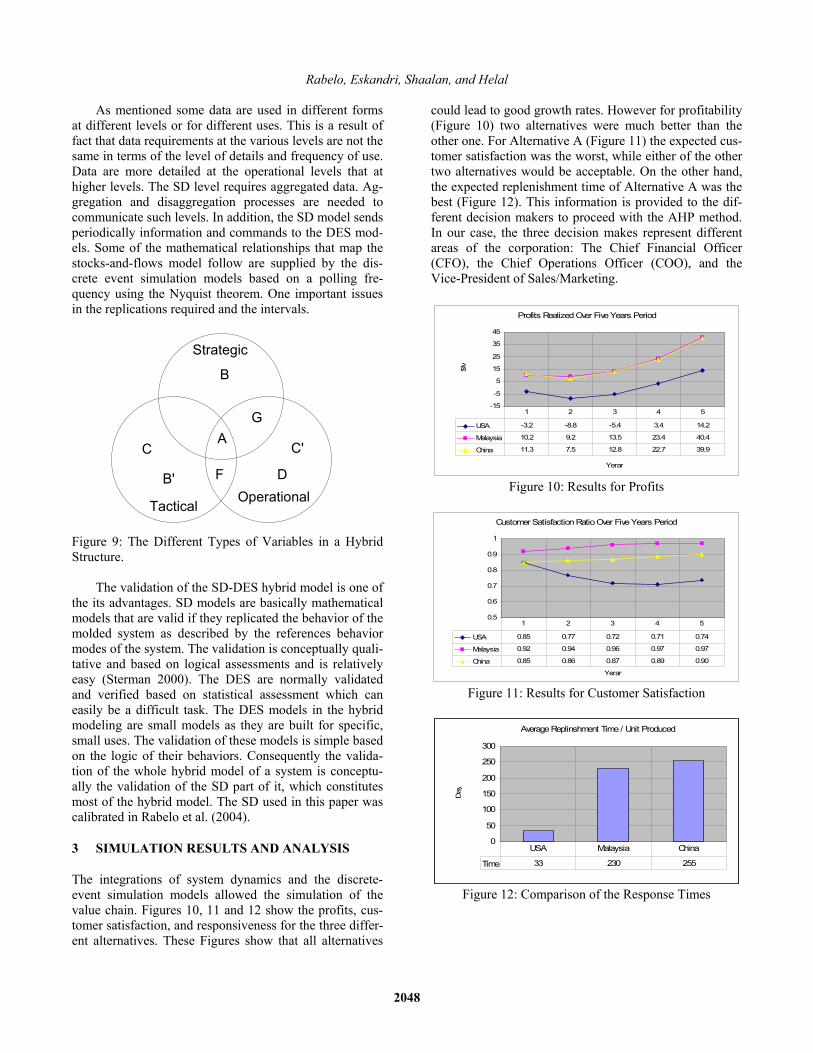
Figure 9: The Different Types of Variables in a Hybrid Structure.
The validation of the SD-DES hybrid model is one of
the its advantages. SD models are basically mathematical models that are valid if they replicated the behavior of the molded system as described by the references behavior modes of the system. The validation is conceptually quali-tative and based on logical assessments and is relatively easy (Sterman 2000). The DES are normally validated and verified based on statistical assessment which can easily be a difficult task. The DES models in the hybrid modeling are small models as they are built for specific, small uses. The validation of these models is simple based on the logic of their behaviors. Consequently the valida-tion of the whole hybrid model of a system is conceptu-ally the validation of the SD part of it, which constitutes most of the hybrid model. The SD used in this paper was calibrated in Rabelo et al. (2004).
3 SIMULATION RESULTS AND ANALYSIS
The integrations of system dynamics and the discrete-event simulation models allowed the simulation of the value chain. Figures 10, 11 and 12 show the profits, cus-tomer satisfaction, and responsiveness for the three differ-ent alternatives. These Figures show that all alternatives
20
could lead to good growth rates. However for profitability (Figure 10) two alternatives were much better than the other one. For Alternative A (Figure 11) the expected cus-tomer satisfaction was the worst, while either of the other two alternatives would be acceptable. On the other hand, the expected replenishment time of Alternative A was the best (Figure 12). This information is provided to the dif-ferent decision makers to proceed with the AHP method. In our case, the three decision makes represent different areas of the corporation: The Chief Financial Officer (CFO), the Chief Operations Officer (COO), and the Vice-President of Sales/Marketing.
Profits Realized Over Five Years Period
-15
-5
5
15
25
35
45
Yerar$M
USA -3.2 -8.8 -5.4 3.4 14.2
Malaysia 10.2 9.2 13.5 23.4 40.4
China 11.3 7.5 12.8 22.7 39.9
1 2 3 4 5
Figure 10: Results for Profits
Customer Satisfaction Ratio Over Five Years Period
0.5
0.6
0.7
0.8
0.9
1
Yerar
USA 0.85 0.77 0.72 0.71 0.74
Malaysia 0.92 0.94 0.96 0.97 0.97
China 0.85 0.86 0.87 0.89 0.90
1 2 3 4 5
Figure 11: Results for Customer Satisfaction
Average Replinshment Time / Unit Produced
0
50
100
150
200
250
300
Day
Time 33 230 255
USA Malaysia China
Figure 12: Comparison of the Response Times
48
Rabelo, Eskandri, Shaalan, and Helal
4 USING THE AHP ANALYSISIn this paper, a framework is implemented for the AHP problem formulation with the measure of global weight variance in order to obtain a confidence interval of the global AHP weight rather than global weight point esti-mates. A stochastic approach is used to calculate the global weight variances accounting for individual errors from inconsistent pairwise comparisons. Utilizing the global AHP weights and their corresponding estimated variances, Monte Carlo simulation is employed for han-dling the related uncertainty in the global AHP weights to allow the investigation of whether the differences among the decision alternatives are statistically significant. This type of analysis provides more information for the deci-sion makers in order to make more precise discrimina-tions among competing alternatives (Hauser Tadikamalla 1996, Levary and Wan 1998).
According to the conventional group AHP using weighted geometric mean method, alternative B, manu-facturing in South East Asia, should be selected as the preferred option with the highest global weight point es-timate of 0.448. Alternative A is ranked second with the next highest global weight point estimate of 0.288 fol-lowed by alternative C, outsourcing in China and per-formance test in USA, with the global weight point esti-mate of 0.264 (see Table 1). If we consider no judgmental uncertainty in the input data, the analysis yields the pref-erence ranking of [B, A, C].
Table 1: Some Statistics for Global Weights of Decision Alternatives
Alternative Mean Standard Deviation
Confidence
Interval (95%)
A 0.288 0.023 (0.242, 0.334) B 0.448 0.037 (0.376,0.520) C 0.264 0.021 (0.222,0.306)
Looking at the obtained 95% confidence interval of
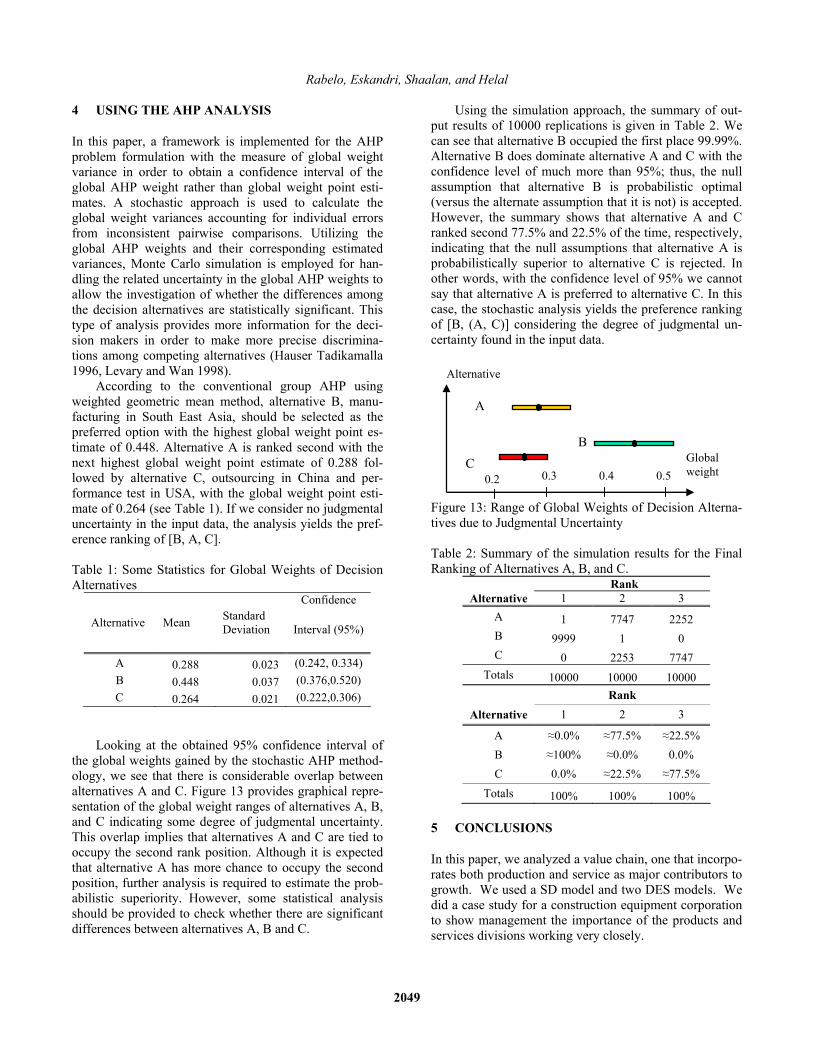
the global weights gained by the stochastic AHP method-ology, we see that there is considerable overlap between alternatives A and C. Figure 13 provides graphical repre-sentation of the global weight ranges of alternatives A, B, and C indicating some degree of judgmental uncertainty. This overlap implies that alternatives A and C are tied to occupy the second rank position. Although it is expected that alternative A has more chance to occupy the second position, further analysis is required to estimate the prob-abilistic superiority. However, some statistical analysis should be provided to check whether there are significant differences between alternatives A, B and C.
20
Using the simulation approach, the summary of out-put results of 10000 replications is given in Table 2. We can see that alternative B occupied the first place 99.99%. Alternative B does dominate alternative A and C with the confidence level of much more than 95%; thus, the null assumption that alternative B is probabilistic optimal (versus the alternate assumption that it is not) is accepted. However, the summary shows that alternative A and C ranked second 77.5% and 22.5% of the time, respectively, indicating that the null assumptions that alternative A is probabilistically superior to alternative C is rejected. In other words, with the confidence level of 95% we cannot say that alternative A is preferred to alternative C. In this case, the stochastic analysis yields the preference ranking of [B, (A, C)] considering the degree of judgmental un-certainty found in the input data.
Figure 13: Range of Global Weights of Decision Alterna-tives due to Judgmental Uncertainty
Table 2: Summary of the simulation results for the Final Ranking of Alternatives A, B, and C.
Rank Alternative 1 2 3
A 1 7747 2252 B 9999 1 0 C 0 2253 7747
Totals 10000 10000 10000 Rank
Alternative 1 2 3
A ≈0.0% ≈77.5% ≈22.5% B ≈100% ≈0.0% 0.0% C 0.0% ≈22.5% ≈77.5%
Totals 100% 100% 100%
5 CONCLUSIONS
In this paper, we analyzed a value chain, one that incorpo-rates both production and service as major contributors to growth. We used a SD model and two DES models. We did a case study for a construction equipment corporation to show management the importance of the products and services divisions working very closely.
0.50.3 0.4
A
B C Global
weight
Alternative
0.2
49
Rabelo, Eskandri, Shaalan, and Helal
We have expanded the original core model to include several other causal loops to add workforce training, fi-nancial structures, and the competitive environment. We have introduced an AHP that takes into consideration the uncertainties resulting from the inconsistent comparison matrices. We believe that the lessons learned from this paper can provide a good decision-making model that integrates the qualitative criteria of the strategic supply chain formu-lation level (i.e., senior executives) which makes empha-sis on the long-term with the SD model representing me-dium-or long term planning and the DES models supporting the short-or medium term tactical planning. This decision-making model has the potential to mitigate the current rigid structure used by managers to make deci-sions in supply chain management and provide a better path to shareholder value.REFERENCES
Anthony, N.R., and Govindarajan, G. 1998. Management control systems. Irwin McGraw-Hill
Ayers, J. B. 2002. A primer on supply chain management and Supply chain strategies. Making Supply Chain Management Work, Design, Implementation, Part-nerships, Technology, and Profits, Ed. Ayers, J. B., Boca Raton, Fla. : CRC Press.
Baines, T. S. and Harrison, D. K.. 1999. An opportunity for system dynamics in manufacturing system model-ling. Production Planning and Control 10(6): 542-552
Barton, J.A., Love, D.M., and Taylor, G. D. 2001. Evalu-ating design implementation strategies using simula-tion. International Journal of Production Economics, 72(3): 285-299.
Bolstroff, P. and Rosenbaum, R. 2003. Supply chain ex-cellence; a handbook for dramatic improvement us-ing the SCOR model. New York AMACOM Books.
Forrester, J. 1965. Industrial dynamics. Portland: Produc-tivity Press.
Godding, G.W., Sarjoughian, H.S., and Kempf, K.G. 2003. Semiconductor supply network simulation. Proceedings of the 2003 Winter Simulation Conf, 7-10 Dec 03, New Orleans, LA. Eds. S. Chick, P. J. Sánchez, D. Ferrin, and D. J. Morrice, eds.
Gregoriades, A., and Karakostas, B. 2004. Unifying busi-ness objects and systems dynamics as a paradigm for developing decision support systems. Decision Sup-port Systems 37(2): 307-311.
Größler, A., Stotz, M., and Schieritz, N. 2003. A software interface between system dynamics and agent-based simulations: linking Vensim® and RePast®. Pro-ceedings of the 21st System Dynamics Society Inter-national Conference, New York, NY, 20-24 July.
20
Hauser, D., and Tadikamalla, P. 1996. The analytic hier-archy process in an uncertain environment: A simula-tion approach. European Journal of Operational Re-search 91: 27-37.
Huang, S., Sheoran, S, and Keskar, H. 2005. Computer assisted supply chain configuration based on supply chain operations reference (SCOR) model. Computer and Industrial Engineering 48: 377-394.
Law, A.M., and Kelton, W.D. 1991. Simulation modelling and analysis. McGraw-Hill.
Lee, Y. H., Cho, M. K., Kim, S. J., and Kim, Y. B. 2002. Supply chain simulation with discrete-continuous combined modelling. Computer and Industrial Engi-neering. 43(1-2): 375-392.
Levary, R., Wan, K. 1998. A simulation approach for handling uncertainty in the analytic hierarchy proc-ess. European Journal of Operational Research 106: 116-122.
Levin, T. and Levin, I.. 2003. Integrating hybrid model-ling with system dynamics. Proceedings of the 21st System Dynamics Society International Conference. New York, NY, 20-24 July.
Lyneis, J.M. 1980. Corporate planning and policy design: A system dynamic approach. The MIT Press
Mentzer, J.T. 2004. Fundamentals of supply chain man-agement: twelve drivers of competitive advantage. Sage Publications, Thousand Oaks, CA.
Murman, E. 2002. Lean enterprise value: insights from MIT's lean aerospace initiative, New York: Palgrave.
Nix, N. W. 2001. The consequences of supply chain man-agement: creating value, satisfaction, and differential advantage. Ed. J. Mentzer, Supply Chain Manage-ment, Sage Publications, Thousand Oaks, CA.
O’Reilly, J., and Lilegdon, W. R. 1999. Introduction to FACTOR/AIM. Proceedings of the 1999 Winter Simulation Conference, Piscataway, NJ, Eds. P. A. Farrington, H. B. Nembhard, D. Sturrock and G.W. Evans.
Poirier, C. and Quinn, F. 2004. How are we doing? a sur-vey of supply chain progress. Supply Chain Man-agement Review Nov/Dec.
Rabelo, L., Speller, T., Burns, C., and Meade, P. 2004. Analysis of sustaining growth in a corporation. Man-agement of Technology, Ed. Hosni, Y. and Khalil, T., San Diego, CA: Elsevier Ltd.
Rabelo, L., Helal, M., Jones, A. Min, J. 2005. Enterprise simulation: a hybrid system approach. Accepted for publication in the International Journal of Computer Integrated Manufacturing.
Rosenbloom, E. S. 1996. A probabilistic interpretation of the final rankings in AHP. European Journal of Op-erational Research 96: 371-378.
Saaty, T. L. 1994. Fundamentals of decision making and priority theory with analytic hierarchy process. RWS Publications.
50
Rabelo, Eskandri, Shaalan, and Helal
Saaty T. L., and Vargas, L.G. 1987. Uncertainty and rankorder in the analytic hierarchy process. European Journal of Operational Research 32: 27-37.
Sterman, J. 2000. Business dynamics: systems thinking and modelling for a complex world. New York: McGraw Hill.
Zahir, M. S. 1991. Incorporating the uncertainty of deci-sion judgments in the analytic hierarchy process. European Journal of Operational Research 53: 206-216.
Zulch, G., Jonsson, U., and Fischer, J. 2002. Hierarchical simulation of complex production systems by cou-pling of models. International Journal of Production Economics 77(1): 39-51.
AUTHOR BIOGRAPHIES LUIS RABELO, Ph.D., is an Associate Professor in the Department of Industrial Engineering and Management Systems at the University of Central Florida in Orlando, Florida. He received dual degrees in Electrical and Me-chanical Engineering from the University of Panama and Master degrees from the Florida Institute of Technology and the University of Missouri-Rolla. He received a Ph.D. in Engineering Management from the University of Mis-souri-Rolla in 1990. He also holds dual MS degrees in Aerospace Systems Engineering & Management from the Massachusetts Institute of Technology. His research in-terests include Simulation Modeling. His email address is [email protected]. HAMIDREZA ESKANDARI is a Ph.D. candidate in the Department of Industrial Engineering and Management Systems at the University of Central Florida. He received his bachelor's degree in Electrical Engineering from Uni-versity of Tehran in 1998 and his Master's degree in Socio-Economic Systems Engineering from Iran Univer-sity of Science and Technology in 2001. His research in-terests include Simulation Modeling and Analysis, Multi-ple Criteria Decision Making, and Multiobjective Optimization. He is a member of IIE. His email address is [email protected].
2
TAREK SHAALAN is a Ph.D. candidate in the Depart-ment of Industrial Engineering and Management Systems at the University of Central Florida. He received a Bache-lor's degree in Mechanical Engineering from the Alexan-dria University, Egypt in 1995, a Master's degree in Engi-neering Management from the Arab Academy for Science and Technology in 1999, Master's degree in Quality Man-agement from the Arab Academy for Science and Tech-nology in 2001 and Master's degree in Engineering Man-agement from the University of Central Florida in 2005. He worked as a professional Engineer for eight years in several Multi-national organizations. His research inter-ests include Simulation Modeling and Analysis, Supply Chain Modeling and Analysis, and Quality Management and Control. His e-mail is [email protected]. MAGDY HELAL received a Master degree in industrial engineering in 1999, and a Bachelor in Manufacturing Engineering Technology in 1993, both from Benha Higher Institute of Technology (BHIT) in Egypt. Helal had been working as a full time researcher and teacher in BHIT since 1993 until he moved to the US in 2001 to pursue a PhD in industrial engineering. Currently he is a Ph.D. candidate at the Industrial Engineering and Man-agement Systems Dept. at the University of Central Flor-ida. Helal is researching in the areas of enterprise engi-neering, production planning and control, and hybrid continuous-discrete simulation modeling. His e-mail is [email protected].
051