
Dependence of Bayesian model selection criteria and Fisher information matrix on sample size

Supplier selection based on multiple criteria
Reza Allahyari Soeini, Laleh Tashakor, Javad Tashakori Bafghi, Mohammad Mokhtari,
Amin Vakili
Director of Development & Renovation Investment in Industrial Development &
Renovation organization of Iran, Tehran, Iran
Senior lecturer in Department of Information Technology Engineering, NOORETOUBA
Virtual University, Tehran, Iran
Department of Information Technology Engineering, NOORETOUBA Virtual University,
Tehran, Iran
Department of Chemical Engineering, Islamic Azad University, Yazd branch, Yazd, Iran
Department of Industry Engineering, Science and Research Branch, Islamic Azad
University, Tehran, Iran
ABSTRACT
Supplier selection is a multi-criteria
decision making problem which includes
both qualitative and quantitative factors.
In order to select the best suppliers it is
necessary to make a trade-off between
these tangible and intangible factors
some of which may conflict. The
majority of previous supplier selection
techniques do not consider strategic
perspective. Besides, uncertainty is one
of the most important obstacles in
supplier selection. For the first time, in
this paper, the idea of the algorithm
"Knapsack" is used to select suppliers.
Moreover, an attempt has to be made to
take the advantage of a simple numerical
method for solving model. This is an
innovation to resolve any ambiguity in
choosing suppliers. This model has been
tried in the suppliers selected in a
competitive environment and according
to all desired standards of quality and
quantity. To show the efficiency of the
model, an industry sample has been uses.
Keyword: Supply chain management,
Supplier select, Knapsack, linear
programming model, Purchasing.
Introduction Nowadays companies are increasingly
outsourcing portions of their business
processes such as IT infrastructures,
purchase of raw material, after sales
services, logistics, and transportation.
According to a recent survey carried out
by Accenture, 80% of the companies‟
surveyed use some form of outsourcing
and a majority of these companies are
spending close to 45% of their total
budget on outsourcing (Accenture
International Journal on New Computer Architectures and Their Applications (IJNCAA) 2(1): 258-273The Society of Digital Information and Wireless Communications, 2012 (ISSN: 2220-9085)
258

Consulting, 2005).Manufacturing
outsourcing began in 1970s and the
1980s when US jobs in steel and textile
moved from Northern states to Southern
states. Outsourcing is defined as
purchasing ongoing services and parts
from an outside company that a
company currently provides, or most
organizations normally provide for
themselves (Linder & Rittscher, 2004).
In another survey carried out by
Accenture, it was found that the primary
reason behind outsourcing is not cost
reduction but the ability to focus on core
competencies. There are various reasons
for outsourcing, most notably (Comperi,
2005) :
1. In many cases the third party can
provide procurement services
more efficiently. Outsourcing can
provide access to specialized
technologies and operational
platforms.
2. Outsourcing can help reduce
number of staff to its efficient
level.
3. Advancements in technologies
has turned procurement to a very
specialized service.
Companies try to reduce costs and
manage risks. It is important to know
that one of the major portions of a firms‟
expenses is related to logistic activities
which in most cases form more than
50% of all companies‟ costs (Aissaoui &
Haouari & Hassini, 2007). Therefore,
companies try to manage purchasing
tasks. Experts believe that supplier
selection is one of the most prominent
activities of purchasing departments (Xia
& Wu, 2007). But, supplier selection is a
difficult problem for managers because
the performances of suppliers are varied
based on each criterion (Liu & Hai,
2005). In the previous investigations,
several methods have been suggested to
solve the supplier selection problem.
However, most of them failed to pay
enough attention to strategic
perspectives of the issue.
Basically there are two kinds of SSP
(supplier selection problem):
(1) Single sourcing. Constraints are
not considered in the supplier
selection process. In other words,
all suppliers can satisfy the
buyer‟s requirements on quantity,
quality, delivery, etc. The buyer
only needs to make one decision,
"which supplier is the best?"
(2) Multiple sourcing. Some
limitations such as supplier‟s
capacity, quality and delivery are
considered in the supplier
selection process. In other words,
no supplier can satisfy the
buyer‟s total requirements and
the buyer needs to distribute his
need among different suppliers to
compensate for the shortage of
capacity or low quality of
suppliers. Under these
circumstances buyers need to
make two decisions: “which
suppliers are the best?”, and
“How much should be purchased
from each selected supplier?”
Many of the decision models applied
to the SSP are linear weighting models
and mathematical programming models.
The proposed decision model is more
comprehensive and competitive rather
than other published MCDM models for
SSP due to its dynamic nature and
strategic oriented.
In this model the idea of a Knapsack
algorithm is used. Suppose that the
tourist wants to fill their Knapsack with
the states may choose from a variety of
devices that provide maximum comfort
for him. The problem formulation begins
with assigning numbers from 1 to n to
International Journal on New Computer Architectures and Their Applications (IJNCAA) 2(1): 258-273The Society of Digital Information and Wireless Communications, 2012 (ISSN: 2220-9085)
259

devices and defining vectors of binary
variables (Binary) (j = 1,2, ... n). That is
to say, if object j is selected, otherwise
when the tool is easily rate j provides the
address and the weight and c is the size
of a Knapsack We take the issue of
choosing between the binary vectors x,
which is provided the limitation. As its
objective function takes the maximum
value.
The Proposed model has been
implemented in a moisture insulator
manufacturing company which intends
to buy products from multiple supplies.
Furthermore, we utilize a proposed
linear programming model to determine
the order quantity from each supplier.
While most former models consider a
single product, our model has been
developed to solve cases with multiple
products. In addition, the capacity of
warehouse is taken into account as a
constraint.
This paper has been organized as
follows: Section 2 discusses the
literature review. Supplier selection
model is presented in Section 3. In
Section 4, a case study is illustrated. In
the first phase, is to assess suppliers.
Then, the order quantity is determined
by a linear programming model. Finally,
conclusions are presented in Section 5.
Literature review
Supplier selection is a multi criteria
decision-making problem. Regulations
and decision-making techniques are two
main elements in a supplier selection
problem. The first research which was
conducted in 1996, identified 23
different criteria to select suppliers based
on questionnaires sent to directors of
North American companies. These
criteria include quality, delivery,
performance, warrant and claim policy,
production facilities and capacity, net
price, and technical capabilities. Hence
supplier selection problem (SSP) is a
multiple criteria problem and it is
necessary to make a trade-off between
tangible and intangible factors to find the
best suppliers. SSP appears more
complicated when considering the fact
that various criteria must be taken into
account in the decision making process.
It is also a complicated issue that
individual suppliers may have different
performance characteristics for different
criteria. For example, the supplier who
can supply an item for the lowest per
unit price may not have the best quality
or service performance among the
competing suppliers. Supplier selection
is therefore an inherent multi-objective
decision that seeks to minimize
procurement cost and maximize quality
and service performance concurrently.
Most complexity of SSP for the buyer
lays in the price discount offered by
supplier, which depends on the total
value of sales volume, not on the
quantity or variation of products
purchased over a given period of time. In
traditional quantity discount pricing
schedules, price breaks are a function of
the order quantity which existed for each
product, irrespective of the total
purchasing volume over a given period
of time. With the advent of just-in-time
(JIT) purchasing, strategies which call
for ordering smaller lot-size are more
practical and feasible. So suppliers are
finding it more meaningful to give
discounts based on the total value of
multi-product orders (i.e. total business
volume) placed by a given buyer
(Dickson, 1966).
In 1973, model was presented which
focused on applied computer-assisted
supplier selection models in industries
(Moore & Fearon, 1973). Reviewing 74
International Journal on New Computer Architectures and Their Applications (IJNCAA) 2(1): 258-273The Society of Digital Information and Wireless Communications, 2012 (ISSN: 2220-9085)
260

articles, in 1991 a literature on supplier
selection was conducted to identify
price, delivery, quality, facilities,
capacity, geographic location, and
technology capability (Weber & Current
& Benton, 1991).
Further researches in 2001 identified
four stages in supplier selection problem
consisting of problem formulation,
formulation of criteria, qualification and
final selection. In that study was stated
that the majority of authors have focused
on final selection stage (De Boer &
Labro & Morlacchi, 2001). In 2004,
some previously published SSP models
were challenged on a comparative basis
to evaluate their relative efficiency
considering their total cost of ownership
(Degraeve & Labro & Roodhoofi, 2004). Also a model was presented a
framework for assessing the flexibility
of a supply chain including the
flexibility of product delivery system,
production system, product development
and supply system (Pujawan, 2004).
In 2007, more researchers presented
their literatures on purchasing process.
Proposed classification is based on
single and multiple items and periods
(Aissaoui & Haouari & Hassini, 2007).
Some authors not only solve the
supplier selection problem, but also they
determine how much should be
purchased from each selected supplier.
The majority of these papers concerned
themselves with manufacturing
environments. Researchers combined
analytical hierarchy process (AHP) and
linear programming to consider both
tangible and intangible factors in
supplier selection problem (Ghodsypour
& O'Brien, 1998). However, their model
is deterministic and does not consider
uncertainty in human though. In this
paper, we extend their model.
In 2000, was utilized DEA for
evaluating the suppliers and multi-
objective programming for determining
the vendor's order quantity (Weber &
Current & Desai, 2000). Researchers
considered a supply network consisting
of a manufacturer and its suppliers. They
formulated a nonlinear programming
model and determined how much of
each raw material and component part to
order from each supplier with respect to
the capacity of suppliers and the
manufacturer. It is assumed that demand
is stochastic. However, they only
determined order quantity not the
suppliers (Kim & Leung & Taepark &
Zhang & Lee, 2002).
In 2007, was proposed a multi-
objective supplier selection model under
stochastic demand conditions. Stochastic
supplier selection has been determined
with simultaneous consideration of the
cost, quality, delivery and flexibility
according to the limitations of capacity
(Liao & Rittscher, 2007). In the same
year, presented a new method based on
analytical hierarchy process improved by
rough sets theory and multi-objective to
determine the number of suppliers and
the order quantity allocated to these
suppliers. In addition, was considered
discount (Xia & Wu, 2007). More
research scholars optimized Price, lead-
time and rejects (quality) to select the
best vendor in the field of outsourcing.
They applied quantity discount in the
model (Wadhwa & Ravindran, 2007).
In linear weighting models weights
are given to the criteria, the biggest
weight indicating the highest
importance. Ratings on the criteria are
multiplied by their weights and summed
in order to obtain a single figure for each
supplier. The supplier with the highest
overall rating can then be selected. Over
the past 15–20 years a wide variety of
International Journal on New Computer Architectures and Their Applications (IJNCAA) 2(1): 258-273The Society of Digital Information and Wireless Communications, 2012 (ISSN: 2220-9085)
261
slightly different linear weighting
models have been proposed for supplier
selection.
Researchers proposed the use of the
AHP to deal with SSP. In short, AHP
circumvents the difficulty of having to
provide point estimates for criteria
weights as well as performance scores in
the basic linear weighting models.
Instead, using AHP the buyer is only
required to give verbal, qualitative
statements regarding the relative
importance of one criterion versus
another criterion and similarly regarding
the relative preference for one supplier
versus another on a criterion. This
approach is more accurate than the other
scoring methods (Narasimhan, 1983;
Nydick & Hill, 1992; Barbarosoglu &
Yazgac, 1997 ).
Another group of authors has
suggested various statistical techniques
to deal with imprecision while using
linear weighting models. They applied
the so-called “indifference trade-off”
method and principal component
analysis, respectively, for the same
purpose. Although the techniques differ,
they have in common that the buyer does
not need to provide precise numerical
criteria weights directly (Min, 1994;
Petroni & Braglia, 2000 ). However, the
use of these statistical methods will
clearly not be traight forward for most
users and make the process quite
cumbersome.
Finally, a number of authors suggest
to use fuzzy sets theory to model
uncertainty and imprecision in supplier
choice situations. Fuzzy sets theory
offers a mathematically precise way of
modeling vague preferences, for
example, when it comes to setting
weights of performance scores on
criteria. An example in 1999 developed
a model that combines the use of fuzzy
set with AHP and implemented it to
evaluate several suppliers in the
engineering and machine sectors
(Morlacchi, 1999).
In addition, researchers discussed the
application of fuzzy sets theory in
supplier selection (Li & Fun & Hung,
1997; Holt, 1998).
Other researchers presented a new
hybrid method for improving the
usability of SWOT analysis. They
combined SWOT and analytic hierarchy
process (AHP) to provide information
for strategic planning processes (Kurttila
& Pesonen & Kangas & Kajanus, 2000).
In 2006, researchers also suggested the
quantified SWOT analytical method
which was adapted to the concept of
Multiple-Attribute Decision Making.
They used AHP and a multi-layer
scheme to simplify complicated
problems. They performed SWOT
analysis on several enterprises
concurrently (Chang & Huang, 2006). It
is well known that through AHP, the
decision maker is only asked to give
judgments about either the relative
importance of one criterion against
another or its preference of one
candidate on one criterion against
another. However, when the number of
candidates and criteria grows, the
pairwise comparison process becomes
cumbersome, and the risk of generating
inconsistencies grows. In addition, AHP,
like many systems which work based on
pairwise comparisons, can produce
„„rank reversal” results (Dyer, 1990).
Next, proposed analytical network
process (ANP) in a SWOT analysis
(Yuksel & Dag deviren, 2007).
However, the problems of pairwise
comparisons are remained. Then
presented the method what has been
used the SWOT to analyze the current
situation of the suppliers in the
International Journal on New Computer Architectures and Their Applications (IJNCAA) 2(1): 258-273The Society of Digital Information and Wireless Communications, 2012 (ISSN: 2220-9085)
262

competitive market according to
strategic viewpoint (Hassanzadeh Amin
& Razmi & Zhang, 2011).
In this paper, the Knapsack algorithm
has been used to analyze the current
situation of the suppliers in the
competitive market according to
strategic viewpoint.
Supplier selection model
Parameters in the model
Variables in the model
Show that this matrix, each of which suppliers have produced the raw material and what points
are earned according to the algorithm.
Unit price of raw material i. Amount of returns of raw material i. Maximum price of raw materials provided by the supplier s. Amount of raw material i needed to make unit of product j. Predicted value for the product j. Supplier price discount rate s. Desired criteria for supplier selection. d=1,2,…,D
Raw material i=1,2,…,I
Supplier s=1,2,…,S
Criteria for selecting suppliers. j=1,2,…,J
Period T
Storage Capacity Production capacity Production line Production capacity of each production line Supplier value . Producer value vector for supplier selection. Cu
Maximum score considered for supplier selection. M
If then else X
International Journal on New Computer Architectures and Their Applications (IJNCAA) 2(1): 258-273The Society of Digital Information and Wireless Communications, 2012 (ISSN: 2220-9085)
263

Mathematical formulation of supplier
selection model
We consider a company manufacturing a
set of products j. Each product can be
obtained by blending a set of ingredients
i according to certain recipes. Several
recipes r are actually available for any
given product and the company is free to
choose among them. Ingredients are
purchased from a set of suppliers s. Let
us first consider the simplest case, where
the company operates a single plant.
Each supplier s offers a discount
schedule which only depends on the total
quantity of all the ingredients purchased
by the plant over a year. Discount
programs based on the total quantity of
purchases generate discontinuities in the
cost of the purchases from a given
supplier. Since there are several
suppliers, the superposition of the
discount schedules generates an intricate
discontinuous cost surface. Demand
forecasts for each product are available.
The problem is to determine which
recipe(s) should be used for each product
and, simultaneously, which quantity of
each ingredient should be purchased
from each supplier, in order to satisfy
demand.
Step 1:
Research the key factors of internal and
external criteria for supplier selection:
the key factors consist of both benefit
and cost metrics. The academics
collected a list of metrics that have been
utilized frequently in international
scientific journals. These criteria
comprise both qualitative and
quantitative ones. These criteria may be
different for the purchase of raw
materials or standards changes in
different conditions. D vector in this
model represents criteria.
(d = 1,2,3, ..., D)
Step 2:
Determine the weights of qualified
criteria for buyer and each suppliers: B
& W vector to produce the selected
criteria. According to the buyer will
impact how much the selected criteria
for choosing their supplier from 1 to 7
are used to form the vector W.
According to the criteria selected, each
candidate is a supplier of absence from 1
to 7 we use to express these conditions
and form a vector B.
Very Low=1, Low=2, Medium Low=3,
Medium=4, Medium High =5, High=6,
Very High=7
Step 3:
In order to express the criteria for
selection which will be B or W and the
vector which are superior to selection
criteria, for each criterion in the above
Amount of product j produced. Total amount of raw materials purchased from supplier s.
If the material i is supplied by supplier s equals to one, otherwise is zero.
Trade volume with the supplier s. The value obtained by supplier according to criteria d. Total amount of material purchased from supplier s.
International Journal on New Computer Architectures and Their Applications (IJNCAA) 2(1): 258-273The Society of Digital Information and Wireless Communications, 2012 (ISSN: 2220-9085)
264
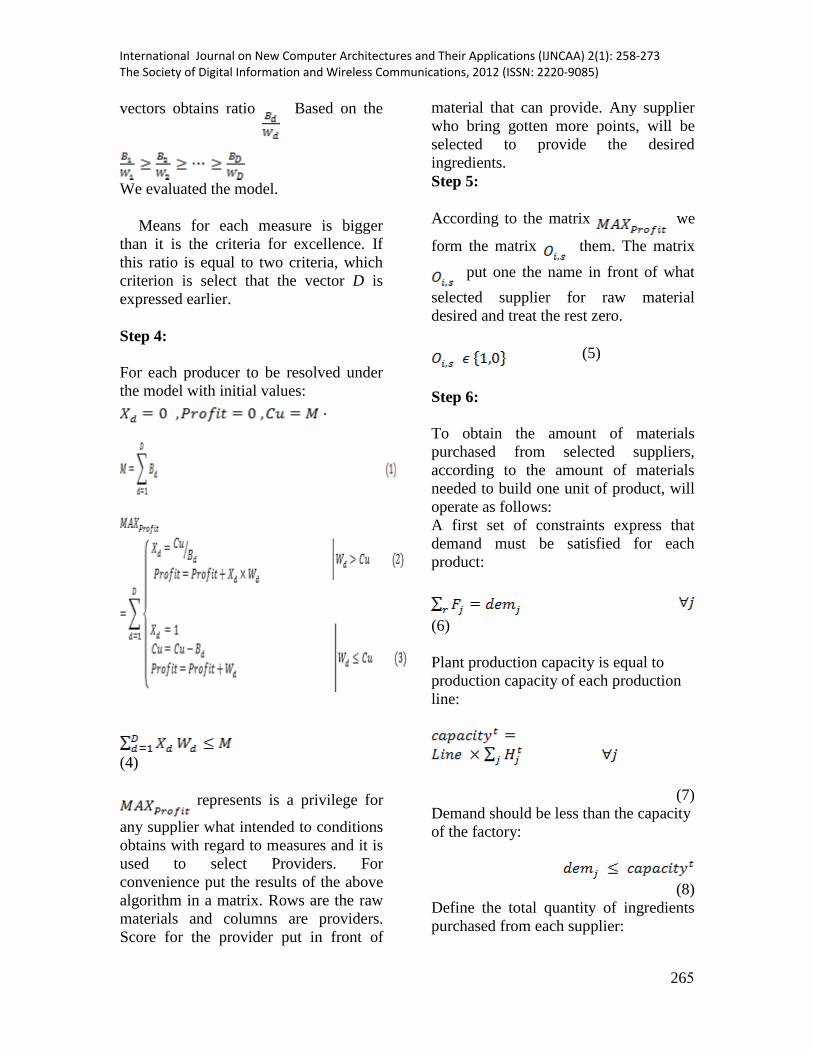
vectors obtains ratio Based on the
We evaluated the model.
Means for each measure is bigger
than it is the criteria for excellence. If
this ratio is equal to two criteria, which
criterion is select that the vector D is
expressed earlier.
Step 4:
For each producer to be resolved under
the model with initial values:
.
(4)
represents is a privilege for
any supplier what intended to conditions
obtains with regard to measures and it is
used to select Providers. For
convenience put the results of the above
algorithm in a matrix. Rows are the raw
materials and columns are providers.
Score for the provider put in front of
material that can provide. Any supplier
who bring gotten more points, will be
selected to provide the desired
ingredients.
Step 5:
According to the matrix we
form the matrix them. The matrix
put one the name in front of what
selected supplier for raw material
desired and treat the rest zero.
(5)
Step 6:
To obtain the amount of materials
purchased from selected suppliers,
according to the amount of materials
needed to build one unit of product, will
operate as follows:
A first set of constraints express that
demand must be satisfied for each
product:
(6)
Plant production capacity is equal to
production capacity of each production
line:
(7)
Demand should be less than the capacity
of the factory:
(8)
Define the total quantity of ingredients
purchased from each supplier:
International Journal on New Computer Architectures and Their Applications (IJNCAA) 2(1): 258-273The Society of Digital Information and Wireless Communications, 2012 (ISSN: 2220-9085)
265
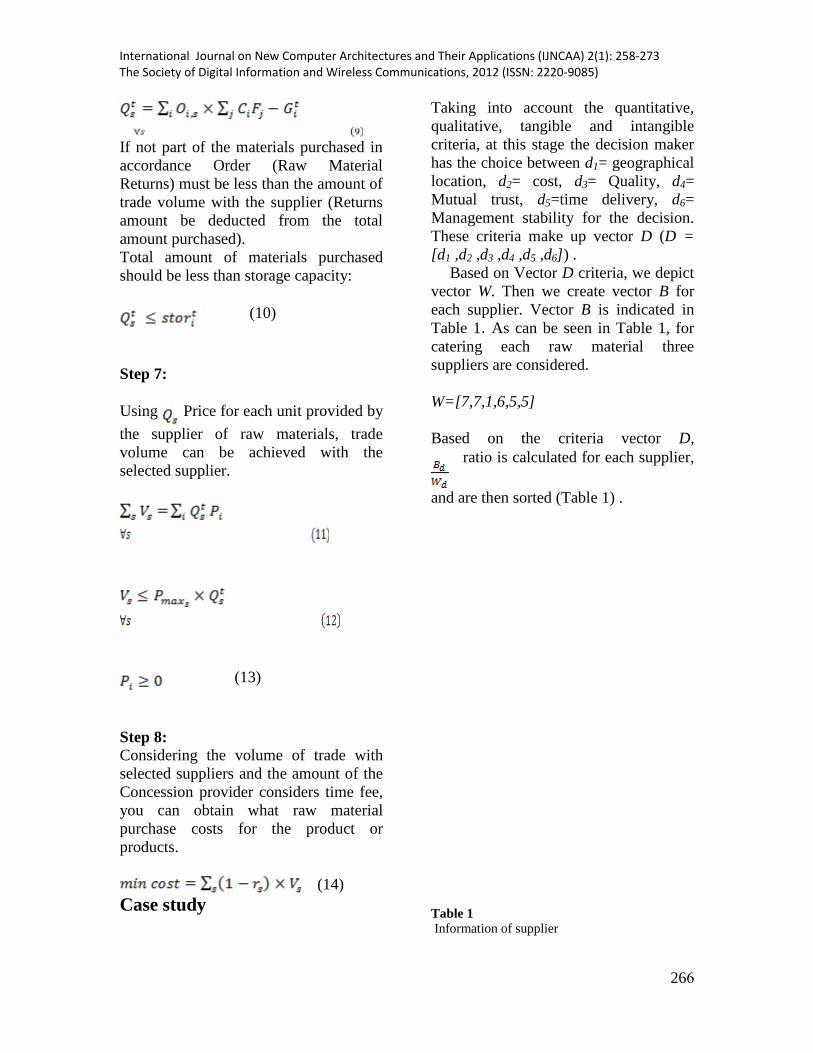
If not part of the materials purchased in
accordance Order (Raw Material
Returns) must be less than the amount of
trade volume with the supplier (Returns
amount be deducted from the total
amount purchased).
Total amount of materials purchased
should be less than storage capacity:
(10)
Step 7:
Using Price for each unit provided by
the supplier of raw materials, trade
volume can be achieved with the
selected supplier.
(13)
Step 8:
Considering the volume of trade with
selected suppliers and the amount of the
Concession provider considers time fee,
you can obtain what raw material
purchase costs for the product or
products.
(14)
Case study
Taking into account the quantitative,
qualitative, tangible and intangible
criteria, at this stage the decision maker
has the choice between d1= geographical
location, d2= cost, d3= Quality, d4=
Mutual trust, d5=time delivery, d6=
Management stability for the decision. These criteria make up vector D (D =
[d1 ,d2 ,d3 ,d4 ,d5 ,d6]) .
Based on Vector D criteria, we depict
vector W. Then we create vector B for
each supplier. Vector B is indicated in
Table 1. As can be seen in Table 1, for
catering each raw material three
suppliers are considered.
W=[7,7,1,6,5,5]
Based on the criteria vector D,
ratio is calculated for each supplier,
and are then sorted (Table 1) .
Table 1
Information of supplier
International Journal on New Computer Architectures and Their Applications (IJNCAA) 2(1): 258-273The Society of Digital Information and Wireless Communications, 2012 (ISSN: 2220-9085)
266
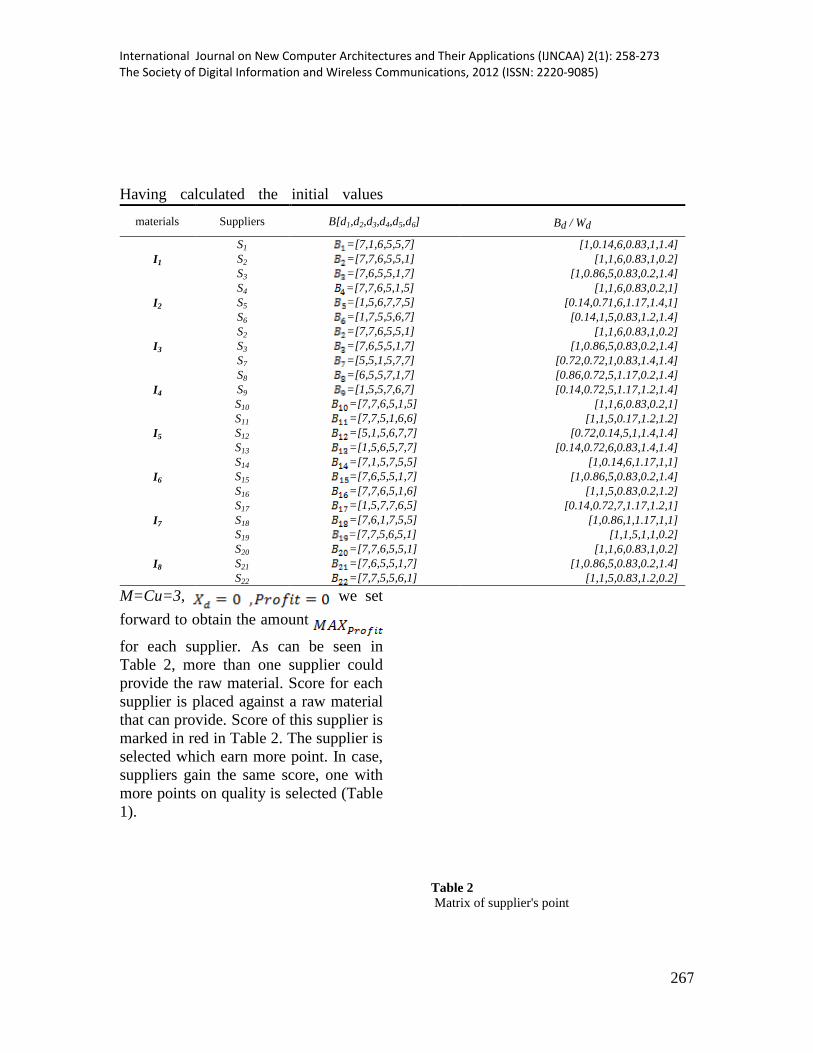
Having calculated the initial values
M=Cu=3, we set
forward to obtain the amount
for each supplier. As can be seen in
Table 2, more than one supplier could
provide the raw material. Score for each
supplier is placed against a raw material
that can provide. Score of this supplier is
marked in red in Table 2. The supplier is
selected which earn more point. In case,
suppliers gain the same score, one with
more points on quality is selected (Table
1).
Table 2
Matrix of supplier's point
Bd / Wd B[d1,d2,d3,d4,d5,d6] Suppliers materials
[1,0.14,6,0.83,1,1.4] =[7,1,6,5,5,7] S1
I1 [1,1,6,0.83,1,0.2] =[7,7,6,5,5,1] S2
[1,0.86,5,0.83,0.2,1.4] =[7,6,5,5,1,7] S3
[1,1,6,0.83,0.2,1] =[7,7,6,5,1,5] S4
I2 [0.14,0.71,6,1.17,1.4,1] =[1,5,6,7,7,5] S5
[0.14,1,5,0.83,1.2,1.4] =[1,7,5,5,6,7] S6
[1,1,6,0.83,1,0.2] =[7,7,6,5,5,1] S2
I3 [1,0.86,5,0.83,0.2,1.4] =[7,6,5,5,1,7] S3
[0.72,0.72,1,0.83,1.4,1.4] =[5,5,1,5,7,7] S7
[0.86,0.72,5,1.17,0.2,1.4] =[6,5,5,7,1,7] S8
I4 [0.14,0.72,5,1.17,1.2,1.4] =[1,5,5,7,6,7] S9
[1,1,6,0.83,0.2,1] =[7,7,6,5,1,5] S10
[1,1,5,0.17,1.2,1.2] =[7,7,5,1,6,6] S11
I5 [0.72,0.14,5,1,1.4,1.4] =[5,1,5,6,7,7] S12
[0.14,0.72,6,0.83,1.4,1.4] =[1,5,6,5,7,7] S13
[1,0.14,6,1.17,1,1] =[7,1,5,7,5,5] S14
I6 [1,0.86,5,0.83,0.2,1.4] =[7,6,5,5,1,7] S15
[1,1,5,0.83,0.2,1.2] =[7,7,6,5,1,6] S16
[0.14,0.72,7,1.17,1.2,1] =[1,5,7,7,6,5] S17
I7 [1,0.86,1,1.17,1,1] =[7,6,1,7,5,5] S18
[1,1,5,1,1,0.2] =[7,7,5,6,5,1] S19
[1,1,6,0.83,1,0.2] =[7,7,6,5,5,1] S20
I8 [1,0.86,5,0.83,0.2,1.4] =[7,6,5,5,1,7] S21
[1,1,5,0.83,1.2,0.2] =[7,7,5,5,6,1] S22
International Journal on New Computer Architectures and Their Applications (IJNCAA) 2(1): 258-273The Society of Digital Information and Wireless Communications, 2012 (ISSN: 2220-9085)
267

We put =1 against the raw material
and the selected supplier in Table 2
(Table 3).
In this case study all purchases are
assumed in cash ( and returns on
material is zero ( ) . Production
value has been investigated in one month
period (t=30).
For product A :
meter
For product B : meter
The total amount of fees paid is Min
cost=162,023,500 Rials(1$ U.S =
10,454 Rials) for product A and product
B (Table 4). Table 3 Matrix of supplier selection
I8 I7 I6 I5 I4 I3 I2 I1 MAX profit
0 0 0 0 0 0 0 29 S1
0 0 0 0 0 31 0 31 S2
0 0 0 0 0 31 0 31 S3
0 0 0 0 0 0 31 0 S4
0 0 0 0 0 0 25.4 0 S5
0 0 0 0 0 0 31 0 S6
0 0 0 0 0 31 0 0 S7
0 0 0 0 27.4 0 0 0 S8
0 0 0 0 25.4 0 0 0 S9
0 0 0 0 31 0 0 0 S10
0 0 0 31 0 0 0 0 S11
0 0 0 25.4 0 0 0 0 S12
0 0 0 25.4 0 0 0 0 S13
0 0 31 0 0 0 0 0 S14
0 0 31 0 0 0 0 0 S15
0 0 31 0 0 0 0 0 S16
0 25.4 0 0 0 0 0 0 S17
0 31 0 0 0 0 0 0 S18
0 31 0 0 0 0 0 0 S19
36 0 0 0 0 0 0 0 S20
35 0 0 0 0 0 0 0 S21
31 0 0 0 0 0 0 0 S22
International Journal on New Computer Architectures and Their Applications (IJNCAA) 2(1): 258-273The Society of Digital Information and Wireless Communications, 2012 (ISSN: 2220-9085)
268

Table 4 Production Information (kg / Rials)
As shown in Figure 1 if the two
providers obtain same scores, one with
more points on quality is selected.
I8 I7 I6 I5 I4 I3 I2 I1 Oi,s
0 0 0 0 0 0 0 0 S1 0 0 0 0 0 1 0 1 S2 0 0 0 0 0 0 0 0 S3 0 0 0 0 0 0 1 0 S4 0 0 0 0 0 0 0 0 S5 0 0 0 0 0 0 0 0 S6 0 0 0 0 0 0 0 0 S7 0 0 0 0 0 0 0 0 S8 0 0 0 0 0 0 0 0 S9 0 0 0 0 1 0 0 0 S10 0 0 0 1 0 0 0 0 S11 0 0 0 0 0 0 0 0 S12 0 0 0 0 0 0 0 0 S13 0 0 0 0 0 0 0 0 S14
0 0 0 0 0 0 0 0 S15 0 0 1 0 0 0 0 0 S16 0 0 0 0 0 0 0 0 S17 0 0 0 0 0 0 0 0 S18 0 1 0 0 0 0 0 0 S19 0 0 0 0 0 0 0 0 S20 0 0 0 0 0 0 0 0 S21 1 0 0 0 0 0 0 0 S22
materials Maximum production Product A
Product B
Q ts Pi V
ts
I1 300000m/24 h 288.5 29 317.5 2,000 635,000
I2 5000kg/24h 865.5 57 922.5 18,500 17,066,250
I3 40000 kg/24h 865.5 0 865.5 46,500 40,245,750
I4 1000000kg/24h 15002 1508 16510 5,350 88,328,500
I5 100000kg/24h 1442.5 145 1587.5 400 635,000
I6 20000kg/24h 1731 174 1905 4,000 7620,000
I7 20000kg/24h 1154 116 1270 1,100 1,397,000
I8 20000kg/24h 1731 174 1905 3,200 6,096,000
Min cost 162,023,500
International Journal on New Computer Architectures and Their Applications (IJNCAA) 2(1): 258-273The Society of Digital Information and Wireless Communications, 2012 (ISSN: 2220-9085)
269
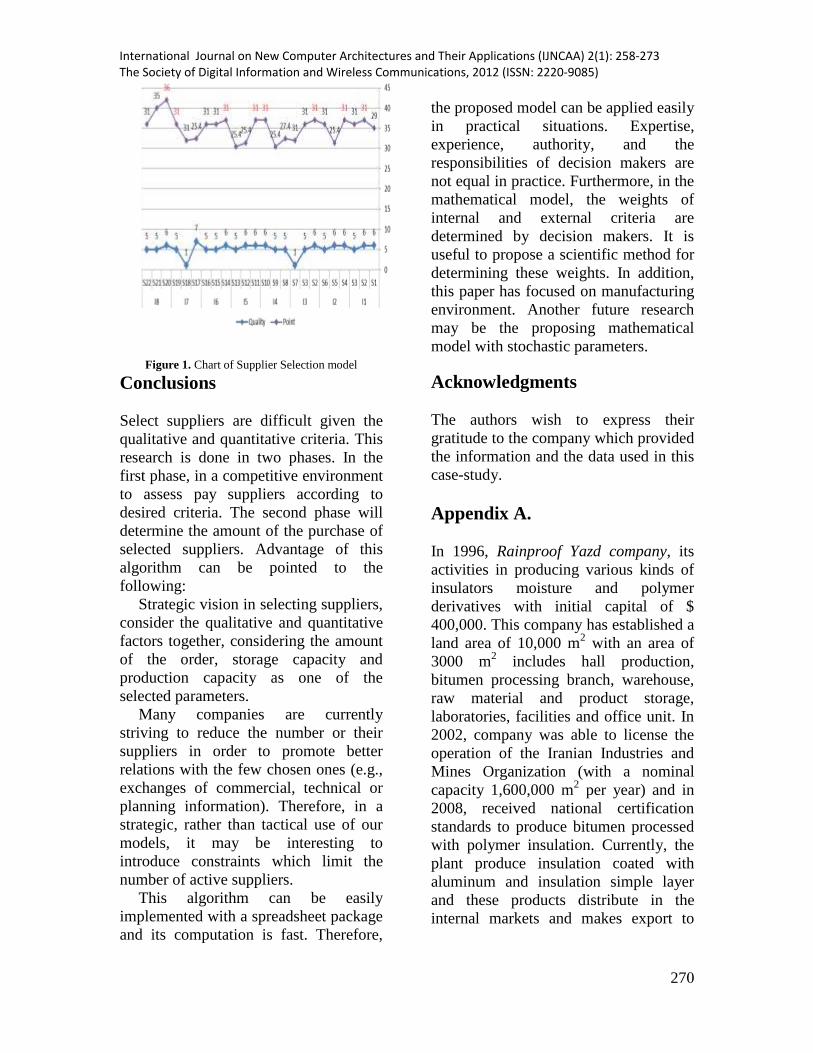
Figure 1. Chart of Supplier Selection model
Conclusions Select suppliers are difficult given the
qualitative and quantitative criteria. This
research is done in two phases. In the
first phase, in a competitive environment
to assess pay suppliers according to
desired criteria. The second phase will
determine the amount of the purchase of
selected suppliers. Advantage of this
algorithm can be pointed to the
following:
Strategic vision in selecting suppliers,
consider the qualitative and quantitative
factors together, considering the amount
of the order, storage capacity and
production capacity as one of the
selected parameters.
Many companies are currently
striving to reduce the number or their
suppliers in order to promote better
relations with the few chosen ones (e.g.,
exchanges of commercial, technical or
planning information). Therefore, in a
strategic, rather than tactical use of our
models, it may be interesting to
introduce constraints which limit the
number of active suppliers.
This algorithm can be easily
implemented with a spreadsheet package
and its computation is fast. Therefore,
the proposed model can be applied easily
in practical situations. Expertise,
experience, authority, and the
responsibilities of decision makers are
not equal in practice. Furthermore, in the
mathematical model, the weights of
internal and external criteria are
determined by decision makers. It is
useful to propose a scientific method for
determining these weights. In addition,
this paper has focused on manufacturing
environment. Another future research
may be the proposing mathematical
model with stochastic parameters.
Acknowledgments
The authors wish to express their
gratitude to the company which provided
the information and the data used in this
case-study.
Appendix A.
In 1996, Rainproof Yazd company, its
activities in producing various kinds of
insulators moisture and polymer
derivatives with initial capital of $
400,000. This company has established a
land area of 10,000 m2 with an area of
3000 m2 includes hall production,
bitumen processing branch, warehouse,
raw material and product storage,
laboratories, facilities and office unit. In
2002, company was able to license the
operation of the Iranian Industries and
Mines Organization (with a nominal
capacity 1,600,000 m2 per year) and in
2008, received national certification
standards to produce bitumen processed
with polymer insulation. Currently, the
plant produce insulation coated with
aluminum and insulation simple layer
and these products distribute in the
internal markets and makes export to
International Journal on New Computer Architectures and Their Applications (IJNCAA) 2(1): 258-273The Society of Digital Information and Wireless Communications, 2012 (ISSN: 2220-9085)
270

international markets (more than 5
countries).
The products are produced the base
modified bitumen with APP polymer
and substrate needle nonwoven polyester
and pull the tissue. The polymer bitumen
will provide opportunity to the weather
conditions that manufactured proper
insulation with the desired
characteristics. The use of quality
materials and experienced technical staff
what is taking advantage of the
company's products provide the
following unique features:
High flexibility
Resistant to heat and cold
Be installed on surfaces with
different coatings
Resistant to expansion and
contraction of longitudinal and
transverse
Style and beauty
The company, based on the quality of its
products and the trust of their customers
for several years, moisture insulators
provides to the 15-year warranty and a
valid insurance policy.
Layer of aluminum on the moisture
barrier in addition to beauty what will
increase resistance insulation to heat.
Also, this coating, with increasing the
reflection coefficient levels of insulation,
will prevent direct sunlight from the
surface of the insulator and connected to
it. These factors, in addition to saving
energy will increase the life of a
moisture barrier. Use this product is
recommended, in the roofs, residential
environments and liquid storage tanks.
Powder insulating are presented both
sides of the plastic or powder. According
to tarry both contact surface, the
insulation has considerable strength. Use
powder insulating recommended in
roofs, pools, greenhouses, bathrooms,
below mosaic and sidewalks.
The company's products can be used in
the following cases:
Roofs
Metal and wood surfaces
Below mosaic and ceramic
Foundation
Steep surfaces
Bathroom
Restoration of surfaces
Greenhouses
Surface roughness
Bridges, tunnels and pools
Curved surfaces
References
Accenture Consulting,(2005). Supply
chain mastery in the global marketplace.
In: 16th
POMS annual conference,
Chicago .
Aissaoui, N., Haouari, M., & Hassini, E.
(2007). Supplier selection and order lot
sizing modeling: A review. Computers
& operations research, 34(12), 3516–
3540.
Barbarosoglu G, Yazgac T (1997). An
application of the analytic hierarchy
process to the supplier selection
problem. Production and Inventory
Management Journal[1st quarter], 14–
21.
Camperi F. (2005). The hidden value
and complexities of outsourcing.
Mortgage banking;65(8),123–4 .
Chang, H. H., & Huang, W. C. (2006).
Application of a quantification SWOT
analytical method. Mathematical and
Computer Modeling, 43(1–2), 158–169.
International Journal on New Computer Architectures and Their Applications (IJNCAA) 2(1): 258-273The Society of Digital Information and Wireless Communications, 2012 (ISSN: 2220-9085)
271

De Boer, L., Labro, E., & Morlacchi, P.
(2001). A review of methods supporting
supplier selection. European journal of
purchasing and supply management,
7(2), 75–89.
Degraeve, Z., Labro, E., & Roodhoofi,
F. (2004). Total cost of ownership
purchasing of a service: The case of
airline selection at Alcatel Bell.
European journal of operational
research, 156(1), 23–40.
Dickson, G. W. (1966). An analysis of
vendor selection system and decisions.
Journal of purchasing, 2(1), 28–41.
Dyer, J. S. (1990). Remarks on the
analytic hierarchy process. Management
Science, 36(3), 249–258.
Ghodsypour, S. H., & O‟Brien, C.
(1998). A decision support system for
supplier selection using an integrated
analytic hierarchy process and linear
programming. International journal of
production economics, 199–212.
Holt GD. (1998). Which contractor
selection methodology? International
Journal of Project Management,
16(3),153–64.
Kim, B., Leung, J. M. Y., Taepark, K.,
Zhang, G., & Lee, S. (2002).
Configuring a manufacturing firm‟s
supply network with multiple suppliers.
IIE transactions, 34(8), 663–677.
Kurttila, M., Pesonen, M., Kangas, J., &
Kajanus, M. (2000). Utilizing the
analytic hierarchy process (AHP) in
SWOT analysis – A hybrid method and
its application to a forest-certification
case. Forest Policy and Economics, 1(1),
41–52.
Li CC, Fun YP, Hung JS. (1997). A new
measure for supplier performance
evaluation. IIE Transactions on
Operations Engineering, 29, 753–8.
Liao, Z., Rittscher, J. (2007). A multi-
objective supplier selection model under
stochastic demand conditions.
International journal of production
economics, 105(1), 150–159.
Linder JG. (2004). Outsourcing for
radical change. A bold approach to
enterprise transformation. NewYork:
AMACOM .
Liu, F. H. F., & Hai, H. L. (2005). The
voting analytic hierarchy process method
for selecting supplier. International
journal of production economics, 97(3),
308–317.
Min H. (1994). International supplier
selection: a multi-attribute utility
approach. International Journal of
Physical Distribution & Logistics
Management,24(5),24–33.
Moore, D. L., & Fearon, H. E. (1973).
Computer-assisted decision-making in
purchasing. Journal of purchasing, 9(1),
5–25.
Morlacchi P.Vendor (1999). Evaluation
and selection: the design process and a
fuzzy–hierarchical model. Paper
presented at the Proceedings of eighth
IPSERA conference, Dublin.
Narasimhan R (1983). An analytic
approach to supplier selection. Journal
of Purchasing and Supply
Management,1, 27–32.
International Journal on New Computer Architectures and Their Applications (IJNCAA) 2(1): 258-273The Society of Digital Information and Wireless Communications, 2012 (ISSN: 2220-9085)
272

Nydick RL, Hill RP (1992). Using the
analytic hierarchy process to structure
the supplier selection procedure.
International Journal of Purchasing and
Materials Management, 28(2),31–6.
Petroni A, Braglia M. (2000). Vendor
selection using principal component
analysis. The Journal of Supply Chain
Management:A Global Review of
Purchasing and Supply,36(2), 63–9.
Pujawan, N. (2004). Assessing supply
chain flexibility: a conceptual
framework and case study. International
journal of integrated supply
management 1 (1), 79–97.
Hassanzadeh A. S., Razmi J., Zhang
G.(2011). Supplier selection and order
allocation based on fuzzy SWOT
analysis and fuzzy linear programming.
Expert Systems with Applications 38,
334-342.
Wadhwa, V., Ravindran, R . (2007).
Vendor selection in outsourcing.
Computers and operations research,
34(12), 3725–3737.
Weber, C. A., Current, J. R., & Benton,
W. C. (1991). Vendor selection criteria
and methods. European journal of
operational research, 50(1), 2–18.
Weber, C. A., Current, J. R., & Desai, A.
(2000). An optimization approach to
determining the number of vendors to
employ. Supply chain management: An
international journal, 5(2), 90–98.
Xia, W., & Wu, Z. (2007). Supplier
selection with multiple criteria in
volume discount environments. Omega,
35(5), 494–504.
Yuksel, I., & Dag deviren, M. (2007).
Using the analytic network process
(ANP) in a SWOT analysis – A case
study for a textile firm. Information
Sciences, 177(16), 3364–3382.
International Journal on New Computer Architectures and Their Applications (IJNCAA) 2(1): 258-273The Society of Digital Information and Wireless Communications, 2012 (ISSN: 2220-9085)
273
Copyright © 2022 FDOKUMEN