ORESTE METHOD IN MULTI CRITERIA DECISION MAKING AND PERSONNEL SELECTION APPLICATION
Upload
khangminh22Category
view
4download
0
Int. J. Business Excellence, Vol. 16, No. 3, 2018 341
Copyright © 2018 Inderscience Enterprises Ltd.
Evaluating international market selection with multi-criteria decision making tools – a case study of a metal company in Indonesia
Elia Oey*, Noviyanti and Sanny Lim International Business and Management, School of Business and Management, Bina Nusantara University, Jl. Jalur Sutera Barat Kav. 21, Alam Sutera, Tangerang, Banten, Indonesia Email: [email protected] Email: [email protected] Email: [email protected] *Corresponding author Abstract: With the era of globalisation, firms have the opportunity to expand their operations beyond the country’s boundary. Expanding business to an international market can give firms benefits such as economic of scale leading to cheaper cost, higher asset utilisation, as well as knowledge to international exposure. However, entering international market also poses its own challenges and risks. To make a sound business decision, firms wish to enter international market need to do a proper analysis and evaluation. The study is based on a case of a medium-size Indonesia company that wishes to export its metal-derivatives products to the international market. The study used a systematic international market selection (IMS) approach using a combination of analytical hierarchical process (AHP) and goal programming (GP). It chose 12 (sub) criteria, representing generic and product-related considerations. Based on the preliminary screening, it narrowed down the alternatives to 15 countries, and using the combination of AHP-GP recommended three countries to enter.
Keywords: multi-criteria decision making; MCDM; goal programming; analytical hierarchical process; AHP; international market selection; IMS; Indonesia.
Reference to this paper should be made as follows: Oey, E., Noviyanti and Lim, S. (2018) ‘Evaluating international market selection with multi-criteria decision making tools – a case study of a metal company in Indonesia’, Int. J. Business Excellence, Vol. 16, No. 3, pp.341–361.
Biographical notes: Elia Oey is a faculty member at the International Business and Management, Bina Nusantara (Binus) University. She was a supply chain practitioner prior to joining the Binus University. Her research areas are operation management, (Global) supply chain management, and cross cultural management.
Noviyanti was an undergraduate student at the International Business and Management, Bina Nusantara University. She was in her final year and was doing her thesis for Bachelor degree during this research.
Sanny Lim is the Head of Program of International Business and Management at the Bina Nusantara (Binus) University. Her research areas are strategic management, operation management, and small and medium enterprise development.

342 E. Oey et al.
1 Introduction
With the era of globalisation, firms nowadays can expand its operation beyond its national border. However, starting their operation in foreign soil is a complex and complicated process. Before deciding to export, companies must weigh benefits and consequences in order to make it a success (Górecka and Szałucka, 2013).
Before conducting international market selection (IMS) study, companies must answer some basic questions such as: clear reason why they want to enter into international business; define suitable product(s) to be delivered to foreign market; determine products’ distinct features in terms of price, quality and other characteristics and verify whether they are still unique in non-domestic market; consider global product life cycle as well as scope and cost of selling the product to foreign market; and lastly to identify the target export market. The whole process is known as IMS (Root, 1998).
Selecting which foreign market to enter is a crucial decision in international market entry strategy. Prior to decide how to enter a market, companies need to decide which ones to enter from a broad range of available foreign markets. The domestic market most also likely different in term of market size, market potential, socio and cultural differences, or political and economic stability. The diversity and complexities in the process is huge, making the IMS a complicated process that must be well planned. (Górecka and Szałucka, 2013).
Despite its challenge, companies still see international business as a compelling opportunity. By expanding to the export market, companies can also leverage its operation by acquiring economic of scale in its production, expand its brand image, acquire international exposure and skills, etc. (Heizer and Render, 2014).
The trend of international business mainly occurs in developing countries where the labor cost is still competitive and added value to the products are possible for its export markets, such as in Indonesia. Indonesia also has a potential domestic market with about 250 million. Population and promising growth driven by its population’s consumption. To complement its domestic operation, many companies in Indonesia seek to expand their business by exporting. Table 1 shows the evolution of non-oil related export of Indonesia from 2009–2013, with medium-size enterprises have enjoyed a healthy growth.
The research is a case study of a medium-size firm in Indonesia producing metal derivatives products. The products are made from aluminium or steel and ranging from retail products like kitchen’s metal appliances to materials used in construction projects such as perforated metal façade. Having a stable demand domestically and excess production capacity at home, the company was evaluating to enter export markets. The objective of the research is to assist the studied company to perform a sound IMS analysis and give recommendation which market(s) to enter. The conducted IMS take into account the peculiarity of metal industry and Indonesia as its host country. The analysis used a combination approach of Spies et al. (2014) and Górecka and Szałucka (2013) when selecting the (sub) criteria and Hortacsu and Tektas (2009) in final calculation stage.

Evaluating international market selection with multi-criteria decision 343
Table 1 Indonesia non-oil related export 2009–2013 (see online version for colours)
Valu
e G
row
th
Non
-oil
rela
ted
expo
rt
2009
20
10
2011
20
12
2013
20
10
2011
20
12
2013
Mic
ro
ente
rpris
e 14
,375
2%
16
,688
1%
17
,249
2%
15
,235
1%
15
,990
1%
16
%
3%
–12%
5%
Smal
l en
terp
rise
36,8
40
4%
38,0
01
3%
39,3
12
3%
32,5
09
3%
32,0
52
3%
3%
3%
–17%
–1
%
Med
ium
en
terp
rise
111,
040
12%
12
1,20
6 11
%
130,
881
11%
11
8,88
2 10
%
134,
071
12%
9%
8%
–9
%
13%
Big
ent
erpr
ise
790,
835
83%
93
6,82
5 84
%
953,
009
84%
1,
018,
765
86%
97
9,21
5 84
%
18%
2%
7%
–4
%
Tota
l 95
3,90
9 10
0%
1,11
2,72
0 10
0%
1,14
0,45
1 10
0%
1,18
5,39
2 10
0%
1,16
1,32
8 10
0%
17%
2%
4%
–2
%
Sour
ce:
http
://w
ww
.dep
kop.
go.id

344 E. Oey et al.
2 Literature review
2.1 Importance of IMS
A lot of research has been performed in the area of IMS such as by Papadopoulos and Denis (1988), Russow and Okoroafo (1996) Papadopoulos et al. (2002), Shankarmahesh et al. (2005) and Sakarya et al. (2007). As entering the new international market can be risky and costly, companies usually allocate their resources to enter only to the most attractive and limited export opportunities (Papadopoulos and Denis, 1988). The challenge in entering international market lies in IMS and previous literatures have indicated poor market selection as the main reason for export failure (Rahman, 2003).
The analysis in IMS can be done qualitative or quantitatively, with each approach elaborated using different models (Papadopoulos and Denis, 1988). Andersen and Buvik (2002) as restated by Jansen (2013) mentioned that there are three ways to perform IMS, namely:
1 A systematic approach, where analysis is done by formalised decision process based on factors and their weighing. This approach searches extensive secondary data to get information related to country-market and uses this information to compute optimal decision that can bring competitive advantage to the company.
2 A non-systematic approach which is commonly done based on experiential knowledge of the company and the people involved in IMS decision. This approach usually focuses on geographical markets and international entry modes (Rask et al., 2008). In the analysis, the company generally performs little or no information search, and relies on perceived psychic distance, which has been defined as “factors preventing or disturbing the flow of information between firms and the market...” (Johanson and Vahlne,1977).
3 A relationship approach which uses the foreign customer as the unit of analysis and focuses on the collaboration between the two parties in making the IMS decision.
Table 2 Some of IMS models
IMS models Researchers
Koch (2001), Kumar et al. (1994) and Root (1998).
Johansson (1997)
Cuyvers (1996), Cuyvers (2004), Pearson et al. (2007), Steenkamp
et al. (2009) and Spies et al. (2014)
• 3 Steps IMS: preliminary screening ⇒ estimating industry market potential ⇒ estimating company sales potential ⇒ choose the market
• 4 Steps IMS: country identification ⇒ preliminary screening ⇒ in-depth screening ⇒ final selection ⇒ choose the market
• Decision support model for IMS using four-step filtering process. The results give market accessibility index per product and indication of growth prospect related to each product-market combination.
• Integrated IMS with a combination of scientific literature analysis, synthesis and comparative analysis, generalisation and expert survey.
Miečinskienė et al. (2014)

Evaluating international market selection with multi-criteria decision 345
There were several models in performing analysis, Table 2 gives some previous studies addressing IMS model.
In a nutshell, IMS is a sequential processes where each phase is a filtering mechanism to eliminate the less attractive markets and aiming at giving a set of prospective markets as deliverables (Górecka and Szałucka, 2013). A systematic approach in IMS is important as it evaluates different aspects and information from different markets and filters those that only relevant. In summary, most of the IMS models consists of three stages (Koch, 2001; Kumar et al., 1994; Root, 1998):
• Preliminary screening. At this stage typically macro-level indicators are assessed to eliminate countries that do not meet the required objectives.
• In-depth screening. At this stage, industry-specific data, e.g., market size and growth, of the potential market from the previous phase are evaluated.
• Final selection. At this stage, firm-specific information is evaluated such as projected profitability, revenue and cost forecast and the like.
A systematic approach in IMS helps researchers to minimise two possible errors, namely: ignoring the prospective countries and spending too much time investigating poor prospects (Root, 1998). Root also suggested in the preliminary screening firms need to identify potential country regardless the entry mode, although some researchers’ think it should be regarded as one decision (Koch, 2001). Albaum and Duerr (2008) distinguished selection of foreign market into two: based on similarities (expansive approach) or by systematic screening from all the possible markets (contractible approach). In general, company adopting a systematic IMS can bring a more efficient international trade practices and enjoys a more rapid export growth than those which limits to only a few alternatives (Cooper and Kleinschmidt, 1985).
To start preliminary screening is a challenge in itself, as data collection and mining can be tedious and overwhelming. To keep the process simple, low-cost yet flexible, most models used macro perspective by focusing on general country indicators (Cavusgil et al., 2004; Papadopoulos et al., 2002). Another possible approach is by using strategic framework like politics, economic, social, and technology (PEST) or politics, economic, social, technology and infrastructure (PESTI) (Nganga, 2015). Some models included industry- or product-specific approach (Douglas et al., 1982; Root, 1998; Whitelock and Jobber, 2004; Sakarya et al., 2007; Kumar et al., 1994).
Nevertheless, there is no unique method of IMS, as each company should adapt the models for its case and context. In general, few stages can be different for each company but initial and final stage are typically common. (Miečinskienė et al., 2014)
With the emergence of small and medium enterprise (SME), especially in developing countries, IMS is also spread and needed by SME. (Musso and Francioni, 2012) did a research on how small firms conduct their IMS, and investigated the primary factors influencing SMEs’ choice when performing IMS. Their results suggested that there is a relationship between systematic IMS and firm size, and that SMEs are typically influenced by firm-specific and host country factor.
However, not like multinational firms, the majority of SME do not use a systematic IMS as they have difficulties in recognising the importance of a systematic approach in IMS (Lee and Brasch, 1978; Ellis, 2000; Francioni, 2012; Musso and Francioni, 2012). To SME, decisions to export can be very risky and influences the sustainability of the

346 E. Oey et al.
companies. Hence, which foreign market to expand to is a very crucial decision to SME (Ellis, 2000; Agndal and Chetty, 2007; Sakarya et al., 2007; He and Wei, 2011). Despite the importance of IMS and its growing necessity for SME, most research related to IMS has occurred to large companies (Douglas and Craig, 1992; Cavusgil and Zou, 1994; Makino et al., 2002) and only few studies were done on Smaller firms. (Brouthers and Nakos, 2005; Francioni, 2012)
2.2 Multi-criteria decision making (in IMS)
Multi-criteria decision making (MCDM) is a methodology commonly used in applications where decision makers try to satisfied selection of alternatives under multi-criteria consideration. A lot of MCDM techniques have been developed and used in real life application due to its relevance and strength.
The simplest yet classical MCDM technique is analytical hierarchical process (AHP) first introduced by Saaty in the1980s (Saaty, 2008). In its progress, research nowadays combines AHP with other MCDM techniques to enhance the result, e.g., by combining with technique for order preference by similarity to an ideal solution (TOPSIS) (Bhutia and Phipon, 2012; Oey and Nitihardjo, 2016; Mansor et al., 2014).
The Second common tool accompanying AHP in application is goal programming (GP). GP is one of the oldest MCDM tool used to optimise multiple objectives by minimising the deviation of each objective from the desired target. For a single goal or objective, the GP problem then becomes a linear programming (LP) model. While in certain constraints LP can give infeasible solutions, GP is superior as it still gives a satisfying solution. The steps in developing a GP models are similar to LP. The main difference between the two is while LP maximises or minimises a single objective, GP minimises the deviations between the target values of the objectives and the realised results (Orumie and Ebong, 2014).
While AHP is considered as multi-attribute decision making (MADM), GP is a multi-objective decision making (MODM) tool. Combining the AHP and GP brings a balance between the two sub-sets of MCDM and give more objectivity on the result. Several studies using combination of AHP and GP in IMS has been done in the past using different criteria as consideration as a result of product or host country specifics.
With the merit and relevance of MCDM in IMS process, previous studies have been performed using these techniques, amongst many are:
• Górecka and Szałucka (2013) applied and evaluated few MCDA methods based on outranking mechanism using Exprom II with veto threshold. They identified 15 selected variables for considerations covering economic, cultural, social and political aspect to assess market’s attractiveness. They then used Promethee II and Electre III methods, in order to get sensitivity and robustness analysis.
• Sener (2014) evaluated new market selection for a Turkish porcelain company using AHP assessing eight main criteria namely operating assets, communication infrastructure of the target market, economic growth rate, proximity to other markets, competitive advantage in the target market, demand, the functioning of the legal system and trade agreements with the target market-exemption.
• Hortacsu and Tektas (2009) developed a model of IMS for assisting an international retailer in selecting which country to enter. They used a combination of AHP and GP

Evaluating international market selection with multi-criteria decision 347
method in solving the case. However, the criteria are quite a high level ones involving ethical, cultural, geographic and economic proximity.
3 Methodology
The steps of this research can be grouped into three main areas as indicated in Figure 1 framework of thinking, i.e.:
• In the preliminary screening, extensive literature review was conducted in order to gain insights on previous studies on IMS. Based on that, relevant criteria and sub-criteria to the case were selected. Once sub-criteria selected, it was followed by searching and collecting the relevant secondary data from the internet. The process was iterative, as some of the sub-criteria do not have data or even proxy data available for the majority of the countries. The result of this stage was the decision tree upon which AHP process will be done and the list of prospective countries to be assessed.
• In the AHP groups, the weight of each of the criteria and sub-criteria were calculated. It was done based on questionnaires sent to three stakeholders in the company. The result of this stage was the geo-mean of global weights of each sub-criterion
• In this last stage, the GP model was constructed. The generic GP model is as following:
Determine X = (x1, x2, x3, …, xi … xn)
( ) ( )1
Min , ,i i ii ii
Z f d d P d d+ − + −
=
= =∑ (1)
Subject to
1
1, ...,n
ij j i iij
a x d d i n− +
=
+ − = =∑ α (2)
1
1, ...,n
i ij
x r j n=
≤ =∑ (3)
where
xj mean value of variable j
, iid d+ − under and over deviations of variable i from target value
Pi priority weight of deviational variables of the ith goal
aij jth technical coefficient value for the ith goal
αi target value for the ith goal
ri upper limit of the ith resource.

348 E. Oey et al.
The GP model aims to minimise the sum of deviations (di) from each goal (Gi). Each goal is assigned a priority weight (Pi) that shows its relative importance. The constraint (2) reflects the objectives set by decision makers, while constraint (3) represent the availability of upper/lower limit of resources.
Figure 1 Framework of thinking (see online version for colours)
Preliminary Screening GP AHP
The GP model was solved using Microsoft excel solver. In each run, the most favourable country was chosen. The model then re-ran by eliminating the variables related to the already chosen country. From this model, three most favourable countries were chosen.
4 Analysis and discussion
4.1 Sub-criteria and reasoning
For criteria, it was decided to have four groups relevant for typical IMS, namely strategic, marketing, supply chain and risk considerations. Some of the sub-criteria used data or indicators that consider relevant for exporting metal product such as those intended by the studied company. As the product will be related to the construction industry, ‘construction spending’ is chosen as one of sub-criteria. The company also have some retail product, and therefore ‘population growth of high and middle class’ was also chosen as sub-criteria to give an indication of usage of metal appliances in the middle-class household. The reasoning and data source of all the chosen sub criteria can be seen in Table 3.

Evaluating international market selection with multi-criteria decision 349
Table 3 Sub-criteria, indicators, reasoning and data sources
Cri
teri
a Su
b-cr
iteri
a In
dica
tors
Re
ason
D
ata
sour
ce
Mar
ket v
alue
G
DP
per c
apita
(USD
) A
ccor
ding
to st
eelo
nthe
net.c
om, c
ount
ries w
ith h
igh
leve
l of i
ncom
e pe
r cap
ita ra
ther
to h
ave
low
stee
l con
sum
ptio
n as
an
effe
ct o
f no
mor
e in
fras
truct
ure
are
built
in d
evel
oped
cou
ntrie
s. ht
tp://
data
.wor
ldba
nk.o
rg/in
dica
tor/N
Y.
GD
P.PC
AP.
CD
Ec
onom
ic
grow
th
GD
P gr
owth
(%)
The
grow
th o
f GD
P im
pact
s to
the
incr
ease
long
-term
inve
stm
ent s
uch
as p
urch
asin
g pr
oper
ty
(http
://m
arke
treal
ist.c
om, 2
014)
. ht
tp://
data
.wor
ldba
nk.o
rg/in
dica
tor/N
Y.
GD
P.M
KTP
.KD
.ZG
Stra
tegi
c
Con
sum
ptio
n gr
owth
In
tere
st ra
te (%
) St
eel p
rodu
cers
and
pro
cess
ors a
re b
enef
ited
from
the
decr
ease
of i
nter
est r
ate
perc
enta
ge a
s th
ey n
eed
borr
owin
gs fo
r cap
ital.
Mar
kets
are
eag
er to
inve
st in
buy
ing
auto
mot
ive
and
real
es
tate
as t
he in
tere
st ra
te d
ecre
ases
(EY
Glo
bal S
teel
Out
look
201
4–20
16).
http
://da
ta.w
orld
bank
.org
/indi
cato
r/FR
.IN
R.R
INR
Con
stru
ctio
n in
dust
ry
grow
th
Con
stru
ctio
n sp
endi
ng
(Bill
ion
USD
) B
ased
on
EY G
loba
l Out
look
201
4, c
onst
ruct
ion
wor
k su
ch a
s hou
sing
and
pub
lic
cons
truct
ion
proj
ects
cre
ates
the
high
est d
eman
d fo
r ste
el p
rodu
cts s
uch
as (b
ars,
sect
ions
, ga
lvan
ised
shee
t and
pla
te).
IHS
Glo
bal C
onst
ruct
ion
Exec
utiv
e Su
mm
ary
2013
Pote
ntia
l m
arke
t gro
wth
Po
pula
tion
grow
th o
f m
iddl
e an
d hi
gh in
com
e gr
oups
The
grow
th o
f inc
ome
incr
ease
s the
num
ber o
f mid
dle
clas
s pop
ulat
ion
whi
ch a
lso
incr
ease
s th
e pr
oper
ty sa
les d
eman
d (h
ttp://
mar
ketre
alis
t.com
, 201
4).
http
://da
ta.w
orld
bank
.org
/cou
ntry
; ht
tp://
data
.wor
ldba
nk.o
rg/in
dica
tor/S
P.P
OP.
GR
OW
Mar
ketin
g
Indu
stry
pe
rfor
man
ce
Stee
l dem
and
surp
lus
and
defic
it (th
ousa
nd
met
ric to
nnes
)
Dem
and
of st
eel p
rodu
cts d
epen
ds o
n th
e ec
onom
ic c
ondi
tion
of a
cou
ntry
and
how
the
cons
truct
ion,
aut
omot
ive
and
othe
r ind
ustry
per
form
(EY
Glo
bal S
teel
Out
look
, 201
4).
http
s://w
ww
.wor
ldst
eel.o
rg/s
teel
-by-
topi
c/st
atis
tics/
stee
l-sta
tistic
al-
year
book
-.htm
l
Lead
tim
e Ph
ysic
al d
ista
nce
(Km
) D
ista
nce
betw
een
two
coun
tries
in e
xpor
t and
impo
rt ac
tiviti
es im
pact
s to
its d
eliv
ery
lead
tim
e an
d fr
eigh
t cos
ts. W
hile
pric
e co
mpe
titiv
enes
s det
erm
ines
the
succ
ess o
f ste
el p
rodu
cer
(EY
Glo
bal S
teel
Out
look
201
5–20
16).
http
s://w
ww
.dis
tanc
ecal
cula
tor.n
et/
Biro
crac
y C
orru
ptio
n in
dex
(ran
k)
Cor
rupt
ion
min
imis
e th
e pr
ofita
bilit
y op
portu
nity
of e
nter
ing
a ne
w m
arke
t as l
ong
as c
reat
ing
risks
and
mor
e co
sts (
http
://ex
port.
gov,
201
6).
http
://w
ww
.tran
spar
ency
.org
/new
s/fe
atu
re/c
orru
ptio
n_pe
rcep
tions
_ind
ex_2
016
Supp
ly
Cha
in
Tran
spor
tatio
n co
st
Frei
ght c
ost (
USD
) Tr
ansp
orta
tion
cost
bec
omes
one
of t
he fa
ctor
s to
dete
rmin
e pr
icin
g fo
r pro
duct
s. M
eanw
hile
, th
e m
arke
t dem
ands
com
petit
ive
pric
ing
whi
ch p
ushe
s the
frei
ght c
ost t
o be
mor
e tig
ht (E
Y
Glo
bal S
teel
, 201
4).
http
://w
orld
frei
ghtra
tes.c
om/e
n/fr
eigh
t
Net
pro
fit
amou
nt
Cor
pora
te ta
x ra
te (%
) C
orpo
rate
tax
rate
impo
sed
by g
over
nmen
t inf
luen
ce fi
rms’
pro
fit a
nd ri
sk
http
://w
ww
.trad
inge
cono
mic
s.com
/cou
ntry
-list
/cor
pora
te-ta
x-ra
te
Polit
ical
risk
G
loba
l com
petit
iven
ess
inde
x (s
cale
) co
mpe
titiv
enes
s as t
he se
t of i
nstit
utio
ns, p
olic
ies,
and
fact
ors t
hat d
eter
min
e th
e le
vel o
f pr
oduc
tivity
of a
n ec
onom
y, w
hich
in tu
rn se
ts th
e le
vel o
f pro
sper
ity th
at th
e co
untry
can
ac
hiev
e.
http
://w
ww
3.w
efor
um.o
rg/d
ocs/
GC
R20
16-
2017
/05F
ullR
epor
t/The
Glo
balC
ompe
titi
vene
ssR
epor
t201
6-20
17_F
INA
L.pd
f
Ris
ks
Cur
renc
y ris
ks
Cur
renc
y flu
ctua
tion
(%)
Pric
ing
of im
porte
d or
exp
orte
d st
ee p
rodu
cts a
ssoc
iate
d w
ith e
xcha
nge
rate
fluc
tuat
ion.
Ste
el
prod
ucer
cou
ntrie
s bec
omin
g co
st c
ompe
titiv
e be
caus
e of
cur
renc
y flu
ctua
tions
(EY
Glo
bal
Stee
l, 20
15–2
016;
Haf
fman
, 200
5).
http
://w
ww
.trad
inge
cono
mic
s.com
/cur
renc
ies

350 E. Oey et al.
Table 4a Result of preliminary screening of alternatives – strategic criteria
Stra
tegi
c
Mar
ket v
alue
Econ
omic
gro
wth
Con
sum
ptio
n gr
owth
GD
P pe
r cap
ita (U
SD)
G
DP
Gro
wth
(%)
In
tere
st ra
te (%
)
Cou
ntry
nam
e 20
15
Rank
Cou
ntry
nam
e 20
15
Rank
Cou
ntry
nam
e 20
15
Rank
Bul
garia
6,
993
8
Bul
garia
3.
62
9
Bul
garia
5.
17
8 B
angl
ades
h 1,
212
15
B
angl
ades
h 6.
55
3
Ban
glad
esh
5.51
9
Chi
na
8,02
8 7
C
hina
6.
91
1
Chi
na
4.81
5
Iraq
4,
944
10
Ir
aq
3.02
12
Iraq
0.
00
1 Is
rael
35
,728
3
Is
rael
2.
51
14
Is
rael
0.
66
2 K
enya
1,
377
14
K
enya
5.
65
5
Ken
ya
6.36
13
M
alay
sia
9,76
8 4
M
alay
sia
4.97
6
M
alay
sia
4.97
6
Mau
ritiu
s 9,
252
5
Mau
ritiu
s 3.
47
10
M
aurit
ius
7.48
15
N
ew Z
eala
nd
37,8
08
2
New
Zea
land
3.
39
11
N
ew Z
eala
nd
5.88
10
Ph
ilipp
ines
2,
904
12
Ph
ilipp
ines
5.
91
4
Phili
ppin
es
6.25
11
R
oman
ia
8,97
3 6
R
oman
ia
3.66
8
R
oman
ia
3.74
4
Sing
apor
e 52
,889
1
Si
ngap
ore
2.01
15
Sing
apor
e 3.
65
3 Th
aila
nd
5,81
5 9
Th
aila
nd
2.83
13
Thai
land
6.
33
12
Sri L
anka
3,
926
11
Sr
i Lan
ka
4.79
7
Sr
i Lan
ka
5.15
7
Vie
tnam
2,
111
13
V
ietn
am
6.68
2
V
ietn
am
7.32
14
Evaluating international market selection with multi-criteria decision 351
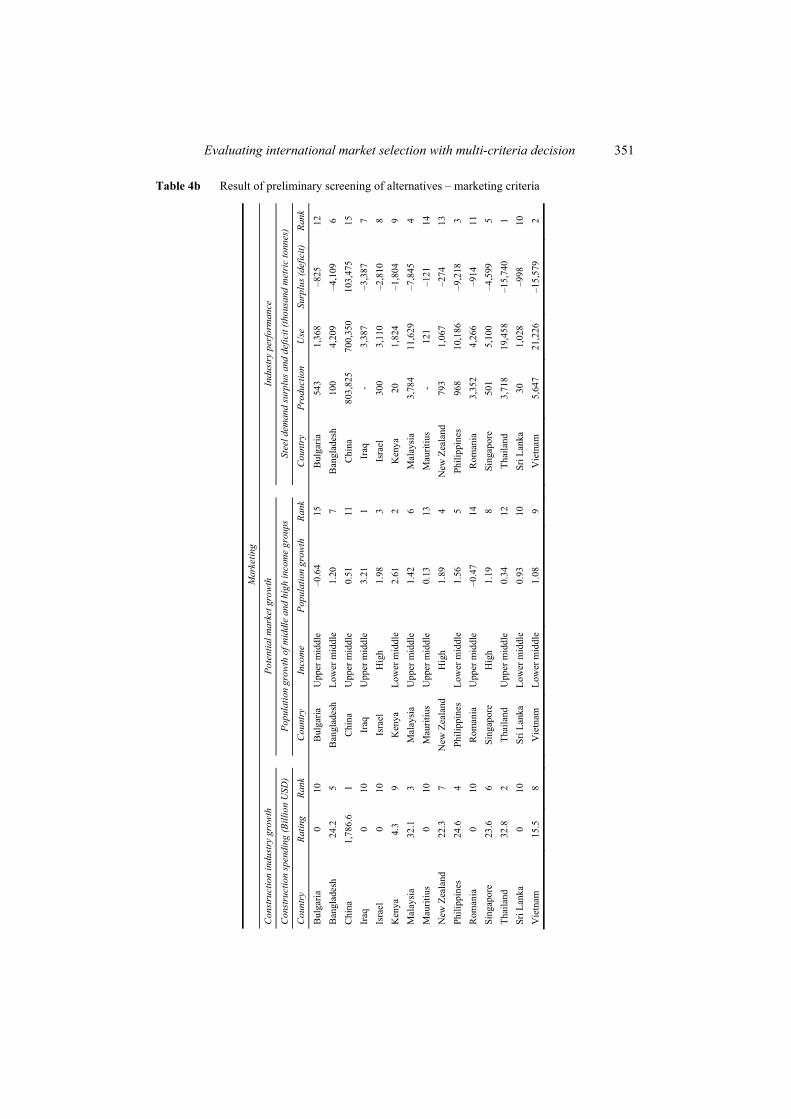
Table 4b Result of preliminary screening of alternatives – marketing criteria
Mar
ketin
g
Con
stru
ctio
n in
dust
ry g
row
th
Po
tent
ial m
arke
t gro
wth
Indu
stry
per
form
ance
Con
stru
ctio
n sp
endi
ng (B
illio
n U
SD)
Po
pula
tion
grow
th o
f mid
dle
and
high
inco
me
grou
ps
St
eel d
eman
d su
rplu
s and
def
icit
(thou
sand
met
ric
tonn
es)
Cou
ntry
Ra
ting
Rank
Cou
ntry
In
com
e Po
pula
tion
grow
th
Rank
C
ount
ry
Prod
uctio
n U
se
Surp
lus (
defic
it)
Rank
Bul
garia
0
10
B
ulga
ria
Upp
er m
iddl
e –0
.64
15
B
ulga
ria
543
1,36
8 –8
25
12
Ban
glad
esh
24.2
5
B
angl
ades
h Lo
wer
mid
dle
1.20
7
B
angl
ades
h 10
0 4,
209
–4,1
09
6 C
hina
1,
786.
6 1
C
hina
U
pper
mid
dle
0.51
11
Chi
na
803,
825
700,
350
103,
475
15
Iraq
0
10
Ir
aq
Upp
er m
iddl
e 3.
21
1
Iraq
-
3,38
7 –3
,387
7
Isra
el
0 10
Isra
el
Hig
h 1.
98
3
Isra
el
300
3,11
0 –2
,810
8
Ken
ya
4.3
9
Ken
ya
Low
er m
iddl
e 2.
61
2
Ken
ya
20
1,82
4 –1
,804
9
Mal
aysi
a 32
.1
3
Mal
aysi
a U
pper
mid
dle
1.42
6
M
alay
sia
3,78
4 11
,629
–7
,845
4
Mau
ritiu
s 0
10
M
aurit
ius
Upp
er m
iddl
e 0.
13
13
M
aurit
ius
- 12
1 –1
21
14
New
Zea
land
22
.3
7
New
Zea
land
Hig
h 1.
89
4
New
Zea
land
79
3 1,
067
–274
13
Ph
ilipp
ines
24
.6
4
Phili
ppin
es
Low
er m
iddl
e 1.
56
5
Phili
ppin
es
968
10,1
86
–9,2
18
3 R
oman
ia
0 10
Rom
ania
U
pper
mid
dle
–0.4
7 14
Rom
ania
3,
352
4,26
6 –9
14
11
Sing
apor
e 23
.6
6
Sing
apor
e H
igh
1.19
8
Si
ngap
ore
501
5,10
0 –4
,599
5
Thai
land
32
.8
2
Thai
land
U
pper
mid
dle
0.34
12
Thai
land
3,
718
19,4
58
–15,
740
1 Sr
i Lan
ka
0 10
Sri L
anka
Lo
wer
mid
dle
0.93
10
Sri L
anka
30
1,
028
–998
10
V
ietn
am
15.5
8
V
ietn
am
Low
er m
iddl
e 1.
08
9
Vie
tnam
5,
647
21,2
26
–15,
579
2

352 E. Oey et al.
Table 4c Result of preliminary screening of alternatives – supply chain criteria
Supp
ly c
hain
Lead
tim
e
Biro
crac
y
Tran
spor
tatio
n co
st
Phys
ical
Dis
tanc
e (K
m)
C
orru
ptio
n in
dex
(ran
k)
Fr
eigh
t cos
t (U
SD)
Cou
ntry
K
m
Rank
Cou
ntry
C
I ran
k Ra
nk
C
ount
ry
Frei
ght c
ost
Rank
Bul
garia
9,
950
14
B
ulga
ria
69
7
Bul
garia
1,
149
10
Ban
glad
esh
3,73
0 6
B
angl
ades
h 13
9 13
Ban
glad
esh
790
7 C
hina
4,
203
8
Chi
na
83
9
Chi
na
503
1 Ir
aq
8,24
0 11
Iraq
16
1 15
Iraq
2,
180
15
Isra
el
9,02
4 13
Isra
el
32
3
Isra
el
1,07
1 9
Ken
ya
8,46
2 12
Ken
ya
139
13
K
enya
81
6 8
Mal
aysi
a 1,
441
2
Mal
aysia
54
5
M
alay
sia
714
3 M
aurit
ius
6,50
1 9
M
aurit
ius
45
4
Mau
ritiu
s 1,
477
11
New
Zea
land
7,
561
10
N
ew Z
eala
nd
4 1
N
ew Z
eala
nd
2,00
5 13
Ph
ilipp
ines
1,
751
3
Phili
ppin
es
95
11
Ph
ilipp
ines
76
9 6
Rom
ania
10
,001
15
Rom
ania
58
6
R
oman
ia
2,12
0 14
Si
ngap
ore
1,14
4 1
Si
ngap
ore
8 2
Si
ngap
ore
707
2 Th
aila
nd
2,33
7 5
Th
aila
nd
76
8
Thai
land
72
1 4
Sri L
anka
3,
804
7
Sri L
anka
83
9
Sr
i Lan
ka
1,54
3 12
V
ietn
am
1,76
6 4
V
ietn
am
112
12
V
ietn
am
765
5

Evaluating international market selection with multi-criteria decision 353
Table 4d Result of preliminary screening of alternatives – risk criteria
RISK
Net
pro
fit a
mou
nt
Po
litic
al ri
sk
C
urre
ncy
risk
s
Cor
pora
te ta
x ra
te (%
)
Glo
bal c
ompe
titiv
enes
s ind
ex (s
cale
)
Cur
renc
y flu
ctua
tion
(%)
Cou
ntry
Ta
x ra
te
Rank
Cou
ntry
G
CI s
core
Ra
nk
C
ount
ry n
ame
Rate
Ra
nk
Bul
garia
10
.00%
2
B
ulga
ria
4.44
8
B
ulga
ria
3.81
%
9 B
angl
ades
h 25
.00%
11
Ban
glad
esh
3.80
14
Ban
glad
esh
4.05
%
10
Chi
na
25.0
0%
11
C
hina
4.
95
5
Chi
na
5.92
%
14
Iraq
15
.00%
3
Ir
aq
0 15
Iraq
0.
09%
5
Isra
el
25.0
0%
11
Is
rael
5.
18
3
Isra
el
–5.2
1%
1 K
enya
30
.00%
14
Ken
ya
3.90
13
Ken
ya
2.69
%
7 M
alay
sia
24.0
0%
10
M
alay
sia
5.16
4
M
alay
sia
8.21
%
15
Mau
ritiu
s 15
.00%
3
M
aurit
ius
4.49
7
M
aurit
ius
0.00
%
3 N
ew Z
eala
nd
0.00
%
1
New
Zea
land
5.
31
2
New
Zea
land
0.
00%
3
Phili
ppin
es
30.0
0%
14
Ph
ilipp
ines
4.
36
9
Phili
ppin
es
5.90
%
13
Rom
ania
16
.00%
6
R
oman
ia
4.30
11
Rom
ania
5.
00%
12
Si
ngap
ore
17.0
0%
7
Sing
apor
e 5.
72
1
Sing
apor
e 3.
23%
8
Thai
land
20
.00%
8
Th
aila
nd
4.64
6
Th
aila
nd
–1.3
9%
2 Sr
i Lan
ka
15.0
0%
3
Sri L
anka
4.
19
12
Sr
i Lan
ka
4.32
%
11
Vie
tnam
20
.00%
8
V
ietn
am
4.31
10
Vie
tnam
2.
20%
6

354 E. Oey et al.
4.2 Preliminary screening of alternatives
For each of the sub-criteria, data for top 50 countries were analysed and top 15 countries were selected as alternatives. This is the result of preliminary screening of the country, which is shown in Table 4a–4d.
4.3 AHP model and result
Based on the complete criteria and sub-criteria, the AHP decision tree was constructed, as indicated in Figure 2. In each decision’s intersections, AHP weighing were calculated based on input from pair-wise comparison questionnaires. As there were three decision makers, the weight of each criterion and sub-criteria were averaged using geometric mean. A sample of weight calculation of criteria from 1 decision maker is shown in Table 5. To get the composite weight of all the three decision makers, the geometric mean for each sub-criteria were calculated. Summary of AHP result is as per shown in Table 6. Table 5 Sample AHP calculation of criteria for criteria from decision maker 1
Step 1: Comparison matrix based on pair-wise questionnaires
Criteria Strategic Marketing Supply chain Risks Strategic 1 1/5 1 1/5 Marketing 5 1 3 3 Supply chain 1 1/3 1 1/3 Risks 5 1/3 3 1 Total 12 1 6/7 8 4 1/2
Step 2: Normalisation to calculate weight
Criteria Strategic Marketing Supply chain Risks Eigen
vector P vector
Strategic 0.083 0.107 0.125 0.044 0.090 0.364 Marketing 0.417 0.536 0.375 0.662 0.497 2.185 Supply chain 0.083 0.179 0.125 0.74 0.115 0.470 Risks 0.417 0.179 0.375 0.221 0.298 1.258 Total 1 1 1 1 1 3.019
Step 3: Checking the consistency Lamaba max 4.188 CI 0.063 RI 0.900 CR 0.070
Acceptable

Evaluating international market selection with multi-criteria decision 355
Table 6 Summary of AHP Result
DM
1
DM
2
DM
3
Geo
met
ric
mea
n fo
r 3 D
Ms
Cri
teri
a an
d
sub-
crite
ria
Wei
ght
crite
ria
Wei
ght
sub-
crite
ria
W
eigh
t cr
iteri
a W
eigh
t su
b-cr
iteri
a
Wei
ght
crite
ria
Wei
ght
sub-
crite
ria
W
eigh
t cr
iteri
a W
eigh
t su
b-cr
iteri
a G
loba
l wei
ght o
f su
b-cr
iteri
a
Stra
tegi
c 0.
090
0.06
7
0.
159
0.11
4
GD
P pe
r cap
ita
0.
260
0.10
6
0.
405
0.23
6 0.
0269
GD
P gr
owth
0.63
3
0.
633
0.48
0
0.
609
0.06
94
In
tere
st ra
te
0.
106
0.26
0
0.
115
0.15
5 0.
0177
To
tal
1
1
1
1
CR
= C
I / R
I
0.03
3
0.
03
0.02
5
M
arke
t siz
e 0.
497
0.29
1
0.
077
0.25
8
Con
stru
ctio
n
0.10
6
0.
074
0.11
0.
094
0.02
43
Po
pula
tion
0.
260
0.28
3
0.
26
0.26
8 0.
0692
Stee
l dem
and
0.
633
0.64
3
0.
63
0.63
8 0.
1646
To
tal
1
1
1
1
CR
= C
I / R
I
0.03
3
0.
056
0.03
3
Su
pply
cha
in
0.11
5
0.
151
0.50
1
0.
238
D
ista
nce
0.
158
0.13
4
0.
193
0.19
7 0.
0468
Cor
rupt
ion
0.
655
0.12
0
0.
083
0.23
0 0.
0548
Frei
ght c
ost
0.
187
0.74
6
0.
724
0.57
3 0.
1361
To
tal
1
1
1
1
CR
= C
I / R
I
0.02
5
0.
011
0.05
7
R
isk
0.29
8
0.
491
0.26
3
0.
390
Ta
x ra
te
0.
777
0.40
5
0.
115
0.41
5 0.
1618
GC
I
0.15
5
0.
480
0.40
5
0.
390
0.15
22
C
urre
ncy
risk
0.
069
0.11
5
0.
480
0.19
5 0.
0762
To
tal
1
1
1
1
CR
= C
I / R
I
0.07
1
0.
025
0.02
5
G
rand
tota
l 1
1
1
1
1

356 E. Oey et al.
Figure 2 Decision tree of AHP (see online version for colours)
4.4 GP model and result
The GP model for the case study is as per (Hoffman, 1998; Hortacsu and Tektas, 2009), which is to select the country with the minimum total deviation from the target goal, i.e.:
( )1 2 3 15Determine = , , , ..., ... iX x x x x x
1 2 4 53
76 8 9 10
11 12
Min 2.69 6.94 1.77 2.43 6.9216.46 4.68 5.48 13.61 16.1815.22 7.62
d d d d dd d d d dd d
− − + − −
+ + + + +
− +
+ + + +
+ + + + +
+ +
Subject to:
1 15 11
1 15 22
1 15 33
1 15 44
1 15
G1 6,993 ............2,111 4,952.14G2 3.62 ............6.68 3.00G3 5.17 ............7.32 7.84G4 0.0 ............15.5 131.07G5 0.64 ............1.08
X X d dX X d dX X d d
X X d dX X
+ −
+ −
+ −
+ −
+ − + =
+ − + =
+ − + =
+ − + =
+ − 55
1 15 66
1 15 77
1 15 88
1 15 99
1
0G6 825 ............ 15,579 420.5G7 9,950 ............1,766 10, 403.5G8 69 ............112 83G9 1,149 ............765 2,181.29G10 10% ........
d dX X d dX X d d
X X d dX X d dX
+ −
+ −
+ −
+ −
+ −
+ =
− + − − + = −
+ − + =
+ − + =
+ − + =
+ 15 1010
1 15 1111
1 15 1212
....20% 25%G11 4.44 ............4.31 4.27G12 3.81 ............2.2% 2.59%
X d dX X d dX X d d
+ −
+ −
+ −
− + =
+ − + =
+ − + =

Evaluating international market selection with multi-criteria decision 357
xi binary value – xi = 1 if located in country j or zero otherwise
, :iid d+ − over and under achievement from target for goal i.
As the target of GP model, Table 7 shows the selected target value and its reasoning. Table 7 Target value for GP model
No. Sub criteria => goals Target value Reason/remarks
G1 GDP per capita (USD) ≥ 4,952.14 2nd quartile of the data
G2 GDP growth (%) ≥ 3% 2nd quartile of the data
G3 Interest rate (%) ≤ 7.84% 2nd quartile of the data
G4 Construction spending (billion USD) ≥ 131,07 Average
G5 Population growth of middle and high income groups
≥ 0 Upper middle to high; positive growth
G6 Steel demand surplus and deficit (thousand metric tons)
≤ –420.5 2nd quartile of the data
G7 Physical distance (Km) ≤ 10,403.5 2nd quartile of the data
G8 Corruption index (rank) ≤ 83 2nd quartile of the data
G9 Freight cost (USD) ≤ 2,181.29 2nd quartile of the data
G10 Corporate tax rate (%) ≤ 25% 2nd quartile of the data
G11 Global competitiveness index (scale) ≥ 4.27 Average
G12 Currency fluctuation (%) ≤ 2.59% Average
The GP model was calculated using Microsoft excel solver, each time giving the best-selected country. To select the next best-selected country, the model was reran by excluding the already-selected country. Based on the model, three best countries were selected, namely: Thailand, Malaysia and Singapore. The summary result of the GP model for those three selected countries is shown in Table 8.
5 Conclusions and limitations
The study recommended three countries as a starting point for IMS’s of the studied company, i.e.: Thailand, Malaysia and Singapore. The study considered four group criteria in performing IMS, and demonstrated a combination of some generic as well as product- or industry-related sub-criteria. In the analysis, the study also combined both subjective approach by using AHP and objective approach by using GP. The study demonstrated that a systematic IMS can be done for a middle-size firm using secondary data and proper methodology. Nevertheless, it should be noted that the selected sub-criteria may be case sensitive and different case may require different sub-criteria. From the preliminary screening of alternatives, few of the top 15 countries, such as Iraq and Israel were not intuitive, and may require further research or sensitivity analysis. The study was also a static analysis, which only valid under the current set of data. Further elaboration or recalculation may be required when market dynamics change.

358 E. Oey et al.
Table 8 Summary of GP result
Best
thre
e co
untr
ies
Thai
land
Mal
aysi
a
Sing
apor
e G
oals
W
eigh
t Ta
rget
Dat
a D
evia
tion
D
ata
Dev
iatio
n
Dat
a D
evia
tion
GD
P pe
r cap
ita
2.69
>
4952
,14
5,81
4.8
-
9,76
8.3
-
52,8
88.7
-
GD
P gr
owth
6.
94
>3.0
0 2.
8 -
5.
0 -
2.
0 1.
0 In
tere
st ra
te
1.77
<
7.84
6.
3 -
5.
0 -
3.
7 -
Con
stru
ctio
n 2.
43
> 13
1.07
32
.8
98.3
32.1
99
.0
23
.6
107.
5 Po
pula
tion
grow
th o
f mid
dle
and
high
in
com
e 6.
92
> 0
0.3
-
1.4
-
1.2
-
Stee
l dem
and
16.4
6 <
–420
,5
–15,
740.
0 -
–7
,845
.0
-
–4,5
99.0
-
Dis
tanc
e 4.
68
< 10
403,
5 2,
337.
0 -
1,
441.
0 -
1,
144.
0 -
Cor
rupt
ion
5.48
<
83
76.0
-
54
.0
-
8.0
- Fr
eigh
t cos
t 13
.61
< 21
81,2
9 72
1.4
-
714.
3 -
70
7.2
- Ta
x ra
te
16.1
8 <
25%
20
%
-
24%
-
17
%
- G
CI
15.2
2 >
4,27
4.
6 -
5.
2 -
5.
7 -
Cur
renc
y ris
k 7.
62
< 2,
59%
–1
.4%
-
8.
2%
0.1
3.
2%
0.0
Min
Z
23
8.9
241.
0
26
8.2
Evaluating international market selection with multi-criteria decision 359
Acknowledgements
The authors would like to thank the anonymous reviewers and the editor for their insightful comments and suggestions.
References Agndal, H. and Chetty, S. (2007) ‘The impact of relationships on changes in internationalisation
strategies of SMEs’, European Journal of Marketing, Vol. 41, Nos. 11/12, pp.1449–1474. Albaum, G. and Duerr, E. (2008) International Marketing and Export Management, 6th ed.,
Pearson Education Limited, Essex, England. Andersen, O. and Buvik, A. (2002) ‘Firms’ internationalization and alternative approaches to the
international customer/market selection’, International Business Review, Vol. 11, No. 3, pp.347–363.
Bhutia, P.W. and Phipon, R. (2012) Application of AHP and TOPSIS method for supplier selection problem’, IOSR Journal of Engineering (IOSRJEN), Vol. 2, No. 10, pp.43–50.
Brouthers, L.E. and Nakos, G. (2005) ‘The role of systematic international market selection on small firms’ export performance’, Journal of Small Business Management, Vol. 43, No. 4, pp.363–381.
Cavusgil, S.T., Kiyak, T. and Yeniyurt, S. (2004) ‘Complementary approaches to preliminary foreign market opportunity assessment: country clustering and country ranking’, Industrial Marketing Management, Vol. 33, No. 7, pp.607–617.
Cavusgil, T. and Zou, S. (1994) ‘Marketing strategy-performance relationship: an investigation of the empirical link in export market ventures’, Journal of Marketing, Vol. 58, No. 1, pp.1–21.
Cooper, R.G. and Kleinschmidt, E.J. (1985) ‘The impact of export strategy on export sales performance’, Journal of International Business Studies, Vol. 16, No. 1, pp.37–55.
Cuyvers, L. (1996) ‘Export opportunities of Thailand: a decision support model approach’, Journal of Euro-Asian Management, Vol. 2, No. 2, pp.71–96.
Cuyvers, L. (2004) ‘Identifying export opportunities: the case of Thailand’, International Marketing Review, Vol. 21, No. 3, pp.255–278.
Douglas, S.P. and Craig, C.S. (1992) ‘Advances in international marketing’, International Journal of Research in Marketing, Vol. 9, No. 4, pp.219–223.
Douglas, S.P., Craig, C.S. and Keegan, W. (1982) ‘Approaches to assessing international marketing opportunities for small and medium-sized companies’, Columbia Journal of World Business, Vol. 17, No. 3, pp.26–32.
Ellis, P. (2000) ‘Social ties and foreign market entry’, Journal of International Business Studies, Vol. 31, No. 3, pp.443–469.
Francioni, B. (2012) Key International Strategic Decisions for SMEs, Lambert Publishing, Saarbrücken, Germany.
Górecka, D. and Szałucka, M. (2013) ‘Country market selection in international expansion using multi-criteria decision aiding methods’, Multiple Criteria Decision Making, Vol. 8, pp.31–55.
He, X. and Wei, Y. (2011) ‘Linking market orientation to international market selection and international performance’, International Business Review, Vol. 20, No. 5, pp.535–546.
Heizer, J. and Render, B. (2014) Operations Management – Sustainability and Supply Chain Management, 11th ed., Pearson, Essex, England.
Hoffman, J. (1998) ‘Evaluating international ethical climates: a goal programming model’, Journal of Business Ethics, Vol. 17, No. 16, pp.1861–1869.

360 E. Oey et al.
Hortacsu, A. and Tektas, A. (2009) ‘Modeling the country selection decision in retail internationalization’, International Journal of Social, Behavioral, Educational, Economic, Business and Industrial Engineering, Vol. 3, No. 7, pp.1563–1570.
Jansen, S.T.G. (2013) Factors in International Market Selection: The Influence of International Experience on the Decision Making, Master Thesis, University of Twente, The Netherlands.
Johanson, J. and Vahlne, J.E. (1977) ‘The internationalization process of the firm – a model of knowledge development and increasing foreign market commitments’, Journal of International Business Studies, Vol. 8, No. 1, pp.23–32.
Johansson, J.K. (1997) Global Marketing, Foreign Entry, Local Marketing and Global Management, McGraw-Hill, Chicago, Illinois.
Koch, A.J. (2001) ‘Selecting overseas markets and entry modes: two decision processes or one?’, Marketing Intelligence and Planning, Vol. 19, No. 1, pp.65–75.
Kumar, V., Stam, A. and Joachimsthaler, E.A. (1994) ‘An interactive multi-criteria approach to identifying potential foreign markets’, Journal of International Marketing, Vol. 2, No. 1, pp.29–52.
Lee, W.Y. and Brasch, J.J. (1978) ‘The adoption of export as an innovative strategy’, Journal of International Business Studies, Vol. 9, No. 1, pp.85–93.
Makino, S., Lau, C.M. and Yeh, R.S. (2002) ‘Asset-exploitation versus asset seeking: implications for location choice of foreign direct investment from newly industrialized economies’, Journal of International Business Studies, Vol. 33, No. 3, pp.403–421.
Mansor, M.R. et al. (2014) ‘Application of integrated AHP-TOPSIS method in hybrid natural fiber composites materials selection for automotive parking brake lever component’, Australian Journal of Basic and Applied Sciences, Vol. 8, No. 5, pp.431–439.
Miečinskienė, A., Stasytytė, V. and Kazlauskaitė, J. (2014) ‘Reasoning of export market selection’, Procedia – Social and Behavioral Sciences, Vol. 110, pp.1166–1175.
Musso, F. and Francioni, B. (2012) ‘How do smaller firms select foreign markets?’, International Journal of Marketing Studies, Vol. 4, No. 6, pp.44–53.
Nganga, P.S. (2015) ‘Market attractiveness evaluation of Sub-Saharan Africa, applying SWOT analysis and AHP methods’, Journal of Economics and Economic Education Research, Vol. 16, No. 1, pp.1–18.
Oey, E. and Nitihardjo, E.C. (2016) ‘Selecting regional postponement centre using PESTLE-AHP-TOPSIS methodology: a case study in a Pharmaceutical Company’, Global Business Review, Vol. 17, No. 5, pp.1250–1265.
Orumie, U.C. and Ebong, D. (2014) ‘A glorious literature on linear goal programming algorithms’, American Journal of Operations Research, Vol. 4, No. 2, pp.59–71.
Papadopoulos, N. and Denis, J-E. (1988) ‘Inventory, taxonomy and assessment of methods for international market selection’, International Marketing Review, Vol. 5, No. 3, pp.38–51.
Papadopoulos, N., Chen, H. and Thomas, D.R. (2002) ‘Toward a trade-off model for international market selection’, International Business Review, Vol. 11, No. 2, pp.165–192.
Pearson, J., Viviers, W. and Cuyvers, L. (2007) ‘Identifying export opportunities: the case of South Africa’, in Paper presented at the Biennial Conference of the Economic Society of South Africa, Johannesburg, 12 September 2007.
Rahman, S.H. (2003) ‘Modelling of international market selection process: a qualitative study of successful Australian international businesses’, Qualitative Market Research: an International Journal, Vol. 6, No. 2, pp.119–132.
Rask, M., Strandskov, J. and Håkonsson, D.D. (2008) ‘Theoretical perspectives on the internationalization of firms’, Journal of Teaching in International Business, Vol. 19, No. 4, pp.320–345.
Root, F.R. (1998) Entry Strategies for International Markets, Revised and Expanded, John Wiley and Sons, San Fransisco.

Evaluating international market selection with multi-criteria decision 361
Russow, L.C. and Okoroafo, S.C. (1996) ‘On the way towards developing a global screening model’, International Marketing Review, Vol. 13, No. 1, pp.46–64.
Saaty, T.L. (2008) ‘Decision making with the analytic hierarchy process’, International Journal of Services Sciences, Vol. 1, No. 1, p.83.
Sakarya, S., Eckman, M. and Hyllegard, K.H. (2007) ‘Market selection for international expansion, assessing opportunities in emerging markets’, International Marketing Review, Vol. 24, No. 2, pp.208–238.
Sener, H.Y. (2014) ‘Determining new markets using analytic hierarchy process: case study in Güral Porcelain’, International Journal of Marketing Studies, Vol. 6, No. 5, pp.149–160.
Shankarmahesh, M.N., Olsen, H.W. and Honeycutt, E.D. (2005) ‘A dominant product-dominant country framework of industrial export segmentation’, Industrial Marketing Management, Vol. 34, No. 3, pp.203–210.
Spies, D.C., Idsardi, E.F. and Steenkamp, E. (2014) ‘Selecting alternative export markets for Namibia’s red meat products: application of a decision support model’, Agricultural Economics Association of South Africa, Vol. 53, No. 1, pp.75–103.
Steenkamp, E. et al. (2009) Export Market Selection Methods and the Identification of Realistic Export Opportunities for South Africa using a Decision Support Model, Working Paper Series, 2009-03, TIPS, Pretoria.
Whitelock, J. and Jobber, D. (2004) ‘An evaluation of external factors in the decision of UK industrial firms to enter a new non-domestic market: an exploratory study’, European Journal of Marketing, Vol. 38, Nos. 11/12, pp.1437–1455.
Copyright © 2022 FDOKUMEN