Supplier Selection for High-Tech Start-Up Companies
70
Supplier Selection for High-Tech Start-Up Companies A Case Study of a Firefighting Robot BENJAMIN LÖFDAHL BIRGER SJÖDIN Master of Science Thesis Stockholm, Sweden 2013
-
Upload
khangminh22 -
Category
Documents
-
view
0 -
download
0
Transcript of Supplier Selection for High-Tech Start-Up Companies

Supplier Selection for High-Tech Start-Up Companies
A Case Study of a Firefighting Robot
BENJAMIN LÖFDAHL BIRGER SJÖDIN
Master of Science Thesis Stockholm, Sweden 2013
Supplier Selection for High-Tech Start-Up Companies
A Case Study of a Firefighting Robot
By
Benjamin Löfdahl Birger Sjödin
Master of Science Thesis INDEK 2013:56 KTH Industrial Engineering and Management
Industrial Management SE-100 44 STOCKHOLM

Master of Science Thesis INDEK 2013:56
Supplier Selection for High-Tech Start-Up Companies
Benjamin Löfdahl
Birger Sjödin
Approved
Examiner
Matti Kaulio Supervisor
Pernilla Ulfvengren Commissioner
Thomas Eriksson Contact person
Thomas Eriksson
Abstract The growing need to source manufacturing activities to original equipment manufacturers has presented a strategic challenge for firms in evaluating and selecting supplier partners for their products. Supplier performance evaluation is a well-researched area within supply chain management. Though several authors have contributed with models for supplier selection, there still exist uncertainties regarding how high-tech start-up firms should capitalize on these models. By conducting a case study at AB Realisator Management Consulting currently developing a new firefighting robot concept called FUMO™, the authors were able to develop a model for supplier selection and test it on a real case scenario. Results indicate that high-tech start-up firms in general should apply the following step-by-step process for selecting suppliers: Align supply chain strategy with product characteristics regarding supply and demand uncertainty, select supplier performance metrics from the comprehensive bank of metrics presented in this thesis related to the supply chain strategy, evaluate suppliers based on the selected performance metrics using the decision making framework Analytic Hierarchy Process (AHP). By following the suggested process step by step, incorporating performance metrics to the AHP structure, high-tech start-up firms will be able to find strategically suitable suppliers to manufacture their products.
Key-words: Analytic Hierarchy Process, supplier performance metrics, supplier selection, supply chain strategy.

Utvärdering av leverantörer för högteknologiska nystartsföretag
En fallstudie av en brandrobot
BENJAMIN LÖFDAHL BIRGER SJÖDIN
Examensarbete Stockholm, Sverige 2013

Utvärdering av leverantörer för högteknologiska nystartsföretag
En fallstudie av en brandrobot
av
Benjamin Löfdahl Birger Sjödin
Examensarbete INDEK 2013:56 KTH Industriell teknik och management
Industriell ekonomi och organisation SE-100 44 STOCKHOLM

Examensarbete INDEK 2013:56
Utvärdering av leverantörer för högteknologiska nystartsföretag
Benjamin Löfdahl
Birger Sjödin
Godkänt
Examinator
Matti Kaulio
Handledare
Pernilla Ulfvengren Uppdragsgivare
Thomas Eriksson Kontaktperson
Thomas Eriksson
Sammanfattning Det växande behovet av att lägga ut tillverkningsverksamhet till externa leverantörer har bidragit med en strategisk utmaning för företag, gällande att utvärdera och välja leverantörer för sina produkter. Leverantörsutvärdering är ett väl utforskat område inom supply chain management. Även om flera författare har bidragit med modeller för leverantörsutvärdering, finns det fortfarande oklarheter om hur högteknologiska nystartsföretag bör dra nytta av dessa modeller. Genom att utföra en fallstudie på AB Realisator Management Consulting som för närvarande utvecklar ett nytt robotkoncept för brandförsvaret, har författarna kunnat utveckla en modell för val av leverantörer, samt testat den på ett verkligt scenario. Resultat visar att högteknologiska nystartsföretag i allmänhet bör tillämpa följande steg-för-steg-process för val av leverantörer: Matcha supply chain-strategi med produktattribut baserat på osäkerhet i tillgång och efterfrågan, välja mätvärden relaterade till vald supply chain-strategi från den omfattande mätvärdesbanken som presenteras i denna avhandling, utvärdera leverantörer utifrån valda mätvärden genom att applicera beslutsverktyget Analytic Hierarchy Process (AHP). Genom att följa den föreslagna processen steg för steg kommer högteknologiska nystartsföretag kunna välja strategiskt lämpliga leverantörer för att tillverka sina produkter.
Nyckelord: Analytic Hierarchy Process, mätvärden, leverantörsutvärdering, supply chain-strategi.

ME200X 2013-06-11 Benjamin Löfdahl & Birger Sjödin
1
Glossary and Abbreviations
Agility The degree to which a supply chain can cope with unpredictability in supply and demand
AHP Analytic Hierarchy Process
ANP Analytic Network Process
CSR Corporate Social Responsibility
Decoupling point The point in the supply chain where the product becomes customer specific
Efficiency/lean The degree to which the supply chain produces cost-efficiently
FUMO™ A firefighting robot concept and physical product of AB Realisator Management Consulting
Functional Product characteristic, meaning stable in demand with long life cycle
Hybrid/Leagile Mix between functional and innovative product characteristics
Industrialization The process of making a product ready for manufacturing
Innovative Product characteristic, meaning unstable in demand with short life cycle
Metric Unambiguous performance measurement
OEM Original Equipment Manufacturer
Responsiveness The degree to which the supply chain can cope with unpredictability in demand
SCC Supply Chain Council
SCOR model Supply Chain Operations Reference, supplier selection model developed by the Supply Chain Council

ME200X 2013-06-11 Benjamin Löfdahl & Birger Sjödin
2
Table of Content 1 Introduction ...................................................................................................................................................................... 4
1.1 Background and Problem Formulation ........................................................................................................ 4
1.2 Purpose ...................................................................................................................................................................... 5
1.3 Objective .................................................................................................................................................................... 5
1.4 Research Questions ............................................................................................................................................... 5
1.5 Delimitations ........................................................................................................................................................... 5
1.6 Report Disposition ................................................................................................................................................ 5
2 Literature Review........................................................................................................................................................... 7
2.1 Supply Chain Characteristics ............................................................................................................................ 7
2.1.1 Demand and Supply Uncertainty ............................................................................................................ 7
2.1.2 Supply Chain Fit ............................................................................................................................................. 9
2.1.3 Hybrid Products .......................................................................................................................................... 11
2.1.4 Supply Chain Structures .......................................................................................................................... 11
2.1.5 Case Relevance ............................................................................................................................................ 13
2.2 Supplier Selection Methodology ................................................................................................................... 14
2.2.1 Differences between AHP and ANP ..................................................................................................... 15
2.2.2 Case Relevance ............................................................................................................................................ 16
2.3 Performance Measurement System ............................................................................................................ 16
2.3.1 SCOR Model ................................................................................................................................................... 16
2.3.2 Established Industry Approach ............................................................................................................ 17
2.3.3 Theoretical Approach to Selecting Performance Measures ...................................................... 18
2.3.4 Case Relevance ............................................................................................................................................ 21
3 Methodology .................................................................................................................................................................. 22
3.1 Product Characteristics and Supply Chain Strategy Alignment ...................................................... 22
3.2 How Should Suppliers be Evaluated and Selected? .............................................................................. 23
3.3 How Could Suppliers be Evaluated and Selected to Find the Best Suited Suppliers .............. 23
3.3.1 AHP as a Supplier Selection Tool ......................................................................................................... 23
3.3.2 Workshop ...................................................................................................................................................... 24
3.3.3 OEM Interviews and Final Ranking Using Pair-wise Comparison ......................................... 27
3.3.4 Consistency Check ...................................................................................................................................... 28
4 Results .............................................................................................................................................................................. 30
4.1 Product, Company and Market Characteristics and Implications .................................................. 30
4.2 The Supplier Selection Methodology .......................................................................................................... 31
4.2.1 Altered Metrics ............................................................................................................................................ 32
ME200X 2013-06-11 Benjamin Löfdahl & Birger Sjödin
3
4.2.2 The Customized AHP-Model .................................................................................................................. 33
4.2.3 Interviews with OEMs .............................................................................................................................. 34
4.2.4 Consistency Check ...................................................................................................................................... 39
4.2.5 Final AHP ....................................................................................................................................................... 40
5 Discussion ....................................................................................................................................................................... 41
5.1 Model Evaluation ................................................................................................................................................ 41
5.1.1 Strengths and Weaknesses ..................................................................................................................... 41
5.1.2 How the Model Performed ..................................................................................................................... 41
5.1.3 Loner Metrics ............................................................................................................................................... 44
5.2 Comparison Process .......................................................................................................................................... 44
5.3 Sustainability Aspect ......................................................................................................................................... 44
5.4 Limitations and Method Criticism ............................................................................................................... 45
6 Conclusions .................................................................................................................................................................... 46
6.1 General Conclusions .......................................................................................................................................... 46
6.2 Future Research .................................................................................................................................................. 47
7 References
Appendix A – Bank of Metrics
Appendix B – Guide for Interviews with Suppliers
Appendix C – Pair-wise Comparison Matrices

ME200X 2013-06-11 Benjamin Löfdahl & Birger Sjödin
4
1 Introduction This chapter aims at explaining the background, problem formulation, purpose and delimitations of the thesis.
1.1 Background and Problem Formulation Throughout recent decades, there has been a shift from relying solely on manpower in high risk endeavors to utilizing more robotic devices as technology progresses. In many industries robotics is already a cornerstone in the execution of potentially dangerous, yet necessary procedures. This master thesis has its focus in developing a supplier selection model, applicable for a company involved in the firefighting industry, where the utilization of robots is still fairly low. As of now, one of the most risk full civilian governmental controlled work task performed in Sweden is smoke diving. The firefighting men and women responsible for these tasks are risking their lives on a regular basis in search and rescue operations. Furthermore, the work itself also has certain efficiency issues, since limited vision and reconnaissance capabilities makes locating people in distress difficult.
The company Realisator AB Management Consulting (from now on called Realisator) has investigated the issue of smoke diving and is now developing a robot which, equipped with cameras and sensors, will be able to enter and scan hostile, smoke-filled environments efficiently and, more importantly, without endangering the lives of firefighters. The robot concept is called FUMO™ and the third generation prototype is scheduled to be operationally ready for extensive field testing third quarter 2013. Results from these tests will render a fourth generation fully operational prototype planned to be taken into production by first quarter 2014. A manufacturing company will be contracted since Realisator lacks the ability and resources to produce and assemble FUMO™. The objective of this master thesis was to design a model for supplier selection and customize it to Realisator in order to identify the most capable manufacturer for FUMO™.
Strategic supplier selection has been of growing importance for recent years since manufacturing companies tend to focus more efforts and resources on core competencies such as R&D, marketing and sales, to build their competitive advantage in today’s increasingly competitive industries, thus sourcing manufacturing activities from Original Equipment Manufacturers (OEMs) to a higher extent (Lee, 2002, Chan 2003, Wang et al., 2004). This presents a challenge for companies in selecting suitable OEM partners for their products, which is also reflected in the number of publications on the subject of supplier selection throughout the last decade. Countless articles have been published presenting supplier selection methodologies and how to measure supplier performance. Though configurable to product characteristics, these methodologies are often very general and not to a significant extent customized to fit a certain range of companies. The authors suggest a selection model customized to fit high-tech start-up companies with low resources and without manufacturing capabilities. The authors also suggest a structured process concerning how to measure and compare supplier performance metrics and how to gather the required input data from supplier alternatives.
By building on existing theories and frameworks the authors have constructed a model customized to offer a strategic fit to the context of Realisator and similar companies. Theories used concerns supply and demand uncertainties, differentiation of supply chain characteristics depending on product/firm category, supplier selection methodologies such as the Analytic Hierarchy Process (AHP), and supplier performance metrics for supplier evaluation.

ME200X 2013-06-11 Benjamin Löfdahl & Birger Sjödin
5
1.2 Purpose The purpose with this master thesis was to identify the best suited supplier for the new firefighting robot concept FUMO™ currently under development by Realisator.
1.3 Objective The overall objective of this master thesis was develop a model for supplier selection, customized for the robot concept FUMO™ in order to provide Realisator with comprehensive information and recommendations that will facilitate the industrialization process. Development of a customized supplier selection model implied analyzing the unit of investigation, i.e. the organizational context of Realisator and the product context of FUMO™ concerning market uncertainties, technical complexity, and annual volumes.
The secondary objective was to contribute to existing academia by providing start-up companies in high-tech markets with a model for how they could evaluate potential suppliers. Identifying supplier capabilities needed depending on product characteristics, components, customer demand, customer values, business strategy of the sourcing company, etc. are examples of essential concepts in this work.
1.4 Research Questions The main research question derived from the purpose and objective of the master thesis was set as:
RQ1 How could suppliers be evaluated and selected to find the best suited suppliers for FUMO™?
Two sub-questions were added in order to answer RQ1:
RQ1.1 What are the product characteristics of FUMO™? RQ1.2 Which supply chain strategy relates to the product characteristics of
FUMO™ and business strategy of Realisator?
A second research question was posted to capture the more general secondary objective of the master thesis:
RQ2 How could high-tech start-up firms select suitable suppliers for their products?
1.5 Delimitations When applying the method to actually select future suppliers and manufacturers, the authors and Realisator decided to only evaluate suppliers in Sweden, since the firm wanted to keep production geographically close in order to maintain control. When potential suppliers were evaluated, the authors chose to only collect data through primary sources since interviews with suppliers’ customers were hindered due to confidentiality reasons.
1.6 Report Disposition The introduction is followed by chapter 2 where most relevant findings from a comprehensive literature review are presented. Findings concern theories on supply chain strategy, supplier selection methodologies, and supply chain performance metrics.

ME200X 2013-06-11 Benjamin Löfdahl & Birger Sjödin
6
In the report, supply chain performance metrics and metric categories are written in italic to facilitate easy understanding. Supply chain properties which correspond to several metrics are also included in this thesis (e.g. one property discussed is lead time, which also is the name of one metric used in the report). In these cases, properties are not written in italic in order to separate metrics and supply chain properties.
Research methodology is accounted for in chapter 3. The case study is explained and the process of applying AHP is described in detail. In chapter 4 the results of applying AHP with incorporated performance metrics on the case company are presented. Results concern which specific metrics to include in the evaluation, which metrics that are most important to fit the case company’s product, and how a responding sample of OEMs scored on the evaluation model.
Discussion regarding the results in relation to theory is found in chapter 5 where strengths and weaknesses of the supplier selection model are debated. The research of supplier selection is also discussed from a sustainability perspective. Finally, general conclusions of the work in relation to the posed research questions are presented in chapter 6. The authors’ contribution to academia as well as future research is also suggested.

ME200X 2013-06-11 Benjamin Löfdahl & Birger Sjödin
7
2 Literature Review
The purpose of this chapter is to present the essence of the current body of literature regarding supply chain strategies, alignment to business strategy and product characteristics, existing supplier selection methodologies, as well as supplier performance metrics.
2.1 Supply Chain Characteristics This section concerns supply chain characteristics, where the framework of demand uncertainty and the supply chain priorities by Fisher (1997) is presented. Following is additions to this framework, made by Lee (2002). Lee expanded Fisher’s (1997) model to include supply uncertainty as well and further defined the strategies linked to different characteristics. Stavrulaki and Davis (2010) takes the process further by identifying four different supply chain structures that are utilized by today’s industrial firms: build to stock (BTS), assemble to order (ATO), make to order (MTO), and design to order (DTO). With the model presented by Stavrulaki and Davis (2010) companies can pinpoint what kind of supply chain structure that is most applicable to their product.
2.1.1 Demand and Supply Uncertainty In the mid-nineties, Fisher (1997) proposed a model for design and evaluation of a firm’s supply chain based on the demand predictability of a product (i.e. the demand uncertainty) and the supply chain priorities. Fisher (1997) makes one clear distinction between product categories, namely functional products and innovative products. Products that are stable in demand and have a long life cycle and therefore are easy to predict are categorized as functional products, hence with low demand uncertainty. Basic foods, oil, and gas are examples of functional products. Higher margin products with a short life cycle, that are fashionable and harder to predict when it comes to demand, are categorized as innovative products, hence with high demand uncertainty. The latest integrated circuits and fashion apparel are examples of innovative products. Fisher’s (1997) supply chain priorities are divided in physical efficiency, meaning cost-efficient supply of predictable demand, and market responsiveness which focuses on quick response to unpredictable demand fluctuations in the market. According to Fisher (1997), keeping inventory might actually be a valid approach to absorb uncertainty in demand, although contemporary research often suggests the opposite (e.g. just-in-time production systems). This method of hedging uncertainty with buffers should, according to Fisher (1997), not be adopted until demand uncertainty has been actively reduced by attempts to obtain new market information, reduce lead time, and increase flexibility.
Lee (2002) continuous on Fisher’s work and states that companies need to prepare their supply chain for the new business challenges and opportunities that entering a new market or capitalizing on a new technology implies. Lee (2002) presents a framework for how to derive a supply chain strategy from some basic product characteristics, namely the level of demand uncertainty and supply uncertainty of a certain product. This framework builds on the demand uncertainty framework introduced by Fisher (1997), however includes supply uncertainty as an additional factor to derive the product’s supply chain strategy from.
Lee (2002) ties demand uncertainty to the different product categories in the same way as Fisher (1997) (i.e. functional products with low demand uncertainty and innovative products with high demand uncertainty). When it comes to supply uncertainty, Lee (2002) describes a stable supply process as where the manufacturing process and technologies used are mature and the base of

ME200X 2013-06-11 Benjamin Löfdahl & Birger Sjödin
8
available suppliers is well established. On the other hand, an evolving supply process is described as one where the manufacturing process and technologies used are under early development and still changing rapidly. A consequence of this may be a limited range of capable suppliers. Lee (2002) claims that evolving supply processes are often subject to disruptions and breakdowns.
According to Lee (2002) it is a more challenging task to manage a supply chain for innovative products than for functional products. In the same way it is more challenging to manage a supply chain for products that require the use of evolving processes than for products that can be produced using stable processes. Therefore all companies are recommended to identify and counter the underlying sources to supply or demand uncertainties, hence try to reduce the uncertainties and obtain a more predictable and manageable supply chain (ibid).
Strategies are presented that can be applied in order to reduce either demand uncertainty or supply uncertainty (ibid). The basis for both types of reduction strategies is similar; close collaboration with suppliers and constant real time information sharing across the supply network is considered to be of high importance in order to reduce uncertainties regarding both supply and demand (ibid). Several concrete examples and real business cases are presented where companies have been able to increase efficiency throughout their supply chains through information sharing and collaborative demand planning (ibid). To support his theories, Lee (2002) also presents data indicating that firms involved in joint demand and logistics planning have a higher profitability than firms that do not. One action, argued for by Lee (2002), to reduce supply uncertainties is to share information regarding new products with suppliers in an early phase of the product development. It is also argued that design collaborations with suppliers concerning new products can reduce supply uncertainties. Utilizing supplier hubs is another way of reducing supply uncertainty, however all reduction strategies comes down to transparency and efficient communication throughout the supplier network.
Lee (2002) ties four different supply chain strategies to his framework, one to fit the supply chain characteristics of each quadrant of the matrix in Figure 1.
Figure 1. The uncertainty framework (Lee, 2002).
The different strategies are: efficient supply chains, risk-hedging supply chains, responsive supply chains, and agile supply chains. The strategies are matched to the framework in Figure 2.

ME200X 2013-06-11 Benjamin Löfdahl & Birger Sjödin
9
Figure 2. Supply chain strategies (Lee, 2002).
Efficient supply chains are optimal for functional products with stable manufacturing processes. These supply chains aim at cost efficiency by; eliminating non-value-adding activities, pursuing economies of scale, optimization, and full capacity utilization through continuous improvements. Transparency of distribution schedules, demand planning, forecasting, and capacity information throughout the supplier network is of high importance (ibid).
Risk-hedging supply chains are well suited for functional products with high supply uncertainty. Risk-hedging implies pooling or sharing resources in the supply chain so that the risk can be spread and mitigated in the event of a supply disruption. Sourcing components from more than one supplier (i.e. dual sourcing) is one way of hedging the risk, increased safety stock of key components is another. Lee (2002) suggests sharing expensive inventory of key components with other companies that sources the same components in order to share and reduce the cost of safety stock.
Responsive supply chains are characterized by flexibility and responsiveness to meet diverse customer needs and fluctuations in demand. Companies utilizing this strategy usually apply a make-to-order practice to satisfy the need of customizing products without the need for extensive inventory of finished goods. Flexible mass customization processes are also used in order to meet the specific requirements of customers. Modularized products that can be differentiated late in the value chain are optimal for a responsive supply chain.
The agile supply chains strategy aims at combining the strengths of the responsive and the risk-hedging strategy. Thus taking actions to be responsive and flexible when it comes to customer needs while pooling inventory and sourcing components from several suppliers to mitigate the risk in the occurrence of a disruption. These supply chains are agile since they can cope with both demand and supply uncertainty.
Conclusively, Lee (2002) states that demand and supply uncertainties can be used as a framework to choose the appropriate supply chain strategy for a product. Information sharing, coordination, collaboration, and postponement of the order differentiation have proven to be key characteristics of a successful supply chain.
2.1.2 Supply Chain Fit Wagner et al. (2012) present indications of the existence of relationships between supply chain fit and financial performance in today’s manufacturing industries. Their extensive research is based on

ME200X 2013-06-11 Benjamin Löfdahl & Birger Sjödin
10
the survey results and financial data from 259 diverse companies from Europe and the U.S. The concept of supply chain fit is based on Fisher’s (1997) framework and concerns the supply and demand uncertainty of a product in relation to its supply chain design characteristics. Supply chain fit is defined as: “The perfect strategic consistency between a product’s supply and demand characteristics (such as demand predictability, life-cycle length, product variety, service, lead-times, and specific market requirements) and supply chain design characteristics (such as inventory strategy, product design strategy, and supplier selection aspects)” (Wagner et al., 2012, pp. 341). For predictable products (i.e. functional products) the perfect fit is obtained with an efficient supply chain. For unpredictable products (i.e. innovative products) a perfect fit is obtained with a responsive supply chain (Fisher, 1997). The working hypothesis of Wagner et al. (2012) is that there exists a positive relation between supply chain fit and financial performance.
Through their quantitative survey, including questions regarding supply and demand uncertainty measurements as well as supply chain responsiveness measurements, Wagner et al. (2012) are able to calculate the supply chain fit of each responding company. The results are then individually compared to the Return on Assets (ROA: net income divided by total assets) for each respective firm.
A total of nine firms were assessed to have a supply chain fit and these firms had an average ROA of 10.57%. 180 firms achieved a negative misfit, see Figure 3, with an average ROA of 5.80%. The remaining 70 firms achieved a positive misfit with an average ROA of 7.73%.
Figure 3. The supply chain fit framework (Wagner et al., 2012; adapted from Chopra and Meindl,
2010 and Fisher, 1997).
Wagner et al. (2012) suggest that to achieve supply chain fit companies must consider the following three factors. First, companies need to understand the demand and supply uncertainty of their specific products and customer needs. Second, firms need to understand the capabilities and characteristics of their supply chains (i.e. the level of efficiency/responsiveness). Third, companies need to make sure that the level of responsiveness/efficiency in a specific supply chain is consistent with the supply and demand uncertainty of the product (ibid).

ME200X 2013-06-11 Benjamin Löfdahl & Birger Sjödin
11
Based on the results, it is also concluded that a positive misfit is more desirable than a negative misfit. This implies that companies struggling to achieve supply chain fit should invest to achieve a more efficient supply chain (e.g. through inventory reductions) rather than a more responsive supply chain (e.g. through postponing the decoupling point, the point where the product becomes order specific) in order to increase financial performance (ibid). Ultimately, Wagner et al. (2012) conclude, based on the results, that there exists a positive relation between supply chain fit and financial performance.
2.1.3 Hybrid Products Wang et al. (2004) presents not only two, but three different types of products carrying different product characteristics, namely; functional products, innovative products, and hybrid products. The concept of hybrid products is described as being either a combination of functional components or a mix of innovative and functional components (Huang et al., 2002; Wang et al., 2004).
Three basic supply chain strategies, corresponding to the different product types are presented as; lean supply chains (LSC), agile supply chain (ASC), and hybrid supply chain (HSC) (Huang et al., 2002; Wang et al., 2004). These supply chain strategies are linked to the different product types and the four stages of a product life cycle (i.e. introduction, growth, maturity, and decline (Wiersema, 1982)), see Table 1. The LSC focuses on cost efficiency through inventory reductions, continuous improvements, and waste elimination. The ASC focuses on fast response to unpredictable market demand. Through flexibility and speedy deliveries the ASC can cope with changing customer requirements. The HSC is described as an intermediate supply chain to the LSC and ASC combining characteristics from the two (Huang et al., 2002). It generally focuses on assemble-to-order-products consisting of functional components and innovative features whose demand can be somewhat accurately forecasted. Mass customization is facilitated through postponing the decoupling point until late in the assembly process. Components manufactured for a HSC-product can utilize both lean and agile production techniques.
Product life cycle: Product type:
Functional products Innovative products Hybrid products Introduction LSC ASC HSC Growth LSC ASC HSC Maturity LSC HSC/LSC HSC Decline LSC HSC/LSC HSC
Table 1. Supply chain classification based on product type and product life cycle (Wang et al., 2004).
2.1.4 Supply Chain Structures Stavrulaki and Davis (2010) further highlight the importance of strategic alignment between the supply chain’s strategic capabilities and the operational objectives of manufacturing and logistics. The authors identify four different supply chain structures that are utilized by today’s industrial firms: build to stock (BTS), assemble to order (ATO), make to order (MTO), and design to order (DTO). The research presented by Stavrulaki and Davis (2010) is based on previous research concerning product categories (functional or innovative) and their linkages to supply chain characteristics (efficient or responsive), as presented by Fisher (1997). This framework was later expanded by Lee (2002) in

ME200X 2013-06-11 Benjamin Löfdahl & Birger Sjödin
12
order to include supply uncertainties. Stavrulaki and Davis (2010) continued the expansion by including guidelines for production and logistics process selection. Furthermore, responsiveness is here defined by Reichhart and Holweg (2007) as a form of external flexibility which is visible and understood by the customer. Along with responsiveness, internal flexibility, which focuses on inbound manufacturing and logistic processes, are both key drivers to a company’s agility.
One of the previously mentioned supply chain structures, ATO (assemble to order), is based on the notion of having the decoupling point relatively far downstream in the production process. This is preferably done by using a modular approach in order to offer customers customization options without a considerable amount of unique components. Upstream from the decoupling point, a cost-efficient (or lean) manufacturing strategy would offer efficiency without compromising the overall agility of the supply chain. This is important since ATO supply chains tend to have low profit margins. Downstream from the decoupling point, a focus should be on agility in order to stay competitive in a fluctuating market. Christopher and Towill (2001) denote these hybrid supply chains leagile (a combination of lean and agile). An ATO supply chain is typically controlled by the assembling firm and there are generally a small number of intermediaries in an ATO supply chain, meaning that products are delivered to retailers or to the end customer directly. (Stavrulaki and Davis, 2010)
Another specific supply chain structure mentioned above is MTO (make to order). Here, the decoupling point is located further upstream in the value chain. Raw material is being efficiently sourced in a lean manner, up to the decoupling point where components are constructed according to customer orders. Downstream from the decoupling point the supply chain should, according to Stavrulaki and Davis (2010), be responsive in order to fulfill customer requirements and be flexible enough to cope with demand uncertainty. Seeing as the opportunity to reap the benefits of lean manufacturing are not as great as in supply chains with the decoupling point further downstream, Stavrulaki and Davis (2010) suggest that one way to achieve efficiencies is to invest in long term relationships with key suppliers of standardized components. Stavrulaki and Davis (2010) conclude that close relationships can drive down costs, increase product quality and at the same time promote timely deliveries. The low volume products usually associated with MTO supply chains can however pose a barrier for bargaining with suppliers (ibid).
MTO supply chains are preferably utilized to manufacture and deliver products of low volume and high margin. Compared to ATO, MTO supply chains correspond in principle to longer lead time, since the decoupling point is further upstream. Furthermore, retailers rarely exist in MTO supply chains which can be beneficial in order to increase response time to customer demand. How different supply chain characteristics correspond to different construction methods and supply chain strategies is described in Figure 4.

ME200X 2013-06-11 Benjamin Löfdahl & Birger Sjödin
13
Figure 4. Alignment of supply chain strategy (Stavrulaki and Davis, 2010).
2.1.5 Case Relevance Contemporary research often has its base in Fisher’s work (1997) and in the specific case of FUMO™ the authors needed to pinpoint the product on the functional-innovative continuum in order to identify suitable supply chain characteristics. Building on Fisher’s research (1997), Lee (2002) adds supply uncertainty which results in the additional strategies: risk-hedging and agility. Applying this expanded framework to FUMO™ would increase the chances of supply chain fit between product and supply chain characteristics. As a suitable supply chain structure was to be identified for FUMO™, the framework of Stavrulaki and Davis (2010) was of high importance. If a perfect fit in the FUMO™ project required resources that could not be reasonably spent, the lesson from Wagner et al. (2012) is that positive misfit (i.e. more efficient) generally yields a better financial performance in terms of ROA than a negative misfit.

ME200X 2013-06-11 Benjamin Löfdahl & Birger Sjödin
14
2.2 Supplier Selection Methodology Over the last two decades numerous publications have presented different approaches to supplier selection challenges. Many of these authors (Ghodsypour, 1998; Chan, 2003; Wang et al, 2004; Percin, 2006; Lee, 2009; Ghosh et al, 2012) base their methodologies on the Analytic Hierarchy Process (AHP) first presented by Saaty (1980).
AHP is a decision-making methodology used to decompose a complex problem into a multi-level hierarchy consisting of factors that affects the decision (Saaty, 1990a). Saaty (1990b) claims that perhaps the most creative task in making a decision is to decide the factors important for that decision. The AHP facilitates the decision by arranging these chosen factors hierarchically from an overall goal to criteria, sub-criteria, and decision alternatives in descending levels (Saaty 1990b), see Figure 5. According to Wind and Saaty (1980), AHP can provide a suitable framework and methodology for evaluating a number of vital corporate decisions, such decisions as which supplier to select for a certain product or component.
The process of evaluating decision alternatives with AHP implies scaling the relative weight of elements in each level with respect to criteria in the higher level of the hierarchy. This is done through pair-wise comparison of each element within a level (Wind and Saaty, 1980). Pair-wise comparisons are performed through subjective comparison of two elements on a single property. This is achieved by participating managers who assign every comparison a scale value to represent one element’s level of dominance over the other. The subjectively generated pair-wise comparison results are arranged in a series of nxn comparison matrices with a diagonal of ones and assigned scale values in each respective cell.
Wang et al. (2004) propose in their article a framework for selecting suppliers for any specific product. Wang et al. (2004) name the framework a multi-criteria decision-making methodology based primarily on AHP that matches supplier characteristics with product characteristics. The supplier selection methodology is created by incorporating the Supply Chain Operations Reference (SCOR) model with AHP. The SCOR model is designed by the Supply Chain Council and presents a set of supplier performance attributes each with a group of metrics to objectively measure and compare suppliers (Supply Chain Council, 2010, Wang et al., 2004). The attributes and metrics are set as level 2 and 3 of the hierarchy in the AHP, see Figure 5.

ME200X 2013-06-11 Benjamin Löfdahl & Birger Sjödin
15
Figure 5. AHP with incorporated SCOR model (Wang et al., 2004).
At the top of the AHP is the overall objective to which the decision should contribute. In Figure 5, the objective is to optimize the overall supplier efficiency. Level 4 corresponds to the available alternatives (i.e. the available suppliers). The SCOR model is used as criteria for supplier selection. The basic idea of the methodology is to rate and compare capable suppliers based on the metrics provided by the SCOR model. Wang et al. (2004) point out that the number of levels in the AHP and the performance metrics used can be modified to fit a certain company’s needs (ibid).
When the hierarchy is designed and criteria for selection are set the relative importance of criteria (i.e. level 2) and sub-criteria (i.e. level 3) are prioritized and weighted based on product characteristics and corresponding supply chain strategies in relation to the product types presented earlier (i.e. functional, innovative, and hybrid). This is preferably determined by experienced managers using pair-wise comparison in accordance with Saaty (1990b). Supplier alternatives are then subjectively rated in the same manner on each performance metric and through integration with the weights, an overall score is calculated for each available supplier. The supplier with the overall highest rating is the optimal choice based on product characteristics, due to the weighted prioritized metrics. If no capacity constraints occur and there is no need for dual sourcing this supplier should be made responsible for delivering 100% of the demand (Wang et al., 2004).
2.2.1 Differences between AHP and ANP Sarkis and Talluri (2002) present a framework for strategic supplier selection based on the Analytic Network Process (ANP) introduced by Saaty (1996). Sarkis and Talluri (2002) claim that the ANP is a generalized development of the more popular decision-making tool AHP as presented by Saaty (1980). It is argued that even though AHP is a robust, easy to use technique it implies some shortcomings that can be avoided using the ANP. It is argued that the greatest disadvantage of AHP is that it only considers one-way hierarchical relationships among factors. When evaluating a decision
ME200X 2013-06-11 Benjamin Löfdahl & Birger Sjödin
16
using AHP all factors are rated separately to generate an overall score for each decision alternative, while an ANP approach allows the decision-maker to explicitly consider interrelations among factors affecting the decision (e.g. cost and quality may impact the flexibility of a supplier) (Sarkis and Talluri, 2002). However, it is concluded that ANP might imply disadvantages in relation to AHP, since ANP can be complex to use because of the increasing number of factors and interrelations to analyze and interpret (ibid).
2.2.2 Case Relevance Comparing the spread and use of AHP to ANP, AHP is dominant in supplier selection literature. The AHP offers advantages favored by supply chain managers since it is easy to use and understand, and at the same time flexible and configurable to fit a certain situation. Combining well-established supplier performance metrics with the AHP creates a powerful tool for selecting potential suppliers.
2.3 Performance Measurement System In this section the authors have comprised research concerning supplier measurement systems. First, the SCOR model is briefly explained. Second, research concerning the industries’ current approaches is described. Finally, purely theoretical approaches to performance measuring systems are reviewed. A comprehensive list of performance metrics relevant to high-tech start-up companies can be found in Appendix A.
2.3.1 SCOR Model The Supply Chain Operations Reference model (SCOR) is a framework for evaluating and comparing supply chain activities and performance, published by a non-profit global organization called the Supply Chain Council (SCC) (Supply Chain Council, 2010). SCC is founded, and consists, of a consortium of member organizations that volunteer in developing and improve tools for superior supply chain management. SCOR is today used by thousands of organizations worldwide and provides frameworks, improvement methodologies, and benchmarking tools for companies to rapidly improve their supply chain performance (ibid).
One key component of the SCOR model is the performance section, consisting of performance attributes and metrics provided to monitor and evaluate supply chain performance. A performance attribute is a group of metrics related to a strategic direction of the supply chain (ibid). Hence, performance attributes constitute the highest level category of metrics. The SCOR model contains five performance attributes namely; reliability, responsiveness, agility, costs, and asset management. Reliability corresponds to supply chains with a focus on delivery performance. Metrics sorted within responsiveness and agility are measuring performance on key attributes to supply chains with either a responsive or an agile strategy (ibid). While costs and asset management metrics corresponds to performance attributes of a cost efficient or lean supply chain (ibid).
The performance attributes are broken down into metrics on three different levels. Focusing on level 1 metrics, representing the overall performance of a supply chain, eleven metrics are divided between the five different attributes (ibid). Perfect order fulfillment is sorted to reliability and further broken down into delivery performance to customer commit date, orders received damage free, payment documentation accuracy etc. (ibid). Order fulfillment cycle time belongs to level 1 within the responsiveness attribute. It is further decomposed into cycle times for every activity of the order

ME200X 2013-06-11 Benjamin Löfdahl & Birger Sjödin
17
cycle in lower levels (ibid). Agility consists of level 1 metrics concerning a supply chain’s ability to be flexible and adaptable when it comes to uncertainties in supply and demand (ibid). Cost of goods sold and overhead supply chain management cost constitutes the level 1 metrics within costs (ibid). Finally, asset management includes metrics such as cash-to-cash cycle time (ibid).
These metrics can be used as benchmarks to compare the performance of different supply chains (ibid). Wang et al. (2004) creates a supplier selection methodology by incorporating level one metrics of an earlier version of the SCOR model with AHP.
2.3.2 Established Industry Approach Bharadwaj (2004) conducted a survey where representatives from 113 firms within the electronics manufacturing industry answered a questionnaire concerning the importance of different decision criteria for selecting suppliers for electronic components. The sourcing firms spanned over a large array of electronic products in order to encompass results for both functional and innovative products. The decision criteria-categories and the appurtenant task-related processes/outcomes were based on findings from previous literature.
The first decision criterion was product quality, which consisted of the measuring of the supplier’s product quality in the aspect of performance and functionality. The second decision criteria, deliver/order fulfillment was meant to cover the most crucial aspects of the deliverance. Order cycle time measured the lead time between ordering and delivery. On-time delivery performance was meant to measure the number of orders received on-time. The supplier’s accuracy in billing and credit was also considered an important aspect to measure. Finally, the defect rate was also a metric of interest. This is a measurement of the condition of the supplier’s products on arrival. The third decision criteria was service, which in Bharadwaj’s (2004) study consisted of the metrics post sales assistance and support and ability and willingness to assist with the design process. Bharadwaj’s (2004) last decision criteria was price, which consisted of the metric price of supplier’s products and services.
The main purpose of Bharadwaj’s (2004) study was to identify which supplier abilities that actually matter the most to sourcing companies. A secondary purpose was to investigate whether the importance of the abilities differed depending on the characteristics of the product. The results indicate that the order of importance of supplier abilities in the electronic industry is as follows: product quality, deliver/order fulfillment, service, and lastly price. No significant difference was shown between firms sourcing lower-complexity products and higher-complexity products. Most prior research suggests that decision criteria should differ among product categories, however the result of this study indicates that the industry does not see it that way.
Bharadwaj (2004) also give five reasons for business customers to have a formal system set up to identify and continuously measure supplier performance. First, it offers a tangible tool by which suppliers can be evaluated. Second, the information obtained can be used to determine baseline levels of acceptable operational performance for suppliers. Third, exceptional suppliers can be identified which can lead to an efficiency increase if future business is directed towards these suppliers. Fourth, underperforming suppliers can be identified and discarded. Fifth and final, by having clearly stated key performance metrics instead of arbitrary evaluation methods, firms can make themselves more attractive as business partners.

ME200X 2013-06-11 Benjamin Löfdahl & Birger Sjödin
18
Gunasekaran et al. (2004) have developed a framework for supply chain performance measurement. This framework consists of metrics on a strategic, tactical, and operational level. 21 companies from a wide range of industry settings participated in the development of this framework by answering a questionnaire concerning the relative importance of metrics within different categories which stems from the work of Gunasekaran et al. (2001). The different categories were strategic planning metrics, order planning metrics, supplier metrics, production metrics, and delivery performance measures. One of the most important metrics in the first category was lead time, which refers to the receipt of a customer order until the delivery of finished goods to the customer. This is closely linked to the response time of the entire supply chain which makes it an important metric.
The second category, order planning, contains one metric which was ranked quite high in the survey, namely customer query time. The fact that this metric was ranked as the most important of the order planning metrics is considered to be a result of the increasing demand of customer service. Generally, customers are often inclined to enquire about the status of their orders or potential changes in availability or delivery (Gunasekaran et al., 2004).
Percentage of defects was ranked the highest in the category production metrics. This metric is related to the product quality, which according to Gunasekaran et al. (2004) explains why the metric was ranked the highest.
Capacity utilization was also ranked highly important in the production metrics category. Capacity utilization affects the responsiveness to customer demand since it impacts flexibility, deliverability, and lead time.
Among the delivery performance metrics, the two highest ranked metrics were quality of delivered goods and on-time delivery of goods. These were regarded to be of almost equal importance. Gunasekaran’s et al. (2004) explanation to this is that they are both part of the foundation for how the customer perceives the value of the delivered product.
2.3.3 Theoretical Approach to Selecting Performance Measures Gunasekaran et al. (2001) present in their work a list of supply chain performance measures which concerns suppliers, delivery performance, customer-service, and costs related to inventory and logistics. The authors have intentionally tried to align these metrics to the cornerstone customer satisfaction. Gunasekaran’s et al. (2001) work was contemporary in its time since the importance of non-financial performance measures was generally being accepted by companies, however research suggest that there was a lack of balance between financial and non-financial measures in existing frameworks. Gunasekaran et al. (2001) suggested that non-financial measures should be used for control and evaluation on a day-to-day operational level, while financial measures instead should be used at a strategic level. Another reason for this kind of research concerning performance metrics was that companies were relying more on quantity than quality in their measurement systems, meaning they utilized too many unique measures instead of focusing on a few good ones (ibid).
One of the metrics Gunasekaran et al. (2001) present is order lead time. Order lead time is a major source of competitive advantage in many of today’s industries since a reduction in order lead time generates higher responsiveness of the supply chain. The reliability and consistency of the lead time is also of great importance since fluctuations may cause deficiencies in customer service (ibid). On-time delivery is an important aspect of delivery performance which also regulates the customer service level. Another metrics presented is capacity utilization. According to Slack et al. (1995, in
ME200X 2013-06-11 Benjamin Löfdahl & Birger Sjödin
19
Gunasekaran et al., 2001) capacity utilization is directly related to the speed of response to customer demands. Gunasekaran et al. (2001) therefore suggests that by measuring capacity utilizations, firms can assess potential gains in flexibility, lead time, and deliverability.
Customer query time is according to Gunasekaran et al. (2001) another measure of high importance. A shorter query time will provide customers with real time information at a faster pace, thus increasing the customer service level. Gunasekaran et al. (2001) therefore suggest that companies should identify which procedures that actually exist to inform customers.
Sarkis and Talluri’s (2002) research is another example of a theoretical approach to developing a performance measurement system. The main contribution of Sarkis and Talluri (2002) is a strategic supplier selection framework based on the Analytical Network Process (Saaty, 1996). This framework incorporates evaluation metrics considering strategic and operational measures. Metrics are gathered from previous research, combined, boiled down, and clustered to either strategic performance metrics or organizational factors. The strategic performance cluster consists of four categories, namely; cost, quality, time, and flexibility (Sarkis and Talluri, 2002). The cost category includes metrics such as cost reduction activities and low initial price, corresponding to the unit price of delivered goods. As for the SCOR model, metrics within the cost category corresponds to a cost efficient supply chain. In the same way, service capability and product volume changes oriented within the flexibility category, are performance measures of a flexible supply chain. Additions to the SCOR outline are the categories quality and time. Quality features metrics such as quality philosophy and consistent deliveries, while time includes delivery speed and product development time (ibid).
The organizational factors cluster consists of the three categories; culture, relationship, and technology (ibid). Culture & relationship are more intangible then most other categories, however important additions to the framework. These two categories include metrics such as strategic fit, management attitude/outlook for the future, communication openness, and the promise of a long-term relationship between buyer and supplier (ibid). Other metrics presented are often straight forward and easy to measure with quantitative input data. However metrics in the culture & relationship categories need, to a higher extent, more qualitative input and subjective judgments than for example cost metrics. Finally, the technology category presents further important additions such as supplier’s design capability, current manufacturing facilities/capabilities, and assessment of future manufacturing capabilities (ibid).
Huang and Keskar (2007) presents 101 metrics divided into seven different categories for evaluating suppliers. The list of metrics builds on the basic structure and categories of the widely accepted SCOR model, with the addition of the two categories safety and environment. Metrics are gathered from previous research, boiled down and compiled into a comprehensive list.
The first category presented is reliability that consists of metrics such as; percentage of orders received on time to commit date, percentage of orders received defect free, and incoming material quality control. Percentage of orders received on time to commit date is defined as the number of orders received on time to commit date, divided by the total number of orders processed in the measurement time. This is a metric to evaluate the on-time delivery performance of suppliers. Percentage of orders received defect free is defined as number of orders received defect free divided by the total number of orders processed in the measurement time. Hence, this measure evaluates the defect rate of a supplier. Incoming material quality control is explained as quality assurance procedures, control over quality of incoming material at supplier and quality improvement

ME200X 2013-06-11 Benjamin Löfdahl & Birger Sjödin
20
perspective towards supplier’s suppliers. Thus, this is a way of measuring the quality achieved by a supplier.
Some of the metrics categorized under responsiveness is; order fulfillment lead-time, return product velocity, and production engineering cycle time. Order fulfillment lead time is defined as the average actual lead times consistently achieved. Lead time is a well-established and recurrent metric in supplier selection literature. Return product velocity is defined as average time required for process of returning the defective, incomplete or damaged orders and reshipping of the orders to customer. This metric can be applied to evaluate the responsiveness of handling defective products. Last in this category is the production engineering cycle time, explained as the average time required for generation and delivery of final drawings, specifications, formulas, part programs, etc. In general this is done as preliminary engineering work as part of the quotation process. This could be a measurement of the time required to set up production.
The flexibility category includes metrics regarding production and delivery flexibility. One example is upside production flexibility defined as number of days required to achieve a specific unplanned and sustainable increase in orders. Similar metrics exists for sustainable decrease in production. These metrics are used to measure suppliers’ flexibility to cope with fluctuating demand.
Cost & financial includes metrics such as financial stability and payment terms. Financial stability is defined as an indicator of excessive asset price volatility, the unusual drying-up of liquidity, interruptions in the operation of payment systems, excessive credit rationing etc. This is simply a measurement of the financial situation of a supplier, e.g. a financially unstable supplier with poor liquidity might have difficulties paying their suppliers, thus struggling to receive raw material for producing goods. Payment terms is explained as the suitability of terms and conditions regarding payment of invoices, open accounts, sight drafts, credit letter, and payment schedule. This could be a measurement of the cash-to-cash cycle time obtained by the buyer if choosing a specific supplier.
The category asset & infrastructure consists of metrics such as; company size, capacity utilization, legal claims, quality system certification/assessment, strategic fit, critical process subcontracting, designing capabilities, manufacturing/process capabilities, and cultural similarity. Company size is defined as an indicator of various factors such as facility size, area, work force strength, turnover, capacity, etc. Capacity utilization is defined as a measurement of how intensively a resource is being used to produce a good or service. Legal claims is defined as pending or filed legal claims against a supplier. This could be an indicator of disputes in previous supplier-customer relationships. Quality system certification/assessment is defined as quality certifications acquired and performance on conformance audits during measurement period. This could serve as an indicator of the quality standard of a supplier. Strategic fit is defined as the compatibility of long term planning in regards to expansion plans, area of concentration, interest in collaborating etc. Thus, a measurement of the strategic fit between the buyer and a supplier. Critical process subcontracting is defined as percentage of critical processes subcontracted by supplier, hence a measurement of in-house process capabilities. Designing capabilities is defined as capabilities regarding conceptualizing, designing, drafting, and prototyping of new product requirements. This is a metric that corresponds to the supplier’s ability to aid in the design process of a product. Manufacturing/process capabilities is defined as capabilities in areas of machining, manufacturing, assembly, and special purpose machines and equipment etc. in line with product requirements, hence a measurement of how

ME200X 2013-06-11 Benjamin Löfdahl & Birger Sjödin
21
capable a supplier is of actually produce the intended goods. Finally in this category, cultural similarity is defined as cultural and language barriers between buyer and supplier.
Huang and Keskar (2007) added the categories safety and environment to the SCOR structure. The safety category consists of metrics related to safety performance and the occurrence of accidents. One example is recordable incident rate, defined as recordable incident rate per 100 employees. The environmental category contains metrics such as; hazardous/non-hazardous waste, chemical releases, global warming gases, and ozone depleting chemicals.
2.3.4 Case Relevance The bank of metrics presented in this report (see Appendix A) consists of a mix between efficiency and responsiveness related metrics. This makes selection from this bank appropriate regardless of whether the focal firm is in a functional, hybrid, or innovative product market. Numerous metrics that are related to the specific needs of start-up companies can be found in the bank of metrics. These metrics are related to capabilities and experience usually unattained by start-up firms such as; ability to assist in service and maintenance, ability and willingness to assist in the design process, manufacturing/process capabilities, similarity in previous projects, years within the industry, etc. Maintaining high diversity in the bank of metrics is essential in order to design a supplier selection model which can be applicable to a wide range of high-tech start-up firms.

ME200X 2013-06-11 Benjamin Löfdahl & Birger Sjödin
22
3 Methodology
In order to answer the research questions, a bottom-up approach has been applied, implying that the sub-questions have been answered first through the use of a case study at Realisator. This chapter explains and justifies all methods used to conduct the research.
A structured methodology process was of utmost importance in the work of answering the research questions posed in this thesis. Table 2 illustrates the methodology process and connects actions to results.
Action Research Questions
RQ1: How could suppliers be evaluated and selected to find the best suited suppliers for FUMO™?
RQ1.1: What are the product characteristics of FUMO™?
RQ1.2:Which supply chain strategy relates to the product characteristics of FUMO™ and business strategy of Realisator?
RQ2: How could high-tech start-up firms select suitable suppliers for their products?
Interview X X X
Literature review
X X X X
Workshop X X
OEM interviews X X
Team meetings X X
Table 2. The table illustrates which action that relates to which research questions.
3.1 Product Characteristics and Supply Chain Strategy Alignment A prerequisite to be able to answer RQ1.1 and RQ1.2 was a complete understanding of the inbound components in the product, its functionality, and to which customers the product is directed. This understanding has stemmed from interaction with the prototype and analyzing inbound components and blueprints. Reviews of previous literature have revealed which product characteristics that would affect the supply chain design and have also aided in the categorization of FUMO™ on the functional-innovative continuum. Market data have further been derived from earlier market analysis conducted by Realisator, in order to extract the most important customer values. The sample for the market analysis included a few of the largest firefighting brigades in Sweden (AB Realisator Management Consulting, 2009).
The link between product characteristics and supply chain strategy is a recurrent topic of previous research and was derived from in-depth literature reviews. Theories regarding supply chain- and product characteristics related to supply and demand uncertainty were reviewed in order to determine the supply chain strategy suitable for Realisator.
Through several project meetings and an additional semi-structured interview with the CEO at Realisator the authors obtained the company’s business strategy.
ME200X 2013-06-11 Benjamin Löfdahl & Birger Sjödin
23
3.2 How Should Suppliers be Evaluated and Selected? In order to answer RQ1 and RQ2, numerous different supplier performance metrics have been reviewed through previous research. By basing this thesis on proven, highly researched metrics from a variety of authors, the validity of the work could be enhanced. A possible alternative solution could have been to adopt an existing compilation of metrics. However, the potential for customization for high-tech start-up firms could have been improved by being more selective in the process, since each metric could be handpicked.
There exists an extensive body of literature covering the field of supplier selection. Existing supplier selection methodologies have been studied and evaluated in relation to the specific context of a company entering a new business and market with a new innovative product. These practices have been analyzed in order to design a supplier selection model, customized for Realisator and generally applicable for high-tech start-up companies.
The framework chosen to house all performance metrics is the widely accepted Analytic Hierarchy Process (AHP) developed by Saaty (1980). The AHP serves as a decision making tool where a problem or an overall goal is hierarchically decomposed into descending levels of criteria, sub-criteria, and alternatives, see Figure 5. AHP can be used to measure both qualitative and quantitative input and has served as a base for many elaborated supplier selection methods presented in more recent years (Ghodsypour, 1998; Chan, 2003; Wang et al, 2004; Percin, 2006; Lee, 2009; Ghosh et al, 2012). AHP was mainly chosen as a framework because of its propagation and establishment in supplier selection literature. Furthermore it is easy to use, and flexible to configure and apply on any supplier selection scenario.
3.3 How Could Suppliers be Evaluated and Selected to Find the Best Suited Suppliers for FUMO™? In this section, the authors present the method used to extract relevant metrics and customize the inter-rankings to fit the Realisator case, thus answering RQ1.
3.3.1 AHP as a Supplier Selection Tool As stated in literature regarding AHP as a supplier selection tool; overall objective, criteria, sub-criteria, and levels should be customized to fit each company utilizing the method (Wang et al., 2004; Ghosh et al., 2012). Criteria are usually set as categories for measurable supplier performance (e.g. cost, quality, delivery), while sub-criteria are the measurable metrics used to evaluate and compare suppliers (e.g. price per unit, defect rate, lead time). In order to obtain categories and metrics for the customized AHP-model, a three-step approach was utilized, illustrated below in Figure 6.

ME200X 2013-06-11 Benjamin Löfdahl & Birger Sjödin
24
Figure 6. Methodology for the metric procurement process.
First, the authors constructed a comprehensive list of performance metrics based on an extensive literature search. The work of established researchers has been reviewed and over 200 metrics have been evaluated. In an initial screening the authors narrowed down the list to consist of 31 diverse metrics covering 8 different categories. These metrics were considered relevant and applicable to the case and also to high-tech start-up firms in general. The removed metrics were either recurrent doublets or considered redundant. The remaining metrics were also unambiguously defined in order to remove the risk of misconceptions (Huang and Keskar, 2007). Second, the remaining metrics were further evaluated in regard to its characteristics. This aided the categorization of metrics as well as the decision making concerning whether a qualitative or quantitative approach should be used to extract information from suppliers (ibid). Third, each category and metric were reviewed in order to assure their relevancy and screen for any redundancy (ibid). The authors also maintained a holistic view in order to spot potential gaps in the bank of metrics. This iterative process resulted in the addition of a ninth category, apart from the eight existing categories, consisting of six CSR-metrics (Corporate Social Responsibility). However the intention was to keep these as mere qualifying metrics. This meant that potential suppliers would not be rated on these CSR-metrics, as long as they lived up to a set of predetermined requirements.
3.3.2 Workshop To determine the relative importance of the metrics and categories chosen in relation to product characteristics and corresponding supply chain strategies, a prioritization procedure should be carried out by experienced supply chain managers according to Ghosh et al. (2012) and Wang et al. (2004). To obtain these relative weights and in order to methodically distinguish which supplier performance metrics that were to be used in the AHP-model, a workshop was conducted. Participants, apart from the authors, were the owner and CEO of Realisator, the authors’ senior supervisor at Realisator, and a supply chain Ph.D. student at KTH, Stockholm. The Ph.D. student was

ME200X 2013-06-11 Benjamin Löfdahl & Birger Sjödin
25
invited to obtain an outsider’s perspective and to add to the limited supply chain experience held by Realisator. The authors chose to conduct a workshop in order to combine the input of those individuals with most knowledge concerning the product and those with more extensive knowledge regarding supply chain management.
The primary goal for the workshop established by the authors was to attain relative weights of importance for each metric and category. The secondary goal was to narrow down the number of metrics and only retain the most important ones (Gunasekaran et al., 2001; Gunasekaran and Kobu, 2006). A pair-wise comparison round of the metrics in each category, followed by pair-wise comparing the categories would fulfill both the primary and secondary goal of the workshop by appointing relative importance to each metric in form of numeric values, and eliminate those that received the lowest ranking (Saaty, 1980; Saaty 2008). To facilitate learning and usable results from the workshop, prior to the workshop the authors analyzed the participants’ different positions in relation to the master thesis, as well as their previous knowledge concerning supplier selection and the FUMO™ case (Steinert, 1992). Information concerning the focal company, the FUMO™ concept and the authors’ contribution to the project, was sent to the Ph.D. student participating. All participants received the list containing the 37 metrics with definitions and suggestions for practical measurements prior to the workshop, in order to mitigate the risk of having to spend too much time familiarizing with the different metrics during the workshop (Tiberius and Silver, 2001). The authors also discussed the meaning of each metric extensively prior to the workshop. Potential interpretations of the metrics were also discussed to mitigate lengthy discussions during the workshop. As expressed by Tiberius and Silver (2001), real time activities have a tendency to take more time than planned ones, therefore the authors kept a close eye on the clock in order to assure that the workshop stayed on schedule so that all activities planned could be executed. The authors tested the complete workshop twice and estimated time consumption of each activity prior to the actual session in accordance with Steinert (1992) and Tiberius and Silver (2001).
The workshop started with a brief introduction of the authors, a description of the master thesis, and a short round of presentations of the participants. Step 1, the matter of ranking the supply chain metrics, then began. The 8 categories containing the initial 31 metrics had been printed on color-coded paper to make the whole process as pedagogical as possible (CSR-metrics were not ranked). The 8 overlying categories of metrics were then ranked relative to each other by first simply arranging them in a line from 1 to 8, according to the consensus of the discussion among the participants. The authors would allow complete elimination of categories if they were considered redundant or unnecessary by the participants. Next a pair-wise comparison was conducted in order to yield relative weightings to the categories (Wind and Saaty, 1980; Saaty, 2008). The idea was to arrange the remaining categories in an nxn matrix with the categories on both dimensions. The relative importance of each category is then pair-wised compared on a scale of 1-9, where 1 represents equal importance of two compared categories, 9 represents the highest level of superiority of the row element over the column element, and 1/9 represents the highest level of superiority of the column element over the row element, see Table 3 (Wind and Saaty, 1980; Saaty, 2008). This will result in an nxn matrix with a diagonal of ones and the relative importance between categories in each respective cell, see Figure 7.

ME200X 2013-06-11 Benjamin Löfdahl & Birger Sjödin
26
n = 3 Quality Cost Delivery Quality 1 3 7 (1/1.48 + 3/4.20 + 7/13.00)/n = 0.643 Cost 1/3 1 5 ((1/3)/1.48 + 1/4.20 + 5/13.00)/n = 0.283 Delivery 1/7 1/5 1 ((1/7)/1.48 + (1/5)/4.20 + 1/13.00)/n = 0.074 SUM 1.48 4.20 13.00 λmax = 1.48*0.643 + 4.20*0.283 + 13.00*0.074 = 3.097
Figure 7. Example matrix.
By normalizing each column, adding all normalized elements of one row, then dividing the sum with the number of rows (n), the relative weight of one row (i.e. one category) can be calculated. When relative weights are computed for each element in the hierarchy, an overall score can be calculated for each decision alternative. The result will show which alternative that represents the optimal contribution to the overall objective.
Intensity of importance
Definition Explanation
1 Equal importance Two activities contribute equally to the objective
3 Weak importance of one over another
Experience and judgment slightly favor one activity over another
5 Essential or strong importance Experience and judgment strongly favor one activity over another
7 Demonstrated importance An activity is very strongly favored and its dominance demonstrated in practice
9 Absolute importance The evidence favoring one activity over another is of the highest possible order of affirmation
2, 4, 6, 8 Intermediate values between the adjacent judgments
When compromise is needed
Reciprocals of above nonzero
If activity i has one of the above nonzero numbers assigned to it when compared with activity j, then j has the reciprocal value when compared with i.
1.1-1.9 If the activities are very close May be difficult to assign the best value but when compared with other contrasting activities the size of the small numbers would not be too noticeable, yet they can still indicate the relative importance of the activities.
Table 3. The fundamental scale of absolute numbers (Wind and Saaty, 1980; Saaty, 2008).
Step 2 was to rank each category’s metrics separately. This was done in the same manner as the ranking in step 1 (i.e. by pair-wise comparison). One of the authors’ main concerns was to assure active participation from all participants, since the diversity in opinions is a facilitator of a successful

ME200X 2013-06-11 Benjamin Löfdahl & Birger Sjödin
27
workshop (Steinert, 1992). All participants were explicitly encouraged to argue for their opinions in order to start a debate and finally reach a consensus on every comparison made.
According to Steinert (1992) feedback is an essential part of a workshop. The authors therefore sent out the results of the workshop to the participants, in which the steps could be traced back to the original 31 metrics.
3.3.3 OEM Interviews and Final Ranking Using Pair-wise Comparison In order to apply the model to identify the most suitable mix of characteristics an OEM could possess in relation to the FUMO™ case, it would also be necessary to narrow down the number of OEMs to include in the evaluation due to the time constraints of this work. Therefore, the authors analyzed which characteristics that simply would be qualifiers, meaning essential abilities among OEMs that would make them eligible for the evaluation process. This was done through close collaboration with the development and assembling team of the FUMO™ prototype, as well as meetings with potential key customers who had been involved in the development process. These capabilities were: mechatronical system assembly, low volume acceptance, total logistic responsibility, and quality and environmental responsibility standards ISO 9001 and ISO 14001.
Once the performance evaluation model had been fully designed, the process of finding eligible OEMs could begin. The search process was partly conducted online by using the Swedish marketplace-site for engineering industry, Qimtek (Qimtek, 2013), as well as Google. The most common search words were; kontraktstillverkning, legotillverkning, mekanisk montering, mekatronisk montering, and original equipment manufacturer. The authors also used company networks of contacts at the Swedish organization Robotdalen (Robotdalen, 2013). Five firms were selected for the evaluation process. A short pre-study and analysis of each OEM resulted in that the authors were convinced that these OEMs had the fundamental capabilities needed to manufacture FUMO™3.
In order to obtain input data to the model and to be able to compare the firms for each of the abilities in the evaluation model, structured interviews were held with one or two interviewees from each OEM, see Table 4. Structured interviews were utilized in order to obtain fully comparable results (Collis and Hussey, 2009). Interviews were conducted during a single one hour session with each OEM either face-to-face on the OEM’s production site, or via telephone depending on the geographical location of OEMs. The structured interview guide was designed to fit the set of metrics included in the evaluation model (16 top ranked metrics) based on the workshop results, see Appendix B. Before interviews were conducted all respondents signed non-disclosure agreements so that sensitive aspects regarding FUMO™ could be discussed. Thus, more correct product related information could be gathered from the suppliers.

ME200X 2013-06-11 Benjamin Löfdahl & Birger Sjödin
28
Original Equipment Manufacturers
Position of interviewee 1
Position of interviewee 2
Interview procedure
OEM1 Plant manager - On-site, face-to-face
OEM2 CEO Head of market On-site, face-to-face
OEM3 Plant manager - Telephone
OEM4 Head of sales and market
- Telephone
OEM5 CEO Process engineer Telephone
Table 4. Interviewees and corresponding interview procedures for OEM sample.
When all five OEMs had been separately assessed they were compared relative to each other using the pair-wise comparison method explained carefully in section 3.3.2. This implies that one 5x5 matrix for each of the evaluation metrics included in the model were used (i.e. 16 matrices in total). The end result manifested itself in a relative weighting among the five OEMs for each of the evaluation metrics. This combined with the models already weighted metrics yielded a ranking of the suitability of the OEMs in relation to the FUMO™ case. A general example of the relative importance calculations is illustrated below in Figure 8.
Figure 8. Example of relative importance calculations through the hierarchy.
3.3.4 Consistency Check By pair-wise comparing the metrics, categories, and OEMs independently, this research offers the possibility to depict complicated inter-rankings in the supplier selection process. This method relies on the notion that special attention is taken to each comparison. If not, the inconsistency in the decisions will distort the hierarchy. One guidance tool to test the consistency of the comparisons is the consistency ratio (CR) which is designed as a consistency index as percentage of the appropriate
Find the best suited OEM
Cost 30%
Cash-to-cash cycle 25%
Financial stability 35%
Price of products 40%
OEM1 60%
OEM2 40%
Quality 45% Delivery 25%
The relative weight of price of products for OEM1 is calculated:
0.3*0.4*0.6 = 0.072 (7.2% of total weight)
Price of products: 0.3*0.4 = 0.12 (12% of total weight) Metrics
Categories
Overall objective
Decision alternatives

ME200X 2013-06-11 Benjamin Löfdahl & Birger Sjödin
29
random average consistency (Saaty, 1980). This control was conducted on all 3x3 or larger comparison matrices, since 2x2 comparison matrices are always consistent.
𝐶𝑅 = 𝐶𝐼𝑅𝐼
(1)
where CI (consistency index) is defined as
𝐶𝐼 = 𝜆𝑚𝑎𝑥−𝑛𝑛−1
(2)
where λmax is the largest eigenvalue, see Figure 7, of the comparison matrix and n is the size of the comparison matrix. Continuing, RI (random consistency index) is defined as
𝑅𝐼 = 1.98(𝑛−2)𝑛
. (3)
The consistency is considered sufficient if CR < 10%. If CR is higher, actions might have to be taken in order to improve the quality of the judgmental data (Saaty, 1980). By analyzing the consistency of the comparisons made during the workshop and after OEM-interviews, the authors ensured that each comparison received sufficient attention and consideration throughout the process.

ME200X 2013-06-11 Benjamin Löfdahl & Birger Sjödin
30
4 Results
In this section, the alignment between product-, company-, market characteristics, and supply chain strategy are presented. The results in section 4.1 are derived from first hand product analysis of the FUMO™2 prototype, market analyses reviews, discussions and meetings with the development team, and from an interview with the CEO of Realisator. Results of the pair-wise comparisons carried out during the workshop are presented in section 4.2.
4.1 Product, Company and Market Characteristics and Implications The current FUMO™2 prototype is built of functional components clustered into an innovative configuration. It requires a custom made chassis to support the integration of ingoing components such as sensors, electrical engines, batteries, CPU, etc. Though this would characterize FUMO™ as an innovative product using the framework of Fisher (1997), the public market and the first to market-factor is more forgiving to an efficiently run supply chain as long as the monopoly situation is upheld. Fisher (1997) also states that characteristics for innovative products are their short life-cycle and the need for extensive market differentiation. FUMO™ would be a substantial investment for the Swedish fire brigades, depreciated over approximately ten years. Furthermore, due to the inherent conservatism in the firefighting industry, the need for customization is somewhat limited. If the first sold product would operate flawlessly, other fire brigades are likely to be inclined to order the exact same model. Taking this into account, one could categorize FUMO™ as a hybrid product, and a supply chain consisting of a mix of efficient and responsive production techniques should be considered (Huang et al. 2002; Lee, 2002). Therefore, the specific metrics selected for ranking in the case of Realisator were a mix of metrics related to both measurements of efficiency and responsiveness.
Continuing the analysis by employing the framework of Stavrulaki and Davis (2010) the most suitable production process can be obtained for FUMO™. Due to very low initial production volume, relatively high demand uncertainty, and production costs, as well as relatively high profit margins, this speaks for an agile supply chain strategy. Since the product variety is limited to one model for the introduction year, this do however according to Stavrulaki and Davis (2010) speak for a more leagile supply chain strategy with a make-to-order production process.
Through close collaboration with the development team of FUMO™, and with the owner of Realisator, it was determined that FUMO™ had potential to go beyond the firefighting industry in the future. Since it essentially is a robust and durable, highly maneuverable inspection robot. This put even more emphasis on finding an OEM with ambitions to make this concept grow and perhaps also would be willing to expand technologically. Therefore, it was of importance to be able to assess the OEM’s future manufacturing capabilities. A customer account of higher financial importance to the OEM is more likely to receive the necessary attention and assistance to take the concept further. Therefore it could be of importance for start-up firms to choose a smaller partner where they will be a more important stakeholder.
Realisator had no experience in manufacturing, no manufacturing assets, and insufficient capital to start up production of the firefighting robot in-house. This is common among innovative start-up companies and this matter should be illuminated by enabling extensive measuring of cash-to-cash cycle periods, and manufacturing- and functional design capabilities in a customized supplier

ME200X 2013-06-11 Benjamin Löfdahl & Birger Sjödin
31
selection model. Realisator also lacked the assets and resources to support distribution operations, meaning that an OEM with the ability to distribute to presumptive customers could be preferred. Because of the financial constraints of a start-up company, the OEM’s accuracy in billing could be of importance. A higher accuracy in billing also facilitates an unstrained relationship between buyer and OEM. In the same way, the OEM’s accuracy in credit is important to maintain relations with sub-suppliers and to receive incoming components on time. The assets to perform after-sales service and maintenance are usually not in place for a start-up company with a technologically complex product. Therefore, the OEMs’ ability to keep spare part inventory and perform repairs should be a factor contributing to the decision. The lack of experience among start-up companies should also be taken into consideration when evaluating possible OEMs. By measuring their experience within similar projects and their active years within manufacturing, crucial experience and know-how could be obtained through the choice of OEM.
The item price of the actual product and the price of after sales services are always taken into account and precursors and enablers of competitive prices are strong financial stability within the OEM, company growth rate, and cost reduction activities. However these metrics should remain secondary to aspects such as product quality and delivery reliability since these are two highly rated customer values. The specific initial target market for FUMO™ did, according to market investigations (AB Realisator Management Consulting, 2009), not appear to be particularly sensitive to extended lead time, even though it was a factor. However, the overall quality and reliability was, as stated, key to persuading the market which resonated in the weighting of metrics such as on-time delivery, product quality, quality policy, and contingency assistance for defective products in this kind of customized model.
As with FUMO™, most start-up companies experience a slow introduction phase for their products, before hopefully going into the growth phase (Wiersema, 1982). With a mere short-term perspective, laying the building blocks for a strategic partnership might not be prioritized. However, by not having to switch OEM when order rates escalate or when the concept evolves can be a great benefit in form of knowledge retention. Therefore the responsiveness to volume changes and capacity utilization of the OEM should be assessed. Another aspect in cultivating a long-term relationship is the strategic fit between the customer and the supplier. In order for Realisator to live up to their customer’s demands and expectations to the fullest, it is important that the strategies of the OEM and Realisator are aligned. A prerequisite is that there exist an open communication and that cultural differences are not too great. This could be affected by the geographical distance between buyer and OEM.
4.2 The Supplier Selection Methodology AHP was chosen as a framework for the supplier selection methodology since it is easy to use and configure to fit a specific context. It has also been thoroughly tested and evaluated through previous research and has proven to be a useful tool for supplier selection decisions.
The idea with AHP is to decompose a complex problem into all underlying factors affecting the decision. This way, the decision alternatives can be evaluated according to each factor contributing to the decision and an overall best alternative can be determined. Firstly, the problem must be defined and set as level 1 of the hierarchy. Since Realisator had no manufacturing capabilities and no resources to acquire the capabilities needed to produce and assemble FUMO™, the purpose of this
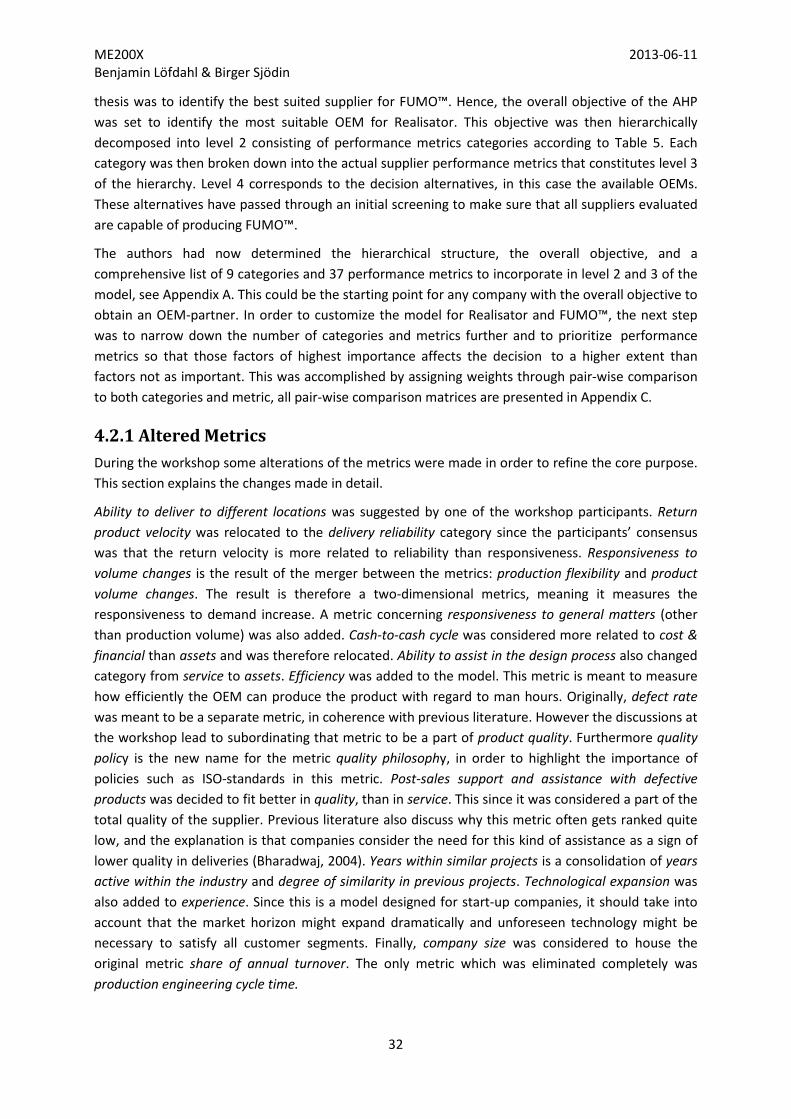
ME200X 2013-06-11 Benjamin Löfdahl & Birger Sjödin
32
thesis was to identify the best suited supplier for FUMO™. Hence, the overall objective of the AHP was set to identify the most suitable OEM for Realisator. This objective was then hierarchically decomposed into level 2 consisting of performance metrics categories according to Table 5. Each category was then broken down into the actual supplier performance metrics that constitutes level 3 of the hierarchy. Level 4 corresponds to the decision alternatives, in this case the available OEMs. These alternatives have passed through an initial screening to make sure that all suppliers evaluated are capable of producing FUMO™.
The authors had now determined the hierarchical structure, the overall objective, and a comprehensive list of 9 categories and 37 performance metrics to incorporate in level 2 and 3 of the model, see Appendix A. This could be the starting point for any company with the overall objective to obtain an OEM-partner. In order to customize the model for Realisator and FUMO™, the next step was to narrow down the number of categories and metrics further and to prioritize performance metrics so that those factors of highest importance affects the decision to a higher extent than factors not as important. This was accomplished by assigning weights through pair-wise comparison to both categories and metric, all pair-wise comparison matrices are presented in Appendix C.
4.2.1 Altered Metrics During the workshop some alterations of the metrics were made in order to refine the core purpose. This section explains the changes made in detail.
Ability to deliver to different locations was suggested by one of the workshop participants. Return product velocity was relocated to the delivery reliability category since the participants’ consensus was that the return velocity is more related to reliability than responsiveness. Responsiveness to volume changes is the result of the merger between the metrics: production flexibility and product volume changes. The result is therefore a two-dimensional metrics, meaning it measures the responsiveness to demand increase. A metric concerning responsiveness to general matters (other than production volume) was also added. Cash-to-cash cycle was considered more related to cost & financial than assets and was therefore relocated. Ability to assist in the design process also changed category from service to assets. Efficiency was added to the model. This metric is meant to measure how efficiently the OEM can produce the product with regard to man hours. Originally, defect rate was meant to be a separate metric, in coherence with previous literature. However the discussions at the workshop lead to subordinating that metric to be a part of product quality. Furthermore quality policy is the new name for the metric quality philosophy, in order to highlight the importance of policies such as ISO-standards in this metric. Post-sales support and assistance with defective products was decided to fit better in quality, than in service. This since it was considered a part of the total quality of the supplier. Previous literature also discuss why this metric often gets ranked quite low, and the explanation is that companies consider the need for this kind of assistance as a sign of lower quality in deliveries (Bharadwaj, 2004). Years within similar projects is a consolidation of years active within the industry and degree of similarity in previous projects. Technological expansion was also added to experience. Since this is a model designed for start-up companies, it should take into account that the market horizon might expand dramatically and unforeseen technology might be necessary to satisfy all customer segments. Finally, company size was considered to house the original metric share of annual turnover. The only metric which was eliminated completely was production engineering cycle time.

ME200X 2013-06-11 Benjamin Löfdahl & Birger Sjödin
33
4.2.2 The Customized AHP-Model Through the pair-wise comparison rounds carried out during the workshop the weightings for categories and metrics were obtained, see Appendix C. Table 5 shows the relative weightings of categories as a result of the pair-wise comparisons. Quality was ranked significantly higher than any other category with a weight of 40.6% within level two of the hierarchy. The second most important category according to the assigned weights was delivery reliability with 20.1%. Least important was relationship & culture with a weight of 1.6%.
Category Relative weight
Quality 40.6% Delivery reliability 20.1% Experience & size 13.0% Cost & financial 10.1% Service 7.4% Assets 4.0% Flexibility & responsiveness 3.4% Relationship & culture 1.6%
Table 5. Weighted categories for the case study.
Once the relative weight of each metric was calculated (i.e. by multiplying the weight of a metric within a category with the weight assigned to that category) the metrics were sorted in descending order of relative importance, see Table 6. The authors decided to exclude all metrics with a relative weight of <1% since these would not affect the decision enough to shift it in any direction. This resulted in 16 metrics that made the cut. The weightings were then recalculated to absorb the weight of those metrics excluded, see Table 6. Metrics hierarchy Category belonging Weighted
importance
Product quality Quality 29.5% On-time delivery Delivery reliability 13.5% Post-sales support and assistance (defective products)
Quality 11.1%
Years within similar projects Experience & size 8.7% Ability to assist in service and maintenance. Service 7.4% Financial stability Cost & financial 7.2% Technological expansion Experience & size 4.0% Lead time Delivery reliability 3.4% Return product velocity Delivery reliability 2.9% Responsiveness to volume changes Flexibility &
responsiveness 2.7%
Quality policy Quality 2.3%

ME200X 2013-06-11 Benjamin Löfdahl & Birger Sjödin
34
Cash-to-cash cycle Cost & financial 1.9% Accuracy in billing and credit Delivery reliability 1.6% Price of products Cost & financial 1.4% Manufacturing/process capabilities Assets 1.4% Communication openness Relationship & culture 1.0%
Table 6. Relative weightings of top 16 metrics in the case study.
4.2.3 Interviews with OEMs In order to test the model an interview guide was designed to gather input data to the 16 top ranked metrics, see Appendix B. Some metrics could be measured by gathering quantitative data from respondents while others required more qualitative data. Questions were formulated to capture the essence of each metric. Structured interviews were conducted to extract the same information from all responding firms. The input data obtained through interviews were then analyzed one question at the time and pair-wise comparisons were performed for each respective metric. Pair-wise comparison matrices can be found in Appendix C.
After a comprehensive screening, encompassing around 200 possible OEMs, requests to participate in an interview session were sent out to 23 companies considered suitable to deliver FUMO™. Five companies answered positively (response rate = 22%) and interviews were conducted either on site or by telephone. The interview sessions showed that some questions were unfit to reflect certain metrics and that some questions did not get sufficient answers to compare companies on that specific metric. The authors were not able to obtain sufficient data covering the accuracy in billing and credit metric, hence this metric was eliminated from the model. No questions seemed fit to cover communication openness and return product velocity was covered by the metric supplier’s post sales assistance and support on defective products. Thus, these were also eliminated from the model.
The pair-wise comparisons were then performed by the authors and results showed that all responding firms scored equally on two remaining metrics. All the evaluated firms offer the same general payment terms with invoices due 30 days after delivery. Thus the cash-to-cash cycle would be identical regardless of which OEM delivering FUMO™. In the same way, all firms scored identically on responsiveness to volume changes. Respondents were asked if they had the surplus capacity and resources to ramp up production from approximately five units per year to about 30 units per year and if they could do so with short notice. All respondents answered equally that this was not a problem. One must take into consideration that the verdict could have been different if other or more companies had been evaluated. The identical answers to questions regarding responsiveness to volume changes are also a consequence of the generally low volumes of FUMO™. More diverse answers would probably have been obtained if the evaluation concerned a product with substantially higher volumes. Consequently, this would be a valid metric for evaluation of OEMs regarding a high volume product. However, by removing the cash-to-cash metric and responsiveness to volume changes in this particular case more weight was placed on those metrics actually affecting the decision. The eleven metrics that were left in the model are presented below in Diagram 1.

ME200X 2013-06-11 Benjamin Löfdahl & Birger Sjödin
35
Diagram 1. Ranking of metrics in the case study.
Once the redundant metrics had been eliminated the overall score of each OEM was calculated by adding the product of the relative weight of each metric and the relative weight of the OEMs considering the corresponding metric. The results from the pair-wise comparison of the remaining eleven metrics are presented in Table 7. As shown in Table 7 and Diagram 2, OEM4 had the highest overall score with 35.6% of the total weight. OEM4 is also the firm receiving the highest score on the product quality metric that constitutes 35.7% of the overall decision. Hence, OEM4 is the firm best suited to produce and deliver FUMO™.
Metrics 1.1 1.2 2.1 2.2 3.1 4.1 4.2 4.3 5.1 6.1 6.2 Total weight
Metrics’ relative weight
.185 .026 .076 .015 .024 .357 .105 .028 .054 .112 0.19
OEM1 .263 .286 .043 .080 .460 .218 .125 .049 .127 .134 .135 18.8% OEM2 .383 .187 .162 .265 .067 .150 .125 .105 .172 .186 .054 19.4% OEM3 .090 .146 .064 .000 .259 .085 .375 .264 .035 .038 .193 11.9% OEM4 .263 .286 .291 .656 .067 .547 .125 .417 .429 .186 .135 35.6% OEM5 .000 .095 .439 .000 .148 .000 .25 .165 .237 .456 .482 14.3%
Table 7. Overall score of OEMs.
35,7%
18,5%
11,2% 10,5% 7,6%
5,4% 2,8% 2,6% 2,4% 1,9% 1,5%
0%5%
10%15%20%25%30%35%40%
Relative Weight of Metrics (Realisator)

ME200X 2013-06-11 Benjamin Löfdahl & Birger Sjödin
36
Diagram 2. Ranking of OEMs in the case study.
Companies were evaluated on quantitative statistics for on-time delivery performance. All responding firms showed statistics for Q1 2013 and the results were generally high. OEM3 showed the lowest on-time delivery performance with 93%, while OEM2 showed the highest performance with 97%. As a consequence of the high performance statistics, all firms were ranked relatively close on this metric, with a slight advantage of OEM2.
To compare companies on lead time all interviewees were asked to estimate the required lead time for FUMO™. Estimations were based on a preliminary component list and estimations made by the development team on time required for assembly and testing. This information was sent out to all interviewees along with a demonstration video and cross section drawings to make sure that respondents could get acquainted with the product configuration. Lead time estimations received by interviewees were similar amongst most firms. It is clear that lead time for incoming components is the most time consuming activity from order point to delivery. All estimations vary from six to eight weeks, however some firms claim they need more time for planning and set up. Because of the rough and relatively close estimations firms were ranked tight through the pair-wise comparison regarding the lead time metric. OEM1 and OEM4 are somewhat favored, both with 28.6% of the total weight.
Financial stability was measured by comparing financial ratios for the last three fiscal years of the evaluated firms. Evaluated ratios were; solidity, cash liquidity, profit margin, and turnover. Ratios were subjectively compared by the authors based on levels and stability over the last three years. Based on these ratios, major differences could be seen between the evaluated firms concerning financial stability. OEM4 and OEM5 are clearly superior to their competitors with positive profit margins for all three years and healthy stable levels of solidity and cash liquidity. OEM1 and OEM3 scored the lowest based on negative profit margins and low levels of solidity and cash liquidity. All financial ratios were accessed through foretagsfakta.se (2013).
Post-sales support and assistance on defective products was measured on qualitative data. All responding firms were asked to explain how they support their customers when defective products are shipped out. The process of returns was explained as part of this question. That is way the
0%
5%
10%
15%
20%
25%
30%
35%
40%
OEM 1 OEM 2 OEM 3 OEM 4 OEM 5
Ranking of OEMs (%)

ME200X 2013-06-11 Benjamin Löfdahl & Birger Sjödin
37
authors decided that the metric return product velocity is actually part of this metric. All evaluated firms claim that they take full responsibility for defective products that are shipped out to customers. OEM1, OEM2, and OEM4 were all ranked equally on this metric with 12.5% each of the total weight. They take actions such as prioritizing shipment of a new product, picking up the defective goods at the delivery location, and discussing the anomalies in business meetings. OEM5 however, was ranked higher with 25% of the total weight since OEM5, in addition to previously mentioned actions, strive to find the root cause of the problem. OEM5 evaluate internal processes and incoming material quality in the occurrence of a defective product and check for possible improvements. OEM3 scored the highest on this metric with 37.5% since it has an established approach to deal with product anomalies. In addition to striving to find the root cause, the approach implies having a short term solution in place 24 hours after registering the anomaly. Inventory and work in progress are also checked so that no further defects are shipped to customers.
In order to be able to compare companies on years within similar projects, respondents were asked to give examples of former or current projects with similar characteristics or technical aspects as FUMO™. For interviewees to be able to answer this question, product information such as; preliminary component list, cross section drawings, and demonstration video had been sent out prior to the interview. Respondents were also asked to estimate for how long their firm had been involved in such similar projects. Part of this information was also retrieved from companies’ websites. OEM3 is a sheet metal processing expert with limited experience regarding the mechanical aspects of FUMO™. In recent years OEM3 has been involved with products requiring electronic system assemblies. However due to OEM3’s lack of extensive mechanical experience it received the lowest ranking with only 3.8% of the total weight. OEM1 is also a firm specialized within sheet metal processing, however with more years of experience within mechatronical assembly projects than OEM3. Some of their projects are more similar to FUMO™ in configuration than projects performed by OEM3. However, no projects carried out by OEM1 are deemed quite as technical complex as FUMO™, thus the relatively low ranking of 13.4%. OEM2 and OEM4 are both experts within system assembly with no material processing of their own. Both firms are involved in numerous mechatronical projects of shifting complexity and have been for around two decades. Thus, OEM2 and OEM4 scored equally with 18.6% each of the total weight. OEM5 is specialized within electrical motors and complex integrated motor systems. Like OEM3 and OEM4, OEM5 has about two decades of relevant experience. However, OEM5 has been involved in several projects concerning innovative robot concepts and can clearly measure up to the level of technical complexity required by FUMO™. Therefore, OEM5 received 45.6% of the total weight of years within similar projects.
To measure Quality policy, comparisons were made regarding certified ISO-standards and continuous improvement work carried out by the responding firms. All evaluated firms are certified with ISO 9001 and ISO 14001. A company certified with ISO 9001 is verified to achieve certain quality standards and continuous improvement work procedures (Swedish Standards Institute, 2013a). ISO 14001 certifies environmental responsibilities of a firm in terms of waste disposal, energy consumption, etc. (Swedish Standards Institute, 2013b). In addition to gathering information regarding ISO-standards of responding firms, interviewees were asked to describe their companies’ daily routines for continuous improvement work and how employees are involved in these routines. OEM1 has no additional ISO-standards in place and the interviewee also claimed that the suggestion-to-solution process could be improved when it comes to continuous improvements. Therefore, OEM1 was ranked lowest with 4.9% of the total weight. OEM2 was working towards certification

ME200X 2013-06-11 Benjamin Löfdahl & Birger Sjödin
38
within ISO 13485, which verifies quality standards required by the medical industry (e.g. in terms of traceability and rigorous documentation of materials and personnel included in the process) (Sis.se, 2013). OEM2 also worked actively with continuous improvements on every level in the company with suggestion boxes, and weekly meetings. Hence OEM2 received a higher ranking than OEM1 with 10.5%. OEM5 claimed that they work according to ISO 13485 and ISO/TS 16949, however without formal certificates in either. ISO/TS 16949 builds on ISO 9001 with enhanced focus on continuous improvement work. This standard is required by the automotive industry. These two informal certificates together with an established approach to continuous improvement work were the reason why OEM5 was ranked third with 16.5% of the total weight. OEM3 was certified according to ISO/TS 16949, while OEM4 was certified with ISO 13485. The authors deemed ISO 13485 to be of higher relevance for FUMO™ since the firefighting industry, similar to the medical industry, have very high requirements when it comes to quality. Thus, OEM4 scored higher than OEM3.
Technological expansion aimed at measuring the OEM’s willingness to adapt new skills and methods associated with new technology. All responding firms claim that they are responsive to customer- and market demands when it comes to educating their employees in handling new technology. Questions were asked regarding technological expansions made in the past as well as plans for technology adaptions in the future. OEM2 is ranked lowest since it only adapts new technology when customers implement changes to their products. OEM1 and OEM4 scored equally with 13.5% of the total weigh. Both offers design input on customer products on a production preparation level in order to be able to produce goods efficiently. OEM1 is also continuously adapting new technology for its sheet metal processing activities. While OEM4 claims, and give examples of, that there exists an eager to be involved in innovative high-tech projects.
OEM3 received 19.3% since it is involved with new innovative products and prototype manufacturing to a higher extent than OEM4. OEM5 is the only respondent that develops products of its own. They develop and produce innovative high-tech electric motors, continuously adapting the latest technologies in order to stay competitive on a global market, thus scoring significantly higher than other respondents with 48.2% of the total weight.
OEM4 scored the highest on the metric ability to assist in service and maintenance (42.9%) mainly since it to a higher extent worked with reversed logistics than the others. OEM4, along with OEM5 with 23.7% of the total weight, could both support the customer with spare parts for an extended period of time and perform troubleshooting on returned components, in an effective manner. OEM2 was slightly ahead of OEM1 (17.2% and 12.7% respectively) since OEM2 was more open to holding inventory of spare key components. OEM3 was ranked the lowest with just 3.5% due to the fact that its respondent claimed that OEM3 had limited service ability in the aspect of handling and troubleshooting returned components.
Product quality was measured on both quantitative and qualitative input. Quantitative input concerned performance indicators such as number of customer anomalies and cost of defective goods divided by annual turnover. All responding firms showed high quality records (i.e. low costs for defective goods). Qualitative questions were asked regarding incoming material control procedures, personnel retention rate, and how personnel were educated. Ratings were primarily derived from cost of defective goods divided by annual turnover. The overall rating for all the input gathered yielded OEM4 superior to other respondent with 54.7% of the total weight. OEM3 scored the lowest with 8.5%. The authors were not able to attain input to the product quality metric from OEM5.

ME200X 2013-06-11 Benjamin Löfdahl & Birger Sjödin
39
Due to the fact that the FUMO™ concept was still at an early prototype stage, price estimations could not be attained from all OEMs. OEM3 and OEM5 did not offer any estimates and could therefore not be ranked on the metric price of products. Furthermore, the actual quotations from the remaining OEMs are not presented in this report due to confidentiality aspects.
OEM1 was ranked the highest on manufacturing/process capabilities with 46.0% of the total weight since it had the capabilities of producing all the mechanical components needed. OEM3 received 25.9% due to the fact that it, like OEM1, possessed the assets to manufacture a significant amount of component in-house. The remaining OEMs had no in-house metal processing capabilities and therefore received a lower score. However OEM5’s relationship with sub-suppliers enabled them to achieve more advantageous sourcing agreement, which resulted in a ranking of 14.8% of the weight of manufacturing/process capabilities.
4.2.4 Consistency Check In order to evaluate the consistency in the workshop results, the authors calculated the consistency ratio (CR), see section 3.3.4 in the methodology chapter.
Consistency calculations were done, using equations (1)-(3), for the overlying matrix containing all of the categories, for every category matrix separately, and for every metric matrix comparing the supplier alternatives. When reviewing CR for the aforementioned overlying matrix the authors found that the CR was at 29.3%. According to Saaty (1980) a highly consistent judgment has a CR of 10% or less. The authors therefore initiated a trial session were the pair-wise comparison was revised slightly with the purpose of reducing CR to below 10%. Next step was to compare the original results from the workshop with the altered, more consistent results. There was no change in the relative order in which the categories were ranked. Table 8 illustrates the difference between the relative weightings from the workshop (CR=29.3%) and the revised results (with CR=9.6%).
Category Workshop results, CR: 29.3%
Revised test CR: 9.6%
Difference
Quality 0.405682 0.383454 -5.5% Deliver reliability 0.200605 0.200769 0.1% Experience & size 0.129803 0.134262 3.4% Cost & financial 0.100701 0.113944 13.2% Service 0.073609 0.074783 1.6% Assets 0.040355 0.040998 1.6% Flexibility & responsiveness 0.033612 0.030613 -8.9% Relationship & culture 0.015634 0.021177 35.5%
Table 8. Impact on relative weightings depending on consistency ratio.
The largest relative difference was for relationship & culture (35.5%). However, since the relative weight for this category was quite low, the actual difference is not deemed significant. Further analysis indicates that the difference between the two results is not substantial, since the impact it has on the selection model will be of low magnitude.
Each category matrix had a consistency ratio within acceptable levels (<10%). Every metric category comparing supplier alternatives were also consistent.
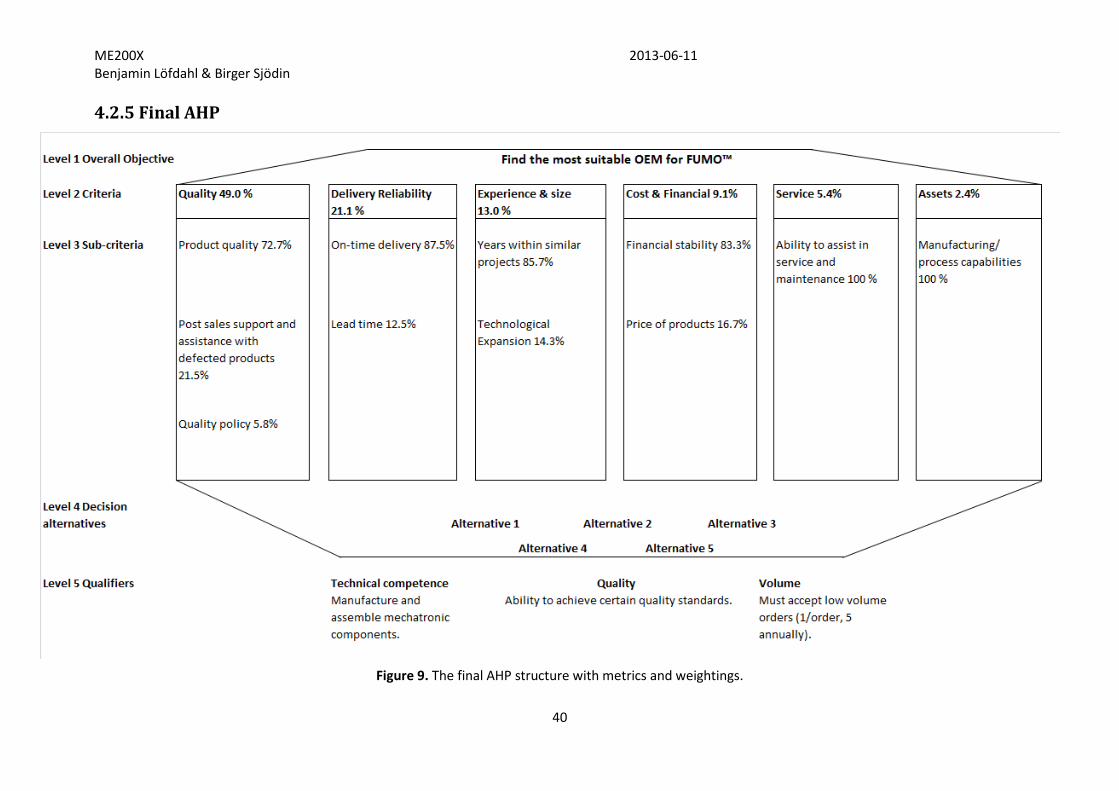
ME200X 2013-06-11 Benjamin Löfdahl & Birger Sjödin
40
4.2.5 Final AHP
Figure 9. The final AHP structure with metrics and weightings.

ME200X 2013-06-11 Benjamin Löfdahl & Birger Sjödin
41
5 Discussion In this chapter, the supplier selection model is critically evaluated and discussed, based on the outcomes from the Realisator case.
5.1 Model Evaluation This section encompasses the identified strengths and weaknesses of the supplier selection model, as well as discussion concerning how these could be handled by firms in need of supplier evaluation tools.
5.1.1 Strengths and Weaknesses The general supplier selection model presented in this paper offers a solution for high-tech start-up companies in the need of a structured supplier selection process. This model does not only consist of metrics, but also a method to establishing the weights of the different metrics. By having a clear structure, quantification enables the comparison between each potential supplier in numerical values and therefore mitigating the risk of making decisions without seeing the whole picture. One issue when dealing with these kinds of selection models is the matter of collecting the input data. Interviews with each supplier is suggested by the authors, preferably at the suppliers headquarters or manufacturing plant since seeing the manufacturing processes increases understanding of the supplier’s business. Furthermore, tacit knowledge might be lost in telephone interviews. However, it is vital to understand that the data collection process is time consuming. One aspect in which this model offer flexibility is that it allows for both quantitative and qualitative input data. The only constraint is that one must assure that equivalent data is collected from all suppliers so that they can be fairly compared. In this report, all input data concerning the OEMs have been collected through primary sources. The authors do however suggest that data could also be collected through interviews with the OEMs’ customers which would provide further data to support the pair-wise comparison decision. This additional data could then be used as reference to the data collected directly from the OEMs. To preserve the consistency in the evaluation process, the authors do recommend that customers from each OEM are interviewed, and not just from a subset.
5.1.2 How the Model Performed The metrics presented in the bank of metrics in this report which high-tech start-up firms can choose from to set the foundation for the evaluation model are all considered important by previous researchers and by the authors. Keeping the amount of metrics used in the model low is however recommended for firms since any more will likely just be drawing away focus from the most important factors of the supply chain (Gunasekaran et al., 2001). Since metrics were eliminated after the interview process, the relative weight was recalculated for remaining metrics. These relative weights are presented in the final AHP-model, see section 4.2.5. The base for the following discussion is however the results yielded from the pair-wise comparison rounds carried out during the workshop (i.e. the top 16 metrics before reducing the amount to eleven and recalculating the weights after the interview process). Discussion concerns these results in order to get the unaltered consensus from workshop participants. If the interview guide would have been perfectly fitted to obtain sufficient answers for all questions and if no metrics would have been deemed redundant

ME200X 2013-06-11 Benjamin Löfdahl & Birger Sjödin
42
because of identical answers from all responding firms, the top 16 metrics would have constituted the model.
The product quality metric received the highest relative importance with 29.5% followed by on-time delivery with 13.5%. These are the top ranked metrics in the two highest ranked categories namely quality and delivery reliability. These categories reflect the promise made by Realisator to its customers. The promise is based on customer values and the single most important product property to the firefighting industry is quality (interview with CEO of Realisator on 18th February 2013). The product is supposed to function flawlessly at all times in harsh environments in order to be able to save lives. It is also important for Realisator to gain credibility and customers’ trust by being able to deliver on time to commit date (interview with CEO of Realisator on 18th February 2013). Therefore, the on-time delivery performance of the OEM is of high importance.
The third most important metric was years within similar projects within the experience category with 11.1%. The fourth metric was post-sales support and assistance on defective products with 8.7% also within the highly ranked quality category. This metric measures the OEMs’ responsiveness when it comes to handling defective goods. Ranked fifth was the service category metric, ability to assist in service & maintenance with 7.4% of the total weight. Years within similar projects and ability to assist in service and maintenance reflects the typical start-up needs of Realisator, which was to attain an experienced partner with resources and capabilities unattained by Realisator, such as the ability to perform service and maintenance on FUMO™. Financial stability was rated sixth with 7.2%. The CEO of Realisator was looking for a long-term partnership, hence a firm with high financial stability that will stay in the game for many years is preferred (interview with CEO of Realisator on 18th February 2013). The seventh and eighth ranked metrics, lead time and return product velocity, received 2.9% and 2.7% respectively, both belonging to the delivery reliability category. It is already argued that delivery reliability is of high importance to Realisator. However during workshop discussions it was clear that lead time is subordinate to on-time delivery performance. According to a market analysis conducted in 2011, there are some potential competitors on the international market (Athandz, 2011). However, it is argued that no competitors are currently looking at delivering a product with the same functionality as FUMO™ to proposed customers (interview with CEO of Realisator on 18th February 2013). Therefore, there was no race with competitors of being able to deliver first. Furthermore, FUMO™ represents a significant investment for the fire brigades, meaning that the procurement process will be time consuming. Therefore, the lead time were of minor importance, however still a factor contributing to the decision. Lead time as a supply chain concept is often associated with production efficiency (i.e. more efficient production induces shorter lead times), hence lead time is a measure of efficiency in the supply chain.
Manufacturing/process capabilities within the assets category received 4.0%. All firms considered and evaluated in the model were able to produce and deliver FUMO™, which was explained to workshop participants, thus the relatively low rating. The metric is merely a measurement of how capable each OEM was at producing FUMO™.
At tenth place, the flexibility & responsiveness category first appeared with the metric responsiveness to volume changes (3.4%). Since volumes will be low, especially for the introduction year and then hopefully ramp up as FUMO™ is recognized on the market and introduced to other markets, the OEM must have the capacity and ability to increase volumes swiftly. This metric is clearly related to the level of responsiveness in the supply chain. Since FUMO™ was categorized as a

ME200X 2013-06-11 Benjamin Löfdahl & Birger Sjödin
43
hybrid product, metrics for measuring both efficiency and responsiveness were incorporated in the model. Quality policy, which was the last metric in the quality category, was ranked eleventh with 2.3%. This metric compares quality certifications and continuous improvement work carried out by the OEMs, which was another measurement of quality. However the relative low ranking showed that workshop participants favored the metric of product quality.
Technological expansion, within the experience category was ranked twelfth with 1.9%. This metric was added by workshop participants since Realisator plans to develop FUMO™ further with cutting edge technology that might require certain skills and commitment from an OEM to educate its employees in handling and assemble these high-tech features. The objective of positioning FUMO™ on the frontier of technology advancements requires an OEM that is responsive to market needs. Hence, technological expansion is a measurement of OEM responsiveness.
Communication openness within the relationship & culture category, received a weight of 1.6%. This was the highest ranked metric in the relationship & culture category. However, the category was the lowest ranked of all categories, hence the overall rating was low. Although the pair-wise comparison deemed this metric relatively unimportant, communication openness should be an important factor affecting the decision. According to Lee (2002) close collaboration and information sharing is a key characteristic of a successful supply chain.
The cost & financial metrics, price of products and cash-to-cash cycle both received the exact same ranking with 1.4%. Closely following were accuracy in billing in credit (1.0%). This clearly shows that most financial and cost related metrics are subordinate to foremost quality, which reflects Realisator’s vision for the product (interview with CEO of Realisator on 18th February 2013). The product price metric somewhat reflects the efficiency level at which an OEM can produce FUMO™, since lower price means higher cost efficiency in production. A low unit price is of course desirable, however it also indicates efficient production characteristics which should be cultivated in order to create a leagile supply chain.
In accordance with previous researchers such as Stavrulaki and Davis (2010) Realisator would be most suitable with a leagile supply chain. Since this model is designed to fit start-up firms or firms without their own manufacturing facilities the likelihood is that the firm will search for an OEM partner which can manage the entire manufacturing process, as in Realisator’s case. Many OEMs generally have a wide range of companies as customers and therefore manufactures many different kinds of products. This forces the OEM to have flexibility in their production as well as having a large network of sub-suppliers. The other side of the coin is that conversely, OEMs with a wide range of customers can never be expected to be able to fully optimize their production to fit any one customer’s products. Hybrid products, such as FUMO™ could be less affected by this than functional products, since functional products are best fitted with an efficient supply chain (Wagner et al., 2012, Lee, 2002, Fisher, 1997). Firms which are industrializing functional products might also want to consider ranking lead time and price of products higher than in this particular case since these metrics are highly related to keeping an efficient supply chain. Continuing, the research of Wagner et al. (2012) suggests that a positive misfit (innovative product with an efficient supply chain) is not as worse as a negative misfit (functional product with a responsive supply chain). This is another reason not to take these metrics too lightly.
In the particular case of Realisator, the metrics which were ranked the highest constitute a mix of both efficient and responsive-affiliated metrics. Seeing as FUMO™ is a hybrid product, best suited for

ME200X 2013-06-11 Benjamin Löfdahl & Birger Sjödin
44
a hybrid supply chain, a customized supplier selection model should therefore have this particular characteristic. Even though this naturally is not a sufficient evaluation of the model, it does suggest that the model works.
Even though the evaluation model yields a clear ranking order as output, the format of the result might still be a source of confusion. The scores are not absolute, but relative to each other. This means that a supplier’s score is dependent on the total amount of suppliers evaluated. Therefore, firms can expect a decreasing difference in absolute numbers between the suppliers’ score, the more suppliers are being evaluated. One should also consider that the more decision alternatives included in the evaluation the more time consuming is the comparison- and interview process. To get a more distinct difference between evaluated candidates and to make the process as time efficient as possible, the amount of companies in the evaluation process should be kept rather low. This can be achieved through a more exclusive first screening of possible candidates, by specifying qualification criteria that must be satisfied by OEMs in order for them to be included further in the evaluation process. Another alternative is to break down candidates into sub-groups and compare them group-wise. The top-ranked candidates from every group are then evaluated in a second round to find the best suited supplier. This alternative would still require comparisons to be made and interviews to be conducted with every company.
5.1.3 Loner Metrics Two of the categories in the supplier selection model ended up with only one metric belonging to each. This was a result of the elimination process where only the top rated metrics was selected for the model. This means that the categories assets and service solely consist of one metric each, which in turn gets the full weight of their corresponding category. It could be argued that this to some extent diminishes the need of having categories for these metrics. An alternative if this happens when ranking the metrics could be to remove the original categories and replace them with the sole metric, then repeat the category comparison round and recalculate the metric ranking. This iterative process could reduce the risk of misunderstanding when comparing the categories.
5.2 Comparison Process The company to which the evaluation model is applied in this report consists of one person. The selection process for which who should be counseled regarding the metric comparisons was therefore quite straightforward. The authors suggest that at least two or three experienced managers from different departments at the company participate (Ghosh et al., 2012; Wang et al., 2004). The by far fastest approach would certainly be to have only one manager making the comparisons, however it could result in a very biased result. The authors conducted the OEM comparisons without direct input from Realisator, since no representatives from the firm participated in the interviews with the suppliers. Having conducted the OEM comparisons without a third opinion might have had an impact on the final ranking, particularly since the authors personal opinions during the comparisons did not differ substantially.
5.3 Sustainability Aspect The supplier selection model presented in this report has been developed in order to evaluate suitable OEMs for the FUMO™ concept. The introduction of FUMO™ to the firefighting market is an

ME200X 2013-06-11 Benjamin Löfdahl & Birger Sjödin
45
important task and it will have a positive impact on both the efficiency of the work of firefighters and the longevity of smoke divers. By finding the most suitable OEM, the firm can enhance its competitive advantage and therefore reach a higher level of economical sustainability.
The qualifying CSR-metrics in the model further help to make sure that the OEM selected was aware of the stringent demands society puts on sustainability in the industry.
5.4 Limitations and Method Criticism Only two out of five interview sessions with potential OEMs were conducted face-to-face at location, remaining interviews were conducted via telephone. By not meeting face-to-face, tacit knowledge could have been lost in the communication process and the authors might not have got the same understanding of the companies as could have been obtained through visits. Interviewees held different positions at their respective firms, which could have affected the extracted information. However, all respondents were deemed suitable since the authors presented their research and aim of the interview in advance to all firms and were thereafter referred to suitable interviewees who had a holistic view of company activities and could answer the relevant questions exhaustively.
Due to time constraint of 20 weeks for this work, the authors decided not to involve the supplier’s customers in the evaluation process. Instead focus was directed solely on interviews and meetings with the suppliers. If the secondary sources would have been used in this case it could have given a more nuanced picture of suppliers’ capabilities. However, since a substantial part of the input was verified objective data, and only to a lesser extent subjective, the process was rationalized. Furthermore, since there are numerous firms in Sweden which could potentially manufacture FUMO™, the authors were not able to reach all possible candidates. Since FUMO™ is at the prototype stage; the final configuration is not decided. This implies that key components can be exchanged or modified. It also implies that blueprints, component lists, and documentation which were the base for OEM estimations regarding price and lead time were not accurate for the final product.
The authors chose to concentrate on designing a supplier selection model for start-up firms, meaning that the model is not specially customized to fit firms with products which are past the introduction stage of their life cycle.
The model has of yet only been tested by one outsourcing company and more testing should be conducted in order to increase the reliability of the supplier selection model.
Lastly, one could argue that a model designed to fit high-tech start-up firms cannot be sufficiently customized for each individual case. However, since the bank of metrics to select from is quite vast and that the relative importance of the metrics can be customized as see fit, the model offer high flexibility and could therefore be used generally across high-tech industries.

ME200X 2013-06-11 Benjamin Löfdahl & Birger Sjödin
46
6 Conclusions Drawing from the outcomes of the Realisator case, general conclusions are presented in this chapter. The chapter is concluded with finishing remarks of possible future research.
6.1 General Conclusions The objective of this master thesis was to develop a model for supplier selection and customize it for the new firefighting robot concept FUMO™. Therefore, the primary research question RQ1 was: How could suppliers be evaluated and selected to find the best suited suppliers for FUMO™? Two sub-questions were added in order to answer RQ1, namely RQ1.1: What are the product characteristics of FUMO™? and RQ1.2: Which supply chain strategy relates to the product characteristics of FUMO™ and business strategy of Realisator?
The secondary objective to provide start-up companies in high-tech markets with a model for how to evaluate potential suppliers, led to RQ2: How could high-tech start-up firms select suitable suppliers for their products?
The growing need to source manufacturing activities to original equipment manufacturers has presented a challenge for firms in evaluating and selecting OEM partners for their products (Lee, 2002, Chan 2003, Wang et al., 2004). Supplier performance evaluation is a well-researched area within supply chain management. Though several authors have contributed with models for supplier selection, there still exist uncertainties regarding how high-tech start-up firms should capitalize on these models. The authors suggest a selection model customized to fit high-tech start-up companies with low resources and without manufacturing capabilities. The work contributes to existing academia by offering a theoretical methodology concerning how to measure and compare supplier performance metrics and how to gather the required input data from supplier alternatives.
Through collaboration with the focal company, the authors customized the supplier selection model to fit the intricate needs of a company without manufacturing capabilities of its own, yet developing a high-tech product. This emphasized the importance of customization potential in the model. Based on analysis of the product characteristics, company strategy, and customer values, the model was tailored to the focal firm and the OEM evaluation process was implemented by the authors. The final customized model answers RQ1 and can be reviewed in Figure 9. Based on the product characteristics, FUMO™ was categorized as a hybrid product suggesting a hybrid supply chain strategy (i.e. mix of efficiency and responsiveness in the supply chain) which answers RQ1.1 and RQ1.2.
Drawing on the conclusions from the case study, the authors propose a roadmap for how the supplier selection model can be used by high-tech start-up firms in general, thus answering RQ2. To find a suitable supplier, firms first need to determine the appropriate supply chain strategy for their product. This is done by analyzing the specific product in relation to demand and supply uncertainty. Starting by categorizing the product as either functional, hybrid, or innovative, will indicate the level of demand uncertainty connected to the product. The demand uncertainty of the product corresponds to the level of efficiency/responsiveness that should be strived for in

ME200X 2013-06-11 Benjamin Löfdahl & Birger Sjödin
47
6. Evaluation of suppliers
through pair-wise comparion
5. Designing the interview
guide
4. Ranking of metrics
through pair-wise
comparison
3. Selection of related metrics from the bank
2. Selection of corresponding supply chain
strategy
1. Evaluation of product
characteristics
the supply chain. By then consider the level of stability in the processes needed to manufacture the product, the supply uncertainty of the product can be estimated. If only low supply uncertainty exist, the supply chain strategy should be configured purely by positioning the product on the efficiency-responsiveness continuum. If high supply uncertainty exists, risk-hedging measures should be considered, such as dual sourcing or inventory pooling.
Selecting which metrics to include in the first comparison rounds should be done with consideration to the result of the product analysis. Hence, which supply chain strategy the level of demand and supply uncertainty indicated. The strategy should also be reflected in the comparisons made (i.e. if an efficient supply chain is indicated, metrics related to efficiency should be ranked higher than metrics measuring responsiveness).
By applying the AHP-model with a set of metrics, selected from the bank of metrics in this report, customized for a certain product, suppliers can be evaluated using pair-wise comparison. Input data from alternative suppliers can be collected using structured interviews. The interview guide should be carefully adapted to fit the set of metrics chosen.
A structured method to supplier selection, found in Figure 10, is presented as a tool for companies to aid in the process of selecting suitable suppliers for a certain product. By following the process step by step, incorporating metrics to the AHP structure, high-tech start-up firms will be able to find strategically suitable OEMs to manufacture their products.
Figure 10. The supplier selection process.
6.2 Future Research The model presented in this report is customized for high-tech start-up firms. Further development of the bank of metrics should be conducted if firms with products at different stages in the product life cycle would want to unlock the models true potential for supplier selection. Future research could also be beneficial if it is aimed at implementing the supplier selection model at firms which are in both functional and innovative product markets. The results could be valuable in terms of evaluation of the validity of the model.

ME200X 2013-06-11 Benjamin Löfdahl & Birger Sjödin
48
7 References
AB REALISATOR MANAGEMENT CONSULTING (2009) Inledande marknadsundersökning kring robotstyrning. August 2009. AB Realisator Management Consulting: Thomas Eriksson.
ATHANDZ (2011) Fire Fighting Robots. 6th October 2011. Athandz (Project leader: Chethana Fernando).
BHARADWAJ, N. (2004) Investigating the decision criteria used in electronic components procurement. Industrial Marketing Management, 33, pp. 317-323.
CHAN, F. T. S. (2003) Interactive selection model for supplier selection process: an analytical hierarchy process approach. International Journal of Production Research, 41 (15), pp. 3549-3579.
CHOPRA, S. and MEINDL, P. (2010) Supply Chain Management: Strategy, Planning, and Operation. 4th ed. New York: Pearson Education.
COLLIS, J. and HUSSEY, R. (2009) Business Research: A Practical Guide for Undergraduate and Postgraduate Students. 3rd ed. Palgrave Macmillan.
FISHER, M. L. (1997) What is the right supply chain for your product? Harvard Business Review, March-April, pp. 105-116.
FORETAGSFAKTA (2013) Sök efter företag i hela sverige, Finansiell info [WWW] Available from: http://www.foretagsfakta.se/ [Accessed: 2013-06-11].
GHODSYPOUR, S. H. and O’BRIEN, C. (1998) A decision support system for supplier selection using an integrated analytical hierarchy process and linear programming. International Journal of Production Economics, 56-57, pp. 199-212.
GHOSH, T., CHAKRABORTY, T., and DAN, P. K. (2012) An effective AHP-based metaheuristic approach to solve supplier selection problem. International Journal of Procurement Management, 5 (2), pp. 140-159.
GUNASEKARAN, A., PATEL, C., and TIRTIROGLU, E. (2001) Performance measures and metrics in a supply chain environment. International Journal of Operations & Production Management, 21, pp. 71-87.
GUNASEKARAN, A. and KOBU, B. (2006) Performance measures and metrics in logistics and supply chain management: a review of recent literature (1995–2004) for research and applications. International Journal of Production Research, 45 (12), pp. 2819–2840.
GUNASEKARAN, A., PATEL C., and MCGAUGHEY R. E. (2004) A framework for supply chain performance measurement. International Journal of Production Economics, 87, pp. 333-347.
HUANG, S. H. and KESKAR, H. (2007) Comprehensive and configurable metrics for supplier selection. International Journal of Production Economics, 105, pp. 510-523.
HUANG, S. H., UPPAL, M., and SHI, J. (2002) A product driven approach to manufacturing supply chain selection. Supply Chain Management: An International Journal, 7 (4), pp. 189-199.
LEE, A. H. I. (2009) A fuzzy supplier selection model with the consideration of benefits, opportunities, costs and risks. Expert Systems with Applications, 36, pp. 2879-2893.

ME200X 2013-06-11 Benjamin Löfdahl & Birger Sjödin
49
LEE, H. L. (2002) Aligning Supply Chain Strategy with Product Uncertainties. California Management Review, 44 (3), pp. 104-119.
PERCIN, S. (2006) An application of the integrated AHP-PGP model in supplier selection. Measuring Business Excellence, 10 (4), pp. 34-49.
QIMTEK (2013) [WWW] Available from: http://www.qimtek.se/ [Accessed 2013-06-11].
REICHHART, A., and HOLWEG, M. (2007) Creating the customer-responsive supply chain: A reconciliation of concepts. International Journal of Operations & Production Management, 27 (11), pp. 1144-1172.
ROBOTDALEN (2013) [WWW] Available from: http://www.robotdalen.se/ [Accessed 2013-06-11].
SARKIS, J. and TALLURI, S (2002) A Model for Strategic Supplier Selection. The Journal of Supply Chain Management, Feb, pp. 18-28.
SAATY, T. L. (1980) The Analytic Hierarchy Process. New York: McGraw-Hill.
SAATY, T. L. (1990a) An Exposition on the AHP in Reply to the Paper "Remarks on the Analytic Hierarchy Process". Management Science, 36 (3), pp. 259-268.
SAATY, T. L. (1990b) How to make a decision: The Analytic Hierarchy Process. European Journal of Operational Research, 48, pp. 9-26.
SAATY, T.L. (1996) Decision Making with Dependence and Feedback: The Analytic Network Process. Pittsburgh: RWS Publications.
SAATY, T. L. (2008) Decision making with the analytic hierarchy process. International Journal of Services Sciences, 1, pp. 83-98.
STAVRULAKI, E. and DAVIS, M. (2010) Aligning products with supply chain processes and strategy. The International Journal of Logistics Management, 21 (1), pp. 127-151.
STEINERT, Y. (1992) Twelve tips for conducting effective workshops. Medical Teacher, 14 (2), pp. 127-131.
SWEDISH STANDARDS INSTITUTE (2013a) Vad är ISO 9001? [WWW] SIS. Available from: http://www.sis.se/tema/ISO9001/varfor-iso-9001/ [Accessed 2013-06-11].
SWEDISH STANDARDS INSTITUTE (2013b) Vad är ISO 14001? [WWW] SIS. Available from: http://www.sis.se/tema/ISO14001/Vad-ar-ISO-14000/ [Accessed 2013-06-11].
TIBERIUS, R. and SILVER, I. (2001) Guidelines for Conducting Workshops and Seminars That Actively Engage Participants (REPORT).
WAGNER, S. M., GROSSE-RUYKEN, P. T., and ERHUN, F. (2012) The link between supply chain fit and financial performance of the firm. Journal of Operations Management, 30, pp. 340-353.
WANG, G., HUANG, S. H., and DISMUKES, J.P. (2004) Product-driven supply chain selection using integrated multi-criteria decision-making methodology. International Journal of Production Economics, 91, pp. 1-15.
WIERSEMA, F.D. (1982) Strategic marketing and the product life cycle. Cambridge: Marketing Science Institute.

ME200X 2013-06-11 Benjamin Löfdahl & Birger Sjödin
50
WIND, Y. and SAATY, T. L. (1980) Marketing Applications of the Analytic Hierarchy Process. Management Science, 26 (7), pp. 641-658.

ME200X 2013-06-11 Benjamin Löfdahl & Birger Sjödin
51
Appendix A – Bank of Metrics
Categories and metrics identified through the literature review were merged into a comprehensive list presented in Table 9 below along with explanations and references.
Category/metric Explanation Reference 1. Delivery reliability Regarding the performance of a supplier in
delivering the ordered products. Bharadwaj (2004)
1.1 Lead time Order cycle time Bharadwaj (2004), (SCOR)
1.2 On-time delivery performance
Percentage of orders received on time. Bharadwaj (2004), (SCOR)
1.3 Accuracy in billing and credit
Percentage of errors in billing and credit. Bharadwaj (2004)
1.4 Defect rate Cost of delivered defective goods divided by turnover.
Bharadwaj (2004)
2. Flexibility & Responsiveness
Velocity at which a supplier provides products to the customer, and regarding the responsiveness to demand changes.
Huang and Keskar (2007)
2.1 Production flexibility Ability to cope with demand fluctuations (number of days required to achieve an unplanned sustainable increase in orders)
Huang and Keskar (2007), (SCOR)
2.2 Return product velocity
Average days required for process of returning defective, incomplete or damaged orders and reshipping of the order to customer.
Huang and Keskar (2007)
2.3 Production engineering cycle time
Average time required for generation and delivery of final drawings, specifications, formulas, part programs, etc.
Huang and Keskar (2007)
2.4 Product volume changes
Ability to cope with demand fluctuations (possible increase in order size).
Sarkis and Talluri (2002)
3. Cost & Financial Criteria regarding cost and financial aspects of procuring from suppliers.
Bharadwaj (2004)
3.1 Financial stability Indicator of excessive asset price volatility, the unusual drying-up of liquidity, interruptions in the operation of payment systems, excessive credit rationing, etc.
Huang and Keskar (2007)
3.2 Cost reduction activities
Cost reduction activities carried out by the supplier.
Sarkis and Talluri (2002)
3.3 Price of products The actual price of one unit. Bharadwaj (2004)
3.4 Price of service The price associated with post sales service and assistance.
Bharadwaj (2004)
4. Assets Criteria regarding the effectiveness of supplier managing assets to support OEM demand.
Huang and Keskar (2007)
4.1 Cash-to-cash cycle Days between cash disbursed to supplier and cash collected from customer.
(SCOR)
4.2 Capacity utilization A measure of how intensively a resource is being used to produce a good or service.
Huang and Keskar (2007)
4.3 Manufacturing /process capability
Capabilities in areas of machining, manufacturing, assembly, special purpose machines and equipment etc. in line with product requirements.
Huang and Keskar (2007)

ME200X 2013-06-11 Benjamin Löfdahl & Birger Sjödin
52
4.4 Geographical distance The geographical distance between supplier production facilities and buyer facilities.
Own addition
4.5 Assessment of future manufacturing capabilities
Adapting pace to new manufacturing capabilities.
Sarkis and Talluri (2002)
5. Quality Regarding suppliers’ product quality Bharadwaj (2004)
5.1 Product quality Product quality and consistency with demand specification.
Bharadwaj (2004)
5.2 Quality philosophy Continuous improvement work to increase quality and efficiency carried out by supplier.
Sarkis and Talluri (2002)
6. Service Regarding suppliers involvement in aftersales and redesign
Bharadwaj (2004)
6.1 Ability to assist in service & maintenance
The supplier’s ability to assist in handling possible service and maintenance of the product.
Bharadwaj (2004)
6.2 Post-sales assistance & support (defective products)
Post sales assistance to deal with product deviations from previously agreed upon tolerances.
Bharadwaj (2004)
6.3 Ability and willingness to assist with the design process
Does the OEM possess the ability to design (knowledge regarding design, customers, new markets, trends, areas of use)? Does designing fit with their strategy?
Bharadwaj (2004)
7. Experience & size Regarding supplier experience within mechatronic manufacturing
Own addition
7.1 Years active within the industry
Time period of consistency in the industry Own addition
7.2 Growth rate Growth rate of supplier’s turnover past three years
Own addition
7.3 Degree of similarity in previous projects
Number of (end extent of) similar projects. E.g. Technical complexity, small batches.
Own addition
7.4 Share of annual turnover
How much of the supplier’s turnover consist of this project?
Own addition
7.5 Company size Indicator of various factors such as facility size, area, work force strength, turnover, capacity etc.
Huang and Keskar (2007)
8. Relationship & culture Regarding potential of partnership and cultural fit.
Sarkis and Talluri (2002)
8.1 Strategic fit Relates to the fit between the supplier’s and customer’s business strategy.
Sarkis and Talluri (2002)
8.2 Long-term relationship Relates to the possibility and prospects of creating a long term prosperous relationship with the supplier.
Sarkis and Talluri (2002)
8.3 Communication openness
How open is the communication with the supplier?
Sarkis and Talluri (2002)
8.4 Culture similarity Cultural and language barriers between buyer and supplier.
Huang and Keskar (2007)
9. CSR Corporate Social Responsibility Own addition 9.1 Legal claims Pending or filed legal claims against the
supplier. Huang and Keskar (2007)
9.2 Recordable incident rate
Occupational Safety and Health Administration (OSHA) or equivalent recordable incident rate per 100 employees.
Huang and Keskar (2007)
9.3 Hazardous/non- Average volume of hazardous/non-hazardous Huang and

ME200X 2013-06-11 Benjamin Löfdahl & Birger Sjödin
53
hazardous waste waste released per day. Keskar (2007) 9.4 Chemical releases Volume of chemical releases per day. Huang and
Keskar (2007) 9.5 Global warming gases Volume in ppmv of global warming gas (carbon
dioxide, methane) releases per day. Huang and Keskar (2007)
9.6 Ozone depleting chemicals
Volume of ambient air releases per day. Huang and Keskar (2007)
Table 9. Metrics compiled from literature presented with explanations and sources.
ME200X 2013-06-11 Benjamin Löfdahl & Birger Sjödin
54
Appendix B – Guide for Interviews with Suppliers
Qualifications for potential suppliers • Ability to manufacture and assemble machines of a certain complexity containing
mechatronic parts. • Ability to take large responsibility as OEM. They will be in charge of acquiring all ingoing
parts. • Quality standards: ISO 9001, ISO 14001 CE, EMC, IPC • Must accept low volume orders
1. The supplier’s product quality
Do you perform quality controls over incoming material and components, how? defect rate? Do you perform quality control of finished products, how? defect rate?
How is your personnel educated, are they experienced? IPC, ESD, high retention
2. On-time delivery
Estimated/recorded on-time delivery performance? (Estimated/actual percentage)
How do you work to achieve and improve on-time delivery performance? (How do you prioritize production and delivery if production would lag? FIFO? Due date?)
3. Supplier's post-sales support and assistance (defective products)
When products deviate from previously agreed upon specifications and tolerances, how do you support and assist the customers to deal with these defective products?
4. Years within similar projects
Could you give examples of previous projects/products with similar characteristics to our robot concept? (low volume, technical complexity, mechatronic assembly of ordered components)
How long have you been involved with such similar projects?
5. The supplier’s ability to assist in service and maintenance
Do you have the ability to support your customers/end-customers with post sales service and maintenance of the product, how?
6. Willingness to expand technologically
How have you developed technologically in the past? What do you see in the future for your company? Where will you go?
7. Lead time
Estimates after understanding the concept of a potential FUMO contract. Will it be 1 week, 1 month, 3 months, 6 months?

ME200X 2013-06-11 Benjamin Löfdahl & Birger Sjödin
55
8. Return product velocity
Can the process for returns be explained? How is this done, and how long does it take?
9. Responsiveness to volume changes
To what extent can you accept an increase or decrease in order quantity? How long time in advance do you need the information on a change? How do you handle these requests?
10. Quality policy
Quality certifications?
How do you work with continuous improvements? How do you involve the employees in this work?
11. Cash-to-cash cycle
How are your payment terms in general? Down payments, installments? Or money down?
12. Price of products
Estimates of the price of FUMO 3.
13. Manufacturing/process capabilities
How much of your processes required for FUMO 3 is in-house?
Which machines do you use, what can you accomplish?
14. CSR • Pending or filed legal claims against the supplier • Recordable incident rate per 100 employees? Occupational Safety and Health Administration
(OSHA) • Average volume of hazardous/non-hazardous waste released per day? • Volume of chemical releases per day? • Volume in ppmv of global warming gas (carbon dioxide, methane) releases per day? • Volume of ambient air releases per day?

ME200X 2013-06-11 Benjamin Löfdahl & Birger Sjödin
Appendix C – Pair-wise Comparison Matrices Metrics Comparisons Original Workshop matrices Delivery reliability
Lead time
On time delivery
Accuracy in billing and credit
Ability to deliver to different locations
Return product velocity
Relative weight within
category
Total relative weight
Lead time 1 1/7 3 6 2 0.153 3.1% On time delivery 7 1 8 8 8 0.577 11.6% Accuracy in billing and credit 1/3 1/8 1 7 1/5 0.087 1.8%
Ability to deliver to different locations 1/6 1/8 1/7 1 1/7 0.031 0.6%
Return product velocity 1/2 1/8 5 7 1 0.152 3.1%
SUM 9.00 1.52 17.14 29.00 11.34
Flexibility & Responsiveness
Responsiveness to volume changes
Responsiveness to flexibility, general question
Relative weight within
category
Total relative weight
Responsiveness to volume changes 1 3 0.750 2.5%
Responsiveness to flexibility, general question 1/3 1 0.250 0.8%
SUM 1.33 4.00
Cost & Financial Financial stability
Cost reduction activities
Price of products
Price of service
Cash-to-cash cycle
Relative weight within
category
Total relative weight
Financial stability 1 7 5 8 5 0.541 5.4% Cost reduction activities 1/7 1 1/3 3 1/5 0.069 0.7%
Price of products 1/5 3 1 7 1 0.173 1.7% Price of service 1/8 1/3 1/7 1 1/5 0.031 0.3% Cash-to-cash cycle 1/5 5 1 5 1 0.181 1.8% SUM 1.67 16.33 7.48 24.00 7.40
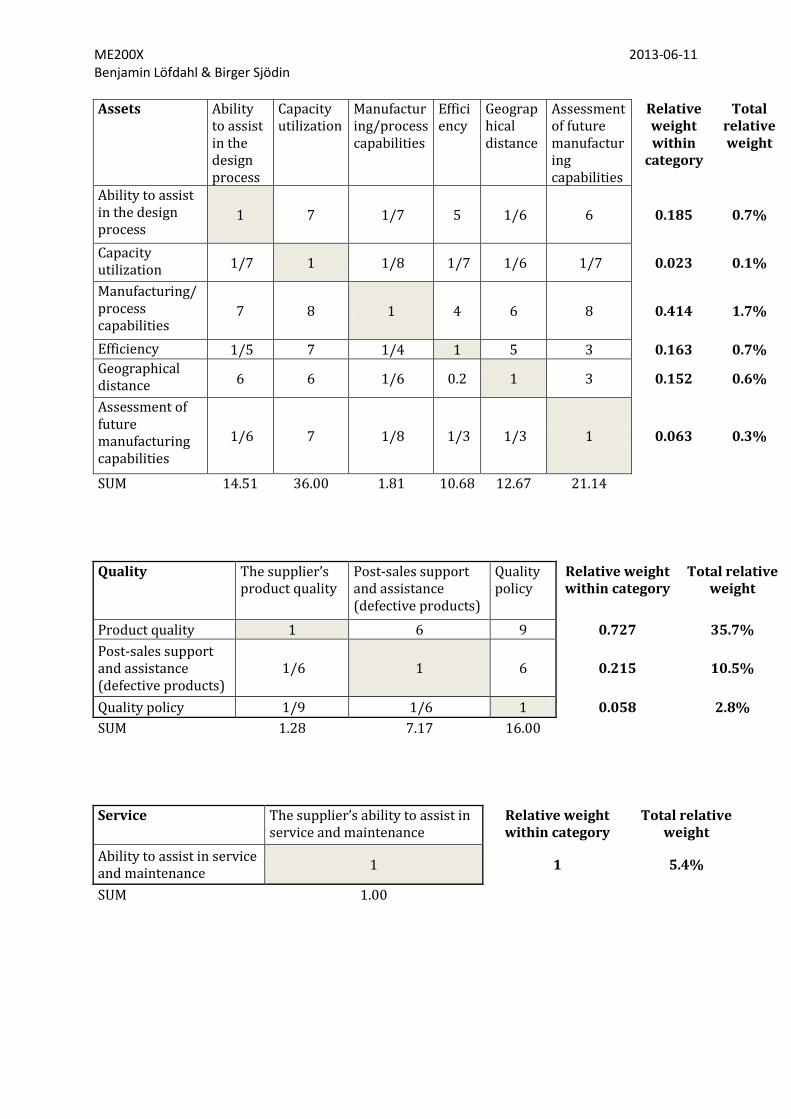
ME200X 2013-06-11 Benjamin Löfdahl & Birger Sjödin Assets Ability
to assist in the design process
Capacity utilization
Manufacturing/process capabilities
Efficiency
Geographical distance
Assessment of future manufacturing capabilities
Relative weight within
category
Total relative weight
Ability to assist in the design process
1 7 1/7 5 1/6 6 0.185 0.7%
Capacity utilization 1/7 1 1/8 1/7 1/6 1/7 0.023 0.1%
Manufacturing/process capabilities
7 8 1 4 6 8 0.414 1.7%
Efficiency 1/5 7 1/4 1 5 3 0.163 0.7% Geographical distance 6 6 1/6 0.2 1 3 0.152 0.6%
Assessment of future manufacturing capabilities
1/6 7 1/8 1/3 1/3 1 0.063 0.3%
SUM 14.51 36.00 1.81 10.68 12.67 21.14
Quality The supplier’s product quality
Post-sales support and assistance (defective products)
Quality policy
Relative weight within category
Total relative weight
Product quality 1 6 9 0.727 35.7% Post-sales support and assistance (defective products)
1/6 1 6 0.215 10.5%
Quality policy 1/9 1/6 1 0.058 2.8% SUM 1.28 7.17 16.00
Service The supplier’s ability to assist in service and maintenance
Relative weight within category
Total relative weight
Ability to assist in service and maintenance 1 1 5.4%
SUM 1.00

ME200X 2013-06-11 Benjamin Löfdahl & Birger Sjödin Experience & Size Years
within similar projects
Growth rate
Technological expansion
Company size
Relative weight within category
Total relative weight
Years within similar projects 1 9 6 7 0.637 8.3%
Growth rate 1/9 1 1/5 1 0.059 0.8%
Technological expansion 1/6 5 1 6 0.241 3.1%
Company size 1/7 1 1/6 1 0.063 0.8% SUM 1.42 16.00 7.37 15.00
Relationship & Culture
Strategic fit
Long-term relationship
Communication openness
Cultural similarity
Relative weight within category
Total relative weight
Strategic fit 1 1 1/6 6 0.159 0.2% Long-term relationship 1 1 1/7 5 0.142 0.2%
Communication openness 6 7 1 9 0.657 1.0%
Cultural similarity 1/6 1/5 1/9 1 0.042 0.1%
SUM 8.17 9.20 1.42 21.00

ME200X 2013-06-11 Benjamin Löfdahl & Birger Sjödin Recalculated Matrices for Final 11 Metrics
Delivery reliability On time delivery Lead time Relative weight within category
Total relative weight
On time delivery 1 7 0.875 18.5% Lead time 1/7 1 0.125 2.6% SUM 1.14 8.00
Cost & Financial Financial stability Price of products Relative weight within category
Total relative weight
Financial stability 1 5 0.833 7.6% Price of products 1/5 1 0.167 1.5% SUM 1.20 6.00
Assets Supplier's ability to assist in the design process
Relative weight within category
Total relative weight
Manufacturing/process capabilities 1 1 2.4%
SUM 1.00
Quality The supplier’s product quality
Post-sales support and assistance (defective products)
Quality policy
Relative weight within category
Total relative weight
Product quality 1 6 9 0.727 35.7% Post-sales support and assistance (defective products)
1/6 1 6 0.215 10.5%
Quality policy 1/9 1/6 1 0.058 2.8% SUM 1.28 7.17 16.00
Service The supplier’s ability to assist in service and maintenance
Relative weight within category
Total relative weight
Ability to assist in service and maintenance 1 1 5.4%
SUM 1.00
Experience & Size Years within similar projects
Technological expansion
Relative weight within category
Total relative weight
Years within similar projects 1 6 0.857 11.2%
Technological expansion 1/6 1 0.143 1.9%
SUM 1.17 7.00

ME200X 2013-06-11 Benjamin Löfdahl & Birger Sjödin
Category Comparisons Original Workshop Matrix
Delivery reliability
Flexibility & Responsiveness
Cost & Financial
Assets Quality Service Experience & Size
Relationship & Culture
Relative weight
Delivery reliability 1 7 6 7 0.2 8 2 9 0.2006
Flexibility & Responsiveness
1/7 1 1/5 1/2 1/9 1/5 1/5 6 0.0336
Cost & Financial 1/6 5 1 6 1/7 5 1/3 7 0.1007
Assets 1/7 2 1/6 1 1/9 1/6 1/7 7 0.0404 Quality 5 9 7 9 1 8 8 9 0.4057 Service 1/8 5 1/5 6 1/8 1 1/5 7 0.0736 Experience & Size 1/2 5 3 7 1/8 5 1 7 0.1298
Relationship & Culture 1/9 1/6 1/7 1/9 1/9 1/7 1/7 1 0.0156
SUM 7.19 34.17 17.71 36.61 1.93 27.51 12.02 53.00
Recalculated Category Matrix Corresponding to Final 11 Metrics
Delivery reliability
Cost & Financial
Assets Quality Service Experience & Size
Relative weight
Delivery reliability 1 6 7 1/5 8 2 21.1%
Cost and Financial 1/6 1 6 1/7 5 1/3 9.1%
Assets 1/7 1/6 1 1/9 1/6 1/7 2.4%
Quality 5 7 9 1 8 8 49.0%
Service 1/8 1/5 6 1/8 1 1/5 5.4% Experience & Size 1/2 3 7 1/8 5 1 13.0%
SUM 6.93 17.37 36.00 1.70 27.17 11.68
λmax 7.71 n 6 CI 0.34 RI 1.32 CR 26.0%

ME200X 2013-06-11 Benjamin Löfdahl & Birger Sjödin Recalculated Category Matrix Corresponding to Final 11 Metrics (Acceptable Critical Ratio)
Quality Delivery
Reliability Experience & Size
Cost & Financial
Service Assets Relative weight
Quality 1 4 5 5 6 7 45.8%
Delivery Reliability 1/4 1 2 3 5 6 21.4%
Experience and Size 1/5 1/2 1 2 3 4 13.2%
Cost and Financial 1/5 1/3 1/2 1 3 4 10.4%
Service 1/6 1/5 1/3 1/3 1 3 6.0%
Assets 1/7 1/6 1/4 1/5 1/4 1 3.3%
SUM 1.96 6.20 9.08 11.53 18.25 25.00
λmax 6.53 n 6 CI 0.11 RI 1.32 CR 8.0%

ME200X 2013-06-11 Benjamin Löfdahl & Birger Sjödin
OEM Comparisons Empty rows/columns correspond to insufficient or no input from OEM.
On-time delivery
OEM1 OEM2 OEM3 OME4 OEM5 Relative weight
OEM1 1 2/3 3 1 0.263
λmax 4.00 OEM2 1 1/2 1 4 1 1/2 0.383
n 4
OEM3 1/3 1/4 1 1/3 0.090
CI 0.00 OEM4 1 2/3 3 1 0.263
RI 0.99
OEM5 1 0
CR 0.00 SUM 3.83 2.58 11.00 3.83 1.00
Lead time OEM1 OEM2 OEM3 OME4 OEM5 Relative weight
OEM1 1 1 1/2 2 1 3 0.286
λmax 5.00 OEM2 2/3 1 1 1/5 2/3 2 0.187
n 5
OEM3 1/2 5/6 1 1/2 1 1/2 0.146
CI 0.00 OEM4 1 1 1/2 2 1 3 0.286
RI 1.19
OEM5 1/3 1/2 2/3 1/3 1 0.095
CR 0.00 SUM 3.50 5.33 6.87 3.50 10.50
Financial stability
OEM1 OEM2 OEM3 OME4 OEM5 Relative weight
OEM1 1 1/5 1/2 1/6 1/7 0.043
λmax 5.32 OEM2 5 1 4 1/3 1/4 0.162
n 5
OEM3 2 1/4 1 1/5 1/6 0.064
CI 0.08 OEM4 6 3 5 1 1/2 0.291
RI 1.19
OEM5 7 4 6 2 1 0.439
CR 0.07 SUM 21.00 8.45 16.50 3.70 2.06
Price of products
OEM1 OEM2 OEM3 OME4 OEM5 Relative weight
OEM1 1 1/4 1/7 0.080
λmax 3.05 OEM2 4 1 1/3 0.265
n 3
OEM3 1 0
CI 0.02 OEM4 7 3 1 0.656
RI 0.66
OEM5 1 0
CR 0.04 SUM 12.00 4.25 1.00 1.48 1.00

ME200X 2013-06-11 Benjamin Löfdahl & Birger Sjödin Manufacturing/process capabilities
OEM1 OEM2 OEM3 OME4 OEM5 Relative weight
OEM1 1 5 3 5 4 0.460
λmax 5.31 OEM2 1/5 1 1/4 1 1/3 0.067
n 5
OEM3 1/3 4 1 4 3 0.259
CI 0.08 OEM4 1/5 1 1/4 1 1/3 0.067
RI 1.19
OEM5 1/4 3 1/3 3 1 0.148
CR 0.07 SUM 1.98 14.00 4.83 14.00 8.67
Product quality OEM1 OEM2 OEM3 OME4 OEM5 Relative weight
OEM1 1 1 1/2 3 1/3 0.175
λmax 4.05 OEM2 2/3 1 2 1/4 0.120
n 4
OEM3 1/3 1/2 1 1/5 0.068
CI 0.02 OEM4 3 4 5 1 0.437
RI 0.99
OEM5 1 0
CR 0.02 SUM 5.00 7.00 11.00 1.78 1.00
Post sales assistance and support (defective products)
OEM1 OEM2 OEM3 OME4 OEM5 Relative weight
OEM1 1 1 1/3 1 1/2 0.125
λmax 5.00 OEM2 1 1 1/3 1 1/2 0.125
n 5
OEM3 3 3 1 3 1 1/2 0.375
CI 0.00 OEM4 1 1 1/3 1 0.5 0.125
RI 1.19
OEM5 2 2 2/3 2 1 0.250
CR 0.00 SUM 8.00 8.00 2.67 8.00 4.00
Quality policy OEM1 OEM2 OEM3 OME4 OEM5 Relative weight
OEM1 1 1/3 1/5 1/6 1/4 0.049
λmax 5.13 OEM2 3 1 1/3 1/4 1/2 0.104
n 5
OEM3 5 3 1 1/2 2 0.264
CI 0.03 OEM4 6 4 2 1 3 0.418
RI 1.19
OEM5 4 2 1/2 1/3 1 0.165
CR 0.03 SUM 19.00 10.33 4.03 2.25 6.75

ME200X 2013-06-11 Benjamin Löfdahl & Birger Sjödin Ability to assist in service and maintenance
OEM1 OEM2 OEM3 OME4 OEM5 Relative weight
OEM1 1 2/3 5 1/4 1/2 0.127
λmax 5.11 OEM2 1 1/2 1 6 1/3 2/3 0.172
n 5
OEM3 1/5 1/6 1 1/8 1/7 0.035
CI 0.03 OEM4 4 3 8 1 2 0.429
RI 1.19
OEM5 2 1 1/2 7 1/2 1 0.237
CR 0.02 SUM 8.70 6.33 27.00 2.21 4.31
Years within similar projects
OEM1 OEM2 OEM3 OME4 OEM5 Relative weight
OEM1 1 2/3 5 2/3 1/4 0.134
λmax 5.16 OEM2 1 1/2 1 6 1 1/3 0.186
n 5
OEM3 1/5 1/6 1 1/6 1/7 0.038
CI 0.04 OEM4 1 1/2 1 6 1 1/3 0.186
RI 1.19
OEM5 4 3 7 3 1 0.456
CR 0.03 SUM 8.20 5.83 25.00 5.83 2.06
Technological expansion
OEM1 OEM2 OEM3 OME4 OEM5 Relative weight
OEM1 1 3 2/3 1 1/4 0.135
λmax 5.08 OEM2 1/3 1 1/4 1/3 1/6 0.054
n 5
OEM3 1 1/2 4 1 1 1/2 1/3 0.193
CI 0.02 OEM4 1 3 2/3 1 1/4 0.135
RI 1.19
OEM5 4 6 3 4 1 0.482
CR 0.02 SUM 7.83 17.00 5.58 7.83 2.00