Decision support model for supplier selection in healthcare ...
Upload
independentCategory
view
2download
0
An Analysis of the Supplier Selection
Process
ROHIT VERMA
DePaul University, Chicago, IL, U.S.A.
MADELEINE E. PULLMAN
Southern Methodist University, Dallas, TX, U.S.A.
(Received February 1997; accepted after revision February 1998)
Customers select suppliers based on the relative importance of di�erent attributes such as quality,price, ¯exibility, and delivery performance. This study examines the di�erence between managers'rating of the perceived importance of di�erent supplier attributes and their actual choice of suppliersin an experimental setting. We use two methods: a Likert scale set of questions, to determine theimportance of supplier attributes; and a discrete choice analysis (DCA) experiment, to examine thechoice of suppliers. The results indicate that although managers say that quality is the most import-ant attribute for a supplier, they actually choose suppliers based largely on cost and delivery per-formance. # 1998 Elsevier Science Ltd. All rights reserved
Key wordsÐpurchasing, conjoint analysis, choice process, supply chain management, measure-ment and methodology
1. INTRODUCTION
DURING RECENT YEARS supply chain manage-ment and the supplier (vendor) selection pro-cess has received considerable attention in thebusiness management literature. In one of thewidely cited articles on operations strategy,Miller et al. [35] classify supply strategies asone of the strategic operating choices.Additionally, with the increase in use of totalquality management (TQM) and just-in-time(JIT) concepts by a wide range of ®rms, thesupplier selection question has become extre-mely important. In a recent study, Flynn et al.[18] found supplier involvement to be an im-portant dimension of quality management.Bankar and Khoska [4] classify the supplierselection process as an important operationsmanagement (OM) decision area. They suggestthat OM research should attempt to identify
the supply chain management practices that
provide competitive advantage. Karmarkar
[29] also identi®es supply chains as multi-disci-
plinary in nature and recommends an inte-
grated OM/marketing approach.
Dickson [15], in one of the early works on
supplier selection, identi®ed over twenty sup-
plier attributes which managers tradeo� when
choosing a supplier. Since then, a number of
conceptual and empirical articles on supplier
selection have appeared [43]. The conceptual
articles by Ansari and Modarress [2, 3],
Benton and Krajewski [6], Bernard [7],
Browning et al. [9], Burton [10], Hahn et al.
[24], Jackson [28], Kraljic [30], Sheth [38], and
Treleven [39] are examples of publications
emphasizing the strategic importance of the
supplier selection process. The above articles
(and several others) highlight the tradeo�
Omega, Int. J. Mgmt Sci. Vol. 26, No. 6, pp. 739±750, 1998# 1998 Elsevier Science Ltd. All rights reserved
Printed in Great Britain0305-0483/98 $19.00+0.00PII: S0305-0483(98)00023-1
739

among quality, cost and delivery performancemeasures in the supplier selection process.
Weber and Current [42] proposed a multi-objective approach to vendor selection. Theirmethodology provides a useful decision sup-port system for a purchasing manager facedwith multiple vendors and tradeo�s such asprice, delivery reliability, and product quality.In Weber and Current's [42] approach, thegoal is to determine an acceptable set of sol-utions (number of vendors and order sizefrom each vendor).
A number of empirical articles on supplierselection have also appeared. Based on empiri-cal data collected from 170 purchasing man-agers, members of the National Association ofPurchasing Managers, Dickson [15] identi®edquality, cost, and delivery performance historyas the three most important criteria in vendorselection. Cardozo and Cagley [11], Chapman[12], Chapman and Carter [13], Dempsey [14],Hakansson and Wootz [26], Monczka et al.[36], Wagner et al. [41] and several otherauthors have evaluated the relative importanceof quality, cost, delivery performance, andother supplier attributes. According to areview of 74 articles discussing supplier selec-tion criteria, quality was perceived to be mostimportant followed by delivery performanceand cost [43]. In summary, most of the articlesreferenced above suggest that managers per-ceive quality to be the most important supplierattribute. The conceptual articles emphasizethat managers should not select suppliersbased on low cost only but should considerquality, delivery performance and other attri-butes.
While the supplier selection literature is richin terms of: (a) conceptual and empirical workand (b) decision support methods for purchas-ing managers, none of the articles cited abovehas studied how managers actually choose sup-pliers. The past empirical articles are based onthe managers' rating of the perceived import-ance of di�erent supplier attributes. An actualchoice of supplier involves evaluating thecharacteristics of the suppliers based on theirattributes and selecting one or more suppli-er(s) that best suit the needs of the ®rm.
It can be argued that it is extremely di�cultfor any one supplier to excel in all dimensionsof performance. For example, a high qualitysupplier might not be the one with lowest cost
components. It is also possible that the com-ponents delivered by a particular supplierexcel in a few quality dimensions (reliability,features) while some other supplier might besuperior in other quality dimensions (forexample, durability or aesthetics). Thereforean actual choice generally involves tradeo�among the attribute levels of di�erent suppli-ers [5, 32].
The objective of this study was to test howmanagers actually choose suppliers. Theempirical results presented later in this articleshow that the relative importance of di�erentsupplier attributes in actual choice of suppliersare not the same as the perceived importance ofthe attributes. For example, it appears thatmanagers perceive quality to be the most im-portant attribute but they assign more weightto delivery performance and/or cost whenactually choosing a supplier. These resultsimply that even though the managers believethat several attributes (for example, quality)are important for supplier selection, in actualpractice the low cost supplier is selected. Webelieve that these results have important impli-cations for operations strategy implementationand supply chain management. To our knowl-edge, none of the published studies has pre-sented such analyses of the supplier selectionprocess.
Speci®cally, we examine the perceived im-portance of supplier selection criteria (quality,cost, delivery performance) and identify therelative weights of the attributes in actualselection of suppliers. In addition to quality,cost, and delivery we also identify the relativeimportance of ¯exibility, the fourth operationsobjective identi®ed by Hayes and Wheelwright[27] and other operations strategy researchers[1, 16]. The following two research questionsexplore the above ideas:
Research Question I: What are the perceivedimportance of quality, cost, delivery, and ¯exi-bility attributes in the supplier selection pro-cess?
Research Question II: How do managers tra-deo� among quality, cost, delivery and ¯exi-bility attributes when actually choosing asupplier?
We used two di�erent data collection andanalyses procedures to explore the aboveresearch questions. A survey instrument con-taining Likert-type scale questions was used to
Verma, PullmanÐAn Analysis of the Supplier Selection Process740

explore Research Question I. We used aneconometric procedure known as discretechoice analysis (DCA) for quantifying therelative weights of attributes when actual sup-plier choice is made (Research Question II).The following sections describe the researchdesign, data collection and analyses pro-cedures, and discuss the empirical results.
2. RESEARCH METHOD
An empirical study was designed to evaluatethe supplier selection process. The samplegroup consisted of manufacturing companies,speci®cally metal processing and producers ofsmall machine tools and tooling in the westernUnited States. The population included 323companies with SIC codes of 33, 34, and 35registered with two western states (Utah andArizona) in 1994. The actual data from themanagers were collected during the ®rst halfof 1995.
Operations managers or the managers withpurchasing/supplier selecting responsibilitywere contacted by phone and were requestedto participate in the survey. It was alsoensured that the company manufacturedappropriate product(s) (with SIC code 33, 34or 35), and con®rmed that the companyemployed at least 15 people. From the originalpopulation, 139 managers agreed to partici-pate in the study. Survey instruments alongwith the cover letter, a postage-paid businessreply envelope, and a forwarding letter fromthe management department of a large stateuniversity in the western United States weremailed to the managers.
As mentioned earlier, a Likert-type scalewas used to explore the perceived importanceof various supplier attributes. The respondentswere asked to evaluate the relative importance
of ®ve broad supplier attributes from 1 (least
important) to 5 (most important). Past
research in supplier selection has identi®ed
quality, cost and delivery performance as im-
portant attributes. For this study, delivery per-
formance is measured with two separate
attributes, delivery lead-time and on time
delivery performance. Both of these criteria
are important for the customer's production
planning and scheduling, particularly for JIT
manufacturers [3]. Flexibility has been ident-
i®ed as another operations objective (or com-
petitive priority) and therefore was included as
one of the attribute [27]. Table 1 lists the ®ve
items used to explore Research Question I.
Next, we used discrete choice analysis
(DCA Ð also known as choice-based conjoint
analysis) to identify the actual supplier choice
process. Past research in econometrics, mar-
keting, and other social sciences has shown
that DCA is an e�ective methodology for ana-
lyzing choices in complex decision making
situations (such as supplier selection) [5, 33].
Discrete choice analysis is a systematic
approach for identifying the relative weights
of attributes among which the decision maker
tradeo�s when choosing an alternative from a
possible set of alternatives. This approach is
based on an econometric model called multi-
nomial logit (MNL), which uses a maximum
likelihood estimation scheme to maximize the
probability of choosing an alternative with
given attribute levels. This approach has been
successfully used for a variety of choice or tra-
deo�-type applications in marketing, consumer
research, transportation, recreation and leisure
research, hospitality, sociology and other
social sciences (for example Refs. [19, 31, 40]).
Later in this article we will present a brief
overview of DCA for the purpose of explain-
Table 1. Perceived importance of supplier attributes
On a scale 1 to 5, rate the relative importance of the following supplier attributes. Assume that you are evaluating theattributes for suppliers of key components/raw materials:
Least important Most importantUnit cost of components/rawmaterials
1 2 3 4 5
Quality of components/rawmaterials
1 2 3 4 5
Delivery lead-time 1 2 3 4 5On-time delivery performance 1 2 3 4 5Flexibility in changing the order 1 2 3 4 5
Omega, Vol. 26, No. 6 741

ing the research approach and the data analy-sis.
Discrete choice analysis involves designingseveral experimental pro®les (alternatives) ofthe decision situations (for example Ð pro®lesof suppliers with di�erent quality, cost, deliv-ery and ¯exibility attribute levels) and asks thedecision maker(s) to choose an alternativefrom a set of possible choices. Therefore thechoice (or tradeo�) pattern can be hypoth-esized to be dependent on the attribute levelsused to design the experimental pro®les (thealternatives are designed according to pre-determined experimental design proceduresand hence the researcher controls the levels ofindependent variables). The distribution ofdependent variable (choice) is determined bythe decision-maker (for example, managers).
Experimental design for a discrete-choiceanalysis starts with the identi®cation of deter-minant attributes used by the decision-makerin the evaluation process. Market surveys,interviews, case studies, and/or focus groupscan be conducted to identify a set of relevantattributes. In the case of supplier selectionprocess however, the past research has ident-i®ed quality, cost, delivery lead time, on timedelivery, and ¯exibility as important attributes.Therefore, in this study, the ®ve attributeslisted in Table 1 were used as supplier attri-butes.
After the identi®cation of the relevant attri-butes and their possible numerical/categoricalvalues, experimental design procedures are uti-lized to generate a set of alternatives.According to Louviere [32], most practicalconjoint studies involving four or more attri-butes at two or more levels rely on fractionalfactorial designs to limit the number of exper-imental pro®les. Green and Srinivasan [20]and Greenberg [22] suggest that respondentsevaluate no more than 30 pro®les. Mostresearchers attempt to limit the number ofpro®les to 16 or less to prevent degradation of
response quality. To reduce the number ofpro®les, researchers can do both of the follow-ing: (a) limit the number of attributes andattribute levels and (b) use fractional factorialdesigns capable of estimating all main-e�ectsand a limited number of interactions. Over thelast several years, a number of fractional fac-torial design procedures have been developedby applied statisticians which can be used todesign discrete choice experiments. See Refs.[8, 21, 25, 32, 34] for detailed discussions onfractional factorial design of experiments.
In order to limit the complexity of the ex-perimental design, we chose to consider onlytwo levels of each of the ®ve attributes. A fullpro®le design would require 25 (32) experimen-tal pro®les to estimate the main e�ects and allpossible interactions among these independentvariables. While a small number of pro®les arerequired for main e�ects only, Hagerty [23]recommends that whenever possible, two-wayinteractions among the attributes should beestimated also. Thus to get main and two-waye�ects, we used a standard one-half fraction ofthe 25 factorial design [25]. This design makesit possible to estimate all the main e�ects andtwo-way interaction terms with only 16 pro-®les.
Table 2 lists the ®ve attributes and their twolevels and experimental design codes. The de-sign codes ÿ1 and +1 represent the two levelsof the attributes. The design procedure was``balanced'' therefore ÿ1 and +1 levels appearan equal number of times for all the attributesin the experimental pro®les. This procedureassures no bias towards +1 levels or ÿ1 levelsin the experimental design. The fractional fac-torial design matrix used to generate the sup-plier pro®les is presented in Table 3.
A typical discrete-choice experiment showstwo or more alternatives to the decision-makerat the same time and asks him/her to choosethe preferred alternative. This choice task isrepeated several times (equal to number of
Table 2. Supplier attributes
Attributes Design code: ÿ1 Design code: +1
Unit cost of components/raw materials lower than competitors higher than competitorsQuality of components/raw materials meets minimum quality standards far exceeds minimum quality standardsDelivery lead-time shorter than competitors longer than competitorsOn-time delivery sometimes late always on timeFlexibility in changing the order lower than competitors higher than competitors
Verma, PullmanÐAn Analysis of the Supplier Selection Process742
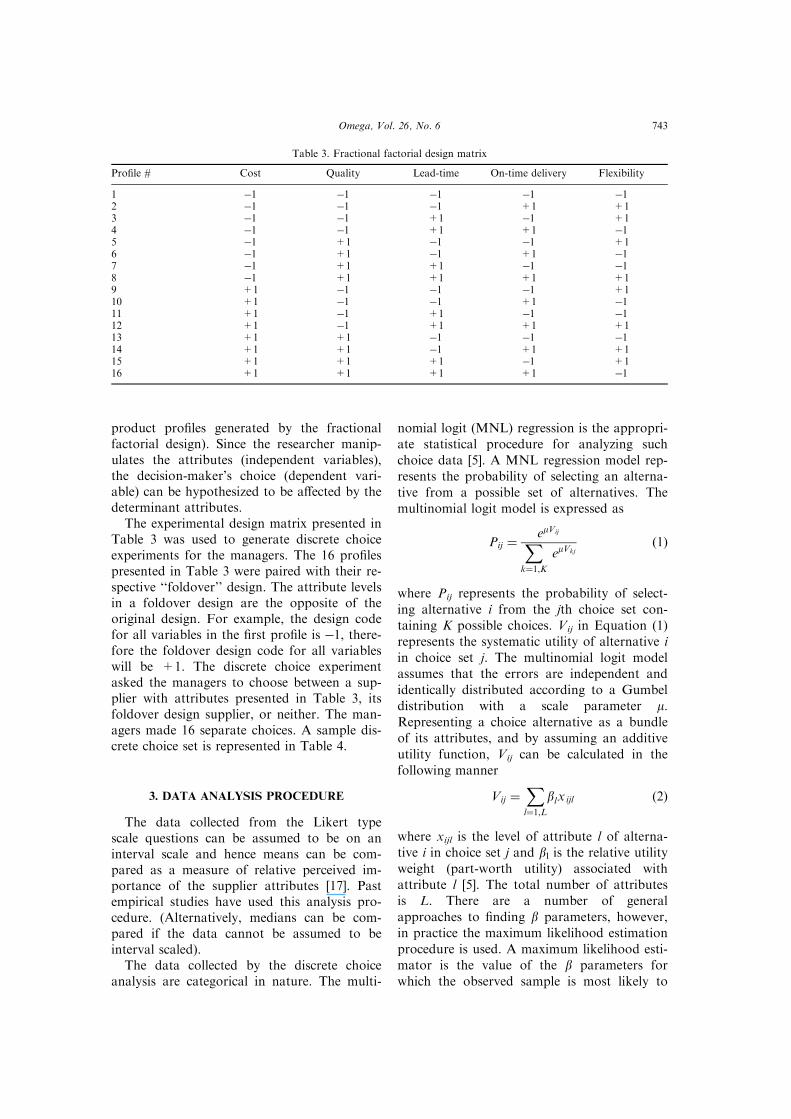
product pro®les generated by the fractionalfactorial design). Since the researcher manip-ulates the attributes (independent variables),the decision-maker's choice (dependent vari-able) can be hypothesized to be a�ected by thedeterminant attributes.
The experimental design matrix presented inTable 3 was used to generate discrete choiceexperiments for the managers. The 16 pro®lespresented in Table 3 were paired with their re-spective ``foldover'' design. The attribute levelsin a foldover design are the opposite of theoriginal design. For example, the design codefor all variables in the ®rst pro®le is ÿ1, there-fore the foldover design code for all variableswill be +1. The discrete choice experimentasked the managers to choose between a sup-plier with attributes presented in Table 3, itsfoldover design supplier, or neither. The man-agers made 16 separate choices. A sample dis-crete choice set is represented in Table 4.
3. DATA ANALYSIS PROCEDURE
The data collected from the Likert typescale questions can be assumed to be on aninterval scale and hence means can be com-pared as a measure of relative perceived im-portance of the supplier attributes [17]. Pastempirical studies have used this analysis pro-cedure. (Alternatively, medians can be com-pared if the data cannot be assumed to beinterval scaled).
The data collected by the discrete choiceanalysis are categorical in nature. The multi-
nomial logit (MNL) regression is the appropri-ate statistical procedure for analyzing suchchoice data [5]. A MNL regression model rep-resents the probability of selecting an alterna-tive from a possible set of alternatives. Themultinomial logit model is expressed as
Pij � emVijXk�1,K
emVkj�1�
where Pij represents the probability of select-ing alternative i from the jth choice set con-taining K possible choices. Vij in Equation (1)represents the systematic utility of alternative iin choice set j. The multinomial logit modelassumes that the errors are independent andidentically distributed according to a Gumbeldistribution with a scale parameter m.Representing a choice alternative as a bundleof its attributes, and by assuming an additiveutility function, Vij can be calculated in thefollowing manner
Vij �Xl�1,L
blx ijl �2�
where xijl is the level of attribute l of alterna-tive i in choice set j and bl is the relative utilityweight (part-worth utility) associated withattribute l [5]. The total number of attributesis L. There are a number of generalapproaches to ®nding b parameters, however,in practice the maximum likelihood estimationprocedure is used. A maximum likelihood esti-mator is the value of the b parameters forwhich the observed sample is most likely to
Table 3. Fractional factorial design matrix
Pro®le # Cost Quality Lead-time On-time delivery Flexibility
1 ÿ1 ÿ1 ÿ1 ÿ1 ÿ12 ÿ1 ÿ1 ÿ1 +1 +13 ÿ1 ÿ1 +1 ÿ1 +14 ÿ1 ÿ1 +1 +1 ÿ15 ÿ1 +1 ÿ1 ÿ1 +16 ÿ1 +1 ÿ1 +1 ÿ17 ÿ1 +1 +1 ÿ1 ÿ18 ÿ1 +1 +1 +1 +19 +1 ÿ1 ÿ1 ÿ1 +110 +1 ÿ1 ÿ1 +1 ÿ111 +1 ÿ1 +1 ÿ1 ÿ112 +1 ÿ1 +1 +1 +113 +1 +1 ÿ1 ÿ1 ÿ114 +1 +1 ÿ1 +1 +115 +1 +1 +1 ÿ1 +116 +1 +1 +1 +1 ÿ1
Omega, Vol. 26, No. 6 743

have occurred [5]. Therefore the likelihoodfunction for M subjects can be represented as
L �Y
m�1,M
Yl�1,L
Yj�1,J
PYijm
ij �3�
Yijm=1 if subject m chooses alternative i inchoice set j, Yijm=0 otherwise.
We used the NTELOGIT program to esti-mate b parameters for the supplier selectionprocess [37]. NTELOGIT calculates the b par-ameters for an aggregate sample data usingthe maximum likelihood estimation procedure.The ``goodness-of-®t'' statistics were also cal-culated. Please refer to Appendix A for detailson these statistics.
4. RESULTS
The survey was mailed to 139 managers and58 completed useable surveys were receivedfor a response rate of 41.7%. Table 5 presentsthe descriptive statistics of data collected bythe Likert-Type Scale questions. The resultsshow that managers perceive ``Quality'' to bemost important supplier attribute, followed by``On Time Delivery'' and ``Unit Cost ofParts''. This result is consistent with the paststudies, which have shown that managers per-
ceive quality to be the most important supplierattribute [43]. It is interesting to note that the®rst delivery performance measure ``On TimeDelivery'' is rated to be more important than``Unit Cost'' but the second measure of deliv-ery performance ``Delivery Lead Time'' israted to be less important than ``Unit Cost.''Flexibility in changing the order was perceivedto be the least important among the ®ve attri-butes.
Table 5 also lists the standard deviations forthe ®ve variables. Since the standard deviationvalues are relatively large (between 0.69 to1.08), statistical tests are not likely to showdi�erences between the mean perceived im-portance of the variables. All possible multiplepairwise comparisons were conducted andonly the mean of ``Quality'' was statisticallydi�erent from all the other variables. The me-dian perceived importances for the ®ve vari-ables are also shown in Table 5. This showsthat quality is perceived to be the most im-portant, followed by equal weight for unit costand delivery performance measures.
Table 6 presents the MNL regression modelfor the supplier choice process. NTELOGITwas used to estimate MNL regression modelfrom data collected by the discrete choice
Table 4. A sample discrete choice set (pro®le #10 from Table 3, and its ``foldover'' design)
Attributes Supplier #1 Supplier #2
Unit cost of components/rawmaterials
higher than competitors (+1) lower than competitors (ÿ1)
Quality of components/rawmaterials
meets minimum qualitystandards (ÿ1)
far exceeds minimum qualitystandards (+1)
Delivery lead-time shorter than competitors (ÿ1) longer than competitors (+1)On-time delivery always on time (+1) sometimes late (ÿ1)Flexibility in changing theorder
lower than competitors (ÿ1) higher than competitors (+1)
I would choose* supplier #1 __ supplier #2 __ neither __
*Assume that you are choosing a supplier of key components/raw materials.Each manager responded to 16 such discrete choice sets.
Table 5. Descriptive statistics for likert-type scale questions (#)
Variables Rank Mean Median Std. deviation
Cost III 3.96 4 0.922Quality* I 4.56 5 0.69Lead-time IV 3.87 4 0.9On-time delivery II 4.14 4 0.91Flexibility V 3.22 3 1.08
#Sample size = 58.*Pairwise comparisons show mean of ``Quality'' to be statistically di�erent from the other four variables at the 5% level.
Verma, PullmanÐAn Analysis of the Supplier Selection Process744

analysis. McFadden's r2 and adjustedMcFadden's r2 measures (similar to R2 andadjusted R2 in Ordinary Least Square re-gression) were found to be 0.7569 and 0.7510,respectively. It means approximately 75% ofthe variation in the dependent variable (choiceor tradeo� pattern) is explained by the esti-mated MNL regression model. Therefore itcan be concluded that the empirical data ®tthe MNL model extremely well. The log likeli-hood ratio was estimated to be 1548.34 (w2
with 6 degrees of freedom; p-value < 0.05)which is statistically signi®cant at the 5%level. The other two goodness-of-®t indicesAIC and CAIC were also >0, implying thatthe empirical data ®ts the estimated MNLmodel well. Please refer to the Appendix forinformation related to the goodness-of-®t stat-istics described above.
Table 6 also indicates that the part-worthutilities (weights or parameter estimates) forCost, Quality, Lead-Time and On-TimeDelivery are statistically signi®cant at a = 0.05(the statistical signi®cance of the b parameterswere estimated by NTELOGIT using anasymptotic t-statistic). Since the design codesfor the ®ve supplier attributes were standar-dized (ÿ1 and +1), the absolute magnitude ofthe b parameters represents the relative weightof the attribute in the supplier selection pro-cess. Cost has the highest absolute value, fol-
lowed by On-Time Delivery and Quality. Anegative sign of parameter (for exampleÿ0.5771 for Cost) indicates that a supplier'sutility (Equation (2)) will decrease if the attri-bute's value increases. For example, if a sup-plier has prices higher than its competitors (allother variables being equal), then that suppli-er's overall utility will be relatively lower.Similarly a positive sign of parameter impliesthat the overall utility will increase if the vari-able value is increased. For example, Table 6shows that managers assign more weight toCost followed by On-Time Delivery andQuality when actually choosing a supplier.Flexibility is not found to be a statistically sig-ni®cant attribute.
The fractional factorial design used to gen-erate discrete choice pro®les was orthogonal innature and therefore it was possible to esti-mate two-way interactions among the attri-butes. The interaction coe�cients documentthe non-linear e�ects of the attributes on thechoice process.
Since the Cost, Quality, Lead-Time and On-Time Delivery attributes were found to bestatistically signi®cant, another MNL logitmodel was developed which included the inter-action among these four attributes, in additionto their main e�ects on the supplier selectionprocess. Table 7 presents the MNL ``MainE�ects + Two-way Interactions'' model. The
Table 6. Multinomial logit main e�ects model (#)
Goodness-of-®t statistics:
LL(0) ÿ1022.81LL(b) ÿ248.64Log-likelihood ratio 1548.34*Akaike information index (AIC) 509.28Consistent akaike information index (CAIC) 558.01McFadden's r2 0.7569McFadden's r2 (Adj.) 0.7510
Parameter estimates:
Variable b Std. error p-value
Intercept 1.0895 0.1185 0.0000Cost ÿ0.5771 0.1249 0.0000Quality 0.3838 0.1173 0.0011Lead-time ÿ0.2871 0.1157 0.0131On-time delivery 0.4157 0.1184 0.0005Flexibility 0.0445 0.1136 0.6954
#The model is based on 928 responses because 58 managers responded to 16 discrete choice sets, each.*w2 distributed with 6 degrees of freedom.
Omega, Vol. 26, No. 6 745

log likelihood ratio (1551.88; w2 with 12degrees of freedom' p-value < 0.05), AIC andCAIC show that the overall model ®ts thedata well. However, the r2 for this model was0.7586 which is only slightly higher than the``Main E�ects Only'' model (Table 6). Noneof the two-way interactions was found to bestatistically signi®cant as shown in Table 7where the non-linear e�ects of the attributesare negligible compared to the main e�ects.
5. DISCUSSION
The results of the Likert-Type scale ques-tions (Table 5) show that the managers per-ceive quality to be the most importantattribute when selecting a supplier. This resultis consistent with the past research on thetopic. The standard deviations for all the vari-ables are relatively large, therefore exceptquality, statistically there are no signi®cantdi�erences among the mean scores for theother four variables. On the other hand, theestimated logit model developed from theDCA data provides useful information formany types of strategic decisions. First of all,
it shows that four independent variables arestatistically signi®cant in predicting tradeo�sin supplier selection process. Additionally ahigh McFadden r2 suggests that the estimatedMNL model ®ts the empirical data (supplierchoice process) very well.
The MNL regression model shows that themanagers assign more weight to cost and ontime delivery compared to quality. This resultis perhaps the most important ®nding of thestudy. It suggests that even though managersunderstand and perceive quality to be moreimportant than cost, in practice they do notchoose supplier based on quality. We believethat this result has important implications forpractice and future research on supply chainmanagement.
The estimated MNL model can be used tocompare the likelihood of choosing a supplierfrom a group of alternatives. A simpleexample can illustrate the point. Assume thatthere are only two suppliers with the attributelevels shown in Table 8. Supplier 1 has lowercosts but relatively lower quality and unreli-able delivery performance while Supplier 2 hashigher cost, quality and reliable delivery per-
Table 7. Multinomial logit main e�ects + selected interactions model (#)
Goodness-of-®t statistics:
LL(0) ÿ1022.81LL(b) ÿ246.87Log-likelihood ratio 1551.88*Akaike information index (AIC) 517.74Consistent akaike information index (CAIC) 615.19McFadden's r2 0.7586McFadden's r2 (Adj.) 0.7469
Parameter estimates:
Variable b Std. error p-value
Intercept 1.0997 0.1429 0.0000Cost ÿ0.5776 0.1354 0.0000Quality 0.3745 0.1274 0.0033Lead-time ÿ0.2980 0.1254 0.0174On-time delivery 0.4177 0.1293 0.0012Flexibility 0.0407 0.1258 0.7461Cost�quality 0.0391 0.1356 0.7731Cost� lead-time 0.0362 0.1356 0.7694Cost�on-time delivery 0.0727 0.1376 0.9578Quality� lead-time 0.0170 0.1285 0.8978Quality�on-time delivery 0.1237 0.1295 0.3394Lead Time�on-time delivery 0.1351 0.1292 0.2957
#Model based on 928 responses.*w2 distributed with 6 degrees of freedom.
Verma, PullmanÐAn Analysis of the Supplier Selection Process746

formance. Given the MNL parameter esti-mates, Table 8 shows that probability ofselecting Supplier 1 is 0.3906 while probabilityof selecting Supplier 2 is 0.6094. The impactof change in strategies can be easily calculatedfrom the MNL Model. For example, assumeSupplier 1 increases its quality level from``minimum required'' to ``far exceeding mini-mum requirement'' and Supplier 2 retains itscurrent strategy. Then the probability of selec-tion of Supplier 1 and Supplier 2 shift to 58%and 42%, respectively.
6. CONCLUSIONS AND DIRECTIONS FOR
FUTURE RESEARCH
Leading publications in business manage-ment emphasize the need for understandingmanufacturing decisions and practices forimproving the competitive position of a ®rm.Various publications argue that it is necessaryfor the manufacturing decisions and choices tobe consistent with the corporate strategy fore�ective operations management. The objec-tive of this research was to understand onestrategic operating decision area: the supplierselection process. As more manufacturing or-ganizations adopt TQM and JIT concepts, therole of supplier and supply chain managementbecomes even more important.
This study was designed primarily to studyhow managers tradeo� among quality, cost,delivery and ¯exibility attributes when choos-ing a supplier for major components and/orraw materials. In order to compare the choiceresults with previous empirical studies relatingto supplier selection, managers were alsoasked to rate the supplier attributes on aLikert-type scale. The results presented in thisarticle show that managers perceive Quality asthe most important supplier attribute.However the same sample of managers assignmore weight to Cost and On Time Deliveryattributes than Quality when actually choosinga supplier.
The results presented in this paper have im-portant implications for the operations strat-egy and supply chain management research. Itis clear that for the sample of ®rms studied,there is a gap between the perception andactual practice. A possible explanation forthese results might be that the operating prac-tices in the sample of ®rms studied are notcompletely consistent with their strategic pri-orities. It is also possible that the performanceevaluation for the managers responsible forselecting suppliers are more weighted towardsthe cost and delivery performance measuresand therefore even though they perceive qual-ity to be more important, it is not the most
Table 8. Using multinomial logit models: an example
Attributes Supplier #1 (design code) Supplier #2 (design code)
Cost lower than competitors (ÿ1) higher than competitors (+1)Quality meets minimum quality standards (ÿ1) far exceeds minimum quality standards (+1)Delivery lead-time longer than competitors (+1) longer than competitors (+1)On-time delivery sometimes late (ÿ1) always on time (+1)Flexibility lower than competitors (ÿ1) lower than competitors (ÿ1)Utility of Supplier #1:
V1 = 1.0895 + (ÿ1)*(ÿ0.5771) + (ÿ1)*(+0.3838) + (+1)*(ÿ0.2871) + (ÿ1)*(+0.4157) + (ÿ1)*(+0.0445) = 0.5355.
Utility of Supplier #2:
V2=1.0895+(+1)*(ÿ0.5771) + (+1)*(+0.3838) +(+1)*(ÿ0.2871)+ (+1)*(+0.4157)+(ÿ1)*(+0.0445)=0.9803.
Probability of choosing Supplier #1:
Pc�1� � e0:5355
e0:5355 � e0:9803� 0:3906:
Probability of choosing Supplier #2:
Pc�2� � e0:9803
e0:5355 � e0:9803� 0:6094:
Omega, Vol. 26, No. 6 747

important criterion when actual choice ismade.
Anderson et al. [1] de®ne operations strat-egy as a long-range vision for the operationsfunction. The plan must be integrated withbusiness strategy and implemented throughoutthe operating decision areas. They suggest thatthe resulting strategy based on a ®rm's mis-sion, objectives, policies and distinctive compe-tence should guide tactical operating decisions.The results presented in this article show thatit is possible that the choice or actual im-plementation decisions might not be consistentwith the stated management's vision. Theseresults raise several interesting questions foroperations strategy researchers: When can weexpect a gap between the stated operationsstrategy and actual implementation? If suchgaps do exist, how can they be reduced? Howdo such strategy gaps a�ect ®rm performance?Are the results presented in this paper general-izable to other industries/samples/operatingfunctions?
The objective of this article was to investi-gate actual practice and choice in an import-ant POM decision area. We have shown thatstudying operating choices can be a worth-while exercise for understanding operationsstrategy processes. Similar studies should beundertaken to further the knowledge of oper-ations strategy process. Further studies arealso required to validate the results presentedin this study and obtain more generalizableresults. For example, our analysis was basedon a relatively small sample size, both in termsof the number of respondents and in terms ofthe industries studied. It is possible that thesupplier selection process varies from industryto industry and/or within di�erent geographi-cal regions around the globe.
Since this paper was the ®rst attempt tomodel actual supplier selection process usingdiscrete choice analysis and multinomial logitmodel, we used two levels and only ®ve attri-butes to describe the alternatives (suppliers) tothe decision makers (managers). Even thoughthe MNL models with two levels generallyexplain close to 75% of variation in the choiceprocesses, they can only be used for ``explora-tory'' type analyses. Supplier selection is ahighly complex process involving in¯uencesfrom two or more organizations, several indi-viduals/departments, and other operating pol-
icies. For example, the two levels of qualityused in this study, ``meets minimum qualitylevel'' and ``far exceeds minimum qualitylevels'', might provide an alternative expla-nation for Quality's lower utility (b) comparedto Cost. It can be argued that once the com-ponents/raw materials reach the minimumacceptable quality level, management's focusoften shifts to Cost reduction. Similarly, add-ing more attributes in the experimental design(for example, multidimensional quality attri-butes±features, reliability, durability, ...of com-ponents) might provide additional insights tothe complex process of supplier selection.
APPENDIX
GOODNESS-OF-FIT STATISTICS
An asymptotic t-statistic (similar to a t-testin the OLS regression) can be calculated forestimated b parameters in MNL model.Several likelihood ratio tests (similar to an F-test in OLS regression) can be used to test theoverall MNL model. A log-likelihood ratiotest is based on the di�erences between thenatural logarithm of the likelihood function(Equation (3)) under two conditions. First thelikelihood ratio is calculated assuming equalprobability of choosing all the alternatives in achoice set or by assuming all b parameters tobe zero. This natural logarithm of the likeli-hood (log-likelihood) value is represented asLL(0). Next, the likelihood ratio is calculatedagain, assuming the estimated b parameters.This log-likelihood value is called LL(b).Then, the log-likelihood ratio test is de®ned as
ÿ2�LL�0� ÿ LL�b�� �A:1�and is w2 distributed with the degrees of free-dom equal to the number of b parameters.Other goodness-of-®t measures called AkaikeInformation Criteria (AIC) and ConsistentAkiake Information Criteria (CAIC) arede®ned in the following manner:
AIC � ÿ2�LL�b� ÿ number of b parameters��A:2�
Verma, PullmanÐAn Analysis of the Supplier Selection Process748
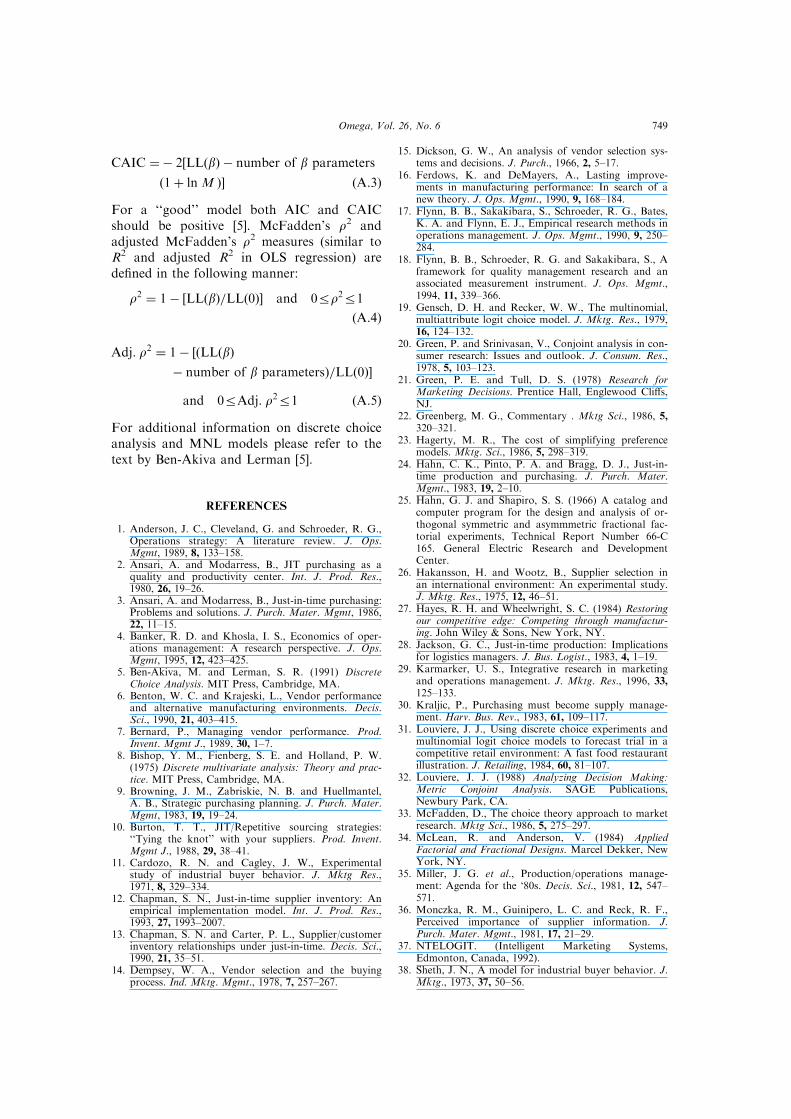
CAIC �ÿ 2�LL�b� ÿ number of b parameters
�1� ln M �� �A:3�For a ``good'' model both AIC and CAICshould be positive [5]. McFadden's r2 andadjusted McFadden's r2 measures (similar toR2 and adjusted R2 in OLS regression) arede®ned in the following manner:
r2 � 1ÿ �LL�b�=LL�0�� and 0Rr2R1
�A:4�
Adj: r2 � 1ÿ ��LL�b�ÿ number of b parameters�=LL�0��and 0RAdj: r2R1 �A:5�
For additional information on discrete choiceanalysis and MNL models please refer to thetext by Ben-Akiva and Lerman [5].
REFERENCES
1. Anderson, J. C., Cleveland, G. and Schroeder, R. G.,Operations strategy: A literature review. J. Ops.Mgmt, 1989, 8, 133±158.
2. Ansari, A. and Modarress, B., JIT purchasing as aquality and productivity center. Int. J. Prod. Res.,1980, 26, 19±26.
3. Ansari, A. and Modarress, B., Just-in-time purchasing:Problems and solutions. J. Purch. Mater. Mgmt, 1986,22, 11±15.
4. Banker, R. D. and Khosla, I. S., Economics of oper-ations management: A research perspective. J. Ops.Mgmt, 1995, 12, 423±425.
5. Ben-Akiva, M. and Lerman, S. R. (1991) DiscreteChoice Analysis. MIT Press, Cambridge, MA.
6. Benton, W. C. and Krajeski, L., Vendor performanceand alternative manufacturing environments. Decis.Sci., 1990, 21, 403±415.
7. Bernard, P., Managing vendor performance. Prod.Invent. Mgmt J., 1989, 30, 1±7.
8. Bishop, Y. M., Fienberg, S. E. and Holland, P. W.(1975) Discrete multivariate analysis: Theory and prac-tice. MIT Press, Cambridge, MA.
9. Browning, J. M., Zabriskie, N. B. and Huellmantel,A. B., Strategic purchasing planning. J. Purch. Mater.Mgmt, 1983, 19, 19±24.
10. Burton, T. T., JIT/Repetitive sourcing strategies:``Tying the knot'' with your suppliers. Prod. Invent.Mgmt J., 1988, 29, 38±41.
11. Cardozo, R. N. and Cagley, J. W., Experimentalstudy of industrial buyer behavior. J. Mktg Res.,1971, 8, 329±334.
12. Chapman, S. N., Just-in-time supplier inventory: Anempirical implementation model. Int. J. Prod. Res.,1993, 27, 1993±2007.
13. Chapman, S. N. and Carter, P. L., Supplier/customerinventory relationships under just-in-time. Decis. Sci.,1990, 21, 35±51.
14. Dempsey, W. A., Vendor selection and the buyingprocess. Ind. Mktg. Mgmt., 1978, 7, 257±267.
15. Dickson, G. W., An analysis of vendor selection sys-tems and decisions. J. Purch., 1966, 2, 5±17.
16. Ferdows, K. and DeMayers, A., Lasting improve-ments in manufacturing performance: In search of anew theory. J. Ops. Mgmt., 1990, 9, 168±184.
17. Flynn, B. B., Sakakibara, S., Schroeder, R. G., Bates,K. A. and Flynn, E. J., Empirical research methods inoperations management. J. Ops. Mgmt., 1990, 9, 250±284.
18. Flynn, B. B., Schroeder, R. G. and Sakakibara, S., Aframework for quality management research and anassociated measurement instrument. J. Ops. Mgmt.,1994, 11, 339±366.
19. Gensch, D. H. and Recker, W. W., The multinomial,multiattribute logit choice model. J. Mktg. Res., 1979,16, 124±132.
20. Green, P. and Srinivasan, V., Conjoint analysis in con-sumer research: Issues and outlook. J. Consum. Res.,1978, 5, 103±123.
21. Green, P. E. and Tull, D. S. (1978) Research forMarketing Decisions. Prentice Hall, Englewood Cli�s,NJ.
22. Greenberg, M. G., Commentary . Mktg Sci., 1986, 5,320±321.
23. Hagerty, M. R., The cost of simplifying preferencemodels. Mktg. Sci., 1986, 5, 298±319.
24. Hahn, C. K., Pinto, P. A. and Bragg, D. J., Just-in-time production and purchasing. J. Purch. Mater.Mgmt., 1983, 19, 2±10.
25. Hahn, G. J. and Shapiro, S. S. (1966) A catalog andcomputer program for the design and analysis of or-thogonal symmetric and asymmmetric fractional fac-torial experiments, Technical Report Number 66-C165. General Electric Research and DevelopmentCenter.
26. Hakansson, H. and Wootz, B., Supplier selection inan international environment: An experimental study.J. Mktg. Res., 1975, 12, 46±51.
27. Hayes, R. H. and Wheelwright, S. C. (1984) Restoringour competitive edge: Competing through manufactur-ing. John Wiley & Sons, New York, NY.
28. Jackson, G. C., Just-in-time production: Implicationsfor logistics managers. J. Bus. Logist., 1983, 4, 1±19.
29. Karmarker, U. S., Integrative research in marketingand operations management. J. Mktg. Res., 1996, 33,125±133.
30. Kraljic, P., Purchasing must become supply manage-ment. Harv. Bus. Rev., 1983, 61, 109±117.
31. Louviere, J. J., Using discrete choice experiments andmultinomial logit choice models to forecast trial in acompetitive retail environment: A fast food restaurantillustration. J. Retailing, 1984, 60, 81±107.
32. Louviere, J. J. (1988) Analyzing Decision Making:Metric Conjoint Analysis. SAGE Publications,Newbury Park, CA.
33. McFadden, D., The choice theory approach to marketresearch. Mktg Sci., 1986, 5, 275±297.
34. McLean, R. and Anderson, V. (1984) AppliedFactorial and Fractional Designs. Marcel Dekker, NewYork, NY.
35. Miller, J. G. et al., Production/operations manage-ment: Agenda for the `80s. Decis. Sci., 1981, 12, 547±571.
36. Monczka, R. M., Guinipero, L. C. and Reck, R. F.,Perceived importance of supplier information. J.Purch. Mater. Mgmt., 1981, 17, 21±29.
37. NTELOGIT. (Intelligent Marketing Systems,Edmonton, Canada, 1992).
38. Sheth, J. N., A model for industrial buyer behavior. J.Mktg., 1973, 37, 50±56.
Omega, Vol. 26, No. 6 749

39. Treleven, M., Single sourcing: A management tool forthe quality supplier. J. Purch. Mater. Mgmt, 1987, 23,19±24.
40. Verma, R. and Thompson, G. M., Basing service man-agement on customer determinants: The importance ofhot pizza. Cornell Hotel Rest. Adm. Q., 1996, 37, 18±23.
41. Wagner, J., Ettenson, R. and Parrish, J., Vendor selec-tion among retail buyers: An analysis by merchandisedivision. J. Retailing, 1989, 65, 58±77.
42. Weber, C. A. and Current, J. R., A multiobjectiveapproach to vendor selection. Eur. J. Oper. Res., 1993,68, 173±184.
43. Weber, C. A., Current, J. R. and Benton, W. C.,Vendor selection criteria and methods. Eur. J. Oper.Res., 1991, 50, 2±18.
ADDRESS FOR CORRESPONDENCE: Professor Rohit Verma,Department of Management, Kellstadt GraduateSchool of Business, DePaul University, Chicago IL60604, USA; Tel: 312 362 6145; Fax: 312 362 6973;E-mail: [email protected].
Verma, PullmanÐAn Analysis of the Supplier Selection Process750
Copyright © 2022 FDOKUMEN