Decision support model for supplier selection in healthcare ...
24
Vol. 10(9), pp. 209-232, 14 May, 2016 DOI: 10.5897/AJBM2016.8030 Article Number: 4A78A4958343 ISSN 1993-8233 Copyright © 2016 Author(s) retain the copyright of this article http://www.academicjournals.org/AJBM African Journal of Business Management Full Length Research Paper Decision support model for supplier selection in healthcare service delivery using analytical hierarchy process and artificial neural network Stephen Gbenga Fashoto 1 *, Boluwaji Akinnuwesi 2 , Olumide Owolabi 3 and David Adelekan 4 1 Department of Computer Science, Kampala International University, Kampala, Uganda. 2 Department of Computer Science, Lagos State University Ojo Lagos, Nigeria. 3 Department of Computer Science and ICT Centre, University of Abuja, Nigeria. 4 Department of Computer Science, Redeemer‘s University Ede, Osun State, Nigeria. Received 12 February 2016; 20 March, 2016 The healthcare industry today has grown rapidly and emphasizing the efficiency and effectiveness within the healthcare delivery systems has become a major priority in the field. In order to increase the satisfaction and safety of patient, hospitals must improve their overall performance. We established from our review that a number of models have been developed for supplier selection using diverse methods. Most of the models were used to evaluate the performance of healthcare service sector but there is little emphasis on suppliers of health service facilities. And also to the best of our search, we could not find research works on models for evaluating and selecting suppliers in the healthcare unit of tertiary institution. Hence our focus in this study is to develop a decision support model for evaluating and selecting suppliers in the healthcare service of universities. The use of manual techniques for supplier selection in healthcare unit of universities in developing countries is quite tedious and inefficient particularly when several criteria are taken into consideration. These make decision making difficult and also cause the health centre to frequently stock out. Moreover deciding when to order and how much to order is not very easy and hence not meeting patients’ demands adequately. This study focuses on investigating and developing a decision support model for evaluating and selecting suppliers in the healthcare service of tertiary institutions using analytical hierarchy process (AHP) and artificial neural network (ANN). Our case study is the health center of Redeemers University, Nigeria. According to the Overall Priority Vector, the priority values for the respective criteria are: Quality = 0.2192, Service = 0.2160, Delivery = 0.2102, Cost = 0.1968 and Risk = 0.1860. Our results revealed that the quality of product supply by the supplier is the most important criterion, while the risk on the supplies is the least important. To improve on the accuracy of these results, the AHP model was supplemented by a 3-layer artificial neural network, adding a learning component to the model. The result also shows that quality is the most important criterion, but with a high index of 0.6845 as opposed to 0.2192 for the AHP alone. This shows that the hybrid model is much better than the AHP alone. Key words: Supply chain management, AHP, ANN, decision making and supplier selection. INTRODUCTION The healthcare industry today as grown rapidly and emphasizing the efficiency and effectiveness within the healthcare delivery systems has become a major priority in the field. In order to increase patients; satisfaction and
-
Upload
khangminh22 -
Category
Documents
-
view
4 -
download
0
Transcript of Decision support model for supplier selection in healthcare ...

Vol. 10(9), pp. 209-232, 14 May, 2016
DOI: 10.5897/AJBM2016.8030
Article Number: 4A78A4958343
ISSN 1993-8233
Copyright © 2016
Author(s) retain the copyright of this article
http://www.academicjournals.org/AJBM
African Journal of Business Management
Full Length Research Paper
Decision support model for supplier selection in healthcare service delivery using analytical hierarchy
process and artificial neural network
Stephen Gbenga Fashoto1*, Boluwaji Akinnuwesi2, Olumide Owolabi3 and David Adelekan4
1Department of Computer Science, Kampala International University, Kampala, Uganda.
2Department of Computer Science, Lagos State University Ojo Lagos, Nigeria.
3Department of Computer Science and ICT Centre, University of Abuja, Nigeria.
4Department of Computer Science, Redeemer‘s University Ede, Osun State, Nigeria.
Received 12 February 2016; 20 March, 2016
The healthcare industry today has grown rapidly and emphasizing the efficiency and effectiveness within the healthcare delivery systems has become a major priority in the field. In order to increase the satisfaction and safety of patient, hospitals must improve their overall performance. We established from our review that a number of models have been developed for supplier selection using diverse methods. Most of the models were used to evaluate the performance of healthcare service sector but there is little emphasis on suppliers of health service facilities. And also to the best of our search, we could not find research works on models for evaluating and selecting suppliers in the healthcare unit of tertiary institution. Hence our focus in this study is to develop a decision support model for evaluating and selecting suppliers in the healthcare service of universities. The use of manual techniques for supplier selection in healthcare unit of universities in developing countries is quite tedious and inefficient particularly when several criteria are taken into consideration. These make decision making difficult and also cause the health centre to frequently stock out. Moreover deciding when to order and how much to order is not very easy and hence not meeting patients’ demands adequately. This study focuses on investigating and developing a decision support model for evaluating and selecting suppliers in the healthcare service of tertiary institutions using analytical hierarchy process (AHP) and artificial neural network (ANN). Our case study is the health center of Redeemers University, Nigeria. According to the Overall Priority Vector, the priority values for the respective criteria are: Quality = 0.2192, Service = 0.2160, Delivery = 0.2102, Cost = 0.1968 and Risk = 0.1860. Our results revealed that the quality of product supply by the supplier is the most important criterion, while the risk on the supplies is the least important. To improve on the accuracy of these results, the AHP model was supplemented by a 3-layer artificial neural network, adding a learning component to the model. The result also shows that quality is the most important criterion, but with a high index of 0.6845 as opposed to 0.2192 for the AHP alone. This shows that the hybrid model is much better than the AHP alone.
Key words: Supply chain management, AHP, ANN, decision making and supplier selection. INTRODUCTION
The healthcare industry today as grown rapidly and emphasizing the efficiency and effectiveness within the
healthcare delivery systems has become a major priority in the field. In order to increase patients; satisfaction and

210 Afr. J. Bus. Manage. safety, hospitals must improve their overall performance. Therefore, the best equipment and drugs have to be used. This brought about the issues of supplier selection which have captivated the enthusiasm of analysts since the 1960s, and exploration around there has expanded. The need for effective delivery in the health system using a supply chain system has been a welcoming idea in the overall output and performance. The supply chain ma-nagement frameworks is the incorporation of exercises to get materials, change them into quick products and last item and convey them to clients (Heizer and Render, 2001). The supply chain management (SCM) underlines the key helpful relationship between main enterprise and enterprise coalition. The choice of vital accomplices is a critical choice making issue in SCM and is the way to fruitful SCM.
Despite the numerous studies that have been conducted over the years, there is still need to develop a supplier selection decision support system that will enhance the university‘s current system of approach in the area of supplier selection which is quite inefficient where decision making on how to choose a supplier are based on either reference or cost, whereas, there are several criteria to take into considerations which includes price, delivery, risk, quality and service. This difficulty in decision making has led the Health Centre to frequent stock outs, deciding when to order and how much to order and adequately meet patients‘ demand.
Though there are traditional cost-based approaches for evaluating and selecting suppliers, evidences were provided in various researches reviewed (Ho et al., 2010; Liberatore and Nydick, 2008) that the multi-criteria de-cision making approaches are better than the traditional cost-based approaches. According to Baltussen and Niessen (2006), an approach that has been gaining momentum in the healthcare supply sector is the Multi-Criteria Decision Making (MCDM) which is a method to aid decision making, where decision are based on more than one criteria. An example is the Analytical Hierarchy Process (AHP). The Analytic Hierarchy Process (AHP) is a multi-criteria decision making (MCDM) method. The model is a technique used in supplier selection and assessment. It makes selection process transparent as well as reveals the relative benefits of alternate answers for a multi criteria choice making issues (Drake, 1998). It is a model developed by Thomas Saaty in the 1970s as a method for managing weapons tradeoffs, asset and resource distribution, and choice making. It utilizes the judgments of leaders to shape a breakdown of issues into chains of hierarchies. The hierarchies are for deriving ratio-scaled measures for choice making and the relative value that alternatives have against organizational goals
and project risks. AHP utilizes matrix algebra to deal with variables to land at a numerically ideal arrangement. It derives ratio scales from matched examination (paired comparisons) of com-ponent and decision alternatives. It additionally utilizes genuine measures like value, checks, or subjective assessment as inputs into a numerical matrix. The yields comprise ratio scales and consistency records derived by computing eigenvalues and eigen-vectors.
AHP model in decision making and supply chain ma-nagement consist of four steps which include: (1) Model development and problem formulation, (2) Pair-wise comparison of determinant, (3) Evaluation of alternatives and (4) Calculation and final result.
Supplier selection decision is a multi-criterion problem (Kahraman et al., 2003) and as a result, some attributes are important in supplier selection process. Van der Rhee et al. (2009) established the relative impact of cost, flexi-bility, delivery and service features on supplier selection based on perspectives of respondents from manufac-turing organizations in Europe (that is, Germany, France, Italy, and UK) using a computer-based supplier selection discrete choice survey. Suppliers‘ flexibility was valued most and next was the cost variable. In addition, Hsu et al. (2013) identified the key criteria influencing the supplier selection with regard to carbon management competencies. Decision-making Trial and Evaluation Laboratory (DEMATEL) approach was applied and its application revealed both the structure and interrelation-ships between the criteria.
In Kahraman et al. (2003), fuzzy analytic hierarchy process (FAHP) was used to select the best supplier firm providing the most satisfaction for the criteria determined. Fuzzy based AHP was used because of the complex and unstructured nature of the supplier selection process.
This paper concentrates on the application of AHP-ANN model for supply chain management in healthcare service delivery and also to identify appropriate decision making processes discussing the advantages and disadvantages of traditional decision making process and focusing more on designing an AHP based model having enhanced features. AHP is used to assign the weights of the alternatives with regard to one or more of the criteria to ANN. ANN utilizes the weight of each criterion from AHP model to select the best supplier and find alternate suppliers on the basis of performance score of each supplier.
AHP modelling methodology was utilized in this study for the following reasons (Saaty, 1996; Chan and Chan, 2004; Sarkis and Surrandaj, 2006; Liberatore and Nydick, 2008): a. AHP is not proportionately complicated as compared
*Corresponding author. E-mail: [email protected].
Authors agree that this article remain permanently open access under the terms of the Creative Commons Attribution
License 4.0 International License

Fashoto et al. 211
Figure 1. Flow of a supply chain management (Bakar et al., 2010).
modeling technique. b. It has the supplemental power of being able to mix quantitative and qualitative factors into a decision. It uses a hierarchical structuring of the factors involved. The hierarchical structuring is universal to the composition of virtually all complex systems, and is a natural problem-solving paradigm in the face of complexity. c. In AHP, judgments evoked are completed using a decomposition approach, which has been shown in experimental studies to reduce decision making errors. d. AHP is validated from the decision maker‘s perspective as well in recent empirical studies. It is a technique that can prove valuable in helping multiple parties (stakeholders) arrive at an agreeable solution due to its structure, and if implemented appropriately can be used as a consensus-building tool. e. Justification for ANN
AHP modelling, though, depends on human intuition, especially in the process of pair wise comparison. Thus, any lack of information regarding the supplier selection criteria may disturb the evaluation process. To overcome this difficulty, we combine the AHP with Artificial Neural Network (ANN) and propose a hybrid AHP-ANN methodology in this paper to improve the data analysis of AHP. The ANN provides a new way for feature extraction (using hidden layers) and classification, as well as adding a learning mechanism to the AHP. This, it is hoped, will produce better results than the ordinary AHP method (Ghodsypour and O‘Brien, 1998; Al-Barqawi and Zayed, 2008; Simunovis et al., 2009).
REVIEW OF RELATED LITERATURE
Review of works on supplier selection and assessment
Over the years, the rate at which quality healthcare expenses is increasing is becoming a source of major concern. A noteworthy piece of medicinal services expense is the pharmaceutical supply segment. Enhanc-ing medicinal services supply chains is discriminating due to the monetary size as well as due to the way that it affects such a large number of individuals. Health is a total state of complete well-being or balance often physical (free from disease, illness or malfunction) but sometimes also mental and social. Being healthy does not mean you are totally free from ailment or diseases and this leads to the issue of healthcare. Healthcare is a
costly, complex, globally used service that massively influences economy and the quality of life (Berry and Bendapudi, 2007).
Due to the rise in competition of global world markets, the supply chain management system framework is turning into a hot issue in the international market today. Organizations are under extreme weight to discover approaches to slice out material expenses and production to survive and maintain their economic position in their individual markets.
According to Christopher (1994), a supply chain networks are system of establishments that are involved in the different procedures and exercises that convey value in the form of products and services in the hands of a customer through upstream and downstream linkages. SCM connects with the administration of streams between and among stages in an inventory network system to minimize total cost. The SCM framework is the combination of exercises to procure materials, change them into immediate goods and final product then convey them to clients (Heizer and Render, 2001). It includes all exertion included in producing, delivering and conveying a finished product or service from the supplier to the customer (Styles et al., 2012; Bradley and Solutions, 2007). SCM framework is a procedure of arranging, controlling and observing of the supply chain operations with the aim of fulfilling customers‘ demand in an effective, successful and gainful way (Bakar et al., 2010). It manages the aggregate stream of exercises or activities from suppliers through end users (Jones and Riley, 1985; Ware et al., 2012). The activities incorporate arranging, sourcing, making, and improvement of proce-dures with its constituent parts to incorporate material suppliers, production facilities, distribution centers, and customers. Cooper et al. (1997) characterized supply chain network as an integrative theory to manage the total stream of a circulation channel from supplier to a definitive client as presented in Figure 1. Thus SCM alludes to an arrangement of strategies for feasibly consolidating suppliers, makers, merchants and retailers to create stocks and convey them accordingly, minimizing framework cost under the precondition of guaranteeing administration level and conveying stocks of legitimate amounts to right places in suitable time.
SCM strategies have been demonstrated effective in various commercial enterprises, for example, producing, rural business, aviation, retailing, development, steel, auto, railroad, keeping money and budgetary
establishments, material and even little and medium measured ventures (Bakar et al., 2010).

212 Afr. J. Bus. Manage.
The medicinal services industry is experiencing aggravating patterns related to cost, quality, and expanded competition. It is surely understood that no industry can survive without considering much about diminishing cost wherever possible. The same is valid for the healthcare industry, which is experiencing sharp rise in expense and in every one of its items and administrations. The alarming high stride of upward advancement of costs is making the produce of the business past the range of the mass. Due to this weights, firms have swung to supply chain management (SCM) as intend to upgrade adaptability, versatility, cost, quality, and responsiveness (Chen and Paulraj, 2004). Supply chain in this industry being a huge driver of expense is accordingly getting all the consideration from industry stakeholders. The healthcare industry has also sought to reap some of the proposed benefits of effective SCM in recent years as the concept of partnering with customers, suppliers, and thus various strategic service providers has gained momentum. As indicated by Walters and Rainbird (2007), the medicinal services store network system offers different likenesses with different chains, not just as far as strategies (e.g. acquirement, warehousing and circulation), additionally regarding recognizing clients and administration structures.
SCM in healing centers includes the inside chain (that is, patients‘ consideration unit, clinic stockpiling, patient etc) and the outer chain (that is, merchants, makers, wholesalers and so on). Human services SCM procedures have three sorts of streams: physical item stream, data stream, and budgetary stream. The physical item stream oversees modified items and administrations for the treatment of patients and their needs. Data and money related streams are identified with production network outline choices for powerful item stream and enhanced hierarchical execution (Lee et al., 2011).
Supplier selection and assessment is the procedure or method of finding a supplier who is capable of giving the purchaser quality items at little expense or cost, and providing the right amount at a précised time. It is an imperative part for creation and logistics administration in numerous organizations (Min, 1994; Sonmez, 2006). In the present time, purchasers request less expensive, superb items, on-time conveyance and magnificent after-deal administrations. Qualified supplier is a key component and a decent asset for a purchaser in decreasing expenses; therefore, assessment and determination of the potential suppliers has turn into an imperative part of supply chain management. Selecting right suppliers significantly lessens the material buying cost and enhances corporate competitiveness (Cheraghi et al., 2011). A lot of works have been carried out on supplier selection and assessment and thus Table 1 presented a few of them.
A review of analytical hierarchy process (AHP)
The Analytical Hierarchy Process since its development
has been an apparatus for decision makers and specialists. The AHP model makes use of MCDM strategy, which is a system to help choice making, where decision are based on more than one criterion. The model is a method utilized as a part of supplier determination and assessment. It makes selection process transparent, straightforward and in addition uncovers the answers for a multi criteria choice making issues (Drake, 1998). It is a model developed by Thomas Saaty in the 1970s for managing weapons tradeoffs, asset and resource assignment, and decision making. The AHP model consists of four major operations which include: Structuring of the decision problem (hierarchy construction); Making pairwise comparison and obtaining judgment matrix; Computing local weight and consistency of the comparisons; Aggregation of local weight.
AHP permits some little irregularity in judgment on the grounds that human is not generally consistence. The proportion scales are obtained from the principal eigenvectors and the consistency file is obtained from the major eigenvalue.
There are several advantages to using the AHP model and one major advantage is that the purchaser has the capacity to get a decent picture of the supplier's execution by utilizing the hierarchy of the criteria and assessing the suppliers (Omkarprasad and Kumar, 2006). Other advantages include stability and flexibility where it is able to makes changes and add to an already existing hierarchy; though AHP could be difficult to implement. Selecting suitable suppliers is the establish-ment of productive acquisition. On the other hand, perceiving suitable suppliers is not a straightforward undertaking. One can contend that it is difficult for any single supplier to exceed expectations in all criteria (Verma and Pullman, 2009). Along this line, establishing objective systems of supplier selection will develop organizations successful procurement process.
Supplier choice procedures have advanced with time as established in literature (Min, 1994; Karande and Chakraborty, 2012); that is, from using cost as the single standard to Multi-Criteria Decision-Making (MCDM), weighted-downright system, network approach, vendor profile analysis (VPA), Analytical hierarchy process (AHP), and multiple objective programming (MOP). Shockingly, most writing on supplier choice is within domestic market and several researchers examined on global supplier choice are minor upgrade from the local strategies with included persuasive criteria.
According to Asamoah et al. (2012), from 2000 to 2011, scientists, in the wake of inspecting sixty articles from different diaries and gatherings, found that the most extensively connected technique in supplier determina-tion was Data Envelopment Analysis (DEA); they recom-mended using AHP to successfully adjust supplier choice issues later on. As said by Vijayvargiya and Dey (2010), instead of recommending a right choice, the AHP helps the decision makers locate the particular case that best suits their needs.

Fashoto et al. 213 Table 1. Brief review of few literatures on supplier selection and assessment.
Author(s) Brief description of research Application Area/ Place of Application
Tool(s)/Approach used
Cheng et al. (2009)
Critical factors for water supplier selection and evaluation were identified and a fuzzy multi-criteria selection model was developed selecting and evaluating water supplier. The critical factors identified were: (1) water quality, (2) delivery time, (3) service, (4) price, (5) process capability, (6) reputation, and (7) past performance
Water supply in semiconductor industry
Fuzzy AHP
Kannan Govindan, Roohollah Khodaverdi, Ahmad Jafarian (2013)
Sustainable supply chain initiatives were explored and the problem of identifying an effective model based on the Triple Bottom Line (TBL) approach was identified. Qualitative performance evaluation was done using triangular fuzzy numbers for finding weights of criteria and then fuzzy TOPSIS (Technique for Order Preference by Similarity to Ideal Solution) for ranking suppliers.
Supply chain management
Fuzzy logic and triple bottom line approach
Hokey (1994)
An analytical approach known as MAUT (Multiple Attribute Utility Theory) was proposed for international supplier selection and it was proved to have strong ability to handle practical size problem. MAUT can effectively handle qualitative and quantitative factors in multiple criteria and uncertain decision environments.
International supplier selection
Multiple Attribute Utility Theory (MAUT)
Ferhan and Demet (2003)
This study proposed an integrated model for supplier selection. Food company
Lexicographic Goal Programming (LGP) and Analytic Hierarchy Process (AHP)
Sloane et al. (2003)
Analytic Hierarchy Process (AHP) was used to carry out a microeconomic Health Technology Assessment (HTA) in order to evaluate critical care neonatal ventilators for a new women’s health facility that appear to be expensive and complex.
Health care sector Analytic Hierarchy Process (AHP)
Lee et al. (2009)
In this research a multi-criteria decision-making (MCDM) model was proposed to select a suitable wind farm project amongst many possible wind farm projects using analytic hierarchy process (AHP) and the critical variables used for assessment were benefits, opportunities, costs and risks (BOCR).
Wind farm Analytic Hierarchy Process (AHP)
Akarte et al. (2001)
The authors designed a decision-support system used to cast supplier evaluation which was linked to a web-based system for casting buyer-supplier interaction. Six objective and twelve subjective variables were used for evaluation and weights were assigned to the variables using AHP methodology
Automobile castings sector
Analytic Hierarchy Process (AHP)
Sonmez (2006)
A critical review of supplier selection process and practices was done and it was revealed that there were emphases on the following: decision criteria and associated weightings that are used for supplier selection and the methods/tools that are proposed for decision making in supplier selection. It was also discovered that though there are more studies are emerging on the study of the effects of buyer-seller relationships, international supplier selection and e-commerce on the supplier selection process and practices but the use of a combination of qualitative and quantitative criteria in supply selection processes should be encouraged. Many of the studies did not consider this.
Supplier selection Structured literature review method
Cheraghi et al. (2011)
This study did critical review on the success factors for supplier selection with the view of establishing significant change in the relative importance of various critical success factors in the research reported during 1966-1990 versus 1990-2001. The study concluded that criteria for supplier selection will be changing based on an expanded definition of excellence to include traditional aspects of performance (that is, quality, delivery, price, service) in addition to non-traditional, evolving ones (that is, Just-in-Time (JIT) communication, process improvement, supply chain management).
Supplier selection Systematic literature review
Punniyamoorthy et al. (2011)
Supplier selection being a multi-criteria decision making problem, thus the authors developed supplier selection model using multidimensional constructs that were both tangible and intangible criteria. They used SEM (Structural Equation Modeling) and fuzzy AHP because the fuzziness of human opinion should be put into consideration.
Supplier selection Structural Equation Modeling and Fuzzy AHP method
Amindoust et al. (2012)
The authors proposed fuzzy inference system (FIS) for supplier selection using sustainable supplier selection criteria and sub-criteria. The linguistic nature of some of the criteria vis-à-vis the subjectivity of the decision makers’ assessments called for the application of fuzzy logic. The FIS was able to evaluate and rank a given set of suppliers.
Supplier selection Fuzzy logic

214 Afr. J. Bus. Manage. Table 1. Contd.
Hsu and Hu (2009)
Supplier selection model was proposed using analytic network process (ANP) which incorporated hazardous substance management (HSM). HSM criteria were classified into four dimensions and the applied ANP was characterized by interdependencies among decision structure components. The proposed system was applied in an electronics company demonstrating the selection of most appropriate supplier in accordance with the requirements of hazardous substance for environmental regulations.
Electronic company Analytical network process (ANP)
Godse and Mulik (2009)
This paper presented an approach that made use of Analytic Hierarchy Process (AHP) technique to prioritize software-as-a-service (SaaS) product features and scoring of the product by experts with the view of selecting the most appropriate SaaS product for their needs.
Software selection Analytical Hierarchy Process (AHP)
Liberatore and Nydick (2008)
This study did a review of past works on the application AHP on medical and health care decision making; thus establishing that AHP is a support tool that aids decision making between patient and doctor, evaluation and selection of therapies and treatments, and the evaluation of health care technologies and policies.
Health care service delivery
AHP
Handfield et al. (2002)
The authors proposed a decision support model using Analytical Hierarchy Process (AHP) to help managers understand the trade-offs between environmental dimensions. They demonstrated the use of AHP to evaluate the relative importance of diverse environmental traits and to assess the relative performance of suppliers along these traits. How AHP could be incorporated into a comprehensive information system that could support Environmentally Conscious Purchasing (ECP) was examined.
Supplier assessment AHP
Ware et al. (2012) This study provided extensive state-of-the-art literature review and critique of the studies related to various aspects of supplier selection problem over the past two decades.
Supplier selection Structured literature review
Rahman and Smith (2000)
A review of location-allocation model in health service development planning in developing countries was carried out in this study with the view of examining the suitability of the models and their relevance to overall development problems in such nations.
Health care service development planning
Structured literature review
Wang et al. (2004)
This study developed an integrated analytic hierarchy process (AHP) and preemptive goal programming (PGP) and takes into account both qualitative and quantitative factors in supplier selection process. Supply chain operations reference (SCOR) model level I performance metrics were adopted as the decision criteria. The model was able to match product characteristics with supplier characteristics and qualitatively determine supply chain strategy; it also determined the optimal order quantity from the chosen suppliers.
Supplier selection AHP and PGP
Büyüközkan et al. (2011)
Factors of service quality were examined in this study and fuzzy AHP was structured to measure the proposed service quality framework. The model was tested in healthcare sector in Turkey with the view of clarifying the methodology.
Healthcare sector Fuzzy AHP
AHP is applied in various areas such as: decision making (Levary and Wan, 1999); forecasting (Korpela and Tuominen, 2001); medicine ((Rossetti and Selandari, 2001); priority and ranking (Labib et al., 1998); evaluation (Akarte et al., 2001).
The following are our deductions from literatures reviewed: 1) A number of models have been developed for supplier selection using diverse methods; 2) There are models developed for evaluating the performance of healthcare service sector but there is little emphasis on suppliers of health service facilities/equipment; 3) to the best of our search, we could not find research works on evaluating and selecting suppliers in the healthcare service of tertiary institution. Hence our focus in this study is to develop a decision support model for evaluating and
selecting suppliers in the healthcare service of tertiary institutions. A review of artificial neural network The knowledge acquired from the study of the structure and functions of the human body system is being used today to build human-like intelligent computing system. Thus the artificial neural network system is built from the concepts of the biological neural system. The artificial neural network technology characterized the sixth generation of computing (Singh and Chauhan, 2005).
An Artificial Neural Networks (ANN) is composed of simple elements operating in parallel. These elements

Fashoto et al. 215
Figure 2. A basic artificial neuron (Negnevitsky, 2002). Inputs = xi and weights = wi;
Summation: ii xwI ; Transfer: Y = f(I).
Figure 3. Multi-layer perception architecture (Xiaoguange et al., 2003)
are inspired by biological nervous systems. As in nature, the connections between elements largely determine the network function. A neural network is trained to perform a particular function by adjusting the values of the connections (weights) between elements. Typically, neural networks are adjusted, or trained, so that a particular input leads to a specific target output (Howard et al., 2008).
In addition ANNs are the electronic models used to analyze data and recognize patterns within the data. ANN is composed of node(s) and each node operates on a principle similar to a biological neuron. In a biological neuron, each incoming synapse of a neuron has a weight associated with it. When the weight of each synapse, times its input, is summed up for all incoming synapses, and that sum is greater than some threshold value, then
the neuron fires, sending a value to another neuron in the network. Also for ANN, each node has a set of input lines which are analogous to input synapses in a biological neuron. Each node also has an activation function (also known as a transfer function) which tells the node when to fire, similar to a biological neuron. In its simplest form, this activation function can just be to generate a '1' if the summed input is greater than some values or a ‘0' otherwise. A basic artificial neuron (single layer percep-tron) is presented in Figure 2. The weights are adjusted systematically based on a given dataset to optimize the output vector produced from a given input vector. A neural network is trained through repeated adjustments of these weights (Negnevitsky, 2002). ANN could also be of multiple layers (Figure 3). This is referred to as multiple layer perceptron.

216 Afr. J. Bus. Manage. Table 2. Initial identification of possible supplier selection criteria.
Criteria Authors
Performance plans, structure production Ozden and Karpak (2005)
Cost, quality, delivery, responsiveness, facility and technology, professionalism, quality of relationship with vendor Huan-Jyh Shyur and Hsu-Shih Shih (2006)
Cost, quality, delivery, supplier profile, Risk Fu and Hongli (2007)
Cost, quality, service, supplier profile, Risk Felix et al. (2007)
Cost, quality, service Weijun Xia and Zhiming Wiu (2007)
Cost, quality, delivery, service, supplier profile, technology and capability Min (2007)
Cost, quality, supplier profile, technology and capability Sanjay and Shankar (2007)
quality, supplier profile, technology and capability Cevriye and Gurpinar (2007)
Cost, quality, delivery, service, supplier profile, technology and capability, mutual trust and easy communication Ezgi and Ozden (2007)
Cost, delivery, technology and capability, collaboration Ali and Zeyrep (2008)
Cost, quality, service Wang et al. (2008)
Reliability, risk Reuven (2008)
Plans and structure, quality, R&D Chia-Wei and Allen (2009)
Cost/price, technology capability, production facilities and capacity, financial capability Keskin et al. (2010)
Supervised learning Supervised learning is based on direct comparison between the actual output of an ANN and the desired correct output, also known as the target output. In supervised learning, a set of example pairs (x, y), x ε X, y ε Y is inputted. The aim is to find a function f in the allowed class of functions that matches the examples (Kumar and Roy, 2010). Unsupervised learning
The unsupervised learning is solely based on the correlations among input data. No information on ―correct output‖ is available for learning. In unsupervised learning with a given input data x, sigmoid function is to be minimized which can be any function of x is related to the network's output, y = f (w, x), where w is the matrix of all weight vectors. This method of learning is adopted in this study (Kumar and Roy, 2010).
Reinforcement learning
The reinforcement learning is a special case of supervised learning where the exact desired output is unknown. It is based only on the information of whether or not the actual output is correct (Fashoto, 2014).
A review of existing supplier selection system in Redeemers University, Nigeria
The existing supplier selection system at the Redeemer‘s University health center has been in use since 2005 when the university as well as the health centre was established.
The healthcare centre makes use of cost as the major
criteria for choosing a supplier whereas there are several other criteria like risk, quality, efficiency, service and delivery.
The use of cost alone as the major criteria for selecting a supplier does not only prove inefficient but also ineffective as seen in the case of healthcare utility delivery. It took several months for the health centre beds and other things several months to arrive from China. Technical solution to the existing problem Having considered the problem of the current system, this research is focused on providing and implementing the solution to the problem. Under this sub-topic, technical details on how to provide solution to the problem will be discussed.
The solution this study provides is how the AHP model can aid decision making on how to select suitable supplier in the healthcare centre considering five (5) criteria and also considering five (5) alternatives rather than just cost which was used in the existing system METHODOLOGY
Initial variables identified from literature
Numerous variables influence a supplier selection execution, some of which include: Cost, Quality, delivery, mutual trust and easy communication, technology and capability, structure production, collaboration, risk, service, responsiveness, supplier profile, reliability, R&D, financial capability, quality relationship with vendors, performance, professionalism and facility and technology and this mostly adds to the supplier selection issue. Presented in Table 2 is the initial identification of supplier selection criteria as established in literature.
Table 2 is a summary of suppliers selection variables/criteria identified from existing literature. These selection variables play a key role in the suppliers‘ selection process.

Study design on ranking of criteria/variables Supplier selection process is a multi-criteria problem, which includes both qualitative and quantitative factors. In order to select the best supplier in the healthcare industry it is necessary to make a trade-off between tangible and intangible factors some of which may conflict.
Traditionally, the selections of suppliers are often based on the cost/price criterion. The cheapest supplier is usually selected without taking into consideration additional costs this supplier may introduce in the value chain of the purchasing organization. Thus, the costs related to unreliable delivery, limited quality of goods supplied, and poor communication are not involved in the selection process.
Supplier decisions are one of the most important aspects that firms must incorporate into their strategic processes. With the increasing importance of the purchasing function, supplier management decisions have become more strategic. As organizations become more dependent on suppliers, the direct and indirect consequences of poor decision making become more critical (Marvin et al., 2003). Selecting the most appropriate suppliers is considered an important strategic management decision that impacts all areas of an organization. Because of this reason, this study describes the extent to which criteria/factors are using as supplier selection criteria in the healthcare industry by using a survey. It presents an exploratory factor analysis that describes which criteria/factors are used by companies as supplier selection criteria.
We carried out a review of some related research works that focused on the selection of suppliers‘ criteria/variables from existing literature. Existing criteria/variables for evaluating supplier selection are cost, quality, delivery, mutual trust and easy communication, technology and capability, structure of production, collaboration, risk, service, responsiveness, supplier profile, reliability, R&D, financial capability, quality relationship with vendors, facility and technology, performance, and professionalism.
The evaluation process requires thorough consideration between all criteria/variables for supplier selection because some criteria are difficult to evaluate since they can only be measured in a qualitative way and not quantitative way. These criteria are more subjective and more people dependent. Examples of quantitative criteria are those that can be measured by a concrete quantitative dimension such as cost. For example the criterion ―cost‖ of the product is easy to measure, it can be obtained directly. Examples of qualitative criteria are the quality of products and services. They cannot be measured directly (Benyoucef et al., 2003).
Some researchers have discovered that the importance of supplier attributes/factors such as quality, cost, delivery, and service are not consistent with their actual choices (Li et al., 2006).
The objective here is to identify some supplier selection criteria/variables that can serve as health organizational variables and also to establish if previous research works relate directly or indirectly to the supplier selection criteria.
At present, there are no existing multi-criteria decision making techniques that help to identify promising criteria/variables for supplier selection that must be considered and evaluated for critical decision factors in tertiary institution healthcare center.
The research methodology applied here starts with the selection of criteria/variables and ends with an AHP model for supplier selection.
The design of the first questionnaire is derived from the issues and questions raised in the literature on how to select the key criteria/variables. Based on these sources 18 criteria used to select suppliers were identified (Table 2).
Respondents were asked to indicate the importance their firms assigned to these supplier selection criterions in the supplier selection process. A five-point Likert scale, which ranged from 1 (Low Importance) to 5 (High Importance), was used to assess
Fashoto et al. 217 importance. The questionnaire was pre-tested for content validity by 10 bulk purchase committees‘ members.
Pretest questionnaire was not used in the subsequent analyses. The revised instrument was sent to healthcare centre management. It was assumed that the committee members (respondents) were familiar with the university health centre supplier management activities and could make reasonable judgments regarding suppliers‘ performances.
Prior to assessing the impact of supplier selection factor analyses were conducted by the help of SPSS 15.0. Factor analysis was carried out to reduce each scale to smaller number of underlying factors. Principal components analysis was used to extract factors (eigen-values > 1.627) and Varimax rotation used to obtain a more interpretable factor matrix. With few exceptions, variables had factor loadings of at least 0.50. The 18 supplier selection criteria were reduced to five underlying factors (Table 3). The five factors (cost, quality, delivery, risk and service) accounted for 84.13 percent of total variance in the data.
Choosing the most outstanding supplier out of numerous suppliers to deliver goods is frequently very difficult, since supplier selection relate to multi-criteria and multi-objective problems (Bayazit and Karpak, 2005). The Analytical Hierarchy Process model was used for the supplier selection problem in healthcare delivery. Both primary and secondary data were used in this study. Interview with the healthcare providers using questionnaire at the University Health Centre make up the primary data while other materials for the study which was sourced from the internet, journals, articles and textbook constitute the secondary data and the JAVA programming language was used for the implementation. The objectives of this study will be achieved through eleven stages using the AHP.
There are eleven stages to the Analytical Hierarchy Process (AHP).
Step 1
Decomposing the problem into a hierarchy
AHP starts with an identification of the criteria to be used in evaluating different alternatives which are organized in a tree-like hierarchy.
How to structure a hierarchy
1) Identify the overall objective or goal. 2) Identify criteria to satisfy the goal. 3) Identify, where appropriate, sub-criteria under each criterion. 4) Identify alternatives to be evaluated in terms of the sub-criteria. 5) If the relative importance of the sub-criteria can be assessed and the alternatives can be evaluated in terms of the sub-criteria, the hierarchy is finished. 6) Otherwise, continue inserting levels until it is possible to link levels and set priorities on the elements at each level in terms of the elements at the level above it.
In the case of this study, the criteria used and their definition are listed in Table 4. The suppliers in the case of this study are the alternatives in Figure 4. These are the different suppliers to be evaluated in order to be selected as the best supplier
Step 2
Designing the questionnaire for the health centre.
Step 3
Collecting input data by pair-wise comparisons of criteria at each

218 Afr. J. Bus. Manage. Table 3. Principal component analysis.
Component Total Initial % of variance Eigenvalues Extraction sums of square loadings
Cumulative % Total % of Variance Cumulative %
1 15.194 84.413 84.413 15.194 84.413 84.413
2 0.757 4.204 88.616
3 0.678 3.769 92.385
4 0.551 3.061 95.446
5 0.326 1.808 97.254
6 0.293 1.627 98.882
7 0.120 0.664 99.546
8 0.049 0.273 99.819
9 0.033 0.181 100.000
10 1.37E-015 7.60E-015 100.000
11 1.04E-015 5.80E-015 100.000
12 2.43E-016 1.35E-015 100.000
13 1.88E-016 1.04E-016 100.000
14 1.61E-016 8.95E-016 100.000
15 8.06E-018 4.48E-017 100.000
16 -7.6E-018 -4.24E-017 100.000
17 -1.3E-016 -7.20E-016 100.000
18 -4.1E-016 -2.29E-015 100.000
Table 4. Criteria definition table.
Criteria Definition
COST Total cost of purchasing products from supplier including freight cost and product price
SERVICE Ability of supplier to respond to change based on health centre demand, provide technical support for problems and warranty of supplied product.
RISK Economic stability of the supplier country (currency exchange rate).
QUALITY How effective and efficient a product is.
DELIVERY Amount of time it takes a supplier to deliver supplies and willingness to expedite an order.
Figure 4. Structure of the hierarchy with goals criterion and alternative.
level of the hierarchy and alternatives. Define the relative importance of criteria at each level of the hierarchy and relative importance of alternatives by means of pair-wise comparisons (Table 5).
Step 4 Estimate the relative importance (weights) of criteria and alternatives and check the consistency in the pair-wise comparisons. This is done using the Saaty Scale for Pair-wise

Fashoto et al. 219 Table 5. Defining criteria at each level of the hierarchy.
Criteria Criterion (Alternative) 1 Criterion (Alternative) 2 … Criterion (Alternative) n
Criterion (Alternative) 1 W1/W1 W1/W2 … W1/Wn
Criterion (Alternative) 2 W2/W1 W2/W2 … W2/Wn
. . . … … … …
Criterion (Alternative) n Wn/W1 Wn/W2 … Wn/Wn
comparisons 1) 1 – Equally preferred 2) 3 – One is moderately preferred over another 3) 5 – One is strongly preferred over another 4) 7 – One is very preferred over another 5) 9 – One is extremely preferred over another 6) 2,4,6,8 intermediate values 7) Reciprocals for inverse comparison Step 5 Calculate the column sum ∑ Cij for each column in the pair-wise comparison table Step 6
Standardize each cell by =
Step 7 Calculate row sum by Ri = ∑ Xi j and weight(Wi )= (R1 +R2 +R3+R4+R5)1/n by using geometric mean formula n = number of Criteria/Sub-criteria or Alternative. Step 8 Calculate the Eigen value and Eigen vector Vi = AWi for i = 1, 2, 3,…, n λ = Vi / Wi and calculate λmax by using the geometric mean formula to find the λi‘s in the table Step 9 Calculate Consistency Index (CI) and Consistency Ratio (C.R)
CI=
CR=
Step 10 Repeat Step-3 to Step- 9 for the other questionnaire and check the consistency ratio for every judgment matrix.
Step 11
Calculate the Geometric mean of each cell of the entire questionnaire for calculating the overall weight for each alternative of each criterion.
Population and sampling technique
Population refers to the entire group of people from whom data can be sourced, investigated and which the researcher can make reference to.
With reference to the scope of this study, the population consists of the healthcare provider in Redeemers University Health Centre.
This includes nurses, doctors, pharmacist, laboratory technicians, medical assistant, store managers, supply officers and store keepers. The stratified sampling method was adopted to choose the respondents and then the respondents were divided into two (2) in order to ensure that each was represented appropriately in the survey sample.
1) Stratum 1 comprises the inventory managers (store managers, store keepers and supply officers). 2) Stratum 2 comprises the healthcare providers (nurses, doctors, pharmacist, Medical Assistants).
The stratified sampling method, which is a type of probability sampling technique was used so as to divide the entire population into different subgroups or strata, then randomly selects the final subjects proportionally from the different strata. This helps to eliminate as many as possible biases in the choice of the sample.
Data collection procedure
In this study, the questionnaire method was adopted. This method enables the collection of large amount of data on the variables considered to be important to the research topic. Furthermore, questionnaire survey afforded respondents the privilege of been anonymous.
The respondents interviewed were selected from Redeemer‘s University Health Centre and simple random was used to select facilities and respondents. To meet the requirement of the research topic, few people were selected for the study. This comprises majorly of the health workers.The purpose of the research was explained to every respondent and they were informed that participation was voluntary and the result would be used for academic purpose and furthermore, respondents were assured that all responses would remain confidential.
Research instrument
The data were collected by means of questionnaire. Questionnaires were used because it is more economical and convenient for the respondent to answer.

220 Afr. J. Bus. Manage.
for final output.
Decision Support Engine
ANN
Processing
Engine
AHP Sub-
Engine
Final result (i.e.
Supplier
selected)
Significant
criteria from
Factor Analysis
Figure 5. Contextual diagram of the decision support system.
Table 6. Analysis of respondents‘ sex.
Sex Frequency %
Male 10 55.6
Female 8 44.4
Total 18 100
Secondly, it encourages the provision of true and honest response on sensitive issues. The questionnaire helped in the collection of information that was not readily available which tend to enrich the answers and these enhance the eventual result of the study.
This was to help in getting good response from the different group of respondents.
DEVELOPMENT AND DATA ANALYSIS TOOLS
The raw data gotten from the use of the questionnaire were captured, presented and analyzed using the analytical hierarchy process (AHP) and artificial neural network (ANN) model. The model was used because it provides better explanation to the data collected concisely.
System architecture
The system architecture for supplier selection using AHP and ANN shown in Figure 5 is such that will receive the significant criteria / factors generated by factor analysis. The significant factors go into the AHP for further processing and the result of AHP weight goes to the ANN for final output.
Algorithm on how a supplier is selected using AHP-ANN model
Step 1: Start AHP module Step 2: List and identify supplier selection criteria. Step 3: List the registered supplier. Step 4: Build the AHP model. Neural network module
Step 5: Create a matrix for hidden layer by using the
following formula:
Main criteria weight: Output value for hidden layer using sigmoid function
=
Step 6: Create a matrix for output layer by using following formula:
Sub-criteria weight: Value for output layer using sigmoid function
=
Ysci = Total score of supplier
Step 7: Select the supplier with maximum score from the above matrix for the best supplier.
Step 8: Stop
Questionnaire analysis
A total number of 20 questionnaires were randomly distributed to respondents at the health centre. These respondents comprise majorly the health workers which include the doctors, nurses, pharmacist, store keeper and so on. 18 out of this questionnaire were duly filled and returned which is what is used for analysis.
PART A – Respondents’ demographic status
Table 6 shows 55.6% representing 10 respondents are males while 44.4% representing 8 respondents are females.

Fashoto et al. 221
Table 7. Analysis of respondents‘ age.
Age No of Respondents Percentage
30-39 12 66.7
40-49 4 22.2
50-59 2 11.1
60 and above 0 0
Total 18 100
Table 8. Analysis of respondents‘ academic qualification.
Academic qualification NO of respondents Percentage
BA/BSC 10 55.6
MBA/MSC 8 44.4
TOTAL 18 100
Table 9. Analysis of research question.
Parameter COST SERVICE RISK QUALITY DELIVERY
COST Equally important Moderately more important Strongly more important Strongly more important Strongly more important
SERVICE Moderately important Equally important Very strongly important Very strongly important Very strongly important
RISK Strongly important More very strongly important Equally important Equally important Equally important
QUALITY Strongly important More very strongly important Equally important Equally important Equally important
DELIVERY Strongly important More very strongly important Equally important Equally important Equally important
Table 10. Pair-wise comparison table obtained from the analysis of our questionnaire.
Criteria Cost Service Risk Quality Delivery
COST 1 1/3 1/5 1/5 1/5
SERVICE 3 1 7 7 7
RISK 5 1/7 1 1 1
QUALITY 5 1/7 1 1 1
DELIVERY 5 1/7 1 1 1
Table 7 shows 66.7% representing 12 respondents are between ages 30-39, 22.2% representing 4 respondents are age 40-49, 11.1% representing 2 respondents are between ages 50-59.
Table 8 shows 55.6% representing 10 respondents are BA/BSc holders while 44.4% representing 8 respondents are MBA/MSc holders.
PART B –Analysis of research question
Research question 1: In your opinion which of the following criteria is of importance over the other in selecting a specific supplier in this healthcare centre (Table 9).
Table 10 is the pair-wise comparison table obtained from the analysis of our questionnaire.
Implementation
To implement the AHP model, we developed a new software, named ExpertplusX. ExpertplusX has a data entry interface for keying in the data obtained from the questionnaire. It consists of modules for executing all the steps of the AHP as outlined under the Methodology, with appropriate command buttons to initiate each step.
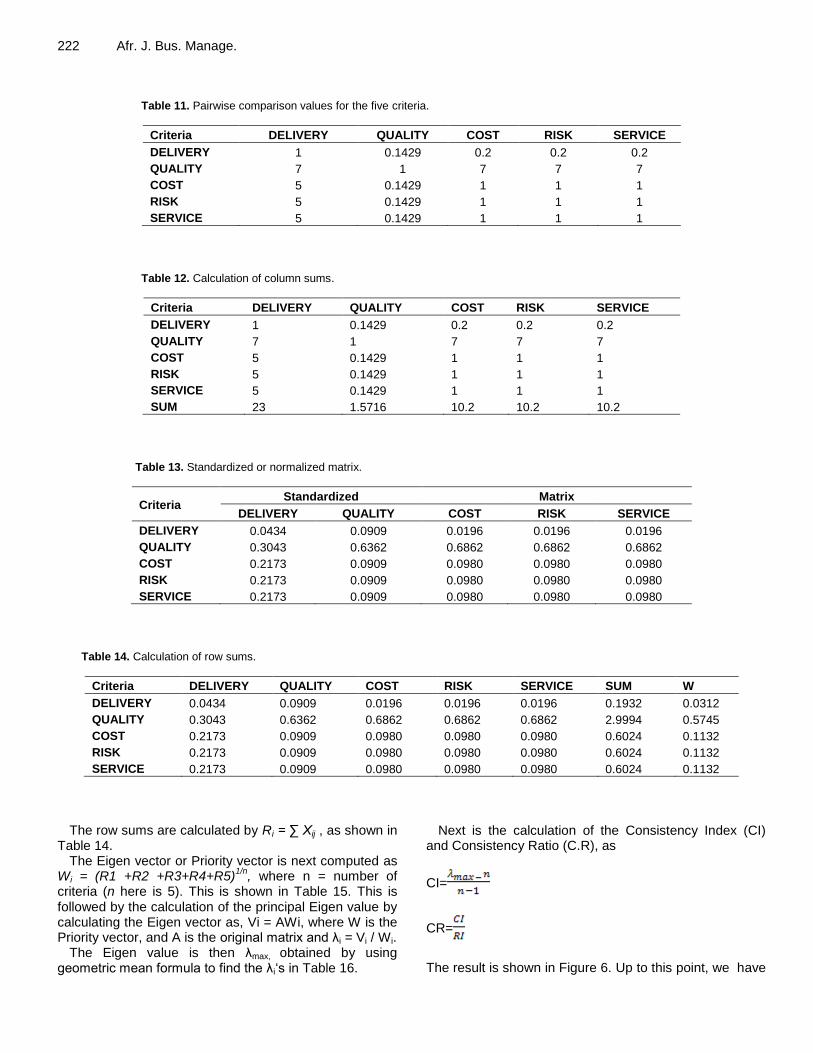
In this section, we walk through the AHP model computations with the data of Section 3, showing screen shots from ExpertplusX. The first step is to enter the pairwise comparison table and initiate the first set of computations. This is shown in Table 11.
This first step yields the column sum ∑Cij for each column in the table as shown in Table 12. The values in
the table are then standardized by = as shown in
Table 13.
222 Afr. J. Bus. Manage.
Table 11. Pairwise comparison values for the five criteria.
Criteria DELIVERY QUALITY COST RISK SERVICE
DELIVERY 1 0.1429 0.2 0.2 0.2
QUALITY 7 1 7 7 7
COST 5 0.1429 1 1 1
RISK 5 0.1429 1 1 1
SERVICE 5 0.1429 1 1 1
Table 12. Calculation of column sums.
Criteria DELIVERY QUALITY COST RISK SERVICE
DELIVERY 1 0.1429 0.2 0.2 0.2
QUALITY 7 1 7 7 7
COST 5 0.1429 1 1 1
RISK 5 0.1429 1 1 1
SERVICE 5 0.1429 1 1 1
SUM 23 1.5716 10.2 10.2 10.2
Table 13. Standardized or normalized matrix.
Criteria Standardized Matrix
DELIVERY QUALITY COST RISK SERVICE
DELIVERY 0.0434 0.0909 0.0196 0.0196 0.0196
QUALITY 0.3043 0.6362 0.6862 0.6862 0.6862
COST 0.2173 0.0909 0.0980 0.0980 0.0980
RISK 0.2173 0.0909 0.0980 0.0980 0.0980
SERVICE 0.2173 0.0909 0.0980 0.0980 0.0980
Table 14. Calculation of row sums.
Criteria DELIVERY QUALITY COST RISK SERVICE SUM W
DELIVERY 0.0434 0.0909 0.0196 0.0196 0.0196 0.1932 0.0312
QUALITY 0.3043 0.6362 0.6862 0.6862 0.6862 2.9994 0.5745
COST 0.2173 0.0909 0.0980 0.0980 0.0980 0.6024 0.1132
RISK 0.2173 0.0909 0.0980 0.0980 0.0980 0.6024 0.1132
SERVICE 0.2173 0.0909 0.0980 0.0980 0.0980 0.6024 0.1132
The row sums are calculated by Ri = ∑ Xij , as shown in Table 14.
The Eigen vector or Priority vector is next computed as Wi = (R1 +R2 +R3+R4+R5)
1/n, where n = number of
criteria (n here is 5). This is shown in Table 15. This is followed by the calculation of the principal Eigen value by calculating the Eigen vector as, Vi = AWi, where W is the Priority vector, and A is the original matrix and λi = Vi / Wi.
The Eigen value is then λmax, obtained by using geometric mean formula to find the λi‗s in Table 16.
Next is the calculation of the Consistency Index (CI) and Consistency Ratio (C.R), as
CI=
CR=
The result is shown in Figure 6. Up to this point, we have

Fashoto et al. 223
Table 15. Calculation of priority vector.
Criteria DELIVERY QUALITY COST RISK SERVICE W P.VECTOR
DELIVERY 1 0.1429 0.2 0.2 0.2 0.0312 0.1812
QUALITY 7 1 7 7 7 0.5745 3.1714
COST 5 0.1429 1 1 1 0.1132 0.5780
RISK 5 0.1429 1 1 1 0.1132 0.5780
SERVICE 5 0.1429 1 1 1 0.1132 0.5780
SUM 23 1.5716 10.2 10.2 10.2 0.9455 5.0870
Table 16. Calculating the principal Eigen value.
Criteria DELIVERY QUALITY COST RISK SERVICE W P.VECTOR LAMDA MAX
DELIVERY 1 0.1429 0.2 0.2 0.2 0.0312 0.181 5.801 5.319
QUALITY 7 1 7 7 7 0.5745 3.171 5.520
COST 5 0.1429 1 1 1 0.1132 0.578 5.104
RISK 5 0.1429 1 1 1 0.1132 0.578 5.104
SERVICE 5 0.1429 1 1 1 0.1132 0.578 5.104
SUM 23 1.5716 10.2 10.2 10.2 0.9455 4.508
Figure 6. Output for CI and CR.
Table 17. Pairwise supplier comparison table for Delivery.
DELIVERY SUPPLIER1 SUPPLIER2 SUPPLIER3 SUPPLIER4 SUPPLIER5
SUPPLIER1 1 1 3 3 5
SUPPLIER2 1 1 3 3 5
SUPPLIER3 0.33 0.33 1 1 2
SUPPLIER4 0.33 0.33 1 1 2
SUPPLIER5 0.2 0.2 0.5 0.5 1
used the pairwise comparison table, with values for the relative importance of each criterion to the others in the supplier selection process. When the CR ≤ 0.1 it is assumed that the judgmental values of the respondent are consistent.
This pairwise comparison will now be done between suppliers for each of the criteria. Thus, we build five tables, one for each criterion. In this way, we weigh the way each supplier compares with the others for each criterion.
The supplier comparison table for delivery is shown in Table 17.
Steps leading to obtainment of the five criteria (Delivery, Quality, Cost, Risk and Service)
We followed the same steps as previously done to arrive
at the Priority Vector for the five criteria (Cost, Delivery, service, Quality and Risk) table, shown in Tables 18 and 19.
Same is also done for the other 4 criteria, viz; Quality as expressed in Tables 20 and 21; Cost as expressed in Tables 22 and 23; Risk as expressed in Tables 24 and 25; and Service as expressed in Tables 26 and 27.
Overall priority matrix of the alternatives
The last stage in the AHP modeling process is the derivation of the overall priority matrix for the criteria versus suppliers. The rows of the matrix are labelled with the criteria while the columns are labelled by the Suppliers. We, thus, have a 5x5 matrix as shown in Tables 28 to 30.

224 Afr. J. Bus. Manage. Table 18. Priority table for Delivery.
DELIVERY SUPPLIER1 SUPPLIER2 SUPPLIER3 SUPPLIER4 SUPPLIER5 SUM PRIORITY
SUPPLIER1 0.1176 0.3496 0.3529 0.3529 0.3333 1.5065 0.3013
SUPPLIER2 0.3496 0.3496 0.3529 0.3529 0.3333 1.7385 0.3477
SUPPLIER3 0.1153 0.1153 0.1176 0.1176 0.1333 0.5993 0.1198
SUPPLIER4 0.1153 0.1153 0.1176 0.1176 0.1333 0.5993 0.1198
SUPPLIER5 0.0699 0.0699 0.0588 0.0588 0.0666 0.3241 0.0648
Table 19. Pairwise comparison table for Quality.
QUALITY SUPPLIER1 SUPPLIER2 SUPPLIER3 SUPPLIER4 SUPPLIER5
SUPPLIER1 1 0.33 1 0.33 0.33
SUPPLIER2 3 1 3 1 1
SUPPLIER3 1 0.33 1 0.33 0.33
SUPPLIER4 0.33 1 0.33 1 1
SUPPLIER5 0.33 1 0.33 1 1
Table 20. Priority table for Quality.
QUALITY SUPPLIER1 SUPPLIER2 SUPPLIER3 SUPPLIER4 SUPPLIER5 SUM PRIORITY
SUPPLIER1 0.1766 0.0901 0.1766 0.0901 0.0901 0.6238 0.1247
SUPPLIER2 0.5300 0.2732 0.5300 0.2732 0.2732 1.8797 0.3759
SUPPLIER3 0.1766 0.0901 0.1766 0.0901 0.0901 0.6238 0.1247
SUPPLIER4 0.0583 0.2732 0.0583 0.2732 0.2732 0.9362 0.1872
SUPPLIER5 0.0583 0.2732 0.583 0.2732 0.2732 0.9362 0.1872
Table 21. Pairwise comparison table for Cost.
COST SUPPLIER1 SUPPLIER2 SUPPLIER3 SUPPLIER4 SUPPLIER5
SUPPLIER1 1 3 1 5 5 SUPPLIER2 0.33 1 0.33 2 2
SUPPLIER3 1 3 1 5 5 SUPPLIER4 0.2 0.5 0.2 1 1
SUPPLIER5 0.2 0.5 0.2 1 1
Table 22. Priority table for Cost.
COST SUPPLIER1 SUPPLIER2 SUPPLIER3 SUPPLIER4 SUPPLIER5 SUM PRIORITY
SUPPLIER1 0.3663 0.375 0.3663 0.3571 0.3571 1.8218 0.3643
SUPPLIER2 0.1208 0.125 0.1208 0.1428 0.1428 0.6524 0.1304
SUPPLIER3 0.3663 0.375 0.3663 0.3571 0.3571 1.8218 0.3643
SUPPLIER4 0.0732 0.0625 0.0732 0.0714 0.0714 0.3518 0.0703
SUPPLIER5 0.0732 0.0625 0.0732 0.0714 0.0714 0.3518 0.0703
Table 23. Pairwise comparison table for Risk.
RISK SUPPLIER1 SUPPLIER2 SUPPLIER3 SUPPLIER4 SUPPLIER5
SUPPLIER1 1 5 1 5 5
SUPPLIER2 0.2 1 0.2 1 1 SUPPLIER3 1 0.2 1 0.2 0.2
SUPPLIER4 0.2 1 0.2 1 1 SUPPLIER5 0.2 1 0.2 1 1

Fashoto et al. 225
Table 24. Priority table for Risk.
RISK SUPPLIER1 SUPPLIER2 SUPPLIER3 SUPPLIER4 SUPPLIER5 SUM PRIORITY
SUPPLIER1 0.3846 0.6097 0.3846 0.6097 0.6097 2.5984 0.5196
SUPPLIER2 0.0769 1219 0.0769 1219 1219 0.5196 0.1039
SUPPLIER3 0.3846 0.0243 0.3846 0.0243 0.0243 0.8424 0.1684
SUPPLIER4 0.0769 0.1219 0.0769 0.1219 0.1219 0.5196 0.1039
SUPPLIER5 0.0769 0.1219 0.0769 0.1219 0.1219 0.5196 0.1039
Table 25. Pair-wise comparison table for Service.
SERVICE SUPPLIER1 SUPPLIER2 SUPPLIER3 SUPPLIER4 SUPPLIER5
SUPPLIER1 1 2 2 0.33 1
SUPPLIER2 0.5 1 1 0.2 0.5
SUPPLIER3 0.5 1 1 0.2 0.5
SUPPLIER4 3 5 5 1 3
SUPPLIER5 1 2 2 0.33 1
Table 26. Priority table for Service.
SERVICE SUPPLIER1 SUPPLIER2 SUPPLIER3 SUPPLIER4 SUPPLIER5 SUM PRIORITY
SUPPLIER1 0.0909 0.1818 0.1818 0.1601 0.1666 0.7814 0.1562
SUPPLIER2 0.0833 0.0909 0.0909 0.0970 0.0833 0.4455 0.0891
SUPPLIER3 0.0833 0.0909 0.0909 0.0970 0.0833 0.4455 0.0891
SUPPLIER4 0.5 0.4545 0.4545 0.4854 0.5 2.3945 0.4789
SUPPLIER5 0.1666 0.1818 0.1818 0.1601 0.1666 0.8571 0.1714
Table 27. Overall priority matrix
Priority matrix SUPPLIER1 SUPPLIER2 SUPPLIER3 SUPPLIER4 SUPPLIER5
SUPPLIER1 0.30130 0.34770 0.11980 0.11980 0.06480
SUPPLIER2 0.12470 0.37590 0.18720 0.18720 0.18720
SUPPLIER3 0.36430 0.13040 0.07030 0.07030 0.07030
SUPPLIER4 0.51960 0.10390 0.10390 0.10390 0.10390
SUPPLIER5 0.15620 0.08910 0.47890 0.47890 0.17140
Table 28. Overall Priority Matrix with column sums (OPV)
Priority Matrix SUPPLIER1 SUPPLIER2 SUPPLIER3 SUPPLIER4 SUPPLIER5
DELIVERY 0.3013 0.3477 0.1198 0.1198 0.0648
QUALITY 0.1247 0.3759 0.1247 0.1872 0.1872
COST 0.3643 0.1304 0.3643 0.0703 0.0703
RISK 0.5196 0.1039 0.1684 0.1039 0.1039
SERVICE 0.1562 0.0891 0.0891 0.4789 0.1714
OPV 1.4661 1.047 0.8663 0.9601 0.5976
The values in the table are obtained from the Priority vectors, each row being filled by the values from the Priority vector for the corresponding criterion. Thus, row 1
is filled by the Priority vector, row 2 by the Priority Vector, and so on. The solution for the AHP supplier selection model studied in this work is given by the

226 Afr. J. Bus. Manage. Table 29. Overall Priority Matrix with the Overall Priority Vector (OPV) shown
Priority Matrix SUPPLIER1 SUPPLIER2 SUPPLIER3 SUPPLIER4 SUPPLIER5 SUM PRIORITY
DELIVERY 0.3478 0.3320 0.1382 0.1247 0.1084 1.0513 0.2102
QUALITY 0.0850 0.3590 0.1439 0.1949 0.3132 1.0962 0.2192
COST 0.2484 0.1245 0.4205 0.0732 0.1176 0.9844 0.1968
RISK 0.3544 0.0992 0.1943 0.1082 0.1738 0.9301 0.1860
SERVICE 0.1065 0.0851 0.1028 0.4988 0.2868 1.0801 0.2160
Table 30. Output values for hidden layer
Main criteria Weight(Wmci) Input value(Xi)
Output value for hidden layer (Ymci)
Delivery 0.0312 0.2 0.2312 0.5575
Quality 0.5745 0.2 0.7745 0.6845
Cost 0.1132 0.2 0.3132 0.5777
Risk 0.1132 0.2 0.3132 0.5777
Service 0.1132 0.2 0.3132 0.5777
Table 31. Data analysis model.
Main criteria AHP AHP-ANN
Delivery 0.2102 0.5575
Quality 0.2192 0.6845
Cost 0.1968 0.5777
Risk 0.1860 0.5777
Service 0.2160 0.5777
Overall Priority Vector. According to the OPV, the priority values for the respective criteria are: Quality = 0.2192, Service = 0.2160, Delivery = 0.2102, Cost = 0.1968 and Risk = 0.1860. According to the model, therefore, this is the order of priority ascribed to these criteria by the client, which in this case in Redeemer's University. This means that the quality of product/goods supply by the supplier is the most important criterion, while the risk of the supplies is the least important. Given that the case study in the work relates to supplier selection for the University's Health Centre, we may infer that the current selection process is deficient.
After careful analysis of the questionnaire and with respect to the overall priority matrix of the alternatives, we come to a conclusion that QUALITY is the major criteria for selecting a suitable supplier instead of cost which was believed to be the major criteria. Their order of importance is: QUALITY…SERVICE…...DELIVERY…..COST…..RISK
AHP and ANN module The input values for all neurons in this study are the
same because each of the criteria is considered to be of equal importance diagonally on the AHP matrix and it depends on the number of suppliers. The bias accounts only for the degree of fitting the given data, but not for the level of generalization. A bias term can be treated as a connection weight from a special unit with a constant, nonzero activation value. The term "bias" is usually used with respect to a "bias unit" with a constant value of one (Kumar and Roy, 2010).
Let input value Xi for input layer = the reciprocal of the number of suppliers considered in this study= 1/5=0.2
Wmci = weight of main criteria Wsci = weight of sub-criteria Ymci = output value for hidden layer = input value for output layer
Ymci =
Ysi = output value for output layer on suppliers From Table 31, we are able to determine that quality is the most important of all the main criteria but delivery is the least important based on the hybridized model while

Fashoto et al. 227
Table 32. Matrix for output layer
Supplier Ymc1=
0.5575
Ymc2=
0.6845
Ymc3=
0.5777
Ymc4=
0.5777
Ymc5=
0.5777 Ysci
Supplier1 0.30130 0.34770 0.11980 0.11980 0.06480 0.781827 0.68607
Supplier2 0.12470 0.37590 0.12470 0.18720 0.18720 0.815154 0.69321
Supplier3 0.36430 0.13040 0.36430 0.07030 0.07030 0.747486 0.67863
Supplier4 0.51960 0.10390 0.16840 0.10390 0.10390 0.778127 0.68528
Supplier5 0.15620 0.08910 0.08910 0.47890 0.17140 0.77522 0.68465
quality is the most important and risk is the least important in the AHP model.
The hybrid AHP-ANN approach also supplies us information on the ranking of the suppliers. Based on the overall criteria as shown in Table 32, Supplier 2 is the best supplier to be selected, followed by supplier 1, supplier 4, supplier 5 and supplier 3 in that order. By comparing the results of AHP-ANN supplier selection with the weights from AHP model, it can be concluded that AHP-ANN model prediction accuracy is higher than that of the AHP model.
The accuracy of the hybridized model (AHP-ANN) result is better than that of the AHP model in all cases especially for Quality with 68.45% while that of AHP model is 21.92%. This makes the case for the decisions much stronger than with only AHP. Conclusion
In this study, we have used the AHP methodology and a hybrid AHP-ANN approach to model the supplier selection process for the Health Centre of Redeemer‘s University, Nigeria. Up till now no systematic study of the supplier selection had been carried out and the centre has been suffering from regular stock outs of essential supplies.
The five supplier selection criteria (service, delivery, cost, risk, and quality) used in the model were selected after careful study of the literature and a study of the applicability and relative importance of the 18 most commonly used criteria. A questionnaire was prepared and administered on the members of the University Health Centre Purchasing Committee to indicate the importance of each of these 18 criteria on the Likert scale. The responses were subjected to Factor Analysis and Principal Component Analysis with SPSS 15 to extract the most important criteria for the AHP model; hence, the five criteria that were eventually employed.
Having settled for the 5 most relevant criteria, another questionnaire was designed and administered on a cross section of health care workers at the Redeemers University Health centre. They include Nurses, Doctors, Pharmacist, Laboratory Technicians, Medical Assistants, Store Managers, Supply Officers and Store keepers.
They were required to rate the relative importance of each supplier selection criterion to the others using the Saaty scale. The outcome was a 5x5 pairwise comparison table for the five criteria. This matrix was fed into Expert plusX, a new software we developed to implement the AHP methodology as described in Section 3.
By studying the supplier selection method currently in use at the Health Centre and building the AHP model, we have been able to determine that the order of importance of the 5 five criteria are: service, delivery, cost, risk and quality. This finding shows that quality and service are the two most important criteria that the supplier selectors should be applying for customer selection, they should put very little premium on cost and risk. Delivery has played a fairly neutral place in the selection process.
To improve on the accuracy of these results, the AHP model was supplemented by a 3-layer artificial neural network, adding a learning component to the model. The result also shows that Quality is the most important criterion, but with a high index of 0.6845 as opposed to 0.2192 for the AHP alone. This shows that the hybrid model is much better than the AHP alone. The hybrid model also suggested a ranking of the suppliers. It, thus, provides an improved basis for decision-making when compared to the AHP model. Conflict of Interests
The author has not declared any conflicts of interest. REFERENCES
Akarte MM, Surendra NV, Ravi B, Rangaraj N (2001). Web based
casting supplier evaluation using analytical hierarchy process. J. Oper. Res. Soc. 52(5):511-522
Al-Barqawi H, Zayed T (2008). Infrastructure Management: Integrated AHP/ANN Model to Evaluate Municipal Water Mains‘ Performance. J. Infrastruct. Syst. 14(4):305-317
Amindoust A, Ahmed S, Saghafinia A, Bahreininejad A (2012). Sustainable supplier selection: A ranking model based on fuzzy inference system. Appl. Soft Co. 12(6):1668-1677.
Asamoah D, Annan J, Nyarko S (2012). AHP approach for supplier evaluation and selection in a pharmaceutical manufacturing firm in Ghana. Int. J. Bus. Manage. 7(10):49-62.
Bakar A, Lukman HAH, Chong SC, Lin B (2010). Measuring supply

228 Afr. J. Bus. Manage.
chain performance among public hospital laboratories. Int. J. Prod. Perform. Manage. 59(1):75-97.
Baltussen R, Niessen L (2006). Priority setting of health interventions: the need for multi- criteria decision analysis. Cost Eff. Resour. Allocation 4:14
Bayazit O, Karpak B (2005). An AHP application in vendor selection. ISAHP, Honolulu, Hawaii, July 8-10, pp. 1-24.
Benyoucef L, Ding,H, Xie X (2003). Supplier Selection Problem : Selection Criteria and Methods. [Research Report] RR-4726, INRIA. 2003, P 38.
Berry LL, Bendapudi N (2007). Health care a fertile field for service research. J. Serv. Res. 10(2):111–122.
Bradley D, Solutions CC (2007). Canada-Sustainable Forest Biomass Supply Chains. Ottawa, ON: Climate Change Solutions. Available @ http://w.bioenergytrade.org/downloads/sustainableforestsupplychainsoct192007.pdf. Access date: September 15, 2015
Büyüközkan G, Çifçi G, Güleryüz S (2011). Strategic analysis of healthcare service quality using fuzzy AHP methodology. Expert Syst. Appl. 38(8):9407-9424.
Chan FTS, Chan HK (2004). Development of the supplier selection model - A case study in the advanced technology industry. Proceeding of the Institution of Mechanical Engineers part B- J. Eng. Manuf. 21(12):1807-1824.
Chen IJ, Paulraj A (2004). ‗Towards a theory of supply chain management: The constructs and measurements‘. J. Oper. Manage. 22(2):119-150.
Cheng Ch, Kuo-Lung Y, Chia-Lung H (2009). Evaluating attack helicopters by AHP based on linguistic variable weight. Eur. J. Oper. Res. 116(2):423–435.
Cheraghi SH, Dadashzadeh M, Subramanian M (2011). Critical success factors for supplier selection: an update. J. Appl. Bus. Res. 20(2):91-108.
Christopher M (1994). Logistics and Supply Chain Management. Richard D. Irwin, Inc. Financial Times NY.
Cooper MC, Douglas ML, Janus DP (1997). Supply Chain management: More Than a New Name for Logistics. Int. J. Logist. Manage. 8(1):1-14
Drake PR (1998). Using the Analytic Hierarchy Process in Engineering Education, Int. J. Eng. Edu. 14:3.
Fashoto SG (2014). A Hybrid Approach to Fraud Detection in Health Insurance Based on Improved K-means Clustering and Multilayer Perceptron. Ph.D thesis, University of Ilorin Nigeria, 2014
Ferhan Ç, Demet B (2003). An integrated approach for supplier selection." Log. Inform. Manage. 16(6):395 -400
Ghodsypour SH, O‘Brien C (1998). A decision support for supplier selection using an integrated analytic hierarchical process and linear programming. Int. J. Prod. Econ. 56-57:199-212.
Godse M, Mulik S (2009). An approach for selecting software-as-a-service (SaaS) product. Cloud Computing, 2009. CLOUD'09. IEEE International Conference on Cloud Computing. 155-158. Available @http://dspace.library.iitb.ac.in/jspui/bitstream/100/2447/2/An%20approach%20for%20selecting%20%20(SaaS).pdf, Accessed date: September 25, 2015.
Govindan K, Khodaverdi R, Jafarian A (2013). A fuzzy multi criteria approach for measuring sustainability performance of a supplier based on triple bottom line approach. J. Cleaner Prod. 47:345-354.
Handfield R, Walton SV, Sroufe R, Melnyk SA (2002). Applying environmental criteria to supplier assessment: A study in the application of the Analytical Hierarchy Process. Eur. J. Oper. Res. 141(1):70-87.
Heizer J, Render B (2001). Operations Management. 6th Edn. Prentice-Hall, Englewood Cliffs, NJ.
Hokey M (1994). International Supplier Selection: A Multi-attribute Utility Approach. Int. J. Phys. Distrib. Log. Manage. 24(5):24-33.
Howard D, Mark B, Matin H (2008): ―Neural Network ToolboxTM 6 User‘s Guide‖. The MathWorks, Inc. 3 Apple Hill Drive Natick, MA 01760-2098.
Hsu C, Hu AH (2009). Applying hazardous substance management to supplier selection using analytic network process. J. Cleaner Prod. 17(2):255-264.
Hsu CW, Kuo TC, Chen SH, Hu AH (2013). Using DEMATEL to develop a carbon management model of supplier selection in green
supply chain management. J. Cleaner Prod. 56:164-172. Jones TC, Riley DW (1985). Using inventory for competitive advantage
through supply chain management. Int. J. Phys. Distrib. Mater. Manage. 5(5):16-26
Kahraman C, Cebeci U, Ulukan Z (2003). Multi-criteria supplier selection using fuzzy AHP. Log. Inform. Manage. 16(6):382-394.
Karande P, Chakraborty S (2012) Decision making for supplier selection using MOORA method. IUP J. Oper. Manage. XI(2):6-18.
Keskin GA, Ilhan S, Özkan C (2010). ―The Fuzzy ART Algorithm: A Categorization Method For Supplier Evaluation And Selection.‖ Expert Syst. Appl. 37(2):1235–1240.
Korpela J, Lehmusvaara A, Tuominen M (2001). Customer service based design of the supply chain. Int. J. Prod. Econ. 69(2):193-204
Kumar J, Roy N (2010). A Hybrid Method for Vendor Selection using Neural Network. Int. J. Comput. Appl. 11(12):35-40.
Labib A, Williams G, O'Connor R (1998). An Intelligent Maintenance Model: An Application of the AHP and a Fuzzy Logic Rule-Based Controller. JORM, 49 (7):745 -757.
Lee AH, Chen HH, Kang H (2009). Multi-criteria decision making on strategic selection of wind farms. Renew. Energy 34(1):120-126.
Lee AK, Mogi G, Li Z, Hui KS, Lee SK, Hui KN, Park SY, Ha YJ, Kim JW (2011). Measuring the relative efficiency of hydrogen energy technologies for implementing the hydrogen economy: An integrated fuzzy AHP/DEA approach. Int. J. Hydrogen Energ. 36(20):12655-12663.
Levary RR, Wan K (1999). An analytic hierarchy process based simulation model for entry mode decision regarding foreign direct investment. Omega 27(6):661-677.
Liberatore MJ, Nydick RL (2008). The analytic hierarchy process in medical and health care decision making: A literature review. Eur. J. Oper. Res. 189(1):194-207.
Min H (1994). International supplier selection: A multi-attribute utility approach. Int. J. Phys. Distrib. Log. Manage. 24(5):24-33.
Negnevitsky M (2002). ―Artificial Intelligence – A Guide to Intelligent Systems‖. First Edition, Addison-Wesley, England.
Omkarprasad SV, Kumar S (2006).Analytic hierarchy process: An overview of application. EJOR 169:1-29
Punniyamoorthy M, Mathiyalagan P, Parthiban P (2011). A strategic model using structural equation modeling and fuzzy logic in supplier selection. Expert Syst. Appl. 38(1):458-474.
Rahman S, Smith DK (2000). Use of location-allocation models in health service development planning in developing nations. Eur. J. Oper. Res. 123(3):437-452.
Rossetti MD, Selandari F (2001). Multi-objective analysis of hospital delivery systems. Comput. Ind. Eng. 41(3):309–333.
Saaty TL (1996). Decision Making with Dependence and Feedback: The Analytic Network Process. RWS Publications, Pittsburgh, PA.
Sarkis J, Sundarraj RP (2006). Evaluation of Enterprise Information Technologies: A Decision Model for High-Level Consideration of Strategic and Operational Issues. IEEE Trans. Syst. Man Cybernet.—Part C (Appl. Rev.) 36(2):260-273.
Simunovis K, Simunovis G, Saric T (2009). Application of Artificial Neural Networks to Multiple Criteria Inventory Classification. Strojarstvo 51(4):313-321.
Sloane EB, Liberatore MJ, Nydick RL, Luo W, Chung QB (2003). Using the analytic hierarchy process as a clinical engineering tool to facilitate an iterative, multidisciplinary, microeconomic health technology assessment. Comput. Oper. Res. 30(10):1447-1465.
Sonmez M (2006). A review and critique of supplier selection pro-cess and practices. Occasional Paper, 2006:1. Loughborough: Business School, Loughborough.
Styles D, Schoenberger H, Galvez-Martos JL (2012). Environmental improvement of product supply chains: A review of European retailers‘ performance. Resour. Conserv. Recycl. 65:57-78.
Van der Rhee B, Verma R, Plaschka G (2009). Understanding trade-offs in the supplier selection process: The role of flexibility, delivery, and value-added services/support[Electronic version]. Retrieved [September 13, 2015], from Cornell University, School of Hotel Administration site: http://scholarship.sha.cornell.edu/articles/518/
Verma R, Pullman ME (1998). An analysis of the supplier selection process. Omega 26(6):739-750.
Vijayvargiya A , Dey AK (2010). An analytical approach for selection of

a logistics Provider. Manage. Decis. 48(3):403-418. Walters D, Rainbird M (2007). Strategic operations management: A
value chain approach. Palgrave Macmillan, Basingstoke. Wang G, Huang SH, Dismukes JP (2004). Product-driven supply chain
selection using integrated multi-criteria decision-making methodology. Int. J. Prod. Econ. 91(1):1-15.
Fashoto et al. 229 Ware N, Sing S, Banwet D (2012). Supplier selection problem: A state-
of-the-art review. Manage. Sci. Lett. 2(5):1465-1490.

230 Afr. J. Bus. Manage. QUESTIONNAIRE FOR HEALTHCARE PROVIDERS AT THE REDEEMER’S UNIVERSITY HEALTH CENTER INTRODUCTION I am a Computer Science Lecturer of Redeemer‘s university, conducting a research on supplier selection process, and its role in healthcare delivery. You have been identified as someone who can assist by responding to the questionnaire intended for this research. I wish to assure you of utmost confidentiality of any information you may provide and also that your responses are only for the purposes of this research, Thank you. BACKGROUND INFORMATION 1. Sex a) Male b) Female 2. Age group a) 30 – 39 b) 40 – 49 c) 50 – 59 d) 60 and above 3. Marital Status a) Never married b) Married c) Divorced d) Separated e) Widowed 4. Position in organization ……………………………………………………………. 5. What is your academic qualification? a) ‗A‘/ ‗O‘/ SSS level b) HND c) BA/BSc d) MBA/MSc e) Others (specify) ……………………… 6. How would you describe your role in the health centre? a) Prescriber b) User c) Supervisor d) Others (specify) …………………….. 7. How many years have you been working in this health centre? a) < 1 b) 1 – 3 c) 4 – 6 d) > 6 8. Have you ever received any training in healthcare delivery? a) Yes b) No 9. How is the selection of health supplies done in your facility? a) Essential Medicines b) Non Medicines list c) Based on services provided d) Others (specify) …………………… 10. Do you establish Maximum, Minimum, and Re-order levels for the health supplies? a) Yes b) No 11. If yes to question 10, how often do you update these levels? a) Daily b) Weekly c) Monthly d) Quarterly e) Bi-annually 12. If No to question 10, how do you control your stock levels? ……………………………………………………………….. 13. Are there separate records for all health supplies? a) Yes b) No 14. How do you determine the quantity of health supplies needed? a) Past Consumption b) Requests from Users c) Availability of Funds d) Others (specify) ………………………………………………… 15. How often is the quantity of health supplies needed requested? a) Daily b) Weekly c) Bi-weekly d) Monthly e) As the need arises 16. From where does your Unit receive its health supplies? Specify …………….......................... 17. How long does it take your unit to receive supplies once a request has been placed? a) Within a day b) 2 to 4 days c) 5 to 7 days d) 8 to 14 days e) After 14 days 18. Have you ever experience a situation where you run short of supplies needed, whilst rendering service? a) Yes b) No 19. If yes to question 18, how did you deal with the situation? ..................................……………………………………… 20. How do you request for the health supplies for your Unit? …………………………………………………………………… 21. What do you do if your requested quantities are not met? ..................................................................................... 22. How do the supplies get to the unit? .................................................................................................................... 23. Who determines the quantity of supplies to be requested? ………………………………………………………………….. AHP Questionnaire (1) Equally important (2) moderately important (3) strongly important (4) very strongly important (5) extremely important. You can add any scale between 1 and 9.

Fashoto et al. 231 Which of the criteria is more important over the other in terms of healthcare delivery? Please rate your response based on the scale above.
Criteria COST SERVICE RISK QUALITY DELIVERY
COST
SERVICE
RISK
QUALITY
DELIVERY
Select the degree of relative preference of each alternative relative to the criteria using the scale above.
COST SUPPLIER 1 SUPPLIER 2 SUPPLIER 3 SUPPLIER 4 SUPPLIER 5
SUPPLIER 1
SUPPLIER 2
SUPPLIER 3
SUPPLIER 4
SUPPLIER 5
SERVICE SUPPLIER 1 SUPPLIER 2 SUPPLIER 3 SUPPLIER 4 SUPPLIER 5
SUPPLIER 1
SUPPLIER 2
SUPPLIER 3
SUPPLIER 4
SUPPLIER 5
RISK SUPPLIER 1 SUPPLIER 2 SUPPLIER 3 SUPPLIER 4 SUPPLIER 5
SUPPLIER 1
SUPPLIER 2
SUPPLIER 3
SUPPLIER 4
SUPPLIER 5
QUALITY SUPPLIER 1 SUPPLIER 2 SUPPLIER 3 SUPPLIER 4 SUPPLIER 5
SUPPLIER 1
SUPPLIER 2
SUPPLIER 3
SUPPLIER 4
SUPPLIER 5
DELIVERY SUPPLIER 1 SUPPLIER 2 SUPPLIER 3 SUPPLIER 4 SUPPLIER 5
SUPPLIER 1
SUPPLIER 2
SUPPLIER 3
SUPPLIER 4
SUPPLIER 5

232 Afr. J. Bus. Manage. Names of suppliers
NO NAME SUPPLIER
1 SUPPLIER 1 EMZOR
2 SUPPLIER 2 MAY & BAKER
3 SUPPLIER 3 GSK
4 SUPPLIER 4 SYNERGY
5 SUPPLIER 5 HOVID


![[Looking for a more participative healthcare: sharing medical decision making]](https://static.fdokumen.com/doc/165x107/6345bf616cfb3d406409d2ee/looking-for-a-more-participative-healthcare-sharing-medical-decision-making.jpg)