Supersonic Combustion and Mixing Characteristics of ...
195
Old Dominion University Old Dominion University ODU Digital Commons ODU Digital Commons Mechanical & Aerospace Engineering Theses & Dissertations Mechanical & Aerospace Engineering Winter 2002 Supersonic Combustion and Mixing Characteristics of Supersonic Combustion and Mixing Characteristics of Hydrocarbon Fuels in Screamjet Engines Hydrocarbon Fuels in Screamjet Engines Ahmed A. Taha Old Dominion University Follow this and additional works at: https://digitalcommons.odu.edu/mae_etds Part of the Heat Transfer, Combustion Commons, and the Structures and Materials Commons Recommended Citation Recommended Citation Taha, Ahmed A.. "Supersonic Combustion and Mixing Characteristics of Hydrocarbon Fuels in Screamjet Engines" (2002). Doctor of Philosophy (PhD), Dissertation, Mechanical & Aerospace Engineering, Old Dominion University, DOI: 10.25777/eqzz-7986 https://digitalcommons.odu.edu/mae_etds/158 This Dissertation is brought to you for free and open access by the Mechanical & Aerospace Engineering at ODU Digital Commons. It has been accepted for inclusion in Mechanical & Aerospace Engineering Theses & Dissertations by an authorized administrator of ODU Digital Commons. For more information, please contact [email protected].
-
Upload
khangminh22 -
Category
Documents
-
view
4 -
download
0
Transcript of Supersonic Combustion and Mixing Characteristics of ...

Old Dominion University Old Dominion University
ODU Digital Commons ODU Digital Commons
Mechanical & Aerospace Engineering Theses & Dissertations Mechanical & Aerospace Engineering
Winter 2002
Supersonic Combustion and Mixing Characteristics of Supersonic Combustion and Mixing Characteristics of
Hydrocarbon Fuels in Screamjet Engines Hydrocarbon Fuels in Screamjet Engines
Ahmed A. Taha Old Dominion University
Follow this and additional works at: https://digitalcommons.odu.edu/mae_etds
Part of the Heat Transfer, Combustion Commons, and the Structures and Materials Commons
Recommended Citation Recommended Citation Taha, Ahmed A.. "Supersonic Combustion and Mixing Characteristics of Hydrocarbon Fuels in Screamjet Engines" (2002). Doctor of Philosophy (PhD), Dissertation, Mechanical & Aerospace Engineering, Old Dominion University, DOI: 10.25777/eqzz-7986 https://digitalcommons.odu.edu/mae_etds/158
This Dissertation is brought to you for free and open access by the Mechanical & Aerospace Engineering at ODU Digital Commons. It has been accepted for inclusion in Mechanical & Aerospace Engineering Theses & Dissertations by an authorized administrator of ODU Digital Commons. For more information, please contact [email protected].

SUPERSONIC COMBUSTION AND MIXING CHARACTERISTICSI MI
OF HYDROCARBON FUELS IN SCRAMJET ENGINES
by
Ahmed A. Taha B.S. July 1988, Cairo University, Egypt M.S. June 1994, Cairo University, Egypt
A Dissertation Submitted to the Faculty of Old Dominion University in Partial Fulfillment of the
Requirement for the Degree of
DOCTOR OF PHILOSOPHY
MECHANICAL ENGINEERING
OLD DOMINION UNIVERSITY December 2002
Approved by:
Dr. Surendra N. Tiwari (Director)
Dr. Taj O. Mohieldin (Co-Director)
Dr. Sushil Chaturvedi (Member)
DrrArthur C. TaylorDJfMember)
Reproduced with permission of the copyright owner. Further reproduction prohibited without permission.

ABSTRACT
SUPERSONIC COMBUSTION AND MIXING CHARACTERISTICS OF HYDROCARBON FUELS IN SCRAM JET ENGINES
Ahmed A. Taha Old Dominion University
Director: Dr. Surendra N. Tiwari Co-Director: Dr. Taj O. Mohieldin
A numerical study has been conducted to investigate the combustion and mixing
characteristics o f hydrocarbon fuels in scramjet engines. The three-dimensional Reynolds
Average Navier-Stokes equations have been used to numerically investigate the
supersonic combustion of ethylene and propane using different combustor configurations
and fuel injection schemes.
Four physical models are used in the current study: the unswept generic rearward-
facing step, the side swept rearward-facing step, the wedge with no pilot injection, and
the wedge with pilot injection configurations.
The combustion characteristics of gaseous propane in supersonic airflow using the
rearward-facing step that is swept inward from both end sides is studied. The effect of
sweeping the step on the flow field features o f propane combustion is investigated.
The study of the supersonic combustion o f ethylene is carried out using different
combustor configurations, different main fuel equivalence ratios, and different pilot fuel
equivalence ratios. The effect o f the combustor configuration on the temperature flow
field and the flow structure is investigated by simulating two different combustor
configurations, the rearward-facing step and the cavity. Then, the effect of the
equivalence ratio of the main fuel injection on the general flow field features and energy
field characteristics is studied. Two normal fuel equivalence ratios are used, 0.4S and
0.60. Lastly, the effect o f the pilot fuel equivalence ratio on the flame holding mechanism
and the combustion and flow field qualities concludes the study. Six pilot injection
equivalence ratios are studiedO.0,0.02,0.03,0.045,0.06, and 0.08.
The swept step shows the ability to hold the propane flame in the supersonic air
stream without extinction. It was found that the side sweeping o f the combustor exhibits
the high temperature and combustion products concentration in the far field domain while
Reproduced with permission of the copyright owner. Further reproduction prohibited without permission.

the area downstream of the normal injection location characterizes lower temperature and
products concentration. It is recommended to optimize the combustor length to ensure the
complete combustion and consequently the full liberation of the chemical energy stored
in the fuel before the fuel exits the combustor.
The main findings from the ethylene study can be summarized in the following
points. The step configuration with no pilot injection can afford the flame holding
mechanism in the supersonic air stream by creating the flow recirculations in the step
base area and featuring permanent high temperature regions surrounding the normal fuel
injection. The step configuration showed good mixing capabilities in the far field domain.
The wedge configuration proved superiority over the generic rearward-facing step
configuration in holding the ethylene flame in the supersonic airstreams, producing
overall higher temperature medium throughout the combustor, and exhibiting lower flow
losses and higher combustor efficiency. The increase in the equivalence ratio o f the
ethylene normal fuel injection enhances the general flow field features and energy field
characteristics in the combustor except in the step base area where the lower equivalence
ratio features better temperature distribution and higher combustion efficiency.
Although the wedge with no pilot injection configuration presents the highest
level o f temperature distribution in the cavity and downstream regions, the 0.02-pilot
equivalence ratio increases the temperature of the upstream face of the normal injection
and enhances the flame holding mechanism. The 0.02-pilot equivalence ratio presented
the optimum pilot injection case that can promote the flame holding mechanism and keep
good combustion and flow field qualities. While further increase o f the pilot injection
equivalence ratio quenches the high temperature gases in the cavity region, which leads
to the deficiency in the flame holding mechanism, the excessive pilot fuel injection shows
its positive effect by increasing the average flow field static temperature and absolute
pressure in the far field domain.
Reproduced with permission of the copyright owner. Further reproduction prohibited without permission.

IV
ACKNOWLEDGMENTS
I would like to express my sincere thanks and deepest appreciation to my advisor,
Professor Surendra N. Tiwari, for his continuous and everlasting support, encouragement,
and patience and for the constructive and fully-informative graduate courses he taught me
during my program. The affectionate parental care he used to offer his students is not less
than, by any way, the great academic and professional guidance he is sincerely providing.
I gratefully acknowledge the financial support o f the Old Dominion University’s Institute
for Scientific and Educational Technology (ISET) through NASA Langley Research
Center, Cooperative Agreement NCC1-349 under the supervision of Prof. Tiwari.
My deep thanks and faithful respect are due to my co-advisor, Professor Taj. O.
Mohieldin, for the valuable scientific knowledge I gained from the graduate courses he
taught me and the priceless discussions and guidance he offered me during the course of
my research. I sincerely appreciate the great help and support my advisors offered me to
overcome the health problem I suffered during my program.
My best words of thanks are due to the faculty and staff of the Mechanical
Engineering Department, Old Dominion University, and especially to Professor Sushil
Chaturvedi, the Department Chair and my committee member, for the wonderful and
persistent effort that he does not spare to facilitate and promote the research environment
in the Department. My appreciation extends also to my committee members Profs. A. S.
Roberts Jr. and A. C. Taylor III for their time and help.
I would like to thanks all my colleagues and fellows at Old Dominion University,
my friends who offered me the help and support and among whom I felt the comforting
spirit o f the one family.
I extend my thanks and gratitude to my former advisors and Professors, M M .
Elkotb and O. M. F. Elbahar, Cairo University, Egypt, who helped me build up my
scientific background and research skills.
Last, but not least, special thanks, acknowledgment, and appreciation are due to
my dedicated parents, my persistent wife, and my children for their everlasting love,
encouragement, and patience. Without their support, this work would have not been
possible.
Reproduced with permission of the copyright owner. Further reproduction prohibited without permission.

V
TABLE OF CONTENTS
Page
LIST OF TABLES ................................................................................................. via
LIST OF FIGURES . ................................................................................... ix
Chapter
I INTRODUCTION AND CHALLENGES......................................................... I
L I Introduction . . . . . ........................................... ........................................ L
1.2 Challenges in Supersonic Combustion......................... ..................... 3
1.3 Objectives of Present Study................................................................ 5
1.4 Work Layout ..................................................... 6
H LITERATURE SURVEY.................................................................................... 7
2.1 Introduction......................................................................... 7
2.2 Injection Modes and M ixing................................................................ 7
2.3 Auto and Forces Ignition................................. .................................... 19
2.4 Vitiated and Clean Incoming A ir ............................................................. 21
2.5 Hydrocarbon Fuels............................................ .................................. 23
2.6 Flame Holding Mechanisms for Liquid Hydrocarbon Combustion... 33
2.7 Importance of Modeling and Simulation ........................................... 38
UL THEORETICAL FORMULATIONS............................................................... 51
3.1 Introduction.......................................................................................... 51
3.2 Governing Equations............................................................................ 51
3.2.1 The Mass Conservation Equation............................................. 51
3.2.2 Momentum Conservation Equation.......................................... 52
3.2.3 The Energy Equation................................................................ 52
3.3 Basic Physical Models for Flow and Heat Transfer............................ 53
3.3.1 Turbulence M odels......................................................... 53
3.3.2 Compressible Flow s................................................................. 55
3.3.3 Chemical Species Transport and Reacting F low ..................... 57
3.4 Thermal M odel....................................................................................... 60
3.4.1 Density: Ideal Gas Law for Compressible Flows.................... 60
Reproduced with permission of the copyright owner. Further reproduction prohibited without permission.

v i
3.4.2 Composition-Dependent Thermal Conductivity for
Multicomponent Mixtures.............................................. 60
3.4.3 Composition-Dependent Viscosity for Multicomponent
Mixtures................................................................ 61
3.4.4 Specific Heat Capacity as a Function of Composition 61
3.5 Grid Generation ......................................................................... 62
3.6 Method o f Solution.............................................................................. 63
3.6.1 Basics of the Overall Solution Algorithm................................ 63
3.6.2 Residual Reporting............................................ 64
3.6.3 Judging Convergence.............................................................. 66
3.7 Physical M odels................................ 67
3.7.1 Rearward-Facing Step Configuration...................................... 67
3.7.2 Swept Rearward-facing Step Configuration............................ 67
3.7.3 Cavity with no Pilot Injection Configuration.......................... 68
3.7.4 Cavity with Pilot Injection Configuration................................ 68
3.8 Boundary and Initial Conditions ...... 68
IV PROPANE SUPERSONIC COMBUSTION............................................. 75
4.1 Introduction........................ 75
4.2 Physical Models and Flow Calculations Description........................ 75
4.3 Grid Independence Study..................................................................... 76
4.4 Results................................................................................................... 77
4.4.1 Symmetry Plane Results............................................................ 77
4.4.2 Cross Row Results.................................................................... 79
4.4.3 Pilot Injection Plane Results................................................... 80
4.4.4 Upper-Wall Average Results.................................................... 81
V ETHYLENE SUPERSONIC COMBUSTION............................................. 99
5.1 Introduction........................................................................................... 99
5.2 Physical Models and Flow Calculations Description......................... 99
5.3 Definitions............................................................................................. 101
5.3.1 Stagnation Pressure Efficiency and Entropy Production 101
5.3.2 Kinetic Energy Efficiency......................................................... 101
Reproduced with permission of the copyright owner. Further reproduction prohibited without permission.

v i i
5.3.3 Combustion Efficiency............................................................. 102
5.3.4 Fuel Penetration and Rate o f Fuel D ecay ................ 103
5.3.5 Upper-Wall Average Absolute Pressure and Static
Temperature Distribution........................................................ 103
5.3.6 Flow Field Average Absolute Pressure and Static
Temperature Distribution............. . ........................................... 104
5.4 Results ................................................ 104
5.4.1 Effect of Configuration............................................................. 104
5.4.2 Effect o f Main Fuel Equivalence Ratio ................................ 110
5.4.3 Effect of Pilot Injection Equivalence R atio ............... ............. 114
VI CONCLUDING REMARKS................................................................. 165
REFERENCES.......................................................................................................... 169
V ITA ......................................................................................................................... 187
Reproduced with permission of the copyright owner. Further reproduction prohibited without permission.

viif
LIST OF TABLES
Table2.1 Energy properties o f and hydrocarbon fuels............. ...........................
5.1 Values of the longitudinal distribution o f the area-weighted average flow
field static temperature for different pilot equivalence ratios ..............
Reproduced with permission of the copyright owner. Further reproduction prohibited without permission.
Page44
121

ix
LIST OF FIGURES
Figure Page
2.1 Schematic diagram o f the scramjet engine configuration................ 45
2.2 Essential features of two-dimensional pr planar geometry scramjet
engines................................................................................................ 45
2.3 Airframe-integrated scramjet along with a partial cross-section
through a typical modular engine.......................................... 46
2.4 Schematic of the region surrounding a single perpendicular
injector............................................................................................... 46
2.5 Generation of counter-rotating streamwise vorticity by ramp fuel
injector...................................................... 47
2.6 Scramjet fuel-injector compression and expansion ram ps............... 47
2.7 Energy content per unit mass for different avionic fuels................. 48
2.8 Temperature limit for different avionic fuels ......................... 49
2.9 Energy content per unit volume for different avionic fuels 50
3.1 An unstructured face meshing unit “Tri-Pave” scheme.................... 70
3.2 T-Grid meshing scheme.................................................................... 70
3.3 Overview of the solution process...................................................... 71
3.4(a) Schematic diagram for the rearward-facing step configuration 72
3.4(b) Schematic diagram for the step configuration at the symmetry
plane with full-dimensions ............................................................... 72
3.5 Schematic diagram for the swept rearward-facing step
configuration...................................................................................... 73
3.6 Schematic diagram for the cavity with no pilot injection
configuration...................................................................................... 73
3.7(a) Schematic diagram for the cavity with pilot injection configuration 74
3.7(b) Schematic diagram for the cavity with pilot injection configuration
at the symmetry plane with full-dimensions................ 74
4.1 Comparison between longitudinal average upper-wall absolute
pressure distribution for both grid sizes, grid independence study.. 83
Reproduced with permission of the copyright owner. Further reproduction prohibited without permission.

X
4.2 Absolute pressure contours at the symmetry plane........................... 84
4.3 Static temperature contours- at the symmetry plane.......................... 85
4.4 COz combustion product mass fraction contours at the symmetry
plane.................................................................................................... 86
4.5 Mach number contours at the symmetry plane................................. 87
4.6 Static temperature contours at X=0.03 lm cross flow plane 88
4.7 Velocity vectors and streamlines contours at X=0.03 lm cross flow
plane............................................................ .................... ................... 89
4.8 Velocity vectors and streamlines contours at X=0.070m cross flow
plane .......................................................................................... 90
4.9 Mach number contours at X=0.070m cross flow plane..................... 9 1
4.10 Absolute pressure contours at X=0.070m cross flow plane.............. 92
4.11 Static temperature contours at X=0.070m cross flow plane ............. 93
4.12 CO2 combustion, products mass fraction contours at X=0.070m
cross flow plane.................................................................................. 94
4.13 Velocity vectors and streamlines contours at the pilot injection
plane, Y=0.0304m.............................................................................. 95
4.14 Static temperature contours at the pilot injection plane,
Y=0.0304m......................................................................................... 96
4.15 C 02 combustion product mass fraction contours at the pilot
injection plane, Y=0.0304m.............................................................. 97
4.16 Average upper-wall absolute pressure and static temperature
distribution along the combustor length.............. ............................ 98
5.1 Velocity vectors and streamlines contours at the symmetry plane.. 123
5.2 Temperature contours at the symmetry plane................................... 125
5.3 Velocity vectors and streamlines contours at X=0.040m plane 127
5.4 Temperature contours at X=0.040m plane......................................... 129
5.5 Velocity vectors and streamlines contours at the pilot injection
plane, Y=0.0304m.............................................................................. 131
5.6 Temperature contours at the pilot injection plane, Y=0.0304m....... 133
5.7 Velocity vectors and streamline contours at the normal injection 135
Reproduced with permission of the copyright owner. Further reproduction prohibited without permission.

x i
plane, X=0.070m ..........................................................................
5.8 Temperature contours at the normal injection plane, X=0.070m... 137
5.9 Temperature contours at X=0.220m................................................... 139
5.10 Comparison between the combustion efficiency for the step and
wedge configurations.......................................................................... 140
5.11 Comparison between the fuel penetration of the step and wedge
configurations ............................................. 140
5.12 Comparison between the rate of fuel decay of the step and wedge
configurations ............ 141
5.13 Comparison between the upper-wall average static temperature
distribution o f the step and wedge configurations ................... 142
5.14 Comparison between the flow field average static temperature
distribution o f the step and wedge configurations............................ 142
5.15 Comparison between the upper-wall average absolute pressure
distribution of the step and wedge configurations............................ 143
5.16 Comparison between the flow field average absolute pressure
distribution o f the step and wedge configurations ............. 143
5.17 Comparison between the fuel penetration of the 0.45-ER and 0.60-
ER wedge configuration cases............................. ............................ 144
5.18 Comparison between the rate of fuel decay of the 0.45-ER and
0.60-ER wedge configuration cases................................................... 144
5.19 Comparison between the combustion efficiency of the 0.45-ER
and 0.60-ER wedge configuration cases............................................ 145
5.20 Comparison between the upper-wall average static temperature
distribution o f the 0.45-ER and 0.60-ER wedge configuration
cases................................................................................................... 146
5.21 Comparison between the flow field average static temperature
distribution, o f the 0.45-ER and 0.60-ER wedge configuration
cases........................... ........... .................. .... .................................... 146
5.22 Comparison between the upper-wall average absolute pressure
distribution o f the 0.45-ER and 0.60-ER wedge configuration
Reproduced with permission of the copyright owner. Further reproduction prohibited without permission.

xii
cases.................................................................................................... 147
5.23 Comparison between the flow field average absolute pressure
distribution o f the 0.45-ER and 0.60-ER wedge configuration
cases.................................................................................................... L47
5.24 Reversed flow at the pilot injection ports for 0.01-ERP, pilot inj.
plane................................... . ....................................... . .................. L49
5.25 Reversed flow at the pilot injection ports for 0.0l-ERp, sym. Plane. 149
5.26 Velocity vectors and streamlines contours at the symmetry plane
for different pilot equivalence ratios ..................................... 151
5.27 Effect o f the pilot injection equivalence ratio on the fuel
penetration ........ 152
5.28 Effect of the pilot injection equivalence ratio on the rate of decay
of the fu e l.............................................. 152
5.29 Temperature contours at the symmetry plane for different pilot
equivalence ratios....................................................... 154
5.30 Temperature contours at the pilot injection plane, Y=0.0304m, for
different pilot equivalence ratios...................................................... 156
5.31 Comparison between the temperature contours of 0.0-ERp and
0.02-ERp-cases focusing on the cavity region............... 157
5.32 Temperature contours at X=0.040m cross flow plane for different
pilot equivalence ratios...................................................................... 159
5.33 Temperature contours the normal injection plane, X=0.070m, for
different pilot equivalence ratios........................................................ 161
5.34 Comparison between the flow field average static temperature
distribution for different pilot equivalence ratios.............................. 162
5.35 Comparison between the flow field average absolute pressure
distribution for different pilot equivalence ratios .................. 162
5.36 Effect o f pilot injection equivalence ratio on the stagnation
pressure efficiency.................................. 163
5.37 Effect o f pilot injection equivalence ratio on the entropy
production............................................................................................ 163
Reproduced with permission of the copyright owner. Further reproduction prohibited without permission.

XU1
5.38 Effect of pilot injection, equivalence ratio on the kinetic energy
efficiency.......................................... ..............................— -............. 164
5.39 Effect of pilot injection equivalence ratio on the combustion
efficiency............................................................................................. 164
Reproduced with permission of the copyright owner. Further reproduction prohibited without permission.

L
Chapter I
INTRODUCTION AND CHALLENGES
1.1 IntroductionSupersonic Combustion Ramjet (Scramjet) engines are attractive for both cruise
and boost missions in the hypersonic portion of the flight corridor [1]. The flow speed is
high in scramjet engines and the mixing and reaction dmes are limited in the engine
combustor. Therefore, combustion is a critical factor in the design o f scramjet engines
[2].Sustained airbreathing hypersonic flight shows potential advantages for military
applications. Furthermore, airbreathing propulsion could be of particular interest for
future reusable launchers in connection with rocket engines. High-speed ramjets
(scramjet and dual mode ramjet) are a key technology for these two kinds o f military and
commercial applications [3]. Missile applications exist that require the performance
benefits offered by the supersonic combustion ramjet (Scramjet) propulsion system [4].
The scramjet engine is expected to be the most effective propulsion system, but
there are severe conditions for ignition such as low pressure, low temperature, and high
airflow speed due to the supersonic incoming air [5]. Constraints on system size and
weight have led to the need to improve technology for analyzing and designing such
system. Considerable fundamental research has been conducted in response to the
increased interest in the development of scramjet propulsion systems. Many experimental
and numerical studies of various aspects of fuel injection in the combustor are discussed
in [6].1
The development o f hypersonic airbreathing plane capable o f horizontal takeoff
and landing and acceleration to low earth orbit has attracted significant interest in the
aerospace community for some time. It has a significant weight advantage over presently
used rocket propulsion systems by eliminating the need to carry onboard oxygen tanks.
One o f the major challenges in developing such a plane is the design o f a suitable
The journal model used for this dissertation Is the AIAA Journal.
Reproduced with permission of the copyright owner. Further reproduction prohibited without permission.

2
propulsion system. Current airbreathing engine designs, which utilize subsonic internal
flow velocities, such as turbojet or even ramjet engines, would be inappropriate because
o f the extreme conditions seen in hypersonic flight. Temperature recovery from the
hypersonic free stream would be in the order of 2000K or more, leading to engine
materials difficulties and loss o f usable energy due to dissociation of air molecules. The
induced drag on the vehicle due to strong shocks at the engine inlets is a strong function
o f the flight Mach number so that it rapidly becomes impractical to use subsonic engines
at high speeds. A supersonic combustion RAMJET or SCRAMJET has long been
considered to be a feasible engine concept for hypersonic vehicles [7].
Although hydrogen is generally a more energetic fuel than hydrocarbon fuels (i.e.,
the hydrogen has a greater energy density), some hydrocarbons offer the advantage that
they can be liquefied without the use of cryogenic cooling and can also be contained
within a smaller volume. The potential for the combustion of storable liquid fuels in
supersonic airstreams for efficient propulsion engines at hypersonic speeds has been
recognized since the late 1950s [8,9]. The need to increase the fuel energy density for
hypersonic flight has long been recognized [10,11]. Liquid hydrocarbons are attractive
solutions for the low end of the hypersonic flight regime because of their higher
volumetric energy content and the relative simplicity of operational logistics [10,12].
For a Mach number range of 4-10, hydrocarbon fuels provide sufficient thrust and
are also being considered. The high density o f hydrocarbon fuels, as well as ease of
handling, make them very attractive for volume-constrained systems such as missiles and
hypersonic research vehicle (HRV) [13].
Most of the scramjet combustion work, currently being conducted, uses liquid
hydrocarbon fuels or hydrogen [14]. The Air Force’s Hypersonic Technology 9-years-
Program (HyTech) is developing a technology base for Mach 4-8 liquid-hydrocarbon
fueled scramjet propulsion systems. The goal of the HyTech Program is to develop and
demonstrate the operability, performance and durability of a Mach 4-8 hydrocarbon
scramjet propulsion system [15].
The investigation of the liquid hydrocarbon fuel-based scramjet combustor is one
o f the major purposes o f the hypersonic flight technology program. A primary problem to
be solved is the longer ignition delay for hydrocarbon combustion. As an example, under
Reproduced with permission of the copyright owner. Further reproduction prohibited without permission.

3
the typical working conditions in a scramjet combustor, the ignition delay for kerosene is
5~10 ms [16,17], while the typical residence time available for complete mixing and
combustion is extremely limited to less than 2 ms in scramjet combustor [18]. Therefore,
injection and mixing enhancement play important role in designing scramjet combustor
[19].Because the missile applications impose demanding volume constraints, a strong
motivation exists for the development of a hydrocarbon-fueled air-frame-integrated
scramjet. Although studies o f supersonic combustion of hydrocarbon fuels have been
performed intermittently over the past forty years [18,20], they yielded only a limited
design database [4].
Although the energy/mass density of liquid hydrocarbon is lower than that of
hydrogen, some o f the mass increase would be recovered by a small and lighter structure
of the vehicle. Liquid hydrocarbon fuels require substantial residence time to achieve
vaporization and complete exothermic reactions, and such time is unlikely to be available
in reasonable-sized supersonic combustors. The chemical kinetics o f hydrocarbons are
slow in comparison with gaseous fuels, such as hydrogen. For many realistic operating
conditions, exothermic reactions cannot be achieved within the available residence time.
Use o f a pilot flame with fast kinetics (i.e., gaseous hydrogen) can provide locally, at the
liquid injection location, the conditions necessary to accelerate the hydrocarbon reactions
rates and reduce the Damkohler number, defined as the ratio between the characteristic
fluid residence time in the reaction zone and the chemical reaction time scale, i.e., high
temperature and low fluid velocities. For such a system it is necessary to verify: (a) the
level of piloted energy required to ignite and maintain stable combustion of the liquid
fuel, and (b) the interaction between the pilot flame and the heat sink represented by the
injected hydrocarbon [21].
Extensive literature survey that reviews the previous related research work is
reported in Chap. 2.
1.2 Challenges in Supersonic CombustionThe high-speed propulsion community has to orient more research activities to
address some of the technical issues, which must be resolved to realize the full potential
o f the scramjets. Among these issues are the fuel-air mixing enhancement, the
Reproduced with permission of the copyright owner. Further reproduction prohibited without permission.

4
structuraUy-compatible injection systems, the fuel densification to increase the
energy/unit volume o f the fuel used, and the turbulence modeling that is capable of
predicting transition in the inlet, heat transfer, shear and mixing in the combustor, and
possible relaminization in the nozzle [22].
Future direction of supersonic combustion research is discussed recently by
Tishkoff et al. [6]. There is still serious question as to whether or not stable supersonic
combustion is possible over the range of expected operating conditions. The successful
development of the supersonic combustion ramjet (scramjet) for use on future hypersonic
vehicles is reliant on detailed understanding of the complex flow field present in different
regions o f the system over a range of operating conditions. To model chemical reaction
o f fuel and air in an engine, reduced kinetic models must be developed to reduce
computational time required for solving the species equations, particularly for
hydrocarbon fuels. To support hydrocarbon-based scramjet engine development, a
comprehensive data set for C7 — C n aliphatic fuel components under scramjet conditions
should be developed. The aliphatic fuels database should be utilized to derive suitable
starting and reduced mechanisms for candidate fuels. Changes in the state of the fuel can
affect the reactivity o f the fuel and the resulting combustion efficiency significantly.
There is a lack o f understanding of the physical processes that may contribute to these
effects. To understand these phenomena changes in the fuel state must be studied in a
realistic simulation of the scramjet preheating and combustion processes.
Fuel-air mixing, flame holding, pressure losses, and thermal loading are among
the major issues that need to be resolved for the successful design and implementation of
hydrocarbon-fueled supersonic combustion ramjet (scramjet) engines. A successful fuel
injection scheme must provide rapid mixing between the fuel and oxidizer streams,
minimum total pressure losses, and have no adverse effects on flame-holding capability
or thermal/structural integrity of the device. These requirements place somewhat
conflicting constraints on the design of a viable fuel-injection scheme, and solutions to
these problems are being actively sought internationally. A need exists for the
development o f a system that effectively integrates fuel injection and flame holding for
supersonic combustion. Such a device would contribute significantly to the present
research and industrial technology base [23].
Reproduced with permission of the copyright owner. Further reproduction prohibited without permission.

5
la the recent work of Powell et al. [24], the many technological challenges that
are still under investigation in the Hypersonic Technology (HyTech) program and the
extent of advancement achieved in each area were presented. Among the discussed
challenges are: the starting condition and mass capture in the inlet, the pressure ratio in
the isolator, the piloting and flame holding, the fueL injection and mixing, the total
pressure losses in the combustor, the frozen flow losses, the divergence losses, the nozzle
thrust vector in the nozzle, the regeneradvely-cooled structures and thermal management,
the expected coking (deposition) o f the hydrocarbon fuels being exposed to high
temperatures during the endothermic reaction, the change in the composition of the
cracked hydrocarbon fuels associated with the change in the ignition delay time that
affects combustion stability, and the significant difference in engine operation during the
ramjet and scramjet modes.
Combustor scaling represents another source of challenge, which should be
seriously compromised by the non-linearity o f chemical reaction times and dissipative
processes. Therefore, it is critical that supersonic combustor testing be accomplished at or
near full scale [25].
For the supersonic mixing studies, it is suggested to investigate the effect of the
injection angle of the main fuel on the supersonic mixing and combustion characteristics.
It is recommended to study the effect of the transverse normal ethylene and propane
injections on the flame holding and combustion characteristics in order to investigate the
relationship between the injection scheme and the flame holding and flow field and
energy field features. It is suggested to simulate the supersonic combustion of the normal
ethylene and propane injections with the pilot gaseous hydrogen. For the future studies, it
is suggested to dedicate more effort trying to carry out the simulation o f the supersonic
combustion o f liquid kerosene with gaseous hydrogen as a pilot fuel. The radiative
interaction is also suggested to be included in the future studies due to the existence of
the hydrocarbon combustion products, which are radiative participating medium.
1.3 Objectives o f Present Study
The primary objective of the current study is to numerically examine the
possibility o f igniting hydrocarbon fuels in supersonic airstreams and maintaining the
hydrocarbon flames in such hostile environments. The secondary objective o f the study is
Reproduced with permission of the copyright owner. Further reproduction prohibited without permission.

6
to investigate the effect o f the combustor configuration, the main fueL equivalence ratio,
and the pilot fuel equivalence ratio on the flame holding mechanism and the flow field
and energy field characteristics.
The combustion characteristics of gaseous propane in supersonic airflow using the
rearward-facing step that is swept inward form both end sides is studied. The effect of
sweeping the rearward-facing step from both end sides, in the cavity configuration, on the
flow field features o f propane combustion is investigated.
Next, an extensive study for the flame holding and mixing and combustion
characteristics of gaseous ethylene in supersonic airstreams is carried out. In this study,
different combustor configurations, different main fuel equivalence ratios, and different
pilot fuel injection equivalence ratios were employed. First, The effect of the combustor
configuration on the temperature flow field and the flow structure is investigated by
simulating two different combustor configurations, the rearward-facing step and the
cavity. Next, the effect of the equivalence ratio of the main fuel injection on the general
flow field features and energy field characteristics is studied. Lastly, the effect o f the pilot
fuel equivalence ratio on the flame holding mechanism, and the combustion and flow
field qualities concludes the study. The equivalence ratios examined are ranged between
0 and 0.08.
1.4 Work LayoutThe current study is presented in the following logical manner. An extensive
literature survey for the related previous work is compiled in Chap. 2. The theoretical
* formulations and code description are provided in Chap. 3. Chapter 4 presents and
discusses the results for the supersonic propane combustion while the obtained detailed
results for the supersonic ethylene combustion are analyzed and discussed in Chap. 5.
Finally, concluding remarks on the supersonic combustion o f hydrocarbon fuels in
scramjet engines are provided in Chap. 6.
Reproduced with permission of the copyright owner. Further reproduction prohibited without permission.

7
Chapter II
LITERATURE SURVEY
2.1 Introduction
A supersonic combustion RAMJET or SCRAMJET has long been considered to
be a feasible engine concept for hypersonic vehicles [7]. Figure 2.1 shows a schematic of
a SCRAMJET engine concept where the aircraft underbody and engine designs are
integrated together [26].
The shock waves formed by the vehicle forebody and the engine inlets serves as
the engine compressor section while the engine exhaust and vehicle afterbody serve as
the expansion nozzle to generate thrust from the gases burned in the combustor. The
surface geometry would be chosen so that supersonic flow would be maintained
throughout the internal passages of the engine avoiding large recovery of temperature and
pressure from the free stream air [27]. The essential features o f two-dimensional or planar
geometry scramjet engines are diagrammed in Fig. 2.2 [26].
Figure 2.3 shows the Airframe-Integrated supersonic combustion ramjet
(scramjet) along with a partial cross-section through a typical modular engine. The
sidewalls of the inlet continue the compression process, which began on the vehicle
forebody. The instream struts complete the compression process and also provide
locations for global distribution of fuel. The particular concept depicted here shows a
combination of perpendicular and parallel fuel injection, which would typically take
place behind a rearward-facing step and at the base of the strut, respectively [28].
2.2 Injection Modes and MixingThe thermodynamic conditions at the test section entrance of the Scramjet engine
are representative of the conditions o f the lower end o f the hypersonic flight regime. For
these vehicles it is anticipated that the fuel be used to cool components o f the vehicle and
o f the engine and, thus, enter the test section at high temperatures (even a supercritical
conditions), resulting in fast vaporization and mixing upon injection. The low range of
hypersonic flight regime is, therefore, of particular interest, since the level o f heating of
the fuel will be relatively low, and thus longer residence time will be required for the fuel
Reproduced with permission of the copyright owner. Further reproduction prohibited without permission.

8
to achieve complete combustion within the engine combustor. The mixing-combustion
coupling at these conditions is o f great interest [21].
Supersonic combustion ramjet (scramjet) propulsion systems rely on injection and
burning of fuel in very high speed flow fields. In such an environment the fuel remains
inside the combustion chamber for such short durations that rapid mixing o f the fuel into
the freestream air is essential for an acceptable design [29]. Rapid mixing ensures the
shortest possible combustor length and maximizes the heat release from the combustion, .
whereas a uniform distribution of fuel within the combustor optimizes combustion
efficiency and minimizes the amount of air processed by the inlet that does not participate
in the combustion. Clearly, an understanding of the fundamental fluid mechanics of
compressible mixing is essential to a successful supersonic combustor design [30].
Fuel-air mixing in an airbreathing engine becomes increasingly inefficient at
higher velocity, hence requiring a longer combustor length. Although this is caused by
the reduced flow residence time inside the combustor and the compressibility effect that
adversely affects the rate o f mixing [31-33], a short combustor length is desirable because
the thrust-to-drag ratio of an engine is roughly proportional to the ratio between the
combustor diameter and length [34].
Injection and mixing enhancement play important roles in successfully designing
a hypersonic air-breathing propulsion system. This is especially true when a liquid
hydrocarbon fuel is used. Several fundamental studies have focused on liquid fuel
injection from the walls o f combustors or from bluff body flame-holders into subsonic or
supersonic crossflow [35-37]. Several fuel injection schemes, such as angled injection
[38], non-circular nozzles [39], and ramp injectors [40], have been studied in attempts to
create deeper fuel penetration into the air stream for better mixing and to generate smaller
droplets of the liquid spray for faster evaporation [41]. Various mixing enhancement
schemes have been proposed including contoured injection orifices, flow field and shock
oscillations, baroclinic vortex generation, and wall-mounted vortex generators [23].
If the heat release by the combustion process becomes greater than a critical value
in a scramjet engine, the Mach number falls to unity and the flow becomes thermally
choked [42]. This choked flow may, in turn, cause a normal shock to form at the engine
inlet. This process, known as “unstart,” creates large amounts o f drag and radically
Reproduced with permission of the copyright owner. Further reproduction prohibited without permission.

9
reduces the performance o f the engine at high flight Mach number [43]. The numerical
results of Moon et al. [44] suggest that there would be two possibilities to trigger thermal
choking, such as 1) strong turbulent mixing, and 2) instability of shear layer between
incoming air and fuel jet. McDaniel and Edwards [45] studied the dynamic simulation of
thermal choking in a nominally two-dimensional scramjet isolator/combustor
configuration.
The fuel-injection modes are used to control heat release. At lower speeds (below
Mach 5, and to some extent Mach 5-7, too much heat release too early in the combustor
will result in thermal choking and inlet unstart. Parallel fuel injection, which is shown to
have a slower-mixing process, is therefore used extensively to stretch out the combustion
zone. Above Mach 7, thermal choking is much less likely to occur, and the faster-mixing
perpendicular injection process is utilized to get faster combustion and higher
performance. In order to quantify this mixing-controlled combustion philosophy, a
considerable amount o f research has been done on perpendicular and parallel mixing
[24].
Different methods o f liquid fuel injection have been investigated. Parallel flow
mixes through the growth of the shear layer generated at the interface of the different
components. It is observed that compressibility plays a major rule in reducing the growth
of the shear layer, thus requiring longer fluid residence time to insure good mixing in
practical devices. As the compressibility increases, the spreading rate of the shear layer
was observed to drop to about one quarter of the compressible shear layer growth for the
same velocity and density ratios of the two mixing constituents. The convective Mach
number (defined as a measure o f the speed of the turbulent structures in the shear layer
relative to the free stream) increases the stability of the large-scale turbulent structures,
which are responsible for the turbulent shear layer growth. This is o f particular
significance in high-speed flows, where parallel injection is the preferred mode due to the
lower total pressure relative to the other fuel injection and mixing options. An increase in
the stability of the large vortical structures in the shear layers due to compressibility is
observed even in situation where the turbulence is intentionally intensified. Growth o f the
shear layer was forced by a pulsating shock impinging on the shear layer in parallel
compressible flows in high speed (i.e., Mach 3 and 5, respectively) as a destabilizing
Reproduced with permission of the copyright owner. Further reproduction prohibited without permission.

10
mechanism leading to the growth of the shear layer and accelerated mixing. Only a
negligible effect was obtained both in the near and far field. However, when a shock of
the same strength impinged on the boundary layer o f the two flows prior to their
coalescence, an increase in the shear layer growth (14 to 26 percent) was experienced.
Thus, an increase in the turbulence in the boundary layer upstream of the mixing station
increased, causing an increase o f as much as 26 percent in the shear layer growth. This
indicated the significant role played by the small-scale turbulence in the mixing process.
Introduction of axial vorticity was shown to improve mixing, which was also attributed to
the small-scale turbulence effect on the growth of the shear layer and on the enhancement
o f turbulence in the shear layer. Mixing at a molecular level is, in particular, important in
combustion applications when stoichiometric mixing is a prerequisite to initiate chemical
reactions [21].
Mohieldin and Tiwari [46] studied numerically the advantage of using the tandem
injection on the regular single step tangential injection regarding the mixing aspect in the
flow field.
Studying the flow field behavior of the transverse injection o f the fuel is one of
the recent demanding research trends in the combustion field o f the scramjet engine. This
technique is used to increase the fiiel-air mixing in order to achieve the required heat
release pattern with the short combustion residence time associated with the high Mach
number condition [6].
Figure 2.4 shows a schematic o f the region surrounding a single perpendicular
injector. Because the mainstream flow is supersonic, there is a bow shock off the
underexpanded fuel jet and internal wave structure associated with the je t expansion. The
boundary layer ahead of the je t separates, and there is a recirculation zone downstream of
the injector as well. The details of these local zones are quite important to the ignition,
flame holding, and combustion processes and therefore important to real combustor
design [24].
Schetz et al. [47] presented a comprehensive review o f the mixing of transverse
jets and wall jets in supersonic flow. While the streamwise injection has the advantage of
adding to the thrust component o f the engine, many o f the approaches utilized to improve
the wall injection have been used successfully to enhance the fuel-air mixing [6].
Reproduced with permission of the copyright owner. Further reproduction prohibited without permission.

11
A numerical study was conducted by Lee et al. [48] for the mixing and burning
augmentation o f the transverse injection in a scramjet combustor. Based on the fact that
the main factor controlling the mixing characteristics in transverse injection is the
backpressure around the injection hole, it was tried to make a flow expansion beside the
injection hole with a cavity in order to reduce backpressure around the front hemisphere
o f injection hole. It was concluded that the near field has convection dominated regime
whose mixing and burning processes are accelerated by convective flow, while the far
field has diffusion dominated regime whose mixing and burning processes are dominated
by mass diffusion.
The effect of the staged hydrogen fuel normal injection in supersonic air streams
was studied numerically by Drummond and Weidner [49]. In comparison with the single
normal injection, the staged normal injection produced a much larger region of separation
around the injectors. The separated region becomes significantly larger with increased
spacing, and the fuel-air ratio there moves closed to stoichiometric increasing the amount
o f reaction. Staged injections provided two important requirements for improved flame
holding, a large separation that increases residence time of the fiiel-air mixture, and a
more favorable fuel-air ratio for reaction. Increasing the spacing between staged injectors
was anticipated to improve these qualities even more.
The axially staggered laterally inline step-injector configuration was investigated
by McClinton [50]. Both the top- and bottom-wall blocks incorporate a rearward-facing
step located ahead o f the injection orifices. The top wall step is located upstream o f the
bottom-wall step. Four fuel injectors were equally spaced in each wall. The results are
compared with results o f previous investigations made in this combustor model by using
laterally staggered rather than opposed injectors. The opposed injector configuration
eliminated the adverse lateral pressure gradient experienced at the downstream injectors
in the staggered injector configuration and strengthened the gradient over that produced
by single-wall injection.
The experimental study of King et al. [51] showed that the combination of a
moderate pressure, sonic normal injection combined with a tangential slot flow is
preferred for the mixing enhancement over the tangential slot injection alone. This
Reproduced with permission of the copyright owner. Further reproduction prohibited without permission.

12
scheme produces total mixing layer spreading angles up to 70% greater, and hence more
total mixing layer growth, than the slot injector alone.
Transverse or inclined injection introduces different mixing mechanism. At a
macro-scale, axial vorticity is produced at the edges and above the jet as the main flow
surrounds the jet in an axial and transverse direction. These vortices break the plume and
entrain the injectant into the core flow. The level o f mixing obtained by this strong
momentum exchange is traditionally quantified by the degree of penetration and
concentration decay of the jet injected into the main flow, usually air [2L]. Studies
performed by Mays et al. [52] and Wood et al. [53] addressed the effect of small-scale
turbulence on transverse injection and mixing. It was suggested that the onset and
divergence of instability in the jet is ultimately responsible for the plume fracture. This
instability propagates upstream and produces additional turbulence in the core flow. Even
in supersonic flows, an upstream interaction exists, as the instability at the jet boundary
induces oscillations of the bow shock generated in front of the jet via the separated region
in front o f the jet. In turn, these shock oscillations contribute to increase the vorticity in
the flow [21].
An important feature of the normal injection flow field is the gross penetration of
the jet into the flow. Baranovsky and Schetz [54] introduced the injection angle as a
separate parameter in the correlation, which was set to evaluate the penetration of liquid
jets. It was found that the upstream injection (injection angle is greater than 90° with
respect to the incoming air flow direction) can be used as a method to increase
penetration and residence time of a liquid fuel into a scramjet combustion chamber. It
was also found that the maximum penetration takes place at injection angle (0) =135
degrees.
Flow field and combustion/ignition characteristics o f a supersonic combustor with
a fuel injection strut were examined experimentally and computationally by Masuya et al.
[55]. Both normal and parallel injections were employed through the strut. Normal wall
injections were added to the strut injection. Pilot injections upstream of the strut and wall
injections were used. Plasma torch port is located on both sides o f the strut to force
ignition. Mixing and combustion efficiencies for a more disturbing strut were higher than
those for a less disturbing strut due to more severe deceleration and disturbance of the
Reproduced with permission of the copyright owner. Further reproduction prohibited without permission.

13
airstream. Mixing and combustion efficiencies o f fuel injected from the struts were
almost linearly increased with an increase of the flow rate ratio of the perpendicularly
injected fuel to the total fuel. Fuel from the strut ignited at a lower air temperature than
that from the wall in both the autoignition and the forced ignition conditions. The twin
plasma torches with pilot injection could ignite perpendicular fuel jets of both paths
without time lag, and they could also ignite parallel jets from the base of the strut.
Ignition limits with the plasma torch were extended by increasing the pilot fuel flow rate.
Flame stabilization and combustion, along with wall friction and heat-transfer
losses, are the major processes of concern in the supersonic combustor in addition to the
fuel injection and mixing processes. Flame stabilization and combustion are intimately
tied to the fuel injection, vaporization, mixing, and ignition processes as well as
combustor geometry. As such, just about all of the experimental combustion data
available are configuration dependent. Thus, flame stabilization is achieved by using a
rearward-facing step and efficient combustion by initially eliminating and finally
restricting the acceleration (or expansion) rate of the flow to prevent quenching of the
reactions over a wide range o f initial conditions [11].
Using the rearward-facing step in the supersonic combustors and injecting the fuel
perpendicular or at least inclined to the main air flow have the advantage of holding the
flame because of the existence of the separated and recirculating regions in the flow field
as depicted in Fig. 2.4. This can help in solving, in part, the complication o f holding the
flame in supersonic engines due to the fact that the flow in such engines is not premixed
which means that if bluff bodies are to be used as fiame-holders they have to be large.
This is highly undesirable in supersonic combustors due to very high drag. Therefore, this
problem of flame holding could be solved using the rearward-facing steps in the
combustors and/or the perpendicular fuel injection. This issue emphasizes the importance
of flow field details around the fuel injectors [24].
Segal et al. [56] conducted an experimental study of transverse hydrogen injection
and combustion behind a reward-facing step into a Mach 2 high temperature clean-air.
The experiment was conducted in an electrically heated (not vitiated), continuous-flow
facility to evaluate the effects o f initial conditions and analyze the interaction between
mixing and combustion in supersonic reacting flows. This work and the earlier non
Reproduced with permission of the copyright owner. Further reproduction prohibited without permission.

14
reacting data for the same combustor reported in [57] provide new experimental data for
supersonic combustion o f hydrogen using clean air. Matsuo and Mizomoto [5] studied
the flow structure of supersonic flow o f Mach 2.5 past a backward-facing step with
perpendicular sonic injection from the bottom wall. They examined the effect of both the
step height and dynamic pressure ratio of the je t flow to the main flow using the perfect
gas condition in two-dimensional space. The effect o f Hi-transverse injection on the
characteristics of the flow Held was investigated numerically by Berman et al. [58] using
both adiabatic and constant temperature wall boundary conditions.
The experimental study of Jian-Guo et al. [59] concluded that the 90° rearward-
facing step enhances the mixing pattern of the kerosene-hydrogen dual fuel system in
comparison to that of the 45° step. This is attributed to the lower recovery temperature in
the 45° step case, which leads to the poorer mixing of the pilot hydrogen and the
supersonic air. It needed more hydrogen to produce enough radicals to ignite the kerosene
spray.
The flow over a ramp induces a pair of counter-rotating stream-wise vortices as
shown in Fig. 2.5 [60]. Supersonic flow over a ramp generates both shock and expansion
waves. This leads to the generation of the vorticity by baroclinic torque. Baroclinic
torque is exerted on a fluid flow whenever the density and pressure gradients are not
parallel [61]. Numerous ramp designs have been investigated. In the work o f Stouffer et
al. [62] an array o f compression and expansion style ramps were investigated whose
geometry is shown in Fig. 2.6. In these studies, hydrogen was used as the fuel and air as
the oxidizer. In these concepts, rapid turns in geometry induce formation o f shocks,
which for compression ramps occur at the base and for expansion ramps at the trough.
Dramatic differences were found in mixing and combustion efficiency between these two
styles. It is well known that, for the same ramp angle, vorticity shed from a compression
ramp induces much stronger vorticity than that from an expansion ramps due to
differences in projected stream area. Despite significantly improved fuel/air mixing from
the compression ramps, the expansion ramps achieved higher combustion efficiency. This
result may be expected because good combustion efficiency is achieved with mixing at
small scales. The extremely strong vorticity o f the compression style ramp, while
Reproduced with permission of the copyright owner. Further reproduction prohibited without permission.

15
increasing the fuel/air contact area also provides a centrifuge that diminishes opportunity
for mixing.
Ramp fuel injectors have also been designed with sweep to control shock and
expansion waves. Tests conducted at NASA Langley Research Center show that
combustion efficiency of swept ramp injectors is much improved compared to those
without sweep. The ramp with sweep approaches the combustion efficiency that is
achieved with normal injection. The effect of ramp sweep was numerically investigated
by Drummond, et al. [63] and Donohue et al. [29], who also performed experimental
planar laser induced iodine fluorescence measurements. Their calculations confirm the
importance o f using sweep for the ramp injectors.
There are a number of studies specifically related to the 3-D mixing flow field of
ramp injectors. Hartfield et al. [64] presented measurements o f injectant mole fraction in
the flow field o f a swept ramp with air injection using the same technique used by
Donohue [33]. The results illustrated the strong effect that ramp generated vortices have
on the mixing process. Waitz et al. [65] presented both numerical simulations and
experimental measurements of total pressure and fuel concentration for helium injection
behind an unswept ramp, which added the effect of baroclinic vortex generation when a
low density fuel is used. Riggins et al. [66] presented numerical simulations of the mixing
flow fields o f both swept and unswept ramps with hydrogen injection into high
temperature air and went on to calculate the reacting flow field as well using the SPARK
code. The study showed substantially higher mixing as well as flow losses for the swept
ramp case. It also showed increased penetration and spreading of the jet plume in the
reaction case. Daso and Gross [67] computed the flow field behind swept and unswept
ramps with air injection using the USA code and illustrated how side sweep of the ramp
significandy increased the mixing downstream. A numerical study designed to
investigate the relative importance of ramp generated vortices vs. baroclinic vorticity on
supersonic mixing behind swept ramps was performed by Donohue et al. [68].
An experimental investigation was conducted by Fuller et al. [691 to compare the
performance of the aero-ramp injector with a physical ramp injector to enhance mixing in
supersonic flow. The scope o f the investigation focused on jet penetration, mixing
characteristics, and total pressure losses. The aero-ramp exhibited a significant increase
Reproduced with permission of the copyright owner. Further reproduction prohibited without permission.

16
in je t penetration when the jet-to-free stream, flux ratio was increased from 1.0 to 2.0;
however, the physical ramp showed very little change. The aero-ramp produced superior
mixing in the near field and slightly less than comparable mixing in the far field. Thus,
the mixing performance decreased with increasing jet momentum for the physical ramp
while it increased for the aero-ramp. The pressure losses induced by the physical ramp
were more severe.
A numerical parametric study of the cantilevered ramp injector for various
geometric parameters was conducted by Schumacher and Sislian [70]. Unlike the
conventional ramp injectors, the sweeping of the sidewalls o f the cantilevered ramp
injector does not translate into appreciably superior mixing performance, due mainly to
the increased strength of the reflected shock, which drives the fuel jet to the lower wall
into regions of low vorticity.
Cox et al. [71] proposed a new injector concept for secondary gaseous injection
into a supersonic crossflow to improve the fuel/air mixing. The basic idea is to arrange an
array of flush-wall injectors in such a way as to induce large vortical structures in the
main stream to increase entrainment and mixing. Both the experimental and
computational results they got demonstrated the creation o f large-scale vortices in the
mixing region, as intended.
Shock waves have been used to enhance mixing. The fuel is injected in the intake
region where the temperature and pressure are sufficiently low so that combustion does
not occur. By injecting in the intake region, the fuel has time to mix before its pressure
and temperature are finally raised as it enters the combustion chamber. This increase in
pressure and temperature is generated by passing a chock through the mixture.
Buttsworth [72] demonstrated that shock cannot only be used to promote ignition, but
they can also be used to generate vorticity as they cross the fuel-air mixing region, and,
thus, can be used to enhance mixing.
It is understood that there exists a strong interaction between mixing and
combustion, even in the limiting cases when one or the other becomes rate controlling.
Due to this coupling, observations from mixing in non-reacting flows are hard to extend
directly to reacting flows. Furthermore, in many practical situations, the Damkohler
number, defined as the ratio between the characteristic fluid residence time in the reaction
Reproduced with permission of the copyright owner. Further reproduction prohibited without permission.

17
zone and the chemical reaction time scale, is 0(1). In such cases, the flow field may
become either mixing or kinetic limited in localized regions; however, in general,
combustion takes place in thick, highly turbulent burning regions. The mean and time
varying parameters responsible for mixing are affected by heat release, which, in turn,
affect the chemical kinetics; thus, mixing and combustion become closely coupled [56].
When heat release effects are included, significant modifications o f the turbulent
structures occur. It has been indicated that the heat released from chemical reactions both
generates and suppresses turbulence. It is shown that the turbulent dilation and viscous
dissipation in flames reduce small-scale turbulence, while the shear gradient effects,
mainly of pressure and density, generate new large-scale structures [21].
The effect o f small-scale turbulence on the mixing process in high-speed flows
requires more detailed investigation. In particular, mixing at a molecular level, which
indicates the ability to initiate chemical reactions, is of great interest. Concentration
distribution is not sufficient to provide this information. Although it is recognized that a
reacting flow field is substantially modified once exothermic reactions take place, mixing
of non-reacting flows needs further investigation to provide further insight o f the
characteristics o f the micro-mixing processes [21].
The effect of the chemical reaction on the flow field characteristics of the normal
injection of sonic hydrogen downstream of a rearward-facing step in supersonic airstream
was investigated in [73]. The comparison between the non-reacting and reacting flow
fields showed that the combustion heat release precluded the flow expansion around the
step edge; instead, the released heat was sufficient to cause a shock compression of the
main flow immediately behind the step. The reacting jet has a completely different
structure. In the non-reacting case, the je t has the characteristic barrel shape of an
underexpanded jet, ending with a normal shock. Because o f the heat release, the fuel jet
penetrate sufficiently deeper into the main flow, approximately 80% more than in the
non-reacting situation.
The effect o f the heat released by combustion on the fuel/air mixing distribution
in the supersonic reacting flow field was studied experimentally by Abbitt et al. [74].
Hydrogen was injected transversely as staged, underexpanded jets behind a rearward-
facing step into a ducted Mach 2 air free stream. The pressure rise associated with the
Reproduced with permission of the copyright owner. Further reproduction prohibited without permission.

18
heat release involved in the reaction forces a rapid lateral displacement of the fuel
towards the side walls. A large amount of burning, therefore, occurs on the side walls.
This would suggest that the mixing distributions observed in the non-reacting flow field
was greatly altered. The wall limited the amount of spreading that would otherwise occur,
and possibly induced some recirculation or deceleration of the flow, which could aid in
flame holding.
Effervescent (or aerated-liquid, or barbotaged) atomization, characterized by
introducing gas bubbles directly into a liquid flow immediately upstream o f the injector
orifice to generate a two-phase flow, has been extensively studied for quiescent
environments [75-78]. Depending on the amount o f gases added into the liquid jet, two
primary mechanisms generate small droplets in the effervescent atomization process. It
has been observed that droplet size could be reduced as the amount of gas added to the
liquid flow increased. Based on this observation, there is considerable interest in
examining the role of effervescent atomization in enhancing the mixing and vaporization
processes in a scramjet combustor [79,80].
In their recent work on the atomization performance of aerated-liquid jets, Lin et
al. [81] applied the effervescent atomization technique to the problem of fuel injection
into a supersonic crossflow. The spray penetration heights of aerated-liquid jets were
studied experimentally using wide ranges of liquid properties, nozzle orifice diameters,
jet-to-air momentum flux ratios, and barbotage gas-to-liquid mass ratios. Two different
modes of spray structures for aerated-liquid jetrs in supersonic crossflows were identified
- pure liquid mode spray and barbotage mode spray. It was observed that the overall
breakup process for pure liquid mode spray is slow and that greater axial distance is
required to generate fine droplets. On the other hand, liquid breakup processes for
barbotage mode spray occur immediately after or even before the liquid is discharged.
This is primarily due to the highly turbulent features o f this inhomogeneous two-phase
flow and the expansion caused by high-pressure barbotage gas. These two modes o f spray
appear randomly and alternatively for low levels o f barbotage [41].
Avrashkov et al. [82] developed a system for the kerosene injection into a
supersonic flow. This system is based on two main principles: firstly, the use of tubular
micropylons, and, secondly, the saturation o f fuel with gas bubbles. The use of
Reproduced with permission of the copyright owner. Further reproduction prohibited without permission.

L9
micropylon allows to arrange uniformly the fuel jets in the flow and to increase
considerably their number. Immediately before the liquid kerosene injection, the
saturation of fuel with gas bubbles (i.e., the bargotage) is made. On the whole, the use of
tubular micropylons and liquid fuel bubbling permit to increase significantly the process
o f mixture formation under conditions o f supersonic flow.
Critical issues regarding fuel injection and mixing in a scramjet combustor are
discussed in details in the literature [6,83,84].
2.3 Auto and Forced Ignition
Ignition delays of conventional hydrocarbon fuels must be significantly reduced
for successful supersonic combustion [85,86].
McClinton [87] showed that combination of the step-base and the perpendicular
injection downstream of the step was effective in enhancing the ignition ability. The
effect o f a variety of parameters on the autoignition behavior was studied. The free-
stream total temperature, wall temperature, and wall boundary layer energy deficiency
have the greatest impact on autoignition. Injectors located within three step heights
downstream of a step are shown to have very poor autoignition characteristics. But when
the injectors are moved downstream, autoigition behavior is improved. Sweeping the step
and fuel temperature produced only slight changes in autoiginition behavior. Injection
angle was shown to have a significant impact on autoigntion: upstream injection
improved ignition, and downstream angled injection impaired autoignition. Huber et al.
[88] suggested possible autoignition source in the supersonic combustors and proposed a
simple model to predict ignition limits in typical combustors. These candidates are the
base region behind steps and struts, recirculation regions upstream of the fuel jets injected
perpendicular to the airflow, and the stagnant region behind the bow shocks upstream of
the fuel jets. The study reported that autoignition of fuel from struts occurred easier than
that from the wall because the strut had a thinner boundary layer that resulted in a higher
surface temperature than the wall.
Tomioka et al. [891 investigated the flow field at pre-ignition phase in a
supersonic combustor with perpendicular injections behind a backward-facing step to
understand the mechanism o f the ignition enhancement observed in the ignition tests with
the same combustor. It was concluded that the interaction o f the separation region
Reproduced with permission of the copyright owner. Further reproduction prohibited without permission.

20
upstream of the fuel j e t and. the two-dimensional step base-recirculating region, namely
the merging o f these two regions, caused enlargement of the ignition region and the
enhancement of the ignition ability. Ignition parameters were compared for the cases with
and without the step. As a result, the interacted region in case with the step was found to
be more preferable ignition source due to its enlarged size.
Autoignition o f hydrogen fuel injected into a scramjet combustor does not occur
at low flight Mach number and an igniter is required [87,90]. Several kinds o f igniters
[91-95], have been tested. Among them, a plasma torch is one o f the most promising
igniters for a supersonic combustor. It is not pyrophoric, toxic, or corrosive, and it is safe
and reliable to use in a propulsion system of the aerospace plane [94]. Kimura et al. [95]
first applied the plasma torch to ignite a fuel jet in supersonic airstream. Northam,
O’Brien, and their associates found that an argon-hydrogen plasma torch is an effective
igniter [96] and developed an uncooled long duration torch [97]. They showed a strong
sensitivity of the plasma igniter performance to the combustor geometry and/or fuel
distribution, and designed a new injector suitable for the plasma igniter [98,99]. Sato et
al. [100] developed and tested a new plasma torch with oxygen or air as a feedstock,
which may be advantageous from the view point of the total aerospace plane system.
The effects of various operational parameters of plasma torches as well as
combustor geometry and fuel injection location of the ignition of hydrogen were
experimentally studied in supersonic combustor by Masuya et al. [94]. The ignition
temperature was found almost linearly decreased as the input electric power increased.
Adding small fraction o f hydrogen to the argon plasma torch igniter was found to
increase its effectiveness. The chemical effect of the plasma torch was considered to be
the main reason of this improvement.
Two simultaneous ignition sources, a spark plug and a plasma torch mounted in
the cavity floor, were used in the combustion o f liquid JP-7 in the scramjet USAF
combustor used by Mathur et al. [41]. It was noticed that turning off the ignition sources
in the cavity did not have any detrimental effect on the combustion.
The issue o f the ignition delay of hydrocarbon endothermic fuels was investigated
by Hawthorn and Nixon [1011. They studied the ignition delay o f propane-air and
methycyclohexane-air mixtures and compared them to hydrogen-air and methane-air
Reproduced with permission of the copyright owner. Further reproduction prohibited without permission.

21
mixtures. It was found that the ignition delays of propane and methycyclohexane fuels
are greater than those for hydrogen at temperatures below 1800 F, but significantly lower
than those for methane. For temperatures above 1800 F, it appears that these
hydrocarbons may have ignition delays comparable to that of hydrogen.
The ignition delay o f RP-l (kerosene) was reduced by adding an accelerant
(Alex® nano aluminum powder) as indicated in the work of Tepper and Kaledin [102].
This accelerant was found to reduce the ignition delay, while increasing the volumetric
energy density of the hydrocarbon, which is an added benefit.
Ignition characteristics of a scramjet combustor with a strut may be different from
those without a strut. The ignition characteristics of fuel from the strut were compared
with those of fuel injected only from the walls [90,94,100]. Installation of struts divide
the combustor into several flow paths, ignition o f fuel jets in each flow path would occur
independently. At least one igniter should be attached on each stream tube [55].
2.4 Vitiated and Clean Incoming A ir
In order to provide the proper ground-based facilities for testing the supersonic
combustors, the test stagnation conditions must be on the level that matches the flight
conditions. Therefore, it is necessary to heat the incoming supersonic air. Typical heating
techniques used to generate this high enthalpy include electric arcs, combustion of
hydrogen or methane fuels in air with oxygen replenishment, or storage heaters. The use
o f an electric arc heater results in air dissociation and the generation of significant
amount o f nitrogen oxides, as well as a depletion in the net level o f oxygen below 21%
by volume. In combustion heaters, the flow constituents are a function of the fuel used;
for example, with hydrogen burner H2O is a primary contaminant, or with a methane
heater a combination of both H2O and CO2 are the primary contaminants. Due to the
presence o f these test flow contaminants, the combustion characteristics in a ramjet or
scramjet engine can potentially be different than results obtained in clean air or actual
flight [1031.
Differences between testing in air and vitiated air could be due to differences in
thermodynamic properties and chemical kinetic effects. Thermodynamic effects include
differences between the heat capacities o f H2O and CO2 compared to N2. The heat
capacities for both HiO and CO2 are substantially higher than N2. Therefore, for the same
Reproduced with permission of the copyright owner. Further reproduction prohibited without permission.

22
amount o f water formed, the temperature rise in vitiated air will be less than that in air.
The temperature rise in vitiated air would also be less than that in air due to dissociation
of some o f the additional H2O in the vitiated air. Chemical kinetic effects wilL also be
different due to the presence of CO2 and additional H2O in the vitiated air as well as
additional chemical kinetic reaction [104].
Various studies, [105-110], have explored the effect of NO, HiO, and CO2
contaminants on combustion processes, primarily with hydrogen fuel with application to
hypersonic propulsion systems. These include both experimental and computational
studies. A general trend from these works is that H2O and CO2 have a minimal influence
on the kinetics of hydrogen-air combustion while NO serves to reduce both ignition and
reaction times. The range o f temperature and pressure investigated and the database with
fuels other than hydrogen are limited. Lai and Thomas [103] investigated numerically the
effect of NO, H2O and a combination o f H2O and CO2 on combustion of various fuels
including hydrogen, ethane and methane with air. Srinivasan and Erickson [110] studied
the influence o f the effects of vitiation for a relatively simple flow configuration but with
a full 3-D computational flow model including mixing, frnite-rate reactions, and
appropriate thermodynamic properties. Srinivasan and Erickson [104] used the same
simple 3-D combustor model to simulate the influence of vitiated air, as compared to air,
in the combustion of hydrogen injected at an angle of 30° into a confined supersonic flow
with equivalence ratio approaching unity. Computations have been made for air and
vitiated air with the same set o f initial (except for the molar composition) and boundary
conditions. Many numerical works have reported the effect o f vitiated air via H2O and
radicals. Bakos and Morgan [111] conducted an experimental and numerical
investigation to study the effects of test air contamination by atomic oxygen on hydrogen
fueled scramjet combustion in hypervelocity environments with Mach 5 test flow.
In the past, many researchers have used vitiated air, numerically and
experimentally, to calculate ignition delay time, ignition temperature, and combustion
efficiency. Experimentally, vitiation often occurs in chemically heated facilities, in the
form o f water vapor or hydrocarbons reaction products. Mitani et al. [112] investigated
experimentally the effect of vitiation on the combustion performance of scramjet engines
a t Mach 6. Both Vitiated Air Heater (VAH, V-mode) and Storage Air Heater (SAH, S-
Reproduced with permission of the copyright owner. Further reproduction prohibited without permission.

24
radical pool, which could decrease the overall timescales of hydrocarbon consumption*
Furthermore, endothermic fuel reactions can be expected to improve the fuel’s
combustion properties, if for no other reason than the fuel enters m a hot vaporized state.
Moreover, the mixing length o f a supersonic combustor is theoretically proportional to
the square root o f the molecular weight of the fuel. Therefore, the large amounts o f
hydrogen generated from endothermic reactions such as reforming might also be
expected to also improve the fuel’s combustion properties [119].
Quite a large number o f liquid fuels and fuel pilots for scramjets have been tested
in connected-pipe combustor and free-jet engine tests [120-124] in an attempt to find a
fuel that is energy-density efficient, would bum to near completion in the residence times
available (typically < 1.5 ms), and also be logistically suitable. Unfortunately, those fuels,
fuel blends, and pilots that did perform well were not logistically suitable, i.e., they
contained toxic, pyrophoric, or carcinogenic components that were unacceptable.
Monopropellant pilots, which are logistically suitable, were also tested, but could not
sustain the desired degree of heat release [125]. Thus, there still exist a need to develop a
high-energy density, storable liquid fuel or fuel that is both highly reactive and safe [14].
Silane (SiHO is a pyrophoric gas that can be added to hydrogen to decrease
ignition delay times of the fuel. Morris [126] made an experimental investigation into the
ignition limits o f different mixtures of silane and hydrogen. It was concluded that silane
is a useful additive to produce ignition in hydrogen when the intake temperature o f the
combustion chamber are below that where spontaneous combustion o f hydrogen would
normally occur. Furthermore, the addition of silane will also decrease the ignition delay
time.
2.5.1 The Problem of Cooling In High-Speed Vehicles and The Role of FuelAs air breathing-engine-propelled vehicle speeds increase, thermal problems
multiply because o f the effect of stagnation temperature. While total cooling needs
increase, the most critical regions are the leading edges and the engines. Although
thermal effects can be somewhat accommodated by improved materials and passive
cooling, sustained hypersonic flight in the atmosphere requires a substantial heat sink.
Compared to a mechanical refrigeration system or a non-combustible coolant, the fuel is
the best source o f cooling [127].
Reproduced with permission of the copyright owner. Further reproduction prohibited without permission.

25
la the high Mach number region of the flight envelope (M>4), aerodynamic
heating is too great for conventional structural materials to survive without active
cooling. The fuel not only must have a good heat-of-combustion but also must provide
the necessary heat sink for the cooling system [128].
Higher aircraft speeds also have a direct impact on the operating environment a
jet fuel will encounter. The higher speeds mean higher air stagnation temperatures, which
increase the aircraft cooling requirements and prevents the use of air as a coolant. Thus,
increasing engine thrust-to-weight ratio and aircraft speed result in large heat loads thatt
must be managed with the main coolant available on the aircraft—the fuel [129].
The fuel in modem military aircraft is the primary coolant for on-board heat
sources. It is used to cool aircraft components such as the engine lubricant oil, hydraulic
fluid, environmental control system (ECS), avionics and electrical systems, and at high
Mach numbers, the airframe. As aircraft and engine technology have advanced from the
F-4 to tomorrow’s advanced fighter, the heat sink requirements of the fuel have increased
significantly. The engine is the main heat source for the aircraft at Mach 3 and below, but
the ECS is becoming an increasingly important part of the heat management problem.
Fuels used in high-speed aircraft will have to absorb large amounts of excess heat for
aircraft thermal management purposes. This will result in the fuels being heated to
supercritical conditions [129].
Fuel is circulated through hot sections of the aircraft, usually back into the tanks,
and finally to the engine where it is burned. This "recuperative" approach has the benefit
that thermal energy dumped into the fuel is then eventually recovered as additional thrust
[130].
2.5.2 Endothermic Fuels, The Promising Fuel for Hypersonic Combustion SystemsDefinitions of and differences between cryogenic and endothermic systems: The
"Cryogenic,r fuels are the fuels that have a negative, less than zero, "Boiling Point."
Therefore, in order to use these fuels as liquids, they must be cooled beyond the boiling
point and storage environments must satisfy this condition. Examples for the cryogenic
fuels and their corresponding boiling point temperature are the liquid hydrogen H2 (-423
F) and liquid methane CH4 (-259 F).
Reproduced with permission of the copyright owner. Further reproduction prohibited without permission.

' £ -■ f - ' r ' - \ g ' r • 7-
26
The "endothermic" fuels are the fuels that extract heat while forming from their
initial components. Therefore, the decomposition of these fuels into the initial
components requires energy for its accomplishment and by that a quantity of heat can be
absorbed from the surrounding environment causing the required thermal loading
management of the vehicle. An example for the endothermic fuels is the
methylcyclohexane MCH (C6H1CH3). The boiling point of MCH is 213 F, which means
that it is a liquid in the normal ambient conditions.
Crvoeenic fuels: advantages and disadvantages: The cryogenic fuels have high energy
contents and thermal tolerance. Figure 2.7 shows that hydrogen has almost three times
higher energy per unit mass than other fuels [130].
The temperature limit of a fuel is a key consideration for its selection as a high
speed transport fuel. Figure 2.8 shows that hydrogen has the highest temperature limit
over other fuels [130]. On the other hand, Fig. 2.9 indicates that cryogenic fuels have
relatively poor energy contents per unit volume, which is an undesirable property that is
magnified by their storage requirements [130].
Cryogenic fuels must be viewed with extreme caution because of the severe
constraints that they place on the design of the aircraft and because of the high cost of
transporting, storing, and delivering them. Hydrogen or methane handling facilities at
just a few U.S. airports would be very costly to install and. maintain, and of course these
fuels raise serious safety questions. From the military standpoint, cryogenic fuels appear
impractical because, again, military operations must not be tendered by a need for costly
and exotic infrastructures, and by all means not by an uncertain and vulnerable supply of
mobility fuels. Nevertheless, serious consideration is being given to such option and it is
possible that successful large-scale applications using hydrogen or methane might
eventually be developed [130].
Endothermic fuels: the phenomenon and advantages: An innovative approach based on
more conventional types o f fuels takes advantage of the fact that some hydrocarbons,
when they degrade at high temperatures, do so cleanly, i.e., without forming
carbonaceous surface deposits. Instead, they break down to smaller hydrocarbons that are
then circulated to the combustor. The chemical breakdown itself absorbs heat, thus
providing another useful thermal management process. A number of these "endothermic"
Reproduced with permission of the copyright owner. Further reproduction prohibited without permission.

27
fuels are known, and some are under serious study. All of the known endothermic fuel
reactions require a catalyst to make them proceed and absorb extra heat at moderate
temperatures. Hence, variants such as the catalytic heat exchanger are being considered in
future aircraft concepts. While the endothermic fuel technique introduces a new element
of complexity into aircraft design (and particularly new maintenance requirements and
reliability concerns), it has obvious advantages over the use o f cryogenic fuels. There are
indications that, free of certain environmental and chemical influences, most
hydrocarbons tend to have good high-temperature tolerance [130].
Cryogenic fuels can contribute only sensible and latent heat, whereas certain
hydrocarbon fuels can in addition provide cooling through endothermic reactions.
Hydrocarbons can undergo both thermal and catalytic reactions. Theoretically, the total
heat-sink capacities for hydrocarbon fuels range from about 50% to 112% of the cooling
capacity of hydrogen (on a "%" heat of combustion basis) with laboratory proven
capabilities up to about 85 % [127].
One example of an endothermic reaction is the dehydrogeneration of
methylcyclohexane to toluene and hydrogen as shown here:
C-jH h ->C7Hs +3H, (2.1)
This reaction, which has a chemical endotherm of 940 Btu/lb, was identified as a
potential source of cooling in earlier investigations of endothermic fuels. However, a
catalyst is required for this reaction to occur at a rate that will produce the necessary
cooling. Catalysts composed of platinum supported on high surface area alumina have
been shown, to work well in this application [131,132].
The cracking reactions, which convert high molecular weight paraffins into
mixtures o f lighter olefins and paraffins, can be conducted either with or without solid
catalysts. Catalytic cracking is carried out at relatively low temperatures, 400-550°C, in
the presence of acidic compounds such as zeolites [133]. Thermal cracking, on the other
hand, is a gas phase reaction and requires higher temperatures, above 500°C, for the
reaction to occur at useful rates. Although catalytic cracking and thermal cracking
reactions both produce a mixture of low molecular weigh hydrocarbons; they occur by
different mechanisms and result in different product distributions. The catalytic
mechanism occurs by way of carbenium ion intermediates on the catalyst surface and
Reproduced with permission of the copyright owner. Further reproduction prohibited without permission.

produces high concentrations o f C3 and C* products and very few Ci and Cz products. On
the other hand, the thermal cracking reaction occurs by a free radical mechanism and
results in high concentrations o f C2 and C3 compounds [134].
h i the laboratory investigations o f Wickham et al. [134] the effect o f adding a
chemical initiator on the rate of thermal cracking o f both normal and isoparaffin fuels. It
was found that at all temperatures the addition of up to 2 wt% percent of the initiator
produced measurable increases in cracking rate. For example at 500°C, this initiator
increased the rate of n-heptane cracking by a factor of six, whereas at 550°C the initiator
produced over a factor o f two improvements in rate. It was found that the initiator only
accelerates the cracking rate and does not alter the overall thermal cracking mechanism.
The thermal decomposition o f three high-energy density hydrocarbon fuels; RIM,
JP-10, and quadricyclane was examined by Wohlwend et al. [135]. Stability
measurements performed in this study indicated that RP-a was the most stable at the
conditions investigated, followed closely by JP-10. Quadricyclane is the least stable,
degrading at relatively low temperatures compared to Jp-10 and RP-1. It was concluded
that quadricyclane would not be a capable pf providing significant fuel system cooling
(due to its thermal instability) if reaction times or temperature were excessive.
The endothermic fuels have the following technical, commercial, and safety
advantages:
Continued availability
Relatively inexpensive
Condensed phase under standard temperature and pressure (STP)
Higher latent heat o f vaporization
Safe handling and storage
High energy content per unit volume
No ignition limitations under subsonic combustion conditions
Non-cryogenic;
Insulation not required
Vapor recovery not required
Conventional Army/Commercial (A/C) fuel system
A/C turn-around time not governed by fuel
permission of the copyright owner. Further reproduction prohibited without permission.

29
Conventional fuel handling/logistics;
Off-site production
Launch side hardening easier
Available enabling technologies
Potentially smaller vehicles
Hydrogen has very low density, and it has boil-off problems, leading to packaging
challenges that derive up structural mass and required overall volume for a given mission.
Cryogenics such as hydrogen and methane will also have obvious handling problems. In
contrast, hydrocarbons are slower burning and have between two-fifth and oneOthird the
energy per unit mass compared to hydrogen; however, with up to 11 times the storage
density, they have over 3.5 times more energy content per unit volume [136]. The
properties of various hydrocarbons are summarized in Table 2.1, contrasted with
cryogenic hydrogen in both liquid and slush form, [137-140]. Hydrocarbons contain
approximately 15-20% hydrogen, and so they actually store hydrogen at up to twice the
density of pure cryogenic hydrogen [141].
Conventional hydrocarbon fuels can be divided into two basic categories:
methane, with energy density of 50 MJ/kg and specific gravity of about 0.4 (and also
cryogenic storage requirements), and the JP hydrocarbons, with nearly twice the density
but only 40 MJ/kg specific energy content. Interestingly, even endothermic fuels such as
methylcyclohexane (MCH) have about the same storage properties and combustion
energy content as the JP fuels, through they may have advantages in recuperating
combustion heat. Hydrogen as either liquid or slush has about the same energy content,
with a slight difference due to the heat o f fusion, but slush has about a 15% higher
density than the liquid form.
Clear technological, economical, and operational advantages exist when liquid
hydrocarbon fuels, such as kerosene, are used in comparison with hydrogen-based
systems for the development of small hypersonic vehicles. However, the flow features in
a supersonic ramjet combustor, primarily the short residence time of a fuel-air mixture,
which is <10'3 S, along with the multistage physical-chemical mechanism of liquid
hydrocarbon fuel burning, increase the difficulties of ignition and flame stabilization. If
the selected fuel is amenable to operate at supercritical conditions, a significant decrease
Reproduced with permission of the copyright owner. Further reproduction prohibited without permission.

30
in the time required for the liquid fuel breakup and vaporization can be achieved. Further,
if chemical decomposition accompanies these transformations, the potential formation of
hydrogen or other active radicals will result in increased reactivity o f the mixture and a
reduction in the combustion length [142].
Moreover, endothermic fuel reactions can be expected to improve the fuel’s
combustion properties, if for no other reason than that the fuel enters in a hot, vaporized
state. Furthermore, the mixing length of the supersonic combustor is inversely
proportional to the gas diffusion coefficient [22]. The gas diffusion coefficient is in turn
inversely proportional to the square root of the molecular weight of the diffusing
components. Therefore, the large amounts of hydrogen generated from endothermic
reactions such as reforming might also be expected to improve the fuel combustion
characteristics by lowering the average fuel molecular weight [143].
The use of hydrocarbon fuels in volume limited systems will require an ignitor
and some form of combustion enhancement. One approach is to use part o f the air to bum
all o f the fuel in a subsonic pre-burner. Another approach is to use form of pyrophoric
material as an ignitor at low temperatures and a flame-holder or combustion enhancement
aid at high temperatures where residence times become shorter and kinetics dominates
the flame propagation [14].
Over the past 15 years a significant amount of experimental research work has
been done on the injector performance and combustion stability using kerosene (RP-1)
as the fuel of rockets. This work encompassed a large variety of injection schemes,
chamber dimensions, and operating conditions [144].
In the analysis conducted by Lewis [141] the fundamental question of whether the
packaging benefits o f high-density hydrocarbon fuels outweigh the high-energy content
of hydrogen fuels. For a cruiser operating in the Mach 8-10 corridor, in which it is
desired to maximize cruise range for a given total takeoff weight, the results seems to be
that the aerodynamic and volumetric advantages o f storable hydrocarbons are about
equivalent or superior to the specific impulse (Isp) advantages of hydrogen in determining
cruise range.
In the work of Edwards and Maurice [119], several hydrocarbon fuels/fuel
systems challenges for hypersonic cruise and space access vehicles were discussed under
Reproduced with permission of the copyright owner. Further reproduction prohibited without permission.

31
the HyTech program. These challenges include extension of fuel heat sink capability,
improvement of hydrocarbon combustion properties, fuel system fouling mitigation, and
fuel system integration.
Heneghan et al. [145] developed a high-thermal-stability JP-8+100 hydrocarbon
fuel, which provides a 55°C (100F) increase in the bulk maximum temperature (from
325F to 425F) and improves the heat sink capability by 50-percent over conventional JP-
8 fuel.
A general purpose CFD model has been proposed by Zhou and Krishnan [146] for
the heat/mass transfer analysis o f endothermic fuel flows under high pressures and
heterogeneous catalysis mechanisms. This model was incorporated into a multi
dimensional CFD code, CFD-ACE. The model was demonstrated for the catalytic
endothermic reaction of MCH dehydrogeneration to Toluene.
Special attention is directed towards the simulation of the combustion flow field
of gaseous methane and gaseous ethylene which are considered to be the light-
hydrocarbon fuels resulting from the cracking of the heavy-hydrocarbon fuel, kerosene.
Ethylene C2H4 is a primary fuel itself and is also produced in large amounts
during the combustion of methane CH4, ethane C2H6 and other higher hydrocarbons
[147]. Ethylene is chosen in the hydrocarbon-fueled scramjet engines because it is used
as a surrogate test fuel for hydrocarbon fuels.
Sun et al. [148] investigated experimentally the effects of the equivalence ratio
and static temperature of premixed air-gasoline mainstream on the flame propagation
speed and ignition delay.
In the experimental work of Vinogradov et al. [149], liquid JP and gaseous
ethylene were injected in the isolator upstream of the combustion chamber in a Mach 1.6
airflow behind a thin pylon to determine the ability o f the pylon to improve penetration
and mixing. The liquid fuel injection behind the pylon increased the fuel penetration to be
entrained by the high velocity airflow core resulting in improved mixing, offering the
possibility of reduced combustion chamber length. Injecting behind the pylon increased
the normalized wall pressure distribution indicating higher rates o f heat release in the far
field as an indication of improved combustion efficiency. The behind-pylon ethylene
injection indicated a substantial increase in penetration over the basic wall injection case.
Reproduced with permission of the copyright owner. Further reproduction prohibited without permission.

33
2.6 Flame Holding Mechanisms For Liquid Hydrocarbon CombustionFuel-air mixing, flame holding, pressure losses, and thermal loading are among
the major issues that need to be resolved for the successful design and implementation of
hydrocarbon-fueled supersonic combustion ramjet (scramjet) engines. A need exists for
the development of a system that effectively integrates fuel injection and flame holding
for supersonic combustion [152]. A study by Yu et al. [153] in an unheated Mach 2 flow,
with fuel injection upstream of a variable cavity length-to-depth ratio (L/D), suggested
that small-aspect-ratio cavities provide better flame holding capability than longer
cavities with inclined aft ramp angles.
In the experimental study of Mathur et al. [152] the cavity-based flame-holder
with low-angle flush wall fuel injection upstream of the cavity was successfully
demonstrated in a model scramjet combustor using gaseous ethylene. The study showed
that ignition and combustion produced a precombustion shock train, resulting in dual
mode combustor operation. The shock train became stronger and the starting location of
the shock train moved progressively upstream with increasing fuel-air equivalence ratio.
The cavity-based flame holding concept proved very effective over a wide range of
operating conditions and combustor fuel-air equivalence ratios.
The cavity can be used to set up a pilot flame reducing the induction time
associated with ignition of fuel-air mixture. Such a method can be useful for maintaining
stable flame holding at low equivalence ratio in scramjet operation or minimizing the
effect of shock trains. In the work of Situ et al. [154], the preliminary tests o f fuel-rich
hot gas as reacting jets were performed without liquid fuel jets. A dual cavity was
employed as the main flame holding mechanism. The pilot energy of fuel-rich hot gas
injected into the supersonic combustor was produced by a dependent pre-burner. The
kerosene in the pre-burner was ignited to produce fuel-rich hot gas, which was discharged
via six injectors divided equally into two groups: right upstream of the first cavity pointed
at 35 degrees with respect to the bottom wall in flow direction, and at the bottom wall of
the first cavity parallel to the main stream respectively.
Another fuel-riched hot gas combustion study was conducted by Situ et al. [155].
The major goal o f the study was to investigate the characteristics o f kerosene-fueled
supersonic combustion in dual-combustors. An experimental study was carried out to
Reproduced with permission of the copyright owner. Further reproduction prohibited without permission.

34
observe the effect o f the fuel air equivalence ratio on supersonic combustion efficiency
and total pressure recovery coefficient, and to investigate where and under which
conditions the flame zone is supersonic* Liquid kerosene was injected into a semi-
dependent subsonic dump combustor* Then, the fiiel-riched hot gas was injected in
parallel to the freestream through a slot nozzle injector located at the bottom wall o f
supersonic combustor.
The results o f the early tests conducted by Kay et al. [156,157] clearly
demonstrated that the supersonic combustion of various hydrocarbon fuels could be
achieved; although for many test conditions, special externally mounted piloting devices
were required to initiate and stabilize the flame.
Bonghi et al. [158] injected liquid toluene at 5H down stream o f a step of height
H in a Mach 2.5 flow at 300 K and 1000 K using a parallel hydrogen-pilot flame.
Toluene (C6H5CH3) is on of the components of catalytically cracker methylcyclohexane
(MCH), a candidate fuel for supersonic combustion applications. Segal and Young [21]
using the same previous configuration injected the toluene from a reservoir at 300 K, and
thus, absorbed energy from the surroundings to vaporize and further heat to the local
temperature. The large recirculation region formed by hydrogen-pilot combustion extends
beyond the liquid injection station, 5H, and thus a substantial amount of the injected
liquid-reaches the region of stabilization of the pilot flame. When the amount of liquid
increases above a certain quantity, it quenches the pilot flame. The amount of liquid fluid
that can be injected without inducing quenching was found to be dependent strongly on
the equivalence ratio of the pilot flame and, in smaller proportion, on the air stagnation
temperature. It was found that as the pilot energy level increases the amount of toluene
that can be injected (while maintaining a stable flame) can also be increased. Beyond a
certain value, however, the ratio of energy levels decreases again, as more liquid is
injected and the amount that reaches the region o f stabilization o f the pilot flame
increases, inducing quenching. This effect is enhanced by the effect o f heat release on the
structure of the flow field. A larger deposition o f heat in the combustion region caused a
pressure increase followed by an enlargement o f the recirculation region and a reduction
in the local velocity, which favors upstream interaction, further facilitating the arrival of
Reproduced with permission of the copyright owner. Further reproduction prohibited without permission.

35
liquid in the recirculation region and quenching of the pilot flame. The increase in the
stable flame margin with the air stagnation temperature, T0, was evident.
Vinogradov et al. [159] used various combinations o f strut and wall injection of
both pilot-hydrogen and liquid kerosene to obtain stable combination at kerosene
equivalence ratios as low as 0.6 and pilot equivalence ratios as low as 0.1 for Mach 6
flight conditions. Bonghi et al. [158] evaluated the piloted energy needed to maintain
stable combustion of liquid toluene using a rearward-facing step as the main flame
holding mechanism with a gaseous hydrogen-pilot flame in a Mach 2.5 airflow. Kay et al.
[4] used a gaseous ethylene pilot to stabilize the combustion o f a primary fuel, injected
both upstream and downstream of the pilot, for a Mach 3 airflow.
The piloted-supersonic combustion experiments strongly recommended that
hydrogen piloting is highly effective for a variety of fuels including methane and
kerosene. A monopropellent, OTTO fuel, was successfully used as an effective pilot in
the scramjets [14]. Other results showed that silane/hydrogen mixtures were effective
pilots for ethylene and kerosene combustion [20].
It was shown in the work of Chang and Lewis [160] that piloting the Jet-A-fueled
scramjet engines with silane is beneficial in decreasing the combustor length necessary to
complete and in reducing the drag. The addition of 10% silane to jet-A fuel reduces the
reaction length to 5% of the original length required at 1 atmosphere, 1000 K, and 2000
m/s.
In their experimental study, Kay et al. [4] used three wall-mounted pilots, which
serve to initiate the combustion process and stabilize the flame. Staged combustion,
whereby the engine fuel is injected at three axial stations corresponding to the pilot
location and two downstream stations, is employed to distribute the combustor heat
release. This leads to high combustion efficiency while controlling the combustor
pressure distribution and preventing combustor-inlet interaction that could unstart the
inlet. Also, by tailoring the fuel distribution, it is possible to operate as a dual-combustion
scramjet where the combustion process is either all supersonic or mixed
supersonic/subsonic, depending on overall equivalence ratio and flight Mach number.
They used gaseous ethylene to simulate the ignition characteristics o f vaporized Jet-A
(JP-5) fuel and limited tests were made using Jet-A. Supersonic combustion tests were
Reproduced with permission of the copyright owner. Further reproduction prohibited without permission.

3 6
performed using gaseous ethylene fuel with primary fuel injection along and with staged
fuel injection over a wide range o f spacings between the primary and secondary injection
stages. In addition to the ethylene-fueled combustor performance tests, they performed
significant combustor testing using Jet-A, a liquid hydrocarbon, as the primary fuel while
the pilot injected as a liquid from the parametric piloting test hardware. In later tests, the
fuel-cooled piloting hardware was used and the fuel was preheated within the pilot
cooling passage, as it would be in an actual engine, to a thermodynamic state such that it
flash-vaporized upon injection into the combustor.
Jian-Guo et al. [59] investigated the effect of the hydrogen pilot injection on the
ignition of liquid kerosene in Mach 2.5-supersonic combustor. They concluded that
without additional ignitor, a proper combination of pilot hydrogen and recessed flame-
holder may ignite kerosene and maintain sustained combustion. The minimum
equivalence ratio for pilot hydrogen to sustain combustion was found to be 0.03. The
effect o f increasing the total temperature for the incoming supersonic air from 1470 K to
L700 K was not found of a significant effect implying that the characteristics evaporation
time for kerosene is smaller than the mixing time and characteristics reaction time. The
evaporation o f kerosene is not the controlling factor. They also concluded that the 90°
rearward-facing step enhances the mixing pattern of the kerosene-hydrogen dual fuel
system in comparison to that of the 45° step. This is attributed to the lower recovery
temperature in the 45° step case, which leads to the poorer mixing o f the pilot hydrogen
and the supersonic air. It needed more hydrogen to produce enough radicals to ignite the
kerosene spray.
Through the experiments of Yu et al. [161] the combustion of kerosene in two
supersonic test combustors using pilot hydrogen was studied. The integrated modules of
pilot and flame-holder using recessed cavity with different geometry were designed and
tested. Effect o f pilot injection scheme, cavity geometry, and combustor scaling on
minimally required pilot hydrogen equivalence ratio were systematically examined.
Results show that the stream wise pilot injection is not the most effective scheme for the
promotion o f kerosene ignition. Also, the cavity depth and length have significant effect
on ignition and flame sustaining, while the slanted angle of aft wall is less important.
Reproduced with permission of the copyright owner. Further reproduction prohibited without permission.

37
In an effort to reduce the combustor length, Yu et al. [34] conducted experimental
study to evaluate the flame holding and mixing enhancement characteristics of supersonic
reacting flow over acoustically open cavities. Several wall cavities having various size
and aspect ratios were subjected to supersonic open-flow flame experiments. The results
showed that cavities with a short aspect ratio provided good flame holding, whereas those
with a relatively long aspect ratio shortened that flame length substantially via acoustic
excitation. In all cases that utilized cavities, the combustor pressure and the exit recovery
temperature were increased suggesting enhanced volumetric heat release. The subject of
the cavity flows and their relevance to flame holding in supersonic combustion engines
was surveyed in [162-164].
An unsteady flow analysis on the effect of cavity length to depth ratio and cavity
aft wall angle has been studied by Baurle et al. [16S] to determine the important
characteristics that influence cavity flame holding effectiveness.
Bumes et al. [166] investigated the use of combustor wall cavities not only to
provide stable flame holding but also to enhance fuel-air mixing in supersonic
combustors. Several different configurations of acoustically open cavities were placed
inside a supersonic combustor. For certain cavity configurations, supersonic flow over
the cavity generated large coherent structures via flow-induced cavity resonance. On one
hand, fuel injection directly into the cavity suppressed the flow oscillations even in the
case o f the most unstable cavity and inhibited coherent structure formation downstream.
This injection scheme would be ideal for cavities that will function as stable flame-
holders. On the other hand, fuel injected into the wake of the cavity was entrained into
the coherent structures, and showed the evidence of mixing enhancement. The presence
of large coherent structures periodically occurring in the wake o f the cavity showed that
turbulent compressible mixing in an enclosed supersonic duct is significantly affected by
flow-induced cavity resonance. This opens up the possibility o f organizing the coherent
“vortical” structures in a scramjet flow field and controlling the combustion inside the
vortices to shorten the combustor length and improve engine performance.
The results o f Gruber et al. [167] indicates that the aft ramp angle plays a strong
role in determining the character of the shear layer that spans the length of the cavity.
Reduction in the aft ramp angle to below 90° yields more stable, two-dimensional flow
Reproduced with permission of the copyright owner. Further reproduction prohibited without permission.

38
fields. Reductions in the aft ramp angle result in higher drag coefficient and shorter
residence times within the cavity.
A computational study of an ethylene-fueled scramjet combustor employing an
aerodynamic ramp fuel injector and a cavity flame-holder was performed in the work of
Eklund et al. [168]. It was found that the position and strength of the three-dimensional
pre-combustion shock train and the combustor heat release distribution were strongly
coupled, which complicated the modeling of the flow field.
2.7 Importance of Modeling and SimulationThe supersonic combustion ramjet (scramjet) is expected to be the most effective
propulsion system for the Single Stage To Orbit (SSTO) transportation vehicles and
hypersonic transportation vehicles o f the next Generation. Many studies on scramjet
components such as inlet, combustor, and nozzle have been carried out to obtain a better
understanding of the performances o f the individual components, [169-172]. However, it
is expected that intensive interactions among these components will occur in real engines.
For example, a rise in pressure due to combustion causes separation which propagates
upstream into the inlet and changes the inlet back pressure, which may result in unstart
condition in the inlet. In the case o f interactions, the total performance of the engine
cannot be evaluated based on the linear combination of the obtained performance of the
individual components. Thus, tests of the models of the whole engine are necessary to
elucidate the interactions among these components and the overall performance o f the
whole engine [173]. Testing of the models of whole engine requires rather big and
expensive wind-tunnel facilities. Thus, only a limited number of results on whole engine
tests have been reported [20,117].
The design o f future hypersonic propulsion system will depend heavily on
computational fluid dynamics (CFD) because o f the difficulties associated with testing
combustors in ground-based facilities. If used properly, CFD can be a strong tool in
conjunction with experiments. Computational solutions have the great advantages that
aspects o f the flow field can be switched on and off to isolate the mechanism of an
observed phenomenon. For instance, chemistry may be turned on in a computed flow to
determine its influence, boundary layers may be switched from laminar to turbulent, and
perturbations can be introduced in upstream calculations to isolate cause and effect.
Reproduced with permission of the copyright owner. Further reproduction prohibited without permission.

39
Computational solutions also permit a flow field to be assessed without intrusion, and
numerical measurement can be made to the resolution of the grid. This capability has
been used very effectively to identify details o f shock-shock interaction, shock-boundary-
layer interactions, supersonic shear layers, and combustion systems that could not
possibly be measured experimentally. A particularly promising example is the used of
CFD investigations of ionized or electrically charged gases to explain reported
aerodynamic and propulsion benefits [25].
Multiphase combustion is such a complex phenomenon that it warrants focused
research using modeling and numerical simulations. Though physical experiments are the
ultimate test to study the performance of combustion/propulsion systems, they are often
extremely expensive and complicated, and at times are not even possible. This is due to
the hostile environments, complicated interactions, and couplings. On the one hand, these
couplings make it impossible to study the effect of one parameter at a time in a physical
experiment o f this nature. On the other hand, numerical experiments open an avenue for
isolating and understanding the influence o f different parameters on complex combustion
situations. Furthermore, these can serve as means o f evaluating scaling laws, which
would be extremely difficult and expensive to determine from physical experiments
alone. Modeling also provides a potential design tool for future combustion and
propulsion systems. However, this is not a simple or straightforward extension o f
computational fluid dynamics (CFD) by including a few more terms in the governing
equations [174].
Numerical simulation is time consuming even with ultrafast modem computers.
The fuels of choice, e.g., hydrocarbons or metal slurries, will have a large number of
kinetic steps and species involved in their combustion. The computational time increases
as the square of the number o f species, and calls for reduced chemistry based on sound
logic. The presence of solid particles, such as soof or- unbumed fuel droplets, and their
transport in the turbulent flow field complicates the situation even further, and requires
extremely small grid sizes. Ultimately, the results of these complex numerical
simulations should be made available in the form o f user-friendly models for the
designer.
Reproduced with permission of the copyright owner. Further reproduction prohibited without permission.

40
Strong interaction of the computational combustion community with
experimentalists is needed in order to assure meaningful model validations, and to
generate more reliable and advanced models to aid in the design of complex
combustion/propulsion systems of the future.
Computational fluid dynamics-(CFD) simulations have become invaluable in the
design process due to the high costs and long turnaround times encountered in
experimental programs and due to the inability to reproduce all desired flow field
conditions in present laboratory facilities. Fundamental numerical techniques for the
calculation of compressible flow fields have been available for some time, but the
computational resources required for making accurate 3-D simulations of complex flow
fields have become more generally available for design purposes only relatively recently.
This is, for the most part, due to the many dramatic improvements that have occurred in
the performance of computer hardware, but is also due to progress in the development of
efficient and accurate numerical techniques and algorithms. Advances in areas such as
grid generation, development of higher order schemes, and turbulence modeling make
reasonably accurate simulations of extremely complex flow fields now possible. It is
important to point out that if CFD codes are to be incorporated into a design process, the
need for experimental validation is a necessity, a point that is sometimes under-
emphasized [23].
One of the advantages of CFD simulations over standard experimental data sets is
that all flow field properties are available everywhere in the flow field so that any desired
quantity can be extracted from the CFD results. Both detailed information about
particular flow field features and global information, such as conservation consistency
checks and overall performance quantities, can be calculated from the numerical data set
[23].
The design of fuel injection configurations like the ones considered in the
scramjet engines rely on the understanding of extremely complex flow fields with
features such as: turbulent mixing, combustion reactions, strong three-dimensionality,
compressibility effects, boundary layers, and flow separations. The ability to study such
flow fields experimentally has been limited because of the difficulty in gaining access
into the harsh, yet easily perturbed environment o f a supersonic flow field. Understanding
Reproduced with permission of the copyright owner. Further reproduction prohibited without permission.

41
the geometrical complexity o f such flows has been limited by the fact that most
traditional quantitative measurement techniques are pointwise techniques. Theoretical
studies in the past have been stalled by the difficulties in dealing with the highly non
linear set of equations that describe the physics of these flow fields. Numerical
approaches give reasonable, and often very accurate, solutions to problems such as these
that are not solvable analytically. Recently, due to the development in non-intrusive laser
diagnostics measurement techniques and to advances in the field o f computational fluid
dynamics, the ability to study such flow fields has been greatly improved [23].
Recent advances in numerical simulation techniques and theoretical studies offer
new descriptions of the physical phenomena in high-speed flows including mixing and
combustion interactions and the onset and development of instabilities and voticity, both
in non-reacting and chemically reacting flows. Although numerical simulations offer
much physical insight and a great level of detail, the experimental validation of both the
theoretical models and the numerical algorithms is largely lacking due to difficulties in
measuring essential parameters in these flow fields, such as velocity, temperature, and
pressure characteristics. Furthermore, there are numerous modeling issues, which are
largely unresolved and need insight from experimental observation. Existing
experimental facilities are, in general, dedicated to study o f only a. limited range of topics
because o f extreme conditions of high enthalpy flow, including an overview o f the
demands of availability of existing facilities. Certain facilities, capable of reproducing
high enthalpy conditions, can operate for only short time durations, insufficient to
achieve stable thermal conditions. Other existing facilities are, in general, limited in
terms o f their experimental flexibility [21].
To efficiently simulate the piloted-scramjet engines, a reasonable kinetic model
has to be implemented in the CFD code. The simple global kinetic models may be
inadequate to study piloting problems, since they neglect intermediate combustion
products, which are essential to the phenomenon [14]. At the same time, the
computational cost o f a given reaction mechanism depends primarily on the number of
species included, rather than the number of reactions [175]. Therefore it is recommended
to use a kinetic scheme with a minimum number o f species and reactions that is
effectively yet capable of modeling the chemistry with reasonable accuracy for the
Reproduced with permission of the copyright owner. Further reproduction prohibited without permission.

42
expected combustion conditions. In the dual-fuel cases, in which pilot hydrogen is
injected to support the ignition of ethylene and kerosene hydrocarbon fuels, the
combustion o f pilot hydrogen has to be accounted for in the chemistry part o f the
simulation. This necessitates inclusion of the hydrogen combustion in the used kinetic
scheme. Fulfilling this task makes the selection of the chemistry scheme being more
tightened to achieve both the minimum possible number of species and the involvement
of hydrogen combustion as one of the elementary reactions of the scheme.
Singh and Jachimowski [13] developed a reduced 10-species, 10-step (with
backward reactions) kinetic model for ethylene combustion, which compared favorably
with the results calculated with the detailed mechanism of Jachimowski [176]. This
reduced model is also suggested for assembling reaction mechanisms of heavy
hydrocarbons such as propane, butane, n-heptane, etc.
Different CFD techniques used for Scramjet engine analysis were presented in the
work of White et al. [177]. Various levels of approximation to the Reynolds-averaged
Navier-Stokes equations, by which the flow field through a scramjet engine can be
described, were mentioned. It included using the Parabolized Navier-Stoked (PNS)
equations, reducing the geometry assumption to two-dimensional planar or axisymmetric
flow, and using the Euler/Boundary-Layer Superposition approach. The application of the
CFD techniques to scramjet engine analysis was highlighted by presenting examples of,
and a discussion of, the techniques applied to the analysis of the various engine
components; the inlet, the combustor, and the nozzle.
For the support of the design of a fixed geometry scram intake two-dimensional
Navier-Stokes calculations have been performed by Bissinger [178]. Unstructured-grid
Navier-Stokes (UNS) methodology is well suited to the analysis o f scramjet combustor
flow fields in view of its ability to deal with complex injection geometries and to
adaptively refine the grid in critical regions such as flame zones. UNS applications to
scramjet combustor flow have been limited in view of the need to deal with complexities
associated with combustion and turbulence modeling, which are better established in
structured flow solvers. Lee et al. [179] used UNS code to investigate the scramjet
combustor field for swept ramp fuel injectors. They summarized the progress achieved in
implementation o f the grid adaptive methodology.
Reproduced with permission of the copyright owner. Further reproduction prohibited without permission.

43
In the work of Kodera et al. [180] the hybrid grid method to compute supersonic
reacting flow rate was applied to internal reacting flows of a scramjet engine at flight
Mach number of 8. The details of reacting internal flow field such as boundary layer
separation, mixing, ignition and combustion as well as engine performance such as thrust
and combustion efficiency were investigated. Ungewitter et al. [181] upgraded the k-e
turbulence model by improving the compressibility correction and transitional modeling.
A more stable Gauss-Seidel implicit solver was incorporated into the unstructured Navier
Stokes code and a new variable element grid methodology was employed which
improved the resolution in several key areas while maintaining a minimum number of
cells.
Chakravarthy et al. [182] presented the progress they recently achieved in the
turbulence modeling closure. Their contribution focused on the improvements to the
classical models and the usage of the hybrid Reynolds Average Navier Stokes Equations/
Large Eddy Simulation (RANS/LES) methods. They presented their simulation data for a
couple of supersonic flow case studies that are: swept ramp injection into a supersonic
flow, and two-hole transverse sonic injections downstream of a rearward-facing step in
supersonic flow field. The calculations produced using the new closure compared
favorably with existing relevant experimental data.
Quantifying the level o f confidence, or accuracy, of computational fluid dynamics
(CFD) codes and numerical solutions has recently received increased attention in the
research and engineering application literature. The issues o f credibility, validation, and
verification o f the CFD codes were discussed intensively in [183-188].
A fine enough mesh with a good enough quality must be used to ensure that there
are not significant variations in. the solution when either the number or the placement of
the mesh points is varied. Otherwise it is impossible to distinguish modeling errors from
numerical errors. The mesh refinement and optimization were studied in [189-190].
The accessibility o f the CFD tools on the Internet was discussed in [191]. A
concept was presented for evolving the current RocketWeb™ Internet Analysis System
into a comprehensive design process, capable o f seamlessly integrating the diverse design
and analysis tools necessary to create robust designs. The resulting system would result in
a rigorous, controlled design process capable o f reducing both design cycle time and cost.
Reproduced with permission of the copyright owner. Further reproduction prohibited without permission.

44
Table 2.1 Energy properties of H2 and hydrocarbon fuels data complied from Refs.[137-140]
Fuel
Energy/Mass,
MJ/kg
Energy/Volume,
MJ/1
STP Density,
Kg/m3
Liquid H2 116.7 8.2 71
Slush H2 116.6 9.8 82
Methane 50.0 20.8 424
n-Heptane 44.6 30.3 717
JP-4 43.5 33.1 760
JP-5 43.0 35.1 815
JP-7 43.9 34.7 790
JP-8 43.2 35.0 809
Jet A 43.4 34.6 799
Kerosene 42.8 34.2 800
MCH 43.4 33.4 770
Reproduced with permission of the copyright owner. Further reproduction prohibited without permission.

45
Fl ight
Path
F o r ebodyObl iqueS h o c kWa ve s
A f t e r b o d y
A i r b r e a th i n gEngine
Fig. 2.1 Schematic diagram of the scramjet engine configuration [26].
ExhaustNozzleSu p erson ic
Burner
Fuel InfectoraFreestream Exhaust
Flow
ForebodyOblique
ShockWave
Fig. 2.2 Ftq»nHal features of two-dimensional or planar geometry scramjet engines
[26].
Reproduced with permission of the copyright owner. Further reproduction prohibited without permission.

Fig. 2.3 Airframe-integrated scramjet along with a partial cross-section through a
typical modular engine [28].
Interaction shock
Ma
Separation region
Boundary layer
Jet boundary
Macn disc
\ \ \ \ \ \ \ \ \ \
Fig. 2.4 Schematic of the region surrounding a single perpendicular injector [28].
Reproduced with permission of the copyright owner. Further reproduction prohibited without permission.

47
Lasar light scattering of silica Hjist
Hjjet w/silicaSwept ramp Injectors
Dimensions in inches \ K "Flash-lamp later with 50 psae pulse
Fig. 2.5 Generation of counter-rotating stream wise vorticity by ramp fuel injector [60].
Compression Expansion
Flow^ 3
Flow
Fig. 2.6 Scramjet fuel-injector compression and expansion ramps [60].
Reproduced with permission of the copyright owner. Further reproduction prohibited without permission.

48
Reproduced with permission of the copyright owner. Further reproduction prohibited without permission.
Fig.
2.7
Ener
gy
cont
ent
per u
nit m
ass
for d
iffer
ent
avion
ic fu
els [
130]
.

49
L4F-::
r tr.r -■J-LW;.
v
i& ii& £ }
ftf
Oo oCM
o©o
mm
1a0 ) u
3CCSt*
0 1S *>IO IH
Reproduced with permission of the copyright owner. Further reproduction prohibited without permission.
Fig.
2.8
Tem
pera
ture
lim
it for
diff
eren
t av
ionic
fuels
[13
0].

50
cepm©
• pm
V ~ \
V ®
A . / T v y . ^
■ *•?.'. A <C!.V ’.v /i i / ' J t f XTTC9 -AX5X.
« t
Ooo0%oin
oo e§ f* " «
o
6 3
ooooin
Reproduced with permission of the copyright owner. Further reproduction prohibited without permission.
Fig.
2.9
Ener
gy
cont
ent
per u
nit v
olum
e for
diff
eren
t av
ionic
fuels
[13
0].

51
CHAPTER m
THEOETICAL FORMULATIONS
3.1 Introduction
The Computational Fluid Dynamics “CFD” Code used in the present study is the
FLUENT commercial code. FLUENT is a general-purpose computer program for
modeling fluid flow, heat transfer, and chemical reaction [192].
FLUENT models a wide range o f phenomena by solving the conservation
equations for mass, momentum, energy, and chemical species using a control volume
based finite difference method. The governing equations are discretized on a curvilinear
grid to enable computations in complex irregular geometries. A non-staggered system is
used for storage o f discrete velocities and pressures. Interpolation is accomplished via a
first-order, Power-Law scheme or optionally via higher order upwind schemes. The
equations are solved using SIMPLE-like algorithms with an iterative line-by-line matrix
solver and multigrid acceleration.
3.2 Governing Equations
For all flows, FLUENT solves conservation equations for mass and momentum.
For flows involving heat transfer or compressibility, an additional equation for energy
conservation is solved. For flows involving species mixing or reactions, a species
conservation equation is solved or, if the PDF model is used, conservation equations for
the mixture fraction and its variance are solved. Additional transport equations are also
solved when the flow is turbulent.
3.2.1 The Mass Conservation Equation
The equation for conservation of mass, or continuity equation, can be written as follows:
( 3 1 )
Equation (3.1) is the general form of the mass conservation equation and is valid
for incompressible as well as compressible flows. The source Sm is the mass added to the
continuous phase from the dispersed second phase (e.g., due to vaporization of liquid
droplets) and any user-defined sources.
Reproduced with permission of the copyright owner. Further reproduction prohibited without permission.

52
3.2.2 Momentum Conservation EquationsConservation of momentum in the i direction in an inertiai (non-accelerating)
reference frame is described by [193]
where p is the static pressure. Tjj is the stress tensor (described below), and pgi and Ft are
the gravitational body force and external body forces (e.g., that arise from interaction
with the dispersed phase) in the i direction, respectively. F, also contains other model-
dependent source terms such as porous-media and user-defined sources.
The stress tensor Xjj is given by
f 3 it,, 3u . Y| 2 3m,
r * = " a ^ + fcT 0 3 )L V 1 JJ
where p. is the molecular viscosity and the second term on the right hand side is the effect
of volume dilation.
3.2.3 The Energy EquationThe general form of the energy equation is:
where iCefr is the effective conductivity (k + kh where kt is the turbulent thermal
conductivity, defined according to the turbulence model being used), and Jr is the
diffusion flux of species The first three terms on the right-hand side of Eq. (3.4)
represent energy transfer due to conduction, species diffusion, and viscous dissipation,
respectively. S& includes heat of chemical reaction, and any other volumetric heat sources
defined.
(3.2)
InEq. 3.4,
(3.5)
where sensible enthalpy h is defined for ideal gases as
h = '2 f mr hri
(3.6)
Reproduced with permission of the copyright owner. Further reproduction prohibited without permission.

53
In Equation (3.6), mj is the mass fraction of species/ and
(3.7)
where Tref is 298.15 K.
Equation (3.4) includes pressure work and kinetic energy terms, which are often
negligible in incompressible flows.
The viscous dissipation terms, which describe the thermal energy created by
viscous shear in the flow, is included in Eq. (3.4). Viscous heating will be important
when the Brinkman number, Br, approaches or exceeds unity, where
and AT represents the temperature difference in the system. The effect o f enthalpy
The source o f energy, Sh, in Eq. (3.4) includes the source of energy due to
chemical reaction:
where h°r is the enthalpy o f formation of species / and Rr is the volumetric rate of
creation o f species j \
When one of the radiation models is used, Sh in Eq. (3.4) also includes radiation
source terms. It should be noted that the energy sources, Sh, also include heat transfer
between the continuous and the discrete phase.
3.3.1 Turbulence ModelsIn turbulent flows, the velocity at a point is considered as a sum of the mean
(ensemble-averaged) and fluctuating components:
transport due to species diffusion is includes in Eq. (3.4) through the term«- /
h,reaction (3.9)
33 Basic Physical Models for Flow and Heat Transfer
(3.10)
Reproduced with permission of the copyright owner. Further reproduction prohibited without permission.
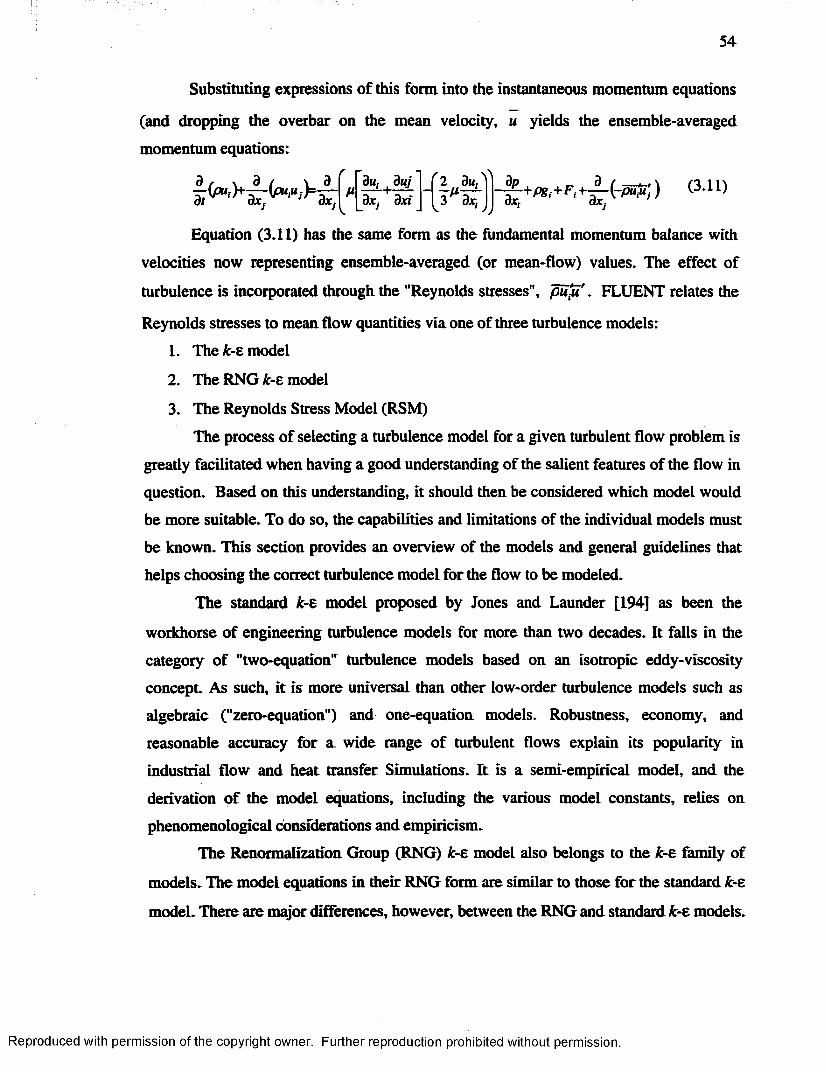
54
Substituting expressions of this form into the instantaneous momentum equations
(and dropping the overbar on the mean velocity, u yields the ensemble-averaged
momentum equations:
Equation (3.11) has the same form as the fundamental momentum balance with
velocities now representing ensemble-averaged (or mean-flow) values. The effect of
turbulence is incorporated through the "Reynolds stresses", pu-u'. FLUENT relates the
Reynolds stresses to mean flow quantities via one of three turbulence models:
1. The k-E model
2. The RNG k-E model
3. The Reynolds Stress Model (RSM)
The process of selecting a turbulence model for a given turbulent flow problem is
greatly facilitated when having a good understanding of the salient features of the flow in
question. Based on this understanding, it should then be considered which model would
be more suitable. To do so, the capabilities and limitations of the individual models must
be known. This section provides an overview of the models and general guidelines that
helps choosing the correct turbulence model for the flow to be modeled.
The standard k-E model proposed by Jones and Launder [194] as been the
workhorse of engineering turbulence models for more than two decades. It falls in the
category of "two-equation" turbulence models based on an isotropic eddy-viscosity
concept. As such, it is more universal than other low-order turbulence models such as
algebraic ("zero-equation") and one-equadon models. Robustness, economy, and
reasonable accuracy for a. wide range of turbulent flows explain its popularity in
industrial flow and heat transfer Simulations. It is a semi-empirical model, and the
derivation o f the model equations, including the various model constants, relies on
phenomenological considerations and empiricism.
The Renormalization Group (RNG) Jfc-e model also belongs to the k-E family of
models. The model equations in their RNG form are similar to those for the standard k-E
model. There are major differences, however, between the RNG and standard k-E models.
Reproduced with permission of the copyright owner. Further reproduction prohibited without permission.

The RNG model was derived using a more rigorous statistical technique, and its model
constants are derived "analytically."
The Reynolds Stress Model (RSM) is the most elaborate turbulence model that
FLUENT provides. Eschewing the isotropic eddy viscosity hypothesis, the RSM closes
the Reynolds stresses by solving their transport equations (six additional equations in 3D,
in comparison with k-E models). As such, the RSM accounts for the history and transport
o f the Reynolds stresses in a rigorous manner. The effects of streamline curvature, swirl,
and rotation are all directly accounted for by the transport equations for the Reynolds
stresses.
3.3.2 Compressible Flows
Compressibility effects are encountered in gas flows at high velocity and/or in
which there are large pressure variations. When the gas flow velocity approaches or
exceeds the speed of sound or when the pressure change in the system (Ap/p) is large, the
variation of the gas density with pressure has a significant impact on the flow velocity,
pressure, and temperature. Compressible flows create a unique set of flow physics, which
should be well known to provide the special input requirements and solution techniques
that are described in this section.
Compressible flows can be characterized by the value of the Mach number
M = u / c (3.12)
where c is the speed o f sound in the gas:
c= JyRT (3.13)
and y is the ratio of specific heats (Cp/Cv).
When the Mach number is less than one, the flow is termed subsonic. At Mach
numbers much less than one (e.g., M < 0.3 or so), compressibility effects are negligible
and the variation of the gas density with pressure can safely be ignored in the flow
modeling. When the Mach number approaches unity, however, compressibility effects
become important. The flow will choke at Mach 1.0. When the Mach number exceeds
1.0, the flow is termed supersonic. Supersonic flows may contain shocks and expansion
fans which can impact the flow pattern significantly and which require compressibility in
Reproduced with permission of the copyright owner. Further reproduction prohibited without permission.

56
the FLUENT model. FLUENT provides a full range of compressible flow modeling
capabilities for subsonic, transonic, and supersonic flows.
Compressible flows are typically characterized by the total pressure P0 (isentropic
stagnation pressure) and total temperature T0 (isentropic stagnation temperature) of the
flow. These quantities can be related to the static pressure and temperature via the
following relationships:
These unique relationships describe the variation of the static pressure and
temperature in the flow as the velocity (Mach number) changes under isentropic (toss-
free, constant enthalpy) conditions.
For a given pressure ratio from inlet to exit, for example, Eq. (3.14) can be used to
For air, Eq. (3.14) predicts a choked flow (Mach number of 1.0) at an isentropic pressure
ratio, Ps/Po, of 0.5283. This choked flow condition will be established at the point of
minimum flow area (e.g., in the throat o f a nozzle). In the subsequent area expansion the
flow may either accelerate to a supersonic flow in which the pressure will continue to
drop, or the flow may return to subsonic flow conditions, decelerating with a pressure
rise. When a supersonic flow is exposed to an imposed pressure increase, a shock will
occur, with a sudden pressure rise and deceleration accomplished across the shock.
Compressible flows are described by the standard continuity and momentum
equations solved by FLUENT, and there is no need to activate any special physical
models (other than the compressible treatment of density as detailed below). The energy
equation solved by FLUENT, Eq. (3.4), correctly incorporates the coupling between the
flow velocity and the static temperature, and should be activated whenever a
compressible flow is solved. In addition, you should activate the optional viscous
dissipation terms in Eq. (3.4), which become important in high-Mach-number flows.
For high-Mach-number flows, compressibility affects turbulence through so-
called "dilatation dissipation," which is normally neglected in the modeling of
r
(3.14)
(3.15)
estimate the exit Mach number (which would exist in a one-dimensional isentropic flow).
Reproduced with permission of the copyright owner. Further reproduction prohibited without permission.

57
incompressible flows [195], Neglecting the dilatation dissipation fails to predict the
observed decrease in spreading rate with increasing Mach number for compressible
mixing and other free shear layers. To account for these effects in the K-e models in
FLUENT, the dilatation dissipation term, YM, is included in the tc equation. This term is
modeled according to a proposal by Sarkar and Balakrishnan [196]:
Yu = pe2M ; (3.16)
where Mt is the turbulent Mach number, defined as
(3.17)
where a (=^JyRT ) is the speed of sound. This compressibility modification always takes
effect when the compressible form o f the ideal gas law is used.
3.3.3 Chemical Species Transport and Reacting FlowFLUENT models chemical species transport and chemical reactions using the
reacting flow models described in this section. The mixing and transport o f chemical
species are modeled by solving conservation equations describing convection, diffusion,
and reaction sources for each component species.
When you choose to solve conservation equations for chemical species, FLUENT
predicts the local mass fraction of each species, m,-, through the solution of a convection-
diffusion equation for the species. This conservation equation takes the following
general form:
+Rr +S r (3.18)
where is the mass rate o f creation or depletion by chemical reaction and Sr , is the
rate o f creation by addition from the dispersed phase. An equation of this form will be
solved for N -l species where N is the total number of fluid phase chemical species
present in the system.
The diffusion flux, / £.£, may optionally be augmented by a thermal diffusion
1 3 Tterm, —DT. —- — (also called Soret diffusion).1 T dx£
where Dj. is the diffusion coefficient for species r \
Reproduced with permission of the copyright owner. Further reproduction prohibited without permission.

58
In turbulent flows, FLUENT computes the mass diffusion in the form:
(3.19)
where Sct is the effective Schmidt number, (with a default setting of 0.7).
For many multi-component mixing flows, the transport of enthalpy due to species
when the species involved have significantly differing heat capacities, this term cannot be
neglected.
The reaction rates that appear as source terms in Eq. (3.18) are computed from
Arrhenius rate expressions or by using the eddy dissipation concept due to Magnussen
and Hjertager [197]. Models o f this type are suitable for a wide range o f applications
including laminar or turbulent reaction systems, and combustion systems including
premixed or diffusion flames.
The source o f chemical species f due to reaction, R,-, is computed as the sum of
the reaction sources over the le reactions that the species may participate in:
where Rr./t is the rate o f creation/destruction o f species f in reaction k. Reaction may
occur in the continuous phase between continuous phase species only, or at surfaces
resulting in the surface deposition or evolution o f a chemical species. The reaction rate,
Rrk , is controlled either by an Arrhenius kinetic rate expression or by the mixing of the
turbulent eddies containing fluctuating species concentrations.
The Arrhenius reaction rate is computed as:
where molar stoichiometric coefficient for species i’ in reaction k (positivet
diffusion (V .|X , can have a significant effect on the enthalpy field and should
not be neglected. In particular, when the Lewis number Le = is far from unity, andk f c v
(3.20)it
(3.21)
values for reactants, negative values for products)
Reproduced with permission of the copyright owner. Further reproduction prohibited without permission.

59
Af f. - molecular weight o f species i ’ (kg/kmol)
fik = temperature exponent (dimensionless)
Ak = pre-exponential factor (consistent units)
Cy = molar concentration of each reactant species j ’ (kmol/m3)
v r k = exponent on the concentration o f reactant j in reaction k
Ek — activation energy for the reaction (J/kmol)
The values for v ’ , fik, Ak , v r k , and Ek are defined in the problem setup.
The influence o f turbulence on the reaction rate is taken into account by
employing the Magnussen and Hjertager model. In this model, the rate of reaction Rrk is
given by the smaller (i.e., limiting value) o f the two expressions below:
= - v n M rA p ? ~ p & — (3.22)Rsk ft
e ^ m*rjt =-v'r.kMrA B p - ^ p. [ (3.23)
k L Pv P*M P
where mp = mass fraction of any product species, P
mR = mass fraction of a particular reactant, R
R = reactant species giving the smallest value of Rr k
A = an empirical constant equal to 4.0
B = an empirical constant equal to 0.5
The eddy breakup model relates the rate o f reaction to the rate of dissipation of
the reactant and product containing eddies, k/e represents the time scale of the turbulent
eddies following the eddy break up model of Spalding. The model is useful for the
prediction of premixed and diffusion problems as well as for partially premixed reacting
flows.
In turbulent reacting flows, FLUENT calculates the reaction rates from the
Arrhenius expression (Eq. (3.21)) and the eddy breakup model (Eqs. (3.22) and (3.23)).
The limiting (slowest) rate is used as the reaction rate and the contribution to the source
terms in the species conservation and enthalpy equations are calculated from this reaction
Reproduced with permission of the copyright owner. Further reproduction prohibited without permission.

- : v ■ . ■ . . .:
60j-'-'-*V '
rate. Energy released by or required for the chemical reaction is accounted for in the
source term o f the enthalpy equation as shown in Eq. (3.9).
The introduction o f the kinetic term into the rate expression for turbulent flows is
useful as it can act as a cut-off to the mixing controlled rate when chemistry is very slow.
However, in many practical situations, the eddy breakup model describes the limiting
rate.
If the fuel is introduced to an oxidant, spontaneous ignition does not occur unless
the temperature of the mixture exceeds the activation energy threshold required to
maintain combustion. In the simulation an ignition source has to be supplied to initiate
combustion. This ignition source may be a heated surface that heats the gas mixture
above the required threshold level. Often, however, it is the equivalent of a spark: an
initial solution state that causes combustion to proceed. This "fuel spark" or "initial
solution state" is supplied by patching a hot temperature into a region of the model that
contains a sufficient fuel/air mixture for ignition to occur. Often, there may be a need to
patch both the temperature and the fuel/oxidant/product concentrations to produce
ignition in the model. The initial patch has no impact on the final steady-state solution-no
more than the location o f a match determines the final flow pattern o f the torch that it
lights.
3.4 Thermal Model3.4.1 Density: Ideal Gas Law for Compressible Flows
For compressible flows, the gas law has the following form:
(3.24)RT
where p is the local relative (or gauge) pressure predicted by FLUENT and Pop is defined
as the Operating Pressure in the Operating Conditions panel.
3.4.2 Composition-Dependent Thermal Conductivity for Multicomponent MixturesWhen the ideal gas law is used with multi-component flow field, the composition-
dependent thermal conductivity based on kinetic theory is calculated as
(3'2S)r Z ,j-X r
where
Reproduced with permission of the copyright owner. Further reproduction prohibited without permission.

and X r is the mole fraction o f species
3.4J Composition-Dependent Viscosity for Multicomponent MixturesWhen the ideal gas law is used with multi-component flow field, the composition-
dependent thermal conductivity based on kinetic theory is calculated as
X r fir
2 r x r*r.r(3.27)
where
0£T =
1+
l Ir w Af,El
M r ,V 1 /(3.28)
8M r\
and X r is the mole fraction o f species f .
3.4.4 Specific Heat Capacity as a Function of CompositionThe species heat capacity is defined as a function of temperature in a polynomial
formas follows:
Cp (r)=A , +A2T + A 3T z -k.. (3.29)
where coefficients A,’s are characteristic data for each species.
The mixture's specific heat capacity is calculated as a mass fraction average of the
pure species heat capacities as follows:
Cp = X mr c„.r (3.30)
3.5 Grid Generation
Reproduced with permission of the copyright owner. Further reproduction prohibited without permission.

62
The grid is a discrete representation of the continuous field phenomena that is
modeled and the accuracy and numerical stability o f the simulation depend on the choice
of the grid. In other words, the density and distribution o f the grid lines determines the
accuracy with which the model represents the actual physical phenomena.
In FLUENT, the control volume method, sometimes referred to as the finite
volume method, is used to discretize the transport equations. In the discrete form of the
equations, values o f the dependent variables appear at control volume boundary locations
(cell faces). These values have to be expressed in terms o f the values at the nodes of
neighboring cells in order to obtain algebraic equations. This task is accomplished via an
interpolation practice, also called a "differencing scheme." The choice of differencing
scheme not only affects the accuracy of the solution but also the stability o f the numerical
method.
The default differencing scheme used in FLUENT is the so-called power-law
scheme. This scheme is derived from the exact analytical solution to the one-dimensional
convection-diffusion equation. The power-law scheme is very stable and gives physically
meaningful (bounded) solutions but, in certain situations, is susceptible to numerical
diffusion effects. These effects, as mentioned earlier, are maximums when the flow is
aligned at 45 degrees to the grid lines and there are significant gradients in the direction
normal to the flow. Higher-order methods which are less susceptible to numerical
diffusion, but also less stable compared to the power-law scheme, are also available in
FLUENT.
It should be noted that recent research in CFD has focused on unstructured grids,
where the grid points are placed in the flow field in a very irregular fashion; this is in
contrast to a structured grid, which reflects some type of consistent geometrical
regularity. Among the advantages of the unstructured grid meshes over the structured
ones are the allowance for the maximum flexibility in matching mesh cells with the
boundary surfaces and for putting cells where needed (193].
Both the structured and unstructured meshes are generated using “Gambit,” which
is the grid generation package of the flow solver “Fluent.”
The meshes used in the present study are unstructured. The faces are meshed
using the “Tri-Pave” scheme, which means that the mesh includes only triangular mesh
Reproduced with permission of the copyright owner. Further reproduction prohibited without permission.

63
elements that are interconnected in an irregular fashion to construct the unstructured
meshing o f the faces. The volume meshing emanates from the mesh elements o f the faces
and branches downward filling the whole volume and connecting the faces using the “T-
Grid” scheme through which GAMBIT creates a mesh that consists primarily o f the
tetrahedral mesh elements but may include hexahedral, pyramidal, and wedge elements
where appropriate.
Figure 3.1 shows an example for an unstructured face meshing using “Tri-Pave”
scheme. Figure 3.2 shows the general shape of the tetrahedral mesh elements that are
created in the volume if none o f the faces are meshed prior to the application of the "T-
Grid” scheme or if all pre-meshed faces are meshed by means o f a Tri-Pave scheme.
3.6 Method of Solution3.6.1 Basics of the Overall Solution Algorithm
The coupled solver in FLUENT solves the governing equations of continuity,
momentum, and (where appropriate) energy and species transport simultaneously as a set,
or vector, o f equations. Governing equations for additional scalars will be solved
sequentially (i.e., segregated from one another and from the coupled set).
The system of governing equations for a single-component fluid, written to
describe the mean flow properties, is cast in integral, Cartesian form for an arbitrary
control volume V with differential surface area dA as follows:
J WdV+§[F -G \d A = \H dV (3.31)at v y
where the vectors, W, F, and G are defined as
p pv 0pu pvu+ pi txipv , F = p w + p j , G = zyipw pvw+pk vtiPE pvE+pv Jijvj+q
and the vector H contains source terms such as body forces and energy sources.
Here p , v , E, and p are the density, velocity, total energy per unit mass, and
pressure o f the fluid, respectively, t is the viscous stress tensor, and q is the heat flux.
Reproduced with permission of the copyright owner. Further reproduction prohibited without permission.

64
Total energy E is related to the total enthalpy H by
(3.33)P
where2
H=h+2
(3.34)
Each iteration consists o f the steps illustrated in Fig. 3.3 and outlined below:
1. Fluid properties are updated, based on the current solution. (If the calculation has
just begun, the fluid properties will be updated based on the initialized solution.)
2. The continuity, momentum, and (where appropriate) energy and species equations
are solved simultaneously.
3. Where appropriate, equations for scalars such as turbulence and radiation are
solved using the previously updated values of the other variables.
4. When interphase coupling is to be included, the source terms in the appropriate
continuous phase equations may be updated with a discrete phase trajectory
calculation.
5. A check for convergence of the equation set is made.
These steps are continued until the convergence criteria are met.
3.6.2 Residual ReportingThe process of obtaining a converged solution is of great importance in FLUENT
simulations. So that in order to monitor this process, FLUENT provides a running report
o f the residuals for each equation at each iteration. The residuals are a measure o f how
closely each finite difference equation is balanced, given the current state o f the solution.
In this section, a definition of the residuals is given.
At each iteration o f the solution algorithm, FLUENT reports a residual for each
equation that has been solved. These residuals provide a measure of the degree to which
each equation is satisfied throughout the flow field. FLUENT computes residuals for
each conservation equation b y summing the imbalance in the equation for all cells in the
domain. A detailed description o f the calculation o f the residuals is provided below.
Reproduced with permission of the copyright owner. Further reproduction prohibited without permission.

At the end of each iteration, the residual sum for each o f the conserved variables
is computed and stored, thus recording the convergence history. This history is also saved
in the data file. The residual sum is defined below.
On a computer with infinite precision, these residuals will go to zero as the
solution converges. On an actual computer, the residuals decay to some small value
(“ round-off1) and then stop changing (“ level out”). For “ single precision” computations
(the default for workstations and most computers), residuals can drop as many as six
orders o f magnitude before hitting round-off. Double precision residuals can drop up to
twelve orders o f magnitude.
A residual for the coupled solvers is simply the time rate of change of the
conserved variable (W). The RMS residual is the square root of the average o f the
squares o f the residuals in each cell of the domain:
Equation (3.35) is the unsealed residual sum reported for all the coupled equations
solved by Fluent's coupled solver.
In general, it is difficult to judge convergence by examining the residuals defined
by Eq. (3.35) since no scaling is employed. Fluent scales the residual using a scaling
R(W)iterarion N R(W)iteration5
The denominator is the largest absolute value of the residual in the first five
iterations.
The scaled residuals described above are useful indicators of solution
convergence. I t is sometimes useful to determine how much a residual has decreased
during calculations as an additional measure of convergence. For this purpose, Fluent
allows to normalize the residual (either scaled or unsealed) by dividing by the maximum
residual value after M iterations.
Normalization o f the residual sum is accomplished by dividing by the maximum
residual value after Af iterations:
(3.35)
factor representative of the flow rate <j of through the domain. This scaled residual is
defined as
Reproduced with permission of the copyright owner. Further reproduction prohibited without permission.

66
m y / ) = i t e r a t i o n N (3.37)R(W)iteration M
Normalization in this manner ensures that the initial residuals for all equations are
of 0(1) and is sometimes useful in judging overall convergence. By default, Af = 5,
making the normalized residual equivalent to the scaled residual.
3.6.3 Judging ConvergenceA FLUENT calculation is converged when all governing equations are balanced
at each point in the solution domain. This section provides guidance on how to judge the
convergence of the solution via residual values and how to monitor the progress towards
convergence via residual histories and histories of solution variables.
The residuals for each flow variable give a measure of the magnitude of the error
in the solution at each iteration. As discussed in the preceding section, these residuals are
normalized unless being set as un-normalized. Generally, a solution is well converged
when the normalized residuals are on the order of IxlO'3. An important exception is the
enthalpy residual, which should be about IxlO'6.
In addition, the residuals o f the species transport equations need to decrease to 1 x
10'5 to I x KT6 when solving problems involving mixing of two species o f very different
molecular weights (e.g., Hi and WFg). If the residuals have decreased to this level, are
monotonically decreasing, and the flow field looks unchanged from the solution 50
iterations earlier, then the solution can be called "converged." Sometimes it might not be
needed to generate a completely converged solution, if the basic features of the flow field
could be picked up right away. When quantitative results are sought, however, complete
convergence of the solution is essential.
fit the present study convergence is primarily judged by reaching unchanged
values for the most important flow field parameters such as temperature, pressure,
velocity magnitude, and species mass fractions. These parameters are averaged over all
grid cells at different cross flow planes along the combustor length using the mass
weighted-approach. A t the convergence condition these averages show unchanged values
with the solution iterations.
Reproduced with permission of the copyright owner. Further reproduction prohibited without permission.

67
The conservation o f mass and energy are checked as another means for examining
the convergence* The imbalance in the mass flow rate and the rate o f heat flux relative to
the total inputs o f mass flow rate and heat flux rate respectively are accepted if less than
1% under the convergence condition.
3.7 Physical ModelsFour physical models are used in the present study that includes; rearward-facing
step, swept rearward-facing step, cavity with no-pilot injection, cavity with pilot injection
models. The configurations used in this case study are that used by Owens et al.
[198,199] with slight differences in the dimensions applied. Figures 3.8-3.11 present the
four models with the full dimensions. The case studied feature the symmetry condition at
the mid-span plane; therefore, just one half of the physical domain is simulated to
minimize the computational time.
3.7.1 Rearward-Facing Step ConfigurationIn the configuration used in this study the rearward-facing step is located at the
upper longitudinal wall. The 3-D schematic diagram for this configuration is
demonstrated in Fig. 3.8(a). The step height (H) is lOmm. Gaseous ethylene, as the main
fuel, is injected at four step heights downstream of the step normal to the incoming
supersonic air stream. The onset of thermal choking was delayed by diverging the test
section starting at 19H downstream of the step with a 3-deg half angle. The total length of
the domain is 350mm with an inlet test section o f 25.4x25.4 mm . The full dimensions of
the combustor at the symmetry plane are shown in Fig. 3.8(b). An unstructured grid with
a size of 389,251 cells is used in simulating this case study.
3.7.2 Swept Rearward-Facing Step ConfigurationThis configuration resembles that used in the rearward-facing case study except
for some differences. The inlet test section dimensions, the step height and its location,
the main injection diameter and its location, and the pilot injections diameter are exacdy
as those used in the ethylene case. The total length of the domain is 220mm. The onset of
thermal choking was delayed by diverging the test section starting at 6H downstream of
the step with a 3-deg half angle. The step implemented in the propane case study is swept
from both end sides starting at 15 mm downstream o f the combustor inlet creating as
extra means of vorticity that aims at enhancing the fuel-air mixing. Gaseous pilot propane
Reproduced with permission of the copyright owner. Further reproduction prohibited without permission.

68
is injected parallel to the incoming air stream via two holes with 1 mm diameter each that
are centered at the base o f the step. The incoming air is a 1.751-Mach flow to simulate
the enthalpy level o f the typical flight conditions at the combustor inlet. The incoming air
is clean (no vitiation used). The schematic diagram for the propane combustion case is
presented in Fig. 3.9. An unstructured grid with a size of 207,125 cells is used in
simulating this case study.
3 .7 J Cavity with No Pilot Injection Configuration
In the configuration used in the present study the rearward-facing step is located
at the upper longitudinal wall. A 15°-wedge is located downstream of the step and
upstream of the main normal injection. The combination of the rearward-facing step and
the wedge forms a cavity-like configuration that helps in enhancing the fuel-air mixing in
addition to initiate and stabilize the main flame. This is demonstrated in Fig. 3.10. The
unstructured grid used to simulate this case study is o f a size o f245,702 cells.
3.7.4 Cavity with Pilot Injection Configuration
The only difference between this configuration and the cavity with no pilot
injection configuration is in the injection o f the gaseous pilot ethylene parallel to the
incoming air stream via three holes that are equally distributed at the base o f the step. The
3-D schematic diagram of this configuration and the combustor full dimensions at the
symmetry plane are presented in Figs. 3.11(a) and 3.11(b) respectively. The unstructured
grid used to simulate this case study is of a size o f245,702 cells.
3.8 Boundary and Initial Conditions
Once the governing flow equations are defined, then the real driver for any
particular solution is the boundary conditions. This has particular significance in CFD;
any numerical solution o f the governing flow equations must be made to see a strong and
compelling numerical representation of the proper boundary conditions [193].
The inflow boundaries are supersonic, so the total and static pressures, the total
temperature, and the species mass fractions are specified. For these supersonic inflow
boundaries, uniform, conditions were assumed for the primitive parameters. The outflow
boundaries are supersonic so all flowfield variables are allowed to float. They are
calculated using linear extrapolation based on the flowfield values at the internal points
Reproduced with permission of the copyright owner. Further reproduction prohibited without permission.
69
[193]. No-slip boundary condition is dictated at all walls and step boundaries; meaning
that zero relative velocity between the surface and the gas immediately at the surface is
assumed and the temperature o f the fluid layer immediately in contact with the surface
equals the wall temperature. All surfaces are assumed adiabatic with zero temperature
gradient at the walls.
To start the calculations, initial conditions for the pressure, temperature, species
mass fractions, and turbulence parameters in the whole flowfield must be stipulated. The
choice o f the initial conditions should not afreet the final steady-state answer. In theory,
these initial conditions can be purely arbitrary. In practice, they should be chosen
intelligently to expedite the final steady-state answer, and hence shortening the computer
execution time [193]. For all case studies in the present investigation, the initial
conditions were set by applying free-stream air inlet conditions throughout the entire flow
field.
Reproduced with permission of the copyright owner. Further reproduction prohibited without permission.

Fig. 3.1 An unstructured face meshing using “Tri-Pave” scheme.
Fig. 3.2 T-Grid meshing scheme.
Reproduced with permission of the copyright owner. Further reproduction prohibited without permission.

Converged?
Update properties.
Solve turbulence and other scalar equations.
Solve continuity, momentum, energy, and species equations simultaneously.
Fig. 3.3 Overview of the solution process.
Reproduced with permission of the copyright owner. Further reproduction prohibited without permission

7 2
Fig. 3.4(a) Schematic diagram for the rearward-facing step configuration.
Bhydne
QmaticreaeinnTn
Dawu iienottDsaie
Vitiated
Fig. 3.4(b) Schematic diagram for the step configuration, at the symmetry plane with full-dimensions.
Reproduced with permission of the copyright owner. Further reproduction prohibited without permission.

73
Fig. 3.5 Schematic diagram for the swept rearward-facing step configuration.
Fig. 3.6 Schematic diagram for the cavity with no pilot injection configuration.
Reproduced with permission of the copyright owner. Further reproduction prohibited without permission.

74
Fig. 3.7(a) Schematic diagram for the cavity with pilot injection configuration.
Bhydm
o
h
OnHticreaeinnTn
Daw^aeiilfosafc
L
33>
Fig. 3.7(b) Schematic diagram for the cavity with pilot objection configuration at the symmetry plane with full-dimensions.
Reproduced with permission of the copyright owner. Further reproduction prohibited without permission.

76
Because of the turbulent nature of the case study, the influence of turbulence on
the reaction rate is taken into account by comparing the Arrhenius reaction rate and the
two eddy-dissipation reaction rates. Out o f the three mentioned rates the limiting
(slowest) rate is used as the reaction rate and the contributions to the source terms in the
species conservation and energy equations are calculated from this reaction rate.
The following global one-step reaction of propane is used to calculate the
Arrhenius reaction rate in the present study:
C3ff8 +50 2----->3C02+4H20 (4.1)
The Arrhenius reaction rate constants for the chemistry scheme are listed below,
Pre-exponential factor= 4.836e+09
Activation energy = 1.256e+08 [J/kgmol]
Temperature exponent= 0
The renormalized group (RNG) form of the tc-e turbulence model is used. The
turbulence near-wall is treated using the two-layer zonal model.
Because the flow is compressible and a multicomponent mixture, it is modeled as
an ideal gas and the density is calculated as a composition-dependent property. A
composition-dependent specific heat capacity is defined for the multicomponent mixture
material while temperature-dependent heat capacities for the individual species are
specified. The solver computes the mixture’s specific heat capacity as a mass fraction
average of the pure species heat capacities. The viscosity and thermal conductivity are
defined as composition-dependent properties.
The coupled solver is used with the explicit formulation and the steady state
approach. The second order upwind scheme is used for discretization of the flow,
turbulence kinetic energy, and turbulence dissipation rate equations.
4.3 G rid Independence Study
Unstructured grid mesh is used to simulate this case study. The full details for the
mesh elements, and the faces and volume-meshing scheme were previously reported in
Sec. 3.5.
For the sake of eliminating the factor of the effect o f the grid refinement on the
accuracy o f the results, the grid independence study was performed. Two grid sizes were
implemented. Unstructured grid mesh with 207,125 tetrahedral cells was used reaching
Reproduced with permission of the copyright owner. Further reproduction prohibited without permission.

77
the converged solution followed by its adapted version that is composed of 402,873
tetrahedral cells. The converged solution was also obtained using the larger grid.
The longitudinal distribution of the calculated averaged upper-wall absolute
pressure along the combustor length is plotted for both grid sizes to judge for the
independence of calculated results on the grid refinement. Twelve cross flow lines
marking the intersection o f the combustor upper wall and the corresponding cross flow
planes are defined along the upper wall length. The twelve cross flow planes are defined
at X=0.001, 0.015, 0.020, 0.025, 0.030, 0.031, 0.070, 0.090, 0.120, 0.150, 0.180, and
0.219m. The points on the curves of Fig. 4.1 represent the area weighted averages of
absolute pressure at all grid cells of the twelve intersection lines for both grid meshes
used. The solid line represents the calculated values obtained using the small grid size
while the dotted line represents those of the large grid size.
The area-weighted average of a quantity (d>) is computed by dividing the
summation of the product o f the selected field variable and facet area by the total area of
the surface as follows:
j > |A | (4.2)A A ,-=l
Figure 4.1 shows a comparison between the averaged upper-wall absolute
pressures for both grids used. An excellent coincidence between the two curves is
manifested. The maximum pressure difference between the two curves with respect to the
maximum average upper-wall pressure value in the whole field is 2.89% at the axial
location of X — 70 mm. Achieving the grid independence study, the remaining of the
calculations was conducted using the small grid and these results are presented here.
4.4 Results4.4.1 Symmetry Plane Results
The flow field features and the combustion characteristics are discussed through
the presentation of flow contours at the symmetry plane as depicted in Figs. 4.2-4.5.
The contours o f the absolute pressure throughout the combustor symmetry plane
are presented in Fig. 4.2. The combination of the expansion and shock waves along the
combustor length is shown. The Prandtl-Meyer expansion waves are formed right at the
step comer (X=0.030m). The contour values show the pressure decrease associated with
Reproduced with permission of the copyright owner. Further reproduction prohibited without permission.

78
these expansion waves. The high-pressure fuel injection in the low-pressure combustor
environment causes the fuel to expand, penetrating down the combustor height. The fuel
expansion is followed by the barrel shock; confining the fuel plume and raising up the
pressure through the normal injection plane. The interaction o f the fuel injection and the
incoming supersonic air brings about the bow shock that extends diagonally downstream
the step base area hitting the lower combustor wall at X=0.090m. A series of reflection
waves off the upper and lower combustor walls is observed by following the change in
the values of the pressure contours around X=0.136m for the upper wall and X=0.092m
and 0.184m for the lower wall. The pressure drop in the regions upstream and
downstream of the normal injection location is responsible for creating vortices and
recirculation zones that entrain the incoming supersonic air to be mixed with the pilot
fuel injection forming a combustible mixture. The ignition o f this combustible mixture
yields high temperature medium that facilitates the ignition of the normal injection and
supports and maintains the main flame extending downstream towards the combustor
exit.
Figures 4.3 and 4.4 show the temperature and CO2 contours respectively at the
symmetry plane. The step base area exhibits a medium o f high temperature and high
combustion products concentration that surrounds the upstream side of the normal
injection. This region is brought by the ignition of the combustible mixture formed in the
step base area and the consequent release of heat of combustion. This high temperature
region represents the main flame holding mechanism in the investigated configuration. It
is worth nothing that in the main flame area extending downstream o f the normal
injection, the flame possesses its highest temperature and combustion products
concentration in the far field domain towards the combustor exit and attached to the
upper wall. The area closer to the downstream o f the injection location characterizes
lower temperature and products concentration. This observation is one o f the inherent
effects o f the side sweeping of the step that pushes the flow field downstream
substantially releasing the heat of combustion in the far field domain. For such flow field
it is recommended to optimize the combustor length to ensure the complete combustion
and consequently the full liberation of the chemical energy stored in the fuel before
exiting the combustor.
Reproduced with permission of the copyright owner. Further reproduction prohibited without permission.

79
The distribution of the Mach number contours at the symmetry plane is presented
in Fig. 4.5. The dominance o f the supersonic flow in the combustor is exhibited except in
few pockets in the upper part o f the combustor. The recirculations upstream and
downstream o f the normal injection in the upper area of the combustor slow down the
flow in these regions creating two subsonic pockets. The 3°-divergence of the upper wall
expands the flow in the upper part of the combustor creating a slight supersonic flow just
upstream o f the reflection waves off the upper wall at X=0.L36m. The compression of
this weak supersonic flow brings about the third subsonic flow area in the far domain
close to the upper wall. Further downstream the flow expansion continues and the flow
exits the combustor slightly supersonic in the upper domain with the exit Mach number
increasing towards the combustor lower wall. The previous flow description well matches
the typical aerodynamics o f such flow field.
4.4.2 Cross Flow ResultsThe flow field features and the combustion characteristics at two cross flow
planes, at X=0.031m and 0.070m, are depicted in Figs. 4.6-4.12. These cross flow planes
are used to present the flow nature inside the flame holding area, which is the step base
area, and at the normal injection station, respectively.
Figure 4.6 shows the temperature contours inside the step base area at X=0.031m.
The two pilot injections are fully surrounded by high temperature medium that extends
downstream to approach the upstream side of the normal injection as discussed in Fig.
4.3. The effect of the side sweeping of the step is apparent in keeping the high-
temperature-combustion gases produced by the ignition o f the pilot injections
concentrated towards the middle area of the combustor with relatively lower temperature
gases at the side walls o f the combustor.
Figures 4.7 and 4.8 show the velocity vectors and stream line contours at two
cross flow locations, X=0.03Im and 0.070m, inside the step base area and at the normal
injection location, respectively. The two plots show the interaction between the incoming
supersonic airflow, coming normal the page, and the pilot and main injections,
respectively. Due the symmetry o f the configuration the streamlines were added to just
one half o f the domain. The vortices formed around the fuel injection help in promoting
the air-fuel muting and consequently lead to more efficient combustion. The high-
Reproduced with permission of the copyright owner. Further reproduction prohibited without permission.

pressure normal injection adds to the momentum of the recirculations surrounding it
creating two strong vortices as shown in Fig. 4.8.
Figure 4.9 shows the Mach number contours at the normal injection cross flow
plane. Once the fuel is injected at high pressures it expands in the surrounding lower-
pressure medium. This is evident from the increase of the Mach number in this area that
reaches a value around Mach 3. Due to the effect of the barrel and bow shocks
surrounding the normal fuel injection, the flow is compressed decreasing its Mach
number. Passing the area o f shocks and due to the interaction between the supersonic
incoming airflow and the normal fuel injection, the cross flow again accelerates and
increases the Mach number.
The effects of the expansion and shock areas on the cross flow absolute pressure
and static temperature distributions along the normal injection plane are shown in Figs.
4.10 and 4.11, respectively. The advancement o f the tv/o pilot flames towards the normal
injection plane causes the two high temperature regions to permanently surround the
normal injection as shown in Fig. 4.11. This is a very supportive tool for the ignition of
the normal injection. The regions close to the sidewalls o f the combustor exhibit lower
temperature levels as previously explained in Fig. 4.6. Figure 4.12 presents the CO2 mass
fraction contours at the normal injection plane showing the high combustion products
concentration surrounding the normal injection.
4.4.3 Pilot Injection Plane ResultsThe velocity vectors and stream lines contours, the temperature and CO2 mass
fraction contours at the pilot injection plane, Y=0.0304m, are presented in Figs. 4.13-
4.1S. The interaction of the incoming supersonic air flow, that spills over the swept
sidewalls o f the combustor, and the pilot and normal fuel injections causes the flow
recirculations in the pilot and main injection zones as shown in Fig. 4.13. The pilot
flames initiated at the pilot injection locations and extended downstream surrounding the
main normal injection, at X=0.070m and Z=0, are manifested in Figs. 4.14 and 4.15. The
high-temperature and high combustion products concentrations featuring the pilot flame
area are clearly seen. As previously explained, sweeping of the combustor sidewalls
forces the hot and highly concentrated combustion gases towards the combustor
centerline while the combustor side areas characterize lower temperature and products
Reproduced with permission of the copyright owner. Further reproduction prohibited without permission.

81
concentration as shown in Figs. 4.14 and 4.15. The high temperature and combustion
products concentration in the far field domain towards the combustor exit are clear,
which confirms the recommendation of using longer combustors with the swept step
configuration.
4.4.4 Upper-Wall Averaged ResultsThe average distributions of the static temperature and absolute pressure at the
combustor upper-wall are depicted in Fig. 4.16. The way the average temperature and
pressure are calculated is previously presented while discussing the grid independence
study at the beginning o f this chapter.
The slight increase in the upper wall temperature downstream of the combustor
inlet is due to the surface frictional heating. The flow expansion due to the side sweeping
o f the step decreases the temperature of the upper wall downstream reaching the step
edge where the pilot flame is initiated. This is responsible for the temperature increase
that reaches the first temperature peak around the pilot injection ports, X=0.031m. The
incoming supersonic air spills over the sidewalls of the swept step and expands mixing
with the high-temperature pilot flame combustion products in the step base area. This
leads to the reduction o f the average upper-wall temperature downstream the step area
approaching the low-temperature normal fuel injection location, X=0.070m. The ignition
o f the normal fuel injected leads to the second increase in the upper-wall average
temperature downstream of the injection station. The flow compression through the shock
wave reflected off the upper wall around X=0.136m contributes to increasing the rate of
the temperature increase at this location. The high temperature in the far field domain
towards the upper wall explains the increase of the temperature at the combustor exit.
The physics explained in the temperature field applies to the pressure field except
that the high-pressure peak coincides with the normal injection location, X=0.070m.
The propane study yielded the following conclusion. The swept step showed the
ability to hold the propane flame in the supersonic air stream without extinction. It was
found that the side weeping of the combustor exhibits the high, temperature and
combustion products concentration in the far field domain while the area downstream of
the normal injection location characterizes lower temperature and products concentration.
I t is recommended to optimize the combustor length to ensure the complete combustion
Reproduced with permission of the copyright owner. Further reproduction prohibited without permission.

82
and consequently the full liberation o f the chemicaL energy stored in the fuel before the
fuel exits the combustor.
Reproduced with permission of the copyright owner. Further reproduction prohibited without permission.

Aver
age
Upp
er-W
all
Abso
lute
Pres
sure
, kP
»
83
290
207125 Grid260
1— 402873 Grid
230
200
170
140
110
0 0.025 0.05 0.075 0.1 0.125 0.15 0.175 0.2 0.225Combustor Length, M
Fig. 4.1 Comparison between longitudinal average upper-wall absolute pressure distributions for both grid sizes, grid independence study.
Reproduced with permission of the copyright owner. Further reproduction prohibited without permission.

84
Abs., Pres., Pa34 205081033 194336932 183592831 172848730 162104629 151360528 140616427 129872326 1191282 s25 1083841 . r>-24 976400 £23 868959 .BA22 761518 *321 654077 as20 546636 k19 439195 s
I18 33175417 22431316 116872 s15 9804014 8581413 84199 W12 8306911 7752210 729339 719198 697027 658566 624485 601364 582693 575882 546351 52927
0.04 -
0.035 -
Symmetry Plane
1
1I
I
0.015 -
0.005 -
0 0.02 0.04 0.05 0.08 0.1 0.12 0.14 0.16 0.18 0.2 0.22
Combustor Length, M
Fig. 4.2 Absolute pressure contours at the symmetry plane.
Reproduced with permission of the copyright owner. Further reproduction prohibited without permission.

8 5
Static Temp., K34 308233 299732 291231 282730 274229 265728 257227 248726 2402 s25 231624 2231 £23 214622 2061 *521 1976 X20 1891 faa19 1806 s
118 172117 163616 1551 s15 146514 1380 513 129512 121011 112510 10409 9558 8707 7856 6995 6144 5293 4442 3591 274
0.04 -
0.035 -
M 0.025
Symmetry Plane
0.015
0.005 -
0.02 0.04 0.00 0.08 0.1 0.12 0.14 0.10 0.18
Combustor Length, M2 0.22
Fig. 4.3 Static temperature contours at the symmetry plane.
Reproduced with permission of the copyright owner. Further reproduction prohibited without permission.

86
C02 Mass Fract34 0.140633 0.136532 0.132431 0.128230 0.124129 0.120028 0.115827 0.111726 0.1076 §25 0.103424 0.0993 g23 0.095122 0.0910 *321 0.0869 as20 0.082719 0.0786 Q18 0.074517 0.0703 116 0.0662 JO15 0.0621 514 0.0579 &13 0.053812 0.049611 0.045510 0.04149 0.03728 0.03317 0.02906 0.02485 0.02074 0.01653 0.01242 0.00831 0.0041
Symmetry Plane
0.035
0.025
0.015
HiiJ m i
0.005
1 111 ’ 1 ' 1 '0.02 0.04 0.06 0.08 0.1 0.12 0.14 0.16 0.18
Combustor Length, M0.22
Fig. 4.4 CO2 combustion product mass fraction contours at the symmetry plane.
Reproduced with permission of the copyright owner. Further reproduction prohibited without permission

87
i
Mach No.36 3.13135 3.04234 2.95233 2.86232 2.77331 2.68330 2.59329 2.50428 2.41427 2.32426 2.23525 2.14524 2.05523 1.96622 1.87621 1.78620 1.75219 1.73318 1.69617 1.60716 1.51715 1.42714 1.33813 1.24812 1.15811 1.06910 0.9799 0.8898 0.8007 0.7106 0.6205 0.5314 0.4413 0.3512 0.2611 0.172
Symmetry Plane0.035
.O f 0.025
S 0.015
0.005
I t0 0.02 0.04 0.06 0.08 0.1 0.12 0.14 0.16 0.18 0.2 0.22
Combustor Length, M
Fig. 4.5 Mach number contours at the symmetry plane.
Reproduced with permission of the copyright owner. Further reproduction prohibited without permission.

88
0.035Static Temp., K40 305539 298138 290837 283536 276235 268834 261533 254232 246831 239530 232229 224928 217527 210226 202925 195624 188223 180922 173621 166320 158919 151618 144317 137016 129615 123414 122913 122912 122711 122310 12139 12078 11507 10776 10035 9304 8573 7832 7101 637
0.025
’3 0.02
3 0.015
0.005 X=31mm cross plane
•0.005 0 0.005
Combustor Width, M0.01
Fig. 4.6 Static temperature contours at X=0.031m cross flow plane.
|Reproduced with permission of the copyright owner. Further reproduction prohibited without permission

Com
busto
r H
eight
, M
89
0.035
0.03
0.025
0.02
0.015
0.01
0.005
0
Fig. 4.7 Velocity vectors and streamlines contours at X=0.031m cross flow plane.
, ill''I f ^
' I t V % v ^: ! | v ' *: \ \ \ \ ^ ^ ^ ^T, \ \ \ \ \ \ v
j , ‘ V \ V v \ \ \ > * ,l ' i m V \ \ \x-s j I /h ' 1 1 v I''\ \ v % t ,
- ^ ^ W ,r / 11— i . — /_ / i i
X=31mm cross plane] i>v W V > 't'l /
■ ' y " (H 1 1111' S / r t . I . I l((I '.I ■f . ! i ■ • 1 ■1 A1 A AACJL
- 0.01t
-0.005 0 0.005
Combustor Width, M
Reproduced with permission of the copyright owner. Further reproduction prohibited without permission.

-0.01 -0.005 o 0.005 0.01
Combustor Width, M
Fig. 4.8 Velocity vectors and streamlines contours at X=0.070m cross flow plane.
Reproduced with permission of the copyright owner. Further reproduction prohibited without permission.

91
Mach No. 0.03540393837363534333231302928272625242322212019181716151413121110987654321
2.9672.9072.8462.7862.7252.6652.6052.5442.4842.4232.3632.3022.2422.1822.1212.0612.0001.9401.8801.8191.7591.6981.6381.5771.5171.4571.3961.3361.2751.2151.1541.0941.0340.9730.9130.8520.7920.7310.6710.611
0.025
*S 0.02
3 0.015
0.005 ~ X=70mm cross plane
•0.01 -0.005 0 0.005
Combustor Width, Mo.oi
Fig. 4.9 Mach number contours at X=0.070m cross flow plane.
Reproduced with permission of the copyright owner. Further reproduction prohibited without permission.

92
A b s.> P i c s . , .P a34 205081033 192415232 179749431 167083630 154417929 141752128 129086327 116420526 1037547 §25 910889 . r24 784232 4323 657574 jo t22 53091621 404258 9320 277600 u19 150942 a18 96731 a17 9341216 91030 a15 89992 ss
e14 88147 Q13 8729912 8465611 8103310 786379 751348 724367 667976 596675 548574 542823 537952 400981 30268
0.035
0.025 -
X=70mm c r o s s
0.005
0.015
0.005 -
•0.005
Combustor Width, M
Fig. 4.10 Absolute pressure contours at X=0.070m cross flow plane.
Reproduced with permission of the copyright owner. Further reproduction prohibited without permission.

93
Static Temp., K 31 263430 255629 247728 239827 232026 224125 21632423222120191817161514131211
87654321
20842005192718481770169116131534145513771298122011411062
10 9849 905
827748670591512434355277
0.025
3 0.015
0.005 X=70 mm cross plane
- 0.01 -0.005 0 0.005 0.01
Combustor Width, M
Fig. 4.11 Static temperature contours at X=0.070m cross flow plane.
Reproduced with permission of the copyright owner. Further reproduction prohibited without permission.

94
C 0 2 Mass F iac t 0.035 P35 0.1042034 0.1011333 0.0980732 0.0950031 0.0919430 0.0888729 0.0858128 0.0827427 0.0796826 0.0766225 0.0735524 0.0704923 0.0674222 0.0643621 0.0612920 0.0582319 0.0551618 0.0521017 0.0490316 0.0459715 0.0429014 0.0398413 0.0367812 0.0337111 0.0306510 0.027589 0.024528 0.021457 0.018396 0.015325 0.012264 0.009193 0.006132 0.003061 0.00003
0.025
5 0.02
3 0.015
0.005 X=70 mm cross plane
-0.005 0.005 0.01
Combustor Width, M
Fig. 4.12 CO2 combustion product mass fraction contours at X=0.070m cross flow plane.
Reproduced with permission of the copyright owner. Further reproduction prohibited without permission.

95
0.0125
0.0075
0.005
0.0025
r> r» 5 >
» r.0-0.0025S o
w -0.005
0.0075
Pilot M ection Plane
£ c n x0.01250.04 0.05 0.08 0.1 0.12 0.14 0.16 0.18 0.2 0.2
Combustor Length, M
Fig. 4.13 Velocity vectors and streamlines contours at the pilot injection plane, Y=0.0304 m.
Reproduced with permission of the copyright owner. Further reproduction prohibited without permission.

96
Static Temp., K 25 318224 306323 294322 282321 270420 258419 246418 234417 222516 218715 210514 198513121110987654321
18661746162615061387126711471027908788668549429
0.0125
0.0075
0.005
€ 0.0025
.0-0.0025S ©
W -0.005
0.0075
Pilot Iniiection Plane
0.01250.04 0.06 0.08 0.1 0.12 0.14 0.16 0.18 0.2 0.22
Combustor Length, M
Fig. 4.14 Static temperature contours at the pilot injection plane, Y=0.0304 m.
Reproduced with permission of the copyright owner. Further reproduction prohibited without permission.

97
C 0 2 M ass Enact.24 0.1433523 0.1373822 0.1314121 0.1254320 0.1194619 0.1134918 0.1075117 0.1015416 0.0955715 0.0895914 0.0836213 0.0776512 0.0716811 0.0657010 0.059739 0.053768 0.047787 0.041816 0.035845 0.029864 0.023893 0.017922 0.011951 0.00597
0.0125
0.0075
0.005
3 0.0025
I■Q-0.0025
W -0.005
0.0075
Pilot uuecfaon Plane
0.0125 i a r r r r0.04 0.06 0.08 0.1 0.12 0.14 0.16 0.18 0.2 0.22
Combustor Length, M
Fig. 4.15 CO2 combustion product mass fraction contours at the pilot injection plane, Y=0.0304 m.
Reproduced with permission of the copyright owner. Further reproduction prohibited without permission.

Aver
age
Upp
er-W
all
Stati
c Te
mpe
ratu
re,
K
98
2902600
’Static Temperature 2602400
^ Absolute Pressure230
2200
200
2000170
1800■ 140
1600110
. ♦ 80
1200 50
10000.2250.075 0.125 0.1750.025 0.05 0.1 0.150
Combustor Length, M
Fig. 4.16 Average upper-wall absolute pressure and static temperature distribution along the combustor length.
Reproduced with permission of the copyright owner. Further reproduction prohibited without permission.
Aver
age
Upp
er-W
all
Abso
lute
Pres
sure
, kP
a

99
CHAPTER V
ETHYLENE SUPERSONIC COMBUSTION
5.1 IntroductionA detailed description of the physical model, the boundary and initial conditions,
and the important flow parameters characterizing the case study are presented in the
physical model description. The definitions o f the terms used in the presentation o f the
results and their calculation procedures are then offered. The most significant results that
can to the best reflect the flow field characteristics o f the supersonic ethylene combustion
conclude the course o f this chapter. The results presented in this chapter are divided into
three sub-sections. First, the effect of the combustor configuration on the combustion
characteristics and flame holding of the supersonic ethylene flame is presented. Second, a
discussion on the effect of the equivalence ratio of the main fuel injection on the
combustion flow field is followed. The chapter is concluded by analyzing the effect of
the equivalence ratio of the pilot fuel injection on the flame holding mechanism, and the
general features of the flow and energy fields.
5.2 Physical Models and Flow Calculations DescriptionThe supersonic ethylene combustion flow field is investigated through three
physical models; rearward-facing step, cavity without pilot injection, and cavity with
pilot injection respectively. The configurations of the three physical models are described
in details in Sec. 3.7. In the present section, the flow field properties and the detailed
description o f the physical models used in the calculations are provided.
The three investigated physical models share the following flow features. The
incoming supersonic airflow is vitiated with H2O mass fraction of 0.17 and the typical Oi
concentration in air. The incoming air total temperature and pressure are 1800 K and
431.7 kPa respectively. The normal ethylene main injection is gaseous with static
temperature o f 300 K, and equivalence ratio of 0.6 calculated based on the total amount
o f the incoming supersonic airflow. For the pilot injection cases, the parallel ethylene
pilot injection is gaseous with, static temperature o f500 K, and equivalence ratios o f 0.02,
Reproduced with permission of the copyright owner. Further reproduction prohibited without permission.

LOO
0.03, 0.045, 0.06, and 0.08 calculated based on the total amount o f the incoming
supersonic airflow.
The pressure inlet boundary conditions are specified for the incoming air inlet,
and both the pilot and main ethylene injections. The flow outlet is supersonic and
specified as pressure outlet boundary that uses first order extrapolation for all parameters
from the adjacent inflow cells. At the supersonic inflow boundaries, the total and static
pressures, the total temperature, and the species mass fractions are specified. For these
supersonic inflow boundaries, uniform conditions are assumed for the primitive
parameters. AIL walls and step boundaries are treated as no-slip adiabatic surfaces.
Applying ftee-stream inlet conditions throughout the entire flow field sets the initial
conditions.
Because of the turbulent nature of the case study, the influence of turbulence on
the reaction rate is taken into account by comparing the Arrhenius reaction rate and the
two eddy-dissipation reaction rates. Out of the three mentioned rates, the limiting
(slowest) rate is used as the reaction rate and the contributions to the source terms in the
species conservation and energy equations are calculated from this reaction rate.
The following global one-step reaction o f ethylene is used to calculate the
Arrhenius reaction rate in the present study:
C2ff4+302------>2C02Jt-2Hz0 (5.1)
The Arrhenius reaction rate constants for the chemistry scheme are listed below,
Pre-exponential factor = 2e+12
Activation energy = 1.256e+08 [J/kgmol]
Temperature exponent—0
The renormalized group (RNG) form of the K-e turbulence model is used. The
turbulence near-wall is treated using the two-layer zonal model.
Because the flow is compressible and a multicomponent mixture, it is modeled as
an ideal gas and the density is calculated as a composition-dependent property. A
composition-dependent specific heat capacity is defined for the multicomponent mixture
material while temperature-dependent heat capacities for the individual species are
specified. The solver computes the mixture’s specific heat capacity as a mass fraction
Reproduced with permission of the copyright owner. Further reproduction prohibited without permission.

101
average of the pure species heat capacities. The viscosity and thermal conductivity are
defined as composition-dependent properties.
The coupled solver is used with the explicit formulation and the steady state
approach. The second order upwind scheme is used for discretization of the flow,
turbulence kinetic energy, and turbulence dissipation rate equations.
5.3.1 Stagnation Pressure Efficiency and Entropy ProductionAcross a scramjet combustor, the loss in the stagnation pressure is o f a
fundamental interest, and may introduce an efficiency based on such loss as follows
where r}^ , PT, and n are the stagnation pressure efficiency, the total pressure, and the
total pressure ratio respectively and the subscripts “inlet” and “outlet” refer to the
combustor inlet and outlet station respectively.
The relationship o f interdependence of the total pressure ratio n and the entropy
production AS is defined as [26]:
where 5 and R are the entropy and the gas constant respectively and the subscripts
“inlet” and “outlet” refer to the combustor inlet and outlet station respectively.
This means that the total pressure ratio n depends exponentially upon the
entropy increase. In other words, the total pressure ratio should be expected to decrease
very rapidly as entropy, the natural indicator of the effects o f dissipation or flow losses,
increases. From Eq. (5.3), the entropy production is defined as:
5.3.2 Kinetic Energy EfficiencyThe concept o f kinetic energy efficiency expounded in Refs. [200-202], can
be used to obtain the following definition:
5.3 Definitions
[143]:
(5.2)
(5.3)
(5.4)
Reproduced with permission of the copyright owner. Further reproduction prohibited without permission.

103
where mCiW< ,nj is the injected fuel flow rate,
= \ p yc&< (V-n)dA,
p, YCiHt, V , and A are the local fuel density, fuel mass fraction, normal
velocity vector, and cross section area, respectively.
5.3.4 Fuel Penetration and Rate of Fuel DecayThe penetration of the fuel jet is measured at the point in the cross flow plane of
the normal fuel injection, X=0.070m, where the maximum fuel mole fraction has dropped
to 0.005 [52]. Since fuel mole fraction distribution at the normal fuel injection cross flow
plane marks the maximum fuel concentration at the line of symmetry, the fuel penetration
is defined by plotting the fuel mole fraction distribution versus the combustor height at
the cross flow line that marks the intersection o f the symmetry plane and the normal fuel
injection cross flow plane. For easily discussing the penetration results, the penetration
values are presented while measured from the upper-wall of the combustor at the normal
injection location.
The rate at which the maximum fuel concentration at each cross section decays
with axial distance is a good indication of the overall mixing rate o f the jet [52]. The fuel
mole fraction contours at sixteen cross flow planes, at X= 0.001, 0.015, 0.030, 0.031,
0.039, 0.048, 0.0566, 0.065, 0.070, 0.110, 0.150, 0.190, 0.220, 0.260, 0.300, and 0.349m
respectively, are plotted which showed the maximum fuel mole fraction to be located at
the combustor centerline. Accordingly, the combustor symmetry plane is used to define
the value of maximum fuel mole fraction at the sixteen lines making the intersection of
the symmetry plane with the corresponding sixteen cross flow plane that are mentioned
earlier. The longitudinal distribution of the maximum fuel mole fraction, a t each cross
flow plane, through the combustor length is plotted to evaluate the overall mixing rate o f
the fuel jet.
53.5 Upper-Wall Average Absolute Pressure and Static Temperature DistributionFor the heat transfer and design considerations, the longitudinal distribution of the
average absolute pressure and static temperature along the upper-wall of the combustor
are calculated. Sixteen cross flow planes are defined at X=0.001, 0.015, 0.030, 0.031,
0.039, 0.048, 0.0565, 0.065, 0.070, 0.110, 0.150, 0.190, 0.220, 0.260, 0.030, and
Reproduced with permission of the copyright owner. Further reproduction prohibited without permission.

105
that extends to towards the upstream side of the normal infection. The temperature
contours depicted in Fig. 5.2(a) show the high-temperatiire gases in the step base area.
These high-temperature gases help in initiating the ignition of the normal fuel Injection
and maintaining its flame. This represents the flame holding mechanism of the step
configuration.
The interaction between the flow recirculations in the step base area and the
incoming supersonic airflow creates a two counter-flow vortices as shown in Fig. 5.3(a)
which presents the velocity vectors and streamline contours at a cross flow plane inside
the step base area, at X=0.040m. The vortices in the step base area direct the flow
outward in the direction o f the combustor sidewalls. These vortices are responsible for
promoting the fuel/air mixing in the lateral direction inside the step base area and
consequently maintaining an efficient combustion in this area. This is evident in the
temperature contours at the same cross flow plane that is depicted in Fig. 5.4(a), which
shows the high temperature area that extends throughout the width of the combustor
surrounding the step edge, Y=0.025m.
The flow field features and energy field characteristics at Y=0.0304m lateral flow
plane that lies in the middle of the step base area and extends longitudinally through the
combustor length are shown in Figs. 5.5(a) and 5.6(a). This lateral flow plane marks the
pilot injection plane for the cases with pilot infection. The flow field in this plane features
a pair of counter flow vortices created in the step base area and surrounding the normal
fuel infection as shown in Fig. 5.5(a). Downstream the normal fuel injection, another
vortical region exists that directs the flow at the wakes o f the injection location towards
the combustor sidewalls. As explained before, these sets of vortices are effective in
enhancing the fuel/air mixing in the regions both upstream and downstream of the normal
injection station. The permanent high temperature regions surrounding the normal
injection station are evident in Fig. 5.6(a), which are due to the vortices formed in their
respective areas as explained before.
The flow field features and energy field characteristics o f the step configuration
that are presented at the symmetry plane, at X=0.040m cross flow plane inside the step
base area, and at Y=0.0304m lateral flew plane exhibited the manifested flame holding
capability o f the step configuration in the supersonic air streams.
Reproduced with permission of the copyright owner. Further reproduction prohibited without permission.

106
The injection of the under-expanded high-pressure normal fuel injection, at
X=0.070m, in the low-pressure supersonic air medium originates the strong two pair o f
vortices surrounding the sides o f the normal fuel injection as shown in Fig. 5.7(a). These
vortices push the flow towards the combustor sides. The interaction between the flow
recirculations surrounding the normal fuel injection and the incoming supersonic airflow
creates the two counter-flow vortices that are shown in Fig 5.7(a). Fig. 5.8(a) presents the
cross flow temperature contours at the normal injection plane. It shows the high-
temperature areas at the sides of the normal fuel injection especially towards the
combustor sidewalls. These hot gases contribute to the holding mechanism o f the flame.
When comparing the velocity vectors and streamlines contours for the wedge
configuration, Fig. 5.1(b), to that of the step configuration that is previously explained,
Fig. 5.1(a), it is shown that the existence of the wedge expands the recirculations to
predominate the step base area. This yields a better fuel/air mixing scheme and
consequently a more efficient combustion. This is manifested in the higher temperature
levels in the step base area o f the wedge configuration as depicted in Fig. 5.2(b)
compared to that o f the step configurations, Fig. 5.2(a). Another advantage for the wedge
configuration, which distinguishes it from the step configuration, is the pocket o f high
temperature gases that is trapped between the wedge straight surface and the normal fuel
injection. This area takes over the role o f a permanent energy source that supports the
ignition o f the normal fuel injection. The better combustion characterization for the
wedge configuration is not only limited to the step base area but is presented in the
downstream flow field as well by observing the higher temperature levels in the case of
the wedge configuration compared to those of the step configuration in the downstream
flow field.
The wider vortices in the step base area in the wedge configuration over that of
the step configuration, as shown in Fig. 5.1(a) and (b), stretches the cross flow in the step
base area towards the bottom wall. This is evident when comparing the velocity vectors
and streamline contours of both configurations at X=0.40m cross flow plane that are
presented in Fig. 5.3(a) and (b). The preference o f the wedge configuration over the step
configuration in supporting the ignition and the flame holding o f the normal fuel injection
is demonstrated when observing the more homogenous temperature distribution and
Reproduced with permission of the copyright owner. Further reproduction prohibited without permission.

107
higher temperature levels pertinent to the wedge configuration in the cross flow plane,
X=0.40m, over that of the step configuration as shown in Figs. 5.4 (a) and (b).
When comparing Figs. 5.5(a) and (b), which present the velocity vectors and
streamline contours for both the step and wedge configurations at the Y=0.0304m lateral
flow plane, it is shown that the existence of the wedge downstream o f the step stretches
the two small counter flow vortices created in the step configuration to fully and laterally
occupy the entire cavity area. Therefore, the wedge configuration creates more
homogenous flow medium that enhances the combustion characteristics in this area. This
is obvious by observing the higher and more homogenous temperature distribution in the
step base area (the cavity area) in the case of the wedge configuration over that in the step
configuration as shown in Figs. 5.6(a) and (b), which present the temperature contours at
the Y=0.034m lateral flow plane. Again the influential effect of the wedge in both flow
regions upstream and downstream o f the normal fuel injection is presented by observing
the higher temperature levels in the entire flow field especially in the region surrounding
the normal fuel injection. This observation stresses on the superiority o f the wedge
configuration as a flame holding mechanism over that of the step configuration.
The comparison between the velocity vectors and streamline contours for both
configurations is done by observing Figs. 5.7(a) and (b), which present these vectors and
contours at the normal injection station, X=0.70m. The wedge existence enlarges the
recirculations area in the normal direction. This can be evaluated by locating the meeting
point of the two counter flow vortices that marks the interaction between the normal
injection and the incoming supersonic airflow. For the step configuration, this point is at
Y=0.01m compared to Y=0.007m for the wedge configuration. Comparing the
temperature contours for both configurations at the same cross flow plane, as shown in
Figs. 5.8(a) and (b) shows the positive effect of the wedge in increasing the temperature
of the gases surrounding the normal fuel injection plume compared to that of the step
configuration. This is translated in more potential for holding the flame in the supersonic
air streams.
One more comparison between the temperature flow fields o f the step and wedge
configurations in the downstream cross flow location at X=0.220m is presented in Figs.
Reproduced with permission of the copyright owner. Further reproduction prohibited without permission.

L08
5.9(a) and (b). These figures show the overall higher temperature levels exhibited when
using the wedge configuration over that of the rearward-facing step configuration.
The advantage of the wedge configuration, over the step configuration, is clearly' * ' *shown when comparing the axial combustion efficiency for both configurations as
depicted in Fig. 5.10. The remarkable difference at the normal fuel injection location
emphasizes on the supportive effect of the wedge that is just upstream of the normal fuel
injection, on burning more quantity of fuel compared to that of the step configuration.
Figure 5.11 shows the fuel penetration for both configurations under
investigation. The wedge configuration exhibits more fuel penetration through the
combustor height than that offered by the step configuration. This can be attributed to the
effect of the wedge, which enlarges the recirculations in the normal direction, as shown in
Figs. 5.7(a) and (b), and consequently permits the deeper fuel penetration compared to
that o f the step configuration. This observation is another advantage that is added to the
wedge configuration.
The comparison between the rates o f decay of the fuel concentration for both
configurations is presented in Fig. 5.12. In the step base area, the rate of fuel entrained to
this area, due to the created vortices, is higher than the rate o f fuel depletion by
combustion. This is the reason for the increase in the fuel mole fraction in this area for
both configurations. Due to the fact that the general combustion efficiency for the wedge
configuration is higher than that of the step configuration, as explained in Fig. 5.10, the
rate o f fuel depletion by combustion in the wedge configuration is higher than that in the
step configuration and consequently its rate of increase of the fuel concentration is lower
than that o f the step configuration. This leads to the conclusion of the better mixing
capabilities o f the wedge configuration compared to that of the step configuration in the
main flame holding region, the step base area. In the downstream o f the normal injection
station the rate o f mixing in the middle o f the combustor is shows in favor for the wedge
configuration but in the far field domain the step configuration shows higher mixing
capabilities, which enables its fuel concentration to converge towards the respective value
of the wedge configuration at the exit o f the combustor. This shows the good mixing
capabilities o f the step in the far field domain.
Reproduced with permission of the copyright owner. Further reproduction prohibited without permission.

109
The upper-wall average static temperature distributions across the combustor
length for both configurations are presented in Fig. 5.13. The wedge configuration
exhibits higher upper-wall temperature along the combustor length than that of the step
configuration. The same behavior is observed when comparing the flow field average
static temperature distributions for both configurations as depicted in Fig. 5.14. It is
worth of noting to observe the convergence o f the values o f the average temperatures for
both configurations, as compared in Figs. 5.13 and 5.14, at the combustor exit. This
observation stresses on the enhancement of the mixing capabilities of the step
configuration in the far field domain reaching that of the wedge configuration, as
discussed previously.
The longitudinal distributions o f the average absolute pressure for the two
configurations under investigation both at the upper-wall and in the flow field are
depicted in Figs. 5.15 and 5.16 respectively. The two figures show that, although the
pressure flow field is less sensitive to the configuration effect than the temperature flow
field, as presented in Figs. 5.13 and 5.14, but yet the wedge configuration shows higher-
pressure values in the region around the normal injection location.
Although the average absolute pressure values at the combustor exits for both
configurations do not have that much difference, but due to the higher average Mach
number at the combustor exit o f the wedge configuration over that of the step
configuration, the wedge-exit stagnation pressure is higher than that of the step. This
leads to the higher stagnation pressure efficiency for the wedge configuration, which
values 44.68%, while that of the step is 43.098%. This implies that the wedge
configuration exhibits lower stagnation pressure loss than that associated with the step
configuration. The same efficiency measure can be, noticed b y c o m p a r in g the entropy
production for both configurations, which amounts 254.97 and 261.65 J/kg. K for the
wedge and step configurations respectively. According to the definition o f the kinetic
energy efficiency presented in Sec. 5.3.2, the wedge configuration showed higher kinetic
energy efficiency than the step configuration. The kinetic energy efficiency for the wedge
configuration is 45.327% while its contemporary value for the step configuration is
43.679%.
Reproduced with permission of the copyright owner. Further reproduction prohibited without permission.

n o
The comparisons presented in Figs. 5.1-5.16 and that are held between the
efficiencies’ values confirm the general advantage o f the wedge configuration over the
rearward-facing step configuration with regard to holding the fiame in the supersonic
airstreams, producing overall higher temperature medium throughout the combustor, and
exhibiting lower flow losses and higher combustor efficiency.
5.4.2 Effect of Main Fuel Equivalence RatioIn this section, the effect o f the equivalence ratio (ER) o f the normal fuel injection
on the general flow field and combustion characteristics of the wedge configuration is
presented. Two ER values o f 0.60 and 0.45 for the normal fuel injection, calculated based
on the mass flow rate of the total incoming supersonic airflow, are used with no pilot
injection. The ER value is set by changing the main fuel injection pressure. Increasing the
fuel injection pressure increases the ER through the increase in the fuel mass flow rate.
The comparison between the flow field features, the energy field characteristics, and the
efficiencies levels o f the two case studies is held. The only changing parameter in this
comparison is the ER value while all other boundary conditions and solution parameters
are set the same.
When comparing the velocity vectors and streamlines contours o f the ER of 0.60,
Fig. 5.1(b), with that of the ER of 0.45, Fig. 5.1(c), it is shown that, using the lower ER,
the fuel entrained in the step base area forms a single recirculation region that fills in the
entire step base area while increasing the fuel injection pressure, ER of 0.60, more fuel is
entrained in the step base area that intensifies the recirculations but confines it in a
smaller region that is close to the normal injection location. One more observation that
worth o f noting is the effect o f the higher injection pressure, higher ER, in stretching the
recirculation region in the vertical direction towards the combustor lower wall. This is
shown in the deflection o f the incoming supersonic air stream downward towards the
combustor lower wall. The reason for this behavior is the higher penetration for the
normal fuel injection in the case o f the higher ER value as shown in Fig. 5.17, which
depicts the comparison between the fiiel penetration patters o f the two ER values. The
temperature contours at the symmetry plane for the ER values o f 0.60 and 0.45 are
presented in Figs. 5.2(b) and (c) respectively. The comparison between the two
temperature fields shows the better temperature distribution in the step base area in the
Reproduced with permission of the copyright owner. Further reproduction prohibited without permission.

I l l
lower ER case. It is also noticed that the higher injection pressure has a less advantageous
effect in reducing the temperature in the area close to the wedge angled-surface,
compared to that exhibited by the lower ER case, while it has a more advantageous effect
in the vertical stretching the high temperature medium backing the upstream side of the
normal fuel injection. This forms a supportive means of maintaining the main flame
while facing the high-speed incoming air. Another advantage for the higher ER case is
the pocket o f high temperature gases that is trapped between the wedge straight surface
and the normal fuel injection. This area plays the role of a permanent energy source that
supports the ignition of the normal fuel injection. In the downstream flow Held, the
higher ER case exhibited, in general, higher temperature levels compared to those of the
lower ER case.
The vertically widened vortices in the step base area in the higher ER case over
that o f the lower ER case, as seen in Figs. 5.1(b) and (c), stretches the cross flow in the
step base area downward towards the bottom wall. This would be clearly observed when
comparing the velocity vectors and streamlines contours of both ER cases at X=0.40m
cross flow plane as presented in Figs. 5.3(b) and (c). The additional fuel entrained in the
step base area, in the case o f the higher ER, with its relatively low temperature breaks the
temperature homogeneity featured in the lower ER case, Fig. 5.4(c), to produce a
temperature spectrum with low values in the middle of the combustor and high values
towards the combustor sidewalls. This is shown in Figs. 5.4(b) and (c). Although the high
ER case lacks the homogenous temperature distribution in the step base area, it posses
higher temperature levels in both the step base area and the lower half of the combustor
as shown in Figs. 5.4(b) and (c).
Figures 5.5(b) and (c) present the velocity vectors and streamline contours for
both ER cases at the Y=0.0304m lateral flow plane, it is shown that the additional
entrained fuel in the step base area, due to the higher injection pressure, develops a
couple o f vortices in the middle of the lateral plane. This couple o f vortices lumps
laterally towards the combustor sidewalls to form a recirculation that fully occupy the
entire step base area. Moreover, the higher injection pressure, higher ER case, lessens the
intensity o f the vortices formed in the down stream proximity o f the normal injection
station. These flow field differences are noticed when comparing Figs. 5.5(b) and (c).
Reproduced with permission of the copyright owner. Further reproduction prohibited without permission.

L12
The temperature flow fields for the two ER cases, Figs. 5.6(b) and (c), present the same
observation reported in the X=0.040m cross flow plane, which states that although the
high ER case lacks the homogenous temperature distribution in the step base area, it
exhibits higher temperature levels in both of the sides of the step base area and the
combustor flow field downstream of the normal fuel injection location, as shown in Figs.
5.6(b) and (c).
The comparison between the velocity vectors and streamline contours for both
ER’s at the normal injection station, X=0.070m, is held by observing Figs. 5.7(b) and (c).
The low-pressure region formed in the neighborhood of the normal injection location
creates the strong flow recirculations that intensify with the increase of the injection
pressure, increasing ER, especially in the combustor upper-wall area surrounding the
injection port. This brings about a better vortical pattern in the normal injection plane in
the case of the higher ER as shown in Figs. 5.7(b) and (c). Comparing the temperature
contours for both ER cases at the same cross flow plane, as shown in Figs. 5.8(b) and (c),
it is shown that the area surrounding the normal fuel injection port features higher
temperature gases in the higher ER case compared to that of the lower ER value. This
helps in igniting the normal fuel injected and enhancing the potential for holding the
flame in the supersonic air streams. Moreover, the higher ER case presents higher
temperature levels in the bottom half o f the combustor that shares in elevating the
average temperature in the cross flow plane of the normal fuel injection.
The comparison between the temperature flow fields of the two ER cases in the
downstream cross flow location at X= 0.220m is presented in Figs. 5.9(b) and (c). These
figures show the overall higher temperature levels exhibited when using the higher ER.
This is attributed to the higher amount of heat released in the flow field as a result o f the
more fuel injected in the case o f the bigger ER.
In the comparisons held between the 0.60 and 0.45-ER cases in all planes; the
symmetry plane, the X=0.040m and X=0.070m cross flow planes, and the Y=0.0304m
lateral flow plane, the higher ER case showed less homogenous combustion
characteristics in the step base area that is presented in the less homogenous temperature
distribution in the entire step base region. At the same time, the comparisons held at the
symmetry and lateral planes show higher temperature levels in the downstream flow field
Reproduced with permission of the copyright owner. Further reproduction prohibited without permission.

114
level of losses compared to those associated with the 0.45-ER case. The kinetic energy
efficiency o f the 0.60-ER case is 45.327% while the contemporary value o f the 0.45-ER
is 42.844%.
The comparisons presented in Figs. 5.1-5.9 (b) and (c) and Figs. 5.17-5.23 and
that held between the values o f the efficiencies shows the positive effect of increasing the
ER of the normal fuel injection on the general flow field features and energy field
characteristics in the combustor except in the step base area in which the lower ER
features better temperature distribution and higher combustion efficiency.
5.4.3 Effect of Pilot Injection Equivalence RatioThe effect o f the pilot injection equivalence ratio (ERp) on the flame holding
mechanism and combustion characteristics of ethylene in supersonic air streams is
studied. The only changing parameter in this study is the value of the ERp while keeping
all other boundary conditions and flow parameters the same. Changing the ERp is
achieved by changing the pilot injection pressure. The ERp is directly proportional to the
injection pressure, which means increasing the pilot injection pressures leads to the
increase in the ERp. There are seven values for the ERp investigated and these are 0 ,0 .01,
0.02,0.03,0.045,0.06, and 0.08. The ERp for each one of the three-fuel pilot injections is
calculated based on the total amount of the incoming supersonic airflow and the fuel
mass flow o f each individual pilot injection.
The flow field features and energy field characteristics o f the different ERp-case
are discussed and compared to determine the optimum ERp that achieves the aspired goals
o f holding the flame and enhancing the combustion characteristics. The injection pressure
that yields 0.01 ERp could not resist the backpressure in the step base area. The boundary
condition for the absolute injection pressure is 92705.8 Pa while the average
backpressure for the flow field surrounding in pilot injection ports in the cavity area is
95798.6 Par therefore, reversed flow through the pilot injection ports dominated the flow
field. This is demonstrated in Figs. 5.24(a), (b), and (c), which show the velocity vectors
and streamlines contours at the three fuel injection ports. The streamlines clearly show
the reversed flow getting out o f the injection ports. This observation nullified the
possibility o f using 0.01-ERp in the pilot injection study. Consequently, the 0.01-ERp-case
Reproduced with permission of the copyright owner. Further reproduction prohibited without permission.

115
was excluded from the comparison study of the pilot equivalence ratio. Figure 5.25
presents the reversed flow through the central pilot injection port at the symmetry plane.
The comparisons between the velocity vectors and the temperature contours o f the
six pilot injection equivalence ratios of 0.0, 0.02, 0.30, 0.045, 0.06, and 0.08 are held at
different flow planes, the symmetry plane, the X=0.040m plane, the pilot injection plane,
and the X= 0.070m plane.
The effect o f ERp on the flow field features in the step base area is presented in
Figs. 5.26(a)-(f). The pilot injection adds to the momentum of the recirculations in the
cavity area. This stretches the vortical structure to dominate the entire cavity area and
intensifies the recirculations. There is a common pattern noticed in the figure, that is the
progressive vertical confinement of the vortices, which recirculate inside the cavity
region, with the increase of the value of the ERp except at 0.02-ERp. This can be
perceived by defining the vertical location of the tangent of the outer most recirculating
streamline that deflects and revolves inside the cavity region. For ERp o f 0.0, 0.02, 0.30,
0.045, 0.06, and 0.08, the vertical locations of the tangents are 0.01265, 0.01353,
0.01112, 0.0106, 0.0103, and 0.00926 m respectively, measured from the combustor
upper wall of the cavity region.
This observation demonstrates the passive effect for the pilot injection on the flow
field quality in the cavity region. This negatively affects the fuel/air-mixing scheme in the
region, which is expected to provide the holding mechanism for the flame of the normal
injection. The only exception for this general observation is the 0.02-ERp-case. This
stretches the recirculation region both axially, through the combustor length to occupy
bigger area in the cavity region, and vertically, through the combustor height to improve
the interaction with the incoming supersonic air flow. This is presented in Fig. 5.26(b).
The effect of the ERp on the fuel penetration at the normal injection plane is
presented in Fig. 5.27. The ERp decreases the penetration of the normal fuel in the
incoming supersonic airflow, which reduces the available chances for the fuel/air mixing
in the main-flame region downstream o f the normal injection station. This should
negatively affect the combustion characteristics o f the main flame extending downstream
towards the combustor exit. The only exception for this trend is the 0.02-ERp-case, which
Reproduced with permission of the copyright owner. Further reproduction prohibited without permission.

116
features the highest fuel penetration value matching that of the 0.0-ERp-case. This is
another precursor for the superiority o f the 0.02-ERp-case in the range of ERp’s examined.
The effect of the ERp on the quality of the fuel/air-mixing scheme is shown in Fig.
5.28, which presents the rates of decay of the fuel along the combustor length for the six
ERp under investigation. This figure shows that the increase o f the ERp decreases the rate
o f decay of the fuel concentration (i.e., the slope of the lines) in the cavity region while it
does not affect it downstream the normal injection station. It is also shown that
downstream o f the normal injection location, the level of initial mixing is higher in the
cases of the smaller ERp (i.e., the lines are shifted downward in the vertical direction).
The progressive confinement of the recirculations in the cavity region with the increase
of the ERp, as shown in Fig. 5.26, leads to the decrease in the decay of the fuel
concentration and as a result affects the mixing rate in the cavity region negatively. The
0.02-ERp-case possesses the best mixing quality in the cavity region among all other
cases with pilot injection. In the region downstream of the normal injection and due to
the increased quantity o f pilot fuel injected, the initial mixing is seen to be higher in the
cases of lower ERp without affecting the rate of decay of the fuel concentration.
Comparing the rate of fuel decay for 0.0-ERp and 0.02-ERp-cases in the downstream flow
field shows that although the 0.02-ERp-case exhibits higher initial level of fuel mole
fraction, it offers a higher mixing rate (higher line slope) that converges its fuel mole
fraction value towards its lower counterpart value of the 0.0-ERp-case far downstream at
the combustor exit. This adds another feature for the 0.02-ERp-case.
The temperature contours at the symmetry plane for the investigated ERp-cases
are exhibited in Figs. 5.29(a)-(f). The no-pilot case presents the highest levels o f
temperature distribution in both flow field regions, the cavity region and the downstream
region. The excessive addition o f the relatively Iow-temperature-pilot injection in the
small cavity area quenches the flame entrained inside the cavity region, by the vortical
effect in this region. This effect reduces the overall temperature levels in the cavity
region that extends to surround the upstream part o f the normal injection. This leads to
deterioration in the combustion characteristics of the normal fuel injection. This is
obviously noticeable when comparing the levels of the temperature contours in the cavity
and downstream flow fields o f the 0.03-ERp, 0.045-ERp, 0.06-ERp, and 0.08-ERp-cases,
Reproduced with permission of the copyright owner. Further reproduction prohibited without permission.

L17
with those of 0.0-ERp-case as presented in Figs. 5.29(a),(c)-(f). The 0.02-ERp-case is
excluded from the general observation mentioned in the previous statement. The
comparison between the temperature contours at the symmetry plane for the 0.02-ERp and
0.0-ERp-cases reveals an advantage for the 0.02-pilot injection equivalence ratio case
over the 0.0-ERp-case and all examined ERp-cases. This is shown in Figs. 5.29(a), (b).
Although the 0.02-pilot injection reduces the temperature in the area occupied by the
relatively lower-temperature pilot injection, the three pilot flames extend downstream
towards the normal injection and the energy liberated by the pilot flames elevates the
temperature levels in the upper part of the cavity region and at the vicinity o f the normal
injection. This behavior generally increases the temperature o f the upstream face of the
normal injection, which enhances the flame holding mechanism of the normal fuel
injection.
The effect of the pilot equivalence ratio on the general energy field at the
symmetry plane, which is discussed above, is now presented at the pilot injection plane.
This is presented by comparing the temperature contours depicted in Figs. 5.30(a)-(f) for
the six investigated pilot injection cases. The suppressive effect of the pilot injection on
the temperature field in both o f the cavity and downstream regions is clear when
comparing Figs. 5.30(a) and (c)-(f). The positive effect o f the 0.02-ERp on elevating the
temperature levels in the cavity area is shown in Figs. 5.31(a), and (b) which presents the
temperature contours in the pilot injection plane with a focus on the region surrounding
the normal injection. The 0.02-ERp-case exhibits an advantage over the 0.0-ERp-case by
offering a temperature increase o f200° in the combustor central area, which is supporting
the upstream side of the normal injection and around 120° temperature increase at the
sides o f the combustor. This observation represents the main advantage o f the 0.02-ERp-
case over the 0.0-ERp-case in promoting the flame holding mechanism in the cavity
region.
The temperature contours at X=0.040m inside the cavity for the six ERp-cases
under investigation are shown in Figs. 5.32(a)-(f). The superiority of the 0.02-ERp-case is
affirmed when com paring its temperature levels at this cross flow location to those o f the
0.0-ERp-case as presented in Figs. 5.32(a) and (b). The 0.02-ERp-case possesses higher
temperatures at the upper part and the sides o f the combustor. This high temperature flow
Reproduced with permission of the copyright owner. Further reproduction prohibited without permission.

118
marches downstream to envelope the upstream side to the normal fuel injection. This
behavior stands in favor o f the 0.02-ERp-case while comparing i f to the 0.0-ERp-case in
regard to the quality o f the flame holding mechanism. The deterioration of the
combustion characteristics in the cavity area with the progressive increase of the ERp is
shown when comparing the decreasing temperature levels exhibited in Figs. 5.32(c)-(f),
which are pertinent to 0.03-ERp, 0.045-ERp, 0.06-ERp, and 0.08-ERp-cases respectively,
and those o f the base line case, 0.0-ERp, which are presented in Fig. 5.32(a).
The temperature contours at the normal injection plane, X=0.070m, for the six
ERp-cases under investigation are presented in Figs. 5.33(a)-(f). In this figure, the positive
effect of the pilot-injection equivalence ratio is revealed. Examining the values of the
temperature contours shows that increasing the ERp increases the temperature level in the
upper part of the combustor surrounding the normal injection. It is noticed that 0.03-ERp-
case exhibits the highest temperature level (3355 K) among the other investigated ERp-
cases. Although further increase in the ERp decreases the maximum temperature level, the
area inhabited by the high temperature values is getting larger especially in the 0.06-ERp-
case which reports the highest area-weighted average static temperature in the X=0.070m
cross flow plane.
The longitudinal distribution of the area-weighted average flow field static
temperature is plotted in Fig. 5.34 for the ERp under investigation. For easily analyzing
the effect o f the ERp on the temperature flow field along the combustor, the data of Fig.
5.34 is presented in Table 5.1. Examining the values of the flow field average
temperature reported in Fig. 5.34 and Table 5.1 shows that part of the relatively lower-
temperature pilot fuel injected in the small cavity region ignites releasing the energy of
combustion that raises the temperature in the cavity area. This is the reason for the
increase of the average temperature o f the 0.02-ERp over that o f the no-pilot injection
case, 0.0-ERp-case a t X=0.040m as shown in Fig. 5.34 and Table 5.1. Further increase in
the relatively low-temperature pilot injection does not sufficiently provide high quantity
o f energy o f combustion that can counteract the quenching effect o f the pilot fuel injected
in the cavity region. This leads to the continuous temperature decrease in the cavity
region with further increase in the pilot injection equivalence ratio, ERp, as presented in
Fig. 5.34 and Table 5.1 a t X=0.040, and 0.060m. The pilot fuel that does not ignite in the
Reproduced with permission of the copyright owner. Further reproduction prohibited without permission.

119
cavity region marches downstream along the combustor and part of it starts igniting in the
high-temperature side areas o f the combustor at the normal injection station. The 0.06-
ERp-case shows the highest average temperature at the normal injection plane,
X=0.070m. Further increase in the ERp entrains more quantity of pilot fuel whose heat
absorption effect is higher than the heat liberated by its combustion and as a result the
average flow temperature decreases for the 0.08-ERp-case at X=0.070m plane. The partial
consumption through combustion of the remaining fuel pilot injection that is entrained in
the flow field narrows the temperature difference shown at X=0.110m plane. Further
downstream, the balancing effect o f heat liberation through the ignition of the pilot fuel
and the heat absorbed by the extra non-ignited fuel keeps the 0.02-ERp-case featuring the
highest flow field average static temperature reaching the combustor exit as shown in Fig.
5.34 and Table 5.1. A thorough examination of the average flow field temperature shows
that 0.02-ERp-case represents the optimum pilot fuel injection choice that can achieve the
highest temperature in the flame holding region, cavity area, and downstream of the
combustor.
The continuous liberation of the heat due to the partial combustion o f the pilot
fuel, that did not ignite in the cavity area and is entrained in the flow downstream the
combustor, interprets for the increase of the flow field area-weighted average absolute
pressure with the increase in the value of the ERp as depicted in Fig. 5.35. Although the
entrained pilot fuel keeps igniting through its way downstream the combustion, the
largest amount of pilot fuel ignites at the normal injection location. This brings about the
large difference in the average pressure values that take place at the normal injection
location, X=0.070m. This difference converges in the downstream o f the combustor. A
slight increase in the flow pressure at the combustor exit with the increase of the ERp,
leads to a slight increase in the stagnation pressure efficiency, as depicted in Fig. 5.36, a
slight decrease in the entropy production, as depicted in Fig. 5.37, and a slight increase in
the kinetic energy efficiency, as depicted in Fig. 5.38.
Increasing the pilot injection equivalence ratio, ERp, increases the amount of fuel
that does not ignite in the cavity region and is entrained in the flow field to be ignited in
part downstream the combustor. As the combustion efficiency is defined to be inversely
proportional to the quantity o f fuel unbumed, the combustion efficiency decreases with
Reproduced with permission of the copyright owner. Further reproduction prohibited without permission.

120
the increase in the ERp, as shown in Fig. 5.39. This figure emphasizes on the advantage of
the 0.02-ERp-case over the other competing pilot injection cases by featuring the highest
combustion efficiency in the flame holding region, the cavity area. This combustion
efficiency is close to that o f the no-pilot injection case, 0.0-ERp.
Taking into consideration both of the flame holding capabilities and the
combustion and flow field qualities, the 0.02 case showed the optimum ERp value that
can achieve the trade off between the mentioned objectives. This conclusion is reached
after carefully analyzing the data presented in Figs. 5.24-5.39.
The main findings attained out o f the ethylene study can be summarized in the
following points. The step configuration with no pilot injection can afford the flame
holding mechanism in the supersonic air stream by creating the flow recirculations in the
step base area and featuring permanent high temperature region surrounding the normal
fuel injection. The step configuration showed good mixing capabilities in the far field
domain. The wedge configuration proved superiority over the generic rearward-facing
step configuration in holding the ethylene flame in the supersonic airstreams, producing
overall higher temperature medium throughout the combustor, and exhibiting lower flow
losses and higher combustor efficiency. The increase in the equivalence ratio of the
ethylene normal fuel injection enhances the general flow field features and energy field
characteristics in the combustor except in the step base area where the lower equivalence
ratio features better temperature distribution and higher combustion efficiency.
Although the wedge with no pilot injection configuration presents the highest
level o f temperature distribution in the cavity and downstream regions, the 0.02-pilot
equivalence ratio increases the temperature of the upstream face of the normal injection
and enhances the flame holding mechanism. 0.02-pilot equivalence ratio presented the
optimum pilot injection case that can promote the flame holding mechanism and keep
good combustion and flow field qualities. While the further increase o f the pilot injection
equivalence ratio quenches the high temperature gases in the cavity region, which leads
to the deterioration of the flame holding mechanism, the excessive pilot fuel injected
expresses its effect by increasing the average flow field static temperature and absolute
pressure in the far field domain.
Reproduced with permission of the copyright owner. Further reproduction prohibited without permission.

121
£*5,
2IS■Ou&2I&S9
w•a*5Ci£9
C33)22S3
1■&
iia9
JB
9S3SJ9
•C
■O
S?9
9ss1
•U)9
2£
SCMO
s
©s
sCO
oCO
in
.1
29
I1sf f
s
0 !W
CM CO CO CO CM inO y— y— y— T— y—CO CO CO CO CO COCM CM CM CM CM CM
CO ^ h* CMCO 5 CO CO CO COCO W) CO CO CO COCM CM CM CM CM CM
in i - cm coT - i - O O ® C 0
<«3- ■<* T f 00 CO CM CM CM CM CM CM
co co ^ o i o inT - o CO (O (O M-CO CO CM CM CM CMCM CM CM CM CM CM
O)® O J N ^ N T - CO CM CM •’T CO CO CD 05 05 05 05
00 CO CO CMO 05 CO O in 05t— O O O 05 COCM CM CM CM t- r -
1 - CO CO r^. 05 CMo co co co r- coo) 05 co r* h* co
05 N ' t T - Wco in co cm
r^. r^. iv. co co in
Is*. CO CO CO 05 05 CO CO CO CO CO GO CM CM CM CM CM CM
•«- t- O O 1 - 0S S S S N SCM CM CM CM CM CM
CO 00 fv 1^. 00 h -in in in in in inCM CM CM CM CM CM
cm co cp coI S
Reproduced with permission of the copyright owner. Further reproduction prohibited without permission.

122
0.035 R
0.03 -
s■O’
0.025 -
S 0.0201£ua
!a0.005
t fli 11
0.015 rC-—-T~—
0.01
0.025 0.05 0.075C o m b u s to r L e n g th , m
(a) 0.60-step, nopilot
0.035 R'v'W
0.025
0.01
0.005
0.025 0.05C o m b u s to r L e n g th , m
(b) 0.60-wedge, nopilot
0.075
Reproduced with permission of the copyright owner. Further reproduction prohibited without permission.

Com
busto
r He
ight,
m
123
0.035
0.03
0.025
0 .02
0.015
0.0 L
0.005
Fig. 5.1 Velocity vectors and streamlines contours at the symmetry plane.
I I I: M 'J r / i i / 1 t f t w 111f W■41 ; /.y r / / f f / /J / Ur
C om bus to r Length, m (c) 0.45-wedge, nopUot
Reproduced with permission of the copyright owner. Further reproduction prohibited without permission.

124
Static Tem p.
26 307725 297424 283323 279922 269321 255220 245819 241218 227117 213016 199015 184914 170813 156812 147911 142710 12879 12718 12597 11466 10055 8654 7243 5832 4431 346
Static Temp.26 307725 297424 283323 279922 269321 255220 245819 241218 227117 213016 199015 184914 170813 156812 147911 142710 12879 12718 12597 11466 10055 % 8654 7243 . 583'2 4451 346
Reproduced with permission of the copyright owner. Further reproduction prohibited without permission.
0.04
0 .035
0.03s
|Ss 0.025
Xua 0.02
a 0.015
0.01
0.005
0.60>Step, No pilot
0.05
(a)
0.1 0.15 0.2 0.25C om bustorLeagth, m
0.60-step, nopilot
0.35
0.04 0.60-Wedge, Nopilot
0.035
0.03
u 0.025
0.015
0.01
0.05 0.1 0.15 0.2 iCombustor Length, m
0.25 0.3 0.35
(b) 0.60-wedge, nopilot

125
Static Temp.26 307725 297424 283323 279922 269321 255220 245819 241218 227117 213016 199015 184914 170813 156812 147911 142710 12879 12718 12597 11466 10055 8654 7243 5832 4431 346
0.45-Wedge, Nopilot
0.035
u 0.025
0.015
0.005
0.05
(c)
0.1 0.15 0.2 0.25Combustor Length, m
0.45-wedge, nopilot
0.3 0.35
Fig. 5.2 Temperature contours at the symmetry plane.
Reproduced with permission of the copyright owner. Further reproduction prohibited without permission.

Com
busto
r He
ight
, m
•0.01 >0.005 0 0.005 0.01C o m b u sto r W id th (m )
(a) 0.60-step, nopilot
0.035
0.03
0.025
0.02
0.015
0.01
0.005
° -0.01 -0.005 0 0.005 0.01C o m b u sto r W id th , m
(b) 0.60-wedge, nopilot
Reproduced with permission of the copyright owner. Further reproduction prohibited without permission.

Com
busto
r He
ight
, m
127
0.035
0.03
0.025
0.02
0.015
0.01
0.005
0
Fig. 5.3
i ,/ hi i iF H j I f '4 i L 1' I V ,; H o . f e - W c U e ‘l l , l x 4 ‘4 0 m k d r o ! siidPI^ O m m d r o s
is1 ;5I \ .. \ u V V.v \
u \ \ \ Wv\ , V 1» \ L v V 1,1
^ W ' V 1!.!
' \ vt\ ' l N
f t 1 ' 1 1. 11 i i i1 I M ill1
■ i ; , v ,
"1 f i l l • ‘ l . W V / / ' /I f 1 V ' h j A / ' J j z f r
,!fl
7 // >, * / r
- 0.01 -0.005 0 0.005C o m b u s to r W idth , m
0.01
(c) 0.45-wedge, nopilot
Velocity vectors and streamlines contours at X= 0.040m plane.
Reproduced with permission of the copyright owner. Further reproduction prohibited without permission.

128
Static Temp* 0.035
0.03
0.025
31 327230 325129 322228 318327 314726 309625 302224 2897 s
. —23 283522 2773 -C21 2699 u20 2648 £
tm19 261118 2595 a
S'IT 252316 2398 M
S15 2273.14 2149 ■613 2024 V12 18991L 177410 16499 1524 - . *8 14677 14556 14375 14004 13273 12882 12781 1275
0.015 *,
0.01
0.005. 0.60-Step, Nopilot X= 40mm Cross Plane
-0.01 •0.005 0 0.005Combustor Width, m
(a) 0.60-step, nopilot
0.01
Static Temp. 31 3272
3251 3222
0.035
30292827
24232221201918
31833147
26 309625 3022
13121110987654321
2897283527732699264826112595
IT 2523 16 239815 227314 2149
2024189917741649152414671455143714001327128812781275
0.025
*3 0*02
3J 0.015
0.60-Wedge, Nopilot X= 40mm Cross Plane0.005
•0.01 -0.005 0 0.005Combustor Width, m
Ob) 0.60-wedge, nopilot
0.01
Reproduced with permission of the copyright owner. Further reproduction prohibited without permission.

129
Static Temp. 0.035 F"31 327230 325129 322228 318327 314726 309625 302224 289723 283522 277321 269920 264819 261118 259517 252316 239815 227314 214913 202412 189911 177410 16499 15248 14677 14556 14375 14004 13273 12882 12781 1275
T 7
0.025
S 0.02
0.015
0.45-Wedge, Nopilot X= 40mm Cross Plane
0.005
-0.01
(C)
-0.005 0 0.005Combustor Width, m
0.45-wedge, nopilot
o.oi
Fig. 5.4 Temperature contours at X= 0.040m plane.
Reproduced with permission of the copyright owner. Further reproduction prohibited without permission.

130
0.005
-0.005
0.05 0.075 0.1 0.125 0.15 0.175 0.2 0.225 0.25 0.275 0.3 0.325 0.35Combustor Length, m
(a) 0.60-step, nopilot
S*•o
la2
0.01
0.005
eu
-0.005
- 0.01
0.05 0.075 0.1 0.125 0.15 0.175 0.2 0.225 0.25 0.275 0.3 0.325 0.35Combustor Length, m
(b) 0.60-wedge, nopilot
Reproduced with permission of the copyright owner. Further reproduction prohibited without permission.

0.05 0.075 0.1 0.125 0.15 0.175 0.2 0.225 0.25 0.275 0.3 0.325 0.35Combustor Length, m
(c) 0.45-wedge, nopilot
Fig. 5.5 Velocity vectors and streamlines contours at the pilot injection plane, Y=0.0304m.
Reproduced with permission of the copyright owner. Further reproduction prohibited without permission.

132
Static Temp.26 336425 330124 318023 312522 307921 300420 298519 294018 286417 282216 278015 276214 275413 256912 238311 219810 20129 18278 16417 14566 12705 10854 8993 7142 528I 343
0.01
0.005 -
4
•0 .005 -
•0.01 -i
&
0.05 0.075 0.1 0 .125 0 .15 0 .175 0.2 0 .225 0 .25 0 .275 0.3 0 .325 0.35
C om b u stor L ength , m
(a) 0.60-step, nopilot
Static Temp
0.0052940 g
2762 U
2383 g
&
2012 .0.005
- 0.01
K a0.05 0.075 0.1 0.125 0.15 0.175 0.2 0.225 0.250.275 0.3 0.325 0.35
Com bustor Length, m(b) 0.60-wedge, nopilot
Reproduced with permission of the copyright owner. Further reproduction prohibited without permission.

133
Static Temp.26 336425 330124 318023 312522 307921 300420 2985 119 2940 s18 2864 417 282215 2780 i15 2762 i*14 2754 3(A13 2569 112 2383 s11 2198 <310 2012 •19 18278 16417 14566 12705- 10854 8993 7142 5281 343
0.005
0.01 »
-0.005
0.05 0.075 0.1 0.125 0.15 0.175 0.2 0.225 0.25 0.275 0.3 0.325 0.35Combustor Length, m
(c) 0.45-wedge, nopilot
Fig. 5.6 Temperature contours at the pilot injection plane, Y=0.0304m.
Reproduced with permission of the copyright owner. Further reproduction prohibited without permission.

134
0.035 F
0.025
J 0.015
0.005 ¥
- 0.01 -0.005 0 0.005C o m b u s to r W id th (m )
0.01
(a) 0.60-step, nopilot
0.035
0.03
0.025S
-£? 0.02 su2
0.015 1 u
0 .0 1
0.005
- 0.01 •0.005 0 0.005C o m b u sto r W idth (m )
Oh) 0.60-wedge, nopilot
0.01
Reproduced with permission of the copyright owner. Further reproduction prohibited without permission.

135
0.035
0.025
aJ 0.015
0.005
• 0.01 0 .01•0.005 0 0.005C om bustor W idth (m)
(c) 0.45-wedge, nopilot
Fig. 5.7 Velocity vectors and streamlines contours at the normal injection plane, X=0.070m.
Reproduced with permission of the copyright owner. Further reproduction prohibited without permission.

136
3MMT19 38 37 363334 33 32 31 30 29 28 27 26 25 24 23 22 2120 19 18 17 16 15 14 13 12 11 10 9 8 7 6 5 4 3 2 I
0.035
0.03
e08
£U3
0.025
0.02
0.015Sd
0.01
0.005
Q
0.60-Step, Nopilot X= 70mm Cross Plane
• 0.01 •0.005 0 0.005Combustor Width (m)
0.01
(a) 0.60-Step, nopilotgMMTiapnUw 39 336738 335537 332736 327235 322234 3147
0.035
333231302928272625242322212019181716151413121110987654321
309630222897283527732699264826112595252323982273214920241899177416491524146714551437140013271288127812751178619542446314211197
^ 0.025e
.BP£faaB3
£
0.60-Wedge, Nopilot X= 70mm Cross Plane
0.015
0.005
•0.005 0.005 0.01
(b)Combustor Width Cm)
0.60-wedge, nopilot
Reproduced with permission of the copyright owner. Further reproduction prohibited without permission.

137
SMMTmpti39 338738 335937 332738 327238 322234 314733 309833 302231 289730 283929 277328 289927 * 264828 261129 259924 252323 239822 227321 214928 202419 189918 177417 184918 1524IS 146714 145513 143712 140011 132710 12889 12788 12757 11788 619S 5424 4463 3142 2111 197
0.035
0.025
•I? 0.02
aJ 0.015
0.45-Wedge, Nopilot X= 70mm Cross Plane0.005
•0.01
(C)
•0.005 0 0.005Combustor Width (m)
0.45-wedge, nopilot
0.01
Fig. 5.8 Temperature contours at the normal injection plane, X=0.070m.
Reproduced with permission of the copyright owner. Further reproduction prohibited without permission.

138
Static Temp. 0.03517 3311
16 3203 0.0315 3090
14 29750.02513 2862 O
2748 £2634 4P 0.022521
2407 0.0152293
21790.01
2065
19521838 0.005 0.60* Step, Nopilot
X= 220mm Cross Plane1724
0.01 0.005 0.0114801 Combustor Width (m)
(a) 0.60-Step, nopilot
Static Temp. 0,03517 3311
14 3203 0.0315 3090
15-
29760.0252862
12 2748 JSw> 0.022634
2521
J 0.0152407
2293
21790.01
19520.0051838 X 6 0 - Wedge, Nopilot
X = 220mm Cross Plane1724
16100.005 0.005 0.01•0.01
14801 Combustor Width (m)(b) 0.60-wedge, nopilot
Reproduced with permission of the copyright owner. Further reproduction prohibited without permission.

Static Temp. 0 .035" 3311
16 3203« 3090 00314 297613 2862 -v 0.02512 274811 2634
jg
*|f 0.02i10 2521 *&. I9 2407 3
J 0.01518 2293 8 17 2179 6 I6 2065 0.0 1 15 19524 1838 0.005 It32I
17241C101480
Nopilot220mm
fig . 5.9
•0.005 0 0Combustor Width (m)
0 .4 5 -W e d g e , nopilot TTcuge, ncemPerat»re Contours at X=0.220m.
Reproduced with permission
VP*■ 'V- . *
o f t he copyright« " e r . Further reproduction
prohibited without permission.

140
0.60-W edge, Nopilot '0.60'Step, Nopilot40.00*
0.00*ISO 200 250 300 35050 1000
Com b u ito r Length (mm)
Fig. 5.10 Comparison between the combustion efficiency of the step and wedge configurations.
0.036
0.03
0.0248
fs 0.018
0.60-Wedge, Nopilot '0.60-Step, Nopilot
0.012
0.006
0.T 0.8 10.4 0.60.10Fuel Mole Fraction
Fig. 5.11 Comparison between the fiiel penetration of the step and wedge configurations.
Reproduced with permission of the copyright owner. Further reproduction prohibited without permission.

Fud
Moic
Frac
tion
141
► "0.60-W edge, Nopilot *0.60-Stcp, Nopilot0.8
0.7
0.6
0.4
0.2
0.1
0.05 0.1 0.15 0.2C om bustor Length, m
0.35
Fig. 5.12 Comparison between the rate of fuel decay of the step and wedge configurations.
Reproduced with permission of the copyright owner. Further reproduction prohibited without permission.

142
3500
3000 •
2500 •
-0.60-W edge, Nopilot •0.60-Step, Nopllot
a 2 000 ■
1500 «
i 1000 •
500
200100 150 250 300 350500Com bustor Length, m m
Fig. 5.13 Comparison between the upper-wall average static temperature distribution of the step and wedge configurations.
2400 ■
2200 •
1 2000 •
'0.60-Wedge, Nopilot '0.60-Step, NopUot
< 1600
1400
1200250 300 350150 200100500
Combustor Length, mm
Fig. 5.14 Comparison between the flow field average static temperature distribution of the step and wedge configurations.
Reproduced with permission of the copyright owner. Further reproduction prohibited without permission.

143
600
500 • 0.60-Wedge, Nopilot '0.60-Step, Nopilot
400 •
< 300 •
1 200 *
too
300 350150 200 250100500C om bustor Length, mm
Fig. 5.15 Comparison between the upper-wall average absolute pressure distribution of the step and wedge configurations.
200 •0.60-W edge, Nopilot '0.60-Slep, Nopilot
180 •
160 ■
1 « • '
< 120 •
100
80350200 250 30015050 1000
Com bustor Length, (mm)
Fig. 5.16 Comparison between the flow field average absolute pressure distribution of the step and wedge configurations.
Reproduced with permission of the copyright owner. Further reproduction prohibited without permission.

!**"
144
0.03
0.024
0.010
0.60-W edge, Nopilot
■0.45-Wedge, Nopilol0.012
0.000
0.7 0.00.4 a s 0.6 10.10Fuel Mole Fraction
Fig. 5.17 Comparison between the fuel penetration of the 0.45-ER and 0.60-ERwedge configuration cases.
'0.60-Wedge, Nopilot ■0.45-Wedge. Nopllot0.8
*SI 0.4
0JL
0.05 0.L0Combustor Length, m
Fig. 5.18 Comparison between the rate of fuel decay of the 0.45-ER and 0.60-ER wedge configuration cases.
Reproduced with permission of the copyright owner. Further reproduction prohibited without permission.

145
100.00%
80.00%
60.00%
J 0.60-Wedge, Nopilot '0.45-Wedge, Nopilot40.00%
20.00%
0.00%250 35050 150 200 3001000
Combustor Length (mm)
Fig. 5.19 Comparison between the combustion efficiency of the 0.45-ER and0.60-ER wedge configuration cases.
Reproduced with permission of the copyright owner. Further reproduction prohibited without permission.

146
K1<Iia
100 200
Fig. 5.20 Comparison between the upper-wall average static temperature distribution of the 0.45-ER and 0.60-ER wedge configuration cases.
2400 •
2200 •
£ 1800 •
“0.60-Wedge, Nopilot •0.45-Wedge, Nopilot
< 1600 ■
1400
120035050 100 150 200 250 3000
Combuitor Length, mm
Fig. 5.21 Comparison between the flow field average static temperature distribution of the 0.45-ER and 0.60-ER wedge configuration cases.
Reproduced with permission of the copyright owner. Further reproduction prohibited without permission.

147
600
500 ■ -0.60-Wedge, Nopilot •0.45-Wedge, Nopilot
400 <
< 300 *
1 200 ■
100 ■ •
150 200 250 300 35050 1000Combustor Length, mm
Fig. 5.22 Comparison between the upper-wall average absolute pressure distribution of the 0.45-ER and 0.60-ER wedge configuration cases.
200 •-0.60-W edge, Nopilot •0.45-W edge, Nopilot
180 •
160 ■
140 ■
< 120 •
100
80250 350150 200 30050 too0
C om bustor Length (mm)
Fig. 5.23 Comparison between the flow field average absolute pressure distribution of the 0.45-ER and 0.60-ER wedge configuration cases.
Reproduced with permission of the copyright owner. Further reproduction prohibited without permission.

148
0.0044
0 .0042SI Llo t'T njectio n£ba 0.004
1E6
0.0038
0.0036
0.0 3 6 0.038 0.040.0340.03C o m b u s to r L e n g th , m
>«(a)
0 . 0 0 1 2
0 .0 0 0 8
0 .0 0 0 4
ttak P H o-t In^ejEtio -
© -0 .0 0 0 4
-0 .0 0 0 8
- 0 . 0 0 1 2
0.040 .0 3 80 .0 3 4 0 .0 3 0Combustor Length, m
0 .0 3 20.03
(b)
Reproduced with permission of the copyright owner. Further reproduction prohibited without permission.

149
0 .0 0 3 8
0.0 0 4In ject io n
. 0 . 0 0 4 2
• 0 .0 0 4 4
•0.0 0 46
•0 .0 0 4 8
• 0.0 0 5 0.0 3 2 0.0 3 4 0.0 3 6C o m b u s t o r L e n g t h , m
0 .0 3 8 0.0 40.0 3
(C)
Fig. 5-24 Reversed flow at the pilot injection ports for 0.01-ERP, pilot inj. plane.
CombustorLength, m Fig. 5-25 Reversed flow at the pilot injection ports for 0.01-ERP, sym. plane.
Reproduced with permission of the copyright owner. Further reproduction prohibited without permission.

151
0 . 1 3 9 F
• . 0 3
0 . 0 1 9
0 . 0 1
0 . 0 0 5
0 *0 5
0 . 0 I
0 .1
(d)<j»P- 0.0450 *0 3 5 F
0 . 0 3
0 .0 2 5
0 .0 2
0 . 0 0 5
0 . 0 1 9 — —T
0 .0 1
. . . "1----:---- -----r— :---- t -0 0 .0 1 9 0 .0 J
C o m b u s to r L e n g t h , m
(e) (j>p = 0.06
0 .0 7 5 0 _
• .t
(f) i |ip s0 .(Fig. 5.26 Velocity vectors and streamlines contours at the symmetry plane for different pilot equivalence ratios.
Reproduced with permission of the copyright owner. Further reproduction prohibited without permission.

152
0.0205
0.60-W cdge, with Pilots 0.60-Step, Nopilot 0.45-W edge, Nopilot
0.02
0.0195
SI
0.019
I0.0185
0.018
0.01750.070.04 0.06 0.08 0.090.01 0.02 0.030
Pilot-Injection Equivalence Ratio
Effect of the pilot injection equivalence ratio on the fuel penetration.Fig. 5.27
Fig. 5.28 the fuel.
0.35C om bustor L ength, m
Effect of the pilot iqjection equivalence ratio on the rate of decay of
Reproduced with permission of the copyright owner. Further reproduction prohibited without permission.

153
S u i t e T• . 0 4 0 . 6 0 - W e d g e , N o p i l o t
«
A*
Comb U-* to r Lenfth.^ m(a) <j>p = 0.0
fi 0 * W e d g e , 0 . 0 2
B
#-• I
o.jC o n b m l o r L t o i t b , m
(b) <J)p = 0.020 .60 -W edge, 0.0 3
t . 0 3
• . II
• t
l . l f • .2-Conbnrtor Lcegth, nt
(c) <j>p = 0.03
Reproduced with permission of the copyright owner. Further reproduction prohibited without permission.

\ r- ’>
154
S ta t i c Te r n p2 62 5 2 9 7 42 42 22 22 i2 9191 91 7161 51 4 1 7 9 9131 21 11 99976 1 9 9 55432 4 4 31 3 4 6
5 t a t l c T e a 9
2 6 3 9 7 72 5 2 9 7 42 4 2 9 3 32 3 2 7 9 92 2 2 4 9 32 I 2 5 5 22 0 2 4 5 9I 9 2 4 1 21 9 2 2 7 1I 7 2 1 3 91 6 1 9 9 91 5 1 9 4 9t 4 L 7 9 9I 3 1 5 6 9t 2 1 4 7 9I 1 1 4 2 71 9 1 2 9 79 1 2 7 19 1 2 5 97 1 1 4 69 1 9 9 55 9 6 54 7 2 43 5 9 32 4 4 3I 3 4 6
• »I4 I . C « * W * 4 | r r l . l 4 1
I •
M S I . SC o m b u s to r L e n g t h , m
t i e T * a 9 ►3 9 7 7 1 9 7 4 I D )3 T 9 V 3 9 9 3 3 5 9 3 3 4 5 9 3 4 1 33 3 T I 3 1 3 9 1 9 9 9 1 9 4 9 1 7 9 9 1 5 9 9 1 4 7 9 1 4 3 7 1 2 9 7 1 2 7 1 1 2 5 9 114 9 1 9 9 5 9 4 57 2 4 5 9 34 4 3 3 4 9
(d) <)>p = 0.0450 » ( 0 - W e d g e , 0 .0 69 »9 4
9 . 9 2
9 . 9 I
9 . 1 5 9 . 2
C o m b u s t o r L e n g t h , m
(e) <J>p at 0.060 . * « - W e d g e , t . l l9 . 9 4
9 . 9 2
9 . 9 I
IU..9 5 .15 9 . 2 5 9 . 3 5C
(f) <f>p =0.08Fig. 5.29 Temperature contours at the symmetry plane for different pilotequivalence ratios.
rL" V*Reproduced with permission of the copyright owner. Further reproduction prohibited without permission.

155
S t it le T e m p le25141 3 11 1114 t • I B t r i « l sI 4I 3 I 1 t I t I
0 .0 I
0 . 0 • 5
-0 .0 0 9
*0 *0 I
0 * 0 9 I J 7 5
S ta tic Temp,
0*119 0 *19 0 *1 7 9 0 *1 0.119 0 *1 9 0 *17 9C o m b u i l o r L e n g i h , m
(a) 6p =0.0
0 *3 0 *3 19 0 *J 9
2 4 3 3 4 42 5 3 3 9 12 4 3 I B B2 3 3 1 1 52 2 3 B T 92 1 3 B B 4I B 1 9 8 51 9 2 9 4 B1 • 2 8 4 4t T 2 8 2 21 4 2 T B Bt S 2 7 4 2I 4 2 7 5 41 3 2 5 4 9t 2 2 3 8 31 1 2 1 9 8t • I B 1 29 t B 2 T8 1 4 4 1T 1 4 5 44 I 2 7 BS 1 B B S4 8 9 93 ' 7 1 42 5 2 81 3 4 3
0 *0 1
0 * 0 0 9
- 0 * 0 0 9
-0 *0 I
0 *1 19 0 *19 0 *1 7 9 0 *1 0 *119 0 *1 9 0 *1 7 9C o m b u 1 to r L e n g t h , m
(b) <bp=0*02
0 *3 0 *3 19 0 *3 9
S t l a M c L T11 is1 41 3122 I 20 1 9 1 B I T I f1 51 4 t 3 t 21 t IB 9 Br4s432t
I
0 * 1 9 ' 0 - 2
C o m b n o l o r L e n g t h »
(c)<J)p = 0 .0 3
0 .3 0 *3 5
Reproduced with permission of the copyright owner. Further reproduction prohibited without permission.

156
(d) ()>p = 0.045BT3v>
• • 5
• . 0 • 5
b u r to r L e n g t h , mC o B
S ta t i c T e aI t j j a 41 s n i t2 . 4 i n iX J j i i f1 2 J • T 9X I J • • 4X S 1 9 1 1I 9 2 9 4 1t • I S t 4t r l i t !1 1 X T • •tt t n tl A X T S 4t 3 X f 1 9t x X J S X1 1 X 1 9 •t • H U9 t i x rr t t 4 tr 1 4 5 4t t X T ts l l l f4 1 9 9S T 1 4I f t lt 1 4 3
I
• • 5
>1 .0 tr*£
C o o b v r t o r L e a | U » m
CO = 0.08Fig. 5JO Temperature contours at the pilot injection plane, Y=0.0304m, fordifferent pilot equivalence ratios.
Reproduced with permission of the copyright owner. Further reproduction prohibited without permission.

157
^ T ? l
«n|0fMJai«tBO3<'*.c• ■ ^ rn m * m. ■* m m.
A • A
« *mPlM.J0Mnqai03 "a.IV *”
Reproduced with permission of the copyright owner. Further reproduction prohibited without permission.
(b)
0.60-
Wed
ge, 0
.02.
Fig.
5. 31
Com
paris
on
betw
een
the t
empe
ratu
re c
onto
urs
of 0.
0-ER
p and
0.
02-E
Rp-c
ases
focus
ing
on the
cav
ity
regi
on.

158
5 U t l e T e n p3 I3 •2 9 3 2 2 22 V2 72 62 5 3 9 2 22 4 2 S 9 72 32 22 12 9I 9I 1171 6t 5 2 2 7 31 4L 3LI1 1 1 7 7 4I f9■7654321
S t i t l e T e m p3 3 2 7 23 9 3 2 5 129 3 2 2 22 9 3 19 32 7 3 1 4 72 6 3 9 9 62 5 3 9 2 224 2 9 9 723 2 9 3 52 2 2 7 7 32 1 2 6 9 92 9 2 6 4 9I 9 2 6 t It I 2 5 9 51 7 2 5 2 31 6 2 3 9 91 5 2 2 7 3t 4 2 ( 4 9I 3 2 9 2 4L2 t 9 9 9t I t 7 7 4I 9 1 6 4 99 1 5 2 49 L 4 6 77 L 4 5 56 1 4 3 75 1 4 9 94 ( 3 2 73 t 2 9 92 t 2 7 91 1 2 7 5
S t* t ic T e n3 I 3 2 7 23 9 3 2 5 12 9 3 2 2 22 9 3 L 9 32 7 3 1 4 72 6 3 9 9 62 5 3 9 2 22 4 2 1 9 72 3 2 9 3 52 2 2 7 7 321 2 6 9 929 2 6 4 9( 9 2 6 1119 2 5 9 51 7 2 5 2 31 6 2 3 9 115 2 2 7 314 2 1 4 913 2 9 2 412 1 9 9 9I t t T T 419 1 6 4 99 1 5 2 49 1 4 6 77 1 4 5 56 1 4 3 75 1 4 9 94 1 3 2 73 1 2 9 92 L 2 7 91 1 2 7 5
• I fI• .• 1
• I f
t i a e
C o n b i t f t o r W f d t h * m
(a) <|ip = 0.0• . • 3 f
• . • 2 5
• .• 2
• .•15
• . • • 5
C o a b m l o r W id th ,
(b) <{>p = 0.02• . • 3 $
• -0Z
g . o o sC o m b u s to r w Id to * n
• . • 1 5 -
• . • • 5 1 •
(c) <p s 0.03
Reproduced with permission of the copyright owner. Further reproduction prohibited without permission.

159
S t i U e Tern p.3 1 3 2-7 23 4 3 2 5 12 9 3 2 2 2XI 5 1 4 32T 3 1 4 72 4 3 4 9 41 5 3 4 2 224 2 4 9 72 3 2 9 3 52 2 2 7 7 32 1 2 4 9 92 9 2 4 4 419 2 4 11I * 2 5 9 517 2 5 2 314 2 3 9 915 2 2 T 314 2 1 4 913 2 4 2 412 1 9 9 9t 1 I T 7 419 1 4 4 99 1 5 2 4
! 9 1 4 4 77 1 4 5 54 1 4 3 75 1 4 9 94 1 3 2 7
j 3 1 2 9 4! 2 1 2 7 4
t 1 2 7 5
S t a t i c T e r n3 t 3 2 7 239 3 2 5 t29 3 2 2 22 9 3 1 4 327 3 14 724 3 9 9 425 3 4 2 224 2 4 9 723 2 4 3 52 2 2 7 7 321 2 4 9 924 2 4 4 419 3 4 1 119 2 5 9 5IT 3 5 1 31 4 2 3 9 91 5 2 2 7 51 4 2 1 4 9t 3 24 1 4t 2 1 4 9 911 1 7 7 414 t 4 4 99 I 5 2 4
• 9 1 4 4 77 1 4 5 5
'4 1 4 3 75 1 4 4 44 13 2 73 L24 42 1 2 7 41 I 2 7 5
• .•35 F
4 .4 3
• .•15
• . • 2
# . • 1 5
• . • • 5 0 . 6 0 - W e d g e . 0 . 0 4 5 X > 4 0 m m C r o i r P l a n e
0 .0 1
(d) <{>p = 0.045
• . • 2 5
• . • 1 5
• . • • 5
(e) ()>p — 0.06S t a t i e
11)1
9 . * I S
(f) <J)p = 0.08Fig. 532 Temperature contours at X=0.040m cross flow plane for different pilot equivalence ratios.
Reproduced with permission of the copyright owner. Further reproduction prohibited without permission.

160
■ I S M * I T X l a t *j a) «I T
i tJ 4J JJ *1a *x aX XX T I ,X Xx * j rX 4 %XX xX XX XX *i ax tXT1 4X IX 4XX1 XX XXXaar X4X43XX
• . I J f
t.t J
• J l f
5C o n b u r t o r w t d l b ( ■ )
(a) s 0.0
• 3
8
• .•15
• ►• I • ~W ed*e. 1.12 X * 7 X ■ m C r a i t P i t a *
• J LC o n b m l o r W i d l k , m
a i i N a t T e x a i r i i a r tX X 3 3 X 7I t 3 3 f tX T 3 3 X 7X X 3 X T X3 1 3 X X X3 4 3 1 4 T3 3 3 X X X3 X 3 X X X3 X X t X T3 X 1 X 3 *X X 1 T T 3xt xxxxI T 2 X 4 1X X X X X XX I x t x rX 4 2 * 2 3X 3 2 3 X tX X 2 2 . T 3X X X X X XX X X X X XXX xt xxL X X T T XI T X X 4 XX X 1 * 2 4i r 1 4 X TE 4 X X f SX 3 X X 3 TX T X X X XXX X 3 2 TXX x x x tX X X - T tt X X T tT X X T XX x t x3 t x x .4 X X X3 3 X 4X X X XX X X T
(b) <p = 0.02• .015
f
i
0 . 6 0 - W e d g e . 0 . 0 3 X * 7 0 m m C r o s s P l a n e
• -• LC o m b n s t o r W tdth. Cm )
(c) <|>p = 0.03
Reproduced with permission of the copyright owner. Further reproduction prohibited without permission.

161
IJ9SI .• IC o m b u t Co r W Id tb ( m )
• If *■ r«111** 1 X 9 J i l t JUl J l I T *••*J i l t t l t f I I J I I T U t i l l 1141 <•11 t l t l t l t J X 1 * B X X 9 1X I 4 1 1 4 1 4 1 1 4 4 4 9 9 4 1 4 4 4 1 1 1 4 t 4 • T 1 4 4 1 1 4 J T I 4 • •4 1 X 9 t I B •I X 9 I t X 9 1 t 4 9 B 414 1 4 X * 4 •1 I «X I 4 1*9
(d) <|>p = 0.045
• J
7
• 2
• t S
• - • • 50 • 5n b u i t o r W id th ( m )C o
(e) <}>p = 0.06
X X T l
1
C o m b i i f t o r W [ d t h (m )
(f) 4>p = 0.08Fig. 5.33 Temperature contours the normal injection plane, X=0.070m, for different pilot equivalence ratios.
Reproduced with permission of the copyright owner. Further reproduction prohibited without permission.

Combusto r Length, mm
Fig. 5.34 Comparison between the flow field average static temperature distributions for different pilot equivalence ratios.
200 ■ 0.60-0.00 .6 -0.020.60-0.030.60-0.046'0.60-0.06■0.60-0.08
180 '
£*t 160 '
1 140 •<
>•< 120 •
100
350250150 200 30050 1000Combustor Length, mm
Fig. 535 Comparison between the flow field average absolute pressure distributions for different pilot equivalence ratios.
Reproduced with permission of the copyright owner. Further reproduction prohibited without permission.

163
“♦“ OfiO-Wedge, With pilots -#-0603tep , Nopilot -A -045-Wedge, Nopilot
006 007 on am003oaz 004aoioHlat-Ii cctfan Eqdtalm x Ratio
Fig. 5.36 Effect of pilot injection equivalence ratio on the stagnation pressure efficiency.
270
i
007 008 009006005003 OM0020010n * ^ K O n f i |M a n i W 9
Fig. 537 Effect of pilot injection equivalence ratio on the entropy production.
Reproduced with permission of the copyright owner. Further reproduction prohibited without permission.

164
(160-Wedge, Nopilot 0.60-Step, Nopilot (145-Wedge, Nopilot
431500%
006 008001 002 003 OM 0090PUot-Injeclfcm Equivalence Ratio
Fig. 5.38 Effect of pilot injection equivalence ratio on the kinetic energy efficiency.
120.00%
100.00 %
80.00% ■
60.00% •
I “ ^ •0 .6 0 -0 .0■“ ^ 0 .6 0 - 0 .0 2“ ♦ “ 0.60-0.03“ ♦ ♦ 0 .6 0 -0 .0 4 5“ ♦ “0.60-0.06-e - 0 .6 0 -0 .0 8
40.00% - ■
20.00%
0.00%300 350200 25050 100 1500
C o m b u sto r L ength (mm)
Fig. 539 Effect of pilot injection equivalence ratio on the combustion efficiency.
Reproduced with permission of the copyright owner. Further reproduction prohibited without permission.

165
CHAPTER V I
CONCLUDING REMARKS
A numerical study has been conducted to investigate the mixing and combustion
enhancements in scramjet engines, which are characterized by the supersonic combustion
flow fields. The primary objective o f the current study is to numerically examine the
possibility of igniting hydrocarbon fuels in supersonic airstreams and maintaining the
hydrocarbon flames in such hostile environments. The secondary objective o f the study is
to investigate the effect o f the combustor configuration, the main fuel equivalence ratio,
and the pilot fuel equivalence ratio on the flame holding mechanism and the flow field
and energy field characteristics.
The four physical models used in the current study are the unswept generic
rearward-facing step, the side swept rearward-facing step, the wedge with no pilot
injection, and the wedge with pilot injection configurations. The Computational Fluid
Dynamics “CFD” Code used in the present study is the FLUENT commercial code,
which is a control volume based finite difference method. FLUENT is a general-purpose
computer program for modeling fluid flow, heat transfer, and chemical reaction.
FLUENT solves the Reynolds average Navier-Stokes equations. It models a wide range
of phenomena by solving the conservation equations for mass and momentum. For flows
involving heat transfer or compressibility, an additional equation for energy conservation
is solved. For flows involving species mixing or reactions, a species conservation
equation is solved. Additional transport equations are also solved when the flow is
turbulent. The governing equations are discretized on a curvilinear grid to enable
computations in complex irregular geometries. A non-staggered system is used for
storage of discrete velocities and pressures. Interpolation is accomplished via a first-
order, Power-Law scheme o r optionally via higher order upwind schemes. The equations
are solved using SIMPLE-like algorithms with an iterative line-by-line matrix solver and
multigrid acceleration. The coupled solver is used with the explicit formulation and the
steady state approach. The second order upwind scheme is used for discretization o f the
flow, the turbulence kinetic energy, and the turbulence dissipation rate equations.
Reproduced with permission of the copyright owner. Further reproduction prohibited without permission.

166
All physical models feature the following: the incoming airflow is supersonic, and
the main fuel is injected normal to the incoming airflow. For the cases with pilot
injections, the pilot fuel is injected parallel to the incoming airflow upstream o f the main
normal fuel injection. The pressure inlet boundary conditions are specified for the
incoming air inlet, and both the pilot and main fuel injections. The flow outlet is
supersonic and specified as pressure outlet boundary. All walls and step boundaries are
treated as no-slip adiabatic surfaces. Applying free-stream inlet conditions throughout the
entire flow field sets the initial conditions.
The influence o f turbulence on the reaction rate is taken into account by
considering the limiting (slowest) rate out o f the three rates of the Arrhenius reaction rate
and the two eddy-dissipation reaction rates. A global one-step reaction of the investigated
fuel is used to calculate the Arrhenius reaction rate. The renormalized group (RNG) form
o f the k-e turbulence model is used. The turbulence near-wall is treated using the two-
layer zonal model. Because the flow is compressible and a multicomponent mixture, it is
modeled as an ideal gas and the density, the specific heat, the viscosity, and the thermal
conductivity are calculated as composition-dependent properties.
A t the beginning o f the investigation, liquid kerosene was used, which is the
closest formula to the jet fuels that are most likely to be used in the hydrocarbon-fueled
scramjet engines. After using different reduced kinetic schemes for kerosene that have
the hydrogen combustion as one o f the elementary reactions, the difficulty o f igniting the
liquid kerosene while injecting pilot gaseous hydrogen ceased the study. The issue o f the
combustion simulation o f two different fuel injections with two different fuel types and
flow phases in supersonic airstreams was realized to be numerically hardly achieved.
Thereafter, attention has been directed towards the simulation o f ethylene and propane as
gaseous hydrocarbons in supersonic air flow fields.
The combustion characteristics o f gaseous propane in supersonic airflow using the
rearward-facing step that is swept inward form both end sides is studied. The effect o f
sweeping the step on the flow field features o f propane combustion is investigated.
Next, an extensive study for the flame holding and mixing and combustion
characteristics o f gaseous ethylene in supersonic airstreams is carried out. h i this study,
different combustor configurations, different main fuel equivalence ratios, and different
Reproduced with permission of the copyright owner. Further reproduction prohibited without permission.

167
pilot fuel injection equivalence ratios were employed. First, The effect o f the combustor
configuration on the temperature flow field and the flow structure is investigated by
simulating two different combustor configurations, the rearward-facing step and the
cavity. Next, the effect of the equivalence ratio o f the main fuel injection on the general
flow field features and energy field characteristics is studied. Lastly, the effect o f the pilot
fuel equivalence ratio on the flame holding mechanism, and the combustion and flow
field qualities concludes the study. Six pilot injection equivalence ratios are studied, 0.0,
0.02,0.03,0.045,0.06, and 0.08.
The propane study yielded the following conclusions. The swept step showed the
ability to hold the propane flame in the supersonic air stream without extinction. It was
found that the side sweeping o f the combustor exhibits the high temperature and
combustion products concentration in the far field domain while the area downstream of
the normal injection location characterizes lower temperature and products concentration.
It is recommended to optimize the combustor length to ensure the complete combustion
and consequently the full liberation of the chemical energy stored in the fuel before the
fuel exits the combustor.
The main findings attained from the ethylene study can be summarized in the
following points. The step configuration with no pilot injection can afford the flame
holding mechanism in the supersonic air stream by creating the flow recirculations in the
step base area and featuring permanent high temperature regions surrounding the normal
fuel injection. The step configuration showed good mixing capabilities in the far field
domain. The wedge configuration proved superiority over the generic rearward-facing
step configuration in holding the ethylene flame in the supersonic airstreams, producing
overall higher temperature medium throughout the combustor, and exhibiting lower flow
losses and higher combustor efficiency. The increase in the equivalence ratio o f the
ethylene normal fuel injection enhances the general flow field features and energy field
characteristics in the combustor except in the step base area where the lower equivalence
ratio features better temperature distribution and higher combustion efficiency.
Although the wedge with no pilot injection configuration presents the highest
level o f temperature distribution in the cavity and downstream regions, the 0.02-pilot
equivalence ratio increases the temperature o f the upstream face o f the normal injection
Reproduced with permission of the copyright owner. Further reproduction prohibited without permission.

L68
and enhances the flame holding mechanism. The 0.02-pilot equivalence ratio presented
the optimum pilot injection case that can promote the flame holding mechanism and keep
good combustion and flow field qualities. While the further increase o f the pilot injection
equivalence ratio quenches the high temperature gases in the cavity region, which leads
to the deficiency o f the flame holding mechanism, the excessive pilot fuel injected shows
its positive effect by increasing the average flow field static temperature and absolute
pressure in the far field domain.
For the supersonic mixing studies, it is suggested to investigate the effect o f the
injection angle o f the main fuel on the supersonic mixing and combustion characteristics.
It is recommended to study the effect o f the transverse normal ethylene and propane
injections on the flame holding and combustion characteristics in order to investigate the
relationship between the injection scheme and the flame holding and flow field and
energy field features. It is suggested to simulate the supersonic combustion o f the normal
ethylene and propane injections with the pilot gaseous hydrogen. For the future studies, it
is suggested to dedicate more effort trying to carry out the simulation o f the supersonic
combustion of liquid kerosene with gaseous hydrogen as a pilot fuel. The radiative
interaction is also suggested to be included in the future studies due to the existence of
the hydrocarbon combustion products, which are radiative participating mediums.
Reproduced with permission of the copyright owner. Further reproduction prohibited without permission.

L69
REFERENCES
1. Swithenbank, J., Eames, I.W., Chin S.B., Ewan B.C.R., Yang Z.Y., Cao JM and
Zhao, X., ‘Turbulent Mixing in Supersonic Combustion Systems,” AIAA Paper
89-0260, January 1989.
2. Mitani, T., “Ignition problems in Scramjet Testing,” Combustion and Flame, Vol.
101, No. 3, May 1995, pp. 347-459.
3. Bouchez, M., Montazel, X., and Dufour, E., “Hydrocarbon Fueled Scramjets for
Hypersonic Vehicles,” AIAA Paper 98-1589, 1998.
4. Kay, I.W., Peschke, W.T., and Guile, R.N., “Hydrocarbon Fueled Scramjet
Combustor Investigation,” Journal o f Propulsion and Power, Vol. 8, No. 2, 1992,
pp. 507-512.
5. Matsuo, A., and Mizomoto, M., “Flow Structure o f Supersonic Flow Past
Backward-Facing Step with Perpendicular Injector,” AIAA Paper 98-0939,
January 1998.
6. Tishkoff, J.M., Drummond, J.P., Edwards, T., and Nejad, A.S., “Future Direction
o f Supersonic Combustion Research: Air Force/NASA Workshop on Supersonic
Combustion,” AIAA Paper 97-1017, January 1997.
7. Ferri, A., “Review o f Problems in Application o f Supersonic Combustion,”
Journal o f the Royal Aeronautical Society, Vol. 68, No. 45,1964, pp. 575-597.
8. Dugger, G.L., “Comparison o f Hypersonic Ramjet Engines with Subsonic and
Supersonic Combustion, ’Taper presented at Fourth AGARD Colloquium, Milan,
Italy; also Combustion and Propulsion-High Mach Number Airbreathing Engines,
edited by Jaumotte, Rothrock, and LeFebvre, Pergamon Press, New York, 1960.
9. Ferri, A., “Supersonic Combustion Progress,” Aeronautics and Astronautics, Vol.
2, Aug. 1964, pp.32-37.
10. Billing, F.S., “Research on Supersonic Combustion,” Journal o f Propulsion and
Power, Vol. 9, No. 4,1993, pp. 499-514.
11. Waltrup, P.J., “Liquid-Fueled Supersonic Combustion Ramjets: A Research
Perspective,” Journal o f Propulsion and Power, Vol. 3, No. 6,1987, pp. 515-524.
Reproduced with permission of the copyright owner. Further reproduction prohibited without permission.

L70
12. Karagozian, A.R., “Fuel Injection and Flame Holding in High Speed Combustion
Systems,” Major Research Topics in Combustion, Springer-Verlag, 1992, pp.
237-252.
13. Singh, D.J., and Jachimowski, C.J., “Quasiglobal Reaction Model for Ethylene
Combustion,” AIAA Journal, Vol. 32, No. 1 ,1993, pp. 213-216.
14. Northam, G.B., “Workshop report: Combustion in Supersonic Flow,” 21st
JANNAF Combustion Meeting, October 1984.
15. Reddecliff, J.M., Weber, J., “Development and Demonstration o f a hydrocarbon
Scramjet Propulsion System,” AIAA Paper 98-1613, April 1998.
16. Schetz, J.A., Cannon, S.C., and Baranovsky, S., “Ignition o f Liquid Fuel Jets in a
Supersonic Airstream,” AIAA paper 79-1238, June 1979.
17. Segal, C., Owens, M.G., Tehranian, S., and Vinogradov, V., “Flame Holding
Configuration for Kerosene Combustion in a Mach 1.8 Airflow,” AIAA-97-2888.
18. Waltrup, P.J., “Liquid-Fueled Supersonic Combustion Ramjets: A Research
Perspective o f the Past, Present and Future,” AIAA 86-0158, January 1986.
19. Situ, M., Sun, Y.Y., Lu, H.P., and Wang, C., “Investigation on Fuel-Rich Hot Gas
as Piloted Energy for Kerosene Supersonic Combustion,” AIAA-2000-3587.
20. ^Northam, G.B., and Anderson, G.Y., “Supersonic Combustion Ramjet Researcht
at Langley*” AIAA Paper86-0159, January 1986.
21. Segal, C., and Young, C.D., “Development o f an Experimental Flexible Facility
for Nlixing-Combustion Interaction in Supersonic Flow,” Journal o f Energy
Resources, Vol. 118, June 1996, pp. 152-158. Heiser, W.H., and Pratt, D.T.,
‘Hypersonic Airbreathing Propulsion,” AIAA Education Series, Washington D.C.,
1994.
22. Billig, F.S., “Research on Supersonic Combustion,” Journal o f Propulsion and
Power, Vol. 9, No. 4, July-August 1993, pp. 499-514.
23. Waltrup, P.J., “Upper Bounds on the Flight Speed of Hydrocarbon-Fueled
Scramjet-Powered Vehicles,” Journal o f Propulsion and Power, Vol. 17, No. 6,
November-December2001, pp. 1199-1204.
24. Powell, O.A., Edward, J.T., Norris, R.B., Numbers, K.E., and Pearce, J.A.,
“Development o f Hydrocarbon-Fueled Scramjet Engines: The Hypersonic
Reproduced with permission of the copyright owner. Further reproduction prohibited without permission.

L71
| 25.
i
i
26.
27.
28.
29.
30.
31.i
32.i!
33.|
34.
35.j
j
Reproduced with permission
Technology (HyTech) Program,” Journal o f Propulsion and Power, Vol. 17, No.
6, November-December 2001, pp. 1170-1176.
Marren, D., Lewis, M., and Maurice, L.Q., “Experimentation, Test, and
Evaluation Requirements for Future Airbreathing Hypersonic Systems,” Journal
o f Propulsion and Power, Vol. 17, No. 6, November-December 2001, pp. 1361-
1365.
Heiser, W.H., and Pratt, D.T., “Hypersonic Airbreathing Propulsion,” AIAA
Education Series, Washington D.C., 1994.
Donohue, J.M., “Experimental and Numerical Study o f Ramp Injectors for
Supersonic Fuel/Air Mixing,” Ph J ) . Dissertation, Department o f Mechanical and
Aerospace Engineering, University ofVirginia, January 1995.
Hussaini, M.Y., Kumar, A., and Voigt, R.G. (eds.), “Major Research Topics in
Combustion," Springer-Verlag, New York, Inc., 1992.
Donohue, J.M., McDaniel J.C., and Haj-Hariri, H., “ Experimental and Numerical
Study of Swept Ramp Injection into a Supersonic How Field,” AIAA Journal,
Vol. 32, No. 9, September 1994, pp. 1860-1867.
Hollo, S.D., McDaniel, J.C., and Hartfield R.J., “Quantitative Investigation of
Compressible Mixing: Staged Transverse Injection into Mach 2 How,” AIAA
Journal, Vol. 32, No. 3, March 1994, pp. 528-534.
Papamoschou, D., and Roshko, A., “The Compressible Turbulent Shear Layer: an
Experimental Study,” Journal o f Fluid Mechanics, Vol. 197,1988, pp. 453-477.
Bogdanoff, D.W., “Compressibility Effects in Turbulent Shear Layers,” AIAA
Journal, Vol., 21, No. 6, 1983, pp. 926-927
Gutmark, E.J., Schadow, K.C., and Yu, K.H., “Mixing Enhancement in
Supresonic Free Shear Hows,” Annual Review o f Fluid Mechanics, Vol. 27, 1995,
pp. 31-43.
Yu, K B ., Wilson, K J., and Schadow, K.C., “Effect o f Hame Holding Cavities on
Supersonic Combustion Performance,” Journal o f Propulsions and Power, Vol.
17, No. 6, November-December 2001, pp. 1287-1295.
Yates, CX., ’’Liquid Injection into a Supersonic Stream,” Report AFAPL-TR-71-
79, Vol. 1, Aero propulsion Laboratory, Wright-Patterson AFB, OH, 1972.
of the copyright owner. Further reproduction prohibited without permission.

L72
36. Kush, E.A., and Schetz, J.A., “Liquid Jet Injection into a Supersonic Flow,” AIAA
Journal, Vol. I I , No. 9,1973, pp.1223-1224.
37. Wu, P.K., Kirkendall, K.A., Fuller, R.P., and Nejad, A.S., “Breakup Processes o f
Liquid Jets in Subsonic Crossflow,” Journal o f Propulsion and Power, Vol. 13,
No. 1,1997, pp. 64-73.
38. Fuller, R., Wu, P.K., Kirkendall, K., and Nejad, A., “Effect o f Injection Angle on
the Breakup Processes o f Liquid Jets in Subsonic Crossflows,” AIAA paper 97-
2966, July 1997.
39. Gruber, M il., Nejad, A.S., and Dutton, J.C., “Circular and Elliptical Transverse
injection into a Supersonic Crossflow—The Role of Large-Scale Structures,”
AIAA Paper 95-2150, June 1995.
40. Fuller, R.P., Wu, P.K., Nejad, A.S., and Schetz, J.A., “Comparison of Physical
and Aerodynamic Ramp as Fuel injectors in Supersonic Flow,” Journal o f
Propulsion and power, Vol. 14, No. 2, 1998, pp. 135-145.
41. Mathur, T., Lin, K.C., Kennedy, P., Gruber, M., Donbar, J., Jackson, T., and
Billig, F., “Liquid JP-7 Combustion in a Scramjet Combustor,” AIAA Paper
2000-3581, July 2000.
42. Curren, E.T., Heiser, W.H., and Pratt, D.T., “Fluid Phenomena in Scramjet
Combustion Systems,” Annual Review o f Fluid Mechanics, Vol. 28, 1996, pp.
323-360.
43. O’Byme, S., Doolan, M., Olsen, S.R., and Houwing, A.F.P., “Measurement and
Imaging o f Supersonic Combustion in a Model Scramjet Engine,” Proceedings o f
the 21st International Symposium on Shock Waves, Great Keepl Island, Australia,
Panther Publishing and Printing, 1988, pp.l 119-1124.
44. Moon, G-, Jeung, I-, and Choi, J-, “Numerical Study o f Thermal Choking Process
in a Model Scramjet Engine,” AIAA Paper 2000-3706, July 2000.
45. McDaniel, K. S., and Edwards, J.R., “Simulation o f Thermal Choking in a Model
Scramjet Combustor,” AIAA Paper 99-3411, June 1999.
46. Mohieldin, T.O., and Tiwari, S.N, “Effects o f Tandem Injection On Compressible
Turbulent Shear Layer,” AIAA Paper98-1638, April 1998.
Reproduced with permission of the copyright owner. Further reproduction prohibited without permission.

L73
47. Schetz, J.A., Thomas, R.H., and Billig, F., “Mixing o f Transverse lets and Wall
Jets in Supersonic Flow,” in Separated Flows and Jets, V.V. Kozlov and A.V.
Dovgal (Edits.), Springer-Verlag, Berlin, 1991.
48. Lee, S-H., Kim., H-B., and Mitani, T., “Mixing and Combustion Augmentation of
Transverse Injection in Scramjet Combustor,” AIAA Paper 2001-0384, January
2001.49. Drummond, J.P., and Weidner, E.H., “A Numerical Study of Candidate
Transverse Fuel Injector Configurations in the Langley Scramjet Engine,” 17th
JANAAF Combustion Meeting, NASA Langley Research Center, Hampton, VA,
September 22-26,1980, pp. 561-586.
50. McClinton, C.R., “Interaction Between Step Fuel Injectors on Opposite Wall in a
Supersonic Combustor Model,” NASA Technical Report 1174,1978.
51. King P.S., Thomas, R.H., Schetz, J.A., and Billig, F.S., “Combined Tangential-
Normal Injection Into a Supersonic Flow,” AIAA Paper 89-0622, January 1989.
52. Mays, R.B., Thomas, R.H., and Schetz, J.A., “Low Angle Injection Into a
Supersonic Flow,” AIAA Paper 89-2461, July 1989.
53. Wood, C.W., Thomas, R.H., and Schetz, J.A., “Effect of Oscillating Shock
Impingement on the Mixing o f a Gaseous Jet in a Mach 3 Airstream,” AIAA
Paper90-1982, July 1990.
54. Baranovsky, S.I., and Schetz, J.A., “Effect o f Injection Angle on Liquid Injection
in Supersonic Flow,” AIAA Journal, Vol. 18, No. 6, 1980, pp.625-629.
55. Masuya, G., Komuro, T., Murakami, A., Shinozaki, N., Nakamura, A.,
Murayama, M., and Ohwaki,K., “Ignition and Combustion Performance of
Scramjet Combustors with Fuel Injection Strut,” Journal o f Propulsion and
Power, Vol. 11, No. 2, March-April 1995, pp. 301-306.
56. Segal, C., McDaniel, J.C., Whitehurst, R.B., and Kruass, R.H., “Mixing and
Chemical Kinetics Interactions in a Mach 2 Reacting Flow, ”Journal o f
Propulsion and Power, Vol. 11, No. 2, March-April 1995, pp. 308-314.
57. McDaniel, J., Fletcher, D., Hartfield, R., and Hollo, S., “ Staged Transverse
Injection Into Mach 2 Flow Behind a Reward-Facing Step: A 3-D Compressible
Reproduced with permission of the copyright owner. Further reproduction prohibited without permission.

L74
^ Test Case for Hypersonic Combustor Code Validation,” AIAA Paper 91-5071,“ ' -/
December 1991....
58. Berman, H.A., Anderson, J.D., and Drummond, J.P., ’’Supersonic Flow over a
Rearward Facing Step with Transverse Non-Reacting Hydrogen Injection,” AIAA
Journal, Vol. 21, No. 12, December 1983, pp. 1707-1713.
59. Jian-Guo, L., Gong Y., Xin-Yu, Z., Qing-Sheng, H., “Combustion o f Kerosene in
a Supersonic Stream,” AIAA Paper 2000-0615, January 2000.
60. Rogers, R.C., Capriotti, D.P., and Guy, R.W., “Experimental Supersonic
Combustion Research at NASA Langley,” AIAA Paper 98-2506, June 1998.
61. Seiner, J.M., Dash, S.M., and Kenzakowski, D.C., “Historical Survey on
Enhanced Mixing in Scramjet Engines,” Journal o f Propulsion and Power, Vol.
17, No. 6, November-December 2001, pp. 1273-1286.
62. Stouffer, ST)., Baker, N il., Capriotti, D.P., and Northam, G.B., “Effects o f
Compression and Expansion Ramp Fuel Injector Configurations on Scramjet
Combustion and Heat Transfer,” AIAA Paper 93-0609, January 1993.
63. Drummond, J.P., Carpenter, M.H., Riggins, D.W., and Adams, M.S., “Mixing
Enhancement in a Supersonic Combustor,” AIAA Paper 89-2794, July 1989.
64. Hartfield, R.J., Jr., Hollo, ST)., and McDaniel, J.C., “Experimental Investigation
o f a Supersonic Swept Ramp Injector Using Laser-Induced Iodine Fluorescence,”
Journal o f Propulsion and Power, Vol. 10, No. 1, January-February 1994, pp.
129-135.
65. Waitz, I.A., Marble, F.E., and Zukoshi, E.E., “An Investigation o f a Contoured
Wall Injector for Hypervelocity Mixing Augmentation,” AIAA Journal, Vol. 31,
No. 6, June 1993, pp. 1014-1021.
66. Riggins, D.W., Mekkes, G.L., McClinton, C.R., and Drummond, J.R., “A
Numerical Study of Mixing Enhancement in a Supersonic Combustor,” AIAA
Paper90-0203,January 1990.
67. Daso, E.O., and Gross, B., “Analysis o f Supersonic Mixing in High Speed
Combustors,” Presented a t the Joint JANNAF Propulsion Meeting, Nov. 15,
1993.
Reproduced with permission of the copyright owner. Further reproduction prohibited without permission.

176
79.
80.
81.
82.
83.
84.
85.
86.
87.
88.
89.
Reproduced with permission
Thompson, M.W., “CIAM Reports for Phase 2 of the Joint US/Russian Scramjet
Program: Russian Hydrocarbon Fueled Scramjet Technology,” Report AFRL-PR-
WP-TR-1998-2017, Wright-Patterson AFB, Dayton, OH, 1997.
SabeL’nikov, V., Korontsvit, Y.P., Bain, W.L., Van Greithuysen, V.J.,
Ivanyushkin, A.K., and Ivanov, V.V., “Experimental Investigation o f Combustion
Stabilization in Supersonic Flow Using Free Recirculating Zone,” AIAA Paper
98-1515, April 1998.
Lin, K.-C., Kirkendall, K.A., Kennedy, P J ., and Jackson, T.A., “Spray Structure
o f Aerated Liquid Fuel Jets in Supersonic Crossflows,” AIAA Paper 99-2374,
June 1999.
Avrashnov, V., Baranovsky, S., and Levin, V., “Gas dynamic Features of
Supersonic Kerosene Combustion,” AIAA Paper 90-5268, October 1990.
Murthy, S.N.B., and Curran, E. T. (eds.), “High-speed R ight Propulsion System”,
Progress in Astronautics, AIAA, Vol. 137, Washington, DC, 1991.
Billig, F.S., “Propulsion Systems from Takeoff to High-Speed Flight,” Progress
in Astronautics and Aeronautics, AIAA, Vol. 137, Washington, DC, 1991, A.
Richard Seebass, Editor-in-chief, PP. 69.
Beach, H.L., “Supersonic Combsution Status and Issues,” in MajorReserach
Topics in Combustion, Hussaini, Kumar, and Voigt, eds, Springer Verlag, NY,
1992.
Northam, G.B., ed., “Workshop Report: Combustion in Supersonic Flow,” 22nd
JANNAF Combustion Meeting Proceedings, CPIA Publication 432, Vol. 1, 1985.
McClinton, C.R., “Autoignition of Hydrogen Injected Transverse to Supersonic
Airstream,” AIAA Paper, 79-1239, June 1979.
Huber, P.W., Schchenxnayder, C.J., and McClinton, R.C., “Criteria for Self-
Ignition of Supersonic Hydrogen-Air Mixtures,” NASA Technical Paper 1457,
1979.
Tomioka, S., Hiraiwa, T., Mitani, T., Zamma, Y., Shiba, K., and Masuya, G.,
“Auto Ignition in a Supersonic Combustor with Perpendicular Injection Behind
Backward-Facing Step,” AIAA Paper97-2889, July 1997.
of the copyright owner. Further reproduction prohibited without permission.

177
90. Sato, Y., Sayama, M., Masuya, G., Komuro, T., Kudou, K., Murakami, A., Tani,
K., and Chinzei, N., “Experimental Study on Autoignition ia a Scramjet
Combustor,” Proceedings o f $ h International Symposium on Airbreathing
Engines, Athens, September, 1989, pp. 569-576.
91. Spaddaccini, L.J., and Chinitz, W., “Supersonic Combustion o f Propane,” AIAA
Journal, Vol. 6,1967, pp. 1391-1393.
92. Beach, H.L., Jr. Mackley, E.A., Rogers. R.C., and Chinitz, W., “Use o f Silane in
Scramjet Research,” 17th JANNAF Combustion Meeting, Vol. I, CPIA
Publications 329, 1980, pp. 639-659.
93. Diskin, G.S., and Northam, G.B., “Evaluation of Storable Flourine Based Pilot for
Scramjets,” AIAA Paper, 86-0372,1986.
94. Masuya, G., Kudou, K., Murakami, A., Komuro, T., Tani, K., Kanda, T.,
Wakamatsu, Y., Chinzei, N., Sayama, M., Ohwaki, K., Kimura, I., “Some
Governing Parameters o f Plasma Torch Igniter/Flame-Holder in A Scramjet
Combustor,” AIAA Paper90-2098,1990.
95. Kimura, I., Aoki, H., and Kato, M., “The Use o f Plasma Jet for Flame
Stabilization and Promotion o f Combustion in Supersonic Air Flows,”
Combustion and Flame, Vol. 42,1981, pp. 297-305.
96. Northam, G.B., McClinton, C.R., Wagner, T.C., and O’Brien, W.F.,
“Development and Evaluation of a Plasma Jet Flame-Holder for Scarmjets,”
AIAA Paper 84-1408,1984.
97. Stouffer, S.D., O’Brien, W.F. and Roby, R.J., “Improved Plasma Torch for
Ignition and Flame Holding in Supersonic Combustion,” AIAA Paper 89-2945,
1989.
98. Wagner, T.C., O’Brien, W.F., Norrtham, G.B., and Eggers, JM ., “Design and
Evaluation o f a New Injector Configuration for Supersonic Combustion,” Proc.
S'* Int. Sympo. Airbreathing Engines, Cincinnati, June 1987, pp. 390-397.
99. Wagner, T.C., O’Brien, W F., Northam, G.B., and Eggers, JM ., “Plasma Torch
Igniter for Scramjets,” Journal o f Propulsion and Power, Vol. 5, 1989, pp. 548-
554.
Reproduced with permission of the copyright owner. Further reproduction prohibited without permission.

178
100. Sato, Y., Sayama, M., Ohwaki, K., Masuya, G., Komuro, T., Kudou, K.,
Murakami, A., Tani, K., Wakamatsu, Y., Kanda, T., Chinzei, N., and Kimura, I.,
“Effectiveness o f Plasma Torches for Ignition and Flame Holding in Scramjet,”
Journal o f Propulsion and Power, Vol. 8, No. 4, July-August, 1992.
101. Hawthorn, R.D., and Nixon, A.C., “Shock Tube ignition Delay Studies of
Endothermic Fuels,” AIAA Journal, Vol. 4, No. 3, March 1966.
102. Tepper, F., and Kaledin, L.A., “Nano Aluminum as a Combustion Accelerator for
Kerosene in Air Breathing Systems,” AIAA Paper 2001-0521,2001.
103. Lai, H.T., and Thomas, S.R., “Numerical Study of Contaminant Effects on
Combustion o f Hydrogen, Ethane and Methane in Air,” AIAA Paper 95-6097,
April 1997.
104. Srinivasan, S., and Erickson, W.D., “Interpretation of Vitiation Effects on Testing
at Mach 7 Flight conditions,” AIAA-95-2719, July 1995.
105. Slack, M., and Grillo, A., “Investigation o f Hydrogen-Air Ignition Sensitized by
Nitric Oxide and by Nitrogen Dioxide,” NASA CR-2986,1977.
106. Laster, W.R., and Sojka, P.E., “Autoignition o f Hi-Air; The Effect o f No*
Addition,” Journal o f Propulsion and Power, Vol. 5, No. 4, 1989, pp. 385-390
107. Brabbs, T A ., Lezberg, E.A., and Bittker, D.A., “Hydrogen Oxidation Mechanism
with Applications to (1) the Chaperon Efficiency of Carbon Dioxide and (2)
Vitiated Air Testing,” NASA TM-100186, 1987.
108. Rogers, R.C., “Effect o f Test Facility Contaminants on Supersonic Hydrogen-Air
Diffusion Flames,” 23rd JANNAF Combustion Meeting, Hampton, VA, October
20-24,1986.
109. Erickson, W. D., and Klick, G.F., “Analytical Chemical Kinetic Study o f the
Effect o f Carbon Dioxide and Water Vapor on Hydrogen-Air Constant-Pressure
Combustion,” NASATND-5768, April 1970.
110. Srinivasan, S., and Erickson, W.D., “Influence o f Test-Gas Vitiation on Mixing
and Combustion at Mach 7 Flight conditions,” AIAA 94-2816,1994.
111. Bakos, R.J., and Morgan, R.G., “Scramjet Combustion and Thrust Measurements
in a Reflected Shock Tunnel with Varied Test Gas Atomic Oxygen
Contamination,” AIAA Paper 94-2520,1994.
Reproduced with permission of the copyright owner. Further reproduction prohibited without permission.

L79
112. Mitani, T., Hiraiwa, T., Sato, S., Tomioka, S., Kanda, T., Tani, K., “Comparison
o f Scramjet Engine Performance in Mach 6 Vitiated and Storage-Heated Air,”
Journal o f Propulsion and Power, Vol. 13, No. 5, September-October 1997,
pp.635-642.
113. Hiraiwa, Ti, Sato, S., Tomioka, S., Kanda, T., Shirmura, T., and Mitan, T.,
“Testing o f a Scramjet Engine Model in Mach 6 Vitiated Air Flow,” AIAA-97-
0292, January 1997.
114. Owens, M., Sega, C., and Auslender, A.H., “Effects o f Mixing Schemes on
Kerosene Combustion in a Supersonic Air Stream,” Journal o f Propulsion and
Power, Vol. 13, No. 4, July-August 1997.
115. Edwards, T., ’’Combustion Challenges o f High Temperature Jet Fuels,” paper
204a presented at AIChE Annual Meeting, Nov. 15, 1996, Chicago, IL.
116. Billig, F.S., “Supersonic Combustion Ramjet Missile,” Journal o f Propulsion and
Power, Vol. 11, No. 6, 1995, pp. 1139-1146.
117. Jensen, J., Branendlein, B., ’’Review o f The Marquardt Dual Mode Mach 8
Scrmajet Development,” AIAA Paper 96-3037, June 1996.
118. Gurijanov, E.P., and Harsha, P.T., “Ajax: New Directions in Hypersonic
Technology,” AIAA Paper 96-4609,1996.
119. Edward, T., and Maurice, L, “HyTech Fuels/Fuel System Research,” AIAA Paper
98-1562, 1998.
120. Heins, A .EJr., Reed, G.J., and Woodgrift, K.E., “Hydrocarbon Scramjet
Feasibility Program, Part H: Experimental Investigation o f a Hydrocarbon Fueled
Scramjet Combustor,” AFAPL-TR-70-74, January 1971.
121. Kay, I.W., and McVey, J.B., “Hydrocarbon-Fueled Scramjet, Vol. XI. Combustor
Demonstration Program,” AFAPL-TR-68-146, May 1972.
122. Heins, A.E. Jr., Reed, G.J., and Woodgrift, K.E., “ Hydrocarbon Scramjet
Feasibility Program, Part HI: Free Jet Engine Design and Performance,” AFAPL
TR-70-74, Jan. 1971.
123. Billig, F.S., Pirkle, J.C., and Dugger, G.L., “Scramjet Fuels Evaluation,” AFAPL
TR-72-21, July 1972.
iI
i
Reproduced with permission of the copyright owner. Further reproduction prohibited without permission.

180
124. Gerstein, M. and Choudhucy, P.R., “Use of Silane/Methane Mixtures for Scramjet
Ignition,” AIAA Paper 84-1407, June 1984.
125. Hunt, J.L., et al., “Hypersonic Airbreathing Missile Concepts Under Study at
Langley,” AIAA Paper 82-0316, January 1982.
126. Morris, N.A., “Silane as an Ignition Aid in Scramjet,” Ph.D. Thesis, University o f
Qeensland, Australia, 1989.
127. Lander, H., and Nixon, A.C., "Endothermic Fuels for Hypersonic Vehicles,1'
Journal o f Aircraft, Vol. 8, No. 4,1970, pp. 200-207.
128. Petley, D.H., and Jones, S.C., "Thermal Management For a Mach 5 Cruise
Aircraft Using Endothermic Fuel," Journal o f Aircraft, Vol. 29, No. 3, May-June
1992, pp. 384-389.
129. Edward, T., "USAF Supercritical Hydrocarbon Fuels Interest," AIAA Paper 93-
0807, January 1993.
130. JANNAF Ramjet Subcommittee Workshop, "Fuels For High-Speed Flight
Vehicles," CPIA Publications 518 (2 Vols.), June 1988, pp. 143-182.
131. Lander, H., and Nixin, A.C., “Endothermic Fuels for Hypersonic Aircraft,”
Journal o f Aircraf, Vol. 8, N o .4 ,1971, pp. 200-207.
132. Hawthorne, R.D., Ackerman, G.H., and Nixon, A.C., “A Mathematical Model of
a Packed-Bed-Heat-Exchanger Reactor for Dehydrogeneration of
Methylcyclohexane: Comparison o f Predictions with Experimental Results,”
AICHE Joura.nl, Vol. 14, No. 1,1968, pp. 69-76.
133. Gates, B.C., Katzer, J.R., and Schuit, G.C.A., Chemistry o f Catalytic Processes,
McGraw-Hill, New York, 1979, p.8.
134. Wickham, D.T., Engel, J.R., Hitch, B.D., and Karpuk, M.E., “Initiators for
Endothermic Fuels,” Journal o f Propulsion and Power, Vol. 17, No. 6,
November-December2001, pp. 1253-1257.
135. Wohlwend, K.L., Maurice, L.O., Edwards, T., Striebich, R.C., Vangsness, M.,
and Hill, A.S., “Thermal Stability o f Energetic Hydrocarbon Fuels for Use in
Combined Cycle Engines,” Journal o f Propulsion and Power, Vol. 17, No. 6,
November-December 2001, pp. 1258-1262.
Reproduced with permission of the copyright owner. Further reproduction prohibited without permission.

18L
136. Kit, B., and Evered, D., “Rocket Propellant Handbook, ” ManMillan, New York,
1960.
137. “Survey o f Jet Fuels (1990-1996), ’’Defence Energy Support Center,” MIL-DTL-
5624T, June 1998.
138. Edwards, T., and Maurice, L.Q., “Surrogate Mixtures to Represent Complex
Aviation and Rocket Fuels,” AIAA Paper99-2217, June 1999.
139. Lefebvre, A., “Gas Turbine Fuels,” Gas Turbine Combustion, Hemisphere, New
York, 1983, Chapter 9.
140. Sobel, D.R., and Spadaccini, L.J., “Hydrocarbon Fuel Cooling Technologies for
Advanced Propulsion,” Journal o f Engineering Gas Turbines and Power, Vol.
119, No. 2, 1997, pp. 344-351.
141. Lewis, M.J., “Significance o f Fuel Selection for Hypersonic Vehicle Range,”
Journal o f Propulsion and Power, Vol. 17, No. 6, November-December 2001, pp.
1214-1221.
142. Owens, M, Tehranian, S, Segal, C., and Vinogradov, V., “Flame Holding
Configuration for Kerosene Combustion in a Mach 1.8 Airflow,” Journal o f
Propulsions and Power, Vol. 14, No. 4, July-August 1998.
143. Currant, E.T., and Murthy, S.N.B (eds.), “Scramjet Propulsion,” Progress in
Astronautics and Aeronautics, AIAA, Vol. 189, Reston Virginia, 2000, pp. 757-
822.
144. Pieper, J., Nguyen, T., and Hulka, J., “Performance and Stability Characterization
o f Liquid Oxygen/Kerosene Injection at Aerojet,” Recent Advances in Spray
Combustion: Spray Combustion Measurement and Model Simulation, Volume II,
Progress in Astronautics and Aeronautics, Volume 171,1996, pp. 349-368.
145. Heneghan, S.P., Zabamick, S.Z., Ballal, D.R., and Harrison HI, W.E., “JP-8+100:
The Development o f High-Thermal-Stability Jet Fuel,” Journal o f Energy
Resources Technology, Vol. 118, September 1996, pp. 170-179.
146. Zhou, N., and Krishnan, A., “A Numerical Model for Endothermic Fuel Flows
with Heterogeneous Catalysis,” AIAA Paper96-0650,1996.
147. Westbrook, C.K., and Dryer, F.L., “Chemical Kinetics Modeling of Hydrocarbon
Combustion,” Progress Energy and Combustion Science, 1984, Vol. 10, pp.1-57.
Reproduced with permission of the copyright owner. Further reproduction prohibited without permission.

L82
148. Sun, Y.Y., Han, Z.Y., Luo, X.S., Dog, S.T., Xu, S i . , and Situ, M., “A
Fundamental Study foe Supersonic Combustion of Hydrocarbon Fuel,” AIAA-
2001-0522, January 2001
149. Vinogradov, V.A., Owens, M., Mullagiri, S., Segal, C., “Effects o f Fuel Pre-
Injection on Mixing in a Mach 1.6 Airflow,” AIAA-99-4918, November 1999.
150. Townend, L.H., “Domain o f the Scramjet,” Journal o f Propulsion and Power,
Vol. 17, No. 6, November-December 2001, pp. 1205-1213.
151. O’Brien, T.F.O., Starkey, R.P., and Lewis, M.J., “Quasi-One-Dimensional high
speed Engine Model with Finite-Rate Chemistry,” Journal o f Propulsions and
Power, Vol. 17, No. 6, November-December 2001, pp. 1366-1374.
152. Mathur, T., Gruber, M., Jackson, K., Donbar, J., Donaldson, W., Jackson, T., and
Billig, F., “Supersonic Combustion Experiments with a Cavity-Based Fuel
Injector,” Journal o f Propulsions and Power, Vol. 17, No. 6, November-
December 2001, pp. 1305-1312.
153. Yu, K., Wilson, K.J., Smith, R.A., and Schadow, K.C., “Experimental
Investigation on Dual-Purpose Cavity in Supersonic Reacting Flows,” AIAA
Paper 98-0723, January 1998.
154. Situ, M., Wang, C., Lu, H.P., Yu, G., and Zhang, X.Y., “Hot gas Piloted Energy
for Supersonic Combustion o f Kerosene with. Dual-Cavity,” AIAA Paper 2001-
0523,2001.
155. Situ, M., Sun, Y.Y., Zhang, S.D., and Wang, C., “Investigation o f Supersonic
Combustion o f Hydrocarbon Fuel-Riched Hot Gas in Scramjet Combstor,” AIAA
Paper 99-2245,1999.
156. Kay, I.W., Chiappetta, L., and McVey, J.B., “Hydrocarbon Fueled-Scramjet,
Combustor Investigation,” Technical Report AFAPL-TR-68-146, Volume IV,
May 1969.
157. Kay, I.W., McVey, J.B., Kepler, C.E., and Chiappetta, L., “Hydrocarbon Fueled
Scramjet, Piloting and Flame Propagation Investigation, Combustor
Investigation,” Technical Report AFAPL-TR-68-146, Volume IX, May 1971.
Reproduced with permission of the copyright owner. Further reproduction prohibited without permission.

183
158. Bonghi, L., Dunlap, M., Owens, M., Young, C.D., and Segal, C., ‘Hydrogen
Piloted for Supersonic Combustion o f Liquid Fuels,” AIAA Paper 95-0730,
January 1995.
159. Vinogradov, V., Kobigsky, S., and Petrov, M., “Experimental Investigation of
Liquid Carbon-Hydrogen Fuel Combustion in Channel at Supersonic Velocities,”
AIAA Paper 92-3429, July 1992.
160. Change, J.S., and Lewis, M.J., “Development o f a Jet-A/Silane/hydrogen
Reaction Mechanism for Modeling a Scramjet Combustor,” AIAA Paper 99-
2252, June 1999.
161. Yu, G., Li, J.G., Chang, X.Y., Chen, L.H., Sung, C.J., “Investigation o f Kerosene
Combustion Characteristics with Pilot Hydrogen in Model Supersonic
Combustors,” Journal o f Propulsion and Power, Vol. 17, No. 6, November-
December 200 L.
162. Baurle, R.A., and Gruber, M.R., “Study o f Recessed Cavity Flow Fields for
Supersonic Combustion Applications,” AIAA Paper 98-0938, January 1998.
163. Ben-Yakar, A., and Hanson. R., “Cavity Flame Holding for Ignition and Flame
Stabilization in Scramjets: Review and Experimental Study,” AIAA Paper 98-
3122, July 1998.
164. Davis, D.L., “Numerical Analysis o f Two and Three Dimensional Recessed
Flame-Holders for Scramjet Applications,” Ph.D. Dissertation, Aeronautics and
Astronautics Dept., A ir Force Inst, o f Technology, W right Patterson AFB, OH,
Sept. 1996.
165. Baurle, R.A., Tam, C.-J., and Dasgupta, S., “Analysis o f Undteady Cavity Flows
for Scramjet Applications,” AIAA Paper 2000-3617, July 2000.
166. Bumes, R., Parr, T.P., Wilson, K J., and Yu, K., “Investigation o f Supersonic
Mixing Control Using Cavities: Effect o f Fuel Injection Location,” AIAA Paper
2000-3618, July 2000.
167. Gruber M il., Baurle, R A ., Mathur, T., and Hsu, K.-Y., “Fundamental Studies o f
Cavity-Based Flame-Holder Concepts for Supersonic Combustors,” AIAA Paper
99-2248, June 1999.
Reproduced with permission of the copyright owner. Further reproduction prohibited without permission.

184
168. Eklund, D.R., Baurle, R.A., and Gruber, M.R., “Numerical Study o f a Scramjet
Combstor Fueled by an Aerodynamic Ramp Injector in Dual-Mode Combustion,”
AIAA, Paper2001-0379, January 2001.
169. Waltrup, P J ., Dugger, G.L., Billig, F.S., and Orth, R.C., “Direct-Connect Tests of
Hydrogen-Fueled Supersonic combustors,” 16th Symposium (Int’l) on
Combustion, Combustion Institute, 1976, pp. 1619-1630.
170. McCilinton, C.R., “Interaction Between Step Fuel Injector on Opposing Walls in
a Scramjet Combustor Model,” NASA TP-1174, 1978.
171. Trexler, C.A., and Sanders, S.W., “Design and Performance at a Local Mach
Number o f 6 o f an Inlet for an Integrated Scramjet Concept,” NASA TN-D-7944,
1977.
172. Nivkerson, G.R., “Optimized Scramjet Exhaust Nozzles for Hypersonic
Propulsion,” AIAA Paper 88-3161, 1988.
173. Tomioka, S., Hiraiwa, T., Sakuranaka, N, Murakami, A., Sato, K., Matsui, A.,
“Ignition Strategy in A Model SCRAMJET,” AIAA-96-3240, July 1996.
174. Roy, G.D., Propulsion Combustion: Fuels to Emissions, Taylor & Francis
Publishers, 1998.
175. Westbrook, C.K., and Dryer, F.L., “Simplified Reaction Mechanism for the
Oxidation o f Hydrocarbon Fuels in Flames,” Combustion Science and
Technology, Vol. 27, No. 1,1981, pp.31-43.
176. Jachimowski, C.J., “An Experimental and Analytical Study o f Acetylene and
Ethylene Oxidation Behind Shock Waves,” Combustion and Flame, Vol. 29, No.
1,1977, pp.55-66.
177. White, M E., Drummond, J.P., and Kumar, A., “Evolution and Application of
CFD Techniques for Scramjet Engine Analysis,” Journal o f Propulsion and
Power, Vol. 3, No. 5, September-October 1987, pp. 423-439.
178. Bissinger, N.C., “CFD Support for Scramjet Design and testing,” AIAA Paper 99-
4956, November 1999.
179. Lee, R.A., Hosangadi, A., Cavallo, PA ., and Dash, S.M., “Application of
Unstructured Grid Methodology to Scramjet Combustor Flow Fields,” AIAA
Paper 99-0087, January 1999.
Reproduced with permission of the copyright owner. Further reproduction prohibited without permission.

L85
180. Kodera, M., Sunami, T., and Nakahashi, K., “Numerical Analysis o f Scramjet
Combusting Flows By Unstructured Hybrid Grid Method,” AIAA Paper 2000-
0886, January 2000.
181. Ungewitter, R.J., Dash, S.M., Papp, J., and Hosangadi, A., “Design-Oriented
Analysis o f Scramjet Combustor Flow Field Using Combined UNS/PNS
Procedure,” AIAA Paper 2000-3616, June 2000.
182. Chakravarthy, S., Goldgerg, U., Batten, P., Palaniswamy, S., and Peroomian, O.,
“Some Recent Progress in Practical Computational Fluid Dynamics,” AIAA
Paper 2001-0136, January 2001.
183. Mehta, U.B., “Credible Computational Fluid Dynamics Simulations,” AIAA
Journal, Vol. 36, No. 5, May 1998, pp.665-667.
184. Rizzi, A., and Vos, J., ‘Towards Establishing Credibility in Computational Fluid
Dynamics Simulations,” AIAA Journal, Vol. 36, No. 5, May 1998, pp. 668-675.
185. Oberkampf, W.L., Blottner, F.G., “Issues in Computational Fluid Dynamics Code
Verification and Validation,” AIAA Journal, Vol. 36, No. 5, May 1998, pp. 687-
695.
186. Roache, P.J., “Verification o f Codes and Calculations,” AIAA Journal, Vol. 36,
No. 5, May 1998, pp. 696-702.
187. Oberkampf, W.L., and Trucano, T.G., “Validation Methodology in Computational
Fluid Dynamics (Invited),” AIAA Paper 2000-2549, June 2000.
188. Espina P J ., and piomelli, U., “Validation o f the NPARC Code in Supersonic Base
Flows,” AIAA Paper97-0032, January 1997.
189. Jameson, A., Martinelli, L., “Mesh Refinement an Modeling Errors in Flow
Simulation,” AIAA Journal, Vol. 36, No. 5, May 1998, pp. 676-686.
190. Habashi, W.G., Doinpierre, J., Bourgault, Y., Fortin, M., and Vallet, M.-G.,
“Certifiable Computational Fluid Dynamics Through Mesh Optimization,” AIAA
Journal, Vol. 36, No. 5, May 1998, pp. 703-711.
191. Johnson, C., and Muss, J., “Propulsion Analysis and Computational Fluid
Dynamics Tools on the Internet,” AIAA Paper 2000-3769, July 2000.
192. Fluent Version 5.5 User’s Guide, Fluent, Inc., Lebanon, New Hampshire, 2000.
Reproduced with permission of the copyright owner. Further reproduction prohibited without permission.

186
193. Anderson, J.D., Computational Fluid Dynamics: The Basics with Applications,
McGraw Hill, Inc., New York, NY, 1995.
194. Launder, B.E., Spalding, D.B., Lectures in Mathematical Models o f Turbulence,
Academic Press, London, England, 1972.
195. Wilcox, D. C. ‘Turbulence Modeling for CFD,” DCW Industries, Inc., La
Canada, California, 1993.
196. Sarkar, S. and Balakrishnan, L. “Application of a Reynolds-Stress Turbulence
Model to the Compressible Shear Layer” ICASE Report 90-18, NASA CR
182002, 1990.
197. Magnussen, B.F., and Hjertager, B.H. "On Mathematical Models o f Turbulent
Combustion with Special Emphasis on Soot Formation and Combustion,” 16th
Sump. (Int’l.) on Combustion, The Combustion Institute, 1976.
198. Owens, M., Segal, C., and Auslender, A.H., “Effects o f Mixing Schemes on
Kerosene Combustion in a Supersonic Air stream,” Journal o f Propulsion and
Power, Vol. 13, No. 4, July-August 1997, pp 525-531.
199. Owens, M., Tehranian, S., Segal, C., and Vinogradov, V., “Flame-Holding
Configurations for Kerosene Combustion in a Mach 1.8 Airflow,” Journal o f
Propulsion and Power, Vol. 14, No. 4, July-August 1998, pp 456-461.
200. Curran, E.T., and Bergsten, M.B., “Inlet Efficiency Parameters for Supersonic
Combustion Ramjet Engines,” AR Aero propulsion Lab. Rep. APLTDR 64-61,
June 1964.
201. Curran, E.T., Leingang, J.L., Carriero, L.R., and Petters, D.P., “A Review of
Kinetic Energy Methods in High Speed Ramjet Cycle Analysis,” International
Symposium on Air Breathing Engines, Paper No. IS ABE 91-10.50-), AIAA,
1991.
202. Curran, E.T., Leingang, J., Carriero, LA., and Petters, DA., “Further Studies of
Kinetic Energy Methods in High Speed Ramjet Cycle Analysis,” AIAA Paper 92-
3805, July 1992.
Reproduced with permission of the copyright owner. Further reproduction prohibited without permission.

187
CURRICULUM VITA
forAHMED A. TAHA
DEGREES:
• Doctor o f Philosophy (Mechanical Engineering), Old Dominion University,
Norfolk, VA, Dec. 2002
• Master o f Science (Mechanical Power Engineering), Cairo University, Cairo,
Egypt, June 1994
• Bachelor o f Science (Mechanical Power Engineering), Cairo University, Cairo,
Egypt, July 1988
PROFESSIONAL CHRONOLOGY:
• Mechanical Engineering Dept., Old Dominion University, Norfolk, VA. Research
and Teaching Assistant, Aug. 1996 - Dec. 2002
• Development, Research, and Technology Planning Center (DRTPC), Cairo,
Egypt. Consultant, Energy Dept., Feb. 1996 — Aug. 1996
• International Company for Engineering, Management, and Environment
Consultations (ICEMEC), Cairo, Egypt. Training Coordinator, Aug. 1994 - Oct.
1995
• Mechanical Power Engineering Dept., Cairo University, Cairo, Egypt. Research
and Teaching Assistant, Aug. 1988 - June 1994
HONORS AND AWARDS:
• Student Member, Virginia Academy o f Science (5/1999 - Present).
• Student Member, American Society for Mechanical Engineers (ASME) (1/1999 -
Present).
• Student Member, American Inst, for Aeronautics and Astronautics (AIAA)
(12/1996 — Present).
• Member, Mechanical Engineering Branch, Engineers Syndicate, Cairo, Egypt
(5/1988 — Present).
Reproduced with permission of the copyright owner. Further reproduction prohibited without permission.

188
SCHOLARLY ACTIVITIES COMPLETED:
Refereed Journal Articles:
• Taha A.A., Tiwari S.N., Mohieldin T.O., “Mixing and Combustion o f Ethylene in
Scramjet Engines,” Journal o f Propulsion and Power. Vol. 18, No. 3, May-June
2002, pp. 716-718.
Selected Refereed Proceedings:
• Mohieldin T.O., Alfahaid A.F., Tiwari S.N., Taha, A.A., "On the Characteristics of
Turbulent Multiple Jets Diffusion Flame: Part 1 Cold Flow," International Thermal
conference, University o f Wales Swansea, Wales, UK, July 21-24, 1997.
• Tiwari S.N., Mohieldin T.O., Taha A.A., "Effects o f Supersonic Vitiated/Clean
Air on Ignition/Combustion Characteristics o f Hydrogen Fuel, Part I: Code
Validation," presented at the 37th AIAA Aerospace Sciences Meeting and Exhibit,
Reno, NV, January 11-14, 1999, AIAA Paper No. 99-0487, January 1999. Also
presented at the 77th Virginia Academy of Science Annual Meeting, Norfolk, VA,
May 25-28, 1999.
• Taha A.A., Tiwari SJST., Mohieldin T.O., "Study o f Supersonic Vitiated/Clean Air
Ignition/Combustion Characteristics o f Hydrogen Fuel," presented at the 9th
International Space Planes and Hypersonic Systems and Technologies Conference,
Norfolk, VA, November 1-5, 1999, AIAA Paper No. 99-4919, November 1999.
• Tiwari S.N., Taha A.A., Mohieldin T.O., "Numerical Investigation of Methane
Combustion in Supersonic Air Streams with Pilot-Hydrogen Injection," presented
at the 38th AIAA Aerospace Sciences Meeting and Exhibit, Reno, NV, January 10-
13,2000, AIAA Paper No. 2000-0320, January 2000.
• Taha A.A., Tiwari S.N., Mohieldin T.O., "Numerical Simulation of
Ignition/Combustion Characteristics o f Ethylene in Supersonic Air Streams,"
presented at the 36th AIAA/ASME/SAE/ASEE Joint Propulsion Conference and
Exhibit, Huntsville, AL, July 16-19,2000, AIAA Paper No. 2000-3584, July 2000.
• Tiwari S.N., Taha A.A., Mohieldin T.O., "Mixing and Ignition/Combustion
Characteristics o f Hydrogen, Ethylene, and Kerosene Fuels in Supersonic Air
Streams," presented at the 34th National Heat Transfer Conference, Pittsburgh, PA,
August 20-22,2000; ASME Paper No. NHTC 2000-12149, August 2000.
Reproduced with permission of the copyright owner. Further reproduction prohibited without permission.

189
• Taha A.A., Tiwari S.N., Mohieldin T.O., “Combustion o f Ethylene and Propane in
Scramjet Engines; Numerical Study,” for Presentation at the 39th Aerospace
Science Meeting and Exhibit, Reno, NV, January 8- i l , 2001.
• Tiwari S.N., Taha A.A., Mohieldin T.O., "Numerical Investigation o f Ethylene
Combustion in Supersonic Air Streams with Pilot-Hydrogen Injection," presented
at the 78th Virginia Academy of Science Annual Meeting, Radford, VA, May 23-
26,2000.
• Taha A.A., Tiwari S.N., Mohieldin T.O., “Combustion o f Hydrocarbon Fuels in
Scramjet Engines; Propane Combustion,” for Presentation at the 35th National
Heat Transfer Conference, Anaheim, CA, June 10-12, 2001.
• Taha A.A., Tiwari S.N., Mohieldin T.O., “Validation o f Fluent CFD Code in
Supersonic Flow Fields,” for Presentation at thel5lh AIAA Fluid Dynamics
Conference and Exhibit, Anaheim, CA, June 11-14,2001.
• Tiwari S.N., Taha A.A., Mohieldin T.O., “Effect of Pilot Injection and Combustor
Configuration on the Flame Holding and Stability o f Ethylene in Scramjet
Engines,” for Presentation at the 40th Aerospace Science Meeting and Exhibit,
Reno, NV, January 14-17,2002.
• Taha A.A., Tiwari S.N., Mohieldin T.O., “Pilot Injection and Flame
Characteristics o f Propane combustion in Scramjet Engines,” for Presentation at
the 38th AIAA/ASME/SAE/ASEE Joint Propulsion Conference & Exhibit,
Indianapolis, Indiana, July 7-10,2002.
Reproduced with permission of the copyright owner. Further reproduction prohibited without permission.