Generation Y students' attitudes and behavioural responses ...
Upload
khangminh22Category
view
2download
0
SUBTYPING THE BEHAVIOURAL EFFECTS OF DECEIT AND THE IMPLICATIONS FOR DETECTING DECEPTION
by
Marcus Juodis
Submitted in partial fulfillment of the requirements for the degree of Doctor of Philosophy
at
Dalhousie University Halifax, Nova Scotia
November 2014
© Copyright by Marcus Juodis, 2014

ii
Dedicated to my mother,
Ruta Dragunevicius
iii
TABLE OF CONTENTS
LIST OF TABLES ............................................................................................................ vii
LIST OF FIGURES ........................................................................................................... ix
ABSTRACT ........................................................................................................................ x
LIST OF ABBREVIATIONS AND SYMBOLS USED ................................................... xi
ACKNOWLEDGMENTS ............................................................................................... xiii
CHAPTER 1. INTRODUCTION ....................................................................................... 1
Defining Deception and the Scope of the Dissertation ............................................... 1
The Functions of Deception ........................................................................................ 3
The Prevalence of Deception ...................................................................................... 4
The Importance of Detecting Deceit in Specific Contexts ......................................... 8
Deception Detection Accuracy and Associated Problems ........................................ 14
Rationale for Examining Verbal and Nonverbal Behaviour of Suspected Deceivers ................................................................................................................... 15
CHAPTER 2. STUDY 1: SUBTYPING THE BEHAVIOURAL EFFECTS OF DECEIT ............................................................................................................................ 20
Verbal and Nonverbal Cues to Deception: Conceptual Background ........................ 20
Ekman and Friesen (1969) .................................................................................... 20
Zuckerman, DePaulo, and Rosenthal (1981) ........................................................ 23
The Role of Arousal .......................................................................................... 24
The Role of Emotional Reactions ..................................................................... 24
The Role of Cognitive Effort ............................................................................ 25
The Role of Attempted Behavioural Control .................................................... 25
Ekman (1985/1992) .............................................................................................. 26
Buller and Burgoon (1996) ................................................................................... 27
DePaulo et al. (2003) ............................................................................................ 28
Rationale for Subtyping the Behavioural Effects of Deception and Hypotheses ..... 31
Method .......................................................................................................................... 34
Participants ................................................................................................................ 34
Procedure .................................................................................................................. 34
Results ........................................................................................................................... 36
Searching for Outliers ............................................................................................... 36

iv
Tests of Significance and Error Rates ....................................................................... 36
Comparing Truthful and Deceptive Accounts: Students versus Offenders .............. 37
Calculating and Correlating Difference Scores ........................................................ 42
Subtyping Procedures ............................................................................................... 45
Defining Key Terms ............................................................................................. 45
Between-Subjects Transformation of Variables ................................................... 46
Within-Subjects Transformation of Variables: Compensating for Responsivity .......................................................................................................... 46
Using K-Means Cluster Analysis to Identify Subtypes ........................................ 47
Identifying the Number of Subtypes ..................................................................... 48
Describing the Subtypes: Fluid Liars and Laboured Liars ............................... 51
Are the Subtypes Meaningful?.............................................................................. 53
Validation of Subtypes: Identifying Correlates .................................................... 55
Searching for Potential Demographic Correlates ............................................. 55
Examining the Importance of Criminal Status ...................................................... 57
Examining the Importance of Speech Rate ........................................................... 65
Discussion ..................................................................................................................... 70
General Behavioural Differences between Students and Offenders ......................... 70
Differences between Truthful and Deceptive Accounts of Negative Life Events .... 72
Relationships among Cues to Deceit for Negative Life Events ................................ 73
Identification of Subtypes: Fluid and Laboured Liars .............................................. 76
Association between Subtypes and Criminal Status ................................................. 79
Limitations of the First Study ................................................................................... 83
CHAPTER 3. STUDY 2: REPLICATING THE SUBTYPES ......................................... 84
Method .......................................................................................................................... 89
Participants ................................................................................................................ 89
Materials ................................................................................................................... 89
International Affective Picture System ................................................................. 89
Manipulation Check .............................................................................................. 90
Demographic Measure .......................................................................................... 91
Beliefs About Deception Questionnaire ............................................................... 91
Big Five Inventory ................................................................................................ 92

v
Balanced Inventory of Desirable Responding ...................................................... 92
Procedure .................................................................................................................. 93
Results ........................................................................................................................... 96
Manipulation Check Results ..................................................................................... 96
Search for Outliers .................................................................................................... 99
Comparing Truthful and Deceptive Accounts of Having Viewed Distressing Images ....................................................................................................................... 99
Calculating and Correlating Difference Scores ...................................................... 101
Subtyping Procedures ............................................................................................. 103
Identifying the Number of Subtypes ................................................................... 104
Describing the Subtypes: Fluid Liars and Laboured Liars ............................. 106
Are the Subtypes Still Meaningful? .................................................................... 108
Subtype Validation: Identifying Correlates ........................................................ 108
Searching for Potential Demographic Correlates ........................................... 108
Searching for Potential Attitudinal Correlates ................................................ 111
Searching for Potential Personality Correlates ............................................... 117
Searching for Methodological Correlates: Ruling Out Confounding Variables ......................................................................................................... 121
Discussion ................................................................................................................... 125
Differences between Truthful and Deceptive Accounts of Distressing Images ..... 126
Relationships among Cues to Deceit for Having Viewed Distressing Images ....... 127
Replication of Subtypes: Fluid and Laboured Liars ............................................... 127
Subtype Correlates: Sex Differences and Beliefs about Cues to Deception ........... 128
Limitations of the Second Study ............................................................................. 134
CHAPTER 4. GENERAL DISCUSSION ...................................................................... 137
Summary of General Findings ................................................................................ 138
Results Consistent Across Both Studies ............................................................. 138
Small or No Group Differences for Cues to Deception .................................. 138
Fluid and Laboured Liar Subtypes and the Robustness of Speech Rate ......... 141
Psychological Factors Underlying Subtype Expression? ............................... 142
The Need for Better Measures of Constructs Related to Deception ............... 144
Appreciable Correlations among Cues to Deceit: Practical Implications ....... 148

vi
Results Unique to Each Study............................................................................. 149
Differences between Students and Offenders: Value in Baseline Comparisons ................................................................................................... 149
Decreases in Silent Pauses among Offenders while Lying: Attempted Control?........................................................................................................... 150
Speech Rate and the Robustness of the Subtypes ........................................... 151
Criminal Status as a Subtype Correlate .......................................................... 152
Replication of Subtypes Using a Different Methodology............................... 153
Stereotypical Beliefs about Cues to Deception as a Subtype Correlate.......... 154
Variables Not Identified as Subtype Correlates .............................................. 157
Discrepancies between the Results of the Two Studies ...................................... 159
Further Implications of the Findings for Detecting Deception ............................... 161
A Profile-Matching Approach for Detecting Deception? ................................... 163
Limitations of Both Studies and Additional Recommendations for Future Research .................................................................................................................. 163
Concluding Remarks ............................................................................................... 169
APPENDIX A. USE OF IPSATIVE Z-SCORES IN FORENSIC RESEARCH AND PRACTICE............................................................................................................ 171
APPENDIX B. RATIONALE FOR USING K-MEANS CLUSTER ANALYSIS WITH EUCLIDEAN DISTANCE SPECIFIED AS THE DISTANCE MEASURE ..... 173
Hierarchical Cluster Analysis versus K-Means Cluster Analysis ........................... 173
Euclidean Distance versus Other Measures of Profile Similarity and Dissimilarity ............................................................................................................ 175
Previous Use of K-Means Cluster Analysis and Other Traditional Techniques ..... 176
Latent Class Cluster Analysis versus K-Means Cluster Analysis ........................... 178
Previous Use of K-Means Cluster Analysis and Latent Class Cluster Analysis ..... 180
APPENDIX C. CODING PROCEDURE FOR VERBAL AND NONVERBAL BEHAVIOUR ................................................................................................................. 182
REFERENCES ............................................................................................................... 185

vii
LIST OF TABLES
Table 1 Coded Behaviour Cell Means (and Standard Deviations) for Students’ and Offenders’ Truthful and Deceptive Accounts of Negative Life Events. ........ 39
Table 2 Results of 2 x 2 Repeated Measures Univariate ANOVAs on Coded Behaviours. ..................................................................................................... 40
Table 3 Results of t-Tests Comparing Behaviours Coded in Students’ and Offenders’ Truthful and Deceptive Accounts of Negative Life Events. ........ 41
Table 4 Pearson Product-Moment Correlations among Difference Scores of Coded Behaviours for Participants (n = 64) Relating Truthful and Deceptive Accounts of Negative Life Events. ................................................ 43
Table 5 Comparison of Fluid and Laboured Liars’ Mean Ipsative Z-Scores of Difference Scores for Behaviours Coded from Truthful and Deceptive Accounts of Negative Life Events. ................................................................. 50
Table 6 Comparison of Student Fluid and Laboured Liars’ Mean Ipsative Z-Scores of Difference Scores for Behaviours Coded from Truthful and
Deceptive Accounts of Negative Life Events. ................................................ 58
Table 7 Comparison of Offender Fluid and Laboured Liars’ Mean Ipsative Z-Scores of Difference Scores for Behaviours Coded from Truthful and
Deceptive Accounts of Negative Life Events. ................................................ 62
Table 8 Comparison of Fluid and Laboured Liars’ Mean Ipsative Z-Scores of Difference Scores for Behaviours Coded from Truthful and Deceptive Accounts of Negative Life Events with Speech Rate Excluded from Analysis........................................................................................................... 66
Table 9 Comparison of Participants’ (n = 64) Pleasantness and Arousal Ratings for Stimuli Viewed in the Truthful and Deception Conditions of the Second Experiment. ........................................................................................ 98
Table 10 Results of t-Tests Comparing Behaviours Coded in Participants’ (n = 64) Truthful and Deceptive Accounts of Exposure to Moderately
Distressing Images. ....................................................................................... 100
Table 11 Pearson Product-Moment Correlations among Difference Scores of Coded Behaviours for Participants (n = 64) Relating Truthful and Deceptive Accounts of Exposure to Moderately Distressing Images. .......... 102
Table 12 Comparison of Fluid and Laboured Liars’ Mean Ipsative Z-Scores of Difference Scores for Behaviours Coded from Truthful and Deceptive Accounts of Exposure to Distressing Images. .............................................. 105
Table 13 Comparison of Fluid and Laboured Liars’ Demographic Characteristics. ... 110
Table 14 Comparison of the Subtypes’ Endorsement of Stereotypical Beliefs About the Behaviour of Liars. ...................................................................... 114

viii
Table 15 Fluid and Laboured Liars’ Beliefs About the Frequency of Deception, their Deception-Related Abilities, and the Gullibility of Others. ................. 116
Table 16 Comparison of Fluid and Laboured Liars’ Personality Traits. ..................... 118
Table 17 Socially Desirable Responding among Fluid and Laboured Liars. .............. 120
Table 18 Nature of the Stimuli Described by Fluid and Laboured Liars. .................... 122
Table 19 Fluid and Laboured Liars’ Ratings of the Perceived Difficulty of the Experimental Tasks, Emotional Arousal Experienced During the Experimental Tasks, and Beliefs Concerning Self-Presentation During the Deception Task. ...................................................................................... 124

ix
LIST OF FIGURES
Figure 1 Profiles of the Relative Behavioural Effects of Deception among Participants Relating Negative Life Events. ................................................... 52
Figure 2 Assignment of Fluid and Laboured Liars as a Function of Criminal Status. .. 56
Figure 3 Profiles of the Relative Behavioural Effects of Deception among Students Relating Negative Life Events. ....................................................................... 60
Figure 4 Profiles of the Relative Behavioural Effects of Deception among Offenders Relating Negative Life Events. ...................................................... 64
Figure 5 Profiles of the Relative Behavioural Effects of Deception among Participants Relating Negative Life Events with Speech Rate Excluded from the Analysis. ........................................................................................... 68
Figure 6 Profiles of the Relative Behavioural Effects of Deception among Participants Describing Moderately Distressing Images. ............................. 107
Figure 7 Participants’ (n = 64) Beliefs About the Behaviour of Liars. ....................... 112
x
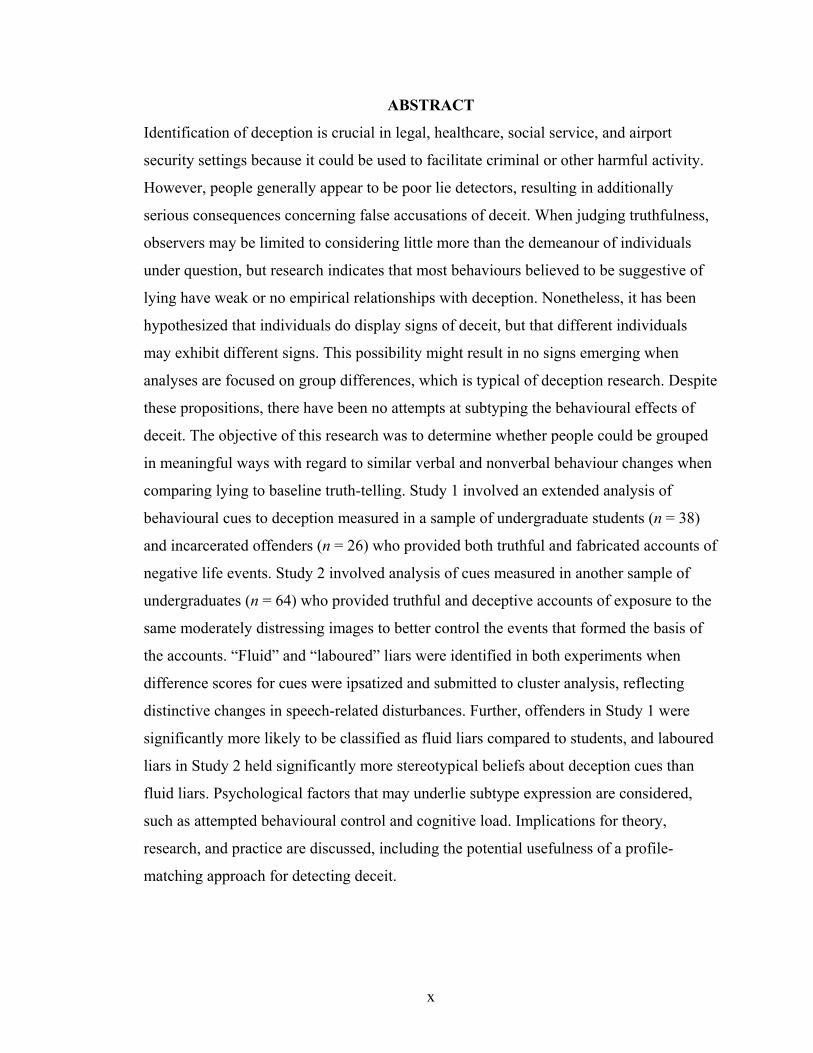
ABSTRACT
Identification of deception is crucial in legal, healthcare, social service, and airport
security settings because it could be used to facilitate criminal or other harmful activity.
However, people generally appear to be poor lie detectors, resulting in additionally
serious consequences concerning false accusations of deceit. When judging truthfulness,
observers may be limited to considering little more than the demeanour of individuals
under question, but research indicates that most behaviours believed to be suggestive of
lying have weak or no empirical relationships with deception. Nonetheless, it has been
hypothesized that individuals do display signs of deceit, but that different individuals
may exhibit different signs. This possibility might result in no signs emerging when
analyses are focused on group differences, which is typical of deception research. Despite
these propositions, there have been no attempts at subtyping the behavioural effects of
deceit. The objective of this research was to determine whether people could be grouped
in meaningful ways with regard to similar verbal and nonverbal behaviour changes when
comparing lying to baseline truth-telling. Study 1 involved an extended analysis of
behavioural cues to deception measured in a sample of undergraduate students (n = 38)
and incarcerated offenders (n = 26) who provided both truthful and fabricated accounts of
negative life events. Study 2 involved analysis of cues measured in another sample of
undergraduates (n = 64) who provided truthful and deceptive accounts of exposure to the
same moderately distressing images to better control the events that formed the basis of
the accounts. “Fluid” and “laboured” liars were identified in both experiments when
difference scores for cues were ipsatized and submitted to cluster analysis, reflecting
distinctive changes in speech-related disturbances. Further, offenders in Study 1 were
significantly more likely to be classified as fluid liars compared to students, and laboured
liars in Study 2 held significantly more stereotypical beliefs about deception cues than
fluid liars. Psychological factors that may underlie subtype expression are considered,
such as attempted behavioural control and cognitive load. Implications for theory,
research, and practice are discussed, including the potential usefulness of a profile-
matching approach for detecting deceit.

xi
LIST OF ABBREVIATIONS AND SYMBOLS USED
% Percent α Cronbach’s alpha ηp
2 Partial eta squared χ2 Chi-square statistic AIC Akaike information criteria ANOVA Analysis of variance APA American Psychiatric Association APD Antisocial personality disorder BADQ Beliefs About Deception Questionnaire BAI Behaviour Analysis Interview BIC Bayesian information criteria BIDR Balanced Inventory of Desirable Responding BFI Big Five Inventory CH Calinski-Harabasz d Cohen’s measure of effect size DNA Deoxyribonucleic acid Ds Dissimulation scale DSM-5 Diagnostic and Statistical Manual of Mental Disorders-5th edition EEG Electroencephalogram F Fisher’s F-ratio fMRI functional Magnetic Resonance Imaging Fp Infrequency-Psychopathology scale IAPS International Affective Picture System IM Impression Management k Number of clusters LC Latent class LCA Latent class analysis LPA Latent profile analysis M Mean MMPI-2 Minnesota Multiphasic Personality Inventory-2 n Sample size / number of participants NIM Negative Impression Management OR Odds ratio p p-value for determining statistical significance PAI Personality Assessment Inventory PCL-R Psychopathy Checklist-Revised PTSD Posttraumatic stress disorder r Pearson product-moment correlation coefficient RM Reality Monitoring RS Rare Symptoms SCAN Scientific Content Analysis SD Standard deviation SDE Self-Deceptive Enhancement SDR Socially Desirable Responding

xii
SEM Structural equation modeling SIRS Structured Interview of Reported Symptoms SPSS Statistical Package for the Social Sciences SVA Statement Validity Assessment t Student’s t-test statistic US United States VSA Voice Stress Analysis

xiii
ACKNOWLEDGMENTS
There’s nothing like trying to complete a clinical psychology PhD program that drives home the point that nobody makes it alone. There are many people that I need to thank for helping me along the way. Being fortunate enough to meet these people made this journey all the more worthwhile, and I share this achievement with them. I could have easily written many more pages of thanks, but unfortunately was unable to do so or the “caboose would outweigh the train” as one might say. I apologize for this limitation in expressing my gratitude, and sincerely apologize to anybody that I may have missed in my hurry to complete this manuscript.
I would like to thank my supervisor, Dr. Stephen Porter, for taking me on as a
doctoral student and facilitating my dream of becoming a psychologist and pursuing forensic psychology at the graduate level. I am very appreciative of the encouragement and freedom that you provided when I was making decisions on areas that I wished to study, and I am especially thankful for your generosity in enabling me to present my research in some of the World’s most interesting, beautiful, and fun places. I will deeply miss, but continue to remember fondly, our many lab get-togethers at Tom’s. They are among my happiest memories of my time in grad school.
I extend sincere thanks to the very supportive people who made up my examining
committee, Drs. Simon Sherry, Raymond Klein, Margo Watt, and Jennifer Stamp. Thank you for your timely review of my work, thoughtful input on elements of experimental design, and valuable suggestions for ways to improve earlier drafts of this dissertation. I also would like to thank Dr. Sherry for agreeing to act as my co-supervisor after Dr. Porter’s departure from Dalhousie, and for the in-person guidance that I needed for meeting many demanding program requirements. Thank you to Dr. Brent Snook for acting as the external examiner at my thesis defence. The careful attention that you devoted in the reading of my thesis was immediately apparent and much appreciated, and the thought-provoking questions that you asked will no doubt inform my future work.
I gratefully acknowledge the support provided to me through grants from the
Social Sciences and Humanities Research Council and the Nova Scotia Health Research Foundation that helped make this research possible. I want to thank Dr. Porter for making available the data that were explored in the first study that comprises the present research, and I want to acknowledge the work of him and his colleagues in collecting that data. Thank you to my research assistants, Jamie Fulmore and Samantha DiFrancescantonio, for their conscientious effort in helping me carry out crucial aspects of the second study. Also in order are thanks to the participants who partook in both studies, as this dissertation research would not have been possible without them.
Thank you to the professors who committed their much sought after time to my
education through teaching of courses, overseeing of comprehensive projects, and supervision of practica, especially Drs. Sherry Stewart and Shannon Johnson who offered additional support when times got tough. I also want to say thank you to the many talented mentors that I had from the clinical community in Halifax who played a pivotal and supportive role in my professional development through their supervision of my

xiv
practicum placements, particularly Drs. Michael Ross, Tina Oates-Johnson, Kiran Pure, Steven Jefferson, Andrew Starzomski, Brad Kelln, and Debbie Sutherland and Mary McGrath. The same much-deserved thanks also are extended to the faculty of the River Valley Health Pre-Doctoral Psychology Internship Program in Fredericton, especially to Drs. Rebecca Mills, Cindy Letts, Gael Wealleans, and David Colquhoun. To both groups: Thank you very much for not only selflessly dedicating your time and energy to my training and to the clinical supervision of my work with clients, but also for kindly lending your ears and providing me with guidance on dealing with the challenges that accompany life as a grad student. And to Bea, Mary, Suzanne, Dana, and Patti: Thank you for helping me with the many administrative responsibilities that were involved in completing this degree.
I need to thank the people who believed in me many years ago when I decided
that I’d try to pursue a career in psychology. They went above and beyond in providing me with relevant and important work experience in both research and clinical settings. They also wrote countless reference letters for me when I was applying to graduate programs and for scholarships. I would especially like to thank Drs. Claire Crooks, Peter Jaffe, Joyce Radford, and Bruce Connell, as well as Lisa Heslop, Alf Mamo, Maureen Reid, and the staff at Changing Ways. And to Dr. John Mitchell: Thanks for such a terrific introductory psychology course when I was a first-year undergrad. That was where it all started for me.
To my fellow grad students, lab mates, and others outside of the PhD program
who I met while living in Halifax and Fredericton, especially Brigitte and Mike F., Kristin and Mike T., Nicolle and Ryan, Jenny and Grant, Chris M. and Aislin, Leanne, Sabrina, Rod, Janine, and Julie and Jason – Thank you for your friendship. I was blessed to have you there throughout both the high and low points. I also wish to thank my fellow lab mates and students on the West Coast (Pamela, Alysha, Tara, and others) for not only helping me handle the tiresome paperwork that comes with a long-distance supervisory relationship, but also for being behind me on the day of the defence. And to my hometown friends: Mike S., Mark, Fergal, Geoff, Jeremy, Chris Z., April, and Liam (and their partners) – Thank you for keeping me grounded throughout my many years as a student and for reminding me of the things that are truly important. And thanks for not making fun of me (too much) for being in school for as long as I have been.
To my family, including my sister, grandparents, and many aunts, uncles, and
cousins: Thank you for the support that you provided not only during this experience, but throughout my formative years. To my partner, Heather: You were the best part of grad school for me. I am immensely grateful for all of your love, support, and patience, and for carrying us during this final stretch. I am so happy that I was able to share this experience with you, and look forward to many new adventures. To Jeff McKillop: What can I say? I am very lucky to have met you and am thankful for all that you have done for me. I will do my very best to pay it forward to those who have not been as lucky as me. Finally, to my mother, for whom I have the greatest difficulty putting my thanks into words: I can only say that I would not have made it as far as I have without you. Thank you for everything.

1
CHAPTER 1. INTRODUCTION
Defining Deception and the Scope of the Dissertation
In psychological science, deception has been defined as a deliberate attempt to
mislead others without giving any forewarning of the intention to do so (DePaulo et al.,
2003; Ekman, 1985/1992; Vrij, 2008, 2011). Deception can occur in many forms. It may
involve the presentation of false information as if it were true, which is sometimes
described as falsification; it also may involve leaving out information that is known to be
true, which is often referred to as concealment (Ekman, 1985/1992). Falsehoods
communicated by individuals who are truly mistaken are not considered to be lies
(DePaulo et al., 2003; Vrij, 2011). Of note, like most researchers (e.g., DePaulo et al.,
2003), this author uses the terms lying and deceiving interchangeably. Further, according
to the definition above, deception is an act that involves at least two subjects and
excludes self-deception (Vrij, 2008), which is not the focus of this dissertation.
The objective of this dissertation research was to determine whether people could
be grouped in meaningful ways with regard to similar verbal and nonverbal behaviour
changes when comparing lying to a truth-telling baseline. As will be discussed later,
identifying subtypes concerning the behavioural effects of deceit could enhance
theoretical understanding on the topic. It also may inform future research on the
phenomenon. Moreover, the identification of subtypes may have practical implications,
and could lead to improvements in the practice of detecting deception.
Two experimental studies were conducted to meet this objective. The first study
involved an extended exploratory analysis of behavioural cues to deceit measured in a
sample of undergraduate students and incarcerated male criminal offenders who provided

2
both truthful and fabricated accounts of negative life events. The second study sought to
address the methodological limitations of the first. It involved an analysis of the same
behavioural cues measured in a sample of undergraduate students who provided truthful
and deceptive accounts of exposure to the same moderately distressing visual images in
order to better control the events that formed the basis of the accounts. Such efforts in
deception research are sometimes referred to as establishing the “ground truth” (Hartwig,
2011, p. 138).
Before describing the methodology and results of these studies in more detail,
however, the first chapter of this dissertation aims to place the aforementioned research
into context by providing relevant background information on the phenomenon of
deception. More specifically, an overview of the functions of deception and its
prevalence is provided. The importance of detecting deceit in particular situations, such
as in criminal justice, healthcare, and social service settings, is highlighted. Findings on
the accuracy of judgments of veracity are summarized, and problems associated with
inaccurate deception detection are covered. Some of the more popular methods for
detecting deceit also are presented in this chapter, and a rationale for examining the
verbal and nonverbal behaviour of suspected deceivers is offered to further place the
current dissertation research into context.
The second chapter of this dissertation provides a detailed description of the
methodology and results concerning the first study, after the major conceptual
formulations on behavioural cues to deceit are summarized. The second chapter also
includes a discussion that is specific to the findings of the first study. Similarly, the third
chapter describes the methods and results of the second study, and includes a discussion

3
that is specific to the findings of this study. The fourth chapter addresses the general
implications of the dissertation findings for theory and research on deception. This final
chapter includes a discussion of the implications of the findings for the practice of
deception detection.
The Functions of Deception
Why does deception exist? Deception is believed to be an evolutionary adaptation
(Bond & Robinson, 1988). Adaptations reliably solved problems concerning survival and
reproduction during the time period in which they evolved (Confer et al., 2010). More
specifically, adaptations involved attributes that aided in survival and reproduction being
passed on to future generations, from parents to offspring, at greater frequencies than
other attributes because they conferred advantages to the organisms that possessed them
(Darwin, 1859). These principles apply to adaptations for exploiting others, including
deception, in order to expropriate scarce but reproductively relevant resources (Buss &
Duntley, 2008).
On the points above, deception appears to serve two main functions and can be
considered both a “selfish act” and a “social lubricant” (Vrij, 2008, p. 11). That is, lying
may assist with the obtainment of desirable rewards, and with the avoidance of unwanted
losses or punishments. Lying also may assist with protecting the feelings of the self, and
with protecting the feelings of others. With regard to this latter function, Vrij (2008)
asserted that people often lie to avoid embarrassment and having to disclose all of their
faults, mistakes, and immoral or indecent thoughts to the rest of the world. Along these

4
lines, it also was pointed out that social interactions and conversations would likely
become awkward and rude if people always told the truth to each other.1
The Prevalence of Deception
Given the tenets above, it is not surprising that deceit appears to be rather
common in social interactions. The available evidence suggests that children begin to
develop the capacity for intentional deception between six and seven years of age
(Salekin, Kubak, & Lee, 2008). In adults, a widely cited diary study involving
community participants and college students indicated that these two groups told an
average of one to two lies per day, respectively (DePaulo et al., 1996). Other research has
indicated that people admit to using deception in 27% of face-to-face interactions, 37% of
telephone conversations, and 14% of email communications (Hancock, 2007; but also see
Serota, Levine, & Boster, 2010). Much of this deception may involve relatively harmless
lying that often goes undetected. Indeed, DePaulo and colleagues (1996) qualified that
most of the lies that participants reported in their study were not of major gravity. Even
though most deception may not be serious, its identification is crucial in certain venues,
such as in criminal justice, healthcare, social service, and airport security settings,
because it could be used to carry out criminal or terrorist activity (Loftus, 2011; Porter &
ten Brinke, 2010; Vrij, 2014; Vrij, Granhag, Mann, & Leal, 2011; Vrij, Granhag, &
Porter, 2010; Vrij, Mann, & Leal, 2013). It also could be used to avoid the consequences
for engaging in such activity, legal or otherwise (e.g., feigning mental disorder in an
effort to obtain an insanity acquittal and avoid conviction) (Vitacco & Rogers, 2010).
1 Lying to protect the feelings of the self or others could be argued to be related to the first function (i.e., to obtain rewards or avoid punishments/losses) because it may serve the deceiver in a similar manner by increasing one’s likeability among others or by reducing unpleasant interpersonal conflict (Rogers, 2008a).

5
It is difficult to determine the exact prevalence or base rate of deception in the
above-mentioned contexts through empirical investigations. This is partly due to the
inherent difficulty in identifying deceit. First, it may be illogical in many instances to ask
individuals to be honest about their dishonest behaviour (Hartwig, 2011; Rogers, 2008b).
Second, the accuracy of many prevalence estimates is questionable because, generally,
only unsuccessful deceivers (i.e., those who are detected) are included in the statistics
(Resnick & Knoll, 2008). Third, estimates may vary as a function of other variables. For
example, estimates may vary as a function of the setting in which the research took place,
or as a function of the assessment/detection methods used to identify the deception
(Rogers & Bender, 2012; Rogers & Gillard, 2013; Rogers, Salekin, Sewell, Goldstein, &
Leonard, 1998). Even within the same setting, estimates may vary as a function of
situational circumstances. As an example, some inmates in correctional facilities may
exaggerate symptoms of mental disorders in order to obtain preferred living arrangements
(e.g., single cells, placements on mental health units), but later may minimize any such
difficulties in their efforts to appear well-adjusted when parole decisions are at hand
(Rogers & Bender, 2012; Vitacco, 2008; Vitacco & Rogers, 2010; Walters, 1988).
Despite the difficulty, research suggests that deceit is not an uncommon problem
in the aforementioned contexts. Deception within healthcare settings, such as feigning
illness or malingering, is of considerable concern. The American Psychiatric
Association’s (APA) Diagnostic and Statistical Manual of Mental Disorders (5th edition;
DSM-5) defines malingering as “the intentional production of false or grossly
exaggerated physical or psychological symptoms, motivated by external incentives”
(APA, 2013, p. 726). External incentives could include, for example, avoidance of work

6
or military duty, evasion of criminal prosecution, or the obtainment of financial
compensation or drugs. The definition of feigning, by contrast, makes no assumptions
about the goals of such symptom fabrication or exaggeration because standardized
measures of deceptive response styles have not been validated to determine the specific
motivations of individuals (Rogers, 2008a; Rogers & Bender, 2003, 2012; Rogers &
Gillard, 2013). Definitions aside, based on 33,531 American neuropsychological
referrals, it was estimated that suspected malingering and symptom exaggeration
occurred in 29% of personal injury cases, 30% of disability cases, 19% of criminal cases,
and 8% of medical cases (Mittenberg, Patton, Canyock, & Condit, 2002).2 With respect
to general forensic practice, large-scale surveys of over 500 forensic experts have
obtained malingering estimates of approximately 15% and 17%, respectively (see Rogers,
Salekin et al., 1998; Rogers, Sewell, & Goldstein, 1994). Regarding general clinical
practice, this survey data yielded malingering estimates between 5% and 7%; however,
these could be overestimates given forensic experts often consult on high-stakes non-
forensic issues that may still be consequential to clients (e.g., independent evaluations of
insurance claims) (Rogers, 2008a, 2008c). In an archival study of 100 consecutive cases
of United States (US) veterans seeking treatment for Vietnam combat-related
posttraumatic stress disorder (PTSD), Frueh and colleagues (2005) found that 5% of
treatment-seekers had either never served in Vietnam or had never served in the military.
Even though research on the prevalence of deception in non-forensic contexts
may be lacking, those working in emergency rooms can often attest to not only
malingering by voluntary patients seeking admission, but also to defensive response
2 Rogers (2008c; Rogers & Bender, 2012) has pointed out that percentages are higher when a broadened category (i.e., the spectrum from symptom exaggeration to suspected malingering) is used. In other words, the prevalence of malingering is relatively lower when focused on definite cases.
7
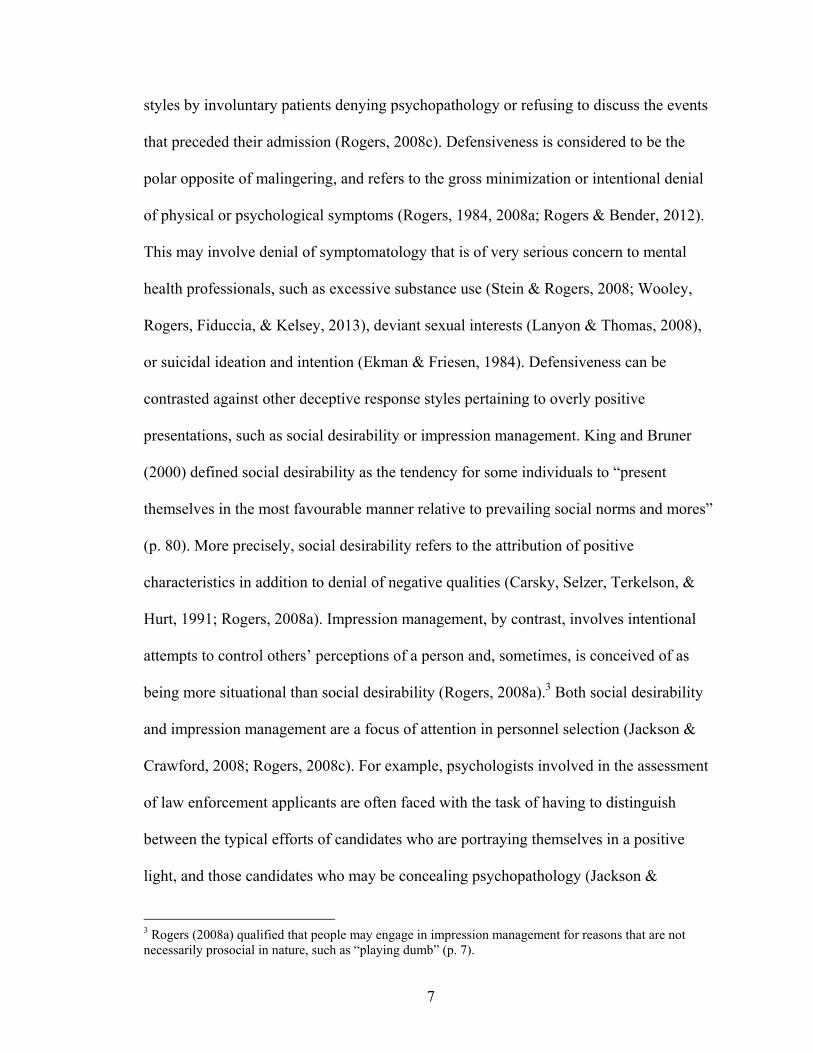
styles by involuntary patients denying psychopathology or refusing to discuss the events
that preceded their admission (Rogers, 2008c). Defensiveness is considered to be the
polar opposite of malingering, and refers to the gross minimization or intentional denial
of physical or psychological symptoms (Rogers, 1984, 2008a; Rogers & Bender, 2012).
This may involve denial of symptomatology that is of very serious concern to mental
health professionals, such as excessive substance use (Stein & Rogers, 2008; Wooley,
Rogers, Fiduccia, & Kelsey, 2013), deviant sexual interests (Lanyon & Thomas, 2008),
or suicidal ideation and intention (Ekman & Friesen, 1984). Defensiveness can be
contrasted against other deceptive response styles pertaining to overly positive
presentations, such as social desirability or impression management. King and Bruner
(2000) defined social desirability as the tendency for some individuals to “present
themselves in the most favourable manner relative to prevailing social norms and mores”
(p. 80). More precisely, social desirability refers to the attribution of positive
characteristics in addition to denial of negative qualities (Carsky, Selzer, Terkelson, &
Hurt, 1991; Rogers, 2008a). Impression management, by contrast, involves intentional
attempts to control others’ perceptions of a person and, sometimes, is conceived of as
being more situational than social desirability (Rogers, 2008a).3 Both social desirability
and impression management are a focus of attention in personnel selection (Jackson &
Crawford, 2008; Rogers, 2008c). For example, psychologists involved in the assessment
of law enforcement applicants are often faced with the task of having to distinguish
between the typical efforts of candidates who are portraying themselves in a positive
light, and those candidates who may be concealing psychopathology (Jackson &
3 Rogers (2008a) qualified that people may engage in impression management for reasons that are not necessarily prosocial in nature, such as “playing dumb” (p. 7).

8
Crawford, 2008). In other words, defensiveness differs from social desirability and
impression management as it involves hiding of symptoms and simulation of adjustment
(Rogers & Bender, 2012). Although base rates of defensiveness among mentally
disordered individuals are unclear, Rogers (2008d) estimated that they could range from
between 16% to 33% of clinical referrals. Similarly, in a meta-analytic review of child
custody and job applicant referrals, Baer and Miller (2002) estimated the base rate of
defensiveness to be approximately 30%.
Complicating matters further for both researchers and practitioners are individuals
who engage in a combination of deceptive response styles within a given situation. In the
context of clinical assessments, this type of response style is sometimes referred to as
hybrid responding (Otto, 2008; Rogers, 2008a; Rogers & Bender, 2012). For example,
under certain circumstances, some individuals might engage in both defensiveness and
malingering. More specifically, Rogers (2008c) provided the example of some plaintiffs
in personal-injury evaluations who may become defensive with regard to questions of
their functioning prior to the injuries, but who also may malinger when queried about
their functioning since the injuries. Collectively, these observations suggest that the
beliefs that deception is both very rare, and that it has stable base rates, are
misconceptions (Rogers, 2008a; Rogers & Bender, 2012; Rogers & Gillard, 2013).
The Importance of Detecting Deceit in Specific Contexts
Practitioners and policymakers employed by criminal justice, healthcare, social
service, and airport security agencies are interested in identifying deception for additional
reasons beyond preventing criminal, terrorist, or other forms of harmful behaviour. Craig
and Badali (2004) summarized several of these additional reasons for those working
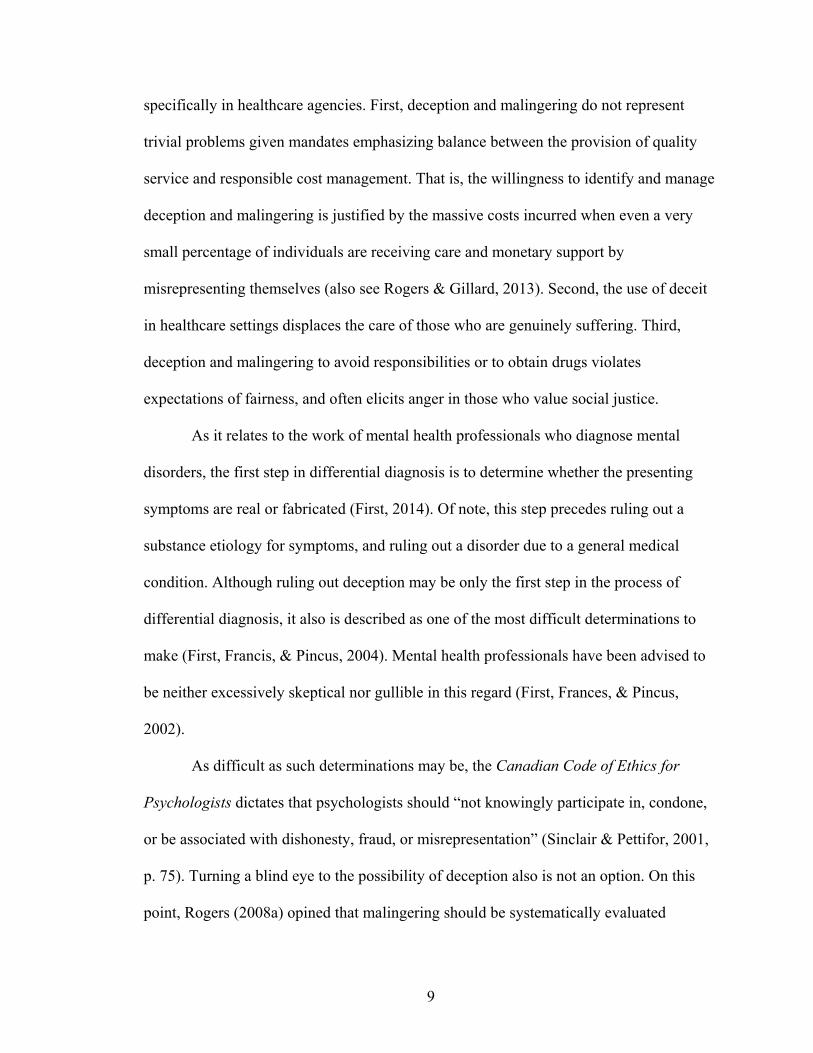
9
specifically in healthcare agencies. First, deception and malingering do not represent
trivial problems given mandates emphasizing balance between the provision of quality
service and responsible cost management. That is, the willingness to identify and manage
deception and malingering is justified by the massive costs incurred when even a very
small percentage of individuals are receiving care and monetary support by
misrepresenting themselves (also see Rogers & Gillard, 2013). Second, the use of deceit
in healthcare settings displaces the care of those who are genuinely suffering. Third,
deception and malingering to avoid responsibilities or to obtain drugs violates
expectations of fairness, and often elicits anger in those who value social justice.
As it relates to the work of mental health professionals who diagnose mental
disorders, the first step in differential diagnosis is to determine whether the presenting
symptoms are real or fabricated (First, 2014). Of note, this step precedes ruling out a
substance etiology for symptoms, and ruling out a disorder due to a general medical
condition. Although ruling out deception may be only the first step in the process of
differential diagnosis, it also is described as one of the most difficult determinations to
make (First, Francis, & Pincus, 2004). Mental health professionals have been advised to
be neither excessively skeptical nor gullible in this regard (First, Frances, & Pincus,
2002).
As difficult as such determinations may be, the Canadian Code of Ethics for
Psychologists dictates that psychologists should “not knowingly participate in, condone,
or be associated with dishonesty, fraud, or misrepresentation” (Sinclair & Pettifor, 2001,
p. 75). Turning a blind eye to the possibility of deception also is not an option. On this
point, Rogers (2008a) opined that malingering should be systematically evaluated

10
whenever the outcome of an evaluation has significant consequences, and the code of
ethics cited above also states that psychologists should “not suppress disconfirming
evidence of their own and their colleagues’ findings and views, acknowledging
alternative hypotheses and explanations” (Sinclair & Pettifor, 2001, p. 77). Rogers
(2008a, 2008c) further stated bluntly that practitioners’ decisions to neglect such
deception represent serious omissions and a likely reflection of professional naïveté.
More to these points, Taylor, Frueh, and Asmundson (2007) have detailed how
provision of treatment for mental disorders to those who are likely to be malingering may
not only be wasteful of clinicians’ time and resources, but also could be harmful. For
example, they argued that treating fabricated PTSD symptoms for a fictitious event with
repeated imaginal exposure could make things worse by increasing the risk of implanting
false memories. It was stressed that some of the individuals under question could even
develop genuine PTSD symptoms if they came to truly believe that they had been
traumatized (also see Loftus, 2011). Taylor et al. (2007) described several reasons for
why malingerers may present for such treatment. These included cases that they have
encountered in which lawyers recommended to clients that they seek treatment in order to
obtain an inexpensive or free diagnostic report from the treating clinician, rather than
having to hire a psychiatrist or psychologist to conduct a more expensive medico-legal
examination.
Whether generalists or forensic specialists, practitioners also must be mindful of
the deception that is often associated with specific mental disorders and other clinically-
relevant phenomena. Vitacco (2008) provided a useful overview of clinical disorders and
syndromes in which deception may be either a peripheral or a central aspect. With regard

11
to the latter, it was noted that deceitfulness is a core symptom of conduct disorder, and
that clinicians must assess the magnitude and type of deception when evaluating youth
with this potential diagnosis. It also was highlighted that deceit is a central feature of both
antisocial personality disorder (APD) and psychopathy. According to the DSM-5,
deceitfulness in APD is indicated by repeated lying, use of aliases, or conning of others
for pleasure or profit (APA, 2013). For psychopaths, deception may be observed in the
form of superficial charm, pathological lying, and conning or manipulation of others
(Babiak et al., 2012; Hare, 1991, 2003, 2006; Hare & Neumann, 2008, 2009). Vitacco
(2008) further advised clinicians to be on the lookout for patients who present with
atypical, varied, and dramatic symptom patterns, and alert to the possibility that some of
these individuals might not be malingering but instead trying to meet deep-rooted
psychological needs in the case of factitious disorders. On this point, he also addressed
clinicians involved in the assessment of maladaptive parenting practices who often
encounter evidence indicating that caretakers are responsible for the ailments of their
children. In these scenarios, it was emphasized that a key distinction to be made is
whether the actions of these parents represent neglect or intentional efforts to fabricate or
induce disorders, as in the case of factitious disorder by proxy. In addition to the
defensiveness often associated with substance misuse or paraphilias as they relate to
sexual abuse, Vitacco (2008) drew attention to the role of defensiveness and deception in
eating disorders. It was noted that deceit may occur in a variety of ways among
individuals diagnosed with anorexia nervosa and bulimia nervosa. For example, some
individuals may hide food to facilitate binge eating, and others may lie about weight gain
or minimize any weight loss.

12
The above is not to state that mental health professionals should aim to identify
every concealment or distortion made by their clients. Of note, the fabrication of an
isolated symptom, or minor embellishments concerning the frequency or intensity of
symptoms, does not qualify as malingering (Gillard & Rogers, 2010; Rogers &
Granacher, 2011). Moreover, consistent with the research cited earlier, Rogers (2008a)
also has pointed to persuasive evidence suggesting that some degree of deception is
involved in most communications. For example, drawing on the research of Laurenceau,
Barrett, and Rovine (2005) that involved an examination of the daily diary reports of
married couples, Rogers (2008a) highlighted that the willingness for self-disclosure was
multi-determined and variable within intimate relationships. Rogers (2008a) also
highlighted that complete and accurate self-disclosure is rare even within the
exceptionally supportive context of psychotherapy. Citing the work of Farber (2003), and
Farber and Hall (2002), Rogers (2008a) pointed out that issues concerning sexuality,
body image, and reproduction are seldom discussed fully in therapy. Thus, it has been
argued that only “consequential” distortions and deceptions be considered, and that
practitioners go about this work in a professional and ethical manner (Rogers, 2008a, p.
4).
A review conducted by Hill and Knox (2001) of the empirical literature on
therapist self-disclosure indicated that it too occurs infrequently, and that therapists
typically avoid disclosing personal and intimate details about themselves beyond their
professional backgrounds. On this point, Rogers (2008a) has stated that a lack of self-
disclosure does not imply dishonesty, but rather an unwillingness to share personal
information. For therapists, this appears to be the case for a variety of reasons. For

13
example, some therapists may avoid self-disclosure to prevent shifting the focus of
therapy from their clients to themselves, and others may avoid self-disclosure to maintain
appropriate boundaries with clients (Hill & Knox, 2001). Psychologists, also, may not
always be completely transparent in their assessment methods. For example, Rogers
(2008a; Rogers & Bender, 2012) raised the issue of how providing clients with full
descriptions of validity scales on psychological instruments may decrease their
effectiveness at detecting malingering (e.g., Rogers, Bagby, & Chakraborty, 1993). It was
further stated that such disclosures could be considered equivalent to coaching clients on
how to thwart these detection strategies.
Although there may be legitimate reasons for healthcare providers to avoid
disclosing specific information under certain circumstances, of particular concern are the
problems addressed by Otto (2008) regarding the collateral records of some medical and
mental health professionals. More specifically, Otto (2008) highlighted the survey results
obtained by Wynia, Cummins, VanGeest, and Wilson (2000) involving 720 American
physicians who were asked to anonymously report on their actions when seeking
insurance coverage for patients. It was indicated that 28% of these physicians
acknowledged exaggerating the severity of some patients’ conditions, 23% admitted to
changing billing diagnoses, and 10% had reported signs or symptoms in medical charts
that their patients did not evidence. Otto (2008) further noted that these patterns of
deceptive behaviour do not appear to be limited to physicians, despite the professional
obligations of treatment providers. For example, citing another survey conducted by
Tubbs and Pomerantz (2001) involving 92 psychologists in Illinois, Otto (2008) pointed
to the finding that 18% of these psychologists reported “sometimes” altering a diagnosis

14
in order to meet insurance criteria. Practitioners, therefore, were cautioned about making
erroneous assumptions regarding the validity of information obtained from collateral
sources, especially when drawing on this information in other client matters (e.g.,
forensic examinations) (Otto, 2008).
Deception Detection Accuracy and Associated Problems
Despite the strong interest among practitioners and stakeholders in identifying
deception, the majority of people appear to be poor lie detectors (Bond & DePaulo, 2006,
2008; Hartwig & Bond, 2011; Vrij, 2008). Of note, two of the most frequently cited
meta-analyses on this topic found that people generally perform around chance levels on
deception detection tasks (Bond & DePaulo, 2006, 2008). This finding appears to apply
to many professionals who work in the aforementioned settings (see, e.g., Porter,
Woodworth, & Birt, 2000; Porter, Juodis, ten Brinke, Klein, & Wilson, 2010; Shaw,
Porter, & ten Brinke, 2013). Moreover, the finding does not seem to preclude those
employed in law enforcement (see, e.g., Ekman & O’Sullivan, 1991; Hartwig, Granhag,
Strömwall & Vrij, 2004; Mann, Vrij, & Bull, 2004; Vrij & Mann, 2001; Vrij et al., 2008).
Inaccurate lie detection poses two major problems. The first problem is obvious
and involves failure to identify the potentially harmful acts that have been summarized in
this chapter. With specific reference to clinical assessments, misclassifying a malingerer
as a genuine patient may result in severe consequences for the criminal justice system,
employers, or insurance companies (Rogers & Gillard, 2013). The second problem with
flawed lie detection involves false accusations and wrongful convictions (Hartwig, 2011;
Kassin, 2012; Kassin & Fong, 1999; Loftus, 2011; Mann et al., 2004; Meissner & Kassin,
2002; Vrij, Mann, & Fisher, 2006). In other words, some individuals may be mistakenly

15
labelled as behaving deceptively (i.e., false positives). These individuals, in turn, may be
denied necessary services, financial well-being, their freedom, or perhaps even their lives
in cases where capital punishment is at issue (Kassin et al., 2010; Rogers & Gillard,
2013). On these points, at the time of this writing, there have been 317 documented post-
conviction DNA exonerations in the US alone (Innocence Project, 2014). The average
length of time served by these exonerees was reported to be 13.5 years, and it was further
indicated that 18 of these individuals had served time on death row for crimes that they
did not commit. Thus, practitioners, including psychologists, bear a great deal of
professional responsibility in their efforts to identify deception accurately and minimize
these kinds of errors (Rogers & Gillard, 2013).
Rationale for Examining Verbal and Nonverbal Behaviour of Suspected Deceivers
Many specialized tools and procedures have been developed to assist various
professional groups with detecting deceit. Vrij (2008, 2014; Vrij et al., 2010a, 2011,
2013) and his colleagues have already comprehensively reviewed the major strengths,
weaknesses, and empirical support (or lack thereof) surrounding use of some of the more
popular instruments and methods. These included polygraph techniques based on both the
concern approach and the orienting reflex approach (also see Iacono & Patrick, 2008;
National Research Council, 2003), the Behaviour Analysis Interview (BAI; Inbau, Reid,
Buckley, & Jayne, 2001), Statement Validity Assessment (SVA; e.g., Köhnken & Steller,
1988; Raskin & Steller, 1989; Steller, 1989; Steller & Boychuk, 1992; Steller &
Köhnken, 1989), Reality Monitoring (RM; e.g., Sporer, 1997), Scientific Content
Analysis (SCAN; Sapir, 1987/2000), and Voice Stress Analysis (VSA; see
www.polygraph.org/section/press-room/position-voice-stress). The use of thermal

16
imaging (e.g., Pavlidis, Eberhardt, & Levine, 2002), functional Magnetic Resonance
Imaging (fMRI; e.g., Langleben et al., 2002, 2005), and electroencephalograms (EEG;
see, e.g., Farwell & Smith, 2001) to detect deception also were reviewed. Despite the
extensive promotion and commercial availability of many of these tools, it was concluded
that no tool is infallible and that each suffers from considerable problems and limitations.
More optimistic conclusions have been drawn, however, with regard to the
detection of dissimulation as it pertains to mental disorders, cognitive impairment, and
medical complaints. A variety of assessment methods for evaluating deceptive response
styles were critically examined in the highly respected text Clinical Assessment of
Malingering and Deception edited by Rogers (2008e). In both his earlier and subsequent
reviews of current clinical methods, Rogers (2008c; Rogers & Bender, 2012; Rogers &
Gillard, 2013; Rogers & Granacher, 2011; Vitacco & Rogers, 2010) and his colleagues
concluded that the selective use of multiple detection strategies lends strength to the
identification of specific response styles. In these reviews, the rare-symptoms strategy
was characterized as the “workhorse” for the detection of feigned mental disorders
(Rogers, 2008c, p. 392). This particular detection strategy takes advantage of symptoms
that are infrequently endorsed by genuine patients, and feigners are often detected
because they tend to report many of these rare difficulties (Rogers, 2008d; Rogers &
Bender, 2012; Rogers & Granacher, 2011; Vitacco & Rogers, 2010). On this point, the
rare-symptoms strategy has yielded very large effect sizes (i.e., Cohen’s d ≥ 1.50) in both
experimental research employing simulation designs, and in studies involving real-world
known-groups comparisons (Rogers, 2008c, 2008d). It was suggested that practitioners
use a multi-method approach incorporating both test- and interview-based measures when
17
conducting their assessments (Rogers, 2008c; Rogers & Bender, 2012; Rogers &
Granacher, 2011; Vitacco & Rogers, 2010). Recommended scales on psychological tests
and interviews that capitalize on the rare-symptoms strategy included: the infrequency-
psychopathology scale (Fp; Arbisi & Ben-Porath, 1995) of the Minnesota Multiphasic
Personality Inventory-2 (MMPI-2; Butcher, Dahlstrom, Graham, Tellegen, & Kraemmer,
1989; Butcher et al., 2001); the Negative Impression Management (NIM) scale of the
Personality Assessment Inventory (PAI; Morey, 1991); and the Rare Symptoms (RS)
scale of the Structured Interview of Reported Symptoms (SIRS; Rogers, Bagby, &
Dickens, 1992).
For clinical practice, Rogers (2008c; Rogers & Bender, 2012; Rogers & Gillard,
2013; Rogers & Granacher, 2011) and others also recommended employing the
“erroneous stereotypes” strategy on account of its effectiveness with relatively
sophisticated feigners. This detection strategy draws on the finding that many individuals,
even mental health professionals, hold common misconceptions regarding clinical
features that are usually associated with mental disorders (Rogers, 2008d; Rogers &
Bender, 2012). As with the rare-symptoms strategy, feigners are often identified via over-
reporting of such stereotypes. Also, like the rare-symptoms strategy, very large effect
sizes have been observed in both simulation and real-world studies that have used the
erroneous stereotypes strategy to identify feigning (Rogers, 2008c, 2008d). Moreover, it
was highlighted that this particular detection strategy seems to be resistant to coaching
(Rogers, 2008d). Currently, the most favourable scale for tapping erroneous stereotypes
appears to be the MMPI-2 Dissimulation scale (Ds) (Rogers, 2008c; Rogers & Bender,

18
2012; Rogers & Gillard, 2013; Rogers & Granacher, 2011), which was originally
developed by Gough (1954).
Despite the widespread use of many of the aforementioned methods, Vrij et al.
(2010a) maintained that observation of behaviour is still the most commonly used
approach for detecting deceit. This is partly the case because certain technologies and
equipment (e.g., fMRI) may be either unavailable or impractical to implement in most
situations. On these points, many police officers the world over are trained to evaluate the
verbal and nonverbal behaviour of criminal suspects during interviews to help them
distinguish between those who are likely to be innocent, and those who are likely to be
guilty and deliberately withholding crucial information (see Horvath, Blair, & Buckley,
2008). Porter and ten Brinke (2008) highlighted that many airport security staff also are
trained to identify potential threats partly by watching for concealed emotions in the faces
of passengers.
Although it may sound simple and ideal to use physical evidence to guide
determinations on the veracity of matters, Porter and ten Brinke (2009) further
highlighted that, in many legal cases, there may be little or no evidence other than the
conflicting accounts of those involved. In countries with no statute of limitations, such as
Canada, it also was pointed out that legal decision-makers may have to make
determinations concerning allegations of events that occurred decades ago. Porter and ten
Brinke (2009) emphasized that the testimony of witnesses in many of these cases may be
the only evidence. In their review of relevant court cases, the opportunity for legal
decision-makers to scrutinize the demeanour of witnesses was stressed. Citing a
conclusion by the Supreme Court of Canada in R. v. B. (K. G.) (1993), Porter and ten
19
Brinke (2009) underscored that judges and juries need to be able to view witnesses
clearly in order to sufficiently evaluate body language, facial expressions, or other
indicators of credibility that are not discernible from written transcripts.
But which behaviours should be attended to when evaluating those who are
suspected of duplicity, and for what reasons? Are there any that are uniquely associated
with deception? Do discernable behavioural differences between truth-tellers and liars
even exist? If so, is there a single behavioural profile suggestive of deceit that observers
should be mindful of? Or might there be many? These questions, and others, are
addressed in the following chapters of this dissertation.

20
CHAPTER 2. STUDY 1:
SUBTYPING THE BEHAVIOURAL EFFECTS OF DECEIT
The first study in this dissertation involved an extended exploratory analysis of
verbal and nonverbal behavioural cues to deception displayed by criminal offenders and
non-offenders while they described both planned truthful and deceptive accounts of
negative life events (Porter, Doucette, et al., 2008). The objective of the current study
was to determine whether these individuals could be grouped in terms of similar
behaviour changes when comparing lying to a truth-telling baseline. As detailed in the
previous chapter, when forming judgments of the truthfulness of communications, in
many instances observers may be limited to considering little more than the demeanour
of the individuals under question. Behavioural cues to deceit, however, are not
understandable without first having some conceptual understanding of why and when
these behaviours may appear (Ekman, 1988). Therefore, the dominant conceptual
formulations regarding behavioural cues to deception are summarized before a rationale
for subtyping individuals with respect to cues is presented. The following formulations
are those that have been featured most prominently in key reviews of the empirical
literature (see, e.g., DePaulo et al., 2003; Vrij, 2008; Vrij et al., 2010a, 2013).
Verbal and Nonverbal Cues to Deception: Conceptual Background
Ekman and Friesen (1969). Some researchers have credited Ekman and Friesen
(1969) with publishing “the first influential theoretical statement” on behavioural cues to
deceit (DePaulo et al., 2003, p. 74). In their seminal article, a distinction was made
between leakage cues and deception cues. Leakage cues were described as those cues that
reveal what liars are attempting to hide, such as how they truly feel. Deception cues, by

21
contrast, suggest that deceit may be occurring, but do not reveal the nature of the
concealed information.
Ekman and Friesen (1969) provided “micro expressions” as an example of
possible leakage cues (p. 98). In contrast to macro facial expressions, which were
characterized as often lasting for about half a second, micro facial expressions were
described as being so short in duration that they are at the threshold of recognition and
almost imperceptible to untrained observers. More specifically, Ekman and Friesen
(1969) considered the face to be the primary site for displays of affect (e.g., happiness,
anger, fear, sadness, surprise, disgust), and underscored that these displays can be
intensified, weakened, neutralized, or masked by another emotion. Micro affect displays
were thought to represent the fragments of squelched, neutralized, or masked displays.
That is, some affect displays may begin to emerge before senders are completely
conscious of them or able to suppress them, given the speed of the face as a sending
system. Ekman and Friesen (1969) postulated that, if there is a brief but relatively
complete display of affect, then such micro displays may represent leakage. It was further
stated that such micro displays are often followed by, or are covered by, simulated and
opposing macro displays of affect; however, untrained observers often miss these micro
displays.
In contrast to leakage cues, Ekman and Friesen (1969) provided poorly performed
simulations of affect as an example of deception cues. Excessively long and overly
expressive performances were highlighted in this regard. Specific examples included
smiles that are too long in duration, or frowns that are too severe. In their comprehensive
meta-analytic review of 158 cues to deceit, DePaulo and colleagues (2003) highlighted

22
that nearly all of the cues reported in the literature are deception cues as opposed to
leakage cues.
According to Ekman and Friesen (1969), the face is not the only source of
potential leakage or deception cues. The hands also were said to be a source of these
cues. On this note, the importance of adaptors was addressed. Ekman and Friesen (1969)
described adaptors as having developed from movements that were first learned by
individuals early in life as part of their efforts to meet bodily needs, perform actions,
manage emotions, and learn instrumental tasks. It was dictated that, in adulthood,
adaptors are emitted during social interactions in a fragmented form of the original
behaviour. These fragments of previously learned adaptive acts are said to be maintained
by habit. Ekman and Friesen (1969) conceived that, when first learned, these adaptive
behaviours were associated with specific drives, felt emotions, expectancies,
interpersonal interactions, or certain settings. In adulthood, these old habits are believed
to be triggered by something in the current environment; however, the total activity is
rarely carried out completely. It was further indicated that these behaviours may appear to
be random to observers without knowledge of the origin of the activities. Given their
habitual nature, adaptors also were characterized as occurring without awareness.
Self-adaptors, also referred to as self-manipulations (see, e.g., Granhag &
Strömwall, 2002), are believed to be based on behaviours learned to manage various
problems and needs (e.g., to groom or modify the attractiveness of the face or body).
Other types of adaptors are thought to originate in early interpersonal contacts (e.g.,
movements necessary for defending or attacking). Ekman and Friesen (1969) suggested
that individuals often will be uncomfortable when engaging in deception, and that these

23
adaptors may emerge as deception clues that betray the discomfort. For example, these
individuals may scratch or pick at themselves. As an example of an adaptor as a leakage
cue, Ekman and Friesen (1969) described individuals who, while smiling, may also be
tearing at a fingernail. As another example, these researchers indicated that the formation
of a fist may leak interest in an attack.
In contrast to adaptors, Ekman and Friesen (1969) defined illustrators as actions
that are tied to verbal speech. More precisely, illustrators demonstrate what is being said
through pointing, pictorial enactment, rhythmic movements, and kinetic actions. It was
suggested that a lack of usual illustrative hand movements may indicate individuals who
do not believe what they are saying. Ekman and Friesen (1969) characterized such
presentations as unnatural.
Zuckerman, DePaulo, and Rosenthal (1981). Although it was premised that the
communication of deception was unlikely to be associated with any single verbal or
nonverbal behaviour, Zuckerman and colleagues (1981) asserted that deception involves
various psychological states and processes that influence behaviour. It was argued, then,
that the search should be for those states and processes that are either more or less likely
to occur when individuals are lying compared to when they are telling the truth. It was
further argued that this search also should focus on behavioural cues that may be
suggestive of such states or processes. Zuckerman et al. (1981) described four constructs
that could be used in such a manner. In the current deception literature, these constructs
are generally referred to as: arousal, emotional reactions, cognitive effort, and attempted
behavioural control (Vrij, 2008). Each construct will be discussed in further detail as it
relates to the phenomenon of deception.

24
The Role of Arousal.
Based on the research available at the time on psychophysiological approaches to
deception detection, Zuckerman and colleagues (1981) reasoned that liars might
experience a greater degree of undifferentiated arousal compared to truth tellers, and that
this arousal may be manifested in the form of greater pupil dilation, increased eye blinks,
a greater frequency of speech disturbances (i.e., errors and hesitations), and a higher
voice pitch (DePaulo et al., 2003). It was acknowledged, however, that this general
autonomic responsivity to deception may be explained by the experience of particular
emotions while lying (Zuckerman et al., 1981). In other words, the possibility was raised
that cues to deception may be better accounted for by the specific affects that are
involved, and that the concept of diffuse or general arousal may be unnecessary.
The Role of Emotional Reactions.
It was further proposed that, to the extent that deceivers experience guilt over
lying or fear of getting caught, behaviours indicative of guilt and fear may be displayed
more often by liars than by those telling the truth (DePaulo et al., 2003; Zuckerman et al.,
1981). As it relates to the current dissertation research, Zuckerman et al. (1981) suggested
that liars might fidget more than truth-tellers. There also may be an increase in direct
expressions of negative affect. For example, facial expressions might become less
pleasant. It was further suggested that deceivers may attempt to disassociate themselves
from their deceptive messages in order to minimize the negative experiences. Zuckerman
and colleagues (1981) referred to this strategy as indirectness or withdrawal based on the
work of Knapp, Hart, and Dennis (1974) and others. More specifically, Zuckerman et al.
(1981) postulated that this strategy might result in evasive responses, decreased eye

25
contact, and less direct body orientation toward targets. Some of these researchers also
conceived of speaking in the third-person as a way of disassociating from one’s responses
(e.g., DePaulo, Rosenthal, Rosenkrantz, & Green, 1982).
The Role of Cognitive Effort.
Zuckerman and his colleagues (1981) claimed that lying is more difficult and
cognitively complex than telling the truth. It was said to be more difficult because liars
have to formulate communications that do not contain logical inconsistencies and do not
contradict information that others may already know. Given these challenges, it was
predicted that deception may result in increased speech pauses or hesitations, longer
response latencies, and fewer illustrators. With regard to the latter cue, Zuckerman et al.
(1982) highlighted an earlier suggestion made by Ekman and Friesen (1972) that high
levels of concentration during speeches would lead to decreases in the frequency of
illustrators.
The Role of Attempted Behavioural Control.
Some individuals may attempt to control their behaviour while lying in order to
maintain their deception, and these very attempts may, paradoxically, serve as cues to
deceit (DePaulo et al., 2003; Zuckerman et al., 1981). That is, controlled behaviours
could come across as overly planned, rehearsed, and lacking in spontaneity. Zuckerman
and colleagues (1981) also proposed that discrepancies in verbal and nonverbal
behaviours may become apparent to observers (e.g., discrepancies between the face,
body, and voice). This was deemed to be a possibility because it was conceived that some
channels of behaviour may not be completely controllable, and people may not be able to

26
simultaneously control all aspects of their behaviour with equal effectiveness (DePaulo et
al., 2003; Zuckerman et al., 1981).
Ekman (1985/1992). In his later work, Ekman (1985/1992) made a distinction
between cues that are related to thinking, and cues that are related to feeling. With regard
to the former, liars do not always have time to prepare, memorize, or rehearse their lines.
In some cases, this might result in accounts that are either internally inconsistent, or
accounts that are contrary to known facts. Ekman (1985/1992) elaborated that failure to
prepare and remember one’s lines may produce cues in how accounts are delivered, even
when there are no discrepancies in what is being said. That is, the need to think carefully
about each word before it is spoken could result in obvious speech pauses. Of note,
Ekman (1985/1992) also recognized that some liars may over-prepare their lines, and that
this could result in accounts that seem too smooth and rehearsed.
It has been suggested, however, that Ekman’s (1985/1992) “more important
contribution” on cues to deceit was his conceptualization of the role of emotions
(DePaulo et al., 2003, p. 75). More specifically, DePaulo and colleagues (2003)
highlighted Ekman’s (1985/1992) argument that it is possible to predict behaviours that
discriminate truth-tellers from liars by understanding the emotions experienced by liars.
On this point, Ekman (1985/1992) asserted that the fear of being caught, guilt about
lying, and delight in having duped someone are so often involved in deception that they
deserve specific attention. More precisely, fear cues were said to be indicative of
detection apprehension. Examples of fear cues included higher voice pitch, louder and
faster speech, pauses, speech errors, and indirect speech (DePaulo et al., 2003). In
relation to guilt, Ekman (1985/1992) postulated that cues might include those associated

27
with sadness. On this note, DePaulo et al. (2003) referenced lower voice pitch, slower
and softer speech, and gazing downward as examples. With regard to “duping delight”,
cues suggestive of excitement were addressed, which may include higher voice pitch,
louder and faster speech, and an increased use of illustrators (DePaulo et al., 2003;
Ekman, 1985/1992). Importantly, because Ekman (1985/1992) noted that emotions also
are relevant to when liars are simulating emotions that they are not experiencing, and
when they are experiencing emotions that they are trying to hide, DePaulo et al. (2003)
pointed out that cues also are dependent on the specific emotions that are being simulated
and experienced.
Buller and Burgoon (1996). Buller and Burgoon (1996) accepted many of the
concepts and propositions put forth by Ekman and Friesen (1969), and Zuckerman et al.
(1981). Buller and Burgoon’s (1996) formulation, however, is distinguished from those
of others in its emphasis on interpersonal communication processes. That is, the active
participation of both senders and receivers was said to be a hallmark of interpersonal
communication. Moreover, it was stressed that interpersonal communication is a dynamic
activity. Buller and Burgoon (1996) further highlighted that behavioural patterns
fluctuate over time as communicators adjust to each other’s feedback, adapt to the
communication context, or change topics. Given these premises, it was argued that a
uniform deceptive profile would be unlikely. It also was conceived to be unlikely because
patterns of behaviours were said to vary with the senders’ goals, expectations,
relationship with the receivers, and the receivers’ suspiciousness of the senders (Buller &
Burgoon, 1996; DePaulo et al., 2003).

28
Both DePaulo et al. (2003) and Vrij (2008) highlighted the relevance of Buller
and Burgoon’s (1996) notion that people are engaged in several important tasks when
attempting to deceive others. More specifically, while attempting to convey their
message, deceivers also have to monitor their targets for signs of suspicion and modify
their behaviour accordingly. DePaulo et al. (2003) stated that such demands may be
challenging at first; however, Buller and Burgoon (1996) postulated that these difficulties
should lessen with time as the deceivers receive more feedback, make adjustments, and
obtain more control over their performance. Buller and Burgoon (1996), therefore,
expected that liars in interactive situations should become more involved, pleasant,
composed, fluent, and smooth in turn-taking as the interactions progressed.
DePaulo et al. (2003). Before they presented the results of their comprehensive
meta-analysis on behavioural differences between truth-tellers and liars (summarized in
the next section of this chapter), DePaulo and colleagues (2003) outlined the implications
of a self-presentational perspective for predicting cues to deceit. They argued that the
many varieties of lies are united by a single identity claim of honesty. It was stipulated
that claims to honesty do not distinguish truth-tellers from liars. Deceivers, however,
were said to be successful in their lies only to the extent that they appear sincere.
DePaulo et al. (2003) asserted that cues to deceit can be predicted based on the
discrepancy between liars’ claims and their beliefs concerning the truth of the matters.
They elaborated that deceitful self-presentations are often not as convincingly embraced
as truthful self-presentations. This difficulty for liars was said to be partly related to
moral qualms that are not experienced by those telling the truth, which may account for
the slight feelings of discomfort experienced by those engaged in deception. It also was

29
stated that liars may lack personal investment in their claims, given they may not have the
relevant knowledge or experiences to back them. Based on these premises, it was
conceived that liars may appear tense, less pleasant and forthcoming, and that their
accounts would not seem compelling. DePaulo and her colleagues (2003) further implied
that people usually experience an increased sense of deliberateness when behaving
deceptively. In contrast, when behaving honestly, people were said to be “just acting
naturally” most of the time (DePaulo et al., 2003, p. 77).4 Drawing on the work of
Baumeister (1998), DePaulo and colleagues (2003) suggested that managing impressions
of credibility represent attempts at self-regulation, and that these attempts consume
mental resources. A stated implication of this self-regulatory busyness was that it may
compromise deceivers’ abilities to generate detailed responses.
Citing Ekman’s (1985/1992) contributions, DePaulo et al. (2003) also suggested
that thoughts and feelings (e.g., guilt, anxiety) could burden liars. If preoccupied by such
mental content, it was indicated that the performance of deceivers may suffer, and that
they may seem less engaged in their interactions. Moreover, efforts to control such
thoughts and feelings were said to be a likely response for liars. Trying not to think about
one’s insincerity was provided as an example; however, DePaulo et al. (2003) also
recognized the longstanding observation that attempts at thought suppression often lead
to increased preoccupation with the thoughts.
Overt behaviours were further formulated to be a target of self-regulatory efforts.
It was highlighted that some deceivers may try to avoid acting in ways that they believe
liars behave, but a risk to this strategy is that some of their beliefs may be inaccurate. In
4 It was qualified that truthful individuals sometimes experience a sense of deliberateness (e.g., when thoughts and feelings are difficult to express, or when the stakes are high for a persuasive performance).

30
this regard, DePaulo et al. (2003) provided the example of the typical belief that liars
cannot stay still, and that some liars may seem to be holding back or lacking in
involvement and positive engagement when trying to avoid movements so as to appear
credible. Based on these premises, it was conceived that liars’ deliberate attempts to
control their thoughts, feelings, and behaviours would be compromised, and that they
would appear tense, less pleasant, less convincing, and less forthcoming.
It should be noted that the self-presentational perspective rejects the notion that
lying is typically a complicated, stressful, and guilt-inducing behaviour that elicits strong
cues. According to DePaulo et al. (2003), deceptive presentations are carried out so
regularly that only faint behavioural cues may be evident. As it relates to appearing less
forthcoming, it was conceived that liars may respond in less detail, and that they may
seem to be holding back. More precisely, their response latencies may be longer, and
their speech may be slower. In terms of providing accounts that are less compelling, it
was contended that there would be more discrepancies in the accounts of liars, and that
they would appear less engaged, more uncertain, less fluent, and less active than truth-
tellers. The self-presentational perspective on cues to deception also predicts that liars
may appear less pleasant and positive than truth-tellers. Lastly, DePaulo et al. (2003)
asserted that only their model predicts that the accounts of liars will contain fewer
ordinary imperfections or unusual contents, given their proposition that even the most
informed deceivers may have misconceptions about the nature of truthful accounts (e.g.,
truthful accounts are highly structured and coherent with few digressions).

31
Rationale for Subtyping the Behavioural Effects of Deception and Hypotheses
As mentioned in the first chapter, people tend to be poor lie detectors. Detecting
deceit appears to be a difficult task for many reasons. One reason for the difficulty is that
there does not appear to be any behaviour that always occurs when people are lying, but
never occurs at any other time (DePaulo et al., 2003). Put simply, there does not appear to
be any behaviour akin to Pinocchio’s nose that observers can use to identify deception
(Hartwig, 2011; Vrij, 2008; Vrij et al., 2010a).
Of relevance to this dissertation are the results from DePaulo et al.’s (2003)
widely cited meta-analysis that reported on the combined results of 1,338 estimates for
158 cues to deception. The results of this meta-analysis indicated that most behaviours
believed to be suggestive of lying have weak or no empirical relationships with deception
(also see meta-analyses conducted by Sporer & Schwandt, 2006, 2007). On this point,
DePaulo and colleagues (2003) reported a median Cohen’s d effect size of .10 for 88
cues, and further highlighted that only three cues had effect sizes greater than .40. Such
findings have led some researchers (e.g., Vrij et al., 2010a) to conclude that deception
detection is difficult partly because it is not easy to spot the subtle behavioural
differences between truth-tellers and liars, a conclusion that has been supported by the
findings of more recent meta-analyses (see Hartwig & Bond, 2011).
Also of relevance to this dissertation, however, are anecdotal observations that
different individuals seem to display different behavioural cues to deceit (Vrij, 2008). On
this note, Vrij (2008) addressed the possibility that each individual does show clear signs
of deceit, but that different individuals show different signs. It was further postulated that
this might result in no signs of deceit emerging when these individuals are analyzed at a

32
group level, which was said to be typical of studies on deception. Despite these
observations and propositions, there do not appear to have been any previous attempts at
subtyping the behavioural effects of deception.
With regard to identifying subtypes of individuals in terms of verbal and
nonverbal cues to deceit, the data obtained by Porter, Doucette et al. (2008) are valuable
for several reasons. First, their study examined cues to deception in a sample of both
criminal offenders and undergraduate students. More specifically, the data are valuable
because most research examining deceptive behaviour has involved university students as
participants (DePaulo et al., 2003; Hartwig, 2011), and the inclusion of offenders was
intended to increase the generalizability of the findings. Second, participants in Porter,
Doucette et al.’s (2008) study provided both truthful and deceptive accounts of negative
life events. That is, the employment of a within-subjects design was consistent with
recommendations put forth by senior researchers on the topic of deception detection in
regards to making comparisons against baseline truthful behaviour when evaluating the
behavioural responses of individuals suspected of engaging in deception (Hartwig, 2011;
Vrij, 2008; Vrij et al., 2010a). Such recommendations have been made on account of the
large individual differences that have been observed in people’s behaviour and speech
(DePaulo & Friedman, 1998), which may place some groups at risk for being falsely
accused of lying. These groups include people whose natural behaviour may appear
suspicious to others (e.g., introverts and socially anxious individuals to name a few) (Vrij
et al., 2010a). Third, the data obtained by Porter, Doucette and colleagues (2008) are
valuable for subtyping because the cues investigated appear to be representative of those
described in the major formulations on cues to deceit summarized earlier. When

33
attempting to identify subtypes of individuals via cluster analysis, which was the
technique employed in the current study, Nunnally (1978) stressed the importance of
sampling variables that are representative of a specified domain. As will become clearer
from the description of the study methodology, Porter, Doucette et al. (2008) examined a
reasonably ample number of variables that have been thought to be important in the
domain of verbal and nonverbal cues to deceit.
The current study was conducted in an exploratory manner because there appear
to have been no previous attempts at subtyping individuals in terms of behavioural cues
to deception. The lack of previous research and theory in this realm made it difficult to
generate specific hypotheses beyond that subtypes would be identified. Again, this
hypothesis was based on anecdotal observations (see Vrij, 2008), and it was difficult to
hypothesize further on the number of subtypes that would emerge, or on the form that
they would take.
It also should be noted that the data were still analyzed in terms of mean
differences for behaviours observed in the truthful condition versus behaviours observed
in the deceptive condition. Doing so facilitated a comparison of the findings when the
focus was on the group level versus subtypes. In this respect, it was reasonable to
hypothesize that either small or no group differences would emerge, consistent with
meta-analytic reviews on behavioural cues to deceit (DePaulo et al., 2003; Sporer &
Schwandt, 2006, 2007).
Lastly, interrelationships among cues to deceit were investigated in the current
study. On this matter, Nunnally (1978) stated that if variables are part of a theoretical
system, it is likely that at least moderate-sized correlations will be observed among them.

34
Given that the variables described in the next section of this chapter have been
conceptualized as being important in the domain of verbal and nonverbal cues to deceit, it
is reasonable to hypothesize that at least some of the cues will be moderately correlated
with each other. Although such a hypothesis may seem obvious, this issue does not seem
to have been a major focus of attention in either individual studies of deception or in
meta-analytic reviews. If moderate or large-sized correlations are observed among some
cues to deceit, then it could have implications for the application of these cues in the
practice of detecting deception.
Method
Participants
The offenders in the sample were 26 adult males serving federal sentences at a
medium-security correctional facility in eastern Canada. Their mean age was 31.7 years
(SD = 10.1). The non-offenders in the sample were 38 undergraduate students attending a
university, also in eastern Canada. Their mean age was 20.8 years (SD = 5.7). Twenty-six
(68.4%) of the undergraduate student participants were female and 12 (31.6%)
participants were male.
Procedure
Participants in this study related one honest and one fabricated (counterbalanced)
negative life event on videotape. They were given 10 minutes to plan each account,
followed by a break to plan the next account. All participants were asked to provide a
“credible and believable” description of the event in no more than five minutes. They
also were told that their stories would be viewed by various groups to assess their
honesty. Both truthful and fabricated events were limited to the five years preceding

35
participation in the study. It should be noted that asking participants to tell the truth and
lie about past criminal behaviour was not possible due to the potential ethical dilemmas
that could arise.
The participants were asked to provide their complete recollection of the negative
life event, including when it occurred, its location, people present at the time, and all
other factual details that they could remember. Beforehand, participants were provided
with a list of potential types of negative life events that they could discuss (e.g., a serious
accident, a medical procedure, or the death of a loved one). The events chosen, however,
were ultimately up to the participants in light of their unique past experiences.
Interviewers did not interject or request elaboration of details while the participants
provided their accounts on video.
Each video was coded for four nonverbal cues. These cues included: frequency of
illustrators (finger, hand, or arm movements); frequency of self-manipulations
(touching/scratching of hands, head, or other body parts); frequency of clear head
movements (nods, shakes); and frequency of smiles or laughs. The videos also were
transcribed verbatim to facilitate the coding of verbal behaviour. Each account was coded
for length in terms of the number of words and response length in seconds. Speech rate
was calculated by coding the number of words spoken per minute. Additionally, the
stories were coded for the frequency of filled pauses/speech hesitations (“umm”, “ahh”,
“well”, etc.), frequency of unfilled speech pauses (greater than two seconds in duration),
and frequency of self-references (“I”, “me”, “my”, “we”).
A second rater coded 20% of the videos, so that the interrater reliability of the
cues could be determined. Correlational analyses indicated that coding of the behaviours

36
was reliable. More specifically, the Pearson product-moment correlations for behaviours
observed in the truthful accounts were as follows: smiles = .82; head movements = .68;
illustrators = .98; self-manipulations = .93; filled pauses = .98; speech pauses = .95; and
self-references = .99. Similarly, the correlations for behaviours observed in the deceptive
accounts were: smiles = .88; head movements = .75; illustrators = .95; self-manipulations
= .91; filled pauses = .69; speech pauses = .62; and self-references = .99.
Results
Searching for Outliers
The raw data concerning the 10 coded behaviours were examined for both
univariate and multivariate outliers prior to performing any statistical analyses, as per
standard recommendations (e.g., Tabachnick & Fidell, 2007). In searching for univariate
outliers, the raw data were first converted to z-scores and then inspected for extreme
standardized values. Mahalanobis distance was used to identify potential multivariate
outliers. These evaluations were conducted separately for data obtained from
participation in both the truthful and deceptive conditions. No outliers were identified.
Tests of Significance and Error Rates
Given the exploratory nature of this research, all statistical analyses performed
involved two-tailed tests of significance. As in other exploratory research (e.g.,
Baumeister, Wotman, & Stillwell, 1993; Juodis, Woodworth, Porter, & ten Brinke,
2009), the Type I error rate was set at .05 for each statistical test conducted and
Bonferroni corrections to this error rate were not made. The rationale for this decision
was to prevent neglect of any potentially novel and important findings. Although there is
a possibility for spurious findings to emerge by chance by proceeding in this manner,

37
there are no statistical corrections for missing important discoveries due to insufficient
attentiveness to the data (Bem, 2004). Conducting research in this fashion simply
underscores the importance of cautious interpretation and replication of results.
Comparing Truthful and Deceptive Accounts: Students versus Offenders
A series of 2 (participant group: student vs. offender) x 2 (veracity of account:
truthful vs. deceptive) repeated measures factorial analysis of variance (ANOVA) were
conducted to determine whether the truthful and deceptive accounts from students
differed from those of offenders. The 10 coded behaviours were entered as the dependent
variables. The results of these analyses, presented in Tables 1 and 2, showed a significant
main effect for participant group with regard to smiles only. More specifically, on
average and across the experimental conditions, students smiled significantly more often
(M = 4.41; SD = 3.54) than offenders (M = 1.21; SD = 1.68). No significant interaction
with the veracity of the account qualified this result.
The results in Table 1 and Table 2 also show that the ANOVAs revealed main
effects for the veracity of the accounts with regard to time and number of words. More
specifically, deceptive accounts took a significantly shorter amount of time to deliver and
contained significantly fewer words than truthful accounts. Tables 1 and 2 further show a
main effect for veracity of the accounts for head movements. That is, deceptive accounts
involved significantly fewer head movements than truthful accounts. The main effects
with respect to account veracity for the other coded behaviours failed to reach
significance. No significant interactions qualified these results.5
5 Because the distributions of many coded behaviours were found to be positively skewed, nonparametric statistical analyses also were performed to determine whether significant differences existed between the truthful and deceptive accounts at the overall group level. A series of Wilcoxon’s matched-pairs signed ranks tests yielded results that were generally consistent with the results of the ANOVAs.
38
Lastly, in considering the results of the ANOVAs, Tables 1, 2, and 3 indicate that
there was a significant interaction between participant group and veracity of the account
for speech pauses only. Specifically, as shown in the tables, the truthful and deceptive
accounts of students did not differ significantly in terms of the number of speech pauses.
The tables show a different result for offenders, however. That is, there were significantly
fewer speech pauses by offenders during the delivery of the deceptive accounts compared
to the delivery of the truthful accounts. This result represented a medium effect size when
considering Cohen’s (1992) standards for small (d = .20), medium (d = .50), and large (d
= .80) effect sizes for independent means.

39
Table 1
Coded Behaviour Cell Means (and Standard Deviations) for Students’ and Offenders’ Truthful and Deceptive Accounts of Negative
Life Events.
Behaviour Students (n = 38) Offenders (n = 26) Overall (n = 64)
Truthful Deceptive Mean Difference Truthful Deceptive Mean Difference Truthful Deceptive Mean Difference
Smiles 4.39 (4.28) 4.42 (3.78) .03 (3.89) 1.73 (2.59) .69 (1.12) -1.04 (2.14) 3.31 (3.89) 2.91 (3.51) -.41 (3.32)
Head movements 15.18 (14.97) 13.92 (11.87) -1.26 (10.47) 15.00 (19.18) 10.77 (14.24) -4.23 (11.09) 15.12 (16.66) 12.64 (12.87) -2.47 (10.74)
Illustrators 13.29 (18.39) 13.61 (14.73) .32 (13.28) 9.27 (13.59) 7.96 (10.66) -1.31 (9.35) 11.66 (16.61) 11.31 (13.43) -.34 (11.78)
Self-manipulations 15.11 (17.23) 14.79 (13.39) -.32 (14.87) 10.08 (12.87) 11.04 (13.43) .96 (7.88) 13.06 (15.69) 13.27 (13.43) .20 (12.44)
Time (seconds) 113.21 (71.38) 98.92 (49.72) -14.29 (44.77) 120.92 (103.84) 91.96 (66.91) -28.96 (77.68) 116.34 (85.36) 96.09 (56.93) -20.25 (60.21)
Words 341.61 (217.15) 298.92 (164.30) -42.68 (137.95) 352.00 (322.44) 271.58 (195.28) -80.42 (250.54) 345.83 (262.63) 287.81 (176.55) -58.02 (190.88)
Speech rate 183.88 (31.04) 182.65 (31.15) -1.24 (22.96) 171.68 (25.30) 177.80 (26.06) 6.11 (27.09) 178.93 (29.27) 180.68 (29.07) 1.75 (24.78)
Filled pauses 10.97 (9.92) 11.05 (9.67) .08 (7.51) 12.58 (14.57) 8.38 (8.74) -4.19 (12.71) 11.63 (11.94) 9.97 (9.33) -1.66 (10.08)
Speech pauses 2.13 (2.59) 2.29 (2.18) .16 (2.37) 3.46 (3.18) 2.23 (1.92) -1.23 (2.64) 2.67 (2.90) 2.27 (2.06) -.41 (2.56)
Self-references 24.29 (20.08) 22.13 (15.38) -2.16 (20.60) 24.54 (30.15) 15.92 (12.64) -8.62 (29.80) 24.39 (24.44) 19.61 (14.55) -4.78 (24.73)
39
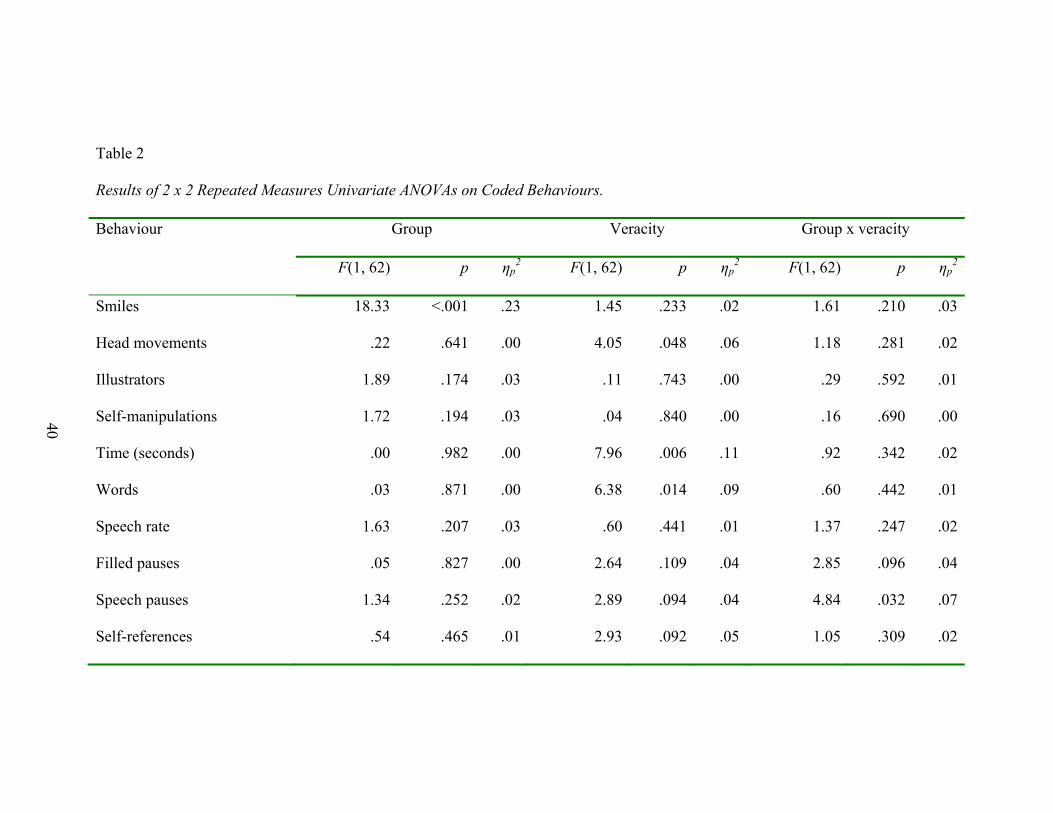
40
Table 2
Results of 2 x 2 Repeated Measures Univariate ANOVAs on Coded Behaviours.
Behaviour Group Veracity Group x veracity
F(1, 62) p ηp2 F(1, 62) p ηp
2 F(1, 62) p ηp2
Smiles 18.33 <.001 .23 1.45 .233 .02 1.61 .210 .03
Head movements .22 .641 .00 4.05 .048 .06 1.18 .281 .02
Illustrators 1.89 .174 .03 .11 .743 .00 .29 .592 .01
Self-manipulations 1.72 .194 .03 .04 .840 .00 .16 .690 .00
Time (seconds) .00 .982 .00 7.96 .006 .11 .92 .342 .02
Words .03 .871 .00 6.38 .014 .09 .60 .442 .01
Speech rate 1.63 .207 .03 .60 .441 .01 1.37 .247 .02
Filled pauses .05 .827 .00 2.64 .109 .04 2.85 .096 .04
Speech pauses 1.34 .252 .02 2.89 .094 .04 4.84 .032 .07
Self-references .54 .465 .01 2.93 .092 .05 1.05 .309 .02
40

41
Table 3
Results of t-Tests Comparing Behaviours Coded in Students’ and Offenders’ Truthful and Deceptive Accounts of Negative Life Events.
Behaviour Students (n = 38) Offenders (n = 26)
t(37) p d t(25) p d
Smiles -.04 .967 .00 2.47 .021 .48
Head movements .74 .462 .12 1.95 .063 .38
Illustrators -.15 .884 -.02 .71 .482 .14
Self-manipulations .13 .897 .02 -.62 .539 -.12
Time (seconds) 1.97 .057 .32 1.90 .069 .37
Words 1.91 .064 .31 1.64 .114 .32
Speech rate .33 .741 .05 -1.15 .261 -.23
Filled pauses -.07 .949 -.01 1.68 .105 .33
Speech pauses -.41 .683 -.07 2.38 .026 .47
Self-references .65 .522 .10 1.47 .153 .29
Note. Values under the fourth and seventh columns are effect sizes for independent samples.
41

42
Calculating and Correlating Difference Scores
Difference scores were computed for the 10 coded behaviours to capture changes
when lying compared to a truth-telling baseline. These computations yielded 10
difference scores for each participant. Specifically, the truthful values of the coded
behaviours were subtracted from the deceptive values. For example, the difference score
for number of words for each person equalled the number of words spoken in the
deceptive condition minus the number of words spoken in the truthful condition. In this
manner, a negative difference score indicated a decrease in behaviour when lying
compared to a truth-telling baseline. Conversely, a positive difference score indicated an
increase in behaviour when lying compared to a truth-telling baseline.
The 10 difference scores for all 64 participants were submitted to correlational
analyses. These analyses were performed to determine the nature and strength of the
relationships among difference scores. Specifically, Pearson product-moment correlations
were calculated. The results of these analyses are presented in Table 4.

43
Table 4
Pearson Product-Moment Correlations among Difference Scores of Coded Behaviours for Participants (n = 64) Relating Truthful and
Deceptive Accounts of Negative Life Events.
Behaviour
1. 2. 3. 4. 5. 6. 7. 8. 9. 10.
1. Smiles
- .49*** .38** .01 .20 .21 .20 .17 -.16 .15
2. Head movements
- .61*** .47*** .54*** .57*** .43*** .31* -.05 .46***
3. Illustrators
- .28* .45*** .52*** .35** .39** -.15 .40**
4. Self-manipulations
- .41** .37** .06 .20 .19 .38**
5. Time (seconds)
- .98*** .22 .79*** .32* .79**
6. Words
- .39** .79** .21 .79***
7. Speech rate
- .19 -.40** .23
8. Filled pauses
- .18 .65***
9. Speech pauses
- .33**
10. Self-references
-
Note. *p < .05. **p < .01. ***p < .001.
43
44
As can be seen in Table 4, results indicated that some pairs of difference scores
were not significantly related, and other pairs were significantly correlated but to varying
degrees. In considering Cohen’s (1992) standards for small (r = .10), medium (r = .30),
and large (r = .50) effect sizes, some significantly correlated pairs of difference scores
evidenced medium-sized relationships, and others evidenced large-sized relationships.
Almost all of the statistically significant relationships were positive relationships. This
finding indicated that changes from truth-telling to lying for these pairs of behaviours,
whether increases or decreases, were generally in the same direction. The exception was
the relationship between difference scores for speech rate and difference scores for
speech pauses. As speech rate tended to increase from truth-telling to lying, speech
pauses tended to decrease from truth-telling to lying, and vice versa.
When examining the relationships among difference scores for coded behaviours
that were found to be significantly different for truthful and deceptive accounts, Table 4
shows that the correlations for these pairs of difference scores varied. Difference scores
for head movements were not significantly related to difference scores for speech pauses.
There was a statistically significant, medium-sized relationship between difference scores
for the amount of time taken to deliver the accounts and the difference scores for speech
pauses. The relationship between difference scores for the time taken to deliver the
accounts and difference scores for the number of head movements was statistically
significant and in the large-sized range. The same was observed for the relationship
between difference scores for the number of words spoken and differences scores for the
number of head movements. The relationship between difference scores for the time
45
taken to deliver the accounts and the difference scores for the number of words spoken
was statistically significant and these scores were almost perfectly correlated.
Subtyping Procedures
Defining Key Terms. Cluster analysis is an unsupervised technique that is used
to unveil natural groupings of people that may exist within a sample. When more than
one variable is used to determine how groups may “hang together”, cluster analysis is
sometimes also referred to as profile analysis (Nunnally, 1978). The term profile initially
came from the practice of plotting test battery scores on graphs in applied settings
(Nunnally, 1978).
According to Nunnally (1978), the three major types of information that can be
gleaned from the profile of scores for any person were the level, dispersion, and shape.
The level was defined as the mean score of the person over the variables in the profile.
Dispersion, also referred to as scatter, was described as how widely the scores in a profile
diverge from the level. The standard deviation of scores for each person was said to be a
measure of dispersion. The shape was characterized as the high and low points of scores
in a profile. It was noted by Nunnally (1978) that even though two people may have the
same profile level and dispersion, the high and low points of scores in their profiles could
be very different. Shape, therefore, was defined by the rank-order of scores in the profile
for each person.
Regarding tests of abilities, Nunnally (1978) highlighted that the shape of a
profile denoted particular strengths and weaknesses for a person. In a controlled
experiment, as in the current study, it was stated the profile shape captured the dependent
variables that were most sensitive to the effects of an experimental manipulation for a

46
particular person. The objective of the current study was to conduct a cluster analysis to
determine whether people fall into different groups, or subtypes, regarding behaviour
changes when lying compared to a truth-telling baseline.
Between-Subjects Transformation of Variables. Prior to clustering profiles, the
difference scores for the 10 coded behaviours were standardized by transforming them to
z-scores. This transformation was made to place the 10 variables on the same scale.
Scaling of variables is important because variables measured on different scales may
have very different units and standard deviations (e.g., number of words versus frequency
of smiles). If differences of this sort are permitted to remain, some variables may more
strongly influence the clustering of profiles than other variables (Nunnally, 1978).
Within-Subjects Transformation of Variables: Compensating for
Responsivity. Vrij (2008; Vrij, Granhag, & Mann, 2010) has pointed out that some
people are better actors than others, and more skilled at regulating their verbal and
nonverbal behaviour. The ability to conceal true feelings, for example, by maintaining a
calm demeanour even when upset, was described as such a skill. These skills were argued
to be of benefit when lying, and imply that some individuals may be less responsive than
others in their verbal and nonverbal behaviour when engaged in deception tasks. Given
that individuals may vary in their overall responsivity to deception tasks, a transformation
to remove such differences was deemed necessary. Thus, a transformation of the
intraindividual distribution of profile scores was undertaken prior to clustering profiles
(Nunnally, 1978).
More specifically, the z-scores of difference scores were standardized again, but
over each profile using the same z-score formula. A mean z-score for each participant’s

47
10 original z-scores was computed, along with a standard deviation of the 10 original z-
scores for each participant. Next, each participant’s mean z-score was subtracted from the
10 original z-scores and divided by the corresponding standard deviation of the 10
original z-scores for the individual. These computations yielded 10 “ipsative” z-scores of
difference scores for each participant, with the mean score of each participant over the
variables in the profile being 0.0 and the standard deviation being 1.0. In other words, the
transformation equated the level and dispersion in all profiles and compensated for
individual differences in overall responsivity to the deception task. Such ipsative
transformations of data have been used successfully in the past by forensic psychologists;
specifically in the context of assessing sexual offenders, where denial of deviant sexual
interests is a primary concern (see Appendix A). It should be noted, however, that
ipsative z-scores are relative scores, and that the magnitude of these scores should not be
confused with the magnitude of absolute measures for the same set of attributes
(Clemens, 1966).
Using K-Means Cluster Analysis to Identify Subtypes. Following both
transformations of data, a k-means cluster analysis (MacQueen, 1967) was conducted on
the 10 ipsative z-scores of difference scores for all participants using SPSS version 15.0.
The distance measure used in the current study, also referred to as the measure of profile
similarity or profile dissimilarity (Nunnally, 1978), was Euclidean distance (SPSS, 2006).
K-means cluster analysis attempts to identify groups of individuals that are similar to
each other on selected characteristics, but that are different from individuals in other
groups on the selected characteristics (Norusis, 2011). In other words, such a technique is
48
used for dividing a larger heterogeneous group into smaller homogenous groups
(DiStefano & Kamphaus 2006).
K-means cluster analysis splits cases into a specified number of groups by
maximizing between cluster variation relative to within cluster variation on the selected
characteristics in a manner similar to conducting a one-way ANOVA where the groups
are unknown and the largest pseudo-F value is obtained by reassigning members to each
group (Systat Software, 2007). Although the pseudo-F statistics provided by k-means
cluster analysis are considered opportunistic in nature, given the technique attempts to
form groups that differ, the relative size of the statistics may be used for descriptive
purposes (SPSS, 2006). More specifically, these statistics provide information about each
variable's contribution to the separation of groups. The final cluster centres (means)
obtained by the analysis also may be used to describe and name the clusters (Norusis,
2011). Clusters are often named by comparing this information and other demographic
characteristics to theoretical perspectives and previous research (DiStefano & Kamphaus,
2006). Good cluster solutions are determined, in part, by a reasonable number of
homogenous clusters and their interpretability (Norusis, 2011). A more detailed rationale
for selecting k-means cluster analysis, and Euclidean distance as the distance measure,
can be found in the Appendix B.
Identifying the Number of Subtypes. Conducting a k-means cluster analysis
requires specification of the number of clusters to be formed. Two- to five-cluster
solutions were inspected in the current study because the number of clusters believed to
exist was not hypothesized in advance. Following inspection of these solutions, a two-
cluster solution was deemed to be the best on both empirical and rational grounds.

49
Empirically, the CH Index was used to determine the optimal number of clusters in the
data (Calinski & Harabasz, 1974). This Index is a measure of between-cluster
dissimilarity over within-cluster dissimilarity, and involves computation of the pairwise
sum of squared errors (distances) between clusters compared to the internal sum of
squared errors for each cluster (Yuan, Li, & Wilson, 2008). The CH Indices for two-,
three-, four-, and five-cluster solutions were: 17.63, 14.09, 12.27, and 11.14, respectively.
Thus, the two-cluster solution evidenced the optimal clustering outcome because it
maximized the CH Index.
As stated previously, a two-cluster solution also was deemed to be superior on
rational grounds. Firstly, the two-cluster solution was the most parsimonious solution.
Secondly, the two-cluster solution was interpreted more easily, signifying superior
interpretability. Table 5 shows the final cluster means obtained by the k-means cluster
analysis when it was constrained to produce a two-cluster solution.

50
Table 5
Comparison of Fluid and Laboured Liars’ Mean Ipsative Z-Scores of Difference Scores
for Behaviours Coded from Truthful and Deceptive Accounts of Negative Life Events.
Behaviour Group t(62) p d
Fluid liars
(n = 34)
Laboured liars
(n = 30)
Smiles .36 (.96) -.56 (1.09) 3.60 .001 .90
Head movements .19 (.62) -.12 (.89) 1.63 .109 .40
Illustrators -.12 (.90) -.00 (.81) -.56 .579 -.14
Self-manipulations -.26 (.93) .16 (.75) -1.99 .051 -.50
Time (seconds) -.20 (.63) .47 (.46) -4.84 .000 -1.22
Words -.04 (.60) .30 (.48) -2.45 .017 -.62
Speech rate .95 (.97) -1.11 (1.02) 8.30 .000 2.08
Filled pauses -.01 (.91) .22 (.73) -1.11 .271 -.28
Speech pauses -.73 (1.14) .66 (.90) -5.38 .000 -1.36
Self-references -.12 (.83) -.00 (.91) -.54 .591 -.14
Note. Values under the second and third columns are means (and standard deviations).
Values under the sixth column are effect sizes for independent samples.

51
Describing the Subtypes: Fluid Liars and Laboured Liars.
It should be noted that the term relative is used when describing the defining
features of the subtypes because the data clustered were ipsative data. Table 5 shows that
the first cluster, named “fluid liars”, comprised 53.1% of the sample. Fluid liars were
characterized by a relative increase in speech rate as well as a relative decrease in speech
pauses when lying in comparison to baseline truth-telling. For fluid liars, there was a
relative decrease in the amount of time taken to deliver the accounts when lying in
comparison to baseline truth-telling. For fluid liars, there also was a relative increase in
smiles when lying in comparison to baseline truth-telling.
Table 5 shows that the second cluster, named “laboured liars”, comprised 46.9%
of the sample. In contrast, laboured liars were characterized by a relative decrease in
speech rate, as well as a relative increase in speech pauses when lying in comparison to
baseline truth-telling. For laboured liars, there was a relative increase in the amount of
time taken to deliver the account in addition to a relative increase in the number of words
spoken when lying in comparison to baseline truth-telling. For laboured liars, there also
was a relative decrease in smiles when lying in comparison to baseline truth-telling.
It is worth highlighting that a sizable number of cases were assigned to each
cluster. This finding indicated that no group was characterized by only one or two
outliers. This finding is of importance because k-means cluster analysis has been found to
be sensitive to the presence of outliers (Hair, Black, Babin, & Anderson, 2009; Norusis,
2011). The profiles of the final cluster means for fluid liars and laboured liars are
presented graphically in Figure 1.

52
Figure 1
Profiles of the Relative Behavioural Effects of Deception among Participants Relating
Negative Life Events.
-1.5
-1
-0.5
0
0.5
1
1.5
1 2 3 4 5 6 7 8 9 10
Behaviour
Mea
n Ip
sativ
e Z
-Sco
re o
f D
iffe
renc
e S
core
Fluid liars (n = 34) Laboured liars (n = 30)
Note. 1 = smiles; 2 = head movements; 3 = illustrators; 4 = self-manipulations; 5 = time
(seconds); 6 = words; 7 = speech rate; 8 = filled pauses; 9 = speech pauses; 10 = self-
references.

53
Figure 1 illustrates that the profiles of fluid liars and laboured liars have different
shapes. That is, the high and low points (or rank order) of scores in the profiles are
different. This finding indicated that the differences between fluid liars and laboured liars
are not only quantitative differences. Such differences would be depicted by parallel
profiles. Parallel profiles would indicate that the two groups differ only in the degree of
their behavioural responses to the deception task. The saw-tooth pattern observed among
the profiles indicates qualitative differences between the two groups concerning the
relative behavioural effects of deception.
Are the Subtypes Meaningful? Cluster analysis is a potentially useful method
for explicating subtypes in complex datasets. Unfortunately, no single definitive rule
exists for determining how many clusters to retain. Statistically, an analyst can retain as
many clusters as there are variables. Theoretically, however, researchers are interested in
finding the most parsimonious cluster solution that best describes the dataset. A similar
problem arises in principle components analysis in terms of the number of components or
factors to retain before factor rotation. Traditionally, most statistical software programs
use an eigenvalue > 1.0 method for factor extraction. Monte Carlo studies, however, have
shown that this technique may not be optimal (Costello & Osborne, 2005). An alternative
technique, known as parallel analysis, provides a more robust method for determining the
number of factors to retain. In parallel analysis a random dataset is created that mimics
the number of variables contained in the existing dataset. A principle components
analysis is then performed on the random dataset. The eigenvalues from the random
dataset are compared to the eigenvalues from the existing dataset. Those components
extracted from the extant dataset with eigenvalues greater than what was found in the

54
random dataset are then retained. Parallel analysis not only assists with determining how
many factors to retain, but also helps ensure that factor solutions are more meaningful
than what one would expect among random data.
In the current study, the logic of parallel analysis was extended to the cluster
solutions that were obtained by following a procedure used by McKillop and Nielson
(2011) (J. M. McKillop, personal communication, April 23, 2013). First, a randomly
generated dataset was created with properties similar to the data obtained in the current
study. This randomly generated dataset was comprised of 10 variables for 64 cases. The
means and standard deviations of these variables were set to 0.0 and 1.0, respectively.
Next, a k-means cluster analysis was conducted on the randomly generated data and
constrained to produce two- to five-cluster solutions. For each solution, the pseudo-F
statistics obtained for each variable were summed and then divided by 10. The resulting
average or “global” pseudo-F values for two-, three-, four-, and five-cluster solutions
were: 10.02, 7.88, 5.67, and 6.44, respectively. Similarly, global pseudo-F values for
two- to five-cluster solutions were calculated using the data obtained from the present
study. Using this data, the global pseudo-F values for two-, three-, four-, and five-cluster
solutions were: 14.86, 16.53, 11.77, and 11.28, respectively. Finally, the global pseudo-F
values for data obtained from the present study were divided by the global pseudo-F
values obtained from the randomly generated data. Thus, the resulting ratios for two-,
three-, four-, and five-cluster solutions were: 1.48, 2.10, 2.08, and 1.75, respectively. The
finding that these ratios were all greater than 1.0 indicated that the cluster solutions
obtained using data from the current study were greater than the cluster solutions
obtained using randomly generated data. In other words, the cluster solutions obtained

55
using data from the current study outperformed those that were obtained using random
data. This finding countered the argument that the solutions obtained using data from the
current study were entirely random, including the obtained two-cluster solution
characterizing fluid liars and laboured liars.
Validation of Subtypes: Identifying Correlates.
Searching for Potential Demographic Correlates.
One method of validating subtypes is to establish relationships between them and
other variables of theoretical and practical importance that were not used to form the
clusters (Hair et al., 2009). An effort, therefore, was made to determine whether fluid
liars and laboured liars differed on any demographic characteristics. An independent
samples t-test indicated no significant difference in age between fluid liars (M = 24.1; SD
= 8.1) and laboured liars (M = 25.8; SD = 10.6), t(60) = -.69, p = .493, d = -.17.6 Cross-
tabulation also indicated no significant association between the subtypes and the sex of
the participants, χ2 (1, n = 64) = 2.06, p = .151. Specifically, 42.3% of women were
classified as fluid liars, and 57.7% were classified as laboured liars. Along these lines,
60.5% of men were classified as fluid liars, and 39.5% were classified as laboured liars.
Of note, this latter finding held even when the offenders (all men) were excluded from
the analysis. Interestingly, cross-tabulation revealed a significant association between the
subtypes and criminal status, χ2 (1, n = 64) = 4.56, p = .033. Specifically, 42.1% of
students were classified as fluid liars, and 57.9% were classified as laboured liars. In
contrast, 69.2% of offenders were classified as fluid liars, and 30.8% were classified as
laboured liars. Figure 2 illustrates this association.
6 The ages of two offenders were unknown.

56
Figure 2
Assignment of Fluid and Laboured Liars as a Function of Criminal Status.
0
10
20
30
40
50
60
70
80
90
100
Students (n = 38) Offenders (n = 26)
Group
Per
cent
age
(%)
of G
roup
Fluid liars
Laboured liars

57
Examining the Importance of Criminal Status. Given the observed association
between the subtypes and criminal status, it may have been the case that the obtained
two-cluster solution was simply the result of performing the cluster analysis on a
combined sample of students and offenders. That is, it may have been the case that the
two subtypes solely reflected differences between students and offenders concerning the
relative behavioural effects of deception. If, however, the two-cluster solution were to be
obtained for student and offender groups when analyzed separately, then fluid liars and
laboured liars would not be specific to either group. Such a finding would indicate that
obtainment of the two subtypes was not solely attributable to differences between
students and offenders concerning the relative behavioural effects of deception. It also
would address the generalizability of the two-cluster solution. A k-means cluster analysis
was performed on student and offender data separately to address these issues. Table 6
shows the final cluster means that were obtained when the analysis was conducted on
student data only and constrained to produce a two-cluster solution.

58
Table 6
Comparison of Student Fluid and Laboured Liars’ Mean Ipsative Z-Scores of Difference
Scores for Behaviours Coded from Truthful and Deceptive Accounts of Negative Life
Events.
Behaviour Group t(36) p d
Fluid liars
(n = 17)
Laboured liars
(n = 21)
Smiles -.16 (1.08) .07 (1.02) -.68 .502 -.22
Head movements -.02 (.46) -.04 (.91) .08 .936 .03
Illustrators -.00 (.77) -.06 (.79) .21 .833 .07
Self-manipulations -.05 (.76) .19 (.71) -1.03 .312 -.33
Time (seconds) -.14 (.68) .31 (.77) -1.86 .071 -.61
Words .17 (.68) .06 (.67) .48 .631 .16
Speech rate 1.06 (.87) -.98 (1.06) 6.38 .000 2.10
Filled pauses .35 (1.11) -.14 (.75) -1.61 .116 .52
Speech pauses -1.12 (.88) .69 (.93) -6.11 .000 -2.00
Self-references -.08 (.77) -.11 (1.09) .09 .931 .03
Note. Values under the second and third columns are means (and standard deviations).
Values under the sixth column are effect sizes for independent samples.
59
Table 6 shows fluid liars comprised 44.7% of the student sample. Fluid liars again
were characterized by a relative increase in speech rate when lying in comparison to
baseline truth-telling. They again were characterized by a relative decrease in speech
pauses when lying in comparison to baseline truth-telling. The table also shows laboured
liars comprised 55.3% of the student sample. Laboured liars again were characterized by
a relative decrease in speech rate when lying in comparison to baseline truth-telling. They
again were characterized by a relative increase in speech pauses when lying in
comparison to baseline truth-telling. The sizable number of cases assigned to each cluster
again indicated that no group was characterized by only one or two outliers. Profiles of
the final cluster means for student fluid liars and student laboured liars are presented in
Figure 3.
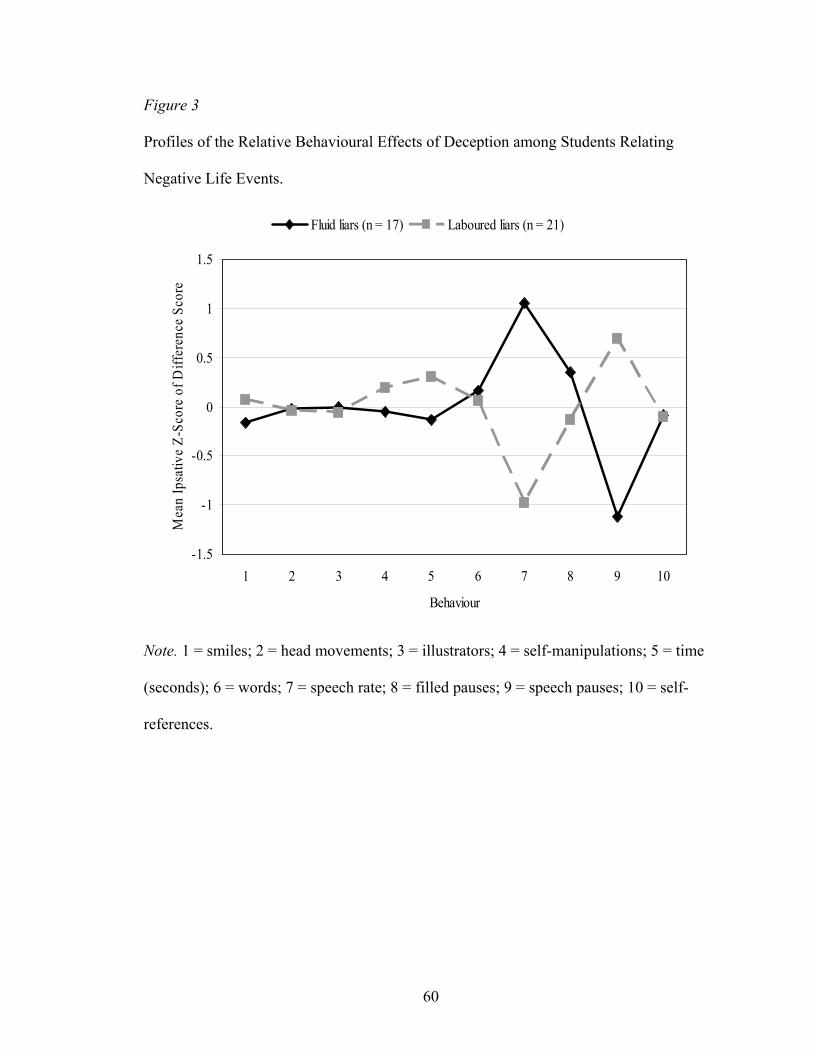
60
Figure 3
Profiles of the Relative Behavioural Effects of Deception among Students Relating
Negative Life Events.
-1.5
-1
-0.5
0
0.5
1
1.5
1 2 3 4 5 6 7 8 9 10
Behaviour
Mea
n Ip
sativ
e Z
-Sco
re o
f D
iffe
renc
e S
core
.
Fluid liars (n = 17) Laboured liars (n = 21)
Note. 1 = smiles; 2 = head movements; 3 = illustrators; 4 = self-manipulations; 5 = time
(seconds); 6 = words; 7 = speech rate; 8 = filled pauses; 9 = speech pauses; 10 = self-
references.

61
Figure 3 illustrates that the subtype profiles for students have different shapes.
The saw-tooth pattern observed among the profiles again indicated qualitative differences
between the two groups concerning the relative behavioural effects of deception, even
when only student data were analyzed. These results indicated that obtainment of a two-
cluster solution characterizing fluid liars and laboured liars is not solely the result of
including data from offenders with data from students. Similarly, Table 7 shows the final
cluster means that were obtained when the k-means cluster analysis was conducted on
offender data only and constrained to produce a two-cluster solution.

62
Table 7
Comparison of Offender Fluid and Laboured Liars’ Mean Ipsative Z-Scores of
Difference Scores for Behaviours Coded from Truthful and Deceptive Accounts of
Negative Life Events.
Behaviour Group t(24) p d
Fluid liars
(n = 15)
Laboured liars
(n = 11)
Smiles .49 (.94) -.62 (1.35) 2.48 .021 .96
Head movements .38 (.67) -.18 (.88) 1.85 .077 .72
Illustrators -.11 (1.03) .03 (.91) -.38 .711 -.15
Self-manipulations -.49 (1.26) -.18 (1.13) -.65 .521 -.26
Time (seconds) -.11 (.62) .40 (.25) -2.57 .017 -1.08
Words -.03 (.60) .31 (.30) -1.68 .11 -.70
Speech rate .53 (1.06) -.55 (1.28) 2.35 .027 .92
Filled pauses .24 (.78) -.19 (.68) 1.47 .155 .59
Speech pauses -.66 (1.06) .84 (.54) -4.31 .000 -1.79
Self-references -.23 (.69) .15 (.84) -1.27 .217 -.50
Note. Values under the second and third columns are means (and standard deviations).
Values under the sixth column are effect sizes for independent samples.

63
Table 7 shows fluid liars comprised 57.7% of the offender sample. Fluid liars
again were characterized by a relative increase in speech rate when lying in comparison
to baseline truth-telling. They again were characterized by a relative decrease in speech
pauses when lying in comparison to baseline truth-telling. For fluid liars, there was a
relative decrease in the amount of time taken to deliver the account when lying in
comparison to baseline truth-telling. For fluid liars, there also was a relative increase in
smiles when lying in comparison to baseline truth-telling.
The table further shows laboured liars comprised 42.3% of the offender sample.
Laboured liars again were characterized by a relative decrease in speech rate when lying
in comparison to baseline truth-telling. They again were characterized by a relative
increase in speech pauses when lying in comparison to baseline truth-telling. For
laboured liars, there was a relative increase in the amount of time taken to deliver the
account when lying in comparison to baseline truth-telling. For laboured liars, there also
was a relative decrease in smiles when lying in comparison to baseline truth-telling. The
number of cases assigned to each cluster again indicated that no group was characterized
by only one or two outliers. Profiles of the final cluster means for offender fluid liars and
offender laboured liars are presented in Figure 4.

64
Figure 4
Profiles of the Relative Behavioural Effects of Deception among Offenders Relating
Negative Life Events.
-1.5
-1
-0.5
0
0.5
1
1.5
1 2 3 4 5 6 7 8 9 10
Behaviour
Mea
n Ip
sativ
e Z
-Sco
re o
f D
iffe
renc
e S
core
Fluid liars (n = 15) Laboured liars (n = 11)
Note. 1 = smiles; 2 = head movements; 3 = illustrators; 4 = self-manipulations; 5 = time
(seconds); 6 = words; 7 = speech rate; 8 = filled pauses; 9 = speech pauses; 10 = self-
references.

65
The offender profiles depicted in Figure 4 have different shapes. The saw-tooth
pattern observed among the profiles again indicated qualitative differences between the
two subtypes concerning the relative behavioural effects of deception, even when only
offender data were analyzed. These results indicated that obtainment of a two-cluster
solution characterizing fluid liars and laboured liars is not solely the result of including
data from students with data from offenders. Collectively, these findings indicated that
fluid liars and laboured liars are not specific to students or offenders.
Examining the Importance of Speech Rate. The results presented above
indicated that speech rate made a relatively large contribution to the separation of groups.
Thus, the aforementioned cluster analytic procedures were repeated with speech rate
omitted from the analyses.7 This action was taken to determine whether the obtained two-
cluster solution characterizing fluid liars and laboured liars was solely the result of the
contribution of speech rate. Table 8 shows the final cluster means obtained when the k-
means cluster analysis was constrained to produce a two-cluster solution and speech rate
was omitted from the analysis.
7 The reanalysis required a new within-subjects transformation of data involving nine variables instead of 10 variables.

66
Table 8
Comparison of Fluid and Laboured Liars’ Mean Ipsative Z-Scores of Difference Scores
for Behaviours Coded from Truthful and Deceptive Accounts of Negative Life Events with
Speech Rate Excluded from Analysis.
Behaviour Group t(62) p d
Fluid liars
(n = 35)
Laboured liars
(n = 29)
Smiles .54 (.86) -.86 (1.01) 5.98 .000 1.49
Head movements .38 (.63) -.31 (.96) 3.49 .001 .86
Illustrators .03 (.87) -.20 (.89) 1.04 .304 .26
Self-manipulations -.27 (1.03) .14 (.80) -1.73 .089 -.44
Time (seconds) -.05 (.66) .41 (.60) -2.90 .005 -.73
Words .07 (.71) .26 (.60) -1.16 .251 -.29
Filled pauses .17 (1.03) -.06 (.72) 1.00 .324 .25
Speech pauses -.86 (1.07) .80 (.83) -6.80 .000 -1.73
Self-references -.00 (.92) -.17 (1.05) .69 .490 .17
Note. Values under the second and third columns are means (and standard deviations).
Values under the sixth column are effect sizes for independent samples.

67
The results presented in Table 8 demonstrated that a two-cluster solution
characterizing fluid liars and laboured liars was obtained even when speech rate was
omitted from the analysis. The table reveals that the first cluster, again named fluid liars,
comprised 54.7% of the sample and was characterized by a relative decrease in speech
pauses when lying in comparison to baseline truth-telling. For fluid liars, there was a
relative decrease in the amount of time taken to deliver the accounts when lying in
comparison to baseline truth-telling. For fluid liars, there also was a relative increase in
smiles when lying in comparison to baseline truth-telling.
In contrast, Table 8 shows that the second cluster, again named laboured liars,
comprised 45.3% of the sample and was characterized by a relative increase in speech
pauses when lying in comparison to baseline truth-telling. For laboured liars, there was a
relative increase in the amount of time taken to deliver the account when lying in
comparison to baseline truth-telling. For laboured liars, there also was a relative decrease
in smiles when lying in comparison to baseline truth-telling. A sizable number of cases
again were assigned to each cluster, indicating that no group was characterized by only
one or two outliers. The profiles of the final cluster means for fluid liars and laboured
liars, when speech rate was omitted from the analysis, are presented in Figure 5.

68
Figure 5
Profiles of the Relative Behavioural Effects of Deception among Participants Relating
Negative Life Events with Speech Rate Excluded from the Analysis.
-1.5
-1
-0.5
0
0.5
1
1.5
1 2 3 4 5 6 7 8 9
Behaviour
Mea
n Ip
sativ
e Z
-Sco
re o
f D
iffe
renc
e Sc
ore.
Fluid liars (n = 35) Laboured liars (n = 29)
Note. 1 = smiles; 2 = head movements; 3 = illustrators; 4 = self-manipulations; 5 = time
(seconds); 6 = words; 7 = filled pauses; 8 = speech pauses; 9 = self-references.

69
Figure 5 illustrates that the profiles again have different shapes (i.e., high and low
points of scores). This finding again indicated that the differences between the two
subtypes are not only quantitative differences. The saw-tooth pattern observed among the
profiles indicated qualitative differences between the two groups concerning the relative
behavioural effects of deception. Collectively, these results indicated that obtainment of a
two-cluster solution characterizing fluid liars and laboured liars is not solely the result of
the contribution of speech rate.

70
Discussion
General Behavioural Differences between Students and Offenders
On average, and across the truthful and deceptive accounts, it was observed that
only smiles occurred significantly more often for students than for offenders. This finding
is not surprising, and there are many different plausible explanations for the result beyond
the possibility that it was obtained simply by chance. Even though both groups were
describing negative life events, given that the offenders were incarcerated, it seems very
likely that they had fewer reasons than students to be happy and show such displays. The
finding may not have been entirely the result of situational circumstances, however. On
this point, a substantial number of offenders are known to experience serious mental
disorders; more so than the general population (e.g., psychotic disorders, mood disorders,
and personality disorders) (Fazel & Danesh, 2002; Steadman, Osher, Robbins, Case, &
Samuels, 2009). Because the correctional files of offenders in the present study were not
available for review, however, it was not possible to obtain this kind of diagnostic
information. It, therefore, cannot be ruled out that such conditions may have influenced
some of the offenders’ displays of affect. It also is possible that another third variable
may account for the finding highlighted above, in whole or in part. On this note, perhaps
some of the more basic dimensions of personality (e.g., neuroticism vs. emotional
stability, antagonism vs. agreeableness) had a bearing upon some offenders’ affective
expressions, and not necessarily mental disorders or personality disorders per se.
Although the focus of this dissertation was not on general verbal and nonverbal
behaviour differences between forensic and community populations, such potential
differences should probably be the focus of further research and warrant the consideration

71
of those who are routinely involved in detecting deceit. Earlier in this chapter it was
highlighted that large individual differences have been observed in people’s behaviour
and speech (DePaulo & Friedman, 1998), and that this may place some groups at greater
risk for being falsely accused of lying. This was said to be a concern for those whose
natural behaviour may appear suspicious to others, such as introverts, socially anxious
persons, and individuals of some ethnicities (e.g., some Aboriginal people in Canada,
some Turkish and Moroccan individuals living in the Netherlands) (see Vrij et al.,
2010a). If it is established through further research that offenders generally smile less
often than non-offenders, and if it is commonly believed that liars typically appear less
pleasant than those telling the truth (see, e.g., DePaulo et al., 2003; Zuckerman et al.,
1981), then offenders may represent another group at increased risk for being falsely
accused of deception. Until confirmed by additional studies, however, those who consider
and interview known offenders in investigations of unsolved crimes would still do well to
be mindful of such a possibility. For example, it may be of some relevance to police who
draw on information from sex offender registries during the course of their work, which
were developed to assist officers with identifying possible suspects to investigate for
unsolved sexual assaults (Murphy, Fedoroff, Martineau, 2009).
The extent to which offender and non-offender populations differ with regard to
other displays of affect is not clear, as they were not examined in the present study. Nor
is it clear whether the difference described above is specific to the processing and
communication of negative emotional material. Studies that investigate these issues
further would shed some light on the generalizability of the aforementioned finding. If
nothing else, these points underscore the importance of making comparisons against

72
similar baseline truthful behaviour, wherever possible, when evaluating the behavioural
responses of individuals suspected of engaging in deception (Hartwig, 2011; Vrij, 2008;
Vrij et al., 2010a).
Differences between Truthful and Deceptive Accounts of Negative Life Events
It was found that, on average, deceptive accounts took a significantly shorter
amount of time to deliver and contained significantly fewer words than truthful accounts.
It also was observed that fabricated accounts involved significantly fewer head
movements than genuine accounts. The first two findings provide some support for
DePaulo and colleagues’ (2003) self-presentational perspective on cues to deceit, which
specifically predicts that liars are less forthcoming than truth-tellers in this manner.
Consistent with the results of meta-analytic reviews (DePaulo et al., 2003; Sporer &
Schwandt, 2006, 2007), and in line with the hypothesis of the present study, were the
relatively small effect sizes that were obtained for these cues.
The remaining coded behaviours (i.e., illustrators, self-manipulations, speech rate,
filled pauses, and self-references) did not differ significantly between the genuine and
fabricated accounts, and these findings run counter to the formulations on cues to deceit
that were summarized earlier (see Buller & Burgoon, 1996; DePaulo et al., 2003; Ekman,
1985/1992; Ekman & Friesen, 1969; Zuckerman et al., 1981).8 No significant interactions
concerning criminal status qualified these particular results, with one exception –
Whereas the deceptive and truthful accounts of students did not differ significantly with
regard to the number of speech pauses, there were significantly fewer speech pauses by
offenders during the delivery of deceptive accounts compared to the delivery of truthful
8 These results, however, may not be entirely relevant to Buller and Burgoon’s (1996) conceptualization because it emphasized interpersonal communication processes, and the present study did not involve ongoing communication between the participants and the experimenter during the experimental tasks.

73
accounts. This finding appears to be consistent with formulations that emphasize the role
of attempted behavioural control (see DePaulo et al., 2003; Zuckerman et al., 1981);
however, it is not known whether offenders specifically believed that speech pauses
represented a cue to deceit and, therefore, consciously tried to minimize them to the point
of overdoing it. For this reason, future research should examine individuals’ beliefs about
cues to deception. On that note, if offenders did hold this particular belief, why wouldn’t
the students? This question will be addressed in the discussion on subtypes, after the
relationships among the aforementioned cues are discussed.
Relationships among Cues to Deceit for Negative Life Events
As hypothesized, substantial correlations were observed among the cues that were
found to differ significantly between the truthful and deceptive accounts. More
specifically, difference scores for the time taken to deliver the accounts and the difference
scores for the number of words spoken were almost perfectly correlated, indicating that
they were measuring the same attribute (i.e., the length of the narratives). The correlation
between difference scores for the time taken to deliver the accounts and difference scores
for the number of head movements was in the large-sized range. The same could be said
for the correlation between difference scores for the number of words spoken and
differences scores for the number of head movements. Additionally, a significant and
medium-sized correlation was observed between difference scores for the amount of time
taken to deliver the accounts and the difference scores for speech pauses. It should be
noted that changes in these behaviours from truth-telling to lying were generally in the
same direction, whether they were increases or decreases. It was only in the case of

74
difference scores for head movements and difference scores for speech pauses that a
statistically significant correlation was not obtained.
These findings also are not particularly surprising given that the behaviours have
been conceptualized as important in the domain of verbal and nonverbal cues to
deception. On this note, it is likely that at least moderately-sized correlations will be
observed among variables if they are part of a theoretical system (Nunnally, 1978). Even
though these results may seem obvious, they are still reported here because the issue of
correlated cues appears to have received very little attention in the literature. As
mentioned in the introduction of this chapter, if moderate and large-sized correlations are
observed among cues, then it could have implications for their practical application.
Problems associated with correlated variables, as they pertain to applied decision-
making, have been raised in other forensic contexts. For example, in relation to the
assessment of risk for future violence, Quinsey, Harris, Rice, and Cormier (2006) drew
attention to the difficulty that some people seem to have with adjusting their predictions
according to interrelationships among various predictor variables. From a practical
standpoint, it was stated that people often assume they are using more information as the
basis for their decisions than is actually the case. Quinsey and colleagues (2006) went on
to state that individuals, therefore, may be willing to make more extreme judgements than
are warranted, and also may have more confidence than is justified.
Otto (2008) made very similar points with regard to evaluations of malingering
and other relevant response styles (also see Rogers & Bender, 2012). More specifically, it
was indicated that, in some assessment contexts, forensic examiners may have numerous
response style measures to select from for use. It was further highlighted that, in some of
75
these circumstances, many instruments are highly related and may yield very similar
results. Otto (2008) emphasized that the preferred approach in such cases is almost
always to use and interpret the results from the single most valid measure instead of using
a number of highly correlated scales or instruments. This was suggested because, with
very few exceptions, use of highly correlated measures of response styles tends to do
little to improve the accuracy of evaluators’ conclusions. On this point, Otto (2008)
stressed that it may even inappropriately increase evaluators’ confidence in these
conclusions. It was qualified, however, that examiners could administer the two best
measures of a given response style if scores on these measures are not highly correlated.
Based on the discussion of these results so far, it may be tempting to conclude that
either decreases in the number of words or decreases in the amount of time taken to
deliver an account should be used as a primary behavioural cue to deception, but not both
variables given the near-perfect correlation observed among them. It also might be
argued that the time taken to provide the account may be the more ideal cue for use given
its relatively larger effect size and the ease with which this variable is measured (i.e.,
transcription of audio/video recordings and counting of words is not required; only a
watch is needed). Additionally, even though decreases in head movements was only
moderately correlated with each of these two variables, one still might argue that this
change does not tap a unique aspect of deception. That is, perhaps the shorter duration of
the deceptive accounts merely led to fewer opportunities for the participants to shake or
nod their heads.
These conclusions and guidelines seem somewhat premature at the present time,
however, given the current state of the knowledge on interrelationships among

76
behavioural cues to deceit. Again, the literature on correlations among cues is relatively
scant. Neither quantitative reviews (DePaulo et al., 2003; Sporer & Schwandt, 2006,
2007) nor qualitative reviews (e.g., Vrij, 2008) have addressed interrelationships. From a
glance at individual studies, this is likely because researchers generally do not report on
interrelationships. Such a practice is unfortunate because large-scale reviews of studies
that report on correlations among cues would inform the field as to which of them
provide unique or redundant information when attempting to discriminate between truth-
tellers and liars. It, therefore, is recommended that researchers begin to systematically
examine and report on these issues. This proposal seems particularly important to follow
because it has been recommended that practitioners rely on multiple cues in their efforts
to detect deception (see, e.g., Vrij, 2008; Vrij et al., 2010a), and the results of a recent
meta-analysis suggested that indicators of deception are manifested in constellations as
opposed to single cues (Hartwig & Bond, 2014). Although it was indicated in this meta-
analysis that deception can be better detected from multiple cues than a single cue, it was
qualified that the strongest cue contributes the most, and interrelationships among cues
were not reported. Until this research is conducted, practitioners ought to be judicious in
their inferences based on multiple cues, especially if they are unaware of the relationships
among them.
Identification of Subtypes: Fluid and Laboured Liars
Are there alternative interpretations for why many of the coded cues did not differ
significantly between the truthful and deceptive accounts, beyond that the formulations
on which they are based are flawed in some way? Do the dominant formulations on cues
to deceit require substantial revisions? Would it be proper to conclude that these

77
formulations lack adequate empirical support and, therefore, should be abandoned
completely? To base such strong conclusions on the results of a single study seems
inappropriate. This appears especially the case in light of the results of several meta-
analyses that have pointed to a number of potentially relevant variables that may
moderate the relationship between the coded behaviours and the veracity of
communications, such as whether the lies were about transgressions or other experiences
(DePaulo et al., 2003; Sporer & Schwandt, 2006, 2007).
More to the comments above, DePaulo and colleagues’ (2003) self-presentational
perspective specifically states that cues to deceit should be faint. This was argued on
account of the observation that people routinely engage in deception in their everyday
lives. On these points, DePaulo et al. (2003) considered many of the nonsignificant
results in their meta-analysis as support for their formulation because they were still in
the expected direction predicted by the self-presentational perspective. These researchers
added that Bond, Kahler, and Paolicelli (1985) made similar arguments from an
evolutionary point of view, suggesting that blatant cues to deceit would have been
recognized by humans long ago and that this would have led evolution to favour more
flexible and less obvious liars.
In a related vein, Ekman (1985/1992) wrote that some lies are executed
beautifully, and that nothing in the deceiver’s behaviour or speech may betray the
deception. He went on to describe a group that he called “natural liars”, individuals who
are able to lie easily and with a great amount of success (Ekman, 1985/1992, p. 57). It
was said that natural liars are aware of their ability, and that they have been getting away
with things, like fooling parents, teachers, and friends, since childhood when they desired

78
to do so. Ekman (1985/1992) elaborated that natural liars feel no detection apprehension
and are confident in their ability to deceive, but stipulated that they are not psychopaths
according to his research. In terms of the ability to control expression, such as facial signs
of feelings, Ekman (1985/1992) asserted that natural liars do so perfectly. Some of them
were described as: likeable, charming, clever and inventive in fabricating, and smooth
talkers with convincing mannerisms.
A number of Ekman’s (1985/1992) views are similar to those of Vrij (2008; Vrij
et al., 2010b) mentioned earlier in this chapter, who indicated that some individuals are
better actors than others and more skilled at regulating their verbal and nonverbal
behaviour. These skills were argued to be of benefit when lying, and imply that
individuals may vary in their overall responsivity to deception tasks. Vrij (2008) also
addressed the possibility that different individuals show different signs of deceit, and that
this would result in no signs of deceit emerging when these individuals are analyzed at a
group level. Consistent with the original hypothesis of the present study, two seemingly
meaningful profiles concerning the behavioural effects of deception were observed when
the difference scores for cues were transformed to z-scores, ipsatized, and submitted to
cluster analysis. A two-cluster solution was retained over solutions of other sizes on
account of both its parsimony and interpretability. Additionally, the two-cluster solution
was empirically superior to solutions of other sizes and outperformed a two-cluster
solution that was obtained using random data, suggesting that the two observed subtypes
were more meaningful than what one would expect among random data.
Fluid liars were characterized by a relative increase in speech rate as well as a
relative decrease in speech pauses when lying in comparison to baseline truth-telling. For

79
fluid liars, there was a relative decrease in the amount of time taken to deliver the
accounts when lying. For fluid liars, there also was a relative increase in smiles when
lying. In contrast, laboured liars were characterized by a relative decrease in speech rate,
as well as a relative increase in speech pauses when lying in comparison to baseline truth-
telling. For laboured liars, there was a relative increase in the amount of time taken to
deliver the account in addition to a relative increase in the number of words spoken when
lying. For laboured liars, there also was a relative decrease in smiles when lying. The
results of this study indicated that speech rate made a relatively large contribution to the
separation of these two groups; however, a two-cluster solution characterizing fluid and
laboured liars was obtained even when speech rate was omitted from the analysis. The
latter finding suggested that the obtainment of this two-cluster solution was not solely the
result of the contribution of speech rate.
Association between Subtypes and Criminal Status
What factors account for the manifestation of these two different subtypes? In the
hope of finding some clues to the answer to this question, demographic variables were
examined to ascertain whether any of them may be correlates. There was no significant
difference in age between the subtypes, and no significant association with the sex of the
participants. There was, however, a significant association between the subtypes and
criminal status, with almost 70% of offenders having been classified as fluid liars and the
rest classified as laboured liars. By contrast, about 42% of students were classified as
fluid liars, and approximately 58% were classified as laboured liars. Based on this finding
alone, one might hypothesize that some other correlate of criminality, such as
psychopathy for example, may be responsible for the result. In addition to being

80
pathological liars, psychopaths also have been described as tending to be smooth, slick,
and verbally facile (Hare, 1991). Maybe this construct accounts for the fluid style of lying
that was observed in the present study? Without access to the offenders’ correctional
files, it was not possible to determine whether there was any relationship between the
subtypes and psychopathy.
While it may be reasonable to hypothesize that psychopaths are more likely to be
characterized as fluid liars than laboured liars, it seems hasty to discount the possibility
that many of them still could be classified as laboured liars. This is because the
identification of subtypes described here relied on comparisons against baseline truthful
behaviour. If psychopaths tend to be smooth, slick, and verbally facile even when they
are telling the truth, then it is still within the realm of possibility that many of them may
display a laboured style of lying if the deceptive task is cognitively challenging enough
and the psychological mechanism underlying the behavioural responses of laboured liars
is predominantly increased cognitive load. On this point, the final chapter of this
dissertation will address the reasons for naming the two subtypes according to the fluid
and laboured behavioural descriptors rather than according to the psychological
constructs that may mediate them (e.g., “attempted behavioural controllers” versus
“cognitively loaded liars”). As will be discussed in the last chapter, even though the
constructs of attempted behavioural control and cognitive load may appear to map well
onto the fluid and laboured subtypes, respectively, there are reasons for withholding the
conclusion that these states/processes are in fact those that primarily govern the
manifestation of the two subtypes.

81
Even if future research were to confirm that psychopaths are more likely to
display a fluid style of lying as opposed to a laboured style, which would be an
interesting finding in and of itself, this would still probably not be the whole story in
terms of accounting for the expression of the two subtypes. It seems unlikely because the
results of the present study indicated that neither fluid liars nor laboured liars were
exclusive to either students or offenders, and the estimated prevalence of psychopathy in
the general population appears too low for it to be the chief factor in explaining whether
students displayed either a fluid or a laboured style of lying. Neumann and Hare (2008)
reported that only 1-2% of individuals in a large and representative North American
community sample evidenced clinically significant levels of psychopathy. Similarly,
Coid, Yang, Ullrich, Roberts, and Hare (2009) estimated that psychopathy affected less
than 1% of the household population in Britain. Thus, other factors are likely to be at
play. For example, again, perhaps some of the more basic and common dimensions of
personality have a role in the manifestation of the two subtypes that were observed here.
Similar arguments could be made for the role of cognitive abilities (e.g.,
intelligence, working memory, or verbal skills) in explaining whether individuals
evidenced either a fluid or a laboured style of lying. At first, one might hypothesize that
perhaps laboured liars had more limited cognitive abilities than fluid liars, which resulted
in their more choppy verbal performance. This hypothesis, however, also would suggest
then that the offenders’ cognitive abilities were superior to those of the students because
they were proportionally more likely to be classified as fluid liars. Although no data were
collected that could speak directly to this issue, it seems unlikely to be the case. This is
not to state that individual differences in cognitive abilities do not have any role in
82
accounting for whether an individual is likely to be classified as either a fluid or laboured
liar when engaging in deception. Rather, like psychopathy, it appears more probable that
cognitive abilities would not fully account for the differences observed among fluid and
laboured liars, but maybe partially so.
On the face of it, it seems that simpler and more general factors are likely to be
responsible for the observed differences between the fluid and laboured liar subtypes,
given that both students and offenders evidenced these styles. For example, perhaps
laboured liars were less confident in their deception skills than fluid liars, which caused
them to struggle more in communicating their deceptive accounts. Or perhaps fluid liars
were more practiced at deception than laboured liars, and that is why their verbal
performance appeared to be somewhat smoother in delivery. Such a hypothesis would
seem to be consistent with the higher likelihood of more extensive and noteworthy
histories of deception among some offenders (e.g., deceitful acts used to carry out crimes
or to avoid culpability for them). Moreover, the offenders also may have had more
experiences than students in dealing with individuals who scrutinized their demeanour in
high-stakes situations, such as police officers, judges and jurors, or parole board
members. These kinds of experiences may have indirectly taught them to avoid some of
the more stereotypic behaviours that liars are believed to exhibit (see DePaulo et al.,
2003; Zuckerman et al., 1981), but did not protect them from overcompensating and
providing accounts that came across as overly smooth and rehearsed. Thus, future
research should examine individuals’ confidence in their deception skills, their emotional
experiences when lying, and potential strategies that they may have employed in addition
to their beliefs concerning cues to deceit.

83
Limitations of the First Study
The general limitations of the research that comprises this dissertation are
discussed more fully in the final chapter. In setting the stage for the second study
described in the next chapter, however, it is worth mentioning that there were some
notable limitations of this first study with respect to its internal validity. That is, even
though efforts were made to exert some control over the types of negative life events that
participants chose to describe, there was a lack of complete control over the event that
was ultimately chosen given the participants’ unique past experiences. Additionally, a
lack of access to collateral sources meant that it was not possible to obtain information
that could verify the veracity of the negative life events that were described. With respect
to generalizability, the findings that were discussed in this chapter may be limited to the
communication of truthful and fabricated accounts of negative life events. Thus, it is
worth establishing whether these results, particularly those pertaining to the subtypes, can
be replicated in studies that employ different methodologies. These, and other issues, are
addressed in the next chapter.

84
CHAPTER 3. STUDY 2:
REPLICATING THE SUBTYPES
The first study in this dissertation involved an examination of uncorroborated
accounts of negative life events. It, therefore, could not be guaranteed that every
participant in the first study was in fact acting truthfully or deceptively when instructed to
do so. It also could be argued that the findings from the first study were an artifact of the
different kinds of negative life events that were described (e.g., medical procedures,
serious accidents, the deaths of loved ones). That is, participants in the first study
ultimately chose the events they wished to discuss, even though they were provided with
some direction in this regard.
The second study in this dissertation sought to replicate the findings from the first
by using a similar within-subjects design; however, participants in this study based their
truthful and deceptive accounts on exposure to the same moderately distressing stimuli in
order to better control the emotional events that formed the basis of their accounts. By
following this procedure, it could be more easily assured that participants were in fact
acting truthfully or deceptively in each respective condition. Such efforts in deception
research are sometimes referred to as establishing the ground truth (Hartwig, 2011; Vrij,
2008). Moreover, because this study represents an even more highly controlled
experiment than the first, a replication of the findings would counter the explanation that
the results of the first study were likely due to different types of negative life events that
were described.
This second study also expanded on the first by having participants complete
several measures of psychological constructs and a manipulation check following their

85
participation in the experiment. With regard to subtyping the behavioural effects of
deceit, having participants complete such measures could assist with elucidating possible
psychological correlates of the subtypes if they were to be observed again. Importantly,
identifying correlates for an outcome is an early but essential step in identifying possible
causes (Kraemer et al., 1997). Following from the discussion of the first study, it was
decided that beliefs about deception, confidence in deception skills, emotional reactions
and strategies employed when lying, and basic dimensions of personality would be
investigated in this second study. Moreover, in addition to ensuring that the experiment
and elements of its design had the intended effects, including a manipulation check could
provide a means for ruling out potential confounding methodological variables that may
be responsible for results.
It should be mentioned that the original hypotheses for the first study were carried
forward to the present study. More specifically, it was hypothesized that: (1) Either small
or no group differences would be observed for the majority of cues investigated; (2) Most
cues would be moderately correlated with one another; and (3) Subtypes would emerge
when difference scores for cues are standardized to z-scores, ipsatized, and submitted to
cluster analysis. With regard to the latter hypothesis, this study specifically sought to
establish whether the fluid liar and laboured liar subtypes could be replicated. Replication
was attempted using a different experimental methodology to examine the
generalizability of the subtypes, and to rule out the possibility that they were a peculiar
artifact of some element of the first experiment.
Of note, the conceptual work of Rogers, Boals, and Drogin (2011) appeared
relevant for generating hypotheses concerning the possible relationship between the
86
subtypes and beliefs about cues to deceit. On this point, the previous chapter highlighted
the potential connection between fluid lying and attempted behavioural control. More
specifically, it was indicated that it was not clear whether fluid liars held common
misconceptions about deceptive presentations, and that their avoidance of exhibiting
stereotypic cues to deceit led them to overcompensating and providing accounts that
came across as overly smooth and rehearsed. Rogers and colleagues (2011) argued that
researchers should investigate whether deceivers are aware of common but mistaken
beliefs regarding honesty, and whether deceivers attempt to apply them to their own
situations. If they do, researchers and practitioners might be able to capitalize on this
phenomenon by developing an “erroneous stereotypes” detection strategy similar to the
one highlighted in the first chapter. Unfortunately, in examining a third of the peer-
reviewed articles included in Sporer and Schwandt’s (2007) meta-analysis, Rogers et al.
(2011) observed that none reported the use of manipulation checks to evaluate
participants’ beliefs or efforts concerning attempted behavioural control. They further
argued that a comprehensive examination of participants’ efforts to control believed cues
would facilitate a greater understanding of mechanisms responsible for empirical results.
Thus, the present study investigated individuals’ beliefs about cues to deception. It was
hypothesized that fluid liars would hold a substantial number of stereotypes concerning
cues, perhaps even more so than laboured liars. Such stereotypic beliefs may have led
fluid liars to manifesting excessive efforts to appear honest, which ultimately became
their own indicators of deceit (i.e., overly smooth accounts). This hypothesis seems
plausible as Rogers and colleagues (2011) have pointed out that beliefs, whether accurate

87
or not, may strongly influence self-presentations and impression management (also see
Barrick, Shaffer, & DeGrassi, 2009).
To account for the behavioural differences between fluid and laboured liars, it is
possible to generate alternative hypotheses to the one presented above. For example, as
discussed in the previous chapter, perhaps fluid liars are more practiced at deception than
laboured liars. That is, maybe their additional practice with deception leads to more
polished deceptive communications, but is not protective against erroneous stereotypes
regarding honesty. Or perhaps fluid liars enjoy engaging in deception more than laboured
liars. The former hypothesis may imply more use of deception that goes undetected by
fluid liars, and the latter may be indicated by more self-reported enjoyment for behaving
deceptively. It also is possible that general strategies, such as trying to maintain a calm
and cool demeanour when lying, may account for some of the observed differences
between the subtypes, and not necessarily a conscious focus on the avoidance of specific
behaviours per se. These possibilities were considered in the current study.
Alternatively, maybe the differences observed between fluid and laboured liars
are a function of confidence in deception skills. That is, maybe laboured liars are less
confident than fluid liars in their abilities to deceive others. Or maybe they experience
greater emotional arousal when lying and, perhaps, greater arousal causes their choppier
verbal performance. It should be noted, however, that this latter explanation seems less
compelling given that anxious arousal is predicted to be associated with faster speech
rate, at least according to Ekman (1985/1992). It seems more reasonable to hypothesize
differences in the degree of perceived difficulty of the deception task, which would
88
reflect differences between the subtypes in cognitive load. Nonetheless, each of these
possible explanations was considered in the present study.
Lastly, in the previous chapter, a possible link between the subtypes and
personality traits was discussed. On this point, Vrij (2008) noted in his comprehensive
review of the deception literature that extraverts appear to lie more frequently than
introverts, even when controlling for the greater number of social interactions that
extraverts engage in. Vrij (2008) also noted that there is some research demonstrating that
extraverts and introverts show different behavioural patterns when lying. For example, he
highlighted that introverts seem to display more speech disturbances than extraverts (see
Siegman & Reynolds, 1983). Given these observations, it was hypothesized that perhaps
introverts are more likely than extraverts to display a laboured style of lying. Having
stated this, each of the basic dimensions of personality was still assessed in the current
study, and not simply extraversion versus introversion alone. That is, all of the “Big
Five” personality traits were examined, which include: extraversion (vs. introversion),
neuroticism (vs. emotional stability), openness to experience (vs. closedness to
experience), agreeableness (vs. antagonism), and conscientiousness (vs. negligence). It is
possible to imagine how each of these dimensions of personality could be related to the
subtypes. For example, perhaps neurotic individuals are more likely to experience fear
and anxiety during the deception task and, thus, are more likely to exhibit a laboured
style of lying than emotionally stable individuals. Maybe negligent and antagonistic
individuals are less likely to be engaged in the experimental tasks and, therefore, are
more likely to display a laboured style of lying on account of poorer preparation. These
possibilities also were explored in the present study.

89
Method
Participants
The sample consisted of another 64 undergraduate students attending a university
in eastern Canada. Their mean age was 21.4 years (SD = 4.0). Forty-six (71.9%)
participants were female. Eighteen (28.1%) participants were male.
Materials
International Affective Picture System (IAPS; Lang, Bradley, & Cuthbert,
1999). The moderately distressing stimuli on which participants based their truthful
accounts were images taken from the IAPS. These pictures were designed to elicit
emotional arousal in experimental settings. IAPS images were chosen because viewing
them represented a safe, laboratory-based analogue of the procedure used in the first
study. The pictures selected for use in the current study, and the respective labels created
for them by this author, were: (a) A riot in progress (IAPS image #2691); (b) The face of
a battered woman (IAPS image #3180); (c) A child running away from a soldier (IAPS
image #6212); (d) The aftermath of a plane crash (IAPS image #9050); (e) A man
pointing a gun at another man (IAPS image #3530); and (f) Two police officers arresting
people (IAPS image #6834).
Participants based their truthful accounts on exposure to only three of the
aforementioned pictures, which were presented to them in a predetermined but
randomized and counterbalanced order. As such, individuals based their deceptive
accounts on exposure to only the labels of the three images that were not presented to
them (also in a predetermined but randomized and counterbalanced order). These pictures
were selected because they have been found to elicit suitable levels of negative emotional

90
arousal and valence according to normative data. These particular images also were
selected because they differed from each other in their pictorial content and labels,
reducing the chance of participants basing their fabricated accounts on an IAPS image
they may have already seen in the truthful condition if they happened to be assigned to
the truthful condition first.
On the point above, it may have been possible for some individuals to rely on
pictures they have seen in the past (e.g., on television, the internet, or in newspapers) to
provide a fabricated account that was coincidentally consistent with the label they viewed
in the experiment. There is no known technology that could prevent such an occurrence
from happening. These occurrences would not jeopardize the validity of any findings,
however. The individuals technically would still be behaving deceptively because the
actual IAPS images were not viewed. Moreover, these scenarios are still a reflection of
some deceptive behaviour in naturalistic settings. That is, in real-world contexts, people
occasionally tell lies that are embedded within partial truths (Vrij et al., 2010a).
Manipulation Check. This brief self-report questionnaire was used to assess
whether elements of the experimental design had the intended effects. For example,
participants rated the pleasantness of the IAPS images they had viewed on a nine-point
Likert scale. They also rated the level of emotional arousal they had experienced when
viewing these pictures or only their labels. Individuals rated the perceived difficulty of
the truthful and deception tasks, as well as the emotional arousal they experienced when
engaged in each task. Two additional questions tapped whether they believed it was
important to maintain a calm demeanour when engaged in the deception task or whether

91
they believed it was important to be animated, energized, or excited, so as not to attract
suspicion. The manipulation check was created by this author.
Demographic Measure. This author-constructed, self-report questionnaire
captured a variety of demographic information. Demographic characteristics that were
assessed included age, sex of the participant, etc. The information was used to
characterize the sample in order to facilitate possible future comparisons of the results
with other studies that may attempt to replicate the findings.
Beliefs About Deception Questionnaire (BADQ; The Global Deception
Research Team, 2006). The BADQ is a 10-item survey that assesses pan-cultural
stereotypes about how liars behave (e.g., liars avoid eye contact). Its items are based on
the results of two worldwide studies involving respondents from 75 different countries
who spoke a total of 43 different languages. The psychometric characteristics of the
measure are unknown; however, it was stated that respondents from 58 countries showed
very strong agreement in the generation of their beliefs about the behaviour of liars, and
the authors reported a Cronbach’s alpha (α) of .98. The survey also included seven
questions pertaining to respondents’ beliefs about their deception abilities, the frequency
of deception, and the demography of deception.
This author developed five additional items that were appended to the end of the
BADQ to assess participants’ self-reported deception abilities, their perception of the
gullibility of others, and whether they enjoyed engaging in deception. More specifically,
participants rated the following items on a nine-point Likert scale, ranging from 1 (Not
true) to 9 (Very true): (i) I could fool a professional lie-catcher (e.g., a police officer); (ii)
Most people are easily deceived; (iii) Most people cannot tell when I am lying; (iv)

92
Everybody lies on occasion; and (v) I enjoy telling lies. These questions were added to
the end of the BADQ to prevent possible contamination of the original measure.
Big Five Inventory (BFI; John, Donahue, & Kentle, 1991). The BFI is a 44-
item self-report measure that taps the “Big Five” personality dimensions: extraversion,
agreeableness, conscientiousness, neuroticism, and openness. Each item is responded to
on a five-point Likert scale, ranging from 1 (Disagree strongly) to 5 (Agree strongly).
The measure is shorter than others that examine the Big Five personality traits, reducing
the possibility of participant fatigue. Although shorter, the questionnaire still examines
the core traits of the Big Five personality dimensions and has demonstrated good
reliability and validity. In the current study, the internal consistency of these personality
scales was found to be generally acceptable. Specifically, Cronbach’s alphas (α) for the
extraversion, agreeableness, conscientiousness, neuroticism, and openness scales were:
.89, .81, .79, .80, and .83, respectively.
Balanced Inventory of Desirable Responding (BIDR; Paulhus, 1991). The
BIDR is a 40-item self-report measure that assesses two forms of socially desirable
responding. More specifically, the instrument contains two 20-item subscales that tap
self-deceptive enhancement (SDE) and impression management (IM). The former scale
assesses individuals’ unconscious tendencies to exaggerate their positive attributes,
whereas the latter scale assesses conscious tendencies to exaggerate positive attributes.
Respondents rate their degree of agreement to each item statement (e.g., I always pick up
my litter) on a 7-point Likert scale. Points are added for each extreme response (6 or 7),
following reversal of negatively keyed items. The instrument also yields an overall
measure of socially desirable responding (SDR) by summing the scores of the SDE and
93
IM scales. The BIDR is a popular instrument for assessing response styles in both
research and clinical/forensic settings, and has evidenced good reliability and validity. In
the current study, the internal consistency of the BIDR scales was found to be generally
on par with previous research. Specifically, Cronbach’s alphas (α) for the SDE, IM, and
SDR scales were .65, .80, and .79, respectively.
Procedure
In the truthful condition, participants viewed three different pictures from the
IAPS as well as their respective labels. They were then asked to provide a single account
concerning a description of the details of these pictures. In contrast, in the deception
condition, participants viewed only the labels for three different pictures from the IAPS.
They were then similarly asked to provide a single account concerning a description of
the details of the pictures that they did not actually view. In this condition, participants
were only able to rely upon brief labels of the images (e.g., “a riot in progress”) to guide
them in their description of the details. The rationale for having individuals describe the
details of three separate images in each account was to prevent the possibility of floor
effects. That is, if each account focused on the details of only a single picture, then the
accounts may have been too short in duration and provided too little opportunity for
observing certain behaviours (e.g., a leaked smile).
The elicitation of truthful and fabricated accounts was counterbalanced across all
participants in an effort to manage order effects. The six images and respective labels
described above also were counterbalanced across all participants to minimize the
potential for obtaining behavioural differences due to the pictorial content that was
described. All stimuli were presented on a computer screen. Each image and its

94
respective label (truthful condition), or each blank screen with only a label (deceptive
condition), was viewed for 60 seconds. Individuals were provided with 60-second breaks
between stimulus viewings in both conditions to rest their eyes.
Prior to viewing the pictures and labels in the truthful condition, participants were
instructed to try to remember as many details as possible about the images presented to
them. They were told that they were being asked to do this because they would later be
instructed to provide a “credible and believable” description of these pictures in as much
detail as possible while being recorded on video. Similarly, prior to viewing only labels
for images in the deception condition, participants were instructed to try to remember
each label. In this instance, however, they were instructed to consider as many pictorial
details as possible that they may lie about having seen that are consistent with the labels.
They were similarly told that they were being asked to do this because they would later
be instructed to provide a credible and believable description of the images that were not
actually shown to them in as much detail as possible. Participants were informed that this
task also would be recorded on video.
Before providing an account, participants were given five minutes alone in an
interviewing room to mentally plan their descriptions. They were informed that they
would not be interrupted or asked questions during the video recording. Participants were
told, however, that the truthfulness of the videos would be evaluated by a registered
forensic psychologist who would be blinded to the conditions from whence the videos
were derived. They were further informed that the psychologist had expertise in detecting
deception. To ensure that all individuals fully understood the requests of them under each
condition, demonstration stimuli for the truthful and deception conditions were presented

95
to each participant prior to their undertaking of the experimental tasks.9 Exposure to
demonstration stimuli was deemed to be particularly important for providing a frame of
reference regarding IAPS images to those participants who were assigned to the
deception condition first.
Participants were administered the paper-and-pencil measures following the
completion of the experimental tasks. Although it could be argued that participation in
the experiment and completion of the questionnaires should have been counterbalanced
across participants, it was still decided to have them complete the measures following
their participation in the experiment. This action was taken to provide the best possible
chance of replicating the results of the first study. More specifically, it was believed that
replication would be best achieved by following a procedure that was highly similar to
that of the first study, which did not involve administration of psychological measures to
participants. It was further believed that the behaviour of some individuals may have
been influenced considerably, particularly during the deception task, if they had
completed certain questionnaires (e.g., BADQ) prior to partaking in the experiment. On
this point, however, it also should be mentioned that participation in the experiment may
have influenced some participants’ responses to the measures. Thus, the results
concerning the questionnaires should be interpreted cautiously with this possibility in
mind.
9 The truthful condition demonstration pictures and labels were: (1) A vicious dog (IAPS image #1300); (2) A Ku Klux Klan rally (IAPS image #9810); and (3) A sinking ship (IAPS image #9600). The deception condition demonstration labels were: (1) A homeless man drinking alcohol; (2) A man and a woman visiting a cemetery; and (3) An addict injecting drugs. These labels corresponded to IAPS image #2750, IAPS image #9220, and IAPS image #2710, respectively. Again, these pictures have been found to elicit negative emotional arousal in research settings according to normative data reported by the IAPS authors. These particular stimuli were used for demonstration purposes because they differed in content from the stimuli used in the actual experiment, reducing the possibility of participants drawing on demonstration stimuli for their deceptive accounts.

96
Each participant was debriefed following completion of the paper-and-pencil
questionnaires. The 10 behaviours reported on in the first study were similarly examined
in this study via the coding of transcripts and videos. To facilitate this, a specific coding
procedure was developed (see Appendix C). As with the first study, a second coder
viewed 20% of the videos to determine the interrater reliability of the observed
behaviours. Correlational analyses indicated that the behavioural measurements were
reliable. Specifically, the Pearson product-moment correlations among raters for the
coded behaviours were as follows: smiles = .92; head movements = .90; illustrators = .98;
self-manipulations = .93; filled pauses = .99; speech pauses = .99; and self-references =
.98.
Results
Manipulation Check Results
During the videotaping, nine participants could not remember one or more of the
six stimuli they were asked to describe. These participants were excluded from the
analysis due to the possibility of them forming a “forgetting” cluster, which could have
obscured the results when attempting to replicate the subtypes observed in the first study.
An additional nine participants were recruited in their place. Each of these participants
was able to complete the experiment without issue.
The experiment appeared to have the intended effects according to participants’
retrospective self-reports on the manipulation check questionnaire. A paired-samples t-
test indicated that participants’ difficulty ratings for the deception task (M = 6.30; SD =
1.73) were significantly higher than their difficulty ratings for the truth-telling task (M =
3.28; SD = 1.89), t(63) = -10.28, p <.001, d = -1.28. A paired-samples t-test also showed

97
that participants’ ratings of the arousal they reportedly experienced during the deception
task (M = 6.23; SD = 1.91) were significantly greater than the ratings of arousal
reportedly experienced during the truth-telling task (M = 4.72; SD = 1.96), t(63) = -7.43,
p <.001, d = -.93. Table 9 indicates that participants’ ratings of the pleasantness of stimuli
viewed in the truthful condition (IAPS images and labels) were lower than the
pleasantness ratings for the stimuli viewed in the deception condition (only labels for
IAPS images). The table also indicates that their arousal ratings for stimuli viewed in the
truthful condition were significantly higher than for stimuli viewed in the deception
condition.

98
Table 9
Comparison of Participants’ (n = 64) Pleasantness and Arousal Ratings for Stimuli
Viewed in the Truthful and Deception Conditions of the Second Experiment.
Order of stimulus
presentation and
quality rated
Truthful condition
(IAPS images)
Deception condition
(Image labels only)
t(63) p d
Stimulus #1
Pleasantness 3.17 (1.38) 3.84 (1.32) -3.20 .002 -.40
Arousal 4.98 (2.04) 4.13 (2.17) 2.77 .007 .35
Stimulus #2
Pleasantness 3.22 (1.21) 3.80 (1.37) -2.60 .012 -.32
Arousal 5.02 (1.69) 4.00 (2.12) 3.90 <.001 .49
Stimulus #3
Pleasantness 3.50 (1.52) 3.81 (1.39) -1.13 .262 -.14
Arousal 5.12 (2.19) 4.16 (2.39) 2.92 .005 .36
Note. Values under the second and third columns are means (and standard deviations).
Values under the sixth column are effect sizes for dependent samples.

99
Search for Outliers
Prior to performing any statistical analyses, the raw data concerning the 10 coded
behaviours were examined for both univariate and multivariate outliers. The same
approach described in the first study for identifying outliers was followed. Again, data
obtained from participation in both conditions were inspected. As with the first study, no
outliers were identified.
Comparing Truthful and Deceptive Accounts of Having Viewed Distressing Images
Paired-samples t-tests were conducted to determine which of the 10 coded
behaviours differed significantly among the truthful and deceptive accounts at the group
level. The results of these t-tests are presented in Table 10. The table shows that there
were significantly more speech pauses in the deceptive accounts than in the truthful
accounts. Differences among the other coded behaviours failed to reach significance
according to the t-tests.10
10 Nonparametric statistical analyses also were conducted to determine whether significant differences existed between the truthful and deceptive accounts. A series of Wilcoxon’s matched-pairs signed ranks tests yielded results consistent with the t-tests.

100
Table 10
Results of t-Tests Comparing Behaviours Coded in Participants’ (n = 64) Truthful and
Deceptive Accounts of Exposure to Moderately Distressing Images.
Behaviour Veracity of account t(63) p d
Truthful Deceptive Difference
Smiles 4.50 (4.63) 4.56 (5.14) .06 (3.72) -.14 .893 -.02
Head movements 203.45 (164.46) 208.11 (183.17) 4.66 (78.11) -.48 .635 -.06
Illustrators 27.52 (32.74) 27.94 (36.70) .42 (16.40) -.21 .838 -.03
Self-manipulation 26.88 (38.44) 27.19 (36.74) .31 (18.59) -.13 .893 -.02
Time (seconds) 134.58 (76.04) 133.22 (81.42) -1.36 (32.26) .34 .737 .04
Words 347.52 (203.54) 341.45 (214.29) -6.06 (100.90) .48 .632 .06
Speech rate 155.09 (21.33) 154.82 (24.49) -.27 (16.38) .13 .897 .02
Filled pauses 16.19 (13.05) 16.45 (13.32) .27 (6.35) -.34 .739 -.04
Speech pauses .20 (.74) .67 (1.82) .47 (1.27) -2.95 .004 -.37
Self-references 5.02 (6.22) 5.25 (4.88) .23 (3.47) -.54 .591 -.07
Note. Values under the second and third columns are means (and standard deviations).
Values under the sixth column are effect sizes for dependent samples.
101
Calculating and Correlating Difference Scores
Difference scores were computed for the 10 coded behaviours to again capture
changes when lying compared to a truth-telling baseline. As with the first study, negative
difference scores indicated decreases in behaviours when lying compared to a truth-
telling baseline, whereas positive difference scores indicated increases in behaviours
when lying compared to a truth-telling baseline. The 10 difference scores for all 64
participants were submitted to correlational analyses to determine the nature and strength
of the relationships among them. The Pearson product-moment correlations obtained
from these analyses are presented in Table 11.

102
Table 11
Pearson Product-Moment Correlations among Difference Scores of Coded Behaviours for Participants (n = 64) Relating Truthful and
Deceptive Accounts of Exposure to Moderately Distressing Images.
Behaviour
1. 2. 3. 4. 5. 6. 7. 8. 9. 10.
1. Smiles
- .16 .19 .29* .40** .41** -.08 .26* .00 .23
2. Head movements
- .45*** .38** .73*** .78*** .20 .48*** .04 .09
3. Illustrators
- .45*** .51*** .57*** .24 .37** .16 .05
4. Self-manipulations
- .28* .42** .19 .23 -.06 .14
5. Time (seconds)
- .91*** .01 .64*** .07 .01
6. Words
- .36** .57*** -.06 .19
7. Speech rate
- -.10 -.18 .30*
8. Filled pauses
- .03 .01
9. Speech pauses
- -.37**
10. Self-references
-
Note. *p < .05. **p < .01. ***p < .001.
102

103
Table 11 shows that some pairs of difference scores were not significantly
correlated, whereas other pairs were significantly correlated to varying degrees.
According to Cohen’s (1992) standards, as summarized in the first study, some
significantly correlated pairs of difference scores evidenced medium-sized relationships.
Other correlated pairs evidenced large-sized relationships. On this point, difference
scores for the time taken to deliver the accounts and the difference scores for the number
of words spoken were almost perfectly correlated.
Almost all of the statistically significant relationships were positive relationships,
indicating that changes from truth-telling to lying for these pairs of behaviours were
generally in the same direction. The exception was the relationship between difference
scores for speech pauses and difference scores for self-references, which evidenced an
inverse relationship. An examination of the relationships among difference scores for
coded behaviours that were found to be significantly different for truthful and deceptive
accounts was not possible because only speech pauses were found to be significantly
different in this regard. On this note, only difference scores for self-references were
found to be significantly correlated with difference scores for speech pauses.
Subtyping Procedures
Cluster analysis was conducted to determine whether individuals again would fall
into different groups, or subtypes, regarding behaviour changes when lying compared to a
truth-telling baseline. The same between-subjects and within-subjects data
transformations that were described in the first study were carried out prior to clustering
profiles in the current study. The former transformation was made to place the raw
difference scores of the coded behaviours on the same scale, and the latter transformation
104
was undertaken to compensate for individual differences in overall responsivity to the
deception task. These computations yielded 10 ipsative z-scores of difference scores for
each participant, with the mean score of each participant over the variables in the profile
being 0.0 and the standard deviation being 1.0.
Identifying the Number of Subtypes. As in the first study, a k-means cluster
analysis was conducted on the 10 ipsative z-scores of difference scores for all participants
with Euclidean distance selected as the distance measure. Two- to five-cluster solutions
were inspected. A two-cluster solution again appeared to be the best on both empirical
and rational grounds. More specifically, the CH Indices for two-, three-, four-, and five-
cluster solutions were: 15.93, 12.98, 10.72, and 10.10, respectively. In other words, a
two-cluster solution evidenced the optimal clustering outcome, as it maximized the CH
Index. The two-cluster solution also was the most parsimonious solution and
demonstrated superior interpretability. Table 12 shows the final cluster means obtained
by the k-means cluster analysis when it was constrained to produce a two-cluster solution.

105
Table 12
Comparison of Fluid and Laboured Liars’ Mean Ipsative Z-scores of Difference Scores
for Behaviours Coded from Truthful and Deceptive Accounts of Exposure to Distressing
Images.
Behaviour Group t(62) p d
Fluid liars
(n = 33)
Laboured liars
(n = 31)
Smiles -.19 (1.10) .31 (.91) -1.95 .056 -.49
Head movements -.11 (.60) -.02 (.87) -.46 .648 -.11
Illustrators -.08 (.87) .04 (.78) -.57 .574 -.14
Self-manipulations .27 (.86) -.25 (.91) 2.36 .022 .59
Time (seconds) -.48 (.58) .40 (.57) -6.03 .000 -1.51
Words -.13 (.57) .08 (.52) -1.51 .137 -.38
Speech rate 1.09 (.94) -.90 (.83) 8.99 .000 2.25
Filled pauses -.61 (.73) .61 (1.04) -5.47 .000 -1.36
Speech pauses -.26 (1.03) -.06 (1.21) -.71 .482 -.18
Self-references .48 (.89) -.20 (.91) 3.00 .004 .75
Note. Values under the second and third columns are means (and standard deviations).
Values under the sixth column are effect sizes for independent samples.

106
Describing the Subtypes: Fluid Liars and Laboured Liars.
Table 12 shows that the first cluster, again named “fluid liars”, comprised 51.6%
of the sample. Fluid liars were characterized by a relative increase in speech rate as well
as a relative decrease in filled pauses when lying in comparison to baseline truth-telling.
For fluid liars, there was a relative decrease in the amount of time taken to deliver the
accounts when lying in comparison to baseline truth-telling. For fluid liars, there also was
a relative increase in self-references and self-manipulations when lying in comparison to
baseline truth-telling.
Table 12 further shows that the second cluster, again named “laboured liars”,
comprised 48.4% of the sample. In contrast, laboured liars were characterized by a
relative decrease in speech rate as well as a relative increase in filled pauses when lying
in comparison to baseline truth-telling. For laboured liars, there was a relative increase in
the amount of time taken to deliver the account in addition to a relative increase in the
number of words spoken when lying in comparison to baseline truth-telling. For laboured
liars, there also was a relative decrease in self-references and self-manipulations when
lying in comparison to baseline truth-telling. As with the first study, a sizable number of
cases were assigned to each cluster, indicating that neither group was characterized by
only one or two outliers. The profiles of the final cluster means for fluid liars and
laboured liars are presented in Figure 6.

107
Figure 6
Profiles of the Relative Behavioural Effects of Deception among Participants Describing
Moderately Distressing Images.
-1.5
-1
-0.5
0
0.5
1
1.5
1 2 3 4 5 6 7 8 9 10
Behaviour
Mea
n Ip
sativ
e Z
-Sco
re o
f D
iffe
renc
e S
core
.
Fluid liars (n = 33) Laboured liars (n = 31)
Note. 1 = smiles; 2 = head movements; 3 = illustrators; 4 = self-manipulations; 5 = time
(seconds); 6 = words; 7 = speech rate; 8 = filled pauses; 9 = speech pauses; 10 = self-
references.

108
Figure 6 illustrates that the profiles of fluid liars and laboured liars again have
different shapes, indicating qualitative differences between the two groups concerning the
relative behavioural effects of deception.
Are the Subtypes Still Meaningful? To determine whether the cluster analysis
obtained solutions that were meaningful, the procedure used by McKillop and Nielson
(2011) that was summarized in the first study was followed again. Global pseudo-F
values for two- to five-cluster solutions were calculated using the data obtained in the
current study. Using this data, the global pseudo-F values for two-, three-, four-, and five-
cluster solutions were: 14.86, 16.53, 11.77, and 11.28, respectively. These global pseudo-
F values were divided by the global pseudo-F values obtained from the randomly-
generated data described in the first study. The resulting ratios for two-, three-, four-, and
five-cluster solutions were: 1.69, 1.74, 2.17, and 1.53, respectively. The finding that these
ratios were all greater than 1.0 indicated that the cluster solutions obtained using data
from the current study were greater than the cluster solutions obtained using randomly
generated data. That is, the cluster solutions obtained using data from this second study
outperformed those that were obtained using random data. This finding indicates that the
solutions obtained using data from the current study were not entirely random, including
the two-cluster solution characterizing fluid liars and laboured liars.
Subtype Validation: Identifying Correlates.
Searching for Potential Demographic Correlates.
An effort was first made to determine whether fluid liars and laboured liars
differed on any demographic characteristics.11 As can be seen in Table 13, a significant
11 For the ethnicity, country of origin, and major area of study variables, some of the categories within these variables had to be combined into an “other” category due to the small numbers of cases in them. This

109
association was found between the subtypes and the sex of the participants. Specifically,
males were significantly less likely to be classified as laboured liars. The results
presented in the table further indicate that the subtypes did not differ on any other
demographic characteristics.
amalgamation allowed for comparisons between fluid liars and laboured liars that did not violate statistical assumptions.

110
Table 13
Comparison of Fluid and Laboured Liars’ Demographic Characteristics.
Variable Group t(62) p d
Fluid liars
(n = 33)
Laboured liars
(n = 31)
or
χ2(64)
or
odds ratio
Age 21.70 (5.03) 21.11 (2.62) .59 .559 .15
Sex (%) 4.28 .039
Male 39.4 16.1 3.39
Female 60.6 83.9 .30
Ethnicity (%) .22 .636
Caucasian 75.8 80.6 .75
Other 24.2 19.4 1.32
Country of origin (%) 1.35 .245
Canada 75.8 87.1 .46
Other 24.2 12.9 2.16
Years in university 2.12 (.92) 2.53 (1.20) -1.54 .130 -.38
Major (%) 1.67 .196
Psychology 48.5 64.5 .52
Other 51.5 35.5 1.93
Note. Values under the second and third columns are means (and standard deviations) for
continuous variables or percentages for categorical variables. For continuous variables,
values under the sixth column are effect sizes for independent samples.

111
Searching for Potential Attitudinal Correlates.
Figure 7 provides a breakdown of participants’ beliefs about how liars typically
behave. These results were based on responses to the first 10 items of the BADQ, and are
presented in the same format used by The Global Deception Research Team (2006). It is
worth pointing out that the most commonly held worldwide beliefs about deceptive
behaviour correspond to the modal responses for items observed in Figure 7. Although
the Global Deception Research Team (2006) obtained a somewhat different rank order of
these 10 items in comparison with the current study, the modal responses to the
individual items were the same across both studies.
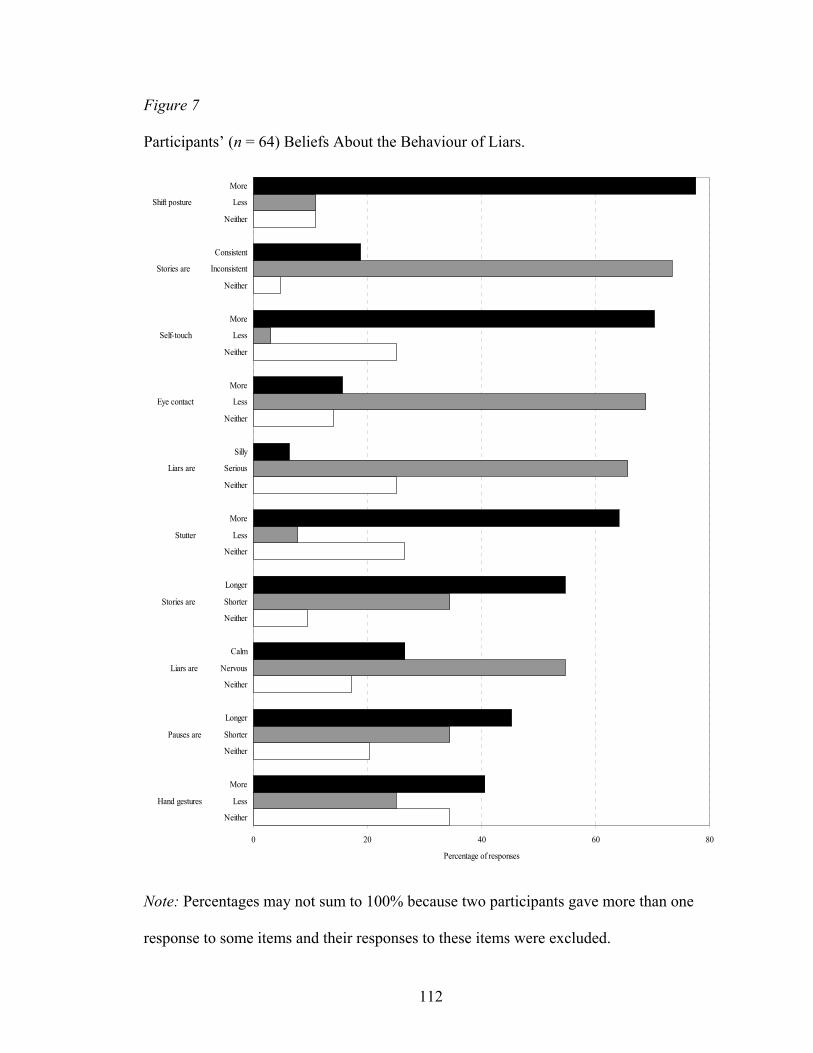
112
Figure 7
Participants’ (n = 64) Beliefs About the Behaviour of Liars.
0 20 40 60 80
Neither
Hand gestures Less
More
Neither
Pauses are Shorter
Longer
Neither
Liars are Nervous
Calm
Neither
Stories are Shorter
Longer
Neither
Stutter Less
More
Neither
Liars are Serious
Silly
Neither
Eye contact Less
More
Neither
Self-touch Less
More
Neither
Stories are Inconsistent
Consistent
Neither
Shift posture Less
More
Percentage of responses
Note: Percentages may not sum to 100% because two participants gave more than one
response to some items and their responses to these items were excluded.
113
Table 14 displays the subtypes’ endorsement of each stereotypical cue to deceit.
As can be seen in the table, a sizable percentage of individuals in each group believed
that these particular behaviours represent cues to deceit. Although there were no
statistically significant differences between the subtypes with respect to endorsement of
the individual cues, the table shows a non-significant pattern of greater endorsement of
these cues by laboured liars. The only exception to this pattern was that more fluid liars
than laboured liars believed that deceivers are nervous. Again, however, this difference
was a non-significant difference.

114
Table 14
Comparison of the Subtypes’ Endorsement of Stereotypical Beliefs About the Behaviour
of Liars.
Stereotypical belief Group χ2(64) p Odds ratio
Fluid liars
(n = 33)
Laboured liars
(n = 31)
Shift posture more 69.7 83.3 1.79 .181 .46
Stories are inconsistent 66.7 80.6 1.60 .206 .48
Self-touch more 60.6 80.6 3.08 .080 .37
Make less eye contact 60.6 77.4 2.10 .147 .45
Are serious 57.6 74.2 1.96 .162 .47
Stutter more 60.6 67.7 .35 .552 .73
Stories are longer 51.5 58.1 .28 .599 .76
Are nervous 57.6 51.5 .23 .632 1.28
Pause longer 42.4 48.4 .23 .632 .79
Make more hand gestures 30.3 51.6 3.01 .083 .40
Note. Values under the second and third columns are percentages.

115
The current study also sought to examine whether fluid and laboured liars differed
with respect to the degree to which they held pan-cultural stereotypes about how liars
behave. This involved tallying for each participant the number of beliefs held that
matched the most commonly held worldwide beliefs reported by the Global Deception
Research Team (2006). By following this approach, each participant received a score
between zero and 10. Interestingly, an independent-samples t-test indicated that laboured
liars held a significantly greater number of stereotypical beliefs about deceptive
behaviour (M = 6.74; SD = 1.88) than did fluid liars (M = 5.58; SD = 2.48), t(62) = 2.11,
p = .039, d = -.53. Of note, this difference represented a moderate effect size according to
Cohen’s (1992) criteria. The results presented in Table 15 indicated that there were no
significant differences between fluid and laboured liars for beliefs concerning the
frequency of deception, their deception-related abilities, the gullibility of others, and
whether they enjoyed engaging in deception. Beliefs concerning the demography of
deception were not examined in the current study given their peripheral relationship to
the research objectives.

116
Table 15
Fluid and Laboured Liars’ Beliefs About the Frequency of Deception, their Deception-Related Abilities, and the Gullibility of Others.
Variable Group t(62) p d
Fluid liars
(n = 33)
Laboured liars
(n = 31)
Number of times per week a typical person lies a 10.14 (10.71) 22.32 (70.93) -.96 .341 -.24
Number of other peoples’ lies detected (out of 10) a 4.06 (2.29) 4.24 (2.00) -.34 .737 -.08
Number of own lies caught by others (out of 10) a 5.39 (2.83) 5.27 (2.89) .17 .867 .04
I could fool a professional lie-catcher (e.g., a police officer) b 2.85 (2.03) 3.13 (2.01) -.55 .581 -.14
Most people are easily deceived b 5.48 (1.86) 5.32 (1.35) .40 .692 .10
Most people cannot tell when I am lying b 4.33 (2.38) 4.32 (1.76) .02 .984 .00
Everybody lies on occasion b 7.70 (2.20) 7.97 (1.17) -.61 .545 -.15
I enjoy telling lies b 2.06 (1.56) 2.71 (2.07) -1.42 .160 -.35
Note. a. Original BADQ item. b. Ancillary item developed by this author (rated on a 9-point Likert scale, ranging from 1 = ‘Not True’
to 9 = ‘Very True’). Values under the sixth column are effect sizes for independent samples.
116

117
Searching for Potential Personality Correlates.
The results presented in Table 16 show that there were no significant differences
between the two subtypes in terms of their personality traits as captured by the BFI. It
should be noted that these results held even when taking acquiescent-related response
styles into account. These response styles included “yea-saying” and “nay-saying”. This
was achieved by ipsatizing BFI items through a procedure described by John, Naumann,
and Soto (2008).

118
Table 16
Comparison of Fluid and Laboured Liars’ Personality Traits.
BFI scale / trait Group t(62) p d
Fluid liars
(n = 33)
Laboured liars
(n = 31)
Extraversion 3.38 (.89) 3.57 (.78) -.87 .390 -.22
Agreeableness 3.98 (.58) 3.77 (.68) 1.33 .187 .33
Conscientiousness 3.59 (.66) 3.70 (.59) -.68 .501 -.17
Neuroticism 2.92 (.74) 2.95 (.68) -.13 .896 -.03
Openness 3.66 (.73) 3.79 (.56) -.76 .453 -.19
Note. Values under the second and third columns are means (and standard deviations).
Values under the sixth column are effect sizes for independent samples.

119
Table 17 summarizes the results of comparisons of BIDR scores for fluid and
laboured liars. As can be seen in the table, there were no significant differences between
the two subtypes concerning the various forms of socially desirable responding. More
specifically, fluid liars and laboured liars did not differ in terms of their tendencies to
engage in self-deceptive enhancement or impression management. These findings counter
the argument that responses on some of the other aforementioned measures (e.g., BFI)
may have been differentially influenced by increased amounts of socially desirable
responding for one of the subtypes.

120
Table 17
Socially Desirable Responding among Fluid and Laboured Liars.
BIDR scale Group t(62) p d
Fluid liars
(n = 33)
Laboured liars
(n = 31)
Self-deceptive enhancement 5.64 (3.05) 5.81 (3.34) -.21 .832 -.05
Impression management 6.09 (3.57) 5.77 (3.47) .36 .721 .09
Socially desirable responding 11.73 (5.24) 11.58 (5.76) .11 .915 .03
Note. Values under the second and third columns are means (and standard deviations).
Values under the sixth column are effect sizes for independent samples.

121
Searching for Methodological Correlates: Ruling Out Confounding Variables.
An attempt was made to determine whether specific methodological variables
were associated with the manifestation of the two different subtypes. The results of this
analysis failed to indicate a significant effect of the order in which the truthful and
deceptive accounts were obtained, χ2 (1, n = 64) = 3.06, p = .080. Of the fluid liars, 39.4%
provided their truthful accounts first and their deceptive accounts second, whereas 60.6%
gave their deceptive accounts first and their truthful accounts second. Similarly, of the
laboured liars, 61.3% provided their truthful accounts first and their deceptive accounts
second, whereas 38.7% delivered their deceptive accounts first and their truthful accounts
second. Table 18 shows that there were no significant associations between the subtypes
and the particular stimuli that were described. These findings counter the argument that
the behavioural differences observed among fluid and laboured liars were likely due to
systematic differences in the pictorial content that was discussed.

122
Table 18
Nature of the Stimuli Described by Fluid and Laboured Liars.
Stimulus and veracity Group χ2(64) p OR
Fluid liars
(n = 33)
Laboured liars
(n = 31)
A riot in progress .06 .802
Truthful 51.5 48.4 1.13
Deceptive 48.5 51.6 .88
The face of a battered woman .56 .453
Truthful 54.5 45.2 1.45
Deceptive 45.5 54.8 .69
A child running away from a soldier .06 .802
Truthful 48.5 51.6 .88
Deceptive 51.5 48.4 1.13
The aftermath of a plane crash .56 .453
Truthful 45.5 54.8 .69
Deceptive 54.5 45.2 1.45
A man pointing a gun at another man .06 .802
Truthful 48.5 51.6 .88
Deceptive 51.5 48.4 1.13
Two police officers arresting people .06 .802
Truthful 51.5 48.4 1.13
Deceptive 48.5 51.6 .88Note. OR = odds ratio.

123
The results presented in Table 19 show that there were no significant differences
between the two subtypes with regard to the perceived difficulty of the truthful and
deception tasks. The same finding was obtained for retrospective ratings of the perceived
emotional arousal experienced during these tasks. Fluid and laboured liars did not differ
significantly in their beliefs concerning self-presentation during the deception task.
Specifically, there was no significant difference between the subtypes in the belief that it
was best to maintain a calm or cool demeanour during the deception task, so as not to
attract suspicion. Moreover, there was no significant difference between the groups in the
belief that it was best to act animated, energized or excited during the deception task.

124
Table 19
Fluid and Laboured Liars’ Ratings of the Perceived Difficulty of the Experimental Tasks, Emotional Arousal Experienced During the
Experimental Tasks, and Beliefs Concerning Self-Presentation During the Deception Task.
Variable Group t(62) p d
Fluid liars
(n = 33)
Laboured liars
(n = 31)
Difficulty ratings for the truth-telling task a 3.45 (1.91) 3.10 (1.89) .75 .453 .18
Emotional arousal ratings for the truth-telling task b 4.67 (2.27) 4.77 (1.61) -.22 .829 -.05
Difficulty ratings for the deception task a 6.30 (1.83) 6.29 (1.66) .03 .977 .01
Emotional arousal ratings for the deception task b 6.33 (2.04) 6.13 (1.78) .43 .672 .10
Thought it was best to keep a calm or cool demeanour to not attract suspicion c 6.12 (2.13) 6.19 (1.74) -.15 .883 -.04
Thought it was best to be animated, energized or excited to not attract suspicion c 3.21 (1.88) 3.61 (1.91) -.85 .401 -.21
Note. a. Rated on a 9-point Likert scale, ranging from 1 = ‘Easy’ to 9 = ‘Difficult’. b. Rated on a 9-point Likert scale, ranging from 1 =
‘Calm’ to 9 = ‘Aroused’). c. Rated on a 9-point Likert scale, ranging from 1 = ‘Not True’ to 9 = ‘Very True’. Values under the second
and third columns are means (and standard deviations). Values under the sixth column are effect sizes for independent samples.
124

125
Discussion
Before discussing the main findings of the second study, it is worth highlighting
again that the experiment appeared to have the intended effects according to participants’
responses on the manipulation check. Student participants perceived fabricating accounts
of having viewed moderately distressing images to be significantly more difficult than
truthfully describing moderately distressing pictures that they were actually shown. This
finding is in line with both past and current views that deception can be more taxing
cognitively than telling the truth, given the increased demands on the deceiver (e.g.,
formulating the lie, considering its plausibility, controlling one’s demeanour, monitoring
the reactions of observers for signs of doubt, etc.) (Vrij, 2014; Vrij et al., 2013;
Zuckerman et al., 1981). The students also reported experiencing significantly more
emotional arousal during the deception task, which was consistent with several of the
perspectives summarized previously (e.g., Ekman, 1985/1992, Ekman & Friesen, 1969;
Zuckerman et al., 1981). With respect to the validity of the stimuli employed, participants
rated the negatively-charged pictures, on which their truthful accounts were based, as less
pleasant than the stimuli that were viewed in the deception condition (i.e., blank screens
with image labels only). Additionally, their ratings of arousal concerning these pictures
were significantly higher than ratings of arousal for the stimuli that were viewed in the
deception condition. These findings provide some empirical support for the internal
validity of the second experiment, at least according to participants’ responses on the
manipulation check. It should be noted, however, that these responses were retrospective
in nature, and some retrospective assessments may be vulnerable to bias.

126
Differences between Truthful and Deceptive Accounts of Distressing Images
The results of the second study indicated that, on average, deceptive accounts
involved significantly more speech pauses than truthful accounts. Consistent with the first
hypothesis was the small effect size that was obtained for this difference. This finding
also is consistent with several of the formulations on cues to deceit that were summarized
in the second chapter, but most notably with the formulations of Zuckerman et al. (1981)
and Ekman (1985/1992). More specifically, these conceptualizations described the utility
of cognitive effort/thinking cues for detecting deception.
There were no significant differences between the truthful and deceptive accounts
for the nine other coded behaviours. These findings also are consistent with the first
hypothesis that small or no group differences would emerge for the cues investigated, and
are generally consistent with the results of the meta-analytic investigations that have been
highlighted throughout this manuscript (DePaulo et al., 2003; Sporer, & Schwandt, 2006,
2007). Notably, these particular results again run counter to the major conceptualizations
on cues to deceit. Several possible explanations for such findings have been put forth by
leading researchers in the field. The previous chapter already summarized some reasons
for why behavioural cues to deceit may be faint according to evolutionary and the self-
presentational perspectives (Bond et al., 1985; DePaulo et al., 2003). Additionally, it has
been pointed out that many lies are executed flawlessly (Ekman, 1985/1992). But how
does one reconcile the discrepancy between the results of the first study and the results of
the second study? For example, why would significant differences between truthful and
deceptive accounts emerge in the first experiment but not in the second for the amount of

127
time taken to deliver the accounts, the number of words spoken, and the number of head
movements? This matter will be addressed in the final chapter of the dissertation.
Relationships among Cues to Deceit for Having Viewed Distressing Images
Consistent with the second hypothesis, and in line with the results of the first
study, were the substantial correlations observed among many of the difference scores for
the coded behaviours. Considering the relationships among difference scores for cues that
were found to differ significantly between the truthful and deceptive accounts in the
current study was not possible because only speech pauses were found to differ
significantly in this regard. Although difference scores for self-references were found to
correlate significantly with difference scores for speech pauses, self-references did not
emerge as a cue to deceit at the group level in this experiment. How might researchers
and practitioners cope with inconsistencies in the results of studies that examine
correlations among cues to deceit? This issue also will be discussed in the final chapter.
Replication of Subtypes: Fluid and Laboured Liars
A two-cluster solution characterizing fluid and laboured liars was observed again
when difference scores for cues were standardized to z-scores, ipsatized, and submitted to
cluster analysis. This finding was consistent with the third hypothesis of the present study
and the results of the previous experiment. Fluid liars exhibited a relative increase in
speech rate as well as a relative decrease in filled pauses when lying in comparison to
baseline truth-telling. For fluid liars, there was a relative decrease in the amount of time
taken to deliver the accounts when lying. For fluid liars, there also was a relative increase
in self-references and self-manipulations when lying. In contrast, laboured liars displayed
a relative decrease in speech rate as well as a relative increase in filled pauses when lying

128
in comparison to baseline truth-telling. For laboured liars, there was a relative increase in
the amount of time taken to deliver the account in addition to a relative increase in the
number of words spoken when lying. For laboured liars, there also was a relative
decrease in self-references and self-manipulations when lying. As with the first study,
this two-cluster solution appeared to be the best on both empirical and rational grounds.
Also consistent with the first study was the finding that the obtained solutions were more
meaningful than what one would expect among random data, including the two-cluster
solution characterizing fluid and laboured liars.
Although fluid and laboured lying profiles emerged in both experiments, the keen
observer may have noticed that the profiles for each subtype were not exactly the same
across both experiments. For example, some cues that differentiated the subtypes in the
first experiment did not do so in the second experiment, and vice versa. How does one
make sense of these differences? Again, discussion of discrepancies between the results
of the two studies will be saved for the final chapter of this dissertation.
Subtype Correlates: Sex Differences and Beliefs about Cues to Deception
A significant association was found between the subtypes and the sex of the
participants, with men being less likely to be classified as laboured liars. This was the
only demographic variable on which the subtypes differed significantly. It may be
tempting to begin generating explanations for why men tended to display a fluid style of
lying over a laboured style. For example, given that there is some evidence suggesting
that adolescent boys appear to be more likely than girls to use deception in order to obtain
dates (Eyre, Read, & Millstein, 1997), one might hypothesize from an evolutionary
perspective that a smooth style of lying may have some advantages with regard to

129
reproduction goals. Alternative explanations also might be generated from the
perspective of gender roles and socialization. It should be remembered, however, that a
significant association between the subtypes and the sex of the participants was not found
in the first experiment. In other words, the association observed here could have been
spurious, so future attempts at replicating the finding seem warranted. Additionally,
whether fluid and laboured lying represent state- or trait-like characteristics should be
first established.
The present study also examined the relationship between the subtypes and the
degree to which they held pan-cultural stereotypes about how liars behave (e.g., liars
make less eye contact, stutter more, pause longer, etc.). Of note, the most commonly held
worldwide beliefs about deceptive behaviour corresponded to the modal responses given
by the students in the current study (see Global Deception Research Team, 2006). As
hypothesized, fluid liars held an appreciable number of supposedly stereotypical beliefs
concerning cues. More specifically, as a group, they held an average of more than five of
the 10 beliefs reported by the Global Deception Research Team (2006). This finding
provides some support for Zuckerman and colleagues’ (1981) formulation of deceptive
behaviour emphasizing attempted behavioural control. Indeed, if fluid liars held no
stereotypic beliefs about deceit, then attempted behavioural control would seem to be a
less likely candidate for the mechanism underlying their overly polished accounts. This is
because the formulation specifically predicts that those engaged in attempted behavioural
control hold erroneous stereotypes about honesty and how liars behave.
Contrary to expectations, it was found that laboured liars held a significantly
greater number of stereotypical beliefs regarding deceptive behaviour compared to fluid

130
liars. More precisely, laboured liars, as a group, held an average of almost seven of the 10
stereotypical beliefs documented by the Global Deception Research Team (2006). Again,
this difference between subtypes represented a moderately large effect size. There are
several different conceivable explanations for the result. For example, in holding a
greater number of stereotypical beliefs, perhaps laboured liars were more vulnerable to
self-fulfilling prophecies consistent with how liars are believed to behave. Indeed, both
accurate and inaccurate beliefs may strongly influence self-presentations (Barrick,
Shaffer, & DeGrassi, 2009; Rogers et al., 2011). Or, in holding fewer stereotypical
beliefs, perhaps fluid liars were less prone to demand characteristics of how they thought
the experimenter may have wanted them to behave. Probably the simplest explanation,
however, has to do with the ordering of participation in the experiment and the
completion of self-report measures. That is, in view of their deceptive performance,
which seemed to be consistent with the apparent stereotypical belief that liars tend to
struggle with delivering their accounts (also see Hartwig & Bond, 2011), laboured liars
may have endorsed a greater number of such beliefs. This explanation is concordant with
Bem’s (1972) self-perception theory, which states that individuals come to know their
beliefs partially through inferring them from observations of their own behaviours or
situations in which the behaviours occur. For this reason, future research should examine
the relationship between beliefs and deceptive behaviours longitudinally. For example, it
would be interesting to know whether a similar or a different relationship emerges
between the subtypes and stereotypical beliefs when the beliefs are measured in the week
or month prior to participating in a comparable experiment. Having stated this,
researchers could still measure these beliefs after participation in an experiment to gauge

131
whether and how they change. Moreover, future research also should examine whether
participants endorse making a conscious effort to control specific cues, as this data was
not collected in the present study and the pattern observed between the subtypes and
specific stereotypical beliefs about cues was non-significant. Such data might facilitate a
greater understanding of the mechanisms underlying the manifestation of the subtypes,
particularly those of fluid liars.
There did not appear to be convincing data to support the hypothesis that fluid
liars were more practiced at deception than laboured liars. There was no significant
difference between the two subtypes with respect to the number of times they were
reportedly detected when behaving deceptively. It should be noted though that the
frequency with which these two groups lied was not assessed. The same could be said for
confidence in the ability to deceive others, as no significant differences were observed in
terms of self-reported deception skills. The subtypes also did not differ significantly in
their views on the gullibility of others, or whether they enjoyed engaging in deception.
Further, the differences between subtypes did not appear to be attributable to more global
strategies concerning the management of self-presentations, such as trying to maintain a
calm and cool demeanour while lying or acting animated, energized, or excited so as not
to attract suspicion. It should be mentioned, however, that the present study was
somewhat limited in measuring these particular constructs. That is, most of them were
assessed via responses to only one or two questions, and individual items may be prone to
error. Thus, further development of psychometrically sound measures of these constructs
could be useful and may yield different results.

132
The perceived difficulty of the experimental tasks was not significantly different
for fluid and laboured liars. Nor was the self-reported emotional arousal experienced
during these tasks. Although these findings seem to undermine the supposition that the
mechanisms underlying laboured lying are cognitive load and/or emotional arousal, it
may have been that fluid liars coped with these states/processes in a different way. For
example, even though all participants were given time to mentally plan and rehearse their
accounts, perhaps fluid liars did so to a greater degree than laboured liars, and this is what
led to their overly smooth accounts. Greater effort, in turn, may have been a function of
more engagement or interest in the experimental tasks. Because these variables were not
assessed in the present study, future research should examine them via manipulation
checks. That is, investigators could ask participants whether they actually used the
allotted time to mentally plan and rehearse their accounts or whether they gave them “off-
the-cuff”. Similarly, experimenters could query whether individuals did not try hard, tried
a little bit, gave a good effort, or really tried to do their best during each task. Likert
scales also could be developed to tap subjects’ interest in the experimental tasks, as well
as their levels of motivation in each condition.
With regard to the possible role of personality traits, the study results failed to
indicate any significant differences between the subtypes and the “Big Five” dimensions
of personality. Importantly, these results held even when compensating for acquiescent-
related response styles (i.e., “yea-saying” or “nay-saying”). Moreover, there were no
significant differences between the subtypes concerning various forms of socially
desirable responding, countering the argument that responses on the other
aforementioned measures may have been differentially influenced by increased amounts
133
of socially desirable responding for one of the subtypes.12 Given that a relatively short
instrument was used to assess these broad personality dimensions, future studies could
examine whether differences emerge when more comprehensive measures are used. For
example, those instruments that simultaneously tap the more narrow facets of the “Big
Five” personality traits could be employed. Researchers also may wish to focus on other
individual differences that could play a role in the manifestation of the subtypes. For
example, while it was argued in the second chapter that psychopathy, diagnosed
categorically, would be unlikely to fully account for the differences observed between the
subtypes, subclinical psychopathy may play a more prominent role when measured
continuously, such as by instruments that tap the “Dark Triad” of personality (Paulhus &
Williams, 2002).
Lastly, an effort was made to determine whether the subtypes may have been a
product of confounding methodological variables. Interestingly, the results failed to
indicate a significant effect of the order in which the truthful and deceptive accounts were
obtained. Similarly, there were no significant associations between the subtypes and the
particular stimuli that were described. This latter finding suggests that the behavioural
differences observed between the subtypes were not specifically due to systematic
differences in the pictorial content that was discussed. Collectively, these findings also
12 It is recognized, however, that the ideal scenario would have been for each instrument to have its own embedded measures of relevant response-styles because individuals may distort their answers on one instrument but not on another (Otto, 2008). Moreover, it is acknowledged that irrelevant (e.g., random) responding and exaggeration of difficulties, such as those related to neuroticism, were not directly assessed in the present study. Incidence of the latter response style is likely to have been low in the current research context, however, because there would have been very little to gain from exaggerating difficulties. With regard to the former response style, some steps were taken to screen for random responding. For example, the experimenter made an effort to identify whether the self-report measures were completed in an unusually short amount of time. Of note, there were no instances of this occurring.

134
counter the argument that the results of the first study concerning the subtypes were
likely due to confounding methodological variables.
Limitations of the Second Study
Probably one of the greatest limitations of the current study was its correlational
design regarding examination of the relationships between the subtypes and the
constructs that were assessed via self-report measures. The reader should remember,
however, that the primary objective of this study was to establish whether the subtypes in
the first study could be replicated in the context of a more highly controlled experiment.
Discovering correlates of the subtypes in order to identify clues as to the causal
mechanisms that may be underlying them was more of an ancillary objective. It was for
this reason that participation in the experiment and completion of the measures was not
counterbalanced across participants, as some of these measures could have unduly
influenced the behaviour of individuals who completed them prior to participating in the
experiment. Having stated this, now that the subtypes appear to have been replicated after
having followed similar procedures to those employed in the first study, counterbalancing
participation in experiments with completion of measures in studies that investigate these
matters further seems more permissible. That is, so long as investigators still attempt to
gauge the impact of this methodological variable.
The correlational aspect of the present study identified some clues as to possible
factors underlying the subtypes. Like all correlational findings, they must be interpreted
with caution. Indeed, other factors that may be responsible for the results were
highlighted in the previous section, as well as in the discussion section of the second
chapter. Recommendations were made concerning other variables that should be assessed
135
via manipulation checks, which could be responsible for the results. But researchers need
to not stop there. In some cases, it may be possible to manipulate variables directly in
order to determine whether they have a causal role in the manifestation of the subtypes.
For example, in the previous section it was hypothesized that perhaps fluid liars made
more use of their allotted time to mentally plan and rehearse their accounts. In a follow-
up study, a researcher could test this hypothesis directly by not only having participants
tell the truth and lie but also randomly assign half of all participants to a condition in
which they practice their accounts with a confederate and the other half of participants to
a condition in which they are left to their own devices. If the above hypothesis is correct,
a greater proportion of fluid liars would be expected to emerge when participants are
encouraged to practice their accounts with a confederate than when they are not. As
another related example, a researcher could provide half of all participants with a list of
the stereotypical beliefs regarding deception cues, and inform them that observers will be
likely to use them in judging the truthfulness of their accounts (“coaching” condition).
The remaining half of participants could receive no such information (control condition).
If attempted behavioural control plays a causal role in fluid lying then a greater
proportion of fluid liars would be expected in the coaching condition.
Like the discussion that followed the first experiment, this discussion section
highlighted some of the limitations that were specific to the current study. Again, many
recommendations for future research were made. These recommendations, however, were
tailored to testing and clarifying the ideas that were reported here. Limitations that apply
to both of the studies that comprise this dissertation research (e.g., issues pertaining to
external validity) will be discussed in the next and final chapter. The last chapter also will

136
outline general recommendations for future research on the topic of subtyping the
behavioural effects of deceit.

137
CHAPTER 4. GENERAL DISCUSSION
The purpose of this dissertation was to determine whether people could be
grouped in meaningful ways with regard to similar verbal and nonverbal behaviour
changes when comparing lying to a truth-telling baseline. Two experimental studies were
conducted to meet this objective. The first study involved an analysis of behavioural cues
to deceit measured in a sample of undergraduate students and incarcerated male criminal
offenders who provided both truthful and fabricated accounts of negative life events. The
second study addressed the methodological limitations of the first. It involved an analysis
of the same behavioural cues measured in a sample of undergraduate students who
provided truthful and deceptive accounts of exposure to the same moderately distressing
images. This second study was conducted to better control the events that formed the
basis of the accounts and establish the ground truth of the matters discussed (Hartwig,
2011; Vrij, 2008). The behaviours examined in both studies were considered to be a
representative sampling of those that are believed to be relevant in the domain of
deception cues (Buller & Burgoon, 1996; DePaulo et al., 2003; Ekman, 1985/1992,
Ekman & Friesen, 1969; Zuckerman et al., 1981). These cues included: the number of
smiles; number of head movements; number of illustrators; number of self-
manipulations; number of words spoken; the length of the response in seconds; speech
rate; the number of filled pauses; number of silent pauses; and the number of self-
references in the accounts. In addition to providing a summary of the general findings
from these studies, this final chapter addresses the possible broader implications of the
results for theory and research concerning deception. It also addresses the potential
implications of the findings for the practice of deception detection. Limitations applicable
138
to both studies are discussed, and recommendations for future research are provided
throughout.
Summary of General Findings
Results Consistent Across Both Studies.
Small or No Group Differences for Cues to Deception.
Based on the results of meta-analytic reviews (DePaulo et al., 2003; Sporer, &
Schwandt, 2006, 2007), it was hypothesized that either small or no group differences
would be observed for the cues investigated. This indeed was the case in both studies. In
the first study, deceptive accounts of negative life events, on average, involved fewer
spoken words, were shorter in duration, and were associated with fewer head movements
than truthful accounts. These findings provided some support for DePaulo and
colleagues’ (2003) self-presentational perspective on cues to deceit, which specifically
predicts that liars are less forthcoming and tell less compelling tales than truth-tellers.
The other coded behaviours did not differ significantly between the genuine and
fabricated accounts when the student and offender samples were examined together;
however, a significant interaction concerning criminal status was found for speech
pauses, which will be discussed in a later section.
In the second study, deceptive accounts of having viewed moderately distressing
images involved significantly more speech pauses than truthful accounts. As with the first
study, a small effect size was obtained for this difference. The finding provided some
support for Zuckerman et al.’s (1981) and Ekman’s (1985/1992) conceptualizations,
which originally described the utility of cognitive effort and thinking cues for detecting

139
deceit. Again, there were no significant differences between the truthful and deceptive
accounts for the remaining coded behaviours.
Some researchers have provided possible explanations for why significant
differences are unlikely to be obtained for cues, or why they may be small differences at
best. For example, some theorists have suggested that individuals are so practiced at
deception as a result of having engaged in it so regularly in their day-to-day lives that
only faint cues are likely to be observed (DePaulo et al., 2003; Hartwig, 2011). Others
have suggested that evolution would not have favoured blatant cues to deceit (Bond et al.,
1985). And still others have pointed out that many lies are executed flawlessly, choosing
to emphasize the talents of natural performers instead (Ekman, 1985/1992). Might there
be alternative explanations to these ones?
Although interpreting null results may be difficult, they may be informative when
obtained in the context of rigorous investigations. It would seem inaccurate to conclude
that null results were obtained here because the studies conducted did not measure up
with regard to quality or purpose. Indeed, having individuals tell the truth and lie about
personal attitudes or facts (e.g., negative life events) are popular paradigms used by
deception researchers, as is having individuals lie and tell the truth about images that they
may or may not have seen. Of note, these paradigms were the top two paradigms used by
deception researchers according to the most extensive meta-analysis of cues conducted to
date (DePaulo et al., 2003). Moreover, the studies conducted were exceptional with
respect to the number of participants that were recruited. On this point, DePaulo and her
colleagues (2003) reported an average sample size of approximately 42 participants for
the studies that were included in their large-scale review. In other words, the experiments

140
that comprised this dissertation research involved one-and-a-half times as many
participants found in the average deception study. Moreover, they both employed the
more powerful within-subjects design, with careful attention to counterbalancing of
conditions and stimuli.
Given the high levels of interrater reliability that were attained for independent
coders, it also seems unlikely that null results were obtained on account of measurement
issues regarding the dependent variables. Of note, some of these coders were kept blind
to the study purposes, conditions, and hypotheses. However, it could be argued that
examining interrater reliability via use of more conservative statistics, such as kappa, may
lead to further improvement in the measurement of behavioural cues to deceit and
thereby enhance the validity of empirical investigations. Although it is possible that some
of the results of the first study may have been partially attributable to confounding
variables, and corroborating data were lacking to verify the veracity of the accounts
provided, the first study was stronger than the second with respect to external validity.
Conversely, even though the second study may have been relatively weaker with regard
to external validity, it addressed methodological issues relating to the internal validity of
the first experiment (e.g., establishing the ground truth of the matters). Additionally, the
second study also made use of demonstration conditions and manipulation checks to
ensure that participants understood instructions, and to show that the experiment indeed
had the intended effects (e.g., the deception task was more difficult than the truthful task
and caused more emotional arousal, stimuli used in the truthful condition were less
pleasant and caused more arousal than stimuli used in the deception condition). What is
more, the second study required participants to describe multiple images in each

141
condition to combat the potential of being hampered by floor effects for the dependent
variables. Thus, the adequacy of the manipulations does not seem to be a compelling
reason for the null results. Lastly, to criticize these studies via attacks on the field of
deception research in general for imprecisely conceived formulations or slipshod
experimental methods would definitely not be criticisms shared by all. Notably, senior
researchers and experts who have achieved a great deal of success in the related field of
detecting deceptive response styles in clinical/forensic settings have commended general
deception researchers for the experimental rigor with which many of their investigations
have been conducted, and for the links that they have drawn between theoretical
formulations, research, and practice (see, e.g., Rogers, 2008f). Prominent memory
researchers also have expressed such positive views (see, e.g., Loftus, 2011).
Fluid and Laboured Liar Subtypes and the Robustness of Speech Rate.
So if small differences and null results are not entirely the product of the
frequency with which people engage in deception, evolutionary processes, natural
performers, or poorly designed studies, then what other contributing factors might there
be? Vrij (2008) addressed the possibility that each individual does show clear signs of
deceit, but that different individuals may show different signs. It was said that this might
result in no signs of deceit emerging when these individuals are analyzed at a group level.
There was some evidence obtained from both studies to support these ideas. As
hypothesized on the basis of anecdotal observations, two seemingly meaningful profiles
concerning the behavioural effects of deception were observed in each study when the
difference scores for cues (deceptive minus truthful) were transformed to z-scores,
ipsatized, and submitted to cluster analysis. A two-cluster solution appeared to reflect

142
qualitative differences between the subtypes and was retained over solutions of other
sizes in both studies on account of its parsimony and interpretability. Further, in each
study, the two-cluster solution was empirically superior to solutions of other sizes and
outperformed a two-cluster solution that was obtained using randomly generated data,
suggesting that the two observed subtypes were more meaningful than what one would
expect among random data. These findings were of relevance because good cluster
solutions are determined, in part, by a reasonable number of homogenous clusters and
their interpretability (Norusis, 2011).
More specifically, fluid liars and laboured liars were observed across both studies,
and were named as such to reflect their salient differences in speech disturbances. Most
prominent were the robust differences and relative changes in speech rate that were
observed in both studies. Fluid liars exhibited a relative increase in speech rate when
comparing lying to a truth-telling baseline. By contrast, laboured liars showed a relative
decrease in speech rate. Of note, this particular cue appeared to be the most sensitive to
the experimental manipulations according to the rank order of scores and profile shapes
of the subtypes (Nunnally, 1978).
Psychological Factors Underlying Subtype Expression?
Given that the constructs of attempted behavioural control and cognitive effort
(Zuckerman et al., 1981) appear to map fairly well onto the fluid and laboured liar
subtypes respectively, one might rightfully ask why the subtypes were not named
according to these constructs. For example, why not call them “attempted behavioural
controllers” and “cognitively-loaded liars”? A decision was made to name them
according to concrete behavioural descriptors because neither study yielded unequivocal

143
evidence that the aforementioned constructs were in fact those that govern the
manifestation of the subtypes, even though some indirect evidence was obtained. More
specifically, further research is required to demonstrate that these states/processes have a
causal role in subtype expression beyond inferring them from the correlates that will be
summarized later. On these points, the previous chapter provided some suggestions for
how investigators may demonstrate causal status. For example, in a similar experiment, a
researcher could include additional conditions in which some participants are “coached”
on stereotypical cues to deceit that may be used to detect their lies, while other
participants receive no such coaching. An observed association between coaching and
fluid lying would provide some causal evidence for the role of attempted behavioural
control in fluid lying. Similarly, researchers could add additional conditions in which
some participants are required to provide their accounts in reverse chronological order
with respect to the events that are discussed, while others are not (see, Vrij, 2014; Vrij &
Granhag, 2012; Vrij, Leal, Mann, & Fisher, 2012; Vrij et al., 2008, 2010a; 2011, 2013).
An observed association between laboured lying and recalling events in reverse
chronological order would provide some support for the causal role of cognitive effort in
laboured lying.
It should be mentioned, however, that other factors may be responsible for the
differences observed among the subtypes, which also is why they were not named
according to the constructs highlighted above. For example, in the previous chapter, it
was hypothesized that perhaps fluid liars and laboured liars made different use of their
time in mentally planning and rehearsing their accounts, with fluid liars over-preparing
and laboured liars under-preparing. In other words, differences in preparation may
144
account for the differences observed between the subtypes, and not necessarily the
conscious control of behaviours per se. Differences in preparation also may reflect other
variables, such as interest in the tasks or motivation to succeed at them. To address this
possibility, future studies could involve some participants sharing their planned accounts
with a confederate before providing them, while others are left to their own devices. An
observed association between fluid lying and greater planning and preparation via the
assistance of a confederate would provide some causal evidence for this factor. Because
the manipulation check that was used in the second study did not assess the self-reported
motivation of participants in each condition or their interest in the experimental tasks, no
data are available to speak to these issues and they should be queried via manipulation
checks in future investigations. Another relevant factor that researchers should consider
investigating is whether the fluid style of lying reflects a “get it over with” approach to
deception, which also may account for the observed differences between the subtypes. In
sum, additional experimental and correlational evidence is needed to elucidate the causal
mechanisms involved in subtype expression before they are renamed to reflect more
abstract psychological constructs.
The Need for Better Measures of Constructs Related to Deception.
Collectively, these findings raise the question of how deception researchers can be
sure that they are actually measuring the constructs that they purport to be measuring
(e.g., arousal, emotional reactions, cognitive effort, or attempted behavioural control).
For example, it could be argued very easily that changes in speech disturbances, such as
hesitations, silent pauses, and speech rate, are not specific to any particular explanatory
construct. They may be associated with changes in arousal, fear, cognitive effort, or

145
attempted behavioural control in various ways. Complicating matters further is the
recognition that these states/processes may operate in concert, and some researchers may
disagree with specific predictions for the cues that are derived from the formulations
(Sporer, & Schwandt, 2006, 2007).
Even though the overall pattern of changes among certain cues may be more or
less suggestive of some constructs rather than others, Nunnally (1978) pointed out long
ago that very few constructs can be fully operationalized by a single variable or item, as
in the case of reaction time for example. To cope with this problem, investigators in other
fields of psychology have had to develop multi-item composite measures of constructs,
recognizing that the vast majority of observable variables are not completely specific to
the attributes that they intend to assess. Yet, for some reason, most deception researchers
often examine and statistically report on individual cues in isolation, as if they were both
specific to, and a complete representation of such abstract constructs as “cognitive effort”
or “attempted behavioural control”.
Although it has often been said that a cue comparable to Pinocchio’s nose does
not exist for diagnosing deception, this also is likely to be the case for the states/processes
associated with it. For example, speech hesitations could represent arousal or cognitive
load. Moreover, increasing cognitive load may very well result in increased anxiety (Vrij
& Granhag, 2012). Such problems are not unique to the field of deception research,
however. Again, most psychological attributes are best represented by composite scores,
based on multiple items (Nunnally, 1978). Indeed, most clinicians would frown upon a
hypothetical practitioner who diagnosed depression solely on the basis of changes in
sleep. As another example, would any psychologist be justified in characterizing an

146
individual’s global intelligence solely on the basis of his or her response to a single item
on an intelligence test?
Given that individual cues do not seem to be specific to the constructs that
deception researchers wish to assess, and that different individuals may exhibit different
styles of lying that also could be associated with different causal mechanisms, it appears
that multi-item composite scales of these constructs are needed. Without a doubt, such
scales seem long overdue. Although the development of behavioural rating scales for
these constructs (that are not dependent on coding of specific verbal content) is a topic
for another paper, interested researchers could look to seminal readings on psychometric
theory for guidance (see, e.g., Nunnally, 1978). It is worth mentioning, however, that
such endeavours are likely to be costly in terms of both time and resources. This is
because the development of reliable and valid composite measures of constructs often
requires the generation of large numbers of items and the use of large samples of
participants. Such an investment may be worthwhile in the long run though, as the
greatest advances in psychological science often involve advances in measurement
(Nunnally, 1978). Indeed, one need only look at the impact that sound measures of
constructs have had in other areas, such as the usefulness of the Psychopathy Checklist-
Revised (PCL-R; Hare, 1991, 2003) for assisting decision-makers with offender
classification and management, or the utility of numerous tests of cognitive abilities for
characterizing strengths and deficits that may have a bearing on various domains of
functioning.
Deception researchers could collaborate with other specialists (e.g., cognitive
scientists, emotion researchers) in the pursuit of developing internally consistent and

147
relatively homogenous multi-item behaviour ratings scales of constructs such as fear,
cognitive effort, guilt, duping delight, etc. To the extent that rigorous and well-planned
efforts fail to yield reliable and valid measures of the phenomena of interest, researchers
may have to abandon these constructs and search for others (Nunnally, 1978). If the
efforts are successful, however, the measures developed could have applications beyond
those that deception researchers may have anticipated. For example, a behaviour rating
scale for fear that does not require the scoring of specific verbal content could be
potentially useful in assessments of individuals with more limited verbal abilities.
General applications aside, it would be interesting to know whether distinctive profiles
emerge when difference scores of composite measures of the constructs summarized in
this dissertation (deceptive minus truthful) are standardized, ipsatized, and submitted to
cluster analysis. Such efforts could paint an even clearer picture of the behavioural effects
of deceit. Further, it would be useful to know whether faint changes from truth-telling to
lying across a number of cues that comprise a construct translate to more noticeable
differences on global measures of the constructs that are represented by these cues.
One could criticize the aforementioned ideas on the grounds of practicality. For
example, even though the sophistication of general deception research has been praised,
Rogers (2008f) noted the limited clinical utility of the findings on account of the time-
intensive coding that is involved for specific behaviours. Given the time and resources
required, it was said that this methodology is impractical for clinical assessments and
other professional applications. So how could one justify the development and use of
composite measures of constructs that may involve the coding of even larger numbers of
cues? Similar to the arguments made earlier, this author believes that the payoff would be

148
in the long run. That is, if reliable and valid composite measures of the relevant
constructs are developed successfully, and based on the lowest level of coding (e.g.,
frequency and/or duration of cues), then researchers may eventually be able to move to
the development of briefer and less time-intensive “screening” measures that could be
used for practical purposes. For example, perhaps researchers could test whether shorter
composite measures can be developed based on a smaller number cues that load most
heavily on the constructs. Making ratings of these behaviours on Likert scales also could
be tested for their accuracy in an effort to develop more rapid methods for the coding of
cues. Of course, any detection strategies based on new composite measures would still
have to demonstrate incremental validity over those that have already been established as
effective.
Appreciable Correlations among Cues to Deceit: Practical Implications.
With regard to interrelationships among cues, substantial correlations were
observed across both studies. This was hypothesized on the grounds that at least moderate
correlations are to be expected when variables are part of an overall theoretical system
(Nunnally, 1978). Specifically, these variables are all conceived to be important in the
domain of behavioural cues to deception (Buller & Burgoon, 1996; DePaulo et al., 2003;
Ekman, 1985/1992, Ekman & Friesen, 1969; Zuckerman et al., 1981). Given these
findings, it was recommended in the second chapter that practitioners be cautious when
using multiple cues to assist them with making judgments concerning the veracity of
matters, especially when they are unaware of the nature of the relationships among them.
This recommendation was made because some cues may provide only redundant
information and could lead to over-confidence in judgements, a problem that has been

149
reported in other forensic contexts (see, e.g., Otto, 2008; Quinsey et al., 2006; Rogers &
Bender, 2012).
Such findings further underscore the need for composite measures of constructs,
where some redundancy among items/variables may actually be beneficial to the
measurement of abstract psychological attributes. Of course, some of these hypothetical
measures could still very well be correlated with each other, but some test construction
procedures could be employed to reduce inter-correlations (see Nunnally, 1978).
Moreover, being aware of correlations among a smaller number of global measures of
constructs is more manageable than having to keep track of correlations among the large
number of possible cues that have been documented to date. Until such measures have
been developed, this author argued that researchers should start to systematically report
on interrelationships among cues, so that users of these cues can gain a sense of the ones
that may provide unique information for differentiating truth-tellers from liars.
Additionally, deception researchers could begin to factor analyse cues to gain an
understanding of how they may hang together, as well as an understanding of the more
abstract variables that underlie them. On this point, the studies described here did not
involve enough participants to permit factor analysis. Use of larger samples is advisable
if this is the focus of inquiry.
Results Unique to Each Study.
Differences between Students and Offenders: Value in Baseline Comparisons.
In the first study, across the truthful and deceptive accounts, it was observed that
only smiles occurred significantly more often for students than for offenders. Although
the focus of this dissertation was not on general behaviour differences between forensic
150
and community populations, it was argued in the second chapter that such potential
differences should probably be the focus of future research and warrant the consideration
of practitioners who are routinely involved in detecting deceit. This argument was made
on the basis that if it is established through further research that offenders generally smile
less often than non-offenders, and if it is commonly believed that liars typically appear
less pleasant than those telling the truth (see, e.g., DePaulo et al., 2003; Zuckerman et al.,
1981), then offenders may represent another group at increased risk for being falsely
accused of deception. The extent to which offender and non-offender populations differ
with regard to other displays of affect is not clear, as they were not examined in the first
study, so this also should be a focus of future investigations. Moreover, the smiles that
were coded in this dissertation research were relatively undifferentiated from the many
different kinds that have been documented (see, e.g., Ekman, 1985/1992); thus, it may be
possible for a different pattern to emerge if specific kinds of smiles were measured. From
a practical standpoint, it is reiterated that these issues underscore the importance of
making comparisons against similar baseline truthful behaviour, wherever possible, when
evaluating the behavioural responses of individuals suspected of engaging in deception
(Hartwig, 2011; Vrij, 2008; Vrij et al., 2010a).
Decreases in Silent Pauses among Offenders while Lying: Attempted Control?
As mentioned earlier in this chapter, in the first study, a significant interaction
concerning criminal status was found for speech pauses. Whereas the deceptive and
truthful accounts of students did not differ significantly with regard to the number of
speech pauses, there were significantly fewer speech pauses by offenders during the
delivery of deceptive accounts compared to the delivery of truthful accounts. This

151
difference for offenders represented a moderate effect size, and appeared to be consistent
with formulations that emphasize the role of attempted behavioural control in deceptive
communications (DePaulo et al., 2003; Zuckerman et al., 1981). It was qualified in the
second chapter, however, that it was not known whether offenders specifically believed
that speech pauses were a cue to deceit and, thus, consciously tried to minimize them to
the extent of overdoing it. In line with the suggestions of others (e.g., Rogers et al.,
2011), it was recommended that future studies examine individuals’ beliefs about cues to
deceit, as was done in the second study (summarized later).
Speech Rate and the Robustness of the Subtypes.
When comparing lying to baseline truth-telling, in addition to a relative increase
in speech rate, fluid liars in the first study were characterized by a relative decrease in
speech pauses. When lying, they also exhibited a relative decrease in the amount of time
taken to deliver the accounts, and showed a relative increase in smiles. By contrast,
laboured liars were characterized not only by a relative decrease in speech rate when
lying, but also by a relative increase in speech pauses. When lying, they showed a relative
increase in the amount of time taken to deliver the account in addition to a relative
increase in the number of words spoken. Laboured liars also evidenced a relative
decrease in smiles when lying. Even though the results of the first study indicated that
speech rate made a comparatively large contribution to the separation of these two
groups, a two-cluster solution characterizing fluid and laboured liars was still obtained
when speech rate was excluded from analysis. This latter finding suggested that the
obtainment of the two-cluster solution was not solely the result of the contribution of
speech rate.

152
Criminal Status as a Subtype Correlate.
As mentioned in the second chapter, one method of validating subtypes is to
establish relationships between them and other variables of theoretical and practical
importance that were not used to form the clusters (Hair et al., 2009). Moreover,
identifying correlates for an outcome is an early but essential step in identifying possible
causes (Kraemer et al., 1997). Interestingly, a significant association between the
subtypes and criminal status was found in the first study. More precisely, almost 70% of
offenders were classified as fluid liars and the rest were classified as laboured liars. By
contrast, about 42% of students were classified as fluid liars, and approximately 58%
were classified as laboured liars. The results of the first study also indicated that neither
fluid liars nor laboured liars were exclusive to either students or offenders, as both
subtypes were observed when the two groups were analyzed separately. This finding
suggested that obtainment of the two subtypes was not solely attributable to differences
between students and offenders concerning the relative behavioural effects of deception.
It also demonstrated the generalizability of the two-cluster solution across both forensic
and community samples.
Based on these findings, it was argued that it was unlikely that clinical
psychopathy would fully account for the different subtypes, given its estimated low
prevalence in the general population (Coid et al., 2009; Hare & Neumann, 2008). More
specifically, it seemed too rare to be the chief factor in explaining whether students
exhibited a fluid style versus a laboured style of lying. A similar argument was made for
the role of cognitive abilities. That is, the hypothesis that laboured liars had more limited
cognitive abilities than fluid liars would inaccurately suggest that offenders’ cognitive
153
abilities were superior to those of students because offenders were proportionally more
likely to be classified as fluid liars. As with psychopathy, it appeared more probable that
cognitive abilities would not fully account for the differences observed among fluid and
laboured liars, but maybe partially so in some cases. Instead, it was postulated that more
common and general factors were likely to have a role, such as basic dimensions of
personality, confidence in deception skills, greater practice at deception, certain
emotional reactions when lying, or broad strategies employed while lying.
Replication of Subtypes Using a Different Methodology.
In the second study, in addition to a relative increase in speech rate when lying,
fluid liars exhibited a relative decrease in filled pauses. They also showed a relative
decrease in the amount of time taken to deliver the accounts as well as a relative increase
in self-references and self-manipulations when lying. In contrast, laboured liars displayed
not only a relative decrease in speech rate when lying, but also a relative increase in filled
pauses. They demonstrated a relative increase in the amount of time taken to deliver the
account in addition to a relative increase in the number of words spoken when lying. For
laboured liars, there also was a relative decrease in self-references and self-manipulations
when lying. The replication of the subtypes using a different methodology provided
further evidence of their generalizability. This replication also suggested that they were
not a peculiar artifact of some element of the first experiment, nor were observations of
the subtypes deemed to be limited to communications concerning truthful and fabricated
accounts of negative life events.
154
Stereotypical Beliefs about Cues to Deception as a Subtype Correlate.
The second study sought to examine the relationship between the subtypes and the
extent to which they held pan-cultural stereotypes about how liars behave (e.g., liars
make less eye contact, stutter more, pause longer, etc.), given that both accurate and
inaccurate beliefs may influence self-presentations (Barrick, Shaffer, & DeGrassi, 2009;
Rogers et al., 2011). As hypothesized, fluid liars held an appreciable number of
stereotypical beliefs concerning cues. More specifically, as a group, they held an average
of more than five of the 10 beliefs reported by the Global Deception Research Team
(2006). This finding provided some additional support for Zuckerman and colleagues’
(1981) formulation emphasizing attempted behavioural control, as it specifically predicts
that those engaged in attempted behavioural control hold erroneous stereotypes about
honesty and how liars behave. Such stereotypic beliefs may have led fluid liars to
excessive efforts to appear honest, which ultimately became their own indicators of
deceit (i.e., overly smooth accounts).
Contrary to expectations, it was found that laboured liars held a significantly
greater number of these stereotypical beliefs. As a group, they held an average of almost
seven of the 10 stereotypical beliefs documented by the Global Deception Research Team
(2006), and this difference between subtypes represented a moderate effect size. The
previous chapter outlined several conceivable explanations for this result. For example, in
holding a greater number of stereotypical beliefs, maybe laboured liars were more
vulnerable to self-fulfilling prophecies consistent with how liars are believed to behave.
Alternatively, in holding fewer stereotypical beliefs, perhaps fluid liars were less prone to
demand characteristics of how they thought the experimenter may have wanted them to

155
behave. It was argued, however, that the simplest explanation likely involved the
ordering of participation in the experiment and the completion of self-report measures.
More specifically, in light of their deceptive performance, which appeared to be
consistent with the apparent stereotypical belief that liars tend to struggle with delivering
their accounts (also see Hartwig & Bond, 2011), laboured liars may have endorsed a
greater number of such beliefs.
It was noted in the previous chapter that the latter explanation is concordant with
Bem’s (1972) self-perception theory, which states that individuals come to know their
beliefs partially through inferring them from observations of their own behaviours or
situations in which the behaviours occur. Such an explanation may be a viable alternative
to others for how stereotypes of lying arise. For example, the Global Deception Research
Team (2006) proposed that stereotypes about lying are designed to discourage lies. They
went on to state that these stereotypes are not intended to be descriptive, but rather to
reflect worldwide norms (e.g., children should feel ashamed when lying to parents, liars
should feel bad, liars should get caught, and lying should not pay). It was elaborated that
stereotypes of liars promote such views, and are transmitted through generations via
socialization as mechanisms for social control.
But maybe some stereotypic beliefs about cues persist because some individuals
actually display them? On this point, laboured liars exhibited some cues concerning
speech disturbances that were consistent with the pan-cultural stereotype. Maybe the liars
who are caught by these cues reinforce the stereotypic beliefs among those who detected
them? Similarly, maybe the liars who exhibit these cues assume that they also apply to all
others? The findings from the second study raise the additional question of whether some

156
of these cues can even be considered stereotypes if a substantial proportion of individuals
display them while lying. Interestingly, another study conducted since publication of The
Global Deception Research Team’s (2006) findings also has indicated that some children
exhibit behaviour while lying that is consistent with the pan-cultural stereotype (i.e., gaze
aversion) (McCarthy & Lee, 2009). The findings from the present research raise the
additional question of whether it is possible that some individuals are accurate at
detecting one type of liar but not another. For example, maybe many individuals can
accurately detect laboured liars but not fluid liars given their greater similarity to the
global stereotype? Such a possibility may partially account for the overall poor levels of
performance that are commonly reported in studies that focus on the accuracy of
deception judgements.
Based on these findings and their potential implications, future research should
examine the relationship between beliefs and deceptive behaviours longitudinally. It was
mentioned in the third chapter that it would be interesting to know whether a similar or a
different relationship emerges between the subtypes and stereotypical beliefs when the
beliefs are measured in the week or month prior to participating in a comparable
experiment. Of course, researchers could still measure the beliefs after participation in an
experiment to gauge whether and how they change. Moreover, future research also
should examine whether participants endorse making a conscious effort to control
specific cues, as this data also was not collected in the second study. Such data might lead
to a greater understanding of the mechanisms responsible for empirical results (Rogers et
al., 2011).

157
Variables Not Identified as Subtype Correlates.
Of note, the second study did not yield convincing data to support the hypothesis
that fluid liars were more practiced at deception than laboured liars. That is, there was no
significant difference between the subtypes with respect to the number of times they were
reportedly detected when behaving deceptively. It should be noted, however, that the
frequency with which these two groups lied was not assessed. The same was said for
confidence in the ability to deceive others, as no significant differences were observed in
terms of self-reported deception skills. The subtypes also did not differ significantly in
the degree to which they reportedly enjoyed engaging in deception. Furthermore, the
differences between subtypes did not appear to be attributable to more global strategies
for managing self-presentations (e.g., trying to maintain a calm and cool demeanour
while lying, or acting animated, energized, or excited so as not to attract suspicion). It
should be repeated, though, that the second study was somewhat limited in measuring
these particular constructs, as most of them were evaluated via responses to only one or
two questions that could be prone to error.
It is worth repeating that the perceived difficulty of the experimental tasks was
not significantly different for fluid and laboured liars in the second study. Nor was the
self-reported emotional arousal experienced during these tasks. Although these findings
appear to undermine the possibility that the mechanisms underlying laboured lying were
cognitive load and/or emotional arousal, it was postulated in the previous chapter that
perhaps fluid liars coped with these states/processes in a different way. Again, maybe
fluid liars put forth greater effort when mentally planning and rehearsing their accounts?
The third chapter provided several recommendations on how researchers could examine
158
this possibility further via the use of manipulation checks. Additionally, querying
participants on the extent to which they experienced guilt and duping delight also would
be informative, as they were not assessed through the manipulation check used in the
second study.
With regard to the possible role of personality traits, the results of the second
study failed to indicate any significant differences between the subtypes and the “Big
Five” dimensions of personality. Notably, these results held even when compensating for
acquiescent-related response styles. Further, there were no significant differences
between the subtypes concerning various forms of socially desirable responding,
countering the argument that responses on the other aforementioned measures may have
been differentially influenced by increased amounts of socially desirable responding for
one of the subtypes. Given that a relatively brief instrument was used to assess these
broad personality dimensions, it was recommended that future studies examine whether
differences emerge when more comprehensive measures are used that simultaneously tap
the more narrow facets of the “Big Five” personality traits. Researchers also may wish to
focus on other individual differences that could play a role in subtype expression (for a
review of other individual difference variables that may be of relevance, see Vrij, 2008).
On a related note, DePaulo et al. (2003), Sporer and Schwandt (2006, 2007), and Hartwig
and Bond (2011, 2014) have reported on a host of moderator variables in their meta-
analyses that may have a bearing on the manifestation of the subtypes.
Lastly, an effort was made in the second study to determine whether the subtypes
may have been a product of methodological variables. Importantly, the results failed to
indicate a significant effect of the order in which the truthful and deceptive accounts were

159
obtained. Similarly, there were no significant associations between the subtypes and the
particular stimuli that were described. This latter finding suggested that the behavioural
differences observed between the subtypes were not specifically due to systematic
differences in the pictorial content that was discussed. Collectively, the findings from the
second study counter the argument that the results of the first study concerning the
subtypes were likely due to confounding methodological variables (e.g., differences in
the types of negative life events that were described).
Discrepancies between the Results of the Two Studies. As summarized earlier
in this chapter, small group differences were obtained for some of the cues investigated in
the first study (i.e., head movements, number of words spoken, duration of the accounts
in seconds), which supported DePaulo et al.’s (2003) self-presentational perspective. In
the second study, however, a small group difference was observed only for speech
pauses, which supported Zuckerman et al.’s (1981) and Ekman’s (1985/1992)
formulations. With regard to correlations among cues, the first study revealed a number
of substantial correlations among the cues that were found to be significantly different for
the truthful and deceptive accounts. By contrast, in the second study, only difference
scores for self-references correlated significantly with difference scores for speech
pauses, and self-references did not emerge as a cue to deceit at the group level in the
second experiment. Even though fluid and laboured lying profiles emerged in both
studies, the keen observer may have noticed that the profiles for each subtype were not
exactly the same across both experiments. Some cues that differentiated the subtypes in
the first experiment did not do so in the second experiment, and vice versa, even though
cues reflecting speech disturbances represented the largest differences between the

160
subtypes in both studies. Moreover, with regard to subtype correlates, the results of the
first study did not indicate a significant association between the subtypes and the sex of
the participants. In the second study, however, a significant association was observed
between these two variables, with men being less likely to be classified as laboured liars.
How is one to make sense of these apparent discrepancies? The previous chapter
already discussed the possibility that the observed association between the subtypes and
the sex of the participants may have been spurious or random. On this point, given the
exploratory nature of the research, the Type I error rate was set at .05 for each statistical
test conducted, and Bonferroni corrections to this error rate were not made. The rationale
for this decision was to prevent neglect of any potentially novel and important findings,
and there was a possibility for spurious findings to emerge by chance by proceeding in
this manner. It also was argued, however, that there are no statistical corrections for
missing important discoveries due to insufficient attentiveness to the data (Bem, 2004),
and that conducting research in this fashion underscored the importance of cautious
interpretation of results. Like Cohen (1994), this author believes that psychologists must
rely on replication for generalization. Thus, it was argued in the previous chapter that
future attempts at replicating the findings seemed warranted. It also was argued that
researchers should first establish whether fluid and laboured lying represent state- or trait-
like characteristics, before attempting to explain any possible associations between the
subtypes and the sexes. Having stated this, Vrij (2008) indicated that gender differences
in cues are unlikely because, in many situations, men and women do not differ with
respect to the emotions felt, cognitive effort experienced, or in their attempts to give
convincing impressions while lying. Vrij (2008) also stated that there do not appear to be

161
any theoretical reasons for why men and women would differ in terms of behavioural
manifestations of emotions, cognitive load, or attempted behavioural control while lying.
The lack of a theoretical rationale, however, does not necessarily mean that such
differences do not exist. Thus, more empirical data on the issue of whether men and
women deceive differently with respect to subtypes would be valuable. In the previous
chapter, this author alluded to the possible use of evolutionary or socialization
perspectives for generating hypotheses on the matter.
Are there other explanations for the discrepancies? There were some differences
between the two studies concerning methodology. The nature of the accounts provided
were different (i.e., negative life events experienced vs. exposure to negative images),
and there were slight differences in the coding procedures for some cues for example. It
is not immediately apparent, however, why these specific methodological differences
would result in the discrepancies noted above. Perhaps the simplest explanation has to do
with the nature of the cues themselves. If some of the behavioural differences between
truth-tellers and liars are indeed subtle and faint (Bond et al., 1985; DePaulo et al., 2003;
Hartwig & Bond, 2011; Vrij, 2008; Vrij et al., 2010a), then some of the cues may be
highly sensitive to sampling effects. Future research, therefore, should seek to identify
the most robust cues. The current dissertation research indicated that speech rate may be
a critical variable in this regard, at least with respect to the identified subtypes.
Further Implications of the Findings for Detecting Deception
For whom are these findings relevant? Given the intensive examination of
behaviour that was involved, it would appear that the findings may be most relevant to
professionals who heavily scrutinize the behaviour of suspected deceivers, and who are

162
employed in organizations where substantial time and resources are allocated to the
recording and careful review of videotaped interviewees (e.g., some police and
government agencies). Or, they may be of relevance to behavioural scientists who train
and consult with such agencies (e.g., Porter & ten Brinke, 2010; Vrij, 2008). It might
appear this way, at least at first. But it has been argued that observation of behaviour is
still the most commonly used approach for detecting deceit (Vrij et al., 2010a), despite
the widespread use of many specialized tools. This was said to be the case because
certain technologies and equipment may be either unavailable or impractical to
implement in many situations. Even in legal cases, judges and jurors may be instructed to
evaluate the demeanor of individuals whose credibility is under question (Porter & ten
Brinke, 2009). As indicated in the first chapter, although it may be ideal to use tangible
evidence to guide determinations on the veracity of matters, Porter and ten Brinke (2009)
highlighted that such evidence may be unavailable in many cases. Thus, awareness of
these findings may be of some relevance to any individual who considers verbal and
nonverbal behaviour when making judgements concerning truthfulness.
Of what particular findings should individuals be aware? Indeed, it appears that
many behavioural differences between truth-tellers and liars may be subtle and, therefore,
difficult to spot (Hartwig & Bond, 2011; Vrij et al., 2010a; Vrij, 2008). Moreover, the
potential usefulness of some cues may not be readily apparent from research that
documents differences at the group level, including meta-analyses. Not only does there
appear to be no Pinocchio’s nose for diagnosing deception, but this dissertation research
yielded additional evidence to suggest that a single behavioural profile also seems
unlikely (Buller & Burgoon, 1996). This at least appears to be the case with respect to the

163
more popular cues that were investigated here. From a practical standpoint, having such
knowledge may be protective against more simplistic views of behavioural indicators of
deceit leading to inaccurate judgements, which may be further associated with the severe
consequences that were highlighted in the introductory chapter of this dissertation.
A Profile-Matching Approach for Detecting Deception? Given that a single
behavioural profile does not seem to be likely, the findings from this research raise the
question of whether a profile-matching approach might be useful for aiding in the
detection of deception. For example, a practitioner might be able to evaluate baseline
behaviour that is observed when an individual is verified to be acting truthfully, and then
contrast it against behaviour that is observed when deception is suspected to ascertain
whether the differences are consistent with either a fluid or laboured style of lying.
Additional research, however, would be necessary before the practical utility and
accuracy of such an approach can be tested. These considerations will be discussed in the
next section.
Limitations of Both Studies and Additional Recommendations for Future Research
As there does not appear to be any individual cue that is diagnostic of deception,
nor should the subtype profiles uncovered here be considered diagnostic of deceit. In
providing two separate accounts, there are plausible alternative explanations for why an
individual may display a behavioural profile that resembles fluid lying or laboured lying.
For example, an individual who provides two truthful accounts may become tired after
providing the first account. As a result of fatigue, he or she may become sluggish in
delivering the second account. This difference could result in a behavioural profile that
resembles a laboured style of lying even though no deception is involved. As another

164
example, a person may provide two truthful accounts, but if one account has been told
more often than the other for whatever reason, the difference in rehearsal of accounts
may resemble a fluid style of lying even though no deception has occurred. Researchers
have referred to such examples of failing to consider alternative explanations for
observed behaviour as the “Othello error” (Ekman, 1985/1992, p. 170), named after the
Shakespearean character who murdered his love over suspected infidelity. More
specifically, Othello interpreted Desdemona’s fear as evidence of infidelity when he
accused her, and failed to consider that she may have been afraid because she believed
that she would be killed if she could not prove her innocence. The onus, thus, is on
practitioners to consider and rule out alternative explanations for behavioural displays
that may be consistent with deceit. When practitioners are unable to do so, it may be best
to reserve judgment. This course of action, however, would depend on the context and
the potential costs to those involved for any indecision. Thus, it is not possible for this
author to provide decision rules that would be equally effective in all situations.
What complicates matters further is the recognition among senior deception
researchers that noteworthy changes from baseline truth-telling to lying are not always
observed, so even if careful steps are taken in real-world situations to find comparable
and verifiable truthful baselines to contrast against suspected deceptive communications,
the potential for error still exists (Vrij et al., 2010a). Given that base rates of deception in
many settings are not known, and that utility estimates (e.g., sensitivity, specificity,
positive predictive power, negative predictive power) also are unknown for the vast
majority of cues, it would appear that making decisions concerning the veracity of
matters solely on the basis of interpreting verbal and nonverbal behaviour is a risky

165
enterprise. Practitioners, therefore, should seek to obtain corroborating evidence
whenever possible. In the absence of such evidence, it might be better to think of the
behavioural displays described in this dissertation, and in other readings, as more like
flags to direct questioning. That is, when these behaviours are observed, the practitioner
may have tapped an area in the interview that is worthy of further inquiry, but alternative
explanations for the behaviours beyond deception must still be considered. Because many
liars may not display cues during their communications, absence of them also should not
be interpreted as definitive evidence for the truthfulness of matters.
Having stated this, researchers could still conduct further empirical investigations
to examine the potential usefulness of a profile-matching approach for detecting deceit.
To combat some of the issues mentioned above, in attempting to replicate the findings
reported here, researchers also could include two conditions in which some participants
provide only truthful accounts in each. This action would be taken because it is probably
unreasonable to assume that the coded behaviours are likely to be exactly the same across
two truthful accounts. For example, as discussed above, more general practice effects
may lead to some changes. Researchers could then examine the behavioural profiles
obtained under these conditions. A profile-matching approach may have some usefulness
if the profiles differ substantially in degree or in kind from those of fluid and laboured
liars. That is, based on the behaviours observed during two accounts for a given
individual, one might be able to say whether the behaviour changes are most consistent
with fluid lying, laboured lying, or profiles that are observed when individuals provide
two truthful accounts and some random variation or practice effects are to be expected.

166
For comparative purposes, researchers also may want to examine profiles obtained under
two conditions in which individuals provide only deceptive accounts.
Of note, if successfully developed, this approach also would necessitate
consideration of interrelationships among cues in rendering decisions about profile
similarity. Importantly, this consideration may lead to decreases in some errors, as this
author has argued that a lack of knowledge regarding interrelationships could lead to
overconfidence in decisions. Such a profile-matching approach may be even more
promising if it were developed using multi-item composite measures of constructs. Thus,
this author accepts that there may be alternative ways to subtype individuals with regard
to the behavioural effects of deceit. Indeed, perhaps other informative findings would be
obtained if individuals were subtyped according to cues of deceit that are different from
the ones that were examined here. Additionally, perhaps meaningful but less common
subtypes would be observed in studies that examine larger samples. Any efforts dedicated
to devising a profile-matching approach, though, should attempt to do so in a manner that
maximizes discriminant validity when it comes to differentiating truth-tellers from liars.
Even still, before the development of such a profile-matching approach is
attempted, some preliminary research should probably be conducted. For example, it
seems imperative to first establish whether relevant subtypes exist outside of the
laboratory setting and in those situations in which such an approach may be used. For
example, if one wanted to devise a profile-matching strategy for detecting deceit in a
police interview, then it must be demonstrated that deceivers in this setting can be
subtyped in meaningful ways with regard to relevant cues. Although preliminary, such
research would be no small feat, as it is a time-consuming endeavour to establish the

167
ground truth of communications in real-world deception studies where random
assignment to conditions is not feasible (Hartwig, 2011; Vrij, 2008).
On the point above, both dissertation studies were conducted in relatively low-
stakes settings, so future attempts at replicating the findings in high-stakes scenarios are
warranted. Even though real-world studies of deception may be costly and time-
consuming to carry out, researchers could aim to increase the stakes in laboratory-based
research to address the generalizability of the findings reported here. Rogers (2008f;
Rogers & Gillard, 2011) has summarized some innovative ways in which researchers
could motivate participants and create incentives that better approximate those found in
real-world contexts; thereby, enhancing the external validity of lab-based investigations.
For example, instead of providing a relatively small monetary reward to each participant
for giving a convincing individual performance, researchers could examine the effect of
offering a larger sum of money or even a weekend getaway at a nice hotel to the top
performer(s) in a study. Such incentives may better approximate the “better life” sought
in some cases of personal injury fraud (Rogers, 2008f, p. 419). To address negative
incentives, Rogers and Cruise (1998) motivated student simulators by informing them
that the names of failed deceivers would be posted on departmental bulletin boards. To
circumvent ethical problems, it was suggested that researchers post fictitious names on
the list (Rogers, 2008f).
Of course, participants in any of these kinds of studies would still have the right to
withdraw their participation at any time (Vrij et al., 2010a), so researchers should at least
attempt to keep track of the demographic characteristics of any participants who drop out
in order to characterize those individuals for whom the results may not generalize. While
168
this sort of limitation may weaken the internal validity of a study, confidence in findings
is ultimately enhanced by converging results across multiple studies that employ diverse
methodologies (Rogers & Gillard, 2011; ten Brinke & Porter, 2013). To this end, it also
is worth investigating whether the findings reported here generalize to paradigms that
extend beyond the description of negative emotional material. It simply is not known
whether these dissertation findings are generalizable to lies about transgressions. It is
worth highlighting that Rogers (2008f; Rogers & Gillard, 2011) also has provided a
useful overview of factors that should be assessed through manipulation checks in these
kinds of lab-based studies.
With regard to the results concerning subtypes correlates, like all correlational
findings, they must be interpreted with caution. This is especially the case for those
variables examined in the second study, as participation in the experiment may have
influenced how self-report measures were completed. Although there was a rationale for
not counterbalancing participation in the experiment with completion of the measures,
future investigations could aim to counterbalance these study procedures unless there is a
rationale for not doing so. Moreover, counterbalancing these elements seems more
permissible, so long as investigators still attempt to gauge the impact of methodological
variables. Additionally, throughout this manuscript, this author has provided numerous
suggestions on how researchers may test whether some of these correlates have a causal
role in subtype expression.
Finally, some cautionary notes are warranted with respect to the use and
interpretation of ipsative scores of cues as they were reported for the subtypes in this
dissertation. Again, given that individuals may vary in their overall responsivity to

169
deception tasks, a transformation of the intraindividual distribution of profile scores was
undertaken prior to clustering profiles to remove these differences (Nunnally, 1978).
Such data transformations may be useful for researchers and practitioners who evaluate
deceivers, especially when examining individuals who may not be very responsive in
their verbal and nonverbal behaviour during deceptive communications. On this point,
perhaps individuals who are good actors or natural performers represent some of these
individuals (see Ekman, 1985/1992; Vrij, 2008, Vrij et al., 2010b). It should be
remembered, however, that ipsative scores are relative scores, and that the magnitude of
these scores should not be confused with the magnitude of absolute measures for the
same set of attributes (Clemens, 1966). Thus, in any future meta-analyses, the statistics
concerning the ipsative z-scores of cues reported here should not be combined with
statistics concerning absolute scores of these cues.
Concluding Remarks
Most people are interested in identifying the kind of deception that could have a
significant impact on their lives or on the lives those who are close to them. Other
individuals seek to attain specific expertise in the ability to detect lies on account of their
professional roles or scholarly interests. The studies that comprised this dissertation
research yielded some novel findings concerning the behavioural effects of deceit, which
could have important implications for theory, research, and practice. Recommendations
for future deception research, therefore, were offered to assist the field with moving
forward in these regards. Although these recommendations were ambitious and many,
concluding this dissertation with the following quote from one of the field’s most

170
influential figures seems fitting: “As always, the mantle of expertise must be earned
through painstaking analysis and research” (Rogers & Jackson, 2005, p. 527).

171
APPENDIX A.
USE OF IPSATIVE Z-SCORES IN FORENSIC RESEARCH AND PRACTICE
Ipsative transformations of data have long been employed in the field of forensic
psychology, specifically in the context of research and clinical practice involving the
assessment and treatment of sexual offenders (see, e.g., Freund, 1967; Quinsey et al.,
1975). Ipsative z-scores are the scores recommended for use in phallometric assessments,
which involve the measurement of male sexual arousal via use of a penile
plethysmograph that monitors changes in penis size while varying stimuli are presented
to the examinee in a controlled manner (Quinsey et al., 2006). Forensic mental health
professionals often utilize penile plethysmography in assessing denied sexual deviance
(Rogers, 2008c). Examples of stimuli used in such assessments include photographs of
persons who vary in age and sex (e.g., Freund, 1965), or audiotaped descriptions of
sexual scenarios that vary in levels of coercion and brutality (e.g., Quinsey & Chaplin,
1988).
Ipsative z-scores are preferred in phallometric assessments over raw change
scores (e.g., millimetres of penile expansion) because they compensate for individual
differences in responsivity to the stimuli presented, and better discriminate groups
defined on the basis of their sexual histories (i.e., sexual offenders versus non-sexual
offenders) (Harris, Rice, Quinsey, Chaplin, & Earls, 1992). Moreover, in addition to
enhancing the discriminant validity of phallometric assessment data, ipsative z-scores
also have evidenced predictive validity in this context. Specifically, phallometric test
results that are based on ipsative z-scores, and that indicate deviant sexual preferences,
are a significant predictor of recidivism for sexual offenders (Quinsey et al., 2006). The

172
demonstrated utility of ipsative z-scores in this forensic context suggested the
transformation also may be useful in deception research, where individual differences in
responsivity also appear to be an issue.

173
APPENDIX B.
RATIONALE FOR USING K-MEANS CLUSTER ANALYSIS WITH
EUCLIDEAN DISTANCE SPECIFIED AS THE DISTANCE MEASURE
The term cluster analysis does not refer to one specific statistical technique, but
rather to a group of multivariate techniques that may be used to identify homogenous
groups in a dataset (DiStefano & Kamphaus, 2006; Hair et al., 2009; Norusis, 2011).
There are many ways in which cases can be clustered into groups. Helpful overviews of
popular techniques that have been employed in fields as diverse as psychology, biology,
chemistry, medicine, geology, geography, engineering, economics, sociology, crime
analysis, and marketing research can be found elsewhere (see, e.g., DiStefano &
Kamphaus, 2006; Hair et al., 2009; Norusis, 2011; Rupp, 2013; Vermunt & Magidson,
2002). These overviews also often include discussion of some of the key choices that
analysts are required to make when using the various techniques. It is not possible to
review all of the available techniques in relation to the current research here given that
Rupp (2013) indicated searches for clustering and classification techniques yielded
thousands of results in the PsychInfo database alone. Instead, a brief rationale for
selecting k-means cluster analysis with Euclidean distance specified as the distance
measure is provided within the context of some of the other more popular subtyping
techniques and distance measures that are available.
Hierarchical Cluster Analysis versus K-Means Cluster Analysis
Hierarchical clustering techniques were the first clustering techniques to be
developed (Hair et al., 2009). These techniques follow either an agglomerative or a
divisive approach (Hair et al., 2009; Norusis, 2011; Rupp, 2013). The former approach

174
begins the clustering process by treating each case as its own cluster and sequentially
joins them until all cases form a single cluster, whereas the latter approach begins the
clustering process with all cases in a single cluster and sequentially separates them until
each case represents its own cluster. It should be noted that, once cases are joined in the
agglomerative approach, these cases cannot be separated. Similarly, once cases are
separated in the divisive approach, these cases cannot be merged with those that they
were separated from earlier.
Hierarchical clustering techniques require selection of a measure of inter-cluster
distance that connects clusters together in addition to selection of a measure of profile
similarity/dissimilarity that provides only the direct distance between all cases
individually in multivariate space (Hair et al., 2009; Norusis, 2011; Rupp, 2013).
According to Rupp (2013), the most commonly known inter-cluster distance measures for
hierarchical clustering techniques are: (1) single linkage; (2) mean/average linkage; and
(3) complete linkage. These inter-cluster distance measures correspond to taking: (1) the
shortest distance between any two points in two different clusters; (2) the arithmetic
mean of all pair-wise distances between points in two different clusters; and (3) the
largest distance between any two points in two different clusters, respectively. In contrast
to these techniques, Ward’s method (1963) assigns cases to clusters such that the within-
cluster variance of cases is minimized, which is a reflection of the basic idea behind
cluster analysis to separate cases into maximally homogenous groups that are maximally
different from each another (Rupp, 2013).
K-means cluster analysis is conceptually related to Ward’s method. Rupp (2013)
pointed out that the key similarity between these two techniques is that they both attempt

175
to minimize the within-group variance of cases in their respective clusters. The major
difference between them is that the latter technique is a non-hierarchical partitioning
clustering technique that allows for reallocation of cases across clusters during the
clustering process. Although not the only partitioning technique, Rupp (2013) stated that
k-means cluster analysis is probably the most commonly used partitioning technique. It
assumes a fixed number of clusters that are characterized by their means and requires the
algorithm to stop only when very minor improvements in the within-cluster variance can
be made by reallocation of cases. This algorithm iteratively estimates these means and
assigns cases to the cluster for which its distance to the cluster mean is smallest (Norusis,
2011). K-means cluster analysis was selected for use in the current research because it
allows the user to control the number of clusters to be analyzed.
Euclidean Distance versus Other Measures of Profile Similarity and Dissimilarity
Both hierarchical and non-hierarchical clustering techniques require selection of a
measure of profile similarity/dissimilarity. As mentioned earlier, these measures quantify
the direct distance between all cases individually in multivariate space (Rupp, 2013).
There are many measures of profile similarity/dissimilarity. To place the number into
perspective, at the time of this writing, there were 30 such measures available in SPSS
alone (Norusis, 2011).
Rupp (2013) asserted that the selection of this measure should be based on its
appropriateness for a given data set. For example, measurement scales, distributions of
variables, or the covariance structure may be used to guide selection. Some measures,
such as Euclidean distance, may be suitable only for continuous variables, while other
measures may be suitable only for categorical variables (Norusis, 2011). On these points,

176
correlation coefficients and distance measures (e.g., the Euclidean distance) appear to be
the most widely used in social science research (Aldenderfer & Blashfield, 1984;
DiStefano & Kamphaus, 2006). Euclidean distance was selected for use not only on
account of its popularity, but also because it captures information relevant to profile
shape in addition to profile level and dispersion (Skinner, 1978). Calculating the value of
Euclidean distance involves finding the difference between vectors of two cases, where
each vector is represented by a profile of scores across the set of variables used in the
cluster analysis (Aldenderfer & Blashfield, 1984; DiStefano & Kamphaus, 2006).
Previous Use of K-Means Cluster Analysis and Other Traditional Techniques
The aforementioned techniques have been used in various ways. Some
researchers have used multiple techniques in a competing fashion within the same study.
For example, Rice and Harris (1988) used a successive and multifaceted approach when
clustering forensic psychiatric patients with regard to common clinical problems (e.g.,
assaultiveness, active psychotic symptoms, social withdrawal). These researchers
compared cluster solutions of different sizes that were obtained by using both
agglomerative hierarchical techniques (i.e., complete, single and average linkage, and
Ward’s method) and non-hierarchical techniques (i.e., k-means cluster analysis). Rice and
Harris (1988) also compared cluster solutions that were obtained using different distance
measures (e.g., Euclidean and squared Euclidean distance). The various obtained cluster
solutions were evaluated in a sequential manner according to several criteria that included
cluster dispersion, clinical significance, and classification agreement. Results indicated
high agreement between the two strongest cluster solutions, which were obtained via k-
means cluster analysis and Ward’s method. Rice and Harris (1988), however, found that

177
k-means cluster analysis produced a more meaningful solution. More specifically, the
cluster solution obtained via the k-means cluster analysis was favoured because Ward’s
method clustered patients who displayed profound intellectual impairments along with
some high-functioning psychopaths. This finding was noteworthy given that Rice and
Harris (1988) pointed to earlier empirical investigations and Monte Carlo studies
showing that Ward’s method tended to generate better solutions than a variety of other
clustering techniques (see Blashfield, 1976, 1980).
Other researchers have used the techniques in a complementary manner. For
example, Holtzworth-Munroe, Meehan, Herron, Rehman, and Stuart (2000) used both
Ward’s method and k-means cluster analysis to subtype male batterers on dimensions
related to the severity of domestic violence, generality of violence outside the home, and
psychopathology. Results indicated that there was substantial concordance between these
two techniques regarding assignment of the offenders as either family only, borderline-
dysphoric, low-level antisocial, or generally violent-antisocial batterers. These
researchers decided for final cluster membership of each batterer to be based on the
cluster in which he appeared most often across several analyses. Such an approach may
be further contrasted against those of other researchers who have used Ward’s method
first on a dataset to indicate the number of clusters to be formed when performing a
subsequent k-means cluster analysis (e.g., Stewart, Zack, Collins, Klein, & Fragopoulos,
2008).
Importantly, other researchers have acceptably chosen to use only k-means cluster
analysis in their research (e.g., McKillop and Nielson, 2011), albeit with more specialized
indicators of the optimal number of clusters to retain (e.g., The CH Index; Calinski &

178
Harabasz, 1974). This latter approach was used in the current study because calculation
of the CH Index involves comparisons of between-cluster and within-cluster variance.
Like k-means cluster analysis, use of the CH Index reflects the main idea behind cluster
analysis to identify maximally homogenous groups that are maximally different from
each other.
Latent Class Cluster Analysis versus K-Means Cluster Analysis
It should be highlighted that there are alternative approaches to the more
traditional clustering techniques described previously that may be used to identify
subtypes. Latent Class (LC) cluster analysis is a model-based clustering approach. In this
approach, a statistical model is presumed to underlie the population data in question and
the model is used to identify individuals that are similar to each other on a categorical
latent variable (Muthén & Muthén, 2004). LC cluster analysis includes both latent class
analysis (LCA) and latent profile analysis (LPA). The former technique is employed
when the variables being clustered are categorical in nature, and the latter technique is
used when the variables being clustered are continuous variables. More detailed
summaries of the major similarities and differences between LC cluster analysis and k-
means cluster analysis can be found elsewhere (see DiStefano & Kamphaus, 2006;
Eshghi, Haughton, Legrand, Skaletsky & Woolford, 2011; Magidson & Vermunt, 2002).
DiStefano and Kamphaus (2006) described the most common way in which LC
clustering techniques are used to uncover the number of subtypes in a dataset.
Summarized briefly, this was accomplished by testing the fit of the data to a variety of
models with increasing numbers of latent classes. It was further stated that model fit
tends to improve as classes are added, so the optimal solution was defined as the one with

179
the smallest number of classes while still obtaining satisfactory model fit. As with
structural equation modelling (SEM), with latent class clustering models there are various
statistical indicators that may be used to assess model fit (Herman, Ostrander, Walkup,
Silva, & March, 2007). These statistical indicators include, for example, the Akaike
information criteria (AIC), Bayesian information criteria (BIC), and entropy (Vermunt &
Magidson, 2002). Similar to the chi-square test, some of these indicators (e.g., the AIC
and BIC) provide an indication of the difference between an estimated model and the
observed data (Fox & Farrington, 2012). The indices may be used to compare different
solutions to determine which model fits the data best (DiStefano & Kamphaus 2006). It
should be noted that the final class solutions must be theoretically interpretable, however,
and not solely a reflection of optimal statistical fit (Vaughn, DeLisi, Beaver, & Howard,
2008).
Use of LC clustering techniques appears to be increasing in forensic-related
research (Fox & Farrington, 2012). This trend is probably partly related to improvements
in computer capabilities and the increased availability of software that can conveniently
perform the intensive calculations involved (Vermunt & Magidson, 2002). Additionally,
it has been argued that employing LC cluster analysis confers specific advantages over
more traditional forms of clustering analysis. On this point, Vermunt and Magidson
(2002) argued that one advantage of using a statistical model-based approach to cluster
analysis is that the selection of the cluster criterion is less arbitrary. These users also
argued that a model-based clustering approach does not require decisions to be made
about the scaling of variables. It was further argued that dealing with variables involving
different scale types could be done with relative ease, and that there are less subjective
180
criteria for making decisions about the number of clusters to retain and other model
characteristics.
Previous Use of K-Means Cluster Analysis and Latent Class Cluster Analysis
Not all of the arguments above have been fully accepted by users of LC cluster
analysis, however (e.g., Marsh, Lüdtke, Trauwein, & Morin, 2009). Moreover, research
appears to be mixed on whether one technique is superior to the other. For example,
while some researchers have reported that LC cluster analysis outperforms k-means
cluster analysis when using simulated data (e.g., Magidson & Vermunt, 2002), other
researchers have reported the opposite finding when using non-simulated data (e.g.,
Eshghi et al., 2011). Even still, other researchers have reported a high degree of overlap
in the results obtained from both techniques, further stating that each technique may
provide unique information (e.g., DiStefano & Kamphaus, 2006).
Some of the aforementioned findings led Eshghi and colleagues (2011) to argue
that it may be important for researchers to pay more attention to the underlying
assumptions associated with various subtyping techniques in order to choose the best one
for a given purpose. On this note, there is some indication that LC cluster analysis may be
inappropriate for use with small samples (see Marsh et al., 2009). Given this, k-means
cluster analysis was deemed to be more appropriate for the current study.
The above is not to say that techniques such as LCA or LPA would not be useful
for subtyping the behavioural effects of deception. Borrowing from a position taken by
Ruscio and Ruscio (2004) on the topic of taxometrics, the various subtyping techniques
may be highly useful when employed in a complementary fashion within a
comprehensive program of research. Ruscio and Ruscio (2004) pointed to a previous

181
recommendation of viewing more traditional forms of cluster analysis as a descriptive
tool that is potentially useful for summarizing data and posing hypotheses (Everitt, 1993).
Ruscio and Ruscio (2004) elaborated that other techniques, including LCA or LPA, may
be used later in a line of research for further elaborations or refinements. In other words,
LC cluster analysis may lead to further informative findings in this field when data from
larger samples is available for examination.

182
APPENDIX C.
CODING PROCEDURE FOR VERBAL AND NONVERBAL BEHAVIOUR
1. Smiles: View the video in slow-motion (two times slower than the default/natural
speed of play), and zoom in as close as possible on the participant’s face. Using a
counter, count the number of full-mouthed smiles observed in the lower half of the
face. For prototypes of smiles, see the relevant images presented in the Facial Action
Coding System (Ekman, Friesen, & Hagar, 2002). If helpful, identify a point in the
video when confident that a participant is smiling. Note the facial musculature during
the smile and look for that configuration again. Laughs may be used as a cue for
smiles; however, subtler smiles are not necessarily accompanied by laughs. When
smiles occur frequently in a short amount of time, they are counted separately if the
muscles in the face return to a baseline state in between the smiles, or if the smile
disappears completely and then another appears. Be careful not to count displays of
contempt as smiles.
2. Head movements: View the video in slow-motion (three times slower than the
default/natural speed of play), and zoom in as close as possible on the participant’s
head. Count the number of times the participant’s head moves. Count each nod,
shake, turn in direction, etc. To facilitate coding, start the video with the cursor on the
tip of the participant’s nose. Using a counter, count the number of times the cursor
must be moved to keep it on the tip of the participant’s nose. If using this approach,
the size of the screen and the screen settings must be consistent across the coding of
participants.

183
3. Illustrators: These are defined as hand movements that are used to supplement or
modify speech. Illustrators are hand gestures that convey information. They can be
any movement/gesture of the arms and/or hands, designed to demonstrate what the
participant is saying. Do not include when the participant simply touched/scratched
the hands, head, or body unless it was done to convey what was being said (see also
self-manipulations below). View the video in real-time and pay attention to language
to identify any movements of the hands that were used to convey/supplement speech.
Count these actions using a counter.
4. Self-manipulations: Using a counter, count the number of times the participant
touched the hands, body, or head (including the neck or hair) with his or her hands.
For hand-to-hand self-manipulations, view the video in slow-motion (one or two
times slower than the default/natural speed of play) and zoomed in as close as
possible. Count the number of times the hands come into contact with each other.
Hand-to-hand self-manipulations are counted separately if the hands come away
completely from each other and then come back together. If the participant begins the
narrative with hands together then this counts as the first hand-to-hand self-
manipulation. For hand-to-body self-manipulations, view the video in slow-motion
(one or two times slower than the default/natural speed of play) and zoomed in as
close as possible. Count the number of times the hands touch a part of the body other
than a hand or the face, head, neck, or hair. This may involve contact with the torso,
shoulders, legs or feet, or arms above the wrists, etc. To facilitate coding, count the
number of hand-to-body self-manipulations for the left hand and right hand
separately, then tally up the results for each to obtain the total number of hand-to-

184
body self-manipulations. For hand-to-head self-manipulations, view the video in real-
time and count the number of times the hands touch a part of the face, head, neck or
hair. Lastly, tally up the number of hand-to-hand, hand-to-body, and hand-to-head
self-manipulations to obtain the total number of self-manipulations.
5. Time / length of the narrative: Record the length of the video file. Convert the time
from minutes to seconds.
6. Words: From the transcript and using a counter, count every word and speech
hesitancy uttered. Do not count words in brackets [e.g., (speech pause) or (laughs)],
which may be present in some parts of the transcript.
7. Speech rate (words per minute): Take the total number of words and divide it by the
total length of the narrative in seconds. Next, take the obtained value and multiply it
by 60.
8. Filled pauses: From the transcript and using a counter, count the number of times the
participant says words like: “umm”, “err”, “ehh”, “uhh”, “ahh”, “well”, “hmm”, or
“mmm”.
9. Speech pauses: From the transcript and using a counter, count the number of speech
pauses that occurred. Speech pauses are identified in brackets [i.e., (speech pause) or
(pause)].
10. Self-references: From the transcript and using a counter, count the number of times a
participant referred to him or herself (e.g., using the words “I”, “me”, “my”, “we”,
“us”, “our”, “mine”, or “myself”).

185
REFERENCES
Aldenderfer, M. S., & Blashfield, R. K. (1984). Cluster analysis. Beverly Hills, CA:
Sage.
American Psychiatric Association. (2013). Diagnostic and statistical manual of mental
disorders (5th ed.). Arlington, VA: American Psychiatric Publishing.
Arbisi, P. A., & Ben-Porath, Y. S. (1995). An MMPI-2 infrequent response scale for use
with psychopathological populations: The infrequency-psychopathology scale, F(p).
Psychological Assessment, 7, 424-431. doi: 10.1037/1040-3590.7.4.424
Babiak, P., Folino, J., Hancock, J., Hare, R. D., Logan, M., Mayer, E. L., … Woodworth,
M. (2012). Psychopathy: An important forensic concept for the 21st century. FBI Law
Enforcement Bulletin, 81, 3-8.
Baer, R. A., & Miller, J. (2002). Underreporting of psychopathology on the MMPI-2: A
meta-analytic review. Psychological Assessment, 14, 16-26. doi: 10.1037//1040-
3590.14.1.16
Barrick, M., Shaffer, J., & DeGrassi, S. (2009). What you see may not be what you get:
Relationships among self-presentation tactics and ratings of interview and job
performance. Journal of Applied Psychology, 94, 1394-1411. doi: 10.1037/a0016532.
Baumeister, R. F. (1998). The self. In D. T. Gilbert, S. T. Fiske, & G. Lindzey (Eds.),
Handbook of social psychology (4th ed., Vol. 1, pp. 680-740). Boston: McGraw-Hill.
Baumeister, R. F., Wotman, S. R., & Stillwell, A. M. (1993). Unrequited love: On
heartbreak, anger, guilt, scriptlessness, and humiliation. Journal of Personality and
Social Psychology, 64, 377-394. doi: 10.1037/0022-3514.64.3.377

186
Bem, D. J. (1972). Self-perception theory. Advances in Experimental Social Psychology,
6, 1-62. doi: 10.1016/S0065-2601(08)60024-6
Bem, D. J. (2004). Writing the empirical journal article. In J. M. Darley, M. P. Zanna, &
H. L. Roediger III (Eds.). The compleat academic: A career guide (2nd ed.).
Washington, DC: American Psychological Association.
Blashfield, R. K. (1976). Mixture model tests of cluster analysis: Accuracy of four
agglomerative hierarchical methods. Psychological Bulletin, 83, 377-388. doi:
10.1037/0033-2909.83.3.377
Blashfield, R. K. (1980). Propositions regarding the use of cluster analysis in clinical
research. Journal of Consulting and Clinical Psychology, 48, 456-459. doi:
10.1037/0022-006X.48.4.456
Bond, C. F., & DePaulo, B. M. (2006). Accuracy of deception judgments. Personality
and Social Psychology Review, 10, 214-234. doi: 10.1207/s15327957pspr1003_2
Bond, C. F., & DePaulo, B. M. (2008). Individual differences in judging deception:
Accuracy and bias. Psychological Bulletin, 134, 477-492. doi: 10.1037/0033-
2909.134.4.477
Bond, C. F., Kahler, K. N., & Paolicelli, L. M. (1985). The miscommunication of
deception: An adaptive perspective. Journal of Experimental Social Psychology, 21,
331-345. doi: 10.1016/0022-1031(85)90034-4
Bond, C. F., & Robinson, M. (1988). The evolution of deception. Journal of Nonverbal
Behavior, 12, 295-307. doi: 10.1007/BF00987597
Buller, D. B., & Burgoon, J. K. (1996). Interpersonal deception theory. Communication
Theory, 6, 203-242. doi: 10.1111/j.1468-2885.1996.tb00127.x
187
Buss, D. M., & Duntley, J. D. (2008). Adaptations for exploitation. Group Dynamics:
Theory, Research, and Practice, 12, 53-62. doi: 10.1037/1089-2699.12.1.53
Butcher, J. N., Dahlstrom, W. G., Graham, J. R., Tellegen, A. M., & Kaemmer, B.
(1989). MMPI-2: Manual for administration and scoring. Minneapolis: University of
Minnesota Press.
Butcher, J. N., Graham, J. R., Ben-Porath, Y. S., Tellegen, A., Dahlstrom, W. G., &
Kaemmer, B. (2001). Minnesota Multiphasic Personality Inventory—2: Manual for
administration, scoring and interpretation (Rev. ed.). Minneapolis: University of
Minnesota Press.
Calinski, T., & Harabasz, J. (1974). A dendrite method for cluster analysis.
Communications in Statistics, 3, 1-27. doi: 10.1080/03610927408827101
Carsky, M., Selzer, M. A., Terkelsen, K. G., & Hurt, S. W. (1992). The PEH: A
questionnaire to assess acknowledgement of psychiatric illness. Journal of Nervous
and Mental Disease, 180, 458-464. doi: 10.1097/00005053-199207000-00009
Cohen, J. (1992). A power primer. Psychological Bulletin, 112, 155-159. doi:
10.1037/0033-2909.112.1.155
Cohen, J. (1994). The earth is round (p < .05). American Psychologist, 49, 997-1003. doi:
10.1037/0003-066X.49.12.997
Coid, J., Yang, M., Ullrich, S., Roberts, A., & Hare, R. D. (2009). Prevalence and
correlates of psychopathic traits in the household population of Great Britain.
International Journal of Law and Psychiatry, 32, 65-73. doi:
10.1016/j.ijlp.2009.01.002
188
Confer, J. C., Easton, J. A., Fleischman, D. S., Goetz, C. D., Lewis, D. M. G, Perilloux,
C., & Buss, D. M. (2010). Evolutionary psychology: Controversies, questions,
prospects, and limitations. American Psychologist, 65, 110-126. doi:
10.1037/a0018413
Clemans, W. V. (1966). An analytical and empirical examination of some properties of
ipsative measures (Psychometric Monograph No. 14). Richmond, VA: Psychometric
Society.
Costello, A. B., & Osborne, J. W. (2005). Best practices in exploratory factor analysis:
Four recommendations for getting the most from your analysis. Practical Assessment,
Research & Evaluation, 10, 1-9.
Darwin, C. (1859). On the origin of species by means of natural selection. London,
England: John Murray.
DePaulo, B. M., & Friedman, H. S. (1998). Nonverbal communication. In D. T. Gilbert,
S. T. Fiske, & G. Lindzey (Eds.), The handbook of social psychology (pp. 3-40).
Boston: McGraw-Hill.
DePaulo, B. M., Kashy, D., Kirkendol, S., Wyer, M., & Epstein, J. (1996). Lying in
everyday life. Journal of Personality and Social Psychology, 70, 979-995. doi:
10.1037/0022-3514.70.5.979
DePaulo, B. M., Lindsay, J. J., Malone, B. E., Muhlenbruck, L., Charlton, K., & Cooper,
H. (2003). Cues to deception. Psychological Bulletin, 129, 74-118. doi:
10.1037/0033-2909.129.1.74
189
DePaulo, B. M., Rosenthal, R., Rosenkrantz, J., & Green, C. R. (1982). Actual and
perceived cues to deception: A closer look at speech. Basic and Applied Social
Psychology, 3, 291-312. doi: 10.1207/s15324834basp0304_6
DiStefano, C., & Kamphaus, R. W. (2006). Investigating subtypes of child development:
A comparison of cluster analysis and latent class cluster analysis in typology creation.
Educational and Psychological Measurement, 66, 778-794. doi:
10.1177/0013164405284033
Ekman, P. (1988). Lying and nonverbal behaviour: Theoretical issues and new findings.
Journal of Nonverbal Behavior, 12, 163-175. doi: 10.1007/BF00987486
Ekman, P. (1992). Telling lies: Clues to deceit in the marketplace, politics, and marriage.
New York: W. W. Norton. (Original work published in 1985).
Ekman, P., & Friesen, W. V. (1969). Nonverbal leakage and clues to deception.
Psychiatry, 32, 88-106.
Ekman, P., & Friesen, W. V. (1972). Hand movements. Journal of Communication, 22,
353-374. doi: 10.1111/j.1460-2466.1972.tb00163.x
Ekman, P., & Friesen, W. V. (1984). Unmasking the face. Palo Alto, CA: Consulting
Psychologists Press.
Ekman, P., Friesen, W. V., & Hagar, J. C. (2002). Facial action coding system. Salt Lake
City, UT: Network Information Research. (Original work published in 1976).
Ekman, P., & O’Sullivan, M. (1991). Who can catch a liar? American Psychologist, 46,
913-920. doi: 10.1037/0003-066X.46.9.913
Eshghi, A., Haughton, D., Legrand, P., Skaletsky, M., & Woolford, S. (2011). Identifying
groups: A comparison of methodologies. Journal of Data Science, 9, 271-291.

190
Everitt, B. S. (1993). Cluster analysis (3rd ed.). London: Edward Arnold.
Eyre, S. L., Read, N. W., & Millstein, S. G. (1997). Adolescent sexual strategies. Journal
of Adolescent Health, 20, 286-293. doi: 10.1016/S1054-139X(96)00239-X
Farber, B. A. (2003). Patient self-disclosure: A review of the research. Journal of Clinical
Psychology, 59, 589-600. doi: 10.1002/jclp.10161
Farber, B. A. & Hall, D. (2002). Disclosure to therapists: What is and is not discussed in
psychotherapy. Journal of Clinical Psychology, 58, 359-370. doi: 10.1002/jclp.1148
Farwell, L. A., & Smith, S. S. (2001). Using brain MERMER testing to detect knowledge
despite efforts to conceal. Journal of Forensic Sciences, 46, 135-143. doi:
10.1520/JFS14925J
Fazel, S., & Danesh, J. (2002). Serious mental disorder in 23,000 prisoners: A systematic
review of 62 surveys. Lancet, 359, 545-550. doi: 10.1016/S0140-6736(02)07740-1
First, M. B. (2014). DSM-5 handbook of differential diagnosis. Washington, DC:
American Psychiatric Publishing, Inc.
First, M. B., Frances, A., & Pincus, H. A. (2002). DSM-IV-TR handbook of differential
diagnosis. Washington, DC: American Psychiatric Publishing, Inc.
First, M. B., Frances, A., & Pincus, H. A. (2004). DSM-IV-TR guidebook. Arlington, VA:
American Psychiatric Publishing, Inc.
Fox, B. H., & Farrington, D. P. (2012). Creating burglary profiles using latent class
analysis: A new approach to offender profiling. Criminal Justice and Behavior, 39,
1582-1611. doi: 10.1177/0093854812457921

191
Freund, K. (1965). Diagnosing heterosexual pedophilia by means of a test for sexual
interest. Behavior Research and Therapy, 3, 229-234. doi: 10.1016/0005-
7967(65)90031-8
Freund, K. (1967). Erotic preference in pedophilia. Behavior Research and Therapy, 5,
339-348. doi: 10.1016/0005-7967(67)90025-3
Frueh, B. C., Elhai, J. D., Grubaugh, A. L., Monnier, J., Kashdan, T. B., Sauvageor, J. A.,
et al. (2005). Documented combat exposure of US veterans seeking treatment for
combat-related post-traumatic stress disorder. British Journal of Psychiatry, 186, 467-
472. doi: 10.1192/bjp.186.6.467
Gillard, N. D., & Rogers, R. (2010). Malingering: Models and methods. In J. M. Brown
& E. A. Campbell (Eds.). The Cambridge Handbook of Forensic Psychology (pp.
683-689). Cambridge, UK: Cambridge University Press. doi:
http://dx.doi.org/10.1017/CBO9780511730290.083
Gough, H. G. (1954). Some common misconceptions about neuroticism. Journal of
Consulting Psychology, 18, 287-292. doi: 10.1037/h0062776
Granhag, P. A., & Strömwall, L. A. (2002). Repeated interrogations: Verbal and
nonverbal cues to deception. Applied Cognitive Psychology, 16, 243-257. doi
10.1002/acp.784
Hair, J. F., Jr., Black, W. C., Babin, B. J., & Anderson, R. E. (2009). Multivariate data
analysis (7th ed.). Upper Saddle River, NJ: Prentice Hall.
Hancock, J. T. (2007). Digital deception: When, where and how people lie online. In K.
McKenna, T. Postmes, U. Reips & A. N. Joinsen (Eds.). Oxford Handbook of Internet
Psychology (pp. 287-301). Oxford: Oxford University Press.
192
Hare, R. D. (1991). The Hare Psychopathy Checklist – Revised. Toronto, Ontario: Multi-
Health Systems.
Hare, R. D. (2003). The Hare Psychopathy Checklist – Revised (2nd ed.). Toronto,
Ontario: Multi-Health Systems.
Hare, R. D. (2006). Psychopathy: A clinical and forensic overview. Psychiatric Clinics of
North America, 29, 709-724. doi: 10.1016/j.psc.2006.04.007
Hare, R. D., & Neumann, C. S. (2008). Psychopathy as a clinical and empirical construct.
Annual Review of Clinical Psychology, 4, 217-246. doi:
10.1146/annurev.clinpsy.3.022806.091452
Hare, R. D., & Neumann, C. S. (2009). Psychopathy: Assessment and forensic
implications. Canadian Journal of Psychiatry, 54, 791-802.
Harris, G. T., Rice, M. E., Quinsey, V. L., Chaplin, T. C., & Earls, C. (1992).
Maximizing the discriminant validity of phallometric assessment data. Psychological
Assessment, 4, 502-511. doi: 10.1037//1040-3590.4.4.502
Hartwig, M. (2011). Methods in deception detection research. In B. Rosenfeld & S. D.
Penrod (Eds.), Research methods in forensic psychology (pp. 136-155). Hoboken, NJ:
John Wiley & Sons Inc.
Hartwig, M., & Bond, C. F. (2011). Why do lie-catchers fail? A lens model meta-analysis
of human lie judgments. Psychological Bulletin, 137, 643-659. doi:
10.1037/a0023589
Hartwig, M., & Bond, C. F. (2014). Lie detection from multiple cues: A meta-analysis.
Applied Cognitive Psychology. Advance online publication. doi: 10.1002/acp.3052

193
Hartwig, M., Granhag, P. A., Strömwall, L. A., & Vrij, A. (2004). Police officers’ lie
detection accuracy: Interrogating freely versus observing video. Police Quarterly, 7,
429-456. doi: 10.1177/1098611104264748
Herman, K. C., Ostrander, R., Walkup, J. T., Silva, S. G., & March, J. S. (2007).
Empirically derived subtypes of adolescent depression: Latent profile analysis of co-
occurring symptoms in the Treatment for Adolescents with Depression Study
(TADS). Journal of Consulting and Clinical Psychology, 75, 716-728. doi:
10.1037/0022-006X.75.5.716
Hill, C. E., & Knox, S. (2001). Self-disclosure. Psychotherapy: Theory, Research,
Practice, Training, 38, 413-417. doi: 10.1037/0033-3204.38.4.413
Holtzworth-Munroe, A., Meehan, J. C., Herron, K., Rehman, U., & Stuart, G. L. (2000).
Testing the Holtzworth-Munroe and Stuart (1994) batterer typology. Journal of
Consulting and Clinical Psychology, 68, 1000-1019. doi: 10.1037/0022-
006X.68.6.1000
Horvath, F., Blair, J. P., & Buckley, J. P. (2008). The behavioural analysis interview:
Clarifying the practice, theory and understanding of its use and effectiveness.
International Journal of Police Science and Management, 10, 101-118. doi:
10.1350/ijpsm.2008.10.1.68
Iacono, W. G., & Patrick, C. J. (2008). Assessing deception: Polygraph techniques and
integrity testing. In R. Rogers (Ed.). Clinical Assessment of Malingering and
Deception (3rd ed., pp. 255-273). New York, NY: The Guilford Press.
Inbau, F. E., Reid, J. E., Buckley, J. P., & Jayne, B. C. (2001). Criminal interrogation
and confessions (4th ed.). Gaithersburg, MD: Aspen.

194
Innocence Project. (2014). DNA exonerations nationwide. Retrieved from
http://www.innocenceproject.org/Content/DNA_Exonerations_Nationwide.php
Jackson, R. L., & Crawford, C. (2008). Response styles in the assessment of law
enforcement. In R. Rogers (Ed.). Clinical Assessment of Malingering and Deception
(3rd ed., pp. 376-388). New York, NY: The Guilford Press.
John, O. P., Donahue, E. M., & Kentle, R. L. (1991). The Big Five Inventory:
Versions 4 and 54. Technical Report, Institute of Personality and Social
Research, University of California, Berkeley, CA.
John, O. P., Naumann, L. P., & Soto, C. J. (2008). Paradigm shift to the integrative
big-five trait taxonomy: History, measurement, and conceptual Issues. In O. P.
John, R. W. Robins, & L. A. Pervin (Eds.), Handbook of personality: Theory
and research (pp. 114-158). New York, NY: Guilford Press.
Juodis, M., Woodworth, M., Porter, S., & ten Brinke, L. (2009). Partners in crime:
A comparison of individual and multi-perpetrator homicides. Criminal Justice
and Behavior, 36, 824-839. doi: 10.1177/0093854809337822
Kassin, S. M. (2012). Paradigm shift in the study of human lie-detection: Bridging
the gap between science and practice. Journal of Applied Research in Memory
and Cognition, 1, 118-119. doi: http://dx.doi.org/10.1016/j.jarmac.2012.02.004
Kassin, S. M., Drizin, S. A., Grisso, T., Gudjonsson, G. H., Leo, R. A., & Redlich, A. D.
(2010). Police-induced confessions: Risk factors and recommendations. Law and
Human Behavior, 34, 3-38. doi: 10.1007/s10979-009-9188-6

195
Kassin, S. M., & Fong, C. T. (1999). I’m innocent! Effects of training on judgments of
truth and deception in the interrogation room. Law and Human Behavior, 23, 499-
516. doi: 10.1023/A:1022330011811
King, M. F., & Bruner, G. C. (2000). Social desirability bias: A neglected aspect of
validity testing. Psychology & Marketing, 17, 79-103. doi: 10.1002/(SICI)1520-
6793(200002)17:2<79::AID-MAR2>3.0.CO;2-0
Knapp, M. L., Hart, R. P., & Dennis, H. S. (1974). An exploration of deception as a
communication construct. Human Communication Research, 1, 15-29. doi:
10.1111/j.1468-2958.1974.tb00250.x
Köhnken, G., & Steller, M. (1988). The evaluation of the credibility of child witness
statements in the German procedural system. In G. Davies & J. Drinkwater (Eds.),
The child witness: Do the courts abuse children? (Issues in Criminological and Legal
Psychology, no. 13) (pp. 37-45). Leicester, England: British Psychological Society.
Kraemer, H. C., Kazdin, A. E., Offord, D. R., Kessler, R. C., Jensen, P. S. & Kupfer, D.
J. (1997). Coming to terms with the terms of risk. Archives of General Psychiatry, 54,
337-343. doi: 10.1001/archpsyc.1997.01830160065009.
Lang, P., Bradley, M., & Cuthbert, B. N. (1999). International affective picture system
(IAPS): Instruction manual and affective ratings (Tech. Rep. No. A-4). Gainsville,
FL: University of Florida, The Center for Research in Psychophysiology.
Langleben, D. D., Loughead, J. W., Bilker, W. B., Ruparel, K., Childress, A., R., Busch,
S. I., & Gur, R. C. (2005). Telling truth from lie in individual subjects with fast event-
related fMRI. Human Behavior Mapping, 26, 262-272. doi: 10.1002/hbm.20191

196
Langleben, D. D., Schroeder, L., Maldjian, J. A., Gur, R. C., McDonald, S., Ragland, J.
D., O’Brien, C. P., & Childress, A. R. (2002). Brain activity during simulated
deception: An event-related functional magnetic resonance study. NeuroImage, 15,
727-732. doi: http://dx.doi.org/10.1006/nimg.2001.1003
Lanyon, R. I., & Thomas, M. L. (2008). Detecting deception in sex offender assessment.
In R. Rogers (Ed.). Clinical Assessment of Malingering and Deception (3rd ed., pp.
285-300). New York, NY: The Guilford Press.
Laurenceau, J., -P., Barrett, L. F., & Rovine, M. J., (2005). The interpersonal process
model of intimacy in marriage: A daily diary and multilevel modeling approach.
Journal of Family Psychology, 19, 314-323. doi: 10.1037/0893-3200.19.2.314
Loftus, E. F. (2011). Intelligence gathering post-9/11. American Psychologist, 66, 532-
541. doi: 10.1037/a0024614
MacQueen, J. (1967). Some methods of classification and analysis of multivariate
observations. In L. M. Le Cam & J. Neyman (Eds.), Proceedings of the fifth Berkeley
symposium on mathematical statistics and probability (Vol. 1, pp. 281-297).
Berkeley, CA: University of California Press.
Magidson, J., & Vermunt, J. K. (2002a). Latent class models for clustering: A
comparison with K-means. Canadian Journal of Marketing Research, 20, 37-44.
Mann, S., Vrij, A., & Bull, R. (2004). Detecting true lies: Police officers’ ability to detect
suspects’ lies. Journal of Applied Psychology, 89, 137-149. doi: 10.1037/0021-
9010.89.1.137
Marsh, H. W., Lüdtke, O., Trautwein, U., & Morin, A. J. S. (2009). Classical latent
profile analysis of academic self-concept dimensions: Synergy of person- and
197
variable-centered approaches to theoretical models of self-concept. Structural
Equation Modeling, 16, 191-225. doi: 10.1080/10705510902751010
McCarthy, A., & Lee, K. (2009). Children’s knowledge of deceptive gaze cues and its
relation to their actual lying behavior. Journal of Experimental Child Psychology,
103, 117-134. doi: 10.1016/j.jecp.2008.06.005
McKillop, J. M., & Nielson, W. R. (2011). Improving the usefulness of the
Multidimensional Pain Inventory. Pain Research & Management, 16, 239-244.
Meissner, C. A., & Kassin, S. M. (2002). “He’s guilty!”: Investigator bias in judgments
of truth and deception. Law and Human Behavior, 26, 469-480. doi:
10.1023/A:1020278620751
Mittenberg, W., Patton, C., Canyock, E. M., & Condit, D. C. (2002). Base rates of
malingering and symptom exaggeration. Journal of Clinical and Experimental
Neuropsychology, 24, 1094-1102. doi: 10.1076/jcen.24.8.1094.8379
Monroe, M. (1993). Uncontrollable falling down and motor-mouth are proximal risk
factors for geriatric profanity disorder: Evidence from a four-wave longitudinal study.
In B. Goodman (Ed.), Owning your okayness: Therapist’s guide to treatment of the
feel bad rainbow (pp. 116-135). Ogdenville, NT: Calmwood Mental Hospital.
Morey, L. C. (1991). Personality Assessment Inventory professional manual. Odessa, FL:
Psychological Assessment Resources.
Murphy, L., Fedoroff, J. P., Martineau, M. (2009). Canada’s sex offender registries:
Background, implementation, and social policy considerations. Canadian Journal of
Human Sexuality, 18, 61-72.
198
Muthén, B., & Muthén, L. K. (2004). MPLUS: User’s guide (3rd ed.). Los Angeles:
Author.
National Research Council (2003). The polygraph and lie detection. Committee to
Review the Scientific Evidence on the Polygraph. Washington, DC: The National
Academic Press.
Neumann, C. S., & Hare, R. D. (2008). Psychopathic traits in a large community sample:
Links to violence, alcohol use, and intelligence. Journal of Consulting and Clinical
Psychology, 76, 893-899. doi: 10.1037/0022-006X.76.5.893
Norusis, M. (2011). IBM SPSS Statistics 19 statistical procedures companion. Old
Tappan, NJ: Pearson.
Nunnally, J. C. (1978). Psychometric Theory (2nd ed.). New York: McGraw-Hill.
Otto, R. K. (2008). Challenges and advances in assessment of response styles in forensic
examination contexts. In R. Rogers (Ed.), Clinical assessment of malingering and
deception (3rd ed., pp. 365-375). New York, NY: The Guilford Press.
Paulhus, D. L. (1991). Measurement and control of response bias. In J. P.
Robinson, P. R. Shaver, & L. S. Wrightsman (Eds.), Measures of personality
and social psychological attitudes (pp. 17-59). New York: Academic Press.
Paulhus, D. L., & Williams, K. M. (2002). The dark triad of personality:
Narcissism, Machiavellianism, and psychopathy. Journal of Research in
Personality, 36, 556-563. doi: 10.1016/S0092-6566(02)00505-6
Pavlidis, J., Eberhardt, N. L., & Levine, J. A. (2002). Seeing through the face of
deception. Nature, 415, 35. doi: 10.1038/415035a

199
Porter S., Doucette, N., Earle, J., & MacNeil, B. (2008). ‘Halfe the world knowes not
how the other halfe lies’: Investigation of cues to deception exhibited by criminal
offenders and non-offenders. Legal and Criminological Psychology, 13, 27-38. doi:
10.1348/135532507X186653
Porter, S., Juodis, M., ten Brinke, L. M., Klein, R., Wilson, K. (2010). Evaluation of the
effectiveness of a brief deception detection training program. The Journal of Forensic
Psychiatry & Psychology, 21, 66-76. doi: 10.1080/14789940903174246
Porter, S., & ten Brinke, L. (2008). Reading between the lies: Identifying concealed and
falsified emotions in universal facial expressions. Psychological Science, 19, 508-
514. doi: 10.1111/j.1467-9280.2008.02116.x
Porter, S., & ten Brinke, L. (2009). Dangerous decisions: A theoretical framework for
understanding how judges assess credibility in the courtroom. Legal and
Criminological Psychology, 14, 119-134. doi: 10.1348/135532508X281520
Porter, S., & ten Brinke, L. (2010). The truth about lies: What works in detecting high-
stakes deception? Legal and Criminological Psychology, 15, 57-75. doi:
10.1348/135532509X433151
Porter, S., Woodworth, M., & Birt, A. R. (2000). Truth, lies, and videotape: An
investigation of the ability of federal parole officers to detect deception. Law and
Human Behavior, 24, 643-658. doi: 10.1023/A:1005500219657
Quinsey, V. L., & Chaplin, T. C. (1988). Preventing faking in phallometric assessments
of sexual preference. Annals of the New York Academy of Sciences, 528, 49-58. doi:
10.1111/j.1749-6632.1988.tb50849.x
200
Quinsey, V. L., Steinman, C. M., Bergersen, S. G., and Holmes, T. F. (1975). Penile
circumference, skin conductance, and ranking responses of child molesters and
“normals” to sexual and non-sexual visual stimuli. Behavior Therapy, 6, 213-219.
doi: 10.1016/S0005-7894(75)80143-2
Quinsey, V. L., Harris, G. T., Rice, M. E., & Cormier, C. A. (2006). Violent offenders:
Appraising and managing risk (2nd ed.). Washington: American Psychological
Association.
R. v. B.(K.G.). 1993. CanLII 116 (S.C.C.), (1993), 79 C.C.C. (3d) 257 (S.C.C.).
Raskin, D. C., & Steller, M. (1989). Assessing the credibility of allegations of child
sexual abuse: Polygraph examinations and statement analysis. In H. Wegener, F.
Losel, & J. Haisch (Eds.), Criminal behavior and the justice system (pp. 290-302).
New York: Springer.
Resnick, P. J., & Knoll, J. L. (2008). Malingered psychosis. In R. Rogers (Ed.). Clinical
Assessment of Malingering and Deception (3rd ed., pp. 51-68). New York, NY: The
Guilford Press.
Rogers, R. (1984). Towards and empirical model of malingering and deception.
Behavioral Sciences and the Law, 2, 93-112. doi: 10.1002/bsl.2370020109
Rogers, R. (2008a). An introduction to response styles. In R. Rogers (Ed.), Clinical
assessment of malingering and deception (3rd ed., pp. 3-13). New York, NY: The
Guilford Press.
Rogers, R., (2008b). Structured interviews and dissimulation. In R. Rogers (Ed.). Clinical
Assessment of Malingering and Deception (3rd ed., pp. 301-322). New York, NY:
The Guilford Press.

201
Rogers, R. (2008c). Current status of clinical methods. In R. Rogers (Ed.). Clinical
Assessment of Malingering and Deception (3rd ed., pp. 391-410). New York, NY:
The Guilford Press.
Rogers, R. (2008d). Detection strategies for malingering and defensiveness. In R. Rogers
(Ed.). Clinical Assessment of Malingering and Deception (3rd ed., pp. 14-35). New
York, NY: The Guilford Press.
Rogers, R. (Ed.) (2008e). Clinical Assessment of Malingering and Deception (3rd ed.).
New York, NY: The Guilford Press.
Rogers, R. (2008f). Researching response styles. In R. Rogers (Ed.). Clinical Assessment
of Malingering and Deception (3rd ed., pp. 411-434). New York, NY: The Guilford
Press.
Rogers, R., Bagby, R. M., & Chakraborty, D. (1993). Feigning schizophrenic disorders
on the MMPI-2: Detection of coached simulators. Journal of Personality Assessment,
60, 215-226. doi: 10.1207/s15327752jpa6002_1
Rogers, R., Bagby, R. M., & Dickens, S. E. (1992). Structured Interview of Reported
Symptoms (SIRS) and professional manual. Odessa, FL: Psychological Assessment
Resources.
Rogers, R., & Bender, S. D. (2003). Evaluation of malingering and deception. In A. M.
Goldstein (Ed.), Comprehensive handbook of psychology: Forensic psychology (vol.
11; pp. 109-129). Hoboken, NJ: John Wiley & Sons, Inc. doi:
10.1002/0471264385.wei11074

202
Rogers, R., & Bender, S. D. (2012). Evaluation of malingering and related response
styles. In R. K. Otto & I. B. Weiner (Eds.), Handbook of psychology, Vol. 11:
Forensic psychology (2nd ed.; pp. 517-540). Hoboken, NJ: John Wiley & Sons Inc.
Rogers, R., Boals, A., & Drogin, E. Y. (2011). Applying cognitive models of deception to
national security investigations: Considerations of psychological research, law, and
ethical practice. Journal of Psychiatry & Law, 39, 339-364.
Rogers, R., & Gillard, N. D. (2011). Research methods for the assessment of
malingering. In B. Rosenfeld & S. D. Penrod (Eds.), Research methods in forensic
psychology (pp. 174-188). Hoboken, NJ: John Wiley & Sons Inc.
Rogers, R., & Gillard, N. D. (2013). Assessment of malingering on psychological
measures. In G. P. Koocher, J. C. Norcross, & B. A. Greene (Eds.), Psychologists’
desk reference (3rd ed., pp. 36-40). New York, NY: Oxford University Press.
Rogers, R., & Granacher, R. P., Jr. (2011). Conceptualization and assessment of
malingering. In E. Y. Drogin, F. M. Datillio, R. L. Sadoff, & T. G. Gutheil (Eds.),
Handbook of forensic assessment: Psychological and psychiatric perspectives (pp.
659-678). Hoboken, NJ: John Wiley & Sons Inc.
Rogers, R., & Jackson, R. L. (2005). Sexually violent predators: The risky enterprise of
risk assessment. The Journal of the American Academy of Psychiatry and the Law,
33, 523-528.
Rogers, R., Salekin, R. T., Sewell, K. W., Goldstein, A., & Leonard, K. (1998). A
comparison of forensic and nonforensic malingerers: A prototypical analysis of
explanatory models. Law and Human Behavior, 22, 353-367. doi:
10.1023/A:1025714808591

203
Rogers, R., Sewell, K., & Goldstein, A. (1994). Explanatory models of malingering: A
prototypical analysis. Law and Human Behavior, 18, 543-552. doi:
10.1007/BF01499173
Rice, M. E., & Harris, G. T. (1988). An empirical approach to the classification and
treatment of maximum security psychiatric patients. Behavioral Sciences & the Law,
6, 497-514. doi: 10.1002/bsl.2370060407
Rupp, A. A. (2013). Clustering and classification. In T. D. Little (Ed.), The Oxford
handbook of quantitative methods (Vol. 2: Statistical Analysis, pp. 517-550). New
York: Oxford University Press.
Ruscio, J., & Ruscio, A. M. (2004). Clarifying boundary issues in psychopathology: The
role of taxometrics in a comprehensive program of structural research. Journal of
Abnormal Psychology, 113, 24-38. doi: 10.1037/0021-843X.113.1.24
Salekin, R. T., Kubak, F. A., & Lee, Z. (2008). Deception in children and adolescents. In
R. Rogers (Ed.), Clinical assessment of malingering and deception (3rd ed., pp. 343-
364). New York, NY: The Guilford Press.
Sapir, A. (1987/2000). The LSI course on scientific content analysis (SCAN). Phoenix,
AZ: Laboratory for Scientific Interrogation.
Serota, K. B., Levine, T. R., & Boster, F. J. (2010). The prevalence of lying in America:
Three studies of self-reported lies. Human Communication Research, 36, 2-25. doi:
10.1111/j.1468-2958.2009.01366.x
Shaw, J., Porter, S., & ten Brinke, L. (2013). Catching liars: Training mental health and
legal professionals to detect extremely high-stakes lies. Journal of Forensic
Psychiatry & Psychology, 24, 145-159. doi: 10.1080/14789949.2012.752025

204
Siegman, A. W., & Reynolds, M. A. (1983). Self-monitoring and speech in feigned and
unfeigned lying. Journal of Personality and Social Psychology, 45, 1325-1333. doi:
10.1037/0022-3514.45.6.1325
Sinclair, C., & Pettifor, J. (2001). Companion manual to the Canadian Code of Ethics for
Psychologists (2nd printing). Ottawa, ON: Canadian Psychological Association.
Skinner, H. A. (1978). Differentiating the contribution of elevation, scatter and shape in
profile similarity. Educational and Psychological Measurement, 38, 297-308. doi:
10.1177/001316447803800211
Sporer, S. L. (1997). The less travelled road to truth: Verbal cues in deception detection
in accounts of fabricated and self-experienced events. Applied Cognitive Psychology,
11, 373-397. doi: 10.1002/(SICI)1099-0720(199710)11:5<373::AID-
ACP461>3.0.CO;2-0
Sporer, S. L., & Schwandt, B. (2006). Paraverbal indicators of deception: A meta-
analytic synthesis. Applied Cognitive Psychology, 20, 421-446. doi: 10.1002/acp.1190
Sporer, S. L., & Schwandt, B. (2007). Moderators of nonverbal indicators of deception: A
meta-analytic synthesis. Psychology, Public Policy, and Law, 13, 1-34. doi:
10.1037/1076-8971.13.1.1
SPSS. (2006). SPSS 15.0 for Windows. Chicago, IL: Author.
Steadman, H., Osher, F., Robbins, P., Case, B., & Samuels, S. (2009). Prevalence of
serious mental illness among jail inmates. Psychiatric Services, 60, 761-765. doi:
10.1176/appi.ps.60.6.761
205
Stein, L. A. R., & Rogers, R. (2008). Denial and misreporting of substance abuse. In R.
Rogers (Ed.). Clinical Assessment of Malingering and Deception (3rd ed., pp. 87-
108). New York, NY: The Guilford Press
Steller, M. (1989). Recent developments in statement analysis. In J. C. Yuille (Ed.),
Credibility assessment (pp. 135-154). Deventer, Netherlands: Kluwer.
Steller, M., & Boychuk, T. (1992). Children as witnesses in sexual abuse cases:
Investigative interview and assessment techniques. In H. Dent & R. Flin (Eds.),
Children as witnesses (pp. 47-73). New York: John Wiley & Sons, Inc.
Steller, M., & Köhnken, G. (1989). Criteria-Based Content Analysis. In D. C. Raskin
(Ed.), Psychological methods in criminal investigation and evidence (pp. 217-245).
New York: Springer-Verlag.
Stewart, S. H., Zack, M., Collins, P., Klein, R. M., & Fragopoulos, F. (2008). Subtyping
pathological gamblers on the basis of affective motivations for gambling: Relations to
gambling problems, drinking problems, and affective motivations for drinking.
Psychology of Addictive Behaviors, 22, 257-268. doi: 10.1037/0893-164X.22.2.257
Systat Software. (2007). SYSTAT 12. San Jose, CA: Author.
Tabachnick, B. G., & Fidell, L. S. (2007). Using multivariate statistics (5th ed.). Boston,
MA: Allyn & Bacon/Pearson Education.
Taylor, S., Frueh, B. C., & Asmundson, G. J. G. (2007). Detection and management of
malingering in people presenting for treatment of posttraumatic stress disorder:
Methods, obstacles, and recommendations. Journal of Anxiety Disorders, 21, 22-41.
doi: 10.1016/j.janxdis.2006.03.016
206
ten Brinke, L., & Porter, S. (2013). Discovering deceit: Applying laboratory and field
research in the search for truthful and deceptive behavior. In B. S. Cooper, D. Griesel,
& M. Temes (Eds.), Applied issues in investigative interviewing, eyewitness memory,
and credibility assessment (pp. 221-237). New York, NY: Springer.
The Global Deception Research Team. (2006). A world of lies. Journal of Cross-Cultural
Psychology, 37, 60-74. doi: 10.1177/0022022105282295
Tubbs, P., & Pomerantz, A. M. (2001). Ethical behaviors of psychologists: Changes since
1987. Journal of Clinical Psychology, 57, 395-399. doi: 10.1002/jclp.1021
Vaughn, M. G., DeLisi, M., Beaver, K. M., & Howard, M. O. (2008). Toward a
quantitative typology of burglars: A latent profile analysis of career offenders.
Journal of Forensic Sciences, 53, 1387-1392. doi: 10.1111/j.1556-4029.2008.00873.x
Vermunt, J. K., & Magidson, J. (2002). Latent class cluster analysis. In. J. A. Hagenaars
& A. L. McCutcheon (Eds.), Applied latent class analysis (pp. 89-106). Cambridge,
UK: Cambridge University Press.
Vitacco, M. J. (2008). Syndromes associated with deception. In R. Rogers (Ed.), Clinical
assessment of malingering and deception (3rd ed., pp. 39-50). New York, NY: The
Guilford Press.
Vitacco, M. J., & Rogers, R. (2010). Assessment of malingering in correctional settings.
In C. L. Scott (Ed.), Handbook of correctional mental health (2nd ed., pp. 255-276).
Arlington, VA: American Psychiatric Publishing, Inc.
Vrij, A. (2008). Detecting lies and deceit: Pitfalls and opportunities (2nd ed.).
Chichester, UK: Wiley.

207
Vrij, A. (2011). Self-deception, lying, and the ability to deceive. Behavioral and Brain
Sciences, 34, 40-41. doi: 10.1017/S0140525X10002293
Vrij, A. (2014). Interviewing to detect deception. European Psychologist, 19, 184-194.
doi: 10.1027/1016-9040/a000201
Vrij, A., & Granhag, P. A. (2012). Eliciting cues to deception and truth: What matters are
the questions asked. Journal of Applied Research in Memory and Cognition, 1, 110-
117. doi: 10.1016/j.jarmac.2012.02.004
Vrij, A., Granhag, P. A., & Mann, S. (2010b). Good liars. The Journal of Psychiatry &
Law, 38, 77-98.
Vrij, A., Granhag, P. A., Mann, S., & Leal, S. (2011). Outsmarting the liars: Toward a
cognitive lie detection approach. Current Directions in Psychological Science, 20,
28-32. doi: 10.1177/0963721410391245
Vrij, A., Granhag, P. A., & Porter, S. (2010a). Pitfalls and opportunities in nonverbal and
verbal lie detection. Psychological Science in the Public Interest, 11, 89-121. doi:
10.1177/1529100610390861
Vrij, A., Leal, S., Mann, S., & Fisher, R. (2012). Imposing cognitive load to elicit cues to
deceit: Inducing the reverse order technique naturally. Psychology, Crime & Law, 18,
579-594. doi: 10.1080/1068316X.2010.515987
Vrij, A., & Mann, S. (2001). Who killed my relative? Police officers’ ability to detect
real-life high-stake lies. Psychology, Crime and Law, 7, 119-132. doi:
10.1080/10683160108401791
Vrij, A., Mann, S. A., & Fisher, R. P. (2006). An empirical test of the Behavior Analysis
Interview. Law and Human Behavior, 30, 329-345. doi: 10.1007/s10979-006-9014-3

208
Vrij, A., Mann, S. A., Fisher, R. P., Leal, S., Milne, R. Bull, R. (2008). Increasing
cognitive load to facilitate lie detection: The benefit of recalling an event in reverse
order. Law and Human Behavior, 32, 253-265. doi: 10.1007/s10979-007-9103-y
Vrij, A., Mann, S., & Leal, S. (2013). Deception traits in psychological interviewing.
Journal of Police and Criminal Psychology, 28, 115-126. doi: 10.1007/s11896-013-
9125-y
Ward, J. H. (1963). Hierarchical grouping to optimize an objective function. Journal of
the American Statistical Society, 58, 236-244. doi: 10.1080/01621459.1963.10500845
Walters, G. D. (1988). Assessing dissimulation and denial on the MMPI in a sample of
maximum security, male inmates. Journal of Personality Assessment, 52, 465-474.
doi: 10.1207/s15327752jpa5203_8
Wooley, C. N., Rogers, R., Fiduccia, C. E., & Kelsey, K. (2013). The effectiveness of
substance use measures in the detection of full and partial denial of drug use.
Assessment, 20, 670-680. doi: 10.1177/1073191112447098
Wynia, M. K., Cummins, D. S., VanGeest, J. B., & Wilson, I. B. (2000). Physician
manipulation of reimbursement rules for patients: Between a rock and a hard place.
Journal of the American Medical Association, 283, 1858-1865. doi:
10.1001/jama.283.14.1858.
Yuan, Y., Li, C-T., & Wilson, R. (2008). Partial mixture model for tight clustering of
gene expression time-course. BMC Bioinformatics, 9, 287-303. doi: 10.1186/1471-
2105-9-287

209
Zuckerman, M., DePaulo, B. M., & Rosenthal, R. (1981). Verbal and nonverbal
communication of deception. In L. Berkowitz (Ed.), Advances in experimental social
psychology (Vol. 14, pp. 1-59). New York: Academic Press.
Copyright © 2022 FDOKUMEN