The behavioural economics of music - DepositOnce
313
The Behavioural Economics of Music A framework for investigating music decision making vorgelegt von M. Sc. Manuel Anglada-Tort ORCID: 0000-0003-3421-9361 an der Fakultät I – Geistes- und Bildungswissenschaften der Technischen Universität Berlin zur Erlangung des akademischen Grades Doktor der Philosophie - Dr. phil. - genehmigte Dissertation Promotionsausschuss: Vorsitzender: Prof. Dr. Stefan Weinzierl Gutachter: Prof. Dr. Jochen Steffens Gutachter: Prof. Dr. Daniel Müllensiefen Tag der wissenschaftlichen Aussprache: 16. Oktober 2020 Berlin 2021
-
Upload
khangminh22 -
Category
Documents
-
view
3 -
download
0
Transcript of The behavioural economics of music - DepositOnce
The Behavioural Economics of Music A framework for investigating music decision making
vorgelegt von
M. Sc.
Manuel Anglada-Tort
ORCID: 0000-0003-3421-9361
an der Fakultät I – Geistes- und Bildungswissenschaften
der Technischen Universität Berlin
zur Erlangung des akademischen Grades
Doktor der Philosophie
- Dr. phil. -
genehmigte Dissertation
Promotionsausschuss:
Vorsitzender: Prof. Dr. Stefan Weinzierl
Gutachter: Prof. Dr. Jochen Steffens
Gutachter: Prof. Dr. Daniel Müllensiefen
Tag der wissenschaftlichen Aussprache: 16. Oktober 2020
Berlin 2021


Acknowledgements
I am grateful for the inspiration, opportunities and support that have enabled me to realise this thesis. I would like to express this gratitude in particular to Prof. Dr. Stefan Weinzierl for the opportunity to complete my PhD at the Technische Universität Berlin. I would also like to deeply thank Prof. Dr. Daniel Müllensiefen, who was so significant in my decision to pursue a PhD. From playing football together at Goldsmiths to our collaborations on many different research projects, I have learned so much from Daniel. The continuous support, motivation, and expertise which I have received from Prof. Dr. Jochen Steffens, have also been so important to guarantee the successful completion of this work. In addition, I wish to thank Dr. Nikhil Masters, whose critical approach and expertise in economics has made him truly indispensable in the consolidation of the framework presented in this thesis.
I gratefully acknowledge the funding for my PhD from the Studienstiftung des deutschen Volkes. The stability and prestige provided by this scholarship has been crucial to my research. I would like to further extend my sincere thanks to the collaborators that have contributed to the scientific publications conducted within this thesis, namely: Prof. Dr. Adrian North, Dr. Amanda Krause, Dr. Diana Omigie, Dr. Sanfilippo, Steve Keller, and Tabitha Trahan. I have also been fortunate to work with some incredibly talented Masters students: Björn Thorleifsson, Thomas Baker, Till Noé, Kerry Schofield, Emily-Beth Hill, Heather Thuering, and Pattera Sutanthavibul; and I thank them for their enthusiasm and dedication.
It is really important to me to also acknowledge the support and love of my family - my parents, Lluís and Marta, and my sisters, Berta and Mei. None of this would have been possible without them giving me such a wonderful childhood and great education. My mother and grandfather first awakened my enthusiasm for music and my father taught me the most important thing: to observe the world around us and ask critical questions. I also wish to thank my friends in Barcelona, London, and Berlin for providing the happy distractions in and out of the research world enabling me to enjoy my life to the full. Finally, special thanks to my partner, Haia, for her unconditional love, support and valuable insights.
Abstract
Music-related decision making encompasses a wide range of behaviours including those associated with music composition and performance, listening choices, music consumption, and decisions involving music education and therapy. Although research programmes in psychology and economics have contributed to an improved understanding of music-related behaviour, historically these disciplines have been unconnected. In this thesis, I present The Behavioural Economics of Music (BEM), a novel research framework that promotes the study of musical behaviour using the tools of behavioural economics. Behavioural economics aims to increase the explanatory power of neoclassical economics by relaxing the rationality assumptions of homo economicus, incorporating insights from an array of disciplines, including psychology, sociology, anthropology, biology, and neuroscience. Thus, the BEM offers an empirically supported set of new concepts and methods that can prove particularly suited to study the multi-faceted nature of music. Ten scientific publications were conducted to support this thesis at three distinct levels. Firstly, two literature reviews helped in understanding the need and value of the BEM. Secondly, four empirical studies examined whether core concepts from behavioural economics, such as bounded rationality and cognitive heuristics, can increase our understanding of music decision making. Findings from these studies indicated that listeners are not utility maximisers who use all information and time available to make optimal musical choices. Instead, they are boundedly rational and, therefore, limited by their cognitive ability, time, and information available. Finally, a further four studies focused on the application of the BEM to improve music-related decision making in the real world. Two studies investigated decision making in the context of choosing music for branding and advertising and two other studies explored alternative methods to examine responses to music in the real world. Overall, these studies emphasize the synergistic benefits of the BEM to both psychologists and economists. Specifically, the BEM draws upon insights from a range of disciplines (including important work from music psychology and music cognition), whilst incorporating models from behavioural economic theory, thereby providing a framework that is wide in scope as well as internally consistent.
Table of contents
1 Introduction 1
1.1 Decision making in music psychology . . . . . . . . . . . . . . . . . . . . 1 1.2 Music decision making in economics . . . . . . . . . . . . . . . . . . . . . 3 1.3 The Behavioural Economics of Music (BEM) . . . . . . . . . . . . . . . . 5
1.3.1 Bounded rationality in music . . . . . . . . . . . . . . . . . . . . . 6 1.4 Research questions and aims . . . . . . . . . . . . . . . . . . . . . . . . . 8
2 Scientific Publications 9 2.1 Why the BEM? .................................................................................................... 11
2.1.1 Visualizing music psychology (S1) ........................................................ 11 2.1.2 The Behavioural Economics of Music (S2) ............................................ 12
2.2 Bounded rationality in music decision making ................................................... 15 2.2.1 The repeated recording illusion (S3) ...................................................... 15 2.2.2 False memories in music listening (S4) .................................................. 17 2.2.3 Names and titles matter: Linguistic fluency and the affect heuristic (S5) 17 2.2.4 The effect of name recognition on listener choices (S6) ........................ 18
2.3 Real world applications ....................................................................................... 20 2.3.1 Source effects on the evaluation of music for advertising (S7) .............. 20 2.3.2 The effect of music recognition on consumer choice (S8) ..................... 21 2.3.3 The busking experiment: A field study (S9) ........................................... 23 2.3.4 Popular music lyrics and musicians’ gender over time (S10) ................. 23
3 Discussion 25 3.1 Theoretical contributions ..................................................................................... 25 3.2 Practical contributions ......................................................................................... 28 3.3 Future directions .................................................................................................. 31 3.4 Conclusion ........................................................................................................... 37
Table of contents v
References 39
Appendix A Visualizing music psychology (S1) 44
Appendix B The Behavioural Economics of Music: Systematic review (S2) 72
Appendix C The repeated recording illusion (S3) 102
Appendix D False memories in music listening (S4) 130
Appendix E Names and titles matter: Linguistic fluency and the affect heuristic (S5) 161
Appendix F The effect of name recognition on listener choices (S6) 193
Appendix G Source effects on the evaluation of music for advertising (S7) 211
Appendix H The effect of music recognition on consumer choice (S8) 238
Appendix I The busking experiment: A field study (S9) 266
Appendix J Popular music lyrics and musicians’ gender over time (S10) 283
Chapter 1
Introduction
This thesis is organised as follows. The following parts of Chapter 1 introduce two disciplines that have been long concerned with the study of music decision making, i.e., music psychology and economics. The chapter follows by introducing the field of behavioural economics, highlighting its potential benefits for music research, such as the role of bounded rationality and related concepts. The chapter ends by outlining the research questions and aims that guided this work. Chapter 2 summarises the ten scientific publications conducted to support this thesis (see Table 2.1 for a list of publications; see Appendix A-J for the full texts), emphasising their value to the BEM. Chapter 3 provides a discussion of this work, focusing primarily on contributions and future directions.
1.1 Decision making in music psychology
Music psychology is a branch of psychology and musicology that aims to understand the psychological processes by which music is perceived, processed, responded to, created, and integrated into everyday life (see Hallam, Cross, & Thaut, 2016; Tan, Pfordresher, & Harré, 2017; Deutsch, 2013, for reviews). Decision making is inherent to many of these processes. In this thesis, this is referred to as music decision making - i.e., the cognitive process of evaluating and choosing between alternative options in any human behaviour related to music. This section introduces some of the most prominent areas in music psychology that rely on our understanding of music decision making.
Decision making is inherent in any creative process by which music is composed and impro- vised. The process of composing and improvising music can be understood as a complex sequence of judgments and decisions that involve both formal theoretical basis of music
1.2 Music decision making in economics
2
theory and creative basis mainly relying on aesthetic evaluations (e.g., Maeshiro, Nakayama, & Maeshiro, 2011). For instance, deciding how to frame a harmonic accompaniment in the context of a newly composed melody, how to extend an improvisation by using a motive heard earlier, or how to produce a hit song that results in millions of sales. Psychologists have begun to examine how composers make choices as part of the creative process (see Impett, 2016, for a review) or how musicians decide which note to play next while impro- vising (see Ashley, 2016, for a review). However, the decision making process underlying music composition and improvisation is still poorly understood and, therefore, could benefit significantly by considering insights from other disciplines, such as theoretical modelling and utility theory from economics.
Decision making also plays a fundamental role in music performance evaluation (see Waddell, 2018, for a review). Yet research on this topic within the field of music psychology raises serious questions about the reliability and consistency of music performance evaluation (Waddell, 2018). For example, jurors’ decisions in a high profile musical competition were significantly influenced by the order in which the candidates performed: those who performed first had a lower chance to win the competition, whereas those who performed later had a higher chance (Flôres & Ginsburgh, 1996). Other studies have identified several non-musical factors that can significantly bias the evaluation of music performances, including musicians’ body movements (Wöllner & Behne, 2011), race and gender (Elliott, 1995), and physical attractiveness (Griffiths, 2008). These findings illustrate the need to better understand and improve decision making processes in the context of evaluating music performances, such as increasing awareness between experts or using evaluative methods that are less prone to human errors.
Music decision making is also central to the study of music preferences and listening behaviour (see Lamont & Greasley, 2016; Lamont, Greasley, & Sloboda, 2016, for reviews). Advances in technology have played a major role in the way people listen to music in daily life, enabling them to listen to music in a wide variety of situations, such as whilst working, exercising, travelling, or relaxing (Lamont et al., 2016). In these contexts, researchers have identified several psychological needs that underlie listening behaviour, including distraction, motivation, attention, emotional regulation, and stress reduction (e.g., Greb, Schlotz, & Steffens, 2018; Linnemann, Wenzel, Grammes, Kubiak, & Nater, 2018; Saarikallio & Erkkilä, 2007). Nevertheless, despite the wide range of psychological approaches that have been used to investigate music preferences and listening behaviour, there is currently no unified theory that has successfully addressed the complexities of this topic and there is no model that can predict accurately a person’s preference or choice for music at any given point in time (Lamont & Greasley, 2016).
Finally, the process of selecting music in applied contexts is heavily reliant on our under- standing of music decision making. A clear example is the use of music in advertising and branding. In this context, choosing an effective music branding strategy can have a positive impact on consumers’ buying behaviour and attitudes towards brands (see Allan, 2007;
1.2 Music decision making in economics
3
North & Hargreaves, 2008; Oakes, 2007, for reviews). Nevertheless, a failure to adequately use music can result in detrimental effects on communication effectiveness and consumer behaviour (Allan, 2007; Lantos & Craton, 2012). Moreover, industry professionals often rely on their gut instinct and personal experience to make musical choices (Schramm & Spangardt, 2016). Thus, when choosing music for advertising is important to improve current practices by designing efficient, reliable, and unbiased methods.
Overall, music psychology has examined music decision making in a wide variety of sit- uations. However, this body of research is still relatively young and would benefit from using a more sophisticated and unified understanding of the processes underlying human judgments and decision making. This could be achieved by incorporating knowledge from other disciplines that have been long concerned with the study of human decision making, such as economics.
1.2 Music decision making in economics
Independent from music psychology, music-related decision making has also been studied through the lens of economics (see Byun, 2016; Cameron, 2015, 2016; Krueger, 2005; Tschmuck, 2017, for reviews). This research is mostly focused on economic decision making related to music, such as the behaviour of firms in the music industry (Burke, 1996; Sweeting, 2013; Rayna & Striukova, 2009), the economy of live music events (Decrop & Derbaix, 2014; Hiller, 2016; Holt, 2010; Larsen & Hussels, 2011; Mortimer, Nosko, & Sorensen, 2012), predicting music popularity in the charts (Bradlow & Fader, 2001; Elliott & Simmons, 2011; Hendricks & Sorensen, 2009; Stevans & Sessions, 2005; Strobl & Tucker, 2000), music consumption (Byun, 2016; Cameron, 2015), and music copyright and piracy (see Oberholzer-Gee & Strumpf, 2009; Varian, 2005, for reviews).
This body of research provides valuable insights to understand key phenomena that influence music consumption and shape the music market. For example, studies have found associ- ations between economic conditions and changes in the characteristics of popular music over time (Maymin, 2012; Pettijohn & Sacco, 2009; Pettijohn, Eastman, & Richard, 2012; Zullow, 1991): songs with faster tempo were most popular in good economic and social times (Pettijohn et al., 2012), whereas pessimistic rumination in popular music lyrics signifi- cantly predicted changes in consumption expenditures and General National Product (GNP) growth (Zullow, 1991). The economic effects of music piracy (illegally downloading and sharing music) have also generated great interest amongst economists (see Oberholzer-Gee & Strumpf, 2009; Varian, 2005). This is, in part, because the controversial results in the literature: while some studies show a relationship between the rise of music piracy and the decline in music sales (e.g., Liebowitz, 2004, 2006), others found little evidence for this causal relationship (e.g., Oberholzer-Gee & Strumpf, 2009). Another area of interest in the economics literature is the growing importance of the live music business. Here, studies suggest that the large decline in artists’ income from record sales has led to the increase in
1.2 Music decision making in economics
4
price for concert tickets (Larsen & Hussels, 2011; Mortimer et al., 2012; Tschmuck, 2017), which grew by 82% from 1996 to 2003 (Krueger, 2005).
The economic literature on music-related decision making relies on a simple but powerful model of behaviour put forward by standard economics: when making judgments and decisions, people do so by maximizing a utility function, using all information available, and processing this information with the appropriate time and mental resources (see Coleman & Fararo, 1992, for one of many reviews on rational choice theory). Thus, this body of research tends to assume that stakeholders such as composers, producers, artists, labels, and listeners are rational actors. This rational model of behaviour is useful in providing a coherent and internally consistent body of theory that offers rigorous and falsifiable models of human behaviour. For instance, using standard economics one can model a consumer’s rational choice between choosing to consume music over other goods, or the production and supply curves in a rational music market that leads to equilibrium price (Byun, 2016).
Overall, research on music decision making in economics provides highly valuable insights to understand how people consume music and key factors that shape the music market. Nevertheless, this body of research focuses mostly on economic decision making and does not consider the psychological underpinnings known to be involved when people create, perform, listen to, and respond to music. Importantly, the assumption of rationality put forward by standard economics has been strongly challenged in the last years. For example, laboratory and field experiments in both psychology and economics show that when making judgments and decisions, people are limited by their mental capacity, use heuristics to solve complex problems, their preferences are inconsistent over time, and their choices are influenced by social information, their current emotional state, and the context (see Dellavigna, 2009, for a review).
5 1.3 The Behavioural Economics of Music (BEM)
1.3 The Behavioural Economics of Music (BEM)
In recent years, researchers have begun to utilise theories and tools from behavioural eco-
nomics to study music-related decision making (e.g., Anglada-Tort & Müllensiefen, 2017;
Lonsdale & North, 2012). Behavioural economics is a scientific discipline that integrates
economics, psychology, and other social sciences to understand and improve judgments and
decision making of individuals and groups in a variety of domains (see Angner, 2012;
Cartwright, 2018, for introductory books; see Dhami, 2016, for a rigorous and detailed
analysis of the methodologies behind the field; see Kahneman, 2011; Tahler, 2015; Ariely,
2008, for informative books aimed to the general public). Behavioural economics arose from
a general discontent with the rational model of behaviour, stimulating diverse streams of
work that have expanded at a remarkable rate (Dhami, 2016). Thus, by increasing the
psychological underpinnings of standard economics, behavioural economics offers a more
realistic and comprehensive account of human judgments and decision making, generating
more accurate predictions and suitable methods for the study of human behaviour. This
thesis proposes The Behavioural Economics of Music (BEM), a novel interdisciplinary
approach to study the multi-faceted nature of musical behaviour by using knowledge and
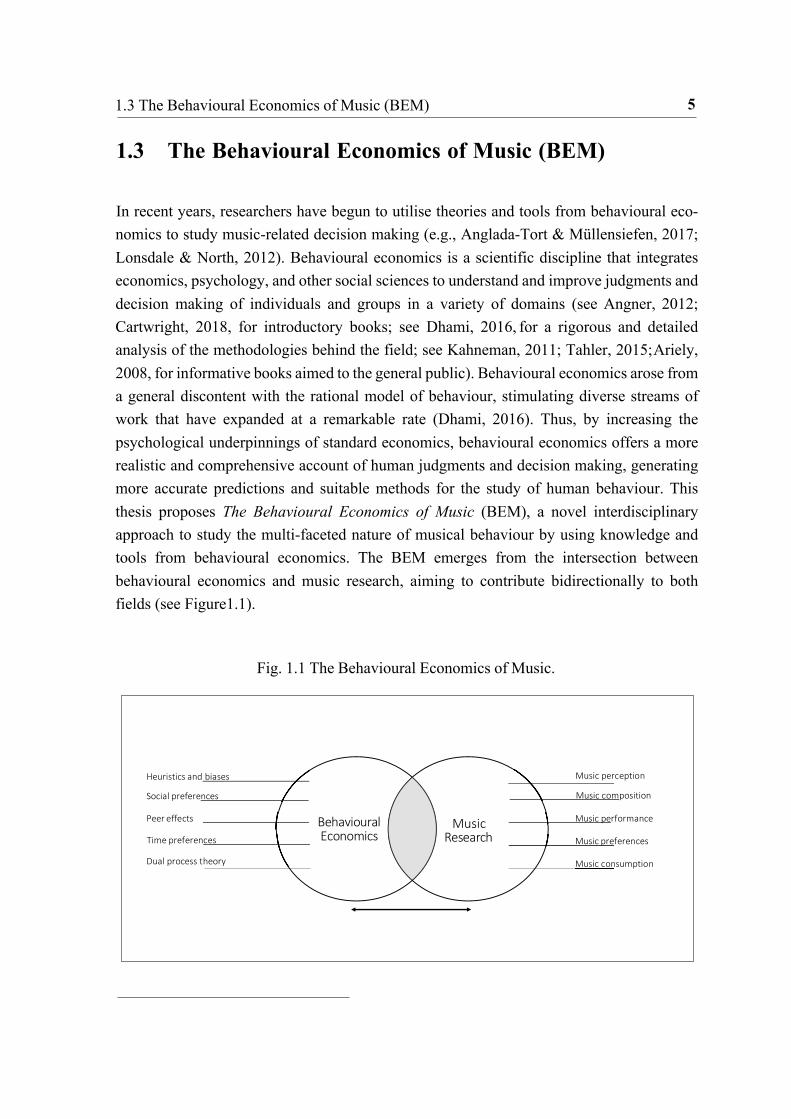
tools from behavioural economics. The BEM emerges from the intersection between
behavioural economics and music research, aiming to contribute bidirectionally to both
fields (see Figure1.1).
Fig. 1.1 The Behavioural Economics of Music.
Heuristics and biases
Social preferences
Music perception
Music composition
Peer effects Behavioural Music performance
Time preferences
Dual process theory
Economics
Music
Research Music preferences
Music consumption

6 1.3 The Behavioural Economics of Music (BEM)
When investigating music-related decision making, researchers from both economics and psychology stand to gain from utilising the behavioural economics toolkit. Economists studying music can benefit by moving away from the rigid neoclassical assumptions that music composers, performers and listeners are rational actors, and instead apply more empirically supported evidence when examining musical behaviour. Equally, since behavioural economics still maintains its economic identity in terms of having falsifiable models that are mathematically rigorous, psychologists can benefit from incorporating such theoretical approach to address key issues in music research that have eluded researchers so far.
Furthermore, behavioural economics is an established paradigm that has been hugely influential in a variety of domains, leading to new interdisciplinary fields. Examples include the behavioural economics of health (Blumenthal-Barby & Krieger, 2015; Rice, 2013), education (Jabbar, 2011), climate change and energy use (Arne Brekke & Johansson-Stenman, 2008; Frederiks, Stenner, & Hobman, 2015). At the same time, behavioural economics is being applied to a wide variety of institutions and companies all over the world, including governments, NGOs, and business entities such as Airbnb, Uber, and Google (e.g., Samson, 2017). Given that research in music decision making is still relatively young and has no research agenda dedicated to this area exclusively, there is great potential in incorporating insights from behavioural economics to study music decision making. This work can be an important step towards creating this.
Finally, today it remains unclear to which extent music may prove exceptional or congruent with general theories of human judgment and decision making. However, the rich, multisensory, aesthetic, social, and highly emotional nature of music may challenge some of these theories, enhancing their generalizability and scope. Music not only offers a unique spectrum of situations to study human decision making, but it is also an important cultural product, an artefact of society that is shaped with political and socioeconomic changes. Thus, investigating music decision making provides a novel testing ground for general theories that could reveal unique insights into behavioural economics.
1.3.1 Bounded rationality in music
Bounded rationality (Simon, 1955, 1982) is a core concept in behavioural economics that challenges the rational model of behaviour put forward by standard economics. According to bounded rationality, humans are limited by their mental capacity, available information, and time when making judgments and decisions. As a consequence, individuals seek decisions that satisfice (e.g., are good enough) rather than optimize (choosing the best possible decision). A central part of this thesis is to better understand bounded rationality in the context of music, as well as related concepts from behavioural economics that may help increase our understanding of music decision making. To illustrate how some of these concepts are particularly relevant in a music context, three examples are provided below:
7 1.3 The Behavioural Economics of Music (BEM)
First, extensive empirical evidence shows that to make efficient judgments and decisions under bounded rationality, people rely on cognitive biases and heuristics. Heuristics are mental shortcuts used by individuals to simplify complex decisions into easier to calculate operations. Although they allow individuals to make decisions quickly and efficiently, heuristics can systematically fail and lead to cognitive biases (see Dhami, 2016; Kahneman, 2011; Dawes & Hastie, 2010, for reviews). Heuristics and biases are highly relevant in a music context, both in terms of the perception of music and how people respond to it. For example, songs with more repetitive lyrics, which are easier to process in terms of information, may be perceived as being liked more (processing fluency); individuals may falsely remember sounds that come easily to the mind (availability heuristic); and listeners may evaluate a music experience based on the most intense moment and the end (peak-end rule).
Second, dual-process theory proposes a cognitive architecture based on two systems of processing that support bounded rationality (Kahneman, 2003). Whereas the emotional System-1 is unconscious, implicit, automatic, effortless and rapid, the cognitive System-2 is conscious, explicit, controlled, effortful and slow (see Evans, 2008, for a review). Our capacity for mental effort is limited and, consequently, mental processes will be assigned to one of the two systems based on how much mental effort they require. Thus, dual-process theories exploring the interaction between emotional and cognitive processes in the brain can be useful for understanding music performance and listening behaviour. For example, to determine the extent to which musicians’ decisions while performing are conscious or unconscious, and how these decisions may be influenced by music expertise.
Finally, in 2007, the critically acclaimed band Radiohead surprised the music industry by offering their new album “In Rainbows” as a digital download using a pay-what-you-want (PWYW) agreement. Essentially, this meant that fans could pay as much as they liked for the album, including a zero option. Although at odds with neoclassical economic theory, in which consumers would download the album for free, many fans made voluntary payments for the album. One possible explanation for such generous payments under PWYW is that individuals exhibit social preferences, i.e., they care about the preferences of others (see Fehr & Rangel, 2011, for a review). Thus, social preferences are an example of how individuals do not always act as self-interested decision-makers and their decisions are influenced by the context and information available.

1.4 Research questions and aims 8 1.4 Research questions and aims
This thesis had two main goals: (i) to gain a solid understanding of the role that behavioural economics can play to increase our understanding of music decision making, and (ii) to provide fruitful directions for future research. To achieve these goals, five research questions guided the present work:
• RQ1 - Where does music decision making sit within the music psychology literature?
• RQ2 - To date, which studies have utilised behavioural economics for research on music-related decision-making?
• RQ3 - How can insights from behavioural economics, such as bounded rationality, increase our understanding of musical behaviour?
• RQ4 - How can behavioural economics improve music-related decision making in real world applications?
• RQ5 - Which are the most fruitful areas for future research on the BEM?
Ten scientific publications were conducted to address these research questions (see section 2 for a summary of these studies highlighting their main contributions to the present thesis; see Appendix A-J for the full texts). First, a bibliometric study visualizing all published literature on music psychology enabled the identification of an important gap in the music psychology literature, namely, a lack of a research agenda dedicated exclusively on music decision making (RQ1; see Appendix A for the full text). Second, a systematic literature review was conducted to provide an up-to-date account of all studies that have utilised behavioural economics for music research thus far (RQ2; Appendix B). The systematic review also identified fruitful avenues for future research on the BEM (RQ5). Furthermore, four empirical studies examined the role of bounded rationality and related concepts to increase our understanding of music decision making (RQ3; Appendix C-F). Finally, four studies focused on applying insights from behavioural economics to improve music-related decision making in real world situations (RQ4; Appendix G-J).
Chapter 2 Scientific Publications
This thesis was written cumulatively and comprises a total of ten scientific publications (seven are published in scientific journals and three were in preparation at the time this thesis was submitted). The full texts of the ten publications are provided in the appendices of this thesis as pre-prints. This section briefly summarises these publications (see Table 2.1 for a list of publications), highlighting their main contribution to the BEM. Although the methods and scientific goals of these studies are diverse, they can be categorised into three groups depending on how they support this thesis: Why the BEM? (see section 2.1), bounded rationality in music decision making (see section 2.2), and real world applications (see section 2.3).
10
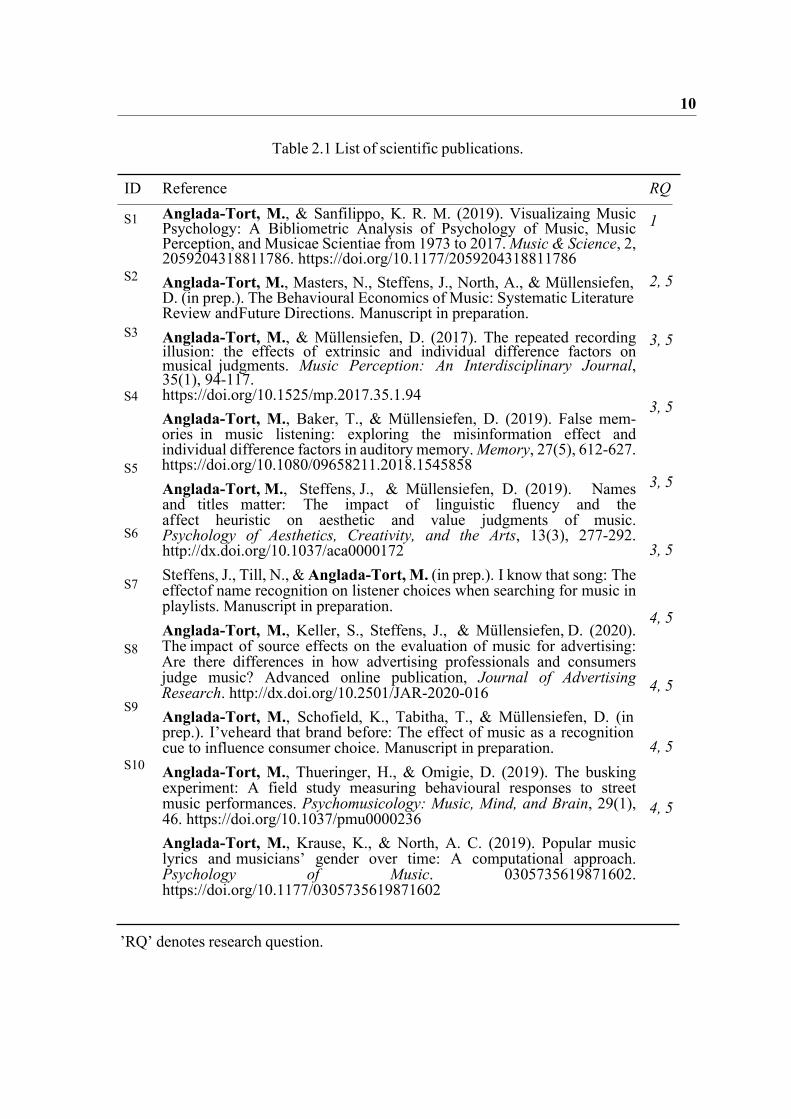
Table 2.1 List of scientific publications.
ID Reference RQ
S1
S2
S3
S4
S5
S6
S7
S8
S9
S10
Anglada-Tort, M., & Sanfilippo, K. R. M. (2019). Visualizaing Music Psychology: A Bibliometric Analysis of Psychology of Music, Music Perception, and Musicae Scientiae from 1973 to 2017. Music & Science, 2, 2059204318811786. https://doi.org/10.1177/2059204318811786 Anglada-Tort, M., Masters, N., Steffens, J., North, A., & Müllensiefen, D. (in prep.). The Behavioural Economics of Music: Systematic Literature Review and Future Directions. Manuscript in preparation. Anglada-Tort, M., & Müllensiefen, D. (2017). The repeated recording illusion: the effects of extrinsic and individual difference factors on musical judgments. Music Perception: An Interdisciplinary Journal, 35(1), 94-117. https://doi.org/10.1525/mp.2017.35.1.94 Anglada-Tort, M., Baker, T., & Müllensiefen, D. (2019). False mem- ories in music listening: exploring the misinformation effect and individual difference factors in auditory memory. Memory, 27(5), 612-627. https://doi.org/10.1080/09658211.2018.1545858 Anglada-Tort, M., Steffens, J., & Müllensiefen, D. (2019). Names and titles matter: The impact of linguistic fluency and the af fect heuristic on aesthetic and value judgments of music. Psychology of Aesthetics, Creativity, and the Arts, 13(3), 277-292. http://dx.doi.org/10.1037/aca0000172 Steffens, J., Till, N., & Anglada-Tort, M. (in prep.). I know that song: The effect of name recognition on listener choices when searching for music in playlists. Manuscript in preparation. Anglada-Tort, M., Keller, S., Steffens, J., & Müllensiefen, D. (2020). The impact of source effects on the evaluation of music for advertising: Are there differences in how advertising professionals and consumers judge music? Advanced online publication, Journal of Advertising Research. http://dx.doi.org/10.2501/JAR-2020-016 Anglada-Tort, M., Schofield, K., Tabitha, T., & Müllensiefen, D. (in prep.). I’ve heard that brand before: The effect of music as a recognition cue to influence consumer choice. Manuscript in preparation. Anglada-Tort, M., Thueringer, H., & Omigie, D. (2019). The busking experiment: A field study measuring behavioural responses to street music performances. Psychomusicology: Music, Mind, and Brain, 29(1), 46. https://doi.org/10.1037/pmu0000236 Anglada-Tort, M., Krause, K., & North, A. C. (2019). Popular music lyrics and musicians’ gender over time: A computational approach. Psychology of Music. 0305735619871602. https://doi.org/10.1177/0305735619871602
1
2, 5
3, 5
3, 5
3, 5
3, 5
4, 5
4, 5
4, 5
4, 5
’RQ’ denotes research question.

11 2.1 Why the BEM?
2.1 Why the BEM?
To understand the need and value of the BEM, two literature reviews were conducted addressing three research questions (see Table 2.1; RQ1, 2 and 5). The first literature review identified a notable gap in the music psychology literature, showing that to date, there is no research agenda dedicated exclusively to decision making in the context of music (RQ1). The second review constitutes one of the core parts of this thesis, providing an up-to-date account of studies utilising behavioural economics for research on music decision making (RQ2), as well as identifying fruitful avenues for future research on the BEM (RQ5).
2.1.1 Visualizing music psychology (S1)
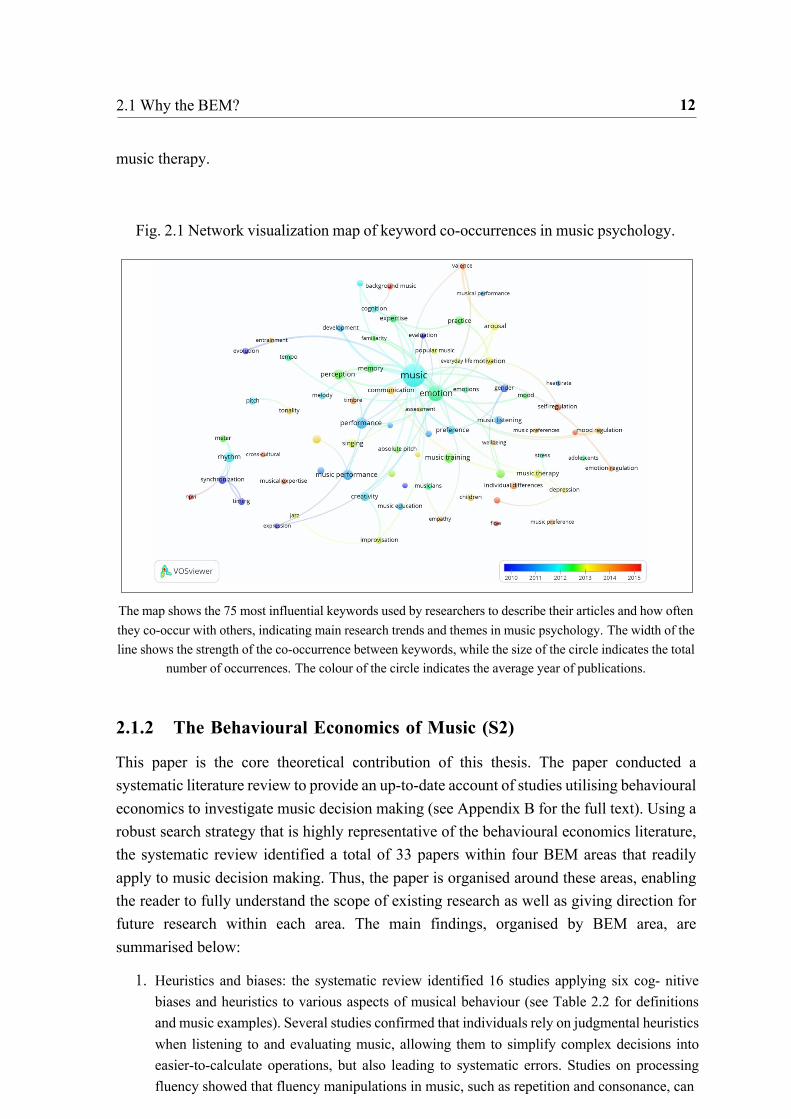
This study aimed to analyse all literature published in the three most prominent scientific journals in the field of music psychology (see Appendix A for the full text). Namely, Psychology of Music, Music Perception, and Musicae Scientiae. Using all available literature in Scopus, a total of 2,089 peer-reviewed articles, 2,632 authors, and 49 countries were analysed, covering a period of 44 years (1973–2017). Visualization and bibliometric techniques were used to investigate the growth of publications, author and country productivity, collaborations, and research trends. Thus, the results of this study present objective and measurable patterns seen across the development of music psychology research included within these three journals. For example, from 1973 to 2017, there was a clear increase in music psychology research, with a total growth rate of 11%. A core feature of this paper is the visualization network map of music psychology (see Figure2.1). The network map shows the most influential keywords in the literature (i.e., keywords used by the authors to define their publications) as well as how they co-occur with others, creating different research trends and themes. For instance, the keywords “music” and “emotion” are the most influential keywords in the literature, which is in line with the general interest and significant increase in research on music and emotion (e.g., Eerola & Vuoskoski, 2013). The map also provides an overlay visualization that adds a time dimension to each keyword (i.e., colour-coding each keyword based on the average publication year), which suggests different trends in the popularity of each keyword over time. Thus, the network map is useful in summarizing the complex field of music psychology in a single picture.
Overall, this study contributed to the literature by providing the first large-scale bibliometric analysis that investigates general research trends and gaps in the field of music psychology. Using bibliometric techniques to visualize the past and present of research in music psychology enables critical observations and conclusions, opening many interesting avenues for future research in the field. In the context of the BEM, this was important to identify a gap in the literature. Namely, there is currently no research agenda dedicated exclusively to study decision making in music. Despite this, decision making is inherent to many of the influential concepts and research trends identified in the study, including, music performance, creativity, improvisation, perception, music preference, music listening, and
12 2.1 Why the BEM?
music therapy.
Fig. 2.1 Network visualization map of keyword co-occurrences in music psychology.
The map shows the 75 most influential keywords used by researchers to describe their articles and how often
they co-occur with others, indicating main research trends and themes in music psychology. The width of the
line shows the strength of the co-occurrence between keywords, while the size of the circle indicates the total
number of occurrences. The colour of the circle indicates the average year of publications.
2.1.2 The Behavioural Economics of Music (S2)
This paper is the core theoretical contribution of this thesis. The paper conducted a systematic literature review to provide an up-to-date account of studies utilising behavioural economics to investigate music decision making (see Appendix B for the full text). Using a robust search strategy that is highly representative of the behavioural economics literature, the systematic review identified a total of 33 papers within four BEM areas that readily apply to music decision making. Thus, the paper is organised around these areas, enabling the reader to fully understand the scope of existing research as well as giving direction for future research within each area. The main findings, organised by BEM area, are summarised below:
1. Heuristics and biases: the systematic review identified 16 studies applying six cog- nitive biases and heuristics to various aspects of musical behaviour (see Table 2.2 for definitions and music examples). Several studies confirmed that individuals rely on judgmental heuristics when listening to and evaluating music, allowing them to simplify complex decisions into easier-to-calculate operations, but also leading to systematic errors. Studies on processing fluency showed that fluency manipulations in music, such as repetition and consonance, can
13 2.1 Why the BEM?
influence music perception and, in turn, affect preferential judgments. Finally, studies on framing effects found that presenting the same music stimuli with different contextual information can systematically change a person’s preferences for the music.
2. Social decision making: nine studies showed that music decision-making is largely influenced by social preferences and information. Firstly, social preferences, such as reciprocity and guilt, are important to understand consumers’ motivation to engage in different revenue models for music consumption, including voluntary payments for music. Social preferences can also help better understand pricing strategies in the concert industry. Secondly, peer effects can play a determinant role in music preferences and choices, which in turn can influence the music market and determine outcomes such as the next successful artist or hit song.
3. Behavioural time preferences: four studies found that behavioural time preferences can give a deeper insight into how music is valued and consumed over time. Two studies found that when consuming music online, consumers disproportionally prioritise im- mediate benefits over future gains, providing solid evidence for hyperbolic discounting in music consumption. The two other studies focused on time preferences for music consumption in terms of its hedonic value. They showed that listeners’ ability to predict pleasure in their future music consumption is rather low and when choosing music repeatedly over time, listeners do not always choose music that maximizes their pleasure but instead seek variety.
4. Dual-process theory: four studies showed that exploring the interaction between System-1 and System-2 processes in the brain can help increase our understanding of how musicians make decisions while performing, as well as the mediating role of music expertise.

14 2.1 Why the BEM?
Overall, the examination of these studies enabled to gain a solid understanding of the role that behavioural economics has played in music research thus far. Furthermore, it was clear from the review that the BEM is a relatively new approach and behavioural economics has just begun to be applied in the domain of music. For example, the vast majority of the retrieved studies were published in the last 10 years and over half of them in the last five years. The findings also suggested that the BEM is fairly multi-disciplinary. While half of the studies came from the music psychology literature, the other half came from behavioural economics. Finally, the paper concluded by providing fruitful ideas and directions for future research, both within the identified BEM areas and beyond.
Table 2.2 Heuristics and biases identified in the systematic review (S2).
Definition Music Example
Processing fluency
Availability heuristic
Represent- ativeness heuristic
Affect heuristic
Framing effect
Peak-end rule
Human tendency to evaluate easy-to-process
information more positively than similar but
more difficult-to-process information (Reber
et al., 2004).
When judging the frequency and probability of
events, people rely on the ease with which
examples come to their minds (Tversky &
Kahneman, 1974).
People estimate the likelihood of an event by
comparing it to an existing event of similar
characteristics that already exists in their
minds (Tversky & Kahneman, 1974).
Human tendency to rely heavily upon our
emotional state when making judgments and
decisions (Slovic et al., 2002).
People make decisions based on how the
options are presented or “framed” (e.g., as a
loss or as a gain) (Kahneman & Tversky,
1979).
People judge an experience largely based on
how they felt at its peak (i.e., the most intense
point) and at its end (Kahneman &
Fredrickson, 1993).
Songs with more repetitive lyrics, which
are easier to process in terms of
information, are perceived as being liked
more (Nunes et al., 2015).
Listeners falsely remember sounds that
come easily to their minds (Vuvan et al.,
2014).
Stereotypes between music genres and fans
can be misjudged (Lonsdale & North,
2011).
Individuals evaluate music based on an
associated emotional feeling (Anglada-
Tort et al., 2018)
Contextual information presented with mu-
sic can systematically affect a person’s
judgment of the music (North &
Hargreaves, 2004)
Listeners evaluate a music experience
based on the most intense moment and at
the end (Rozin, et al., 2004).

15 2.2 Bounded rationality in music decision making
2.2 Bounded rationality in music decision making
To further develop the BEM within this thesis, four empirical studies explored whether bounded rationality and related insights from behavioural economics may prove valuable for music research (RQ3). The four studies showed that when making musical judgments and decisions, listeners are limited by their mental capacity (e.g., memory constraints), time, and information available (e.g., song titles, post-event information, or descriptions about the performer). Consequently, listeners rely on cognitive biases and heuristics that do not depend on the music stimuli themselves.
2.2.1 The repeated recording illusion (S3)
This study investigated the extent to which listeners are limited by memory constraints and the context when evaluating music performance (see Appendix C for the full text). To do so, a novel experimental paradigm was developed, namely, the repeated recording illusion. In this paradigm, participants (N= 72) were told to listen to three “different” musical performances of an original piece. However, unbeknownst to them, they were exposed to the same repeated recording three times in succession. Each time, the recording was accompanied by a text suggesting a low, medium, or high prestige of the performer. Participants evaluated the music using several rating scales (i.e., liking, timing, tone quality, pitch accuracy, emotional quality, and overall quality). The procedure was repeated using a piece of highly familiar rock music and a piece of unfamiliar classical music. Potentially related extrinsic factors (i.e., explicit information and repeated exposure) and individual differences were investigated.
Results showed that most participants (75%) believed that they had heard different musical performances while, in fact, they were identical. In the two music conditions, participants evaluated the same recording significantly more positively when it was presented with a high-prestige text compared to low and medium texts. However, the position of the recording only had a significant impact on the familiar music condition. To capture higher-order interactions between extrinsic and individual difference factors, a regression tree model based on permutation tests was computed. The dependent variable was a one-factor solution indicated by a Principal Component Analysis, where a negative score indicated an overall negative evaluation and a positive score an overall positive evaluation. The predictor variables were prestige effect, the position of the recording, music conditions (classical-unfamiliar vs. rock-familiar), and seven individual difference variables, including age, personality, and musicality. Figure2.2 shows the structure of the regression tree the model, which shows that only 3 of the predictor variables had a significant impact on performance evaluation, i.e., explicit information, repeated exposure, and the music condition. Note that none of the individual differences were significant predictors.
Overall, these findings highlight the fallibility of music evaluation and support the notion of bounded rationality in musical behaviour, showing that musical judgments are limited by

16 2.2 Bounded rationality in music decision making
memory constraints, cognitive biases, and the context. The influence of explicit information and the partial effect of repeated exposure are discussed in terms of the anchoring heuristic (Tversky & Kahneman, 1974) and processing fluency (Reber, Schwarz, & Winkielman, 2004).
Fig. 2.2 The influence of non-musical factors on music performance evaluation.
The regression tree model is useful in identifying the most predictive variables influencing music performance
evaluation, as well as specific conditions that lead to particularly high (left node, 3) and low (right node, 9)
ratings. The tree model can be interpreted by starting at the top and following each branch down, to arrive at a
terminal node. A path to a terminal node describes the interaction of experimental conditions that lead to a
particular subset of ratings.

17 2.2 Bounded rationality in music decision making
2.2.2 False memories in music listening (S4)
When people listen to music or experience music in a live performance, they are normally exposed to related information at some point after the event. This study examined for the first time whether post-event misinformation can induce false memories in music (see Appendix D for the full text). Though misinformation effects have been demonstrated extensively within visual tasks, they have not yet been explored in the realm of non-visual auditory stimuli. Besides, the study explored individual difference factors potentially associated with false memory susceptibility in music, including age, suggestibility, personality, and musical training. In two music recognition tasks, participants (N = 151) listened to an initial music track, which unbeknownst to them was missing an instrument. They were then presented with post-event information which either did or did not suggest the presence of the missing instrument. The presence of misinformation resulted in significantly poorer performance on the music recognition tasks (d = .43), suggesting the existence of false musical memories. A random forest analysis indicated that music expertise was not significantly associated with misinformation susceptibility. These findings support previous research on the fallibility of human memory and demonstrate, to some extent, the generality of the misinformation effect to a non-visual auditory domain. In the context of the BEM, this is important to further support the notion of bounded rationality in music decision making, in particular demonstrating the fallibility of memory-based judgments of music.
2.2.3 Names and titles matter: Linguistic fluency and the affect heuris-
tic (S5)
This study manipulated the song titles and artist names presented with music to examine the influence of two well- known heuristic principles on aesthetic and value judgments of music: processing fluency (Experiment 1) (Reber et al., 2004) and the affect heuristic (Experiment 2) (Slovic, Finucane, Peters, & MacGregor, 2002) (see Appendix E for the full text). In Experiment 1, the same music excerpts were presented with easy-to-pronounce (fluent) and difficult-to-pronounce (disfluent) names. The names consisted of a list of Turkish names that were shown in a previous study to be fluent or disfluent to English speakers (Shah & Oppenheimer, 2007). Native English-speaking participants (N= 48) listened to the music stimuli and provided evaluations on different scales measuring aesthetic properties (e.g., like, emotional expressivity, quality) and subjective value of the music (e.g., likelihood to attend a concert of the artists or to recommend the song to a friend). Results indicated a main significant effect of fluency. In particular, participants evaluated the same music excerpts significantly more positively when presented with fluent names than when presented with disfluent names.
In Experiment 2 (N= 100), the same procedure was used, but instead manipulating the emotional content of the titles. Thus, the music excerpts were presented with positive (e.g.,
18 2.2 Bounded rationality in music decision making
Kiss), negative (e.g., Suicide), and neutral (e.g., Window) titles. This time, at the end of the experiment, participants also performed an unexpected free recall task (i.e., write down the songs they remembered). In both aesthetic and subjective value evaluations, presenting the music with negative titles resulted in the lowest judgments. When looking at the effects of emotionality on memory, results showed that music excerpts presented with neutral and negative titles were remembered significantly more often than positive titles.
Overall, these findings suggest that like any other human judgments, evaluations of music also rely on heuristic principles that do not necessarily depend on the aesthetic stimuli themselves. These heuristics operate even when the information processed is minimal, such as changing the linguistic properties of titles presented with music.
2.2.4 The effect of name recognition on listener choices (S6)
When searching for and choosing music in playlists, individuals may rely on judgment heuristics to make fast (in terms of computing time) and frugal (in the use of information) decisions. This study addressed this issue by investigating for the first time the role of the recognition heuristic on musical choices when listeners search for music in playlists (see Appendix F for the full text). The recognition heuristic states that when people are faced with recognised and unrecognised options, they infer that the recognized one has the higher value with respect to the criterion being judged and, therefore, they tend to choose it (Goldstein & Gigerenzer, 2002). In particular, the study extended the paradigm used in Oeusoonthornwattana and Shanks, 2010 to a listening task with 10 alternative choices, simulating a common listening playlist. Before the main experimental task, participants (German and English speakers) had to learn a list of Spanish names. This manipulation made it possible to create playlists using novel music paired with Spanish names that had been previously learned (i.e., recognisable) or were completely novel. In the main choosing task, participants were presented with ten songs in a playlist format and had to choose their favourite five. To study the role of recognition-based heuristics in the presence and absence of music information, participants searched for and selected music in two playlist conditions: a titles-only condition (where they could only choose music based on visual cues – i.e., the Spanish names) and a titles-and-music condition (where they could choose music based on both visual and auditory cues – i.e., they could also listen to the music).
19 2.2 Bounded rationality in music decision making
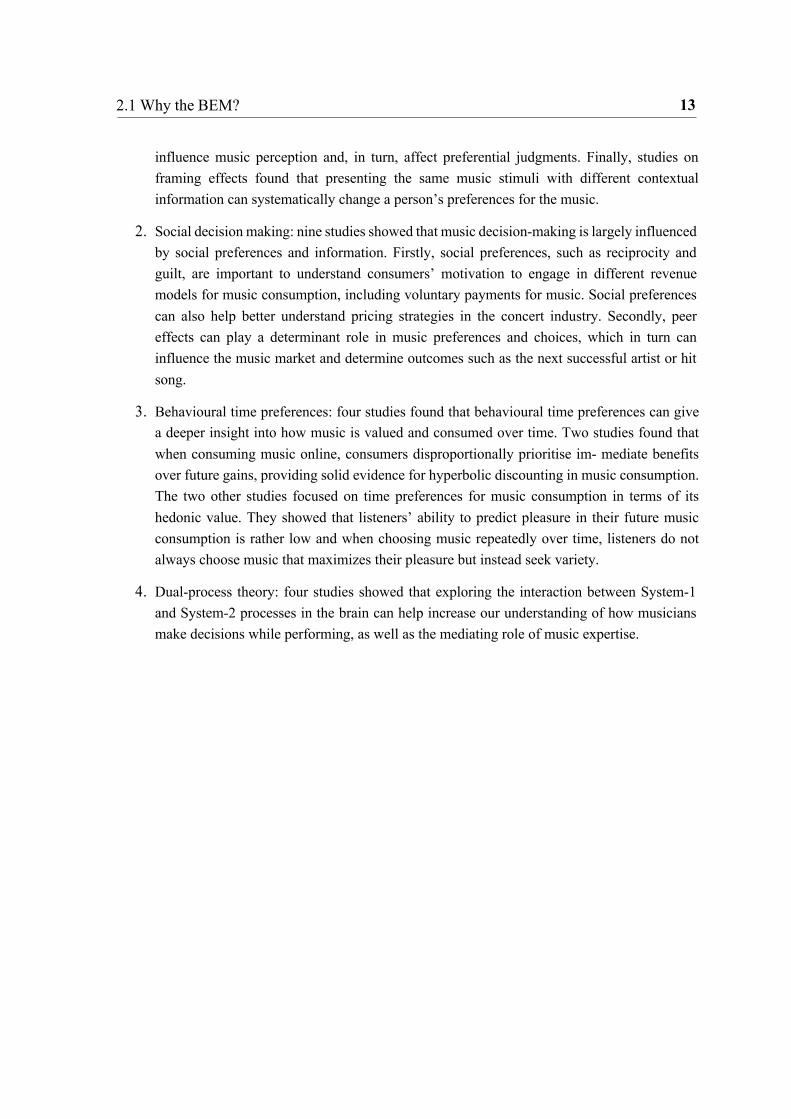
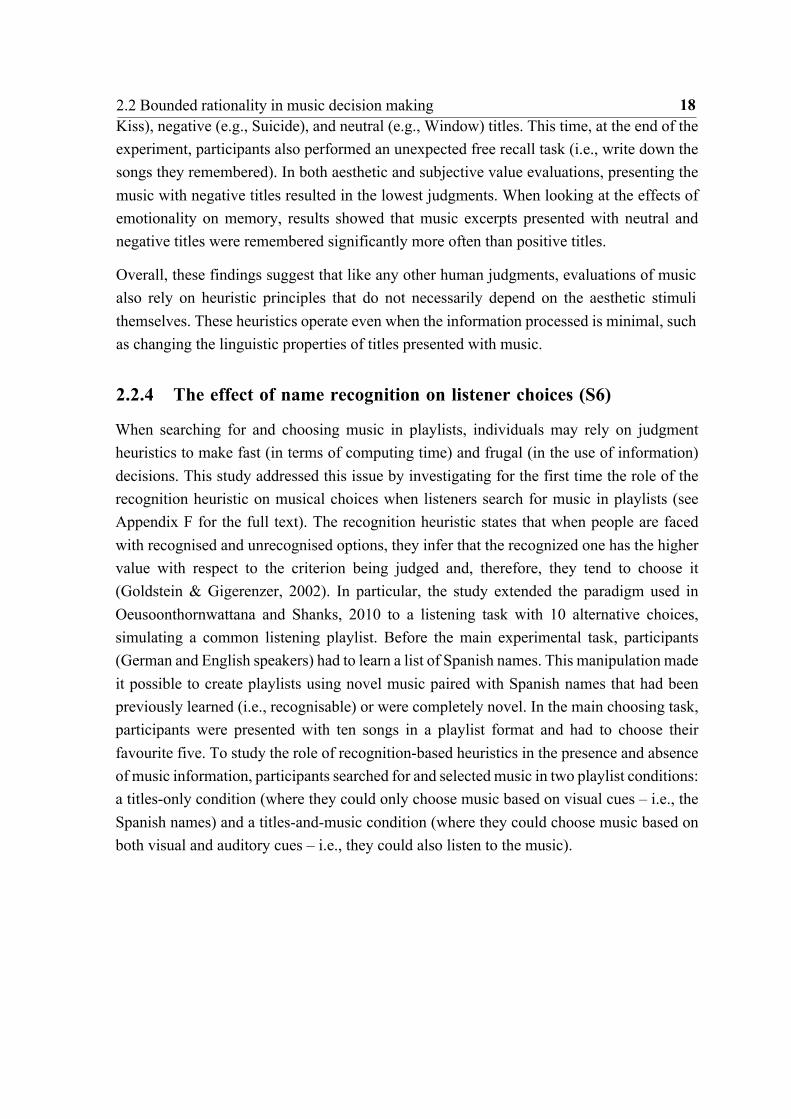
Figure 2.3 depicts the mean choice proportion of music clips paired with learned and novel names in the two choosing conditions. Results confirmed that there was a significant effect of name recognition in the two choosing conditions, but this effect was larger when participants chose music based on visual information only (titles condition). Moreover, participants’ preferences for the selected music were also influenced by recognition - i.e., the same music clips were significantly more liked when paired with learned names than when paired with novel ones. These results show that listeners rely on the recognition heuristic when both deciding which songs to choose in a playlist and developing music preferences.
Fig. 2.3 Mean choice proportion of music clips when paired with learned and novel names in both playlist conditions (Error bars represent 95% CI).
1.00
0.75
0.50
0.25
0.00
Titles Only
Titles and Music
Name recognition Novel Learned
Listeners rely on recognition cues when searching for and choosing music in the two playlist conditions.
However, the effect of name recognition was larger when listeners chose music only based on visual cues (title
only) than they chose music based on both visual and music cues.
Mea
n ch
oice
pro
port
ion
of m
usic
clip
s
20 2.3 Real world applications
2.3 Real world applications
The last part of this thesis focused on the application of the BEM to improve music-related decision making in the real world (RQ4). Two studies applied insights from behavioural economics to better understand the decision making process to select music for branding and advertising, whereas the other two studies explored alternative methods to examine music preferences in the real world, including field research and naturalistic data approaches.
2.3.1 Source effects on the evaluation of music for advertising (S7)
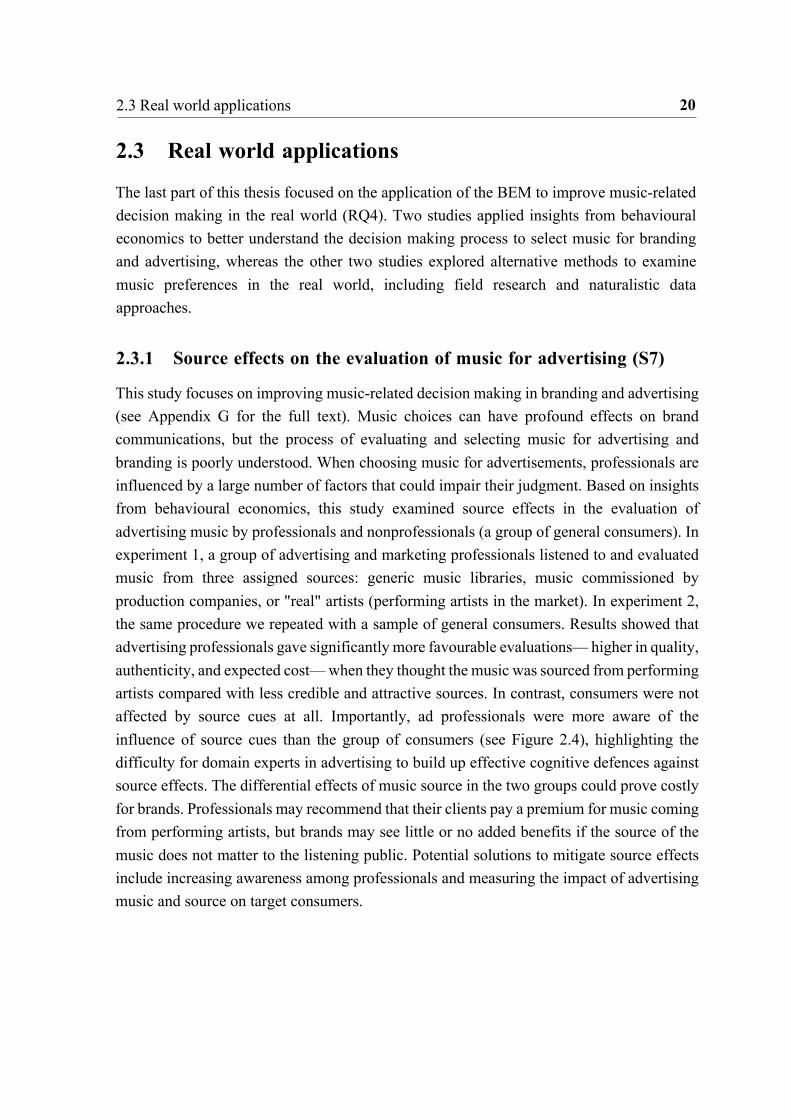
This study focuses on improving music-related decision making in branding and advertising (see Appendix G for the full text). Music choices can have profound effects on brand communications, but the process of evaluating and selecting music for advertising and branding is poorly understood. When choosing music for advertisements, professionals are influenced by a large number of factors that could impair their judgment. Based on insights from behavioural economics, this study examined source effects in the evaluation of advertising music by professionals and nonprofessionals (a group of general consumers). In experiment 1, a group of advertising and marketing professionals listened to and evaluated music from three assigned sources: generic music libraries, music commissioned by production companies, or "real" artists (performing artists in the market). In experiment 2, the same procedure we repeated with a sample of general consumers. Results showed that advertising professionals gave significantly more favourable evaluations— higher in quality, authenticity, and expected cost— when they thought the music was sourced from performing artists compared with less credible and attractive sources. In contrast, consumers were not affected by source cues at all. Importantly, ad professionals were more aware of the influence of source cues than the group of consumers (see Figure 2.4), highlighting the difficulty for domain experts in advertising to build up effective cognitive defences against source effects. The differential effects of music source in the two groups could prove costly for brands. Professionals may recommend that their clients pay a premium for music coming from performing artists, but brands may see little or no added benefits if the source of the music does not matter to the listening public. Potential solutions to mitigate source effects include increasing awareness among professionals and measuring the impact of advertising music and source on target consumers.
21 2.3 Real world applications
Fig. 2.4 Awareness of sources effects in consumers and ad professionals.
6
4
2
0
Consumers Professionals
Advertising professionals were significantly more aware of the influence of source effects when
choosing music for ads than the group of general consumers. This suggests that for domain experts
in advertising it is difficult to build up effective cognitive defences against this bias. In the Figure,
violin plots are used in addition to box plots to show the probability density of the data at different
values (smoothed using a kernel density estimator).
*** Denotes that the difference between groups is highly significant, as indicated by an independent t-test.
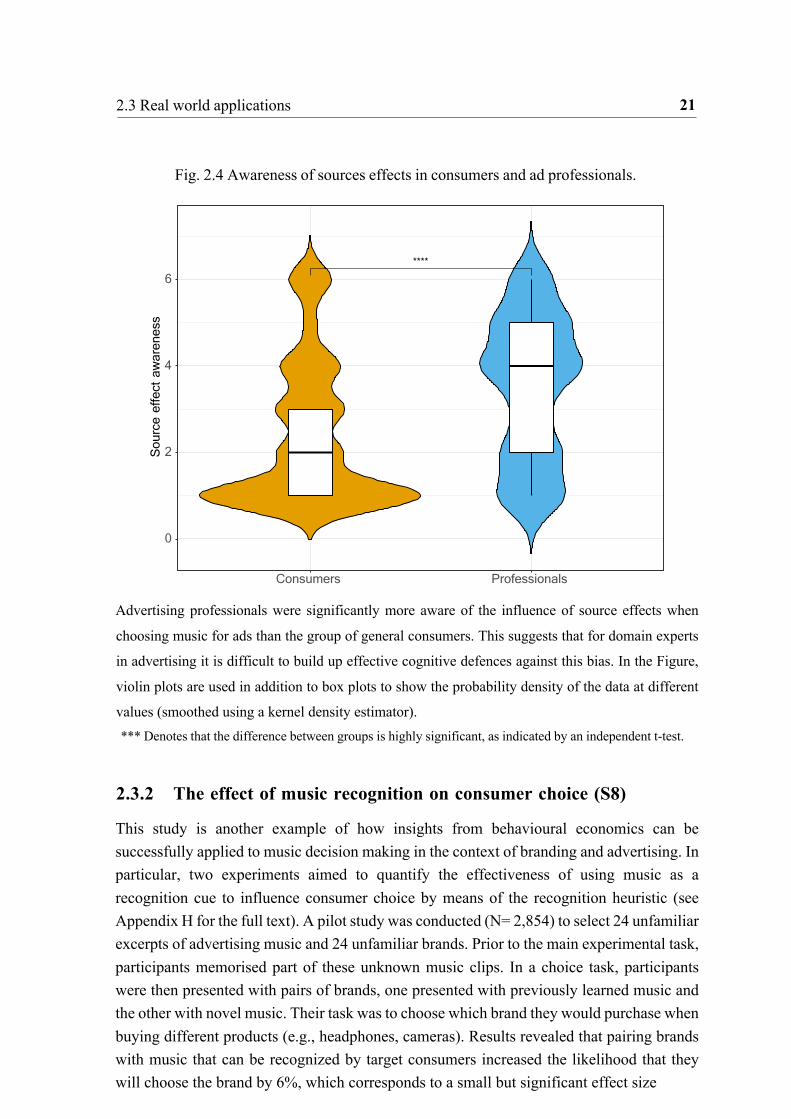
2.3.2 The effect of music recognition on consumer choice (S8)
This study is another example of how insights from behavioural economics can be successfully applied to music decision making in the context of branding and advertising. In particular, two experiments aimed to quantify the effectiveness of using music as a recognition cue to influence consumer choice by means of the recognition heuristic (see Appendix H for the full text). A pilot study was conducted (N= 2,854) to select 24 unfamiliar excerpts of advertising music and 24 unfamiliar brands. Prior to the main experimental task, participants memorised part of these unknown music clips. In a choice task, participants were then presented with pairs of brands, one presented with previously learned music and the other with novel music. Their task was to choose which brand they would purchase when buying different products (e.g., headphones, cameras). Results revealed that pairing brands with music that can be recognized by target consumers increased the likelihood that they will choose the brand by 6%, which corresponds to a small but significant effect size
****
Sou
rce
effe
ct a
war
enes
s

22 2.3 Real world applications
(d = .21). Furthermore, music preferences were a key moderating factor in the success of recognition-based heuristics. Exploratory results indicated that participants only relied on music recognition when they liked the music, whereas recognition-based heuristics did not play an influential role when the music was disliked (see Figure 2.5). Therefore, when using music to influence consumer behaviour, it is important to consider how recognition cues are processed in combination with other information, such as music preferences. This is valuable to inform brands in terms of measuring the value of their investment when working with music.
Fig. 2.5 Mean choice proportion of brands paired with learned and novel clips when the music was liked and disliked (Error bars represent 95% CI.).
1.00
0.75
0.50
0.25
0.00
Dislike
Like
Music recognition Novel Learned
Music recognition only had a significant effect on participants’ choices when the music was liked, whereas
recognition-based heuristics did not play a significant role when participants disliked the music. The relative
difference between choosing a brand paired with a learned and a novel music clip when the music was liked
was 18%, whereas when the music was disliked the difference was 5.1%.
Mea
n ch
oice
pro
port
ion
of b
rand
s
23 2.3 Real world applications
2.3.3 The busking experiment: A field study (S9)
This study applied methods from behavioural economics to a different music problem (see Appendix I for the full text). That is, what makes a successful street musician? And which aspects of the performative act might influence people’s economic responses? To address this question, a field experiment was conducted with a professional busker in the London Underground over the course of 24 days. The study primary aim to investigate the extent to which performative aspects influence behavioural responses to music street performances. Two aspects of the performance were manipulated: familiarity of the music (familiar vs. unfamiliar) and body movements (expressive vs. restricted). The amount of money donated and the number of donors were recorded. A total of 278 people donated over the experiment. The music stimuli, which was selected in a previous study to differ only in familiarity, had been previously recorded by the busker. During the experimental sessions, the busker lip-synced to the pre-recorded recordings. Thus, the audio input in the experiment remained identical across sessions and the only variables that changed across conditions were the familiarity of the music and the expressivity of performed body movements. The results indicated that neither music familiarity nor the performer’s body movements had a significant impact on the amount of money donated or the number of donors. Importantly, the results do not support previous literature investigating the influence of familiarity and performers’ body movements, typically conducted in laboratory and artificial environments. The findings are further discussed with regard to potential extraneous variables that may be crucial to control for in similar field experiments (e.g., location of the performance, physical appearance, and the bandwagon effect) and the advantages of field versus laboratory experiments.
2.3.4 Popular music lyrics and musicians’ gender over time (S10)
This study applied a naturalistic data approach to investigate preferences for popular music in the UK over time (see Appendix J for the full text). Data on the singles sales charts from 1960 to 2015 was analysed as a proxy of music preferences. Note that singles sales charts is determined by weekly sales, downloads, and streaming of music. With this data, the study focused on how the gender distribution of the United Kingdom’s most popular artists has changed over time and the extent to which these changes might relate to popular music lyrics. Using data mining and machine learning techniques, all songs that reached the UK weekly top 5 sales charts from 1960 to 2015 were analysed (4,222 songs). A computational analysis of the lyrics was conducted to measure a total of 36 lyrical variables per song. Results showed a significant inequality in gender representation on the charts. However, the presence of female musicians increased significantly over the period covered in the study. The most critical inflection points leading to changes in the prevalence of female musicians were in 1968, 1976, and 1984. Linear mixed-effects models showed that the total number of words and the use of self-reference in popular music lyrics changed significantly as a function of musicians’ gender distribution over time, and particularly around the three
24 2.3 Real world applications
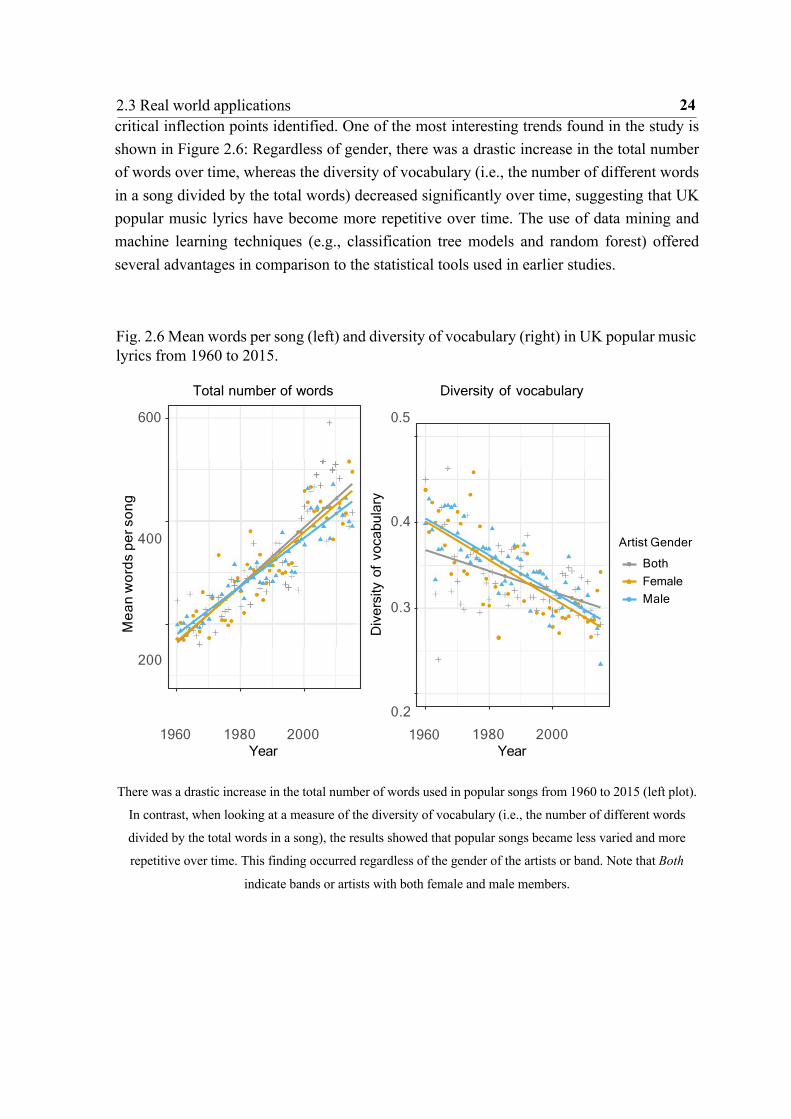
critical inflection points identified. One of the most interesting trends found in the study is
shown in Figure 2.6: Regardless of gender, there was a drastic increase in the total number
of words over time, whereas the diversity of vocabulary (i.e., the number of different words
in a song divided by the total words) decreased significantly over time, suggesting that UK
popular music lyrics have become more repetitive over time. The use of data mining and
machine learning techniques (e.g., classification tree models and random forest) offered
several advantages in comparison to the statistical tools used in earlier studies.
Fig. 2.6 Mean words per song (left) and diversity of vocabulary (right) in UK popular music
lyrics from 1960 to 2015.
600
Total number of words
0.5
Diversity of vocabulary
400 0.4
0.3
Artist Gender
Both
Female
Male
200
1960
1980 Year
2000
0.2
1960
1980 Year
2000
There was a drastic increase in the total number of words used in popular songs from 1960 to 2015 (left plot).
In contrast, when looking at a measure of the diversity of vocabulary (i.e., the number of different words
divided by the total words in a song), the results showed that popular songs became less varied and more
repetitive over time. This finding occurred regardless of the gender of the artists or band. Note that Both
indicate bands or artists with both female and male members.
Me
an
wo
rds
pe
r so
ng
Div
ersi
ty o
f vo
cabu
lary

Chapter 3
Discussion
This section starts by discussing the main theoretical and practical contributions of this thesis, with a focus on what have we learned from applying behavioural economics in the context of music. The section ends with discussing directions for new insights and valuable future research and, finally, concludes.
3.1 Theoretical contributions
The main theoretical contribution of this thesis is the conception of the BEM, an interdisciplinary but unified framework with which we can increase our understanding of musical behaviour (see Figure 1.1). Two literature reviews and eight empirical investigations (see Table 2.1 for a list of publications; see Appendix A-J for the full texts) demonstrate the value and potential of this novel approach.
The BEM contributes most significantly to the existing bodies of music research in both standard economics and psychology. Economists interested in music will benefit by moving away from the more rigid assumptions of standard economics and consider the psychological underpinnings known to be involved in musical behaviour. For example, in several studies conducted within this thesis, we learned that listeners are not utility maximisers who use all information and time available to make optimal musical choices. Instead, there are several psychological constraints that limit their ability to evaluate and choose music, such as memory and the contextual information often presented with music. Incorporating these insights will help building a more realistic and comprehensive account of music-related decision making.

26 3.3 Future directions
In comparison to other stimuli, music is experiential, multisensory, aesthetic, social, and highly emotional. Such intrinsic properties may prove particularly useful to test economic theories and enhance their generalizability and scope. For example, music is highly effective in evoking strong emotions in their listeners, such as chill experiences – i.e., the phenomenon of chills or goosebumps caused by intense emotion that come from listening to a specific piece of music (Goldstein, 1980). Thus, music can be an efficient and inexpensive stimulus to study the role of emotion in decision making. For instance, S5 (see section 2.2.3 - Appendix E) found an interaction between the affect heuristic and the emotional content of the music, suggesting that the impact of this heuristic on decision making may differ when using music stimuli in comparison with other stimuli. Similarly, music is social and largely influenced by culture. By investigating properties of popular music (e.g., lyrics) and characteristics of the artists (e.g., gender), S10 (see section 2.3.4 - Appendix J) showed how popular music can be used as a cultural product to study how the preferences and values of a society are shaped by political and socioeconomic changes.
On the other hand, phycologists will gain from considering behavioural economics as a toolkit by which to address key music problems that. In particular, the BEM approach allows psychologists to rethink the study of musical behaviour using a new (and empirically supported) set of concepts and theories, such as bounded rationality, dual-process theory, and behavioural game theory. Whilst these insights have been highly influential in the study of human behaviour and decision making, they have rarely been applied to examine musical behaviour. For example, to date, the notion of heuristic processing has been mostly overlooked in the music psychology literature. Nevertheless, four studies conducted in this thesis (see section 2.2) indicated that heuristics play a central role in music listening and choice behaviour.
The studies conducted in this thesis are important in demonstrating the value of applying insights from behavioural economics to study music decision making. However, they mostly focused on one BEM area (i.e., cognitive biases and heuristics) and one aspect of music decision making (i.e., music preferences and listening behaviour). To address this issue, S2 (see section 2.1.2 - Appendix B) provided an up-to-date account of all studies that utilised behavioural economics for research on music-related decision making. This study contributes significantly to the literature by showing which areas within behavioural economics can generate new and valuable insights into the study of music decision making, both in terms of research methods and theory. The systematic review identified 33 studies organised in four distinctive BEM that readily apply to music decision making: cognitive biases and heuristics, social decision making, behavioural time preferences, and dual-process theory. Each of these BEM areas adds value to the existing bodies of music research in both psychology and economics. For instance, social decision making is an area within behavioural economics that examines how decisions are influenced by social information and preferences. Although at odds with neoclassical economic theory, social preferences (i.e., altruism, reciprocity, and fairness concern) can explain why consumers choose to pay

27 3.3 Future directions
voluntarily for music, a phenomenon that has puzzled researchers for a long time.
Similarly, behavioural time preferences can enable a deeper understanding of how music is valued and consumed over time. Notably, individuals exhibit present-biased time preferences, i.e., they have a strong preference for immediate gratification (O’ Donoghue & Rabin, 1999). Since music is a hedonic good (i.e., multisensory based on experiential consumption), individuals may place an even higher weight on outcomes that occur in the present rather than the future. This has implications for how consumers select music, particularly with the emergence of music streaming platforms providing music instantaneously. A further area of behavioural economics, dual-process theory, explores the interaction between emotional and cognitive processes in the brain. Dual-process theory can be used to study decision making in the context of music composition and performance. For example, investigating the interaction between these two systems can help better understand conscious states while musicians perform and how these may impact on the quality of their performances.
Another theoretical implication of this thesis is the focus on understanding the role of context in music evaluation and decision making. Research within music psychology has identified three main interconnected factors that influence people when listening to and evaluating music: the music, the listener, and the listening context (see Hargreaves, North, & Tarrant, 2006; LeBlanc, 1982, for theoretical models considering the three factors; see Greasley & Lamont, 2016; North & Hargreaves, 2008, for research reviews). Traditionally, the vast majority of studies have focused on the music and the listener. Comparatively, less attention has been paid to the listening context. In this thesis, six empirical investigations manipulated contextual factors presented with the music stimuli to investigate its effects on musical behaviour, including artists names, song titles, information about the artists, post-event information about the music piece, and the source of the music. These studies consistently show that music decision making does not happen in a vacuum, but is significantly influenced by the context. More specifically, contextual information can lead listeners to perceive different musical performances when in fact they are identical (S3; see section 2.2.1 - Appendix C); generate false musical memories of a past music event (S4; see section 2.2.2 - Appendix D); influence music judgments and decision even when the contextual manipulation is minimal, such as only changing linguistic aspects of titles presented with music (S5 and S6; see section 2.2.3 and 2.2.4 - Appendix E and F); and cause potentially negative biases amongst ad professionals when choosing music for advertising (S7; see section 2.3.1 - Appendix G).
Furthermore, the studies conducted in this thesis contribute towards a better understanding of the role of music expertise in music evaluation and decision making. Previous research consistently shows that highly trained musicians outperform non-musicians in several musical tasks, such as short-term and working memory tasks with music stimuli (see Talamini, Altoe, Carretti, & Grassi, 2017, for a review). Thus, it seems plausible that since musicians’ cognitive abilities to perceive and process music are higher than non-musicians,

28 3.3 Future directions
they should perhaps be less influenced by contextual factors and cognitive heuristics. Several of the studies conducted in this thesis addressed this issue by collecting data on participants’ musical background, including both musical training and active engagement to music. These studies, which collected data on more than 500 participants, showed that music expertise does not have a protective effect against contextual factors. Besides, highly trained musicians are not any more or any less susceptible to cognitive biases and heuristics than non-musicians. Thus, contextual factors and heuristics seem to influence listeners regardless of their previous experience to music. Although these results might seem counterintuitive at first, they are consistent with the behavioural economics literature on the "expert problem" (e.g., Hall, Ariss, and Todorov, 2007; Reyna, Chick, Corbin, and Hsia, 2014; Taleb, 2007), showing that in certain conditions and domains, more knowledge and expertise does not necessarily lead to more accurate and less biased judgments and decisions.
3.2 Practical contributions
A main practical contribution of this thesis is the wide variety of methods and paradigms used to investigate different aspects of music decision making. For example, S3 (see section 2.2.1 - Appendix C) proposed the repeated recording illusion, a novel paradigm that is useful to investigate non-musical factors in music evaluation because it allows for the study of their effects while the music remains the same. S4 (see section 2.2.2 - Appendix D) applied, for the first time, the misinformation paradigm using music instead of visual materials, showing that listeners generate false memories in a music context. Both S5 (see section 2.2.3 - Appendix E) and S6 (see section 2.2.4 - Appendix F) adapted successfully existing paradigms in the behavioural economics literature to study the effects of cognitive heuristics in music evaluation and decision making. S5 adapted a well-known experiment from behavioural economics (Shah & Oppenheimer, 2007) to examine linguistic fluency, whereas S6 adapted a common paradigm to investigate the recognition heuristic in preferential choice tasks (Oeusoonthornwattana & Shanks, 2010) to study musical choices when listeners search for music in playlists. Overall, these studies emphasize the potential of applying methods and paradigms from behavioural economics to study similar phenomena in music.
This thesis also explored other methods beyond those commonly used in controlled and artificial studies. This is important because controlled studies conducted in laboratories and other artificial environments are susceptible, among other things, to two major problems (Carpenter, Harrison, & List, 2005; Reis & Judd, 2000): a lack of external validity—the extent to which the results are generalizable beyond the research setting and participant pool—and a lack of ecological validity—the degree to which the results apply to the real world situation under study. Note that issues related to poor ecological validity and generalizability are taken particularly seriously by economists and behavioural scientists (Harrison & List, 2004; Levitt & List, 2007). As argued by Levitt and List (2007), “Perhaps

29 3.3 Future directions
the most fundamental question in experimental economics is whether findings from the lab are likely to provide reliable inferences outside of the laboratory” (p. 179). Thus, it was important to consider further ways to examine behavioural responses to music in natural environments, once sufficient scientific grounding has been obtained based on laboratory-generated data.
This was one of the motivations for S9 (see section 2.3.3 - Appendix I), which used a field research approach to investigate responses to musical performances in a naturalistic busking environment. The charitable behaviour of passersby’ (i.e., amount of money donated) was recorded while a professional busker performed in the London Underground over the course of 24 days. Two factors of the performance, commonly investigated in lab studies, were manipulated: familiarity of the music and body movements. Contrary to common findings in lab studies looking at the same factors, the results indicated that neither music familiarity nor the performer’s body movements had a significant impact on the amount of money donated. These discrepancies might be due to differences in the ecological validity between laboratory and field studies. For instance, in the laboratory, participants are always aware of their participation in a scientific study and their only goal is to listen carefully to the music while evaluating it in a highly controlled and quiet environment. Therefore, the advantages of field studies over lab studies include high ecological validity and avoiding problems associated with self-reported assessments. On the other hand, S10 (see section 2.3.4 - Appendix J) used a big data approach that offers high ecological validity but also allows to analyse large datasets. In particular, the study analysed naturalistic data from the singles sales charts to examine how preferences for popular music have changed over time. This approach allowed for the study of responses to music in the real world that are neither obtained nor affected by the actions of researchers. Moreover, it made it relatively easy to collect and analyse a large dataset (4,222 songs and 2,287 artists) covering 55 years (1960-2015). Overall, S9 and S10 are useful in exploring alternative methods to study musical behaviour that do not suffer from poor external and ecological validity.
Another contribution of this thesis includes the wide variety of analysis techniques used across the eight empirical studies to examine human responses to music. Firstly, linear mixed-effect models proved to be very efficient to test main hypotheses when using repeated- measured designs, as they allowed the modelling of important sources of random noise, such as participants and songs’ variability. Secondly, several studies applied machine learning and data mining techniques that proved to be well-suited to examine certain music problems. For example, to analyse a large set of individual differences, S3 (see section 2.2.1 - Appendix C) and S4 (see section 2.2.2 - Appendix D) showed that random forests can be a very useful technique, as they can handle a large number of variables even when they are correlated between themselves. Similarly, classification tree models were successfully applied in S3 (see section 2.2.1 - Appendix C) and S10 (see section 2.3.4 - Appendix J) to model higher-order interactions between several predictor variables and the dependent variable of the study. In S10, for instance, this approach allowed for the identification of three main inflection points in which the prevalence of female artists in UK’s popular music
30 3.3 Future directions
changed considerably over time, i.e., 1968, 1976, 1984. Interestingly, these inflection points coincide with some significant moments in UK’s culture, such as the surge in popularity of the women’s rights movements (1968), the rise of punk (1976), and the peak in popularity of Margaret Thatcher’s prime ministership (1984).
Finally, the last part of this thesis focused on the application of the BEM to improve music- related decision making in the real world. Two studies focused on music decision making in advertising and marketing, an area where music choices are particularly relevant. Musical choices can have profound effects on brand communications, consumer behaviour, and can be costly for brands. Despite this, the process of choosing and evaluating music for advertising is poorly understood. Thus, S7 and S8 applied insights from behavioural economics to better inform the decision-making process of selecting music for ads. S7 (see section 2.3.1 - Appendix G) found that source bias has a significant impact on how ad professionals evaluate music for advertising purposes, whereas source cues have no effect on consumers. The differences between these two groups can be costly for brands, as professionals may recommend that their clients pay a premium for music coming from specific sources (e.g., performing artists), but brands may see little or no added benefit if ultimately, the source of the music does not matter to the consumer. Potential solutions to mitigate this bias are discussed, including increasing awareness among professionals and measuring the impact of advertising music and source on target consumers. In addition, S8 (see section 2.3.2 - Appendix H) provided a first estimation of the effectiveness of using music as a recognition cue to influence consumer choice by means of the recognition heuristic. The results showed that music can only be successfully used as a recognition cue when it is liked by the target consumers, whereas recognition-based heuristics are not influential when the music is disliked. This finding is valuable to brands in terms of the importance of measuring the value of their investment when working with music.
31 3.3 Future directions
3.3 Future directions
The diversity of the ten studies presented in Chapter 2 begin to illustrate the breadth and potential of the role that behavioural economics can play in music research. Moreover, a network visualisation map of behavioural economics demonstrates the rich array of concepts and theories yet to be applied within the domain of music research (see Figure 3.12). The map was generated using 68,509 publications from the field of behavioural economics and shows the 200 most frequently used concepts in these publications (the key terms provided by the author (s) to describe their work). Thus, the map highlights the potential of behavioural economics for future research on music decision making. Based on this map and further accumulated insights from the ten empirical investigations summarised in Chapter 2, this section proposes ideas and directions for future research within the BEM (RQ 5). The future directions are organised around different areas within music research that can significantly benefit from considering the behavioural economics toolkit.
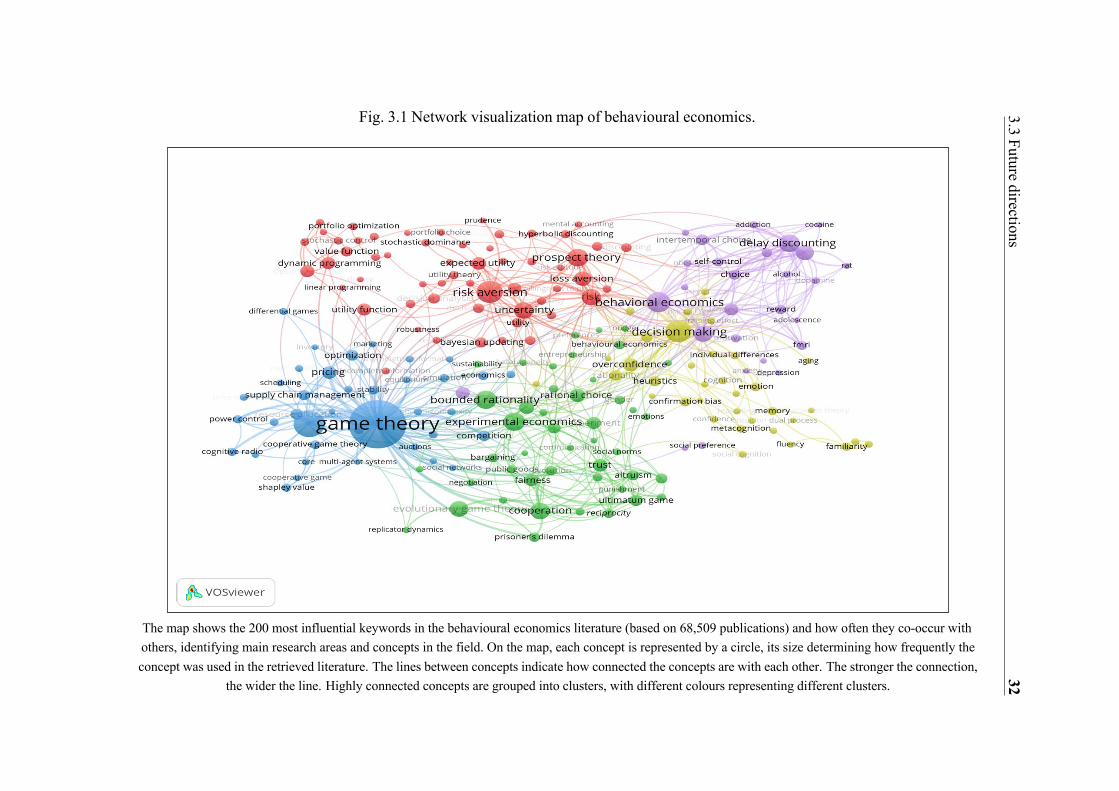
Fig. 3.1 Network visualization map of behavioural economics.
The map shows the 200 most influential keywords in the behavioural economics literature (based on 68,509 publications) and how often they co-occur with
others, identifying main research areas and concepts in the field. On the map, each concept is represented by a circle, its size determining how frequently the
concept was used in the retrieved literature. The lines between concepts indicate how connected the concepts are with each other. The stronger the connection,
the wider the line. Highly connected concepts are grouped into clusters, with different colours representing different clusters.
32
3.3
Futu
re directio
ns

33 3.3 Future directions
Music reward value
Music reward value is at the core of musical behaviour. Yet, if musical sounds have not intrinsic reward for humans, why are they perceived so pleasurably by the human brain? This issue has puzzled scientists and philosophers over the years, but recent advances in neuro- science have made great progress in identifying multiple mechanisms underlying reward in music (see Zatorre & Zald, 2011, for a review). Here, there is great potential for Neuroeconomics, a fast-growing field in behavioural economics that aims to explain how human decision making happens inside the brain (see Dhami, 2016; Glimcher & Fehr, 2014, for reviews). By using neuroscientific methods, neuroeconomics both tests and develops theories of human decision making while using algorithmic models and experimental paradigms that are particularly suited to study human behaviour (Dhami, 2016; Glimcher & Fehr, 2014). Therefore, neuroeconomics may be useful in identifying the brain regions that allow humans to derive pleasure from music. Using this approach, Salimpoor et al., 2013 examined the neural processes when music gains reward value the first time it is heard. While undergoing fMRI scanning, participants listened to previously unheard music excerpts and indicated how much they were willing to spend on them using an auction paradigm. The results showed that music reward arises from the interaction between mesolimbic reward circuitry – a pathway in the brain associated with the dopaminergic system and reward – and sensory cortices involved in auditory processing, which impacts behavioural decisions about the value of music. Importantly, the benefits of neuroeconomics for music research are not just limited to the study of reward in music. Neuroeconomics can be useful to test and develop theories of decision making in other music areas as well, such as music composition and improvisation choices, music preferences and listening behaviour, and the use of music in advertising.
Music preferences and listening behaviour
Why do people listen to (and pay) for the music they do? And how do these decisions influence the music industry? To address these questions, this thesis encourages future research to consider the behavioural economics literature on cognitive biases and heuristics and dual-process theory.
Several studies reported in this thesis show that listeners are boundedly rational and, consequently, rely on cognitive biases and heuristics when evaluating and choosing music (see section 2.2). However, we are far from having a clear picture of the role that heuristic processing plays in music listening and decision making. In addition to the heuristics and biases addressed in this thesis, researchers have proposed many others that have yet not been applied to the music domain. This list is extensive, for example, the Decision Lab (Montreal, Canada) identifies more than 80 heuristics and biases in human decision making (https://thedecisionlab.com/biases). Thus, the scientific potential for music research here is immense. As an example, one can consider how some of these unexplored heuristics and biases may help better understand music listening behaviour in the current digital era. The
34 3.3 Future directions
drastic increase in music streaming services observed in recent years, such as Youtube and Spotify, provides listeners with millions of tunes almost instantly (IFPI, 2019). Yet, it is unclear how listeners search for and choose music in this seemingly endless range of music choices. Here, it is worth considering research on choice overload, a cognitive phenomenon that occurs as a result of too many choices being available to consumers, resulting in negative outcomes, such as decision fatigue, choosing the default option, or having an unpleasant experience (see Chernev, Böckenholt, & Goodman, 2012, for a review). Future research on choice overload could determine how the size of music choice sets or playlist affect people when listening to music in streaming services, helping identify the optimal number of items to maximize the listening experience. Alternatively, mental accounting refers to the tendency to treat one’s money or goods differently based on subjective criteria, such as its intended use or its source (Thaler, 1985). Future studies on mental accounting could examine differences in people’s value for music when the music is in digital format versus physical format (e.g., CD or vinyl). Similarly, mental accounting could explain why people easily engage in music piracy, whereas they would not engage in similar behaviour when the format of the music is physical, such as stealing music CDs from a store.
Furthermore, there is great potential for research on dual-process theory in the context of music listening and preferences. Examining the interactions between emotional (System 1) and cognitive (System 2) processes in the brain can shed light on how music affects individuals in a particular moment in time, providing a window into why people like the music they do. Previous research suggests that people choose music depending on the cognitive involvement of the two systems of processing (Konecni, 1982; Konecni & Sargent- Pollock, 1976; North & Hargreaves, 2000, 1999). For example, participants were less likely to select complex music when performing a cognitively-demanding task than when performing a less demanding task (Konecni & Sargent-Pollock, 1976). Future studies could examine this issue further by using a wider selection of music stimuli and cognitively demanding tasks, as well as studying how they interact with listeners’ individual differences. These insights could be used to improve current models of music preference and attempt to predict listeners’ music choices in a given point in time based on the involvement of the two systems of processing.

35 3.4 Conclusion
Music consumption and the market
The behavioural economics toolkit offers highly valuable insights into understanding consumer behaviour and the market. This thesis emphasizes the potential of behavioural pricing for future research exploring music consumption and how listener choices shape the music industry. Behavioural pricing is an area in behavioural economics that examines how consumers react to prices incorporating a psychological perspective (see Koschate-Fischer & Wüllner, 2017, for a review). By investigating the intra-personal processes of price perception, evaluation, and memory, researchers can better understand consumer behaviour and its consequences to the market. With much of music content now online and the continual threat of piracy, artists, labels, and music distributors have had to become more innovative to develop new strategies for generating revenue from digital music content. Thus, behavioural pricing can be useful to understand consumers’ reactions to pricing decisions made by artists and music firms. For instance, future studies could focus on understanding why consumers choose to pay voluntarily for music and which are the advantages of this payment model compared to traditional fixed-price strategies. More research is needed here looking specifically at the motivations behind such behaviour. Similarly, future studies could examine the feasibility of other voluntary payment models, such as giving the music completely for free or using crowdsourcing methods to raise funds from fans. Other pricing decisions in music that could largely benefit from considering behavioural pricing include the relationship between artists’ pricing decisions and the live music industry. For example, future studies could investigate whether pricing strategies could promote attendance of young audiences to classical music concerts, an ongoing concern among classical music organizations (e.g., Dimaggio & Mukhtar, 2004; Kolb, 2000). Alternatively, future research could examine whether pricing strategies can ameliorate the value gap created between artists and music streaming services – i.e., the growing mismatch between consumed music in these services and the revenue returned to musicians and the music community, which is proportionally very low (IFPI, 2019).
Music composition and improvisation
Given the highly demanding nature of music improvisation, including fast timing of note events (often in the range of 40 milliseconds or less) and cognitive as well as bodily limitations (Impett, 2016), it seems plausible that musicians strongly rely on fast and frugal heuristics to make decisions while improvising. This thesis emphasizes the potential of computational musicology to analyse large corpora of music performances and quantify the role that different heuristics may play in music composition and improvisation. Using such approach, a recent study (Beaty, Frieler, Norgaard, & Merseal, 2020) analysed a corpus of hundreds of improvised solos from eminent jazz musicians. By extracting all melodic sequences in the corpus and calculating relevant metrics (e.g., pitch variety, pattern frequency), the authors quantified the level of complexity in each music sequence in the corpus. The results consistently showed that expert jazz musicians tend to start their

36 3.4 Conclusion
improvisations with music sequences that are significantly easier than subsequent sequences in their solos, where “easy” was defined as statistically more frequent and less melodically complex. This finding is in line with the availability heuristic (Tversky & Kahneman, 1973), as the less complex a music sequence is, the more available in memory and easier to remember. This thesis encourages future studies to use similar methods to identify other core heuristics underlying music composition and improvisation. For instance, the anchoring heuristic (Tversky & Kahneman, 1974) refers to the human tendency to rely heavily on the first piece of information offered to “anchor” subsequent judgments and interpretations. Musicians may rely on this heuristic to simplify decision making while improvising, adjusting their choices to the anchor (the first piece of music played or heard). By analysing large corpora of improvised solos, one could examine the role of the anchoring heuristic by comparing the melodic similarity of the first music sequence in a solo to subsequent sequences.
Music performance evaluation
Further research on the BEM could focus on improving the decision making process inherent to music performance evaluation, both in terms of identifying core cognitive biases and heuristics and tailoring evaluative strategies to mitigate their effects. As an example, consider how this process could work to improve jurors’ decision making in a well-known musical competition such as the Queen Elisabeth Musical Competition. Firstly, using data from previous years, one could systematically investigate whether juror’s judgments rely on cognitive biases and heuristics. For instance, Flôres and Ginsburgh (1996) analysed the rankings of the 12 semi-finalists in this competition over 21 years and found a clear order bias in jurors’ decisions: those semi-finalists who performed first had a lower chance to win the competition, whereas those who performed later had a higher chance. Order bias can be understood within the context of bounded rationality, where jurors are simply not able to remember equally well all performances and, consequently, their judgments rely on the availability effects (Tversky & Kahneman, 1973), giving higher scores to performances they remember better (those that performed more recently). Secondly, once the impact of cognitive biases and heuristics is measured, the second step should focus on tailoring effective strategies to mitigate their effects on the evaluative process. For example, making jurors aware of such biases is one step towards mitigating their effects, as there is evidence that awareness of bias can bring about change (Pope, Price, & Wolfers, 2013). Other interventions could consist of using assessment methods that are less susceptible to cognitive biases, such as providing moment-to-moment evaluations or using blind and randomised procedures.
Music education
Research on music education has used a wide variety of psychological approaches to understand what motivates people to take and persists with music lessons and practice (see
37 3.4 Conclusion
Austin, Renwick, & McPherson, 2006; Renwick & Reeve, 2012, for reviews). However, it remains unclear why some individuals manage to persist through the challenges of learning and practicing, whereas others eventually quit. Research on behavioural time preferences can offer valuable insights to this issue. For example, research on delay discounting provides a unifying theoretical approach that that has been successfully applied to a number of similar issues in psychology, including those related to health, self-control, impulsivity, and risk taking (see Green & Myerson, 2004; Koffarnus, Jarmolowicz, Mueller, & Bickel, 2014; Peters & Büchel, 2011; Reynlods, 2006, for reviews). In the context of music education, delay discounting predicts that in impatient students, the short-term temptation (e.g., quit- ting or not practising enough) foregoes the long-term goal (e.g., learning how to play an instrument). More importantly, the relationship between time and subjective reward can be modelled accurately using mathematical functions with few parameters, such as discount rate (how fast an individual’s subjective value decreases over time), which is associated with impulsivity and impatience (see Peters & Büchel, 2011, for a review). Thus, there is great potential for future research looking at whether the rate of delay discounting can be a reliable trait marker for music practice and learning. By incorporating such insights, one could help improve current educational methods in music, decreasing dropout rates and increasing the learning experience. For instance, there is evidence that framing effects and episodic future thinking can reduce significantly delay discounting (Koffarnus et al., 2014), as the better that individuals can imagine future outcomes, the more they value them.
3.4 Conclusion
Music psychology has examined various aspects of decision making related to musical behaviour using a wide variety of methods and techniques (see Deutsch, 2013; Hallam et al., 2016; Tan et al., 2017, for reviews). This body of research, however, would benefit from using a more sophisticated and unified framework dedicated exclusively on the study of music decision making, as well as incorporating insights from social sciences and economics. In contrast, economists have investigated music-related decision making with a focus on rational economic analysis instead of the psychological underpinnings known to be involved in music perception, cognition, and behaviour (see Byun, 2016; Cameron, 2016; Krueger, 2005; Tschmuck, 2017, for reviews). To bridge this gap, this thesis proposes the BEM, a novel research framework that integrates knowledge from psychology, economics, and other disciplines to increase our understanding of human behaviours related to music. Ten scientific publications (see Table 2.1 for a list of publications; see Appendix A-J for the full texts) were conducted to demonstrate the value of this novel approach, generating new insights into the study of music decision making.
The BEM has both theoretical and practical implications. First, it offers a multidisciplinary but unified framework to understand and improve music decision making in a variety of areas. Second, it merges two distinct bodies of research that have been largely unconnected
38 3.4 Conclusion
in the literature thus far. In particular, the BEM moves away from the rigid neoclassical assumption of rationality by incorporating insights from psychology, while still relying on falsifiable models from standard economics that are mathematically rigorous and can prove significant to address key problems in music research. Third, the BEM offers a solid understanding of those areas in behavioural economics that readily apply to music decision making, but also provides valuable directions for future research aiming to explore new areas, such as neuroeconomics, behavioural pricing, and behavioural game theory. These avenues for future research can improve our current knowledge in many areas within music psychology, including music composition and improvisation, performance evaluation, music preferences and consumption, and music education. Finally, since music is a potent and highly emotional stimulus, investigating music decision making can provide a novel testing ground for general theories on human behaviour and decision making. Thus, the BEM can be used as a toolkit to generate new ideas and accelerate progress in any area concerned with human behaviours related to music.
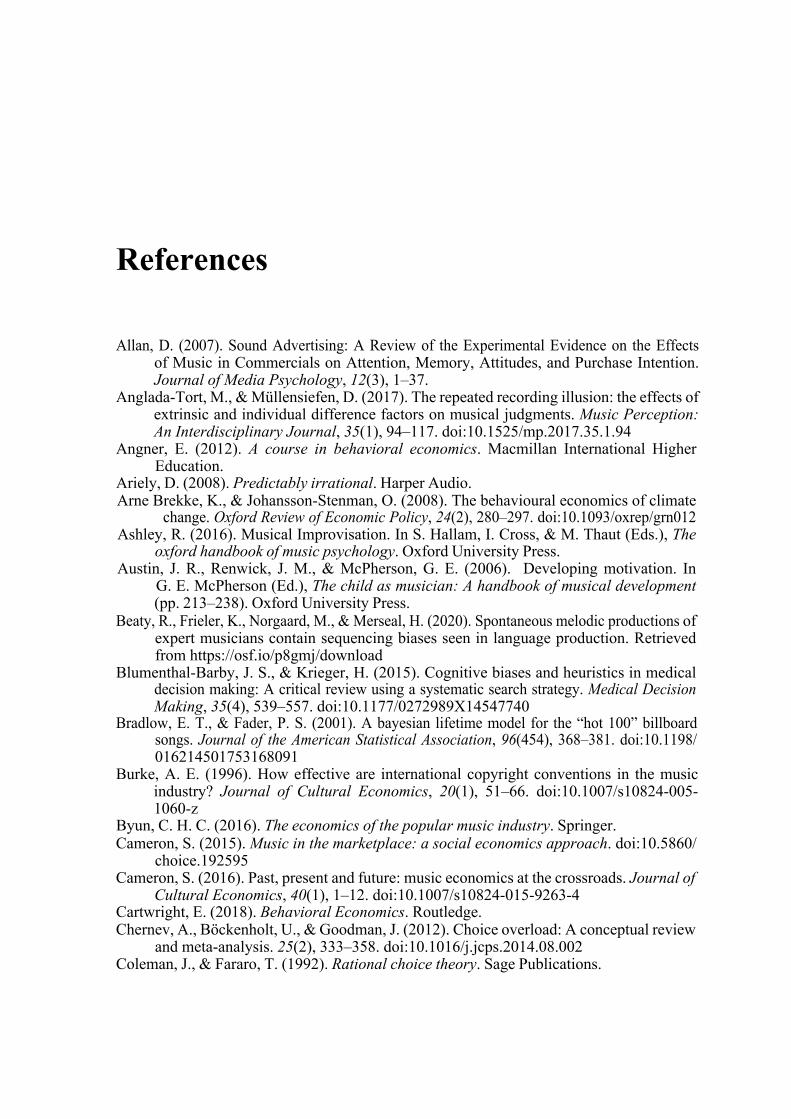
References
Allan, D. (2007). Sound Advertising: A Review of the Experimental Evidence on the Effects
of Music in Commercials on Attention, Memory, Attitudes, and Purchase Intention. Journal of Media Psychology, 12(3), 1–37.
Anglada-Tort, M., & Müllensiefen, D. (2017). The repeated recording illusion: the effects of extrinsic and individual difference factors on musical judgments. Music Perception: An Interdisciplinary Journal, 35(1), 94–117. doi:10.1525/mp.2017.35.1.94
Angner, E. (2012). A course in behavioral economics. Macmillan International Higher Education.
Ariely, D. (2008). Predictably irrational. Harper Audio. Arne Brekke, K., & Johansson-Stenman, O. (2008). The behavioural economics of climate
change. Oxford Review of Economic Policy, 24(2), 280–297. doi:10.1093/oxrep/grn012 Ashley, R. (2016). Musical Improvisation. In S. Hallam, I. Cross, & M. Thaut (Eds.), The
oxford handbook of music psychology. Oxford University Press. Austin, J. R., Renwick, J. M., & McPherson, G. E. (2006). Developing motivation. In
G. E. McPherson (Ed.), The child as musician: A handbook of musical development (pp. 213–238). Oxford University Press.
Beaty, R., Frieler, K., Norgaard, M., & Merseal, H. (2020). Spontaneous melodic productions of expert musicians contain sequencing biases seen in language production. Retrieved from https://osf.io/p8gmj/download
Blumenthal-Barby, J. S., & Krieger, H. (2015). Cognitive biases and heuristics in medical decision making: A critical review using a systematic search strategy. Medical Decision Making, 35(4), 539–557. doi:10.1177/0272989X14547740
Bradlow, E. T., & Fader, P. S. (2001). A bayesian lifetime model for the “hot 100” billboard songs. Journal of the American Statistical Association, 96(454), 368–381. doi:10.1198/ 016214501753168091
Burke, A. E. (1996). How effective are international copyright conventions in the music industry? Journal of Cultural Economics, 20(1), 51–66. doi:10.1007/s10824-005- 1060-z
Byun, C. H. C. (2016). The economics of the popular music industry. Springer. Cameron, S. (2015). Music in the marketplace: a social economics approach. doi:10.5860/
choice.192595 Cameron, S. (2016). Past, present and future: music economics at the crossroads. Journal of
Cultural Economics, 40(1), 1–12. doi:10.1007/s10824-015-9263-4 Cartwright, E. (2018). Behavioral Economics. Routledge. Chernev, A., Böckenholt, U., & Goodman, J. (2012). Choice overload: A conceptual review
and meta-analysis. 25(2), 333–358. doi:10.1016/j.jcps.2014.08.002 Coleman, J., & Fararo, T. (1992). Rational choice theory. Sage Publications.
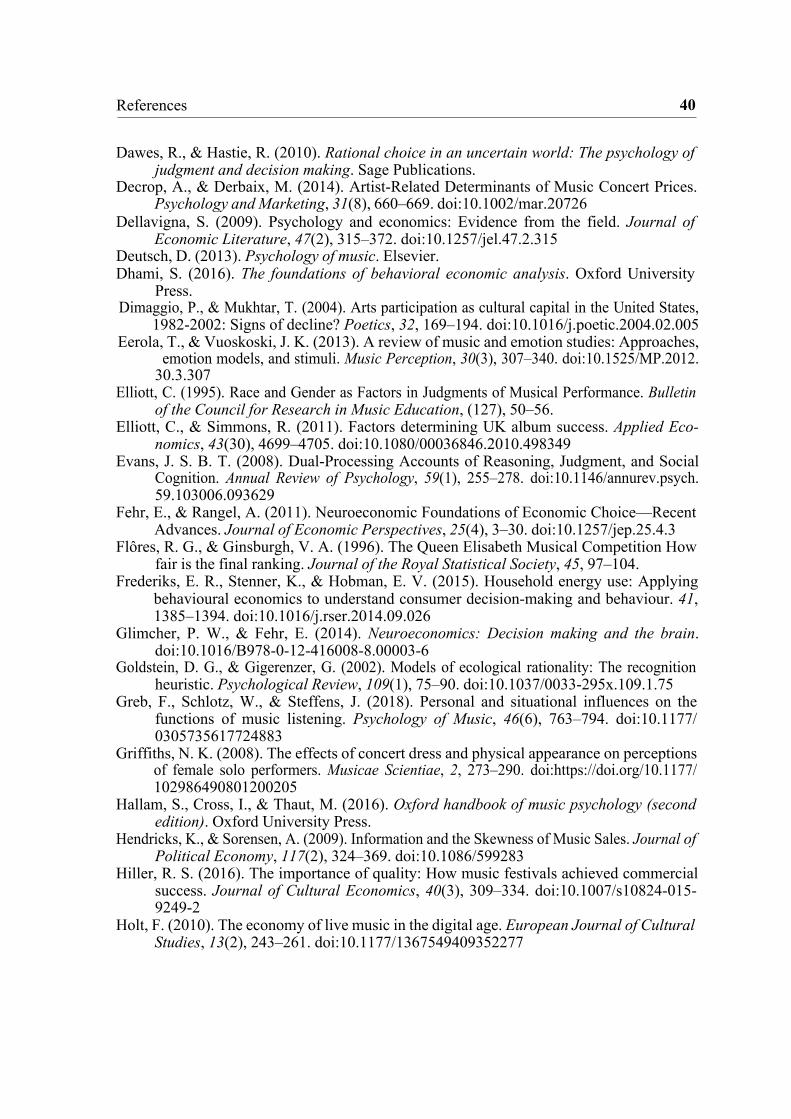
40 References
Dawes, R., & Hastie, R. (2010). Rational choice in an uncertain world: The psychology of
judgment and decision making. Sage Publications. Decrop, A., & Derbaix, M. (2014). Artist-Related Determinants of Music Concert Prices.
Psychology and Marketing, 31(8), 660–669. doi:10.1002/mar.20726 Dellavigna, S. (2009). Psychology and economics: Evidence from the field. Journal of
Economic Literature, 47(2), 315–372. doi:10.1257/jel.47.2.315 Deutsch, D. (2013). Psychology of music. Elsevier. Dhami, S. (2016). The foundations of behavioral economic analysis. Oxford University
Press. Dimaggio, P., & Mukhtar, T. (2004). Arts participation as cultural capital in the United States,
1982-2002: Signs of decline? Poetics, 32, 169–194. doi:10.1016/j.poetic.2004.02.005 Eerola, T., & Vuoskoski, J. K. (2013). A review of music and emotion studies: Approaches,
emotion models, and stimuli. Music Perception, 30(3), 307–340. doi:10.1525/MP.2012. 30.3.307
Elliott, C. (1995). Race and Gender as Factors in Judgments of Musical Performance. Bulletin of the Council for Research in Music Education, (127), 50–56.
Elliott, C., & Simmons, R. (2011). Factors determining UK album success. Applied Eco- nomics, 43(30), 4699–4705. doi:10.1080/00036846.2010.498349
Evans, J. S. B. T. (2008). Dual-Processing Accounts of Reasoning, Judgment, and Social Cognition. Annual Review of Psychology, 59(1), 255–278. doi:10.1146/annurev.psych. 59.103006.093629
Fehr, E., & Rangel, A. (2011). Neuroeconomic Foundations of Economic Choice—Recent Advances. Journal of Economic Perspectives, 25(4), 3–30. doi:10.1257/jep.25.4.3
Flôres, R. G., & Ginsburgh, V. A. (1996). The Queen Elisabeth Musical Competition How fair is the final ranking. Journal of the Royal Statistical Society, 45, 97–104.
Frederiks, E. R., Stenner, K., & Hobman, E. V. (2015). Household energy use: Applying behavioural economics to understand consumer decision-making and behaviour. 41, 1385–1394. doi:10.1016/j.rser.2014.09.026
Glimcher, P. W., & Fehr, E. (2014). Neuroeconomics: Decision making and the brain. doi:10.1016/B978-0-12-416008-8.00003-6
Goldstein, D. G., & Gigerenzer, G. (2002). Models of ecological rationality: The recognition heuristic. Psychological Review, 109(1), 75–90. doi:10.1037/0033-295x.109.1.75
Greb, F., Schlotz, W., & Steffens, J. (2018). Personal and situational influences on the functions of music listening. Psychology of Music, 46(6), 763–794. doi:10.1177/ 0305735617724883
Griffiths, N. K. (2008). The effects of concert dress and physical appearance on perceptions of female solo performers. Musicae Scientiae, 2, 273–290. doi:https://doi.org/10.1177/ 102986490801200205
Hallam, S., Cross, I., & Thaut, M. (2016). Oxford handbook of music psychology (second edition). Oxford University Press.
Hendricks, K., & Sorensen, A. (2009). Information and the Skewness of Music Sales. Journal of Political Economy, 117(2), 324–369. doi:10.1086/599283
Hiller, R. S. (2016). The importance of quality: How music festivals achieved commercial success. Journal of Cultural Economics, 40(3), 309–334. doi:10.1007/s10824-015- 9249-2
Holt, F. (2010). The economy of live music in the digital age. European Journal of Cultural Studies, 13(2), 243–261. doi:10.1177/1367549409352277

41 References
IFPI. (2019). International Federation of the Phonographic Industry (IFPI) Global Music
Report 2018. Retrieved from http://www.ifpi.org/downloads/GMR2019.pdf Impett, J. (2016). Making a mark: the psychology of composition. In S. Hallam, I. Cross, &
M. Thaut (Eds.), The oxford handbook of music psychology. Oxford University Press. Jabbar, H. (2011). he behavioral economics of education: New directions for research.
Educational Researcher, 40(9), 446–453. Kahneman, D. (2003). Maps of bounded rationality: Psychology for behavioral economics.
American Economic Review, 93(5), 1449–1475. Kahneman, D. (2011). Thinking , Fast and Slow. Macmillan. Kolb, B. M. (2000). You call this fun? Reactions of young first-time attendees to a classical
concert. MEIEA Journal, 1(2), 13–29. Konecni, V. (1982). Social interaction and musical preference. In D. Deutsch (Ed.), The
psychology of music (pp. 497–516). Academic Press. Konecni, V. J., & Sargent-Pollock, D. (1976). Choice between melodies differing in complex-
ity under divided-attention conditions. Journal of Experimental Psychology: Human Perception and Performance, 2(3), 347–356. doi:10.1037/0096-1523.2.3.347
Koschate-Fischer, N., & Wüllner, K. (2017). New developments in behavioral pricing re- search. Journal of Business Economics, 87(6), 809–875. doi:10.1007/s11573-016- 0839-z
Krueger, A. B. (2005). The economics of real superstars: The market for rock concerts in the material world. Journal of Labor Economics, 23(1), 1–30. doi:10.1086/425431
Lamont, A., & Greasley, A. (2016). Musical preferences. In S. Hallam, I. Cross, & M. Thaut (Eds.), The oxford handbook of music psychology. Oxford University Press.
Lamont, A., Greasley, A., & Sloboda, J. (2016). Choosing to Hear Music. In S. Hallam, I. Cross, & M. Thaut (Eds.), The oxford handbook of music psychology (pp. 1–20). Oxford University Press.
Lantos, G. P., & Craton, L. G. (2012). A model of consumer response to advertising music. Journal of Consumer Marketing, 29(1), 22–42. doi:10.1108/07363761211193028
Larsen, G., & Hussels, S. (2011). The significance of commercial music festivals. In S. Cameron (Ed.), Handbook on the economics of leisure (pp. 250–270). doi:10.4337/ 9780857930569.00022
Liebowitz, S. J. (2004). Will MP3 downloads annihilate the record industry? The evidence so far. Advances in the Study of Entrepreneurship, Innovation, and Economic Growth, 15, 229–260. doi:10.1016/S1048-4736(04)01507-3
Liebowitz, S. J. (2006). File sharing: Creative destruction or just plain destruction? Journal of Law and Economics, 49(1), 1–28. doi:10.1086/503518
Linnemann, A., Wenzel, M., Grammes, J., Kubiak, T., & Nater, U. M. (2018). Music listening and stress in daily life—a matter of timing. International Journal of Behavioral Medicine, 25(2), 223–230. doi:10.1007/s12529-017-9697-5
Lonsdale, A. J., & North, A. C. (2012). Musical taste and the representativeness heuristic. Psychology of Music, 40(2), 131–142. doi:10.1177/0305735611425901
Maeshiro, T., Nakayama, S. I., & Maeshiro, M. (2011). Representation of decision making process in music composition based on hypernetwork model. In Lecture notes in computer science (including subseries lecture notes in artificial intelligence and lecture notes in bioinformatics) (Vol. 6771 LNCS, pp. 109–117). doi:10.1007/978-3-642- 21793-7_13
Maymin, P. (2012). Music and the market: Song and stock volatility. North American Journal of Economics and Finance, 23(1), 70–85. doi:10.1016/j.najef.2011.11.004

42 References
Mortimer, J. H., Nosko, C., & Sorensen, A. (2012). Supply responses to digital distribution:
Recorded music and live performances. Information Economics and Policy, 24(1), 3–14.
North, A. C., & Hargreaves, D. J. (1999). Music and driving performance. Scandinavian Journal of Psychology, 40, 285–292.
North, A. C., & Hargreaves, D. J. (2000). Musical preferences during and after relaxation and exercise. The American Journal of Psychology, 113(1).
North, A. C., & Hargreaves, D. J. (2008). The social and applied psychology of music. OUP Oxford.
Oakes, S. (2007). Evaluating Empirical Research into Music in Advertising: A Congruity Perspective. Article in Journal of Advertising Research, 47(1), 38–50. doi:10.2501/ S0021849907070055
Oberholzer-Gee, F., & Strumpf, K. (2009). File sharing and copyright. Innovation Policy and the Economy, 10, 19–55. doi:10.1086/605852
Oeusoonthornwattana, O., & Shanks, D. R. (2010). I like what I know: Is recognition a non-compensatory determiner of consumer choice? Judgment and Decision Making, 5(4), 310–325.
Peters, J., & Büchel, C. (2011). The neural mechanisms of inter-temporal decision-making: understanding variability. Trends in cognitive sciences, 15(5), 20–37.
Pettijohn, T. F., Eastman, J. T., & Richard, K. G. (2012). And the Beat Goes On: Popular Billboard Song Beats Per Minute and Key Signatures Vary with Social and Economic Conditions. Current Psychology, 31, 313–317. doi:10.1007/s12144-012-9149-y
Pettijohn, T. F., & Sacco, D. F. (2009). The Language of lyrics An analysis of popular Billboard songs across conditions of social and economic threat. Journal of Language and Social Psychology, 28, 297–311. doi:10.1177/0261927X09335259
Pope, D. G., Price, J., & Wolfers, J. (2013). Awareness Reduces Racial Bias. Management Science, 64(11), 4988–4995.
Rayna, T., & Striukova, L. (2009). Monometapoly or the Economics of the Music Industry. Prometheus, 27(3), 211–222. doi:10.1080/08109020903127778
Reber, R., Schwarz, N., & Winkielman, P. (2004). Processing fluency and aesthetic pleasure: Is beauty in the perceiver’s processing experience? Personality and Social Psychology Review, 8(4), 364–382. doi:10.1207/s15327957pspr0804_3
Renwick, J. M., & Reeve, J. (2012). Supporting motivation in music education. In G. E. McPherson & G. F. Welch (Eds.), Oxford handbook of music education (pp. 143–162). Oxford University Press.
Rice, T. (2013). The Behavioral Economics of Health and Health Care. Annual Review of Public Health, 34(1), 431–447. doi:10.1146/annurev-publhealth-031912-114353
Saarikallio, S., & Erkkilä, J. (2007). The role of music in adolescents’ mood regulation. Psychology of Music, 35(1), 88–109. doi:10.1177/0305735607068889
Salimpoor, V. N., van den Bosch, I., Kovacevic, N., McIntosh, A. R., Dagher, A., & Zatorre, R. J. (2013). Interactions between the nucleus accumbens and auditory cortices predict music reward value. Science, 340(6129), 216–219. doi:10.1126/science.1231059. arXiv: arXiv:1011.1669v3
Samson, A. (2017). The Behavioral Economics Guide 2017. Behavioral Science Solutions Ltd.
Schramm, H., & Spangardt, B. (2016). Wirkung von Musik in der Werbung [Effects of music in advertising]. In Handbuch werbeforschung (Siegert, G, pp. 433–449). Wiesbaden, Germany: Springer VS.
43 References
Shah, A. K., & Oppenheimer, D. M. (2007). Easy does it: The role of fluency in cue weighting.
Judgment and Decision Making, 2(6), 371–379. Simon, H. A. (1955). A Behavioral Model of Rational Choice. The Quarterly Journal of
Economics, 69(1), 99–118. doi:10.2307/1884852 Simon, H. A. (1982). Models of Bounded Rationality. MIT press. Slovic, P., Finucane, M., Peters, E., & MacGregor, D. G. (2002). Rational actors or rational
fools: Implications of the effects heuristic for behavioral economics. Journal of Socio- Economics, 31(4), 329–342. doi:10.1016/S1053-5357(02)00174-9
Stevans, L. K., & Sessions, D. N. (2005). An empirical investigation into the effect of music downloading on the consumer expenditure of recorded music: A time series approach. Journal of Consumer Policy, 28(3), 311–324. doi:10.1007/s10603-005-8645-y
Strobl, E. A., & Tucker, C. (2000). The dynamics of chart success in the U.K. pre-recorded popular music industry. Journal of Cultural Economics, 24(2), 113–134. doi:10.1023/ A:1007601402245
Sweeting, A. (2013). Dynamic Product Positioning in Differentiated Product Markets: The Effect of Fees for Musical Performance Rights on the Commercial Radio Industry. Econometrica, 81(5), 1763–1803. doi:10.3982/ECTA7473
Tahler, R. (2015). Misbehaving: The Making of Behavioral Economics. WW Norton. Tan, S., Pfordresher, P., & Harré, R. (2017). Psychology of music: From sound to significance.
Routledge. Thaler, R. (1985). Mental Accounting and Consumer Choice. Marketing Science, 4(3), 199–
214. doi:10.1287/mksc.4.3.199 Tschmuck, P. (2017). The economics of music. Agenda Publishing. Tversky, A., & Kahneman, D. (1973). Availability: A heuristic for judging frequency and
probability. Cognitive Psychology, 5(2), 207–232. doi:10.1016/0010-0285(73)90033-9 Tversky, A., & Kahneman, D. (1974). Judgment under Uncertainty: Heuristics and Biases.
Science, 185(4157), 1124–31. doi:10.1126/science.185.4157.1124 Varian, H. R. (2005). Copying and copyright. Journal of Economic Perspectives, 19(2),
121–138. doi:10.1257/0895330054048768 Waddell, G. (2018). Time to decide: A study of evaluative decision-making in music perfom-
rance (Doctoral dissertation, Royal College of Music). Wöllner, C., & Behne, K.-E. (2011). Seeing or hearing the pianists? A synopsis of an early
audiovisual perception experiment and a replication. Musicae Scientiae, 15(3), 324– 342. doi:10.1177/1029864911410955
Zatorre, R. J., & Zald, D. H. (2011). Music. In J. A. Gottfried (Ed.), Neurobiology of sensation and reward. CRC Press.
Zullow, H. M. (1991). Pessimistic rumination in popular songs and news magazines pre- dict economic recession via decreased consumer optimism and spending. Journal of Economic Psychology, 12(3), 501–526.
Appendix A Visualizing music psychology (S1)
This is an Accepted Manuscript of an article published by SAGE in Music & Science on 25th of January 2019. ©The Author(s) 2019. Reprinted by permission of SAGE Publications1, and available online: https://doi.org/10.1177/2059204318811786. The paper is not the copy of the record and may not exactly replicate the authoritative document published in the journal. For presentation in this thesis, the appendices of the paper have been removed and the passages referring to each Appendix in the text modified to indicate where to find the materials online. Moreover, there may be minor modifications in the text to guarantee a consistent typographic style throughout the thesis, such as the position of figures and tables. Please do not copy or cite without author’s permission.
Citation Anglada-Tort, M., & Sanfilippo, K. R. M. (2019). Visualizing Music Psychology: A Bibliometric Analysis of Psychology of Music, Music Perception, and Musicae Scientiae from 1973 to 2017. Music & Science, 2, 2059204318811786. DOI: https://doi.org/10.1177/2059204318811786.
Author contribution The paper was written together with Dr. Sanfilippo (Goldsmiths, University of London). I conceived of the idea and the analysis strategy for the study, whereas all other aspects were done collaboratively.
1 The paper is deposited under the rems of the Creative Commons Non Commercial CC BY-NC: This article is distributed under the terms of the Creative Commons Attribution-NonCommercial 4.0 License (http://www.creativecommons.org/licenses/by-nc/4.0/), which permits non-commercial use, reproduction and distribution of the work without further permission provided the original work is attributed as specified on the SAGE and Open Access pages (https://us.sagepub.com/en-us/nam/open-access-at-sage).

Visualizing music psychology: A bibliometric analysis of
Psychology of Music, Music Perception, and Musicae
Scientiae from 1973 to 2017
Music psychology has grown drastically since being established in the middle of the 19th century. However, up to this date, no large-scale computational bibliometric analysis of the scientific literature in music psychology has been carried out. This study aims to analyze all published literature from the journals Psychology of Music, Music Perception, and Musicae Scientiae. The retrieved literature comprised a total of 2,089 peer-reviewed articles, 2,632 authors, and 49 countries. Visualization and bibliometric techniques were used to investigate the growth of publications, citation analysis, author and country productivity, collaborations, and research trends. From 1973 to 2017, with a total growth rate of 11%, there is a clear increase in music psychology research (i.e. number of publications, authors, and collabo- rations), consistent with the general growth observed in science. The retrieved documents received a total of 33,771 citations (M = 16.17, SD = 26.93), with a median (Q1 – Q3) of 7 (2 – 20). Different bibliometric indicators defined the most relevant authors, countries, and keywords as well as how they relate and collaborate with each other. Differences between the three journals are also studied. This type of analysis, not without its limitations, can help understand music psychology and identify future directions within the field.
Keywords: music psychology; psychology of music; bibliometrics; scientometrics; visu- alization technique.

46 A.1 Introduction
A.1 Introduction
The beginnings of what we now regard as music psychology started in the middle of the 19th century as a branch of both psychology and musicology (Thaut, 2016). But music psychology has evolved and grown drastically since then. From a focus on psychoacoustics, perception, and the cognitive sciences, to health applications and the use of music in everyday life, music psychology has shifted and blossomed, establishing programs, labs and journals covering different research interests, geographical areas, and research groups.
Music Psychology can be defined as the scientific study of the psychological processes through which music is perceived, created, responded to, and incorporated to everyday life (Tan, Pfordresher, & Harré, 2017; Thompson, 2014). The field of music psychology therefore embraces an incredibly diverse and wide variety of topics, including the origins of music, music perception and cognition, responses to music (e.g. bodily, emotional, and aesthetical), the neuroscience of music, music development, music education, music performance, composition and improvisation, the use of music in everyday life, and music therapy and wellbeing (Hallam, Cross, & Thaut, 2016). But the psychology of music can also contribute to many other fields, including musical theory, ethnomusicology, computer science, aesthetics, health sciences, marketing and advertising. Researchers from all over the globe investigate these topics empirically, with more than 80 music cognition and science labs around the world (www.musicperception.org/smpc-resources.html). Various music psychology specific conference series have also begun to develop such as the International Conference on Music Perception and Cognition (ICMPC), founded in 1989, and the European Society for the Cognitive Sciences of Music (ESCOM), founded in 1991. In 2008, the International Conference of Students of Systematic Musicology (SysMus) was founded for students of systematic musicology, a broader field which encompasses music psychology.
The first research journal specifically dedicated to music psychology is Psychology of Music established in 1973. This multidisciplinary journal’s aim is to, "increase scientific understand- ing of all psychological aspects of music and music education". Music Perception, estab- lished in 1983, was developed with a primary focus on cognitive-psychological research with broader and multidisciplinary draw, including work from “psychology, psychophysics, neuro- science, music theory, acoustics, artificial intelligence, linguistics, philosophy, anthropology and cognitive science” (mp.ucpress.edu). In 1997, the European Society for the Cognitive Sciences of Music (ESCOM) was developed along with its journal Musicae Scientiae, which aims to include “empirical, theoretical and critical articles directed at increasing understand- ing of how music is perceived, represented and generated” (journals.sagepub.com/home/msx). As a truly multidisciplinary subject, music psychology research is published in many other

47 A.1 Introduction
journals, including other APA journals and journals from related disciplines, such as musicol- ogy, music theory, music therapy, music education, aesthetics, marketing, and neuroscience. This includes, for example, the Journal of Research in Music Education, International Jour- nal of Music Education, Journal of Music Therapy, Empirical Musicology Review, and Psychomusicology: Music, Mind, and Brain
The current research focuses on the three most prominent scientific journals in music psy- chology. Namely, Psychology of Music, Music Perception, and Musicae Scientiae. We used two criteria to select these journals: content and impact. Regarding content, the focus was in journals covering specifically the psychology of music. Impact was determined by the SJR ranking provided in SCImago (https://www.scimagojr.com/). This measure indicates the average number of weighted citations per document received within the selected journal during the previous three years. In June 2018, searching in the category “music”, Psychology of Music was ranked the fourth, Musicae Scientiae the sixth, and Music Perception the seventh. The first (i.e. IEE Signal Processing Magazine), second (i.e., Journal of Research in Music Education), third (i.e., Music Education Research), and fifth (i.e., International Journal of Music Education) journals did not meet the first criterion of content, focusing on other topics rather than music psychology (i.e. signal processing or music education).
With the surge of interest in music psychology research, it is important as a discipline to reflect objectively and systematically on what research has been published and what gaps can still be filled. Bibliometrics and scientometrics allow for the measurement and analysis of published scientific literature, giving objective and measureable data to help us understand the discipline’s trajectory thus far. By using computational, mathematical and statistical techniques, bibliometrics analyses the quantity and quality of published scientific literature, including citation analysis, authorship and country productivity and collaborations, impact of publications, and research trends (e.g., Blázquez-Ruiz, Guerrero-Bote, & Moya- Anegón, 2016; Blažun, Kokol, & Vošner, 2015; Chen, Arsenault, Gingras, & Larivière, 2015; De Bellis, 2009; Laengle et al., 2017; Mryglod, Holovatch, Kenna, & Berche, 2016; Naukkarinen & Bragge, 2016; Sweileh, 2017; Sweileh, Al-Jabi, AbuTaha, Zyoud, Anayah, & Sawalha, 2017; Sweileh, Al-Jabi, Sawalha, Zyoud, 2016; Sweileh et al., 2016). Bibliometric analysis has rarely been applied to music psychology. We have found two articles that used a bibliometric approach to study perception and cognition research (Tirovolas & Levitin, 2011) and music and affect research (Diaz & Silveria, 2014). In Triovolas & Levitin (2011) study, the authors looked at publications within one journal (i.e., Music Perception), covering a total 578 articles. The retrieved literature was coded to look at the most frequent topics, populations, stimuli, materials, outcome measures, and music styles, indicating their trends

48 A.1 Introduction
between 1984 and 2009. They also provided a list of the top 20 most highly cited articles published in Music Perception and the top 20 articles published outside Music Perception that were most cited in the journal. Finally, the authors showed the most productive countries publishing in Music Perception. In the paper by Diaz and Silveria (2014), the authors looked specifically at music and affective phenomena. They focused on three journals: the Journal of Research in Music Education, Psychology of Music, and Music Perception. The authors used a strict inclusion criteria to select articles related to topics relevant to affective aspects of music, resulting in a total of 286 articles. While the study by Triovolas & Levitin (2011) only focused on one scientific journal, the study by Diaz and Sliveria (2014) had a very narrow topical focus. Thus, these studies cannot give insight into trends throughout music psychology as a whole. Moreover, the studies used very few bibliometric indicators. For instance, they did not provide information about growth of publications, more elaborated citation analysis, or author productivity and collaborations. Another important limitation in these two studies is the use of human coders to analyze the content of the articles.
The present study aims to produce a large-scale computational bibliometric analysis of the scientific literature published in music psychology from 1973 to 2017. Using this method of analysis we aim to better understand research trends, citations, authorships, collaborations, as well as global contributions. This is important in identifying future directions within the field. To reduce potential sources of bias and analyze systematically a large amount of documents, the present study used the R package Bibliometrix (Aria & Cuccurullo, 2017), a tool for quantitative research in bibliometrics that provides various functions to perform citation, coupling, and scientific collaboration analysis. To visualize the data, we used VOSviewer (Van Eck & Waltman, 2010), a software tool that applies advanced clustering and natural language processing techniques for generating and visualizing maps based on network data. VOSviewer software has been used in a large body of published literature (http://www.vosviewer.com/publications), generating over 500 publications since 2006. To the best of our knowledge, the software has not yet been applied to music psychology literature.
In the present study we analyze, through visualization and bibliometric techniques, all published literature from Psychology of Music, Music Perception, and Musicae Scientiae, focusing on five key aspects of the retrieved literature: (1) growth of publications (i.e., annual growth rate, relative growth rate, and whether there are significant temporal changes in the number of publications over time), (2) citation analysis (i.e., number of citations per journal and year, top cited authors and papers, and whether there are significant temporal changes in the number of citations over time), (3) authorship analysis (i.e., productivity,

49 A.2 Methods
dominance, collaboration index, visualizations of authorship collaboration, and Lotka’s law), (4) country analysis (i.e., productivity, visualization of country collaboration, and geographical distribution of the publications), and (5) the main conceptual language used in the retrieved literature.
A.2 Methods
A.2.1 Data collection and search strategy
The data used in this study was retrieved from Scopus, a bibliographic database that covers over 20,000 journals, including technical, medical, and social sciences titles. Scopus is larger than PubMed and Web of Science (Falagas, Pitsouni, Malietzis, & Pappas, 2008) and offers many relevant features that facilitate bibliometric analysis (e.g., author, country, and affiliation contributions, citation analysis, and the “source type” function).
We searched all available literature, by “source title”, in Psychology of Music, Music Percep- tion, and Musicae Scientiae. Using the Scopus “source type” function, we limited the search to empirical and review articles only, excluding book chapters, conference papers, and edito- rial notes. We also excluded any document from 2018 because it was the year in which this study was conducted. All available results were then exported to text files, including citation information (i.e., authors, document title, year, source title, volume, issue, pages, citation count, source and document type, and DOI), bibliographical information (i.e., affiliations, serial identifiers, publisher, editor, language of original document, correspondence address, and abbreviated source title), abstracts, as well as keywords. All data was retrieved on the 20th of April 2018 (see supplementary materials for the two main datasets used in this study).
In some situations, the same author might have more than one name, use different initials in different publications (e.g., Sloboda, J. vs. Sloboda, J. A.), or have different name spellings. This might generate inaccuracy and inconsistencies in the computational analysis of authorship. There is not a clear solution to this problem. However, to reduce its negative impact, we deleted the second initials from all authors’ names in the retrieved dataset, including only the first surname and first initial. Moreover, it is important to note that our data has a gap between 2002 and 2004 in the literature retrieved from Music Perception. Scopus did not contain any documents from this source during these three years.
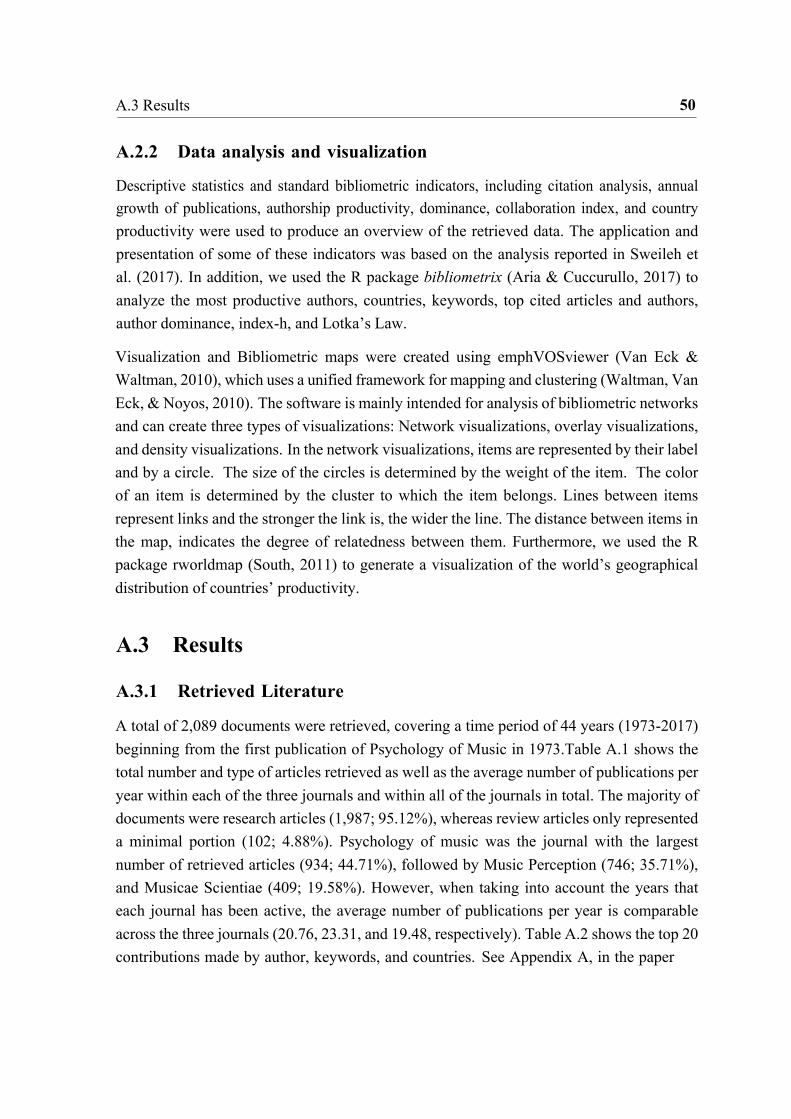
50 A.3 Results
A.2.2 Data analysis and visualization
Descriptive statistics and standard bibliometric indicators, including citation analysis, annual growth of publications, authorship productivity, dominance, collaboration index, and country productivity were used to produce an overview of the retrieved data. The application and presentation of some of these indicators was based on the analysis reported in Sweileh et al. (2017). In addition, we used the R package bibliometrix (Aria & Cuccurullo, 2017) to analyze the most productive authors, countries, keywords, top cited articles and authors, author dominance, index-h, and Lotka’s Law.
Visualization and Bibliometric maps were created using emphVOSviewer (Van Eck & Waltman, 2010), which uses a unified framework for mapping and clustering (Waltman, Van Eck, & Noyos, 2010). The software is mainly intended for analysis of bibliometric networks and can create three types of visualizations: Network visualizations, overlay visualizations, and density visualizations. In the network visualizations, items are represented by their label and by a circle. The size of the circles is determined by the weight of the item. The color of an item is determined by the cluster to which the item belongs. Lines between items represent links and the stronger the link is, the wider the line. The distance between items in the map, indicates the degree of relatedness between them. Furthermore, we used the R package rworldmap (South, 2011) to generate a visualization of the world’s geographical distribution of countries’ productivity.
A.3 Results
A.3.1 Retrieved Literature
A total of 2,089 documents were retrieved, covering a time period of 44 years (1973-2017) beginning from the first publication of Psychology of Music in 1973.Table A.1 shows the total number and type of articles retrieved as well as the average number of publications per year within each of the three journals and within all of the journals in total. The majority of documents were research articles (1,987; 95.12%), whereas review articles only represented a minimal portion (102; 4.88%). Psychology of music was the journal with the largest number of retrieved articles (934; 44.71%), followed by Music Perception (746; 35.71%), and Musicae Scientiae (409; 19.58%). However, when taking into account the years that each journal has been active, the average number of publications per year is comparable across the three journals (20.76, 23.31, and 19.48, respectively). Table A.2 shows the top 20 contributions made by author, keywords, and countries. See Appendix A, in the paper
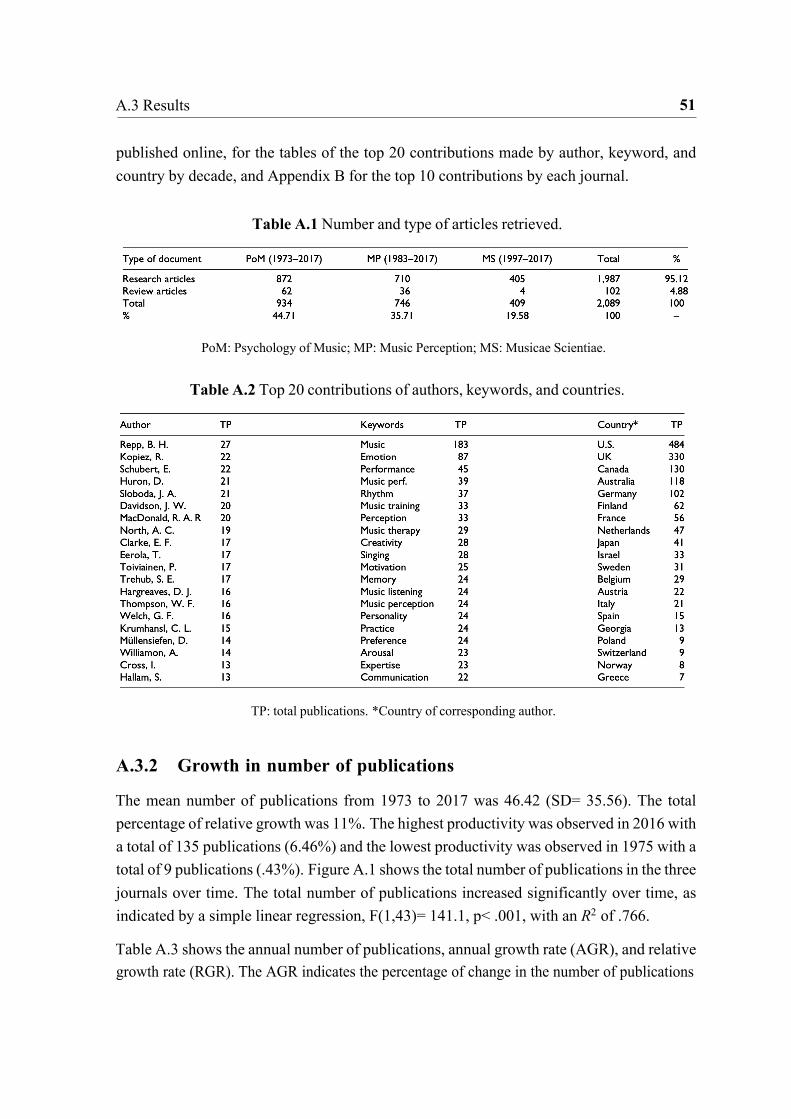
51 A.3 Results
published online, for the tables of the top 20 contributions made by author, keyword, and country by decade, and Appendix B for the top 10 contributions by each journal.
Table A.1 Number and type of articles retrieved.
PoM: Psychology of Music; MP: Music Perception; MS: Musicae Scientiae.
Table A.2 Top 20 contributions of authors, keywords, and countries.
TP: total publications. *Country of corresponding author.
A.3.2 Growth in number of publications
The mean number of publications from 1973 to 2017 was 46.42 (SD= 35.56). The total percentage of relative growth was 11%. The highest productivity was observed in 2016 with a total of 135 publications (6.46%) and the lowest productivity was observed in 1975 with a total of 9 publications (.43%). Figure A.1 shows the total number of publications in the three journals over time. The total number of publications increased significantly over time, as indicated by a simple linear regression, F(1,43)= 141.1, p< .001, with an R2 of .766.
Table A.3 shows the annual number of publications, annual growth rate (AGR), and relative growth rate (RGR). The AGR indicates the percentage of change in the number of publications
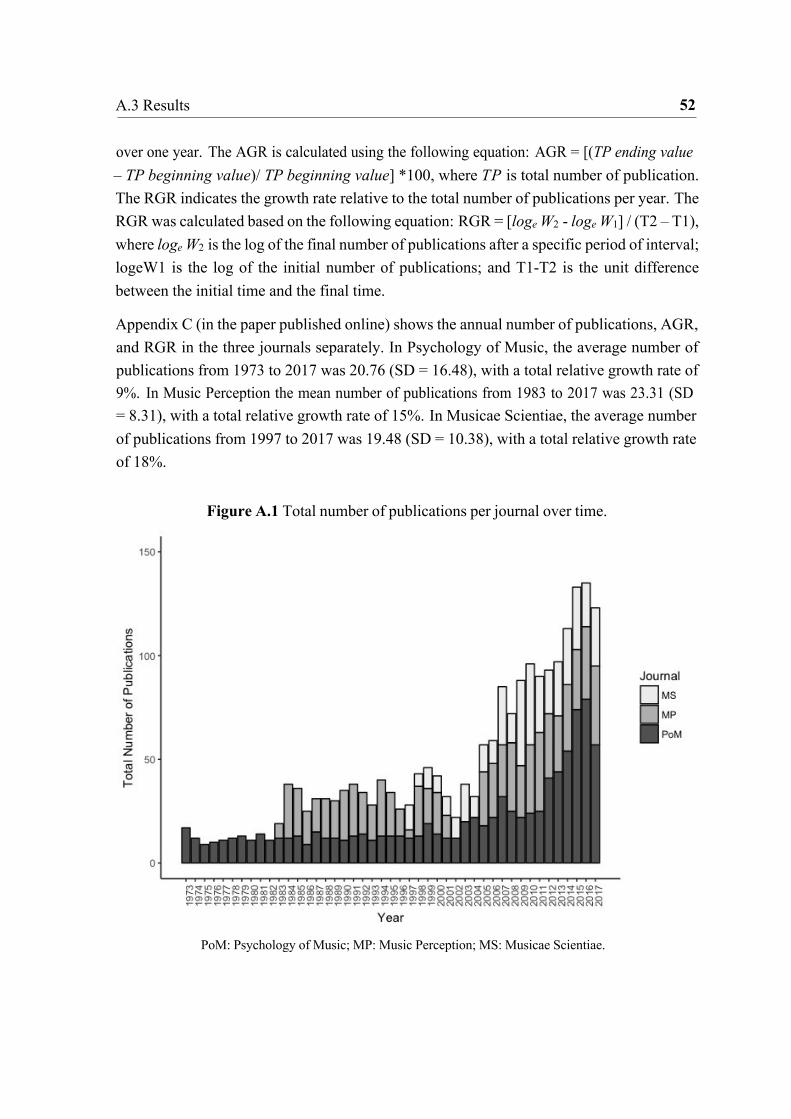
52 A.3 Results
over one year. The AGR is calculated using the following equation: AGR = [(TP ending value – TP beginning value)/ TP beginning value] *100, where TP is total number of publication. The RGR indicates the growth rate relative to the total number of publications per year. The RGR was calculated based on the following equation: RGR = [loge W2 - loge W1] / (T2 – T1), where loge W2 is the log of the final number of publications after a specific period of interval; logeW1 is the log of the initial number of publications; and T1-T2 is the unit difference between the initial time and the final time.
Appendix C (in the paper published online) shows the annual number of publications, AGR, and RGR in the three journals separately. In Psychology of Music, the average number of publications from 1973 to 2017 was 20.76 (SD = 16.48), with a total relative growth rate of 9%. In Music Perception the mean number of publications from 1983 to 2017 was 23.31 (SD = 8.31), with a total relative growth rate of 15%. In Musicae Scientiae, the average number of publications from 1997 to 2017 was 19.48 (SD = 10.38), with a total relative growth rate of 18%.
Figure A.1 Total number of publications per journal over time.
PoM: Psychology of Music; MP: Music Perception; MS: Musicae Scientiae.

53 A.3 Results
Table A.3 (left) Annual number of publications, AGR, and RGR. Table A.4 (right) Summary of the citation analysis.
AGR: annual growth rate and RGR: relative growth rate. TC: total citations.
A.3.3 Citation analysis
Table A.4 shows the summary of the citation analysis of all three journals combined. Re- trieved documents received a total of 33,771 citations, a mean of 16.17 (SD = 26.93) citations per document, and median (Q1 – Q3) of 7 (2 – 20). While the highest number of citations per document was in 2007, with 2,059 (M= 24.2, SD = 31.4) citations, the lowest was in 1975 with 25 citations (M= 2.8, SD = 2.9). Figure A.2 shows the average total number of citations

54 A.3 Results
over time. Across the entire time period, the average number of citations did not increase significantly, as indicated by a simple linear regression, F(1,43) = .21, p= .65, R2 = .005. However, the relationship between the average citations and year followed an inverted-U shaped, as indicated by a statistically significant quadratic regression, F(2,42) = 52.65, p < .001, R2 = .715.
Appendix D (in the paper published online) shows the summary of citation analysis in the three journals separately. In Psychology of Music, the retrieved documents received a total of 13,344 citations, a mean of 16.98 (SD = 26.12) citations per document, and median (Q1 – Q3) of 8 (3 - 21). In Music Perception, the documents received a total of 17,069 citations, a mean of 24.38 (SD = 33.25) citations per document, and median (Q1 – Q3) of 14 (5 - 29). In Musicae Scientiae, the documents received a total of 3,358 citations, a mean of 10.17 (SD = 15.04) citations per document, and median (Q1 – Q3) of 5 (2 - 12).
Figure A.2 Average total citations per year over time.
The top 10 cited articles and authors in the retrieved literature are shown in Table A.5 (a) and (b) respectively. The publication that received the highest amount of citations was “Perception of Temporal Patterns” by Povel and Essens (1985), with a total of 364 citations and an average of 11.03 citations per year. The author with the highest number of citations was John Sloboda who received a total of 1,070 citations.

55 A.3 Results
Table A.5 (a) Top 10 cited articles in the retrieved literature and (b) top 10 cited authors in the retrieved literature.
PoM: Psychology of Music; MP: Music Perception; MS: Musicae Scientiae. TC: total citations; TP: total
publications.
A.3.4 Authorship analysis: productivity, dominance, collaboration, and
Lotka’s Law
A total of 2,632 authors were covered in the retrieved literature, with a mean of 1.26 authors per article and a mean of .79 articles per author. The mean number of co-author per article was 2.08. Table A.6 shows the average authors per document, author productivity, and collaboration index (CI). The mean number of authors per document increased significantly over time, from a mean of 1.2 in the first period of 10 years (1973-1982) to a mean of 2.48 in the last period of 10 years (2008-2017), F(1,43) = 221.19, p< .001, R2 = .837. The collaboration index (CI) for multi-authored papers (CI = number of authors in multi-authored publications/number of multi-authored papers) increased significantly over time from 2.00 in 1974 (the first year with a multi-authored paper) to 2.98 in 2017, F(1,43) = 78.91, p < .001, R2 = .653.
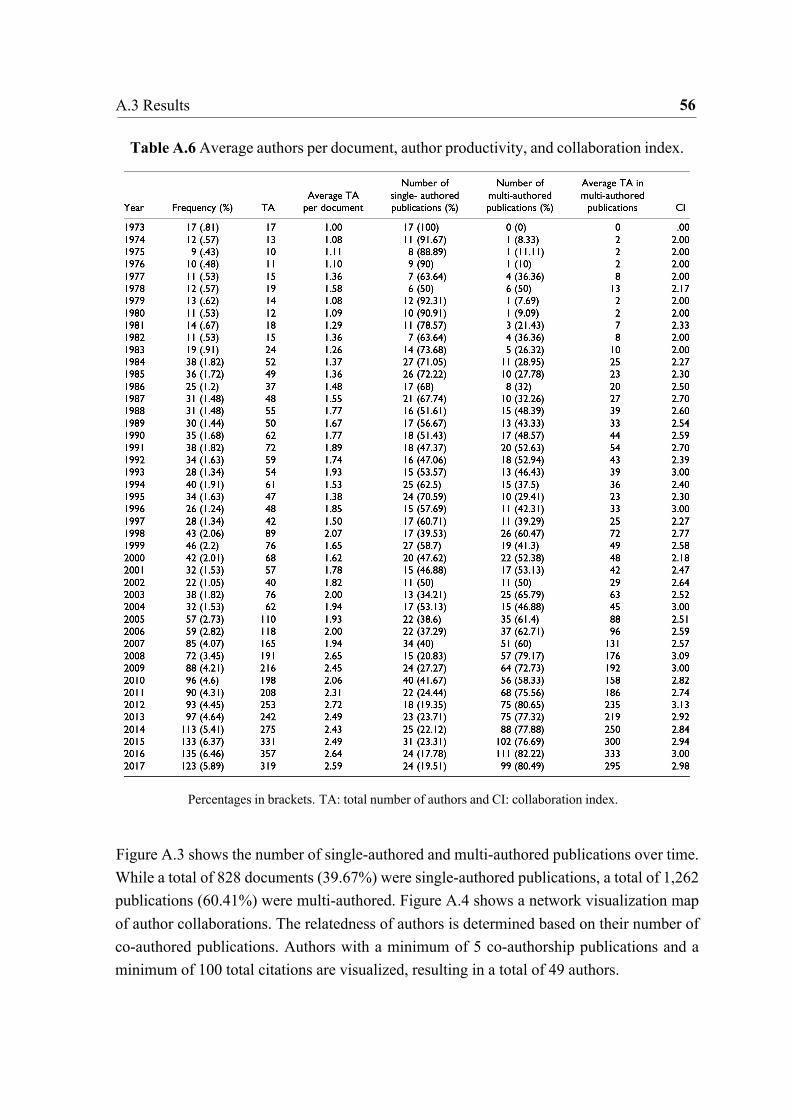
56 A.3 Results
Table A.6 Average authors per document, author productivity, and collaboration index.
Percentages in brackets. TA: total number of authors and CI: collaboration index.
Figure A.3 shows the number of single-authored and multi-authored publications over time. While a total of 828 documents (39.67%) were single-authored publications, a total of 1,262 publications (60.41%) were multi-authored. Figure A.4 shows a network visualization map of author collaborations. The relatedness of authors is determined based on their number of co-authored publications. Authors with a minimum of 5 co-authorship publications and a minimum of 100 total citations are visualized, resulting in a total of 49 authors.

57 A.3 Results
Figure A.3 Number of single-authored and multi-authored publications over time.
Figure A.4 Network visualization map of author collaborations.
The width of the line shows the strength of the collaboration. The size of the circle indicates the total number
of publications per author. The color of the circle indicates the cluster to which the author belongs.

58 A.3 Results
Table A.7 shows the authors with a minimum dominance factor of > .1. The dominance factor was proposed by Kumar & Kumar (2008), indicating a ratio of the fraction of multi-authored publications in which an author appears as first author (dominance factor 1 means that an author is the first author in all of his or her multi-authored papers). The author with the highest dominance factor (.47) was Tuomas Eerola, being the first author in 8 publications out of 17 multi-authored publications.
Table A.7 Authors with a minimum dominance factor of > .1.
Figure A.5 depicts Lotka’s law coefficient for scientific productivity (Lotka, 1926), indicating the theoretical distribution (red) and the estimated distribution based on the retrieved literature (blue). Lotka’s law describes the frequency of publication by authors in any given field. It assumes an inverse square law in which the number of authors making a certain number of contributions is a fixed ratio to the number of authors publishing a single article, implying that the theoretical beta coefficient of Lotka’s law nearly always equals 2. Using the function lotka from the R package bibliometrix (Aria & Cuccurullo, 2017) we estimated the Beta coefficient of the retrieved literature, which was 2.3 and had a goodness of fit equal to .94. A Kolmogorov-Smirnoff two sample test indicated that there were no significant differences between the observed and the theoretical Lotka distribution, p = .22.
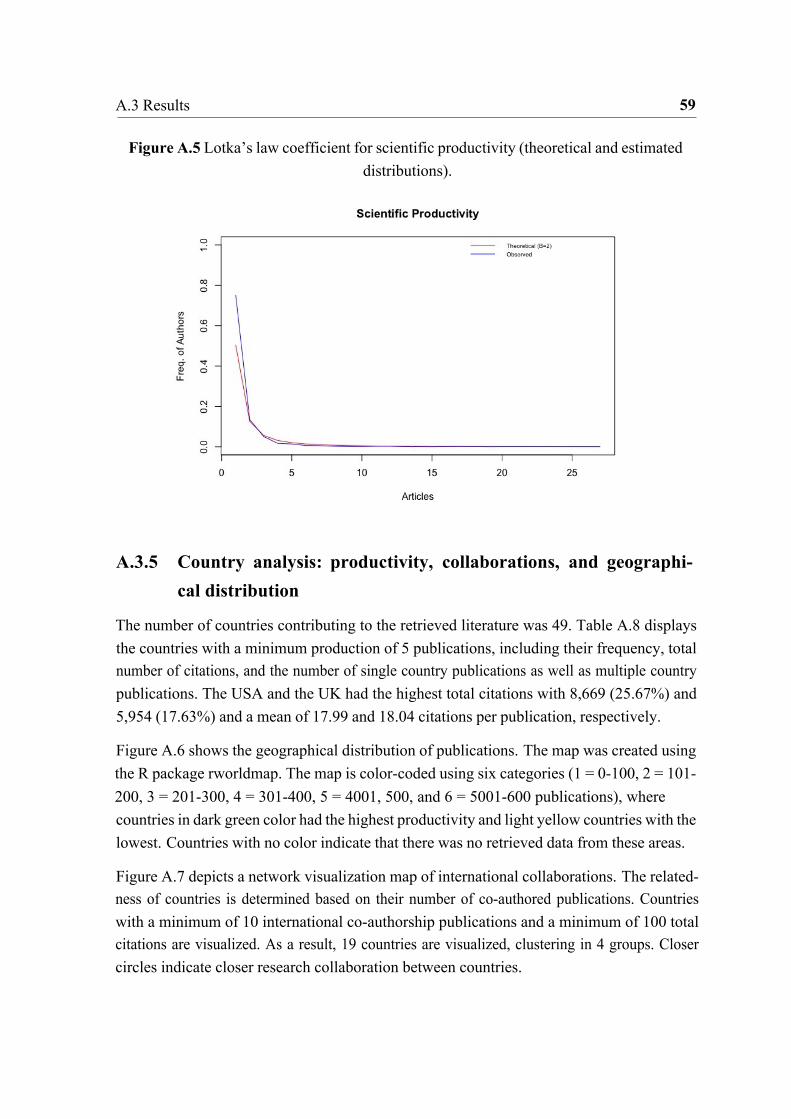
59 A.3 Results
Figure A.5 Lotka’s law coefficient for scientific productivity (theoretical and estimated distributions).
A.3.5 Country analysis: productivity, collaborations, and geographi-
cal distribution
The number of countries contributing to the retrieved literature was 49. Table A.8 displays the countries with a minimum production of 5 publications, including their frequency, total number of citations, and the number of single country publications as well as multiple country publications. The USA and the UK had the highest total citations with 8,669 (25.67%) and 5,954 (17.63%) and a mean of 17.99 and 18.04 citations per publication, respectively.
Figure A.6 shows the geographical distribution of publications. The map was created using the R package rworldmap. The map is color-coded using six categories (1 = 0-100, 2 = 101-200, 3 = 201-300, 4 = 301-400, 5 = 4001, 500, and 6 = 5001-600 publications), where countries in dark green color had the highest productivity and light yellow countries with the lowest. Countries with no color indicate that there was no retrieved data from these areas.
Figure A.7 depicts a network visualization map of international collaborations. The related- ness of countries is determined based on their number of co-authored publications. Countries with a minimum of 10 international co-authorship publications and a minimum of 100 total citations are visualized. As a result, 19 countries are visualized, clustering in 4 groups. Closer circles indicate closer research collaboration between countries.

60 A.3 Results
Table A.8 Countries with a minimum productivity of five publications (country of corresponding author).
TP: total publications, TC: total citations, SCP: single-country publication, MCP: multiple-country publication.

61 A.3 Results
Figure A.6 Geographical distribution of publications without correcting for country population (top) and with the correction (bottom).
Countries colored dark blue had the highest productivity and countries colored light yellow had the lowest.
Countries with no color indicate that there was no retrieved data from these areas.
Figure A.7 Network visualization map of international collaborations.
The width of the line shows the strength of the collaboration. The size of the circle indicates the total number
of publications per country. The color of the circle indicates the cluster to which the country belongs.

62 A.4 Discussion
A.3.6 Conceptual Language
Figure A.8 shows an overlay visualization map of author keywords occurrences (i.e., key- words listed by the authors on each publication). Only keywords that occurred a minimum of 10 times were included, resulting in a total of 75 keywords. Overlay maps are similar to network maps but they are colored based on a given score. The scores used in Figure 8 are based on the average publication year of each keyword. Dark blue represents the oldest average year of publications and red the most recent. The interpretation of the maps is the same as in the network visualization maps (i.e., closer circles indicate closer keyword occurrence).
Figure A.8 Network visualization map of keyword occurrences.
The width of the line shows the strength of the co-occurrence between keywords. The size of the circle
indicates the total number of occurrences. The color of the circle indicates average year of publications.
A.4 Discussion
This study aimed to analyze, through visualization and bibliometric techniques, all published literature from Psychology of Music, Music Perception, and Musicae Scientiae. Using all available literature in Scopus, a total of 2,089 publications, 2,632 authors, and 49 countries constituted the retrieved literature, covering a time span of 44 years (1973-2017). The major-
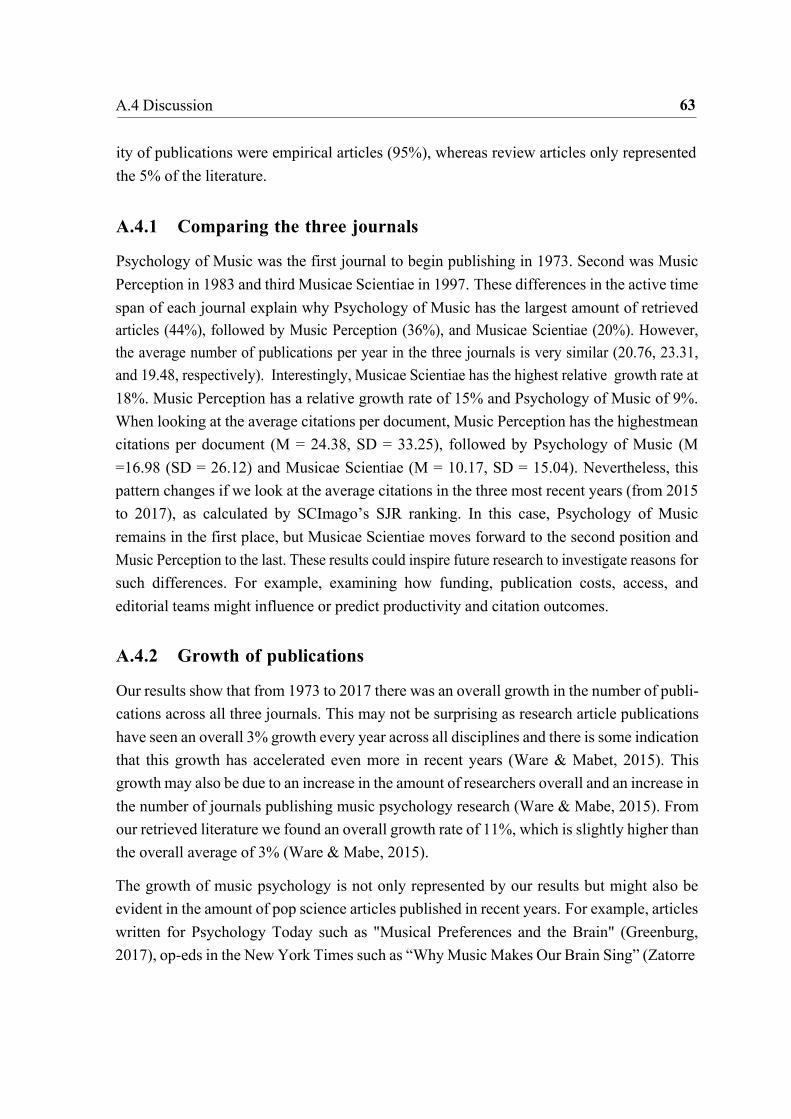
63 A.4 Discussion
ity of publications were empirical articles (95%), whereas review articles only represented the 5% of the literature.
A.4.1 Comparing the three journals
Psychology of Music was the first journal to begin publishing in 1973. Second was Music Perception in 1983 and third Musicae Scientiae in 1997. These differences in the active time span of each journal explain why Psychology of Music has the largest amount of retrieved articles (44%), followed by Music Perception (36%), and Musicae Scientiae (20%). However, the average number of publications per year in the three journals is very similar (20.76, 23.31, and 19.48, respectively). Interestingly, Musicae Scientiae has the highest relative growth rate at 18%. Music Perception has a relative growth rate of 15% and Psychology of Music of 9%. When looking at the average citations per document, Music Perception has the highest mean citations per document (M = 24.38, SD = 33.25), followed by Psychology of Music (M =16.98 (SD = 26.12) and Musicae Scientiae (M = 10.17, SD = 15.04). Nevertheless, this pattern changes if we look at the average citations in the three most recent years (from 2015 to 2017), as calculated by SCImago’s SJR ranking. In this case, Psychology of Music remains in the first place, but Musicae Scientiae moves forward to the second position and Music Perception to the last. These results could inspire future research to investigate reasons for such differences. For example, examining how funding, publication costs, access, and editorial teams might influence or predict productivity and citation outcomes.
A.4.2 Growth of publications
Our results show that from 1973 to 2017 there was an overall growth in the number of publi- cations across all three journals. This may not be surprising as research article publications have seen an overall 3% growth every year across all disciplines and there is some indication that this growth has accelerated even more in recent years (Ware & Mabet, 2015). This growth may also be due to an increase in the amount of researchers overall and an increase in the number of journals publishing music psychology research (Ware & Mabe, 2015). From our retrieved literature we found an overall growth rate of 11%, which is slightly higher than the overall average of 3% (Ware & Mabe, 2015).
The growth of music psychology is not only represented by our results but might also be evident in the amount of pop science articles published in recent years. For example, articles written for Psychology Today such as "Musical Preferences and the Brain" (Greenburg, 2017), op-eds in the New York Times such as “Why Music Makes Our Brain Sing” (Zatorre

64 A.4 Discussion
& Salimporr, 2013), and popular books such as This Is Your Brain On Music (Levitin, 2006) and Musicophilia: Tales of Music and the Brain (Sacks, 2007). Growth of interest in music psychology and its research, more specifically music and health research, may also be seen in the formation of the UK because All-Party Parliamentary Group on Arts, Health and Wellbeing (APPGAHW) in 2014, which aims to improve awareness of the benefits that the arts can bring to health and wellbeing. This UK group uses the research findings from music psychology, and other related arts disciplines, to help inform policies. Future research could be done to investigate the subsequent effects of increases in publications on the number of popular science publications and on governmental policies. Understanding this could give better insight into the impact of music psychology research outside of the academic audience.
A.4.3 Citation analysis
The retrieved documents received a total of 33,771 citations, with a mean of 16.17 (SD = 26.93) citations per document. This is relatively small compared to other related disciplines such as neuroscience, with 187 average citations per article, experimental psychology with 67, and clinical psychology with 68 (Patience, Patience, Blais, Bertrand, 2017). However, compared to music research publications, which has an average of about seven citations per article, it is relatively higher (Patience et al., 2017).
Across the entire time period, the average number of citations did not increase significantly. However, we identified a significant inverted-U shaped relationship between year of publica- tion and average number of citations, with its highest peak in 2007, which received 2,059 citations. This finding can be explained by the natural gap between year of publication and year of first citation. Hancock and Price (2016) provided some evidence of this gap by examining the first citation speed for articles in Psychology of Music from 1973 and 2012. The authors found that the probability of an article receiving a first citation was .25 after 2 years, .50 after 4 years, and .75 after 7 years (Hancock & Price, 2016).
The publication that received the highest amount of citations was “Perception of Temporal Patterns” by Povel and Essens (1985), with a total of 364 citations and an average of 11.03 citations per year. When looking at the top ten most cited articles (Table A.5a), we see that four out of the ten are about music and emotion and three are about investigating the temporal aspect of music. This may speak to the most cited areas or sub disciplines in the field of music psychology within these three journals. The author with the highest number of citations was John Anthony Sloboda who received a total of 1,070 citations. John Sloboda is also known for his research in music and emotion, again emphasizing a key area of music psychology research over the years.
65 A.4 Discussion
However, note that these results only cover articles published within three music psychology specific journals. For instance, we are not capturing articles published in neuroscience or general psychology journals that represent other sub disciplines within music psychology. It is also important to mention that we only used the citation analysis provided in Scopus on the 20th of April 2018. The content of this database is frequently updated, therefore, the numbers reported here will likely change over time. Moreover, there are significant differences between the number of citations indexed in Scopus and other databases, such as Web of Knowledge and Google Scholar (Meho & Yang, 2007). While both Scopus and Web of Knowledge index mostly refereed journal articles, Google Scholar indexes refereed and non-refereed types of documents. In addition, citation counts in different databases rely strongly on the subject matter of the researcher (Meho & Yang, 2007), some subjects being more represented in one database than in another.
Although it was beyond the scope of this study, it would be interesting to carry out an analysis to understand different factors which may predict the number of citations a publication might receive. As predictors, one could use the total number of authors per document, gender of the author, affiliation, country, funding body, research area, and/or journal of publication. For instance, Patience et al. (2017) found that the citation rate correlates positively with the number of funding agencies that finance the research. This is a thought-provoking element we did not account for in the present study. The effect funding has on the dissemination and impact of certain research is known, but not within the field of music psychology specifically.
A.4.4 Authorship analysis
A total of 2,632 authors were covered in the retrieved literature, with a mean of 1.26 authors per article and a mean of .79 articles per author. The mean number of authors per document increased significantly over time, from a mean of 1.2 in the first period of 10 years (1973-1982) to a mean of 2.48 in the last period of 10 years (2008-2017). While a total of 828 documents (39.67%) were single-authored publications, a total of 1,262 publications (60.41%) were multi-authored. Both the number of single-authored papers and multi-authored papers increased significantly over time. However, the magnitude of this increase was higher in the publications with multiple authors. Finally, the collaboration index (CI) for multi- authored papers (i.e., CI = number of authors in multi-authored publications/number of multi-authored papers) increased significantly over time, from 2.00 in 1974 (the first year with a multi-authored paper) to 2.98 in 2017. We can speculate why this growth may be happening, including a mixture of a spike in interest in music psychology, music psychology

66 A.4 Discussion
related journals, and programs training students in music psychology subsequently resulting in more music psychology researchers.
This growth in the total number of authors and collaboration are not just a significant trend in music psychology but is observed in general scientific literature. The Economist (2016) found that in 34 million research papers published in peer-reviewed journals and conference proceedings between 1996 and 2015, the average number of authors per paper grew from 3.2 to 4.4. Many factors could be responsible of this growth. One reason could be due to the fact that research is becoming more multi- and interdisciplinary in general, which is particularly true in the case of music psychology. Another reason may be due to authors wanting to “pad their publication lists” and the increasing institutional pressures to “publish or perish” (The Economist, 2016). Multi-authored papers help cut down the workload resulting in more publications per author per year. Future research could investigate more systematically the reason for this increase and try to understand how this might affect the impact or rigor of published scientific research.
The visualization map also gives a good indication of the spread of collaboration happening both internationally and within specific domains. For example, the blue cluster in the network visualization (Figure A.5) includes individuals from a range of sub disciplines such as everyday uses of music, music perception and music and memory and is mostly comprised of UK researchers. The author dominance factor (i.e., a ratio of the fraction of multi-authored publications in which an author appears as first author) is interesting in providing a different type of information in addition to author productivity. This visualization helps to track how collaborations across different domains and areas may be carried or created by certain dominate individuals within the field.
Finally, when comparing our data set to Loka’s theoretical distribution (Lotka, 1926), we found no significant differences between the observed and the theoretical distributions. Although expected, this is a good indicator that the literature in music psychology conforms to Lotka’s law. That is, the distribution of the number of authors and their scientific productivity (i.e., number of publications) is highly asymmetric: While very few authors publish many articles, the remaining authors publish very few.
A.4.5 Country analysis
When looking specifically at the international collaborations and distributions of publications we found that out of the total 49 countries contributing to the retrieved literature, the US and the UK were the most productive cuntries, defined as having the highest number of
67 A.4 Discussion
publications (US = 23% and UK = 16%) and citations (US = 26% and UK = 18%). Note, however, that our analysis did not account for population size and this variable is confounded in the data. The collaboration network map shows this predominance of the UK and the USA as well but also shows how more countries collaborate with the UK creating more international collaborations than the US. This may have to do with the UK being within the wider EU and thus fostering more collaboration between countries. This prominence of research coming from the US and the UK is not specific to music psychology. However, the full picture of nation productivity in music psychology looks different compared to the general picture. The world’s most research-intensive nations, measured by field-weighted citation impact are the UK, US, China, Japan, Germany, Italy, Canada and France (Kisjes, 2013). However, in our study the top 8 most productive countries were the USA, UK, Australia, Canada, Germany, Finland, France, and the Netherlands. The productivity of these countries may be related to certain funding opportunities available in these countries, number of labs and number of teaching programs based in these countries. Future research could investigate how funding affects the geographical distribution of music psychology. It is important to think about which nation’s voices are being heard and which are the loudest within the music psychology research. There is a limitation in knowledge if only a few nations are represented. Working towards creating opportunities in other countries for music psychology research and providing places for people to train could help disperse the distribution beyond Europe and the US.
A.4.6 Main conceptual language
The keywords that researchers used to describe their articles and how often they co-occur with others indicate the research trends and themes in music psychology. By selecting those keywords that occurred a minimum of 10 times we obtained a total of 75 keywords (Figure A.8). The keywords “music” and “emotion” have the highest number of co-occurrences as well as connections with other keywords. This finding is in line with the general interest and significant increase in research on music and emotion (Eerola & Vuoskoski, 2013; Gabrielsson & Lindstrom, 2011; Juslin & Laukka, 2003; Västfjäll, 2002). While some keywords connect very well with others (e.g., memory, performance, preference), others are more disconnected (e.g., flow, cross-cultural, musical expertise). It is also interesting to see how a close group of keywords represent research areas. For instance, a clear research area is constituted by “timing”, “synchronization”, “rhythm”, and “meter”; another by “music therapy”, “stress”, “depression”, “individual differences”, and “personality”. In addition, the overlay map shows how keyword use changes over time. We can see that keywords such as “synchronization” and “timing” both co-occur and are prominently used

68 A.4 Discussion
in the early 2000s, whereas keywords such as “self-regulation”, “flow”, and “emotion regulation” appear more popular in recent publications. Overall, this network map allows us to summarize and better understand the complex field of music psychology in a single picture, but the applications of this visualization technique are far-reaching. We encourage researchers to use this tool to define unexplored research areas within music psychology as well as complement their literature reviews. Although this is the first published article that uses VOSviewer (Van Eck & Waltman, 2010) to create visualization network maps within music psychology, the software has been used in more than 500 publications since 2006 (http://www.vosviewer.com/publications ).
A.4.7 Limitations of the study
The present study has two main limitations. First, we only included three journals in our analysis. This choice was based on the journals’ content and impact. The aim was to select the most prominent journals that specifically look at music psychology research. Moreover, we needed to use journals indexed in Scopus, as we used this database to retrieve the literature (e.g., the journals of Psychomusicology: Music, Mind, and Brain and Music & Science are yet not indexed in Scopus). This is an important limitation because high quality research on music psychology is published in a wide range of journals from a wide variety of disciplines, including experimental psychology, social psychology, clinical psychology, computer science, marketing and advertising, personality, and neuroscience. Thus, our study only examines a fraction of the total number of music psychology research publications and our conclusions can then only be drawn from this fraction of literature. It also means that some authors that do not appear as relevant in this dataset might actually be very influential in general.
The second main limitation is due to the fact that we used Scopus to retrieve the literature, including the citation analysis. This limitation is inherent to any bibliometric study using similar search strategies. Even though Scopus is the largest existing database (Falagas et al., 2008), it is not a complete record of all published literature due to licensing. For example, articles from Music Perception between 2002 and 2004 are missing in Scopus. In addition, when performing databases searches, there is a potential for false positive and false negative results; and the number of citations differ depending on the database (Meho & Yang, 2007). Finally, some authors might have more than one name or different name spelling, which might have caused inaccuracies in the result. Although no ideal solution exist to this problem, we reduced its potential negative impact at the minimal level by deleting the second initials from all authors’ names in the retrieved dataset, including only the first surname and the first
69 A.5 Conclusion
initial. We hope that the limitations of the current study are justified by the benefits of using large-scale computational bibliometric analysis.
A.5 Conclusion
The study reported here begins to investigate the general research trends, reach, and gaps within the published literature in three prominent music psychology journals. Using bib- liometric techniques to visualize and understanding the past and present of research in music psychology leads us to critical observations and conclusions opening many interesting avenues for future collaborations and research in the field.
More international collaboration, outside of Europe and the USA should be persued, allowing for different types of questions, methods and potential findings, steering our field away from WEIRD (Westernized, educated, industrialized, rich, and democratic) populations (Henrich, Heine, & Norenzayan, 2010). Future studies should be done to investigate potential predictors of music psychology research citations. Understanding how the system around music psychology research, it’s funding schemes, organizations and institutions, and the influence of certain individuals and countries impact the dissemination and academic impact of music psychology research could shed light on how the system is working and potential ways to improve it. Finally, future research should be persued investigating the wider impact of music psychology research to the general public and policies. Scientific communication and research impact is only becoming more important. Using similar computational large- scale analysis allows for these questions to be more objectively addressed.
Music psychology is still a relatively young field. Taking the time to objectively look back and reflect on how the field has progressed, which this study has only just begun to do, helps push the field forward in new and exciting directions. More research should be done using similar methods giving insight to the past, present and future of music psychology research.
A.6 References Aria, M., & Cuccurullo, C. (2017). bibliometrix: An R-tool for comprehensive science
mapping analysis. Journal of Informetrics, 11(4), 959-975. Bellis, N. De. (2009). Bibliometrics and citation analysis: from the science citation index to
cybermetrics. Scarecrow Press.

70 A.6 References
Blázquez-Ruiz, J., Guerrero-Bote, V. P., & Moya-Anegón, F. (2016). New scientometric-
based knowledge map of food science research (2003 to 2014). Comprehensive Reviews in Food Science and Food Safety, 15(6), 1040–1055.
Blažun, H., Kokol, P., & Vošner, J. (2015). Research literature production on nursing competences from 1981 till 2012: A bibliometric snapshot. Nurse Education Today, 35(5), 673–679.
Chen, S., Arsenault, C., Gingras, Y., & Larivière, V. (2014). Exploring the interdisciplinary evolution of a discipline: the case of Biochemistry and Molecular Biology. Scientomet- rics, 102(2), 1307–1323.
Diaz, F., Music, J. S.-J. of R. in, & 2014, undefined. (n.d.). Music and affective phenomena: A 20-year content and bibliometric analysis of research in three eminent journals. Journal of Research in Music Education, 62(1), 66-77.
Eerola, T., & Vuoskoski, J. K. (2013). A review of music and emotion studies: approaches, emotion models, and stimuli. Music Perception: An Interdisciplinary Journal, 30(3), 307-340.
Falagas, M. E., Pitsouni, E. I., Malietzis, G. A., & Pappas, G. (2008). Comparison of PubMed, Scopus, web of science, and Google scholar: strengths and weaknesses. The FASEB journal, 22(2), 338-342.
Gabrielsson, A., & Lindström, E. (2001). The influence of musical structure on emotional expression. In P.N. Juslin, & J.A. Sloboda (Eds., pp. 223-248), Music and Emotion: Theory and Research. New York: Oxford University Press.
Hallam, s., Cross, I., & Thaut, M. (2011). Oxford handbook of music psychology (2nd ed.). Oxford, UK: Oxford University Press.
Henrich, J., Heine, S. J., & Norenzayan, A. (2010). The weirdest people in the world?. Behavioral and Brain Sciences, 33(2-3), 61-83.
Juslin, P. N., & Laukka, P. (2003). Communication of emotions in vocal expression and music performance: Different channels, same code?. Psychological Bulletin, 129(5), 770.
Laengle, S., Merigó, J. M., Miranda, J., Słowinski, R., Bomze, I., Borgonovo, E., . . . Teunter, R. (2017). Forty years of the European Journal of Operational Research: A bibliometric overview. European Journal of Operational Research, 262(3), 803–816.
Levitin, D. J. (2006). This is your brain on music: The science of a human obsession. Penguin.
Meho, L. I., & Yang, K. (2007). Impact of data sources on citation counts and rankings of LIS faculty: Web of Science versus Scopus and Google Scholar. Journal of the American Society for Information Science and Technology, 58(13), 2105-2125.

71 A.6 References
Mryglod, O., Holovatch, Y., Kenna, R., & Berche, B. (2016). Quantifying the evolution
of a scientific topic: reaction of the academic community to the Chornobyl disaster. Scientometrics, 106(3), 1151–1166.
Patience, G. S., Patience, C. A., Blais, B., & Bertrand, F. (2017). Citation analysis of scientific categories. Heliyon, 3(5), e00300.
Povel, D.-J., & Essens, P. (1985). Perception of temporal patterns. Music Perception, 2(4), 411–440.
Sacks, O. (2010). Musicophilia: Tales of music and the brain. Vintage Canada. Sweileh, W. M. (2017). Global research trends of World Health Organization’s top eight
emerging pathogens. Globalization and Health, 13(1), 9. Sweileh, W. M., Al-Jabi, S. W., AbuTaha, A. S., Zyoud, S. H., Anayah, F. M. A., & Sawalha,
A. F. (2017). Bibliometric analysis of worldwide scientific literature in mobile - health: 2006-2016. BMC Medical Informatics and Decision Making, 17(1), 1–12.
Sweileh, W. M., Al-Jabi, S. W., Sawalha, A. F., & Zyoud, S. H. (2016a). Bibliometric profile of the global scientific research on autism spectrum disorders. SpringerPlus, 5(1).
Sweileh, W. M., Shraim, N. Y., Al-Jabi, S. W., Sawalha, A. F., Rahhal, B., Khayyat, R. A., & Zyoud, S. H. (2016). Assessing worldwide research activity on probiotics in pediatrics using Scopus database: 1994–2014. World Allergy Organization Journal, 9(1), 25.
Tan, S. L., Pfordresher, P., & Harré, R. (2017). Psychology of music: From sound to significance. Routledge.
Thaut, M. (2016). History and research. In S. Hallam, I. Cross, & M. Thaut (Eds.), Oxford handbook of music psychology (2nd ed.). Oxford, UK: Oxford University Press.
Thompson, W.F. (2009). Music Thought & Feeling: Understanding the Psychology of Music. New York: Oxford University Press.
Tirovolas, A. K., & Levitin, D. J. (2011). Music perception and cognition research from 1983 TO 2010: A categorical and blbliometric analysis of empirical articles in music perception. Music Perception, 29(1), 23–36.
van Eck, N. J., & Waltman, L. (2010). Software survey: VOSviewer, a computer program for bibliometric mapping. Scientometrics, 84(2), 523–538.
Västfjäll, D. (2001). Emotion induction through music: A review of the musical mood induction procedure. Musicae Scientiae, 5, 173-211.
Waltman, L., Van Eck, N. J., & Noyons, E. C. (2010). A unified approach to mapping and clustering of bibliometric networks. Journal of Informetrics, 4(4), 629-635.
Appendix B The Behavioural Economics of Music: Systematic review (S2)
The following paper has not yet been accepted to a peer-reviewed journal. The text presented here is the most updated version of the manuscript as written by the time in which this thesis was published (August 2021). For presentation in this thesis, the appendices of the paper have been removed. Moreover, there may be minor modifications in the text to guarantee a consistent typographic style throughout the thesis, such as the position of figures and tables.
Author contribution I conceived of the initial idea of the paper, whereas Dr. Nikhil Masters (School of Social Sciences, University of Manchester) played a major role in developing it further. Prof. Dr. Daniel Müllensiefen (Goldsmiths, University of London) and Prof. Dr. Jochen Steffens (Technische Universität Berlin) supervised the project at all stages. I was responsible for most of the systematic literature review, whereas Prof. Dr. Jochen Steffens and Dr. Nikhil Masters helped in the systematic screening processes. All other aspects of the paper were done collaboratively with all authors. The paper was written together with Dr. Nikhil Masters, with whom I share the first authorship.

The Behavioural Economics of Music: Systematic review
and future firections
In this paper, we conduct a systematic literature review to examine how behavioural eco- nomics has been utilised to study judgements and decision making related to music. Using a robust search strategy, we identified a total of 33 studies within four distinctive BEM areas that readily apply to music research: heuristics and biases, social decision making, behavioural time preferences, and dual process theory. We organised the discussion of this literature around these BEM areas, which allowed us to demonstrate the value of behavioural economics for music research and deduce further suggestions for future research. We hope this paper contributes to the establishment of the Behavioural Economics of Music (BEM), an interdisciplinary field that stimulates research on the intersection between music, psychology, economics, and other disciplines. The BEM can be used as a toolkit to generate new ideas and accelerate progress in any area concerned with human behaviours related to music.
Keywords: music psychology; behavioural economics; musical behaviour; decision making.

74 B.1 Introduction
B.1 Introduction
This paper discusses the role of behavioural economics in understanding decision making related to music. Specifically, we conduct a systematic literature review with the primary goal of identifying studies that have utilised insights from behavioural economics to study music. Our second goal is to use the results from our search to provide meaningful direction for future research in this area. Based on these two objectives, we propose the Behavioural Economics of Music (BEM), a unified research program that promotes the study of music research using the tools of behavioural economics.
Our motivation flows from an extensive literature in music psychology – a branch of psy- chology and musicology that aims to understand the psychological processes by which music is perceived, processed, responded to, created, and integrated in everyday life (see Hallam, Cross, & Thaut, 2016; Deutsch, 2013; Tan, Pfordresher, & Harré, 2017, for reviews). Decision making is inherent to many of these processes and constitutes the basis of musical behaviour. This includes, amongst others, music composition and improvisation choices, performance evaluation, music preferences and listening behaviour, music consumption and the market, the role of music in branding and advertising, and music use in health, such as music therapy. Research on these areas has been crucial in our understanding of the cognitive processes that drive music-related decision making. For example, studies have identified the neural mechanisms that support decision making in music improvisation by scanning musicians’ brains while improvising (see Beaty, 2015, for a review). When looking at music preferences and listening behaviour, researchers have found that individuals listen to music and choose different pieces to satisfy a number of psychological needs, from distraction and motivation, to emotional regulation and stress reduction (e.g., Greb et al., 2018; Linnemann et al., 2018; Saarikallio & Erkkilä, 2007). In clinical contexts, practitioners rely on psychological-based models, such as the transformational design model (TDM), to successfully design and implement music interventions to support patients’ health needs (see MacDonald et al., 2013, for a review).
Independent from music psychology, music-related decision making has also been studied through the lens of economics (see Byun, 2016; Connolly & Krueger, 2005; Tschmuck, 2007, for general overviews). In particular, research from economics has been able to improve understanding of decision making in music markets by successfully applying theoretical tools from neoclassical economics such as producer theory, consumer theory and game theory. Examples include behaviour of firms in the music industry (Burke, 1996; Ko & Lau, 2016; Sweeting, 2013), explaining large scale music success (Elliott & Simmons, 2011; Hendricks & Sorensen, 2009; Fox & Kochanowski, 2007; Strobl & Tucker, 2000), copyright and music

75 B.1 Introduction
piracy (see Oberholzer-Gee & Strumpf, 2009; Varian, 2005, for reviews), and the economics of live music events (Decrop & Derbaix, 2014; Hiller, 2016; Holt, 2010; Krueger, 2005; Larsen & Hussels, 2011).
In recent decades, there has been a burst of interest in the field of behavioural economics (see Angner and Loewenstein, 2012; Dhami, 2016; Thaler, 2016, for overviews). In particular, some researchers have begun to utilise tools from behavioural economics to study music- related decision making. Behavioural economics, a subdiscipline of standard economics, aims to increase its explanatory power by relaxing the rationality assumptions of homo eco- nomicus, incorporating insights from an array of disciplines, such as psychology, sociology, anthropology, biology, and neuroscience. Such an interdisciplinary approach seems ideal to study the multi-faceted nature of music, adding value to the existing body of research in both music psychology and economics.
Researchers from both economics and psychology stand to gain from utilising the behavioural economics toolkit. Economists studying music are able to pursue a more evidence-based approach in which individuals may not always be fully rational, self-interested utility max- imisers. For example, consider how a music listener makes a choice about which song to play next on their playlist. Such an individual may use mental shortcuts or heuristics to come to a decision quickly rather than spend hours carefully considering all the alternatives. Likewise, instead of setting a fixed price for their music, a music artist may instead ask for voluntary donations from their fans as a ‘fairer’ way to distribute their music. For music psychologists, since behavioural economics still maintains its economic identity, they have access to a body of behavioural economic theory, mathematically rigorous, underpinned by economic principles (see Dhami, 2016). Incorporating such theory may prove significant for addressing key issues in music research that have eluded researchers so far. For instance, as Greasly and Lamont (2016) remark, despite the wide range of psychological approaches that have been used to investigate music preferences, there is currently no unified theory that can accurately predict such preferences. Above all, we stress the synergistic benefits that music researchers can obtain by utilising behavioural economics.
This paper contributes to the literature in two main ways. Our first contribution is to provide an up-to-date account of studies using behavioural economics for research on music-related decision making. Using a robust search strategy that is representative of the behavioural economics literature, we find 33 studies identified within four distinct research areas of behavioural economics – heuristics and biases, social decision-making behavioural time preferences, and dual-process theory. We organise our discussion around these areas, enabling the reader to gain a better understanding of where these studies fit in the broader context of

76 B.2 Methods
the behavioural economics literature. Our second contribution is to demonstrate the potential of our proposed BEM research program by providing guidance for future work. Our focus is on issues important to music researchers from psychology and economics where we see clear benefit from using behavioural economics. We note that research in music-related decision making is still relatively young, with no specific research field dedicated to this area exclusively. Thus, we see our work as the first steps in creating this.
The remainder of this paper is organised as follows. Section 2 outlines the methods for conducting the systematic literature review. Section 3 provides an overview of the results from the systematic search. Section 4 discusses the retrieved literature in more detail. Section 5 discusses future directions within the BEM research program. Section 6 concludes.
B.2 Methods
This section outlines the methods employed for the systematic literature review. In section B.2.1, we present our procedure for selecting the behavioural economics keywords to be used in the systematic search. In section B.2.2, we give details of each stage of the systematic review.
B.2.1 Behavioural economics keywords
An important requirement of the systematic literature review was to select a list of keywords that is representative of behavioural economics. This procedure consisted of three steps, summarised in Figure B.1: (i) extraction of keywords that appeared in titles, headings, and sub-headings of prominent textbooks in behavioural economics and decision-making published within the last 10 years, resulting in 585 keywords across all books (Angner, 2012; Ball & Thompson, 2017; Cartwright, 2011; Dawes & Hastie, 2010; Dhami, 2016; Holyoak & Morrison, 2012; Ogaski & Tanaka, 2017; Wilkinson & Klaes, 2017); (ii) assessing keyword eligibility by selecting only those keywords that were duplicated in at least two of the textbooks, leaving 69 keywords; (iii) creating a comprehensive list by including alternative spellings (e.g., behaviour vs. behaviour) and synonyms (e.g., mental accounting vs. psychological accounting), adding 46 extra keywords. Thus, the final list comprised a total of 115 keywords. Three behavioural economists at the faculty level independently evaluated the procedure using a 10-point scale (1 = not at all; 10 = very much) in terms of objectivity (M = 7.7; SD = 1.7), adequacy (M = 8.0; SD = 0), and exhaustiveness (M = 7.5; SD = 0.5), providing reassurance that overall our keyword strategy is effective.

77 B.2 Methods
Figure B.1 Behavioural economics keywords selection.
K = number of keywords at each step in the selection procedure.
B.2.2 Systematic literature review
Here we describe the methods undertaken for the systematic literature review to identify published studies that have utilised behavioural economics to study music-related decision making. Following an established protocol, we applied the methodology outlined by the Preferred Reporting Items for Systematic Reviews and Meta-analyses (PRISMA) (Moher, Liberati, Tetzlaff, & Altman, 2009). The systematic review consisted of four stages: (i) identification of studies through a database search, (ii) an initial systematic screening based on titles and abstracts only, (iii) a second systematic screening based on full-text, and (iv) coding of the final set of included studies. Figure B.2 summarises the outcome of each stage using a PRISMA flow diagram.
In the identification stage, a database search was conducted using the following syntax: the list of 115 behavioural economics keywords connected with the keyword "music" (including the same word with different endings; i.e., musical, musicians, musicality, musicianship). The database search was undertaken on the 6th of June 2018 using Scopus, Web of Science, PsycINFO, Academic Search Complete, Business Source Complete, and the 10 first pages of Google Scholar. The search parameters were the same in all databases: to identify papers that used at least one of the behavioural economics keywords and the keyword “music” in the title, abstract, or authors’ keywords; and to search only in peer-reviewed journals published in English (excluding book chapters, book reviews, conference papers, and editorial notes). A total of 338 studies were identified in this stage, which after duplicate studies were removed, resulted in 202 studies ready for screening.
In both systematic screenings, we used the following inclusion criteria to determine whether a study was included: (i) the study is written in English and published in a peer-reviewed journal, (ii) the study examines judgements and decision making related to music, and (iii)

78 B.2 Methods
the study uses behavioural economics to study music-related decision making. In the first systematic screening, two reviewers, a music psychologist (MA) and a behavioural economist (NM), independently screened each study based only on the abstract. A third reviewer (JS) screened those cases in which there were conflicts. This resulted in 119 studies proceeding to the second screening stage. In the second systematic screening, two reviewers (MAT and JS) independently assessed the studies based on full-text, with a third reviewer (NM) resolving those cases with conflicts. The final number of studies included for the systematic review was 35.
The final set of studies were independently coded by two reviewers (MAT and JS) along the following attributes: research area within behavioural economics, research area within music, academic discipline, and methods used (i.e., experimental, field-data, survey, theoretical). A third researcher (NM) resolved any conflicts in the coding.
Figure B.2 PRISMA flow diagram.

B.3 Overview of results 79 B.3 Overview of results
From the systematic literature review we found 33 studies that utilised behavioural eco- nomics to study music-related decision making. In particular, we identify four areas within behavioural economics that these studies can be categorised (henceforth known as BEM areas): heuristics and biases (n = 16), social decision-making (n = 9), behavioural time preferences (n = 4), and dual-process theory (n = 4). We organise the discussion of these studies around these BEM areas (see next section).
Within music, the most prominent areas are music preferences (n = 9) and music consumption (n = 9), followed by music performance (n = 5), piracy (n = 4), music memory (n = 3), music perception (n = 1), music in advertising (n = 1), and music in health (n = 1). The sample of studies is multi-disciplinary, with the majority from psychology (including music psychology) (n = 15), economics (n = 10), neuroscience (n = 5), business (n = 2), and health (n = 1). The majority of studies are empirical (n = 28) with the most of these being experimental (n = 22) and the rest survey, field-data, theoretical and mixed methods. Publication dates indicate that this literature is relatively recent (i.e., 27 out of the 33 studies were published in the last 10 years).
B.4 BEM Discussion
In this section we provide a discussion of the studies identified in the systematic review, giving particular focus to their contribution from behavioural economics. We organise this literature around the BEM areas outlined in the previous section.
B.4.1 Heuristics and biases
When making musical judgments and decisions, people are limited by their mental capacity, available information, and time. For example, composers are influenced by their current emo- tional state and memory when creating a new piece of music, whereas music performances are bounded to the musicians’ cognitive and body capacity. Similarly, music preferences and choices are influenced by the information available to the listener, such as the popularity of the music or the prestige of the artist. This human condition is known as bounded rationality (Simon, 1955, 1982) and affects decision making in any domain. Extensive evidence in behavioural economics shows that to make efficient judgments and decisions under bounded rationality, people rely on cognitive biases and heuristics. Heuristics are mental shortcuts used by individuals to simplify complex decisions into easier to calculate operations (Tversky

80 B.4 BEM Discussion
& Kahneman, 1971, 1974), allowing people to make decisions quickly, in terms of computa- tion time, and efficiently, in the use of information. Heuristics represent a departure from the predictions of neoclassical economics, which assume that individuals are fully rational utility maximisers who have limitless cognitive abilities and follow the laws of probability and statistics. Instead, research has shown that individuals use information selectively, which may lead to individuals systematically making sub-optimal decisions, known as cognitive biases (see Dhami, 2016; Hastie & Dawes, 2010, for reviews). From the 33 studies identified in the systematic review, 15 apply heuristics and biases to music related decisions, making this the most prominent BEM area in our review. We organise the discussion of these studies into the following sub-sections – judgement heuristics, processing fluency and framing effects.
Judgement heuristics
This section focuses on studies from the review that investigated the use of judgement heuris- tics when making music-related decisions. Specifically, we discuss the following heuristics – the availability heuristic, the peak-end rule, the affect heuristic, and the representativeness heuristic.
A number of the studies provide evidence that people apply heuristics when making musical judgements recalled from memory, such as the availability heuristic and the peak-end rule. The availability heuristic describes the tendency for individuals to judge the likelihood of an event by the ease with which similar events can be brought to the mind (Tversky & Kahneman, 1974). Vuvan, Podolak & Schmuckler (2014) examined whether the availability heuristic can explain tonal expectancies in music memory. Participants were presented with melodies followed by a test tone and subsequently asked to indicate whether the test tone was present in the melody or not. The test tones were manipulated so they could either be highly expected to be contained in the melody (the tone was related to the tonality or scale of the melody), moderately expected or unexpected. The results indicated that participants tended to falsely recall that the test tone was in the melody more frequently when it was highly expected to be in the melody, consistent with the idea that such tones are more easily ‘available’ to the mind.
Rozin, Rozin & Goldberg (2004) investigated how listeners make affective judgements about past music experiences. Participants listened to selections of music while providing moment-to-moment emotional intensity ratings. The authors found that in line with the peak-end rule (Fredrickson & Kahneman, 1993), participants judged the emotional intensity of the music on how they felt at its the most intense point (the peak) and at its end, rather than the total sum or average of every moment of the experience. Schäfer, Zimmermann &
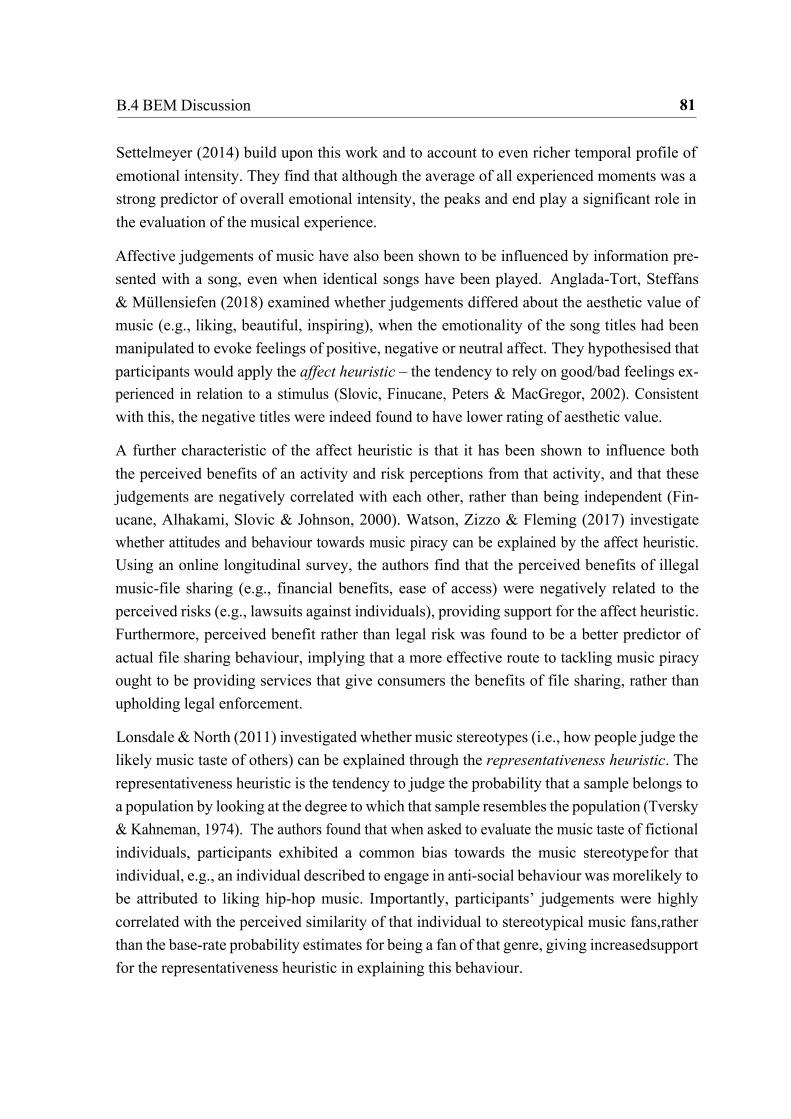
81 B.4 BEM Discussion
Settelmeyer (2014) build upon this work and to account to even richer temporal profile of emotional intensity. They find that although the average of all experienced moments was a strong predictor of overall emotional intensity, the peaks and end play a significant role in the evaluation of the musical experience.
Affective judgements of music have also been shown to be influenced by information pre- sented with a song, even when identical songs have been played. Anglada-Tort, Steffans & Müllensiefen (2018) examined whether judgements differed about the aesthetic value of music (e.g., liking, beautiful, inspiring), when the emotionality of the song titles had been manipulated to evoke feelings of positive, negative or neutral affect. They hypothesised that participants would apply the affect heuristic – the tendency to rely on good/bad feelings ex- perienced in relation to a stimulus (Slovic, Finucane, Peters & MacGregor, 2002). Consistent with this, the negative titles were indeed found to have lower rating of aesthetic value.
A further characteristic of the affect heuristic is that it has been shown to influence both the perceived benefits of an activity and risk perceptions from that activity, and that these judgements are negatively correlated with each other, rather than being independent (Fin- ucane, Alhakami, Slovic & Johnson, 2000). Watson, Zizzo & Fleming (2017) investigate whether attitudes and behaviour towards music piracy can be explained by the affect heuristic. Using an online longitudinal survey, the authors find that the perceived benefits of illegal music-file sharing (e.g., financial benefits, ease of access) were negatively related to the perceived risks (e.g., lawsuits against individuals), providing support for the affect heuristic. Furthermore, perceived benefit rather than legal risk was found to be a better predictor of actual file sharing behaviour, implying that a more effective route to tackling music piracy ought to be providing services that give consumers the benefits of file sharing, rather than upholding legal enforcement.
Lonsdale & North (2011) investigated whether music stereotypes (i.e., how people judge the likely music taste of others) can be explained through the representativeness heuristic. The representativeness heuristic is the tendency to judge the probability that a sample belongs to a population by looking at the degree to which that sample resembles the population (Tversky & Kahneman, 1974). The authors found that when asked to evaluate the music taste of fictional individuals, participants exhibited a common bias towards the music stereotype for that individual, e.g., an individual described to engage in anti-social behaviour was more likely to be attributed to liking hip-hop music. Importantly, participants’ judgements were highly correlated with the perceived similarity of that individual to stereotypical music fans, rather than the base-rate probability estimates for being a fan of that genre, giving increased support for the representativeness heuristic in explaining this behaviour.

82 B.4 BEM Discussion
Processing fluency
Processing fluency refers to the subjective experience of ease with which people process information. A key observation is that more fluent stimuli are often perceived as being familiar and aesthetically pleasing compared to less-fluent stimuli (see Reber, Schwarz, & Winkielman, 2004, for a review). In particular, factors thought to increase fluency such as repeated exposure to a stimulus (Zajonc, 1968) and the amount of information represented in a stimulus (Checkosky & Whitlock, 1973) can lead to more favourable evaluations. In this section, we discuss studies identified in the systematic review that examined processing fluency related to music.
Witvliet and Vrana (2007) investigated how repeated playing of music stimuli that varied by emotional valence influenced participant liking of the music. The results indicated a polarised response – repeated exposure to positive music led to increased liking for that music, whilst repetition of the negative music led to increased disliking for that music. The authors also measured physiological responses and find that certain facial muscles decreased in reactivity after repeated exposure, providing evidence of increased ease of processing. Anglada-Tort and Müllensiefen (2017) examined fluency effects through the repeated recording illusion – the phenomenon which listeners perceive music stimuli to be different, whilst in fact they are identical. The results also indicated a differential response with participants’ preferences for music increasing with repeated listening only for familiar pop music and not for a relatively unknown classical piece. The results from both studies suggest that whilst repeated exposure appears to influence music preferences, factors associated with the listener experience such as emotional connection and familiarity with the music seems important to uncover more nuanced patterns in this relationship.
A series of studies have used properties of music stimuli as a way of investigating processing fluency, such as altering the linguistic properties of music (linguistic fluency). Nunes, Ordanini & Valsesia (2015) manipulated the amount of repetition in the lyrics of identical songs in the lab and found that this was related to increased perceived familiarity. The authors then examined the effect of song repetitiveness on a song’s popularity in the marketplace using field data from the US singles chart. The results indicated that more repetitive songs were more likely to be a number one hit as well as being faster climbers to the top of the chart. Anglada-Tort et al. (2018) found that when manipulating the linguistic fluency of artist names and song titles in a foreign language, identical music excerpts presented with easy-to-pronounce names were preferred in terms of subjective value and aesthetic quality, compared to excerpts presented with difficult-to-pronounce names. These results even held

83 B.4 BEM Discussion
for participants with high levels of music training, indicating that susceptibility to the effects of processing fluency is not offset by increased knowledge of music.
Seror III and Neil (2003) examined whether a single target note could be detected within a harmonic interval of several notes played simultaneously, for which the interval was either consonant or dissonant. Consonant intervals (e.g., a perfect fifth) are associated with feeling of pleasantness and agreeableness, whilst dissonant intervals (e.g., a tritone) with unpleasantness and harshness. The authors hypothesised that since consonant intervals are more likely to be fluent than dissonant intervals, the ability to identify the target note should be easier. The results confirmed this hypothesis, showing faster and more accurate pitch discrimination in consonant intervals.
Krishnan, Kellaris & Aurand (2012) examined the role of processing fluency in auditory branding, a branch of branding that uses short periods of music or audio logos to convey core brand values and prime brand recognition. The authors investigated how the number of tones (3, 6, 9 tones) in an audio logo affects participants’ willingness-to-pay (WTP) for the brand’s associated product. They found that WTP varied with the number of tones and importantly, that this variation was mediated by participants evaluations of fluency.
Finally, Huron (2013) provides a proposal of strategies that musicians can take in order to maximise the overall hedonic effect of their performances. Specifically, the author applies the findings that increased fluency through repeated exposure is likely to lead to favourable evaluations amongst listeners; as well as the counter-effect of habituation – that successive repetitions may become less novel to listeners and therefore lead to unresponsiveness. Three main strategies are outlined (i) the trance strategy, which involves high levels of repetition to induce positive feelings from increased fluency; (ii) the variation strategy, which allows for fluency through repetition but with slight modifications to curb habituation; and (iii) the rondo strategy, which involves reduced repetition and relies on the introduction of new music material. Such an approach provides an insight into how processing fluency can be applied by music performers.
Framing and loss aversion
Framing represents the systematic change in an individual’s decision when presented with a choice in informationally equivalent ways (Tversky & Kahneman, 1981; see Kühberger, 1998, for a meta-analysis). When framing either highlights the positive or negative aspects of the same decision, humans exhibit loss aversion. Research on loss aversion consistently shows that humans prefer avoiding losses to acquire equivalent gains (Kahneman & Tversky,
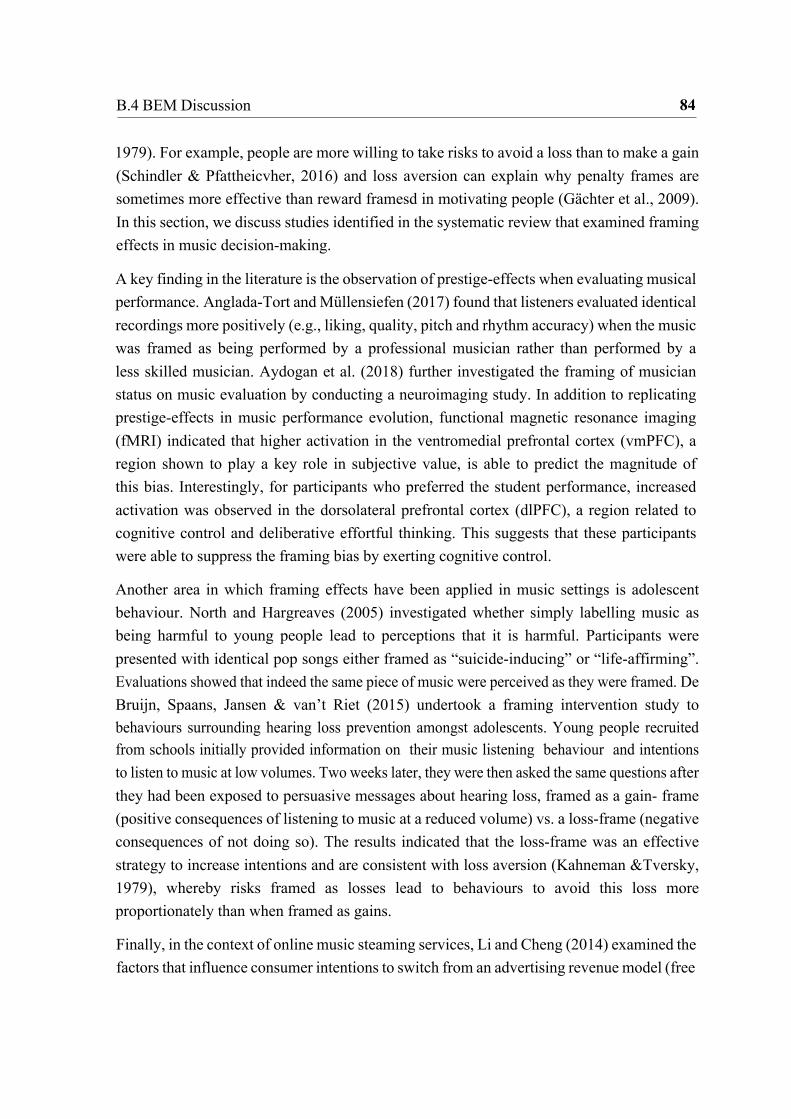
84 B.4 BEM Discussion
1979). For example, people are more willing to take risks to avoid a loss than to make a gain (Schindler & Pfattheicvher, 2016) and loss aversion can explain why penalty frames are sometimes more effective than reward framesd in motivating people (Gächter et al., 2009). In this section, we discuss studies identified in the systematic review that examined framing effects in music decision-making.
A key finding in the literature is the observation of prestige-effects when evaluating musical performance. Anglada-Tort and Müllensiefen (2017) found that listeners evaluated identical recordings more positively (e.g., liking, quality, pitch and rhythm accuracy) when the music was framed as being performed by a professional musician rather than performed by a less skilled musician. Aydogan et al. (2018) further investigated the framing of musician status on music evaluation by conducting a neuroimaging study. In addition to replicating prestige-effects in music performance evolution, functional magnetic resonance imaging (fMRI) indicated that higher activation in the ventromedial prefrontal cortex (vmPFC), a region shown to play a key role in subjective value, is able to predict the magnitude of this bias. Interestingly, for participants who preferred the student performance, increased activation was observed in the dorsolateral prefrontal cortex (dlPFC), a region related to cognitive control and deliberative effortful thinking. This suggests that these participants were able to suppress the framing bias by exerting cognitive control.
Another area in which framing effects have been applied in music settings is adolescent behaviour. North and Hargreaves (2005) investigated whether simply labelling music as being harmful to young people lead to perceptions that it is harmful. Participants were presented with identical pop songs either framed as “suicide-inducing” or “life-affirming”. Evaluations showed that indeed the same piece of music were perceived as they were framed. De Bruijn, Spaans, Jansen & van’t Riet (2015) undertook a framing intervention study to behaviours surrounding hearing loss prevention amongst adolescents. Young people recruited from schools initially provided information on their music listening behaviour and intentions to listen to music at low volumes. Two weeks later, they were then asked the same questions after they had been exposed to persuasive messages about hearing loss, framed as a gain- frame (positive consequences of listening to music at a reduced volume) vs. a loss-frame (negative consequences of not doing so). The results indicated that the loss-frame was an effective strategy to increase intentions and are consistent with loss aversion (Kahneman & Tversky, 1979), whereby risks framed as losses lead to behaviours to avoid this loss more proportionately than when framed as gains.
Finally, in the context of online music steaming services, Li and Cheng (2014) examined the factors that influence consumer intentions to switch from an advertising revenue model (free

85 B.4 BEM Discussion
content but subject to advertising) to a pay-for-content model (higher quality content with no advertising but consumers pay a subscription). Drawing upon status quo bias theory i.e., the tendency to stay with the current option (Samuelson & Zeckhauser, 1988), the authors identify loss aversion as a channel that affects switching intentions. Specifically, consumers were concerned about the perceived sacrifices of leaving the current plan including the monetary cost, the time and effort to switch and the risk that the new plan would not be enjoyable.
Summary
The studies identified in this section suggest that when making judgements and decisions, listeners are limited by their mental capacity (e.g., memory and emotion), time, and in- formation available (e.g., song titles or descriptions about the performer). Consequently, listeners rely on cognitive biases and heuristics that do not depend on the music stimuli themselves. In particular, we identified four judgmental heuristics that readily apply to music decision-making, allowing people to simplify complex decisions into easier-to-calculate operations - i.e., the availability heuristic, peak-end-rule, the representativeness heuristic, and the affect heuristic. Moreover, we found that fluency manipulations in music, such as repetition and consonance, can influence music perception and, in turn, affect preferential judgments. Overall, all studies supported the fluency hypothesis, showing higher preferences for easier-to-process music compared to less-fluent stimuli. Finally, in line with framing, several studies found that contextual information often presented with music (e.g. song titles, labels, or the social status of the artist) has a significant impact on how listeners respond to it and develop music preferences. Framing interventions can also be successfully applied to prevent hearing loss amongst adolescents.
B.4.2 Social decision making
In 2007, the critically acclaimed band Radiohead surprised the music industry by offering their new album “In Rainbows” as a digital download using a pay-what-you-want (PWYW) agreement. Essentially, this meant that fans could pay as much as they liked for the album, including a zero option. Although at odds with neoclassical economic theory, in which consumers would download the album for free, fans actually made voluntary payments for the album. One possible explanation for such generous payments under PWYW is that individuals exhibit social preferences, i.e., they care about the preferences of others (see Fehr & Schmidt, 2006 for a review). Another possibility is that individuals’ decisions are highly influenced by the choices of their peers, also known as peer effects (Banerjee, 1992;

86 B.4 BEM Discussion
Bikhchandani, Hirschleifer & Welch, 1992). The example above suggets that music decision- making does not happen in a vacuum, but it is influenced by the social world around us. In this section, we discuss studies identified in the review that fall within the broader umbrella of social decision making, including social preferences and peer effects.
Social preferences
We found a number of studies that examined the possible motivations behind consumer behaviour under PWYW. Regner and Barria (2009) investigated whether voluntary payments could be observed using field data for customers from an independent record label. Customers were able to set the price they wanted to pay for an album within the range of 5−18, with the label giving a recommendation of $8. The data indicated that around 85% of customers chose to make payments that exceeded the minimum required payment, with the average payment above the recommendation. The authors conjectured that since the label offers an extensive try-before-you-buy service, reciprocity may be driving the generous payments. More formally, they set up a behavioural game theory model to show how concerns for reciprocity can switch behaviour from a selfish outcome, which customers simply offer the minimum, to the more generous outcome, as observed in the data. In a follow up study, Regner (2015) tested this theoretical prediction by testing the relationship between an individual’s payments and survey data examining their motivations behind their decision. The results indicated that reciprocity was indeed a driver for these payments.
In a controlled experiment, Waskow et al. (2016) compared WTP payments for albums under PWYW vs. a traditional fixed-price. Although as expected, average WTP was lower in the PWYW condition, these payments were significantly greater than zero. In addition, the authors investigated whether these behavioural differences could be explained at the neural level. Neuroimaging data revealed significant differences between the two conditions with WTP only being related to neural activity in the fixed-price condition. Specifically, correlations were found in the frontal brain regions - orbitofrontal cortex (OFC), medial prefrontal cortex (mPFC), anterior cingulate cortex (ACC), areas linked to reward processing. No such relationships were found in the PWYW condition suggesting a different mechanism at the neural level.
Harbi, Grolleau & Bekir (2014) examined the feasibility of a PWYW pricing strategy from the point of the view of the artist. The authors propose a theoretical microeconomic model to compare profitability under PWYW vs. a fixed-price scenario with/without piracy. Importantly in the model, consumers gain procedural utility from buying music i.e., they care not only about their satisfaction from consuming music but also the conditions in which the

87 B.4 BEM Discussion
music is made, including the welfare of the artist. As a result, PWYW can be profitable for the artist as it reduces piracy, promoting positive voluntary payments as well as increasing the demand and prices for live performance through increased network size. A PWYW strategy can also increase an artist’s profit share relative to the record label and may be useful as bargaining tool when negotiating contracts.
Hashim, Kannan, Maximiano & Ulmer (2014) investigated piracy behaviour in a public goods experiment framed in the context of music consumption. In this game, adolescent participants decided whether to buy songs or to download them for free. If participants are purely self-interested, then the game-theoretic prediction is maximum piracy, whereas if they exhibit social preferences and care about the record label, this would lead to the purchase of songs. In particular, the authors examined the effectiveness of different sources of advice to reduce piracy, with the strength of the relationship between the participant and the source of advice (i.e., the social tie) being manipulated. The results showed that advice from parents, who had the highest social ties with the participants, was the most effective in leading participants to pay for music.
Finally, Sonnabend (2016) looked at pricing decisions of music artists in the live music industry. In a theoretical model, fans are concerned about the fairness of prices of live gigs, such that if prices are above a reference price, they do not buy tickets. The model shows that such concerns can be enough for the artist to keep prices rigid, even at times when there is higher demand, for example on the weekends. Higher prices due to increased costs borne by the artist are perceived as fair and are therefore tolerated.
Peer Effects
Berlin, Bernard & Fürst (2015) examined the effect of music ratings evaluated by peers on teenage consumption choices of songs by bestsellers vs. new artists. The results indicated that participants tended to imitate their peers with more listening time devoted to bestsellers rather than new artists, thereby strengthening the superstar effect, in which relatively small numbers of music artists dominate the industry.
Berns, Capra, Moore & Noussair (2010) found that information about song popularity through website downloads led participants to change likability ratings of songs in the direction of the popularity. In order to distinguish between competing mechanisms for how this information affected music consumption, the authors analysed neuroimaging data for the participants. The fMRI data supported the hypothesis that participants were motivated to change their rating due to a desire for conformity rather than a change in the intrinsic value of the music.

88 B.4 BEM Discussion
Specifically, correlations between the tendency to change rating and neural activity were found in the bilateral anterior insula and ACC, regions associated with negative feeling states, suggesting that for these participants, the mismatch between their ratings and others’ ratings may have led to cognitive/emotional dissonance that had to be resolved. In a follow up study, Berns and Moore (2012) found that the same neuroimaging data were able to predict future sales of these songs, with activity within the ventral striatum (associated with reward) being correlated with future commercial success. We therefore see that in addition to the effect of social information driving changes in music consumption at the individual level, the brain responses of individuals are able to predict future commercial success at the population level, insights that could be useful for neuromarketing and hit song science.
Summary
The studies outlined above suggest that music decision-making does not happen in a social vacuum, but instead is largely influenced by social preferences and information. We found evidence showing that PWYW is a viable strategy to sell music, offering several advantages compared to traditional fixed-price strategies. Social preferences, such as reciprocity and guilt, are important to understand consumers’ motivation to engage in different revenue models for music consumption, including the success of PWYW. In addition, social preferences can help better understand pricing strategies in the concert industry. Another important aspect of social decision-making is social influence, such as peer effects. Several studies suggest that peer effects can play a determinant role in music preferences and choices, which in turn can influence the music market and determine outcomes such as the next successful artist or hit song. We also found that interventions based on social information can be successfully applied to reduce music piracy amongst adolescents.
B.4.3 Behavioural Time Preferences
Many decisions in music have a time dimension. For example, individuals have to consider their future selves and preferences when buying music online, creating a playlist for a holiday trip, or deciding to take music lessons. A significant amount of research in behavioural economics has been devoted to decisions that have a time dimension (see Dhami, 2016, for s review). A central aspect of this research is that individuals exhibit present-biased time preferences, i.e., they have a strong preference for immediate gratification (O’ Donoghue & Rabin, 1999). This desire can be so strong that it can lead the individual to alter a previously made decision at a later point in time. In such cases, the standard exponential discounted utility model is insufficient to capture these patterns of time inconsistency, and instead a
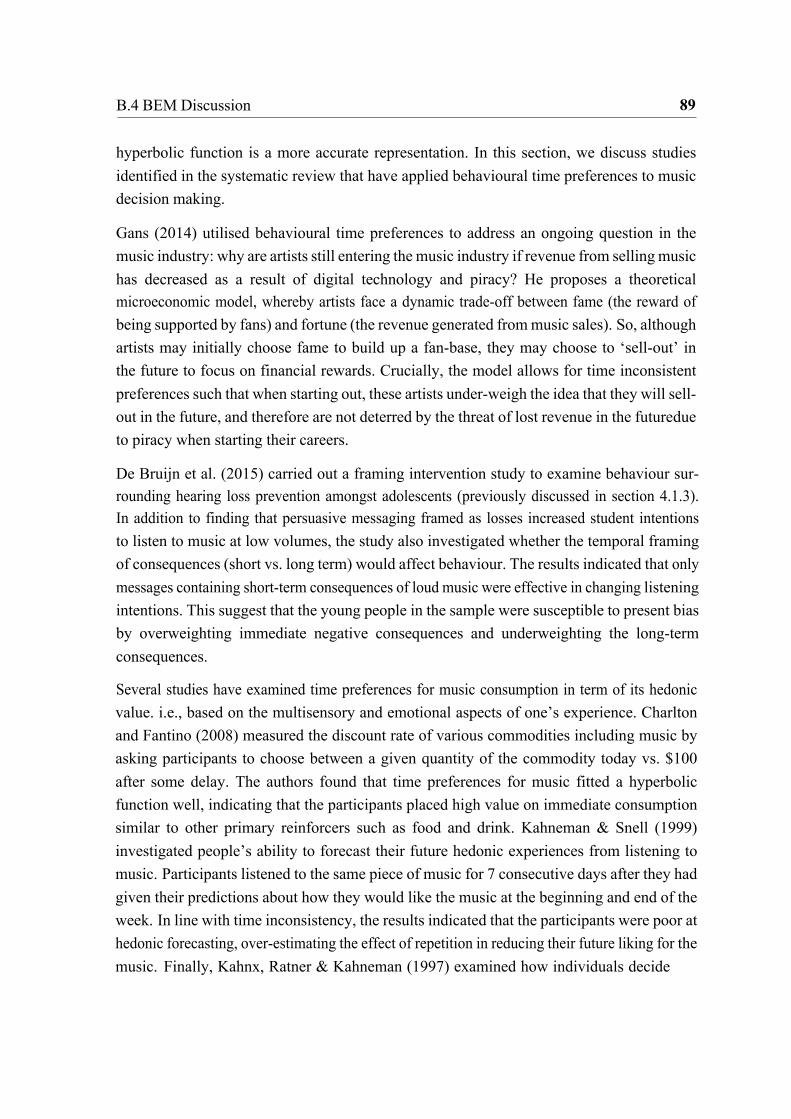
89 B.4 BEM Discussion
hyperbolic function is a more accurate representation. In this section, we discuss studies identified in the systematic review that have applied behavioural time preferences to music decision making.
Gans (2014) utilised behavioural time preferences to address an ongoing question in the music industry: why are artists still entering the music industry if revenue from selling music has decreased as a result of digital technology and piracy? He proposes a theoretical microeconomic model, whereby artists face a dynamic trade-off between fame (the reward of being supported by fans) and fortune (the revenue generated from music sales). So, although artists may initially choose fame to build up a fan-base, they may choose to ‘sell-out’ in the future to focus on financial rewards. Crucially, the model allows for time inconsistent preferences such that when starting out, these artists under-weigh the idea that they will sell-out in the future, and therefore are not deterred by the threat of lost revenue in the future due to piracy when starting their careers.
De Bruijn et al. (2015) carried out a framing intervention study to examine behaviour sur- rounding hearing loss prevention amongst adolescents (previously discussed in section 4.1.3). In addition to finding that persuasive messaging framed as losses increased student intentions to listen to music at low volumes, the study also investigated whether the temporal framing of consequences (short vs. long term) would affect behaviour. The results indicated that only messages containing short-term consequences of loud music were effective in changing listening intentions. This suggest that the young people in the sample were susceptible to present bias by overweighting immediate negative consequences and underweighting the long-term consequences.
Several studies have examined time preferences for music consumption in term of its hedonic value. i.e., based on the multisensory and emotional aspects of one’s experience. Charlton and Fantino (2008) measured the discount rate of various commodities including music by asking participants to choose between a given quantity of the commodity today vs. $100 after some delay. The authors found that time preferences for music fitted a hyperbolic function well, indicating that the participants placed high value on immediate consumption similar to other primary reinforcers such as food and drink. Kahneman & Snell (1999) investigated people’s ability to forecast their future hedonic experiences from listening to music. Participants listened to the same piece of music for 7 consecutive days after they had given their predictions about how they would like the music at the beginning and end of the week. In line with time inconsistency, the results indicated that the participants were poor at hedonic forecasting, over-estimating the effect of repetition in reducing their future liking for the music. Finally, Kahnx, Ratner & Kahneman (1997) examined how individuals decide

90 B.4 BEM Discussion
which songs to play over a given period of time, such as when creating a playlist. When making repeated choices between a liked song and less-preferred songs, the findings showed that listeners do not always choose a song that maximised their enjoyment but instead opted for less-preferred music in order to seek variety.
Summary
Overall, these studies show that behavioural time preferences can give a deeper insight into how music is valued and consumed over time. We found evidence that time preferences when consuming music follow a hyperbolic function and, therefore, consumers disproportionally prioritise immediate benefits over future gains. This has implications for how consumers demand music, particularly with the emergence of music streaming platforms providing music instantaneously. Another important concept is time inconsistency, which was successfully applied to model how artists’ decisions may shape the music market. Finally, we gained valuable insights from studies focusing on time preferences for music consumption in terms of its hedonic value. In particular, listeners’ ability to predict pleasure in their future music consumption is rather low and when choosing music repeatedly over time, listeners do not always choose music that maximizes their pleasure but instead seek variety, choosing to listen to music that is less preferred.
B.4.4 Dual process theory
Dual process theories posit that there are two different modes of processing – an emotional system and a cognitive system. The emotional system (system 1) is seen as fast, automatic and unconscious, whilst the cognitive system (system 2) is seen as slow, deliberative and conscious (see Evans, 2008; Frankish & Evans, 2009, for reviews). Within music, exploring the interaction between emotional and cognitive processes could prove particularly insightful when analysing musical performance, e.g., the extent to which performers rely on conscious vs. unconscious decisions and the factors that can affect this. In this section, we review studies identified that have examined dual process theories with regard to musical performance.
Bangert, Fabian, Shubert and Yeadon (2014) undertook a case study in which performance data and retrospective accounts were taken from an expert cellist performing a piece of familiar music, with the goal of understanding which music decisions were intuitive and which were deliberate. The results indicated that out of the 134 music decisions made, 65% were categorised as deliberate. In a second study, Bangert, Schubert, and Fabian (2015) applied the same method using a small sample of professional violinists, but with an unfamiliar piece of music. This time, 82% of music decisions were categorised as intuitive.
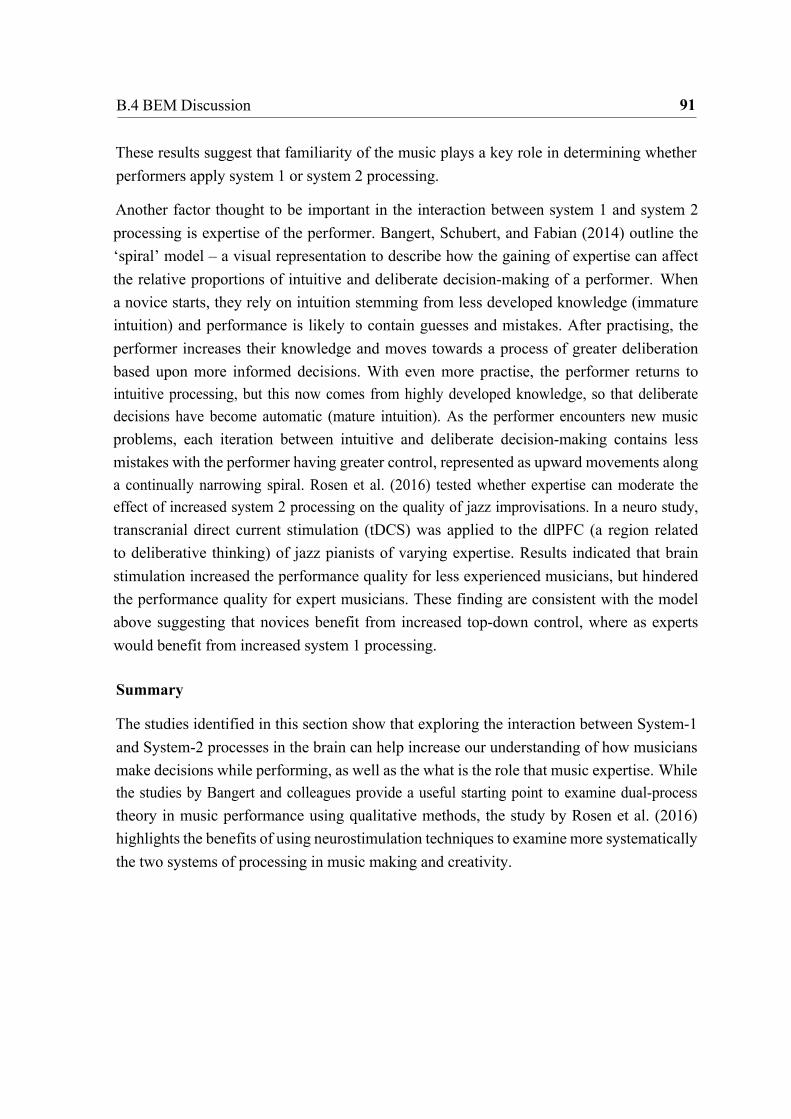
91 B.4 BEM Discussion
These results suggest that familiarity of the music plays a key role in determining whether performers apply system 1 or system 2 processing.
Another factor thought to be important in the interaction between system 1 and system 2 processing is expertise of the performer. Bangert, Schubert, and Fabian (2014) outline the ‘spiral’ model – a visual representation to describe how the gaining of expertise can affect the relative proportions of intuitive and deliberate decision-making of a performer. When a novice starts, they rely on intuition stemming from less developed knowledge (immature intuition) and performance is likely to contain guesses and mistakes. After practising, the performer increases their knowledge and moves towards a process of greater deliberation based upon more informed decisions. With even more practise, the performer returns to intuitive processing, but this now comes from highly developed knowledge, so that deliberate decisions have become automatic (mature intuition). As the performer encounters new music problems, each iteration between intuitive and deliberate decision-making contains less mistakes with the performer having greater control, represented as upward movements along a continually narrowing spiral. Rosen et al. (2016) tested whether expertise can moderate the effect of increased system 2 processing on the quality of jazz improvisations. In a neuro study, transcranial direct current stimulation (tDCS) was applied to the dlPFC (a region related to deliberative thinking) of jazz pianists of varying expertise. Results indicated that brain stimulation increased the performance quality for less experienced musicians, but hindered the performance quality for expert musicians. These finding are consistent with the model above suggesting that novices benefit from increased top-down control, where as experts would benefit from increased system 1 processing.
Summary
The studies identified in this section show that exploring the interaction between System-1 and System-2 processes in the brain can help increase our understanding of how musicians make decisions while performing, as well as the what is the role that music expertise. While the studies by Bangert and colleagues provide a useful starting point to examine dual-process theory in music performance using qualitative methods, the study by Rosen et al. (2016) highlights the benefits of using neurostimulation techniques to examine more systematically the two systems of processing in music making and creativity.

92 B.5 Future Directions
B.5 Future directions
Having demonstrated the value of behavioural economics to music-decision research using the current literature, we now turn to our second objective of exploring how behavioural economics can inform future research. Again, to guide our discussion we use the BEM areas categorised from the systematic review. In the final part of this section, we introduce the BEM research programme and show how it can be applied practically in the context of a real-world music issue.
Heuristics in Music Performance
The area of heuristics and biases was found to be the most prevalent research topic within the review, focusing almost exclusively on issues related to music preferences and consumption. Surprisingly, however, we found no studies that applied heuristics to music composition and improvisation choices. Given the highly demanding nature of music improvisation, including both cognitive and bodily limitations (Ashley, 2016), it seems likely that musicians rely on fast and frugal heuristics to simplify complex decisions while improvising. A recent study by Beaty et al. (2020) provides some initial evidence for this, demonstrating that eminent jazz musicians tend to start their solo improvisations with music sequences that are melodically simpler before creating more complex sequences, the so-called ‘easy-first’ bias. We hypothesise that musicians may be relying on other heuristics in their performances, some of which have not yet been studied in the music domain at all. One such candidate is the anchoring heuristic (Tversky & Kahneman, 1974), whereby musicians during a performance rely on initial musical choices (the anchor) to inform future decisions. At this point, we note the link between heuristics and the two-systems view from dual process theory (Kahneman, 2011). If performers are using heuristics and applying System 1 processing to save on cognitive effort, then this may be observable at the neural level. In this regard, we encourage further use of the research methods employed in the field of improvisation neuroscience (see Beaty, 2015, for a review), in order to gain a deeper understanding of the neural processes that underpin heuristics in music composition and performance.
Cognitive Biases in Music Consumption
A potentially fruitful application of cognitive bias research is choice overload. The dramatic increase in recent years of music streaming services (e.g., Spotify, YouTube) provides lis- teners with a large assortment of songs instantly. However, listeners may not necessarily be benefiting from this vast amount of choice. In fact, much evidence indicates that providing individuals with variety can lead to negative outcomes including choice deferral, choice rever-

93 B.5 Future Directions
sal, reverting to the default option, and overall lower satisfaction (see Chernev, Böckenholt, & Goodman, 2015, for a review). Despite voluminous research on choice overload, there has been little application to music listening behaviour. One promising avenue of research is provided by Ferweda, Yang, Schedl, & Tkalcic (2019), who found that music expertise moderates the relationship between how music is organised on streaming platforms (e.g., mood, genre, activity) and preferences for choice set size. For example, when presented with music organised by mood, participants with more music expertise preferred a system with fewer choices; but when presented with music organised by genre, these participants preferred a system with more choices. We see scope to build on this work to understand more fully how individual differences influence music taxonomy choices, minimising the adverse effects of choice overload and improving the user experience from music streaming services.
Social Decision Making and Piracy
As discussed in the review, social preferences can lead individuals to make voluntary pay- ments for music, whilst peer effects can influence an individual’s consumption choices. We see benefit in combining these areas of research in order to examine ways to reduce music piracy. For example, a robust finding in laboratory experiments is that many people are “conditional co-operators”, whose pro-social behaviour is sensitive to observations of others’ behaviour (see Chaudhury, 2011, for a review). Exploring conditional cooperation in a music setting may therefore hold the key to increasing compliance associated with music payments. In addition, to further understand the dynamics of music consumption and emergence of social norms in a more naturalistic environment, we encourage the use of social network experiments (see Hawkins, Goodman, & Goldstone, 2019, for a review). Such methods could be used to model the complex cognitive processes involved in music consumption, such as learning, social coordination, and cultural transmission.
Behavioural Game Theory and Hit Song Science
We see a great amount of potential in applying behavioural game theory further to music- decision research. One area of advance is hit song science, a field aimed at predicting song success before market release. Traditionally, attempts at predicting song popularity have only considered the intrinsic properties of the music itself, but given that social factors have a substantial influence on market outcomes, this approach has been unsuccessful (see Pachet, 2012). One novel way to model social influence is to use Level-k and cognitive hierarchy models (Camerer, Ho, & Chong, 2004; Stahl & Wilson, 1994, 1995). In such models, there is a hierarchy about what players believe about the actions of other players. For example, a
94 B.5 Future Directions
well-known application for which Level-k modelling has made accurate predictions about behaviour is the beauty contest (Keynes, 1936; Nagel, 1995). Here, we consider a music adaptation, where individuals have to guess the song which corresponds to the average preference of the competition. Whilst Level-0 individuals may simply choose their favourite song, Level-1 players will choose the song that they believe the majority of Level-0 players will choose, and Level-2 players will choose a song incorporating their beliefs about Level-1 players, and so on. Understanding how individuals form beliefs in music prediction markets and how these beliefs are affected by others could give greater insight into how songs become popular, potentially increasing prediction accuracy in hit song science.
Behavioural Time Preferences in Music Education
The review indicated that present-biased preferences can lead an individual to reverse a previously made decision at a later point in time. Since time-inconsistent preferences are often detrimental to the long-term interest of the individual, a substantial amount of the literature has been focused on self-control (see Steel 2007, for a review). An area of music research where such insights could prove to be beneficial is motivation in music education. Although learning a musical instrument can be a personally satisfying and meaningful activity, it requires considerable effort in the form of regular practice. For many music students, this may be difficult due to a lack of intrinsic motivation, belief in their competence, or reaction to the learning environment (see Renwick & Reeve, 2012, for a review). Therefore, for impatient students, the short-term temptation of not practising may be more desirable than the long-term goal. Here we offer two proposals. First, we recommend that music education researchers incorporate theoretical frameworks used in behavioural economics to model time preferences, e.g., procrastination models to measure the extent to which individuals are present-biased as well as how aware they are of their self-control problems (O’Donoghue & Rabin, 1999). This could allow music researchers to gain a better understanding of how individuals vary in their music-related motivation, and to investigate whether such model parameters can be reliable trait markers of the efficacy of music learning (see Peters & Büchel, 2011, for a review). Second, to help improve motivation in music practice, we propose the application of interventions successfully applied in other domains of self-control, such as episodic future thinking and pre-commitment devices (e.g., Ariely & Wertenbroch, 2002; Koffarnus, Jarmolowicz, Mueller, & Bickel, 2014).
95 B.5 Future directions
The BEM Research Programme
From our discussion of the extant literature and explorations of future work, we have demonstrated the benefits of applying behavioural economics to music-decision research. Specifically, we have shown that by relaxing the rationality assumptions of homo economicus and drawing from interdisciplinary insights, researchers are able to follow an approach that is both empirically supported and wider in scope. Furthermore, incorporating models from behavioural economic theory, based upon principles of optimisation and underpinned by axiomatic foundations, provides an internally consistent framework to work within. Here, we propose the BEM research programme – an integrated research agenda that utilises the behavioural economics toolkit in music-decision making. We emphasise that this programme is not limited to using the BEM research areas only discussed in this review nor are they required to be applied in isolation of each other. Instead, we see the BEM as a holistic framework to study music-related behaviour. As an example, below we show how several areas of the BEM can be applied practically to address a real-world music issue.
One area of concern amongst classical music organisations is the lack of socio-economic diversity in the audience for classical music concerts, especially from young people and ethnic minorities (see Chan, Goldthorpe, Keaney, Oskala, 2008; DiMaggio & Mukhtar, 2004; Kolb, 2001). Barriers to attendance often cited include perceived lack of knowledge, feeling of not belonging to the community, and the desire for more social interaction at concerts (Dearn and Price, 2016; Dobson & Pitts, 2011; Kolb, 2000). Applying audience development strategies based on a combination of areas within behavioural economics may help to reduce these barriers. These include measures aimed to change social norms associated with classical concerts (e.g., more accessible music venues, relaxation of dress code, promotion of a social community through increased performer/audience interactions); framed advertising to actively challenge music stereotyping appealing to minority groups; and the use of social networks to encourage positive peer effects. Furthermore, whilst there has been some limited discussion about the perceived risk associated with the decision to attend concerts (Baker, 2000; Price, 2017), this area could be developed by applying theories of reference-dependent utility (Kahneman and Tversky, 1979; Koszegi & Rabin, 2006). Here, risk attitudes of attenders can be captured relative to a reference point, e.g., expectations of enjoyment, and could be particularly useful to model behaviour of new-attenders who may differ in their expectations to those who attend concerts regularly. We hope that from the examples given here, this discussion has provided valuable stimulation of ideas about the future potential of applying behavioural economics to music research.
96 B.7 References
B.6 Conclusion
Departing from historically disconnected research programmes in psychology and economics, this paper has discussed the benefits of using behavioural economics in music-decision research. Our contributions to the literature are two-fold. First, through a systematic literature review, we identified 33 studies that applied behavioural economics to music-related decision making, categorised within four research areas – heuristics and biases, social decision making, behavioural time preferences, and dual-process theory. These studies utilised theoretical and empirical tools of behavioural economics, covering a wide area of music research, including music consumption and piracy, music preferences, music performance, music perception and memory, and music and health. Second, based upon the findings of our set of identified studies, we discussed how behavioural economics can help develop new avenues of research. Based on these objectives, we proposed the Behavioural Economics of Music (BEM), an interdisciplinary research programme positioned at the intersection of music, psychology, and economics. We are truly excited about such a programme, and we hope that this discussion has stimulated interest in the potential of using behavioural economics to address key issues in music-decision research. Finally, we note that research in music-related decision making is still relatively young, with no specific research field dedicated to this area exclusively. Our proposal of the BEM provides the first steps towards this.
B.7 References Anglada-Tort, M., & Müllensiefen, D. (2017). The repeated recording illusion: the effects of
extrinsic and individual difference factors on musical judgments. Music Perception: An Interdisciplinary Journal, 35(1), 94–117.
Anglada-Tort, M., Steffens, J., & Müllensiefen, D. (2018). Names and Titles Matter: The Im- pact of Linguistic Fluency and the Affect Heuristic on Aesthetic and Value Judgements of Music. Psychology of Aesthetics, Creativity, and the Arts, 13(3), 277-292.
97 B.7 References
Angner, E. (2012). A course in behavioral economics. Macmillan International Higher
Education. Austin, J. R., Renwick, J. M., & McPherson, G. E. (2006). Developing motivation. In G.
E. McPherson (Ed.), The child as musician: A handbook of musical development (pp. 213–238). Oxford, UK: Oxford University Press.
Ball, L. J., & Thompson, V. A. (Eds.). (2017). International handbook of thinking and reasoning. Routledge.
Bangert, D., Schubert, E., & Fabian, D. (2015). Practice thoughts and performance action: Observing processes of musical decision-making. Music Performance Research, 7, 27–46.
Bangert, D., Schubert, E., & Fabian, D. (2014). A spiral model of musical decision-making. Frontiers in psychology, 5, 320
Berlin, N., Bernard, A., & Fürst, G. (2015). Time spent on new songs: word-of-mouth and price effects on teenager consumption. Journal of Cultural Economics, 39(2), 205–218.
Berns, G. S., & Moore, S. E. (2012). A neural predictor of cultural popularity. Journal of Consumer Psychology, 22(1), 154–160.
Berns, G. S., Capra, C. M., Moore, S., & Noussair, C. (2010). Neural mechanisms of the influence of popularity on adolescent ratings of music. NeuroImage, 49(3), 2687–2696.
Burke, A. E. (1996). How effective are international copyright conventions in the music industry? Journal of Cultural Economics, 20(1), 51–66.
Byun, C. H. C. (2016). The economics of the popular music industry. Springer. Cameron, S. (2015). Music in the marketplace: a social economics approach. Routledge. Cameron, S. (2016). Past, present and future: music economics at the crossroads. Journal of
Cultural Economics, 40(1), 1–12. Cartwright, E. (2018). Behavioral Economics. Routledge. Charlton, S. R., & Fantino, E. (2008). Commodity specific rates of temporal discounting:
Does metabolic function underlie differences in rates of discounting? Behavioural Processes, 77(3), 334–342.
Dawes, R., & Hastie, R. (2010). Rational choice in an uncertain world: The psychology of judgment and decision making. Sage Publications.
De Bruijn, G. J., Spaans, P., Jansen, B., & Van’t Riet, J. (2016). Testing the effects of a mes- sage framing intervention on intentions towards hearing loss prevention in adolescents. Health Education Research, 31(2), 161–170.
Decrop, A., & Derbaix, M. (2014). Artist-Related Determinants of Music Concert Prices. Psychology and Marketing, 31(8), 660–669.
Deutsch, D. (2013). Psychology of music. Elsevier.

98 B.7 References
Dhami, S. (2016). The foundations of behavioral economic analysis. Oxford University
Press. Elliott, C., & Simmons, R. (2011). Factors determining UK album success.Applied Eco-
nomics, 43(30), 4699–4705. Gans, J. S. (2015). “Selling Out” and the impact of music piracy on artist entry. Information
Economics and Policy, 32, 58–64. Greb, F., Schlotz, W., & Steffens, J. (2018). Personal and situational influences on the
functions of music listening. Psychology of Music, 46(6), 763–794. Hallam, S., Cross, I., & Thaut, M. (2016). Oxford handbook of music psychology (second
edition). Oxford University Press. Hantula, D. A., Brockman, D. D. C., & Smith, C. L. (2008). Online shopping as foraging:
The effects of increasing delays on purchasing and patch residence. IEEE Transactions on Professional Communication, 51(2), 147–154.
Hantula, D. A., & Bryant, K. (2005). Delay discounting determines delivery fees in an e- commerce simulation: A behavioral economic perspective. Psychology and Marketing, 22(2), 153–161.
Hashim, M. J., Kannan, K. N., Maximiano, S., & Ulmer, J. R. (2014). Digital Piracy, Teens, and the Source of Advice: An Experimental Study. Journal of Management Information Systems, 31(2), 211–244.
Hendricks, K., & Sorensen, A. (2009). Information and the Skewness of Music Sales. Journal of Political Economy, 117(2), 324–369.
Hiller, R. S. (2016). The importance of quality: How music festivals achieved commercial success. Journal of Cultural Economics, 40(3), 309–334.
Holt, F. (2010). The economy of live music in the digital age. European Journal of Cultural Studies, 13(2), 243–261.
Holyoak, K. J., & Morrison, R. G. (2012). The Oxford Handbook of Thinking and Reasoning. Oxford University Press.
Huron, D. (2013). A Psychological Approach to Musical Form: The Habituation–Fluency Theory of Repetition. Current Musicology, 96(96), 7–35.
IFPI. (2019). International Federation of the Phonographic Industry (IFPI) Global Music Report 2018. Retrieved from http://www.ifpi.org/downloads/GMR2019.pdf
Impett, J. (2016). Making a mark: the psychology of composition. In S. Hallam, I. Cross, & M. Thaut (Eds.), The oxford handbook of music psychology. Oxford University Press.
Jabbar, H. (2011). The behavioral economics of education: New directions for research. Educational Researcher, 40(9), 446–453.
99 B.7 References
Kahn, B., Ratner, R., & Kahneman, D. (1997). Patterns of Hedonic Consumption Over Time.
Marketing Letters, 8(1), 85–96. Kahneman, D. (2003). Maps of bounded rationality: Psychology for behavioral economics.
American Economic Review, 93(5), 1449–1475. Kahneman, D. (2011). Thinking , Fast and Slow. Macmillan. Kahneman, D., & Snell, J. (1992). Predicting a changing taste: Do people know what they
will like? Journal of Behavioral Decision Making, 5(3), 187–200. Ko, T. H., & Lau, H. Y. K. (2016). A Decision Support Framework for Optimal Pricing and
Advertising of Digital Music as Durable Goods. IFAC-PapersOnLine, 49(12), 277–282. Koffarnus, M. N., Jarmolowicz, D. P., Mueller, E. T., & Bickel, W. K. (2013). Changing
delay discounting in the light of the competing neurobehavioral decision systems theory: a review. Journal of the experimental analysis of behavior, 99(1), 32-57.
Krishnan, V., Kellaris, J. J., & Aurand, T. W. (2012). Sonic logos: Can sound influence willingness to pay? Journal of Product and Brand Management, 21(4), 275–284.
Krueger, A. B. (2005). The economics of real superstars: The market for rock concerts in the material world. Journal of Labor Economics, 23(1), 1–30.
Lamont, A., & Greasley, A. (2016). Musical preferences. In S. Hallam, I. Cross, & M. Thaut (Eds.), The oxford handbook of music psychology. Oxford University Press.
Lamont, A., Greasley, A., & Sloboda, J. (2016). Choosing to Hear Music. In S. Hallam, I. Cross, & M. Thaut (Eds.), The oxford handbook of music psychology (pp. 1–20). Oxford University Press.
Li, Z., & Chen, Y. (2014). From Free To Fee: Exploring the Antecedents of Consumer. Journal of Electronic Commerce Research, 15(4), 281–300.
Liebowitz, S. J. (2004). Will MP3 downloads annihilate the record industry? The evidence so far. Advances in the Study of Entrepreneurship, Innovation, and Economic Growth, 15, 229–260.
Liebowitz, S. J. (2006). File sharing: Creative destruction or just plain destruction? Journal of Law and Economics, 49(1), 1–28.
Linnemann, A., Wenzel, M., Grammes, J., Kubiak, T., & Nater, U. M. (2018). Music listening and stress in daily life—a matter of timing. International Journal of Behavioral Medicine, 25(2), 223–230.
Lonsdale, A. J., & North, A. C. (2012). Musical taste and the representativeness heuristic. Psychology of Music, 40(2), 131–142.
Moher, D., Liberati, A., Tetzlaff, J., & Altman, D. G. (2009). Preferred reporting items for systematic reviews and meta-analyses: the PRISMA statement. Journal of Clinical Epidemiology, 62(10), 1006–1012.

100 B.7 References
Mortimer, J. H., Nosko, C., & Sorensen, A. (2012). Supply responses to digital distribution:
Recorded music and live performances. Information Economics and Policy, 24(1), 3–14.
Nunes, J. C., Ordanini, A., & Valsesia, F. (2014). The power of repetition: Repetitive lyrics in a song increase processing fluency and drive market success. Journal of Consumer Psychology, 25(2), 187–199.
North, A. C., & Hargreaves, D. J. (2008). The social and applied psychology of music. OUP Oxford.
Oberholzer-Gee, F., & Strumpf, K. (2009). File sharing and copyright. Innovation Policy and the Economy, 10, 19–55
Ogaski, & Tanaka. (2017). Behavioral Economics: toward a new economics by integration with traditional economics. Springer.
Palazzi, A., Wagner Fritzen, B., & Gauer, G. (2019). Music-induced emotion effects on decision-making. Psychology of Music, 47(5), 621–643.
Rayna, T., & Striukova, L. (2009). Monometapoly or the Economics of the Music Industry. Prometheus, 27(3), 211–222.
Regner, T., & Barria, J. A. (2009). Do consumers pay voluntarily? The case of online music. Journal of Economic Behavior and Organization, 71(2), 395–406.
Regner, T. (2015). Why consumers pay voluntarily: Evidence from online music. Journal of Behavioral and Experimental Economics, 57, 205–214.
Renwick, J. M., & Reeve, J. (2012). Supporting motivation in music education. In G. E. McPherson & G. F. Welch (Eds.), Oxford Handbook of Music Education (Vol. 1, pp. 143–162). New York: Oxford University Press.
Reynolds, B. (2006). A review of delay-discounting research with humans: relations to drug use and gambling. Behavioural pharmacology, 17(8), 651-667.
Schäfer, T., Zimmermann, D., & Sedlmeier, P. (2014). How we remember the emotional intensity of past musical experiences. Frontiers in Psychology, 5(AUG), 1–10.
Simon, H. A. (1955). A Behavioral Model of Rational Choice. The Quarterly Journal of Economics, 69(1), 99–118.
Simon, H. A. (1982). Models of Bounded Rationality. MIT press. Slovic, P., Finucane, M., Peters, E., & MacGregor, D. G. (2002). Rational actors or rational
fools: Implications of the effects heuristic for behavioral economics. Journal of Socio- Economics, 31(4), 329–342.
Sonnabend, H. (2016). Fairness constraints on profit-seeking: evidence from the German club concert industry. Journal of Cultural Economics, 40(4), 529–545.

101 B.7 References
Strobl, E. A., & Tucker, C. (2000). The dynamics of chart success in the U.K. pre-recorded
popular music industry. Journal of Cultural Economics, 24(2), 113–134. Sweeting, A. (2013). Dynamic Product Positioning in Differentiated Product Markets: The
Effect of Fees for Musical Performance Rights on the Commercial Radio Industry. Econometrica, 81(5), 1763–1803.
Tahler, R. (2015). Misbehaving: The Making of Behavioral Economics. WW Norton. Tan, S., Pfordresher, P., & Harré, R. (2017). Psychology of music: From sound to significance.
Routledge. Tschmuck, P. (2017). The economics of music. Agenda Publishing. Tversky, A., & Kahneman, D. (1973). Availability: A heuristic for judging frequency and
probability. Cognitive Psychology, 5(2), 207–232. Tversky, A., & Kahneman, D. (1974). Judgment under Uncertainty: Heuristics and Biases.
Science, 185(4157), 1124–31. D Varian, H. R. (2005). Copying and copyright. Journal of Economic Perspectives, 19(2),
121–138. Vuvan, D. T., Podolak, O. M., & Schmuckler, M. A. (2014). Memory for musical tones: The
impact of tonality and the creation of false memories. Frontiers in Psychology, 5(JUN), 1–18.
Waskow, S., Markett, S., Montag, C., Weber, B., Trautner, P., Kramarz, V., & Reuter, M. (2016). Pay What You Want! A Pilot Study on Neural Correlates of Voluntary Payments for Music. Frontiers in Psychology, 7.
Wilkinson, N., & Klaes, M. (2017). An introduction to behavioral economics. Macmillan International Higher Education.
Witvliet, C. V. O., & Vrana, S. R. (2007). Play it again Sam: Repeated exposure to emo- tionally evocative music polarises liking and smiling responses, and influences other affective reports, facial EMG, and heart rate. Cognition and Emotion, 21(1), 3–25.
Appendix C The repeated recording illusion (S3)
This is an Accepted Manuscript of an article published by UC Press in Music Perception on 24th February 2017, available online: https://doi.org/10.1525/mp.2017.35.1.94. The paper is not the copy of the record and may not exactly replicate the authoritative document published in the journal. For presentation in this thesis, the appendices of the paper have been removed and the passages referring to each Appendix in the text modified to indicate where to find the materials online. Moreover, there may be minor modifications in the text to guarantee a consistent typographic style throughout the thesis, such as the position of figures and tables. Please do not copy or cite without author’s permission.
Citation Anglada-Tort, M., & Müllensiefen, D. (2017). The repeated recording illusion: the effects of extrinsic and individual difference factors on musical judgments. Music Perception: An Interdisciplinary Journal, 35(1), 94-117. DOI: https://doi.org/10.1525/mp.2017.35.1.94
Author contribution The experiment presented in the paper was conducted during my master thesis in the MSc in Music, Mind, and Brain, at Goldsmiths, University of London (2015-2016). The paper was written after completing my masters and published during the first year of my PhD at Technicshce Universität Berlin. Prof. Dr. Daniel Müllensiefen (Goldsmiths, University of London) supervised this work at all stages.

The repeated recording illusion: the effects of extrinsic and
individual difference factors on musical judgments
The repeated recording illusion refers to the phenomenon in which listeners are under the impression that they hear different musical stimuli while they are in fact identical. This phenomenon has not yet been studied systematically. Thus, the present paper aims to construct an experimental paradigm to enable the systematic measurement of the repeated recording illusion, investigating individual difference factors that contribute to it as well as extrinsic factors responsible for differences in musical judgements when the acoustic input remains the same. Seventy-two participants were misled to think that they had heard three different musical performances of an original piece when in fact they were exposed to the same repeated recording. Each time, the recording was accompanied by a different text suggesting a low, medium or high prestige of the performer. 75 % of the participants were under the impression of hearing different musical performances. High levels of neuroticism and openness made it significantly more likely that an individual would fall for the illusion. Musicians were not any more or any less susceptible to the illusion than non-musicians. For participants who fell for the illusion, the explicit prestige texts influenced evaluations of the music significantly. In addition, the mere repetition of the stimulus showed a partial effect. These results suggest that musical judgements are sometimes not based on musical cues and features but are influenced by factors that do not depend on the music itself. The repeated recording illusion can constitute a paradigm for investigating psychological biases and individual differences in aesthetic and musical judgements because the illusion allows for the study of their effects while the music remains the same. Results are interpreted within Tversky and Kahneman’s framework of judgements and decision-making.
Keywords: aesthetics, individual differences, explicit information, music performance, judge- ments and preferences.
104 C.1 Introduction
C.1 Introduction
In 1977, the German radio station WDR 3 conducted an audience participation experiment during a live programme (see the description in Behne, 1987). The radio broadcaster misled the audience to think that they would hear three different performances of the same excerpt of Bruckner Symphony No. 4, providing brief information about three different conductors (Karl Böhm, Leonard Bernstein, and Herbert von Karajan) just before each recording was played. However, the radio broadcaster played the same recording three times. The radio station received 536 calls. 81.7 % of the callers were misled and reported differences between the identical music recordings. Only the remaining 18.3 % of the listeners who called in reported that there were no differences between the three performances. Nevertheless, we note that the audience participation experiment had several shortcomings, such as a lack of control over experimental conditions and a potential sampling bias for those listeners who believed they had heard different musical performances to call the radio station. Therefore, one of the main motivations of the present paper was the replication of this phenomenon in an experimental setting.
We will refer to this phenomenon, where listeners are under the impression that they hear different musical performances while in fact they are identical, as the repeated recording illusion. Duerksen (1972) was amongst the first academic studies to use a similar approach. He played two tape recordings of an identical piano performance to music major and non- music major students. Participants were told that one performance was by an eminent professional pianist and the other one by a student. Both groups rated technical and musical characteristics of the music recording consistently lower when told the performance was by a student than when told it was by a professional. However, Duerksen (1972) merely attributed the findings to an effect of expectations and did not investigate whether participants believed that they had heard the same or different musical performances.
There are a number of studies that used similar experimental paradigms, presenting partici- pants with identical recordings in succession (Behne & Wöllner, 2011; Cavitt, 1997, 2002; Elliott, 1995; Griffiths, 2008; Juchniewicz, 2008; Radocy, 1976; Silvey, 2009). The main purpose of these studies was to investigate non-musical factors that influence evaluations of musical performances, such as the effect of expectations (Cavitt, 1997, 2002; Duerksen, 1972), authority (Radocy, 1976), musicians’ body movements (Behne & Wöllner, 2011; Juchniewicz, 2008), race and gender (Elliott, 1995), concert dress and physical attractiveness (Griffiths, 2008), and band labels (Silvey, 2009). None of these studies considered the implications of participants potentially falling for the repeated recording illusion. Thus, in none of these studies it is possible to determine whether the illusion occurred in the sample of
105 C.1 Introduction
participants. We considered the repeated recording illusion to be a phenomenon that merits further investigation. Exploring this phenomenon in detail could provide relevant and unique insights to the fields of aesthetics, music perception, cognition, and choice behaviour. There- fore, the present study attempts to measure systematically the repeated recording illusion, investigating individual difference factors that contribute to it as well as extrinsic factors responsible for differences in musical judgements when the acoustic input remains the same.
In relation to the individual difference factors, we suggest that the amount of musical training of participants may play an important role in the repeated recording illusion. A large number of previous studies have shown that people with high levels of musical training (i.e., musicians) outperform non-musicians on many music-related tasks, indicating that musical training has a positive influence on the efficiency and accuracy with which characteristics of sounds (e.g., pitch and timbre) are encoded in memory (see Pearce, 2015 for a review). For instance, musicians show greater sensitivity to fine variations and nuances in music (e.g., slurs, rests, articulation, and timbre) (Deliege, 1987) and better recognition memory for melodies than non-musicians (Dowling & Bartlett, 1981; Dowling, 1978; Halpern, Bartlett, & Dowling, 1995; Orsmond & Miller, 1999). We therefore hypothesized that musical training would have an effect on the illusion. However, the tasks involved in the above research (e.g., to recognize a melody) are very different to the task that requires an individual to realize that the same music recording is played in succession. Thus, it is difficult to predict the direction in which musical training may affect the repeated recording illusion. The present study only attempts to assess whether musicians perform differently on this task compared to non-musicians.
Arguably, the paradigm used in the repeated recording illusion relies on a judgement bias exerted by a figure of authority (i.e., participants are told by a researcher in a lab condition that they will listen to different performances). In line with Milgram’s obedience to authority experiment (1963), Radocy (1976) found that the bias exerted by a figure of authority significantly influenced participants’ evaluations of musical events. We therefore considered that individual differences on suggestibility could be an important factor contributing to the illusion. We hypothesized that people with higher levels of susceptibility would be more likely to fall for the repeated recording illusion.
The present research also explored music preferences and personality as possible individual difference factors related to the illusion. Individuals tend to have stronger preferences for certain genres of music, becoming more familiar with the preferred style as a result of repeated listening. Repeated exposure to a piece of music increases the liking for it and decreases its subjective complexity (see North & Hargreaves, 2008 for a review). In relation
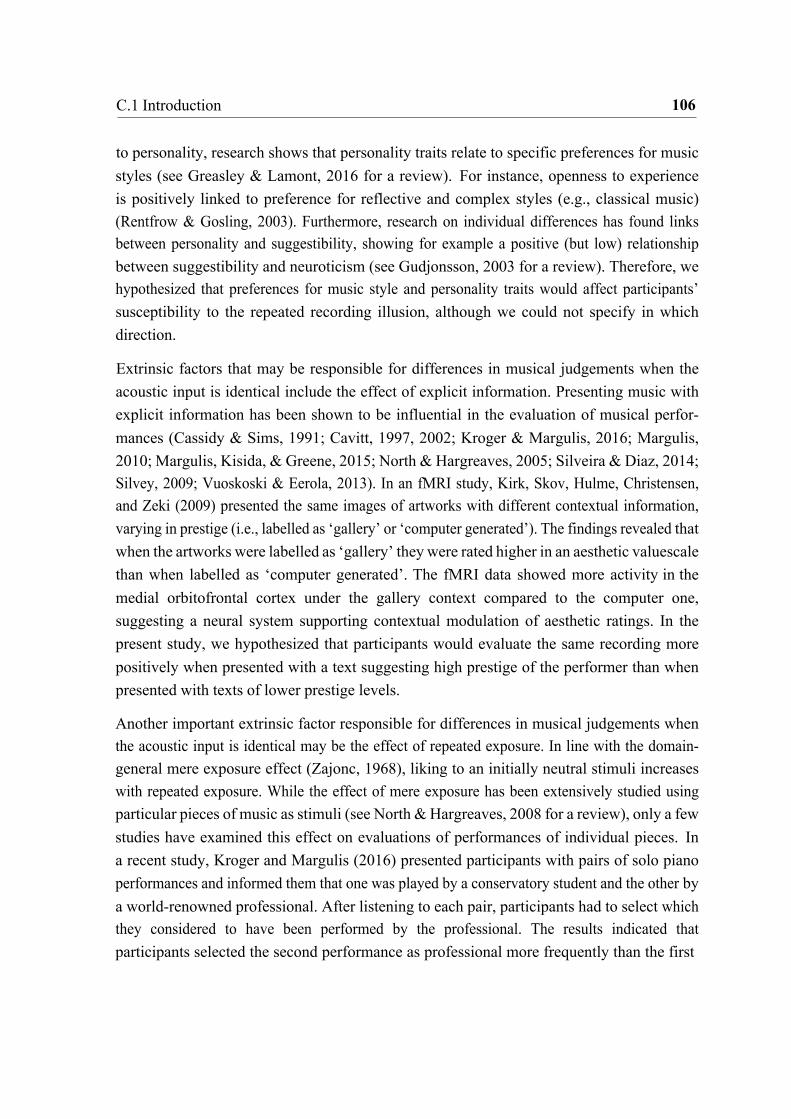
106 C.1 Introduction
to personality, research shows that personality traits relate to specific preferences for music styles (see Greasley & Lamont, 2016 for a review). For instance, openness to experience is positively linked to preference for reflective and complex styles (e.g., classical music) (Rentfrow & Gosling, 2003). Furthermore, research on individual differences has found links between personality and suggestibility, showing for example a positive (but low) relationship between suggestibility and neuroticism (see Gudjonsson, 2003 for a review). Therefore, we hypothesized that preferences for music style and personality traits would affect participants’ susceptibility to the repeated recording illusion, although we could not specify in which direction.
Extrinsic factors that may be responsible for differences in musical judgements when the acoustic input is identical include the effect of explicit information. Presenting music with explicit information has been shown to be influential in the evaluation of musical perfor- mances (Cassidy & Sims, 1991; Cavitt, 1997, 2002; Kroger & Margulis, 2016; Margulis, 2010; Margulis, Kisida, & Greene, 2015; North & Hargreaves, 2005; Silveira & Diaz, 2014; Silvey, 2009; Vuoskoski & Eerola, 2013). In an fMRI study, Kirk, Skov, Hulme, Christensen, and Zeki (2009) presented the same images of artworks with different contextual information, varying in prestige (i.e., labelled as ‘gallery’ or ‘computer generated’). The findings revealed that when the artworks were labelled as ‘gallery’ they were rated higher in an aesthetic value scale than when labelled as ‘computer generated’. The fMRI data showed more activity in the medial orbitofrontal cortex under the gallery context compared to the computer one, suggesting a neural system supporting contextual modulation of aesthetic ratings. In the present study, we hypothesized that participants would evaluate the same recording more positively when presented with a text suggesting high prestige of the performer than when presented with texts of lower prestige levels.
Another important extrinsic factor responsible for differences in musical judgements when the acoustic input is identical may be the effect of repeated exposure. In line with the domain- general mere exposure effect (Zajonc, 1968), liking to an initially neutral stimuli increases with repeated exposure. While the effect of mere exposure has been extensively studied using particular pieces of music as stimuli (see North & Hargreaves, 2008 for a review), only a few studies have examined this effect on evaluations of performances of individual pieces. In a recent study, Kroger and Margulis (2016) presented participants with pairs of solo piano performances and informed them that one was played by a conservatory student and the other by a world-renowned professional. After listening to each pair, participants had to select which they considered to have been performed by the professional. The results indicated that participants selected the second performance as professional more frequently than the first

107 C.2 Method
performance, although this effect was modulated by the actual identity of the performer. In relation to the repeated recording illusion, we hypothesized that participants’ ratings of the same recording would improve with repeated exposure.
The present research had three main aims. The first was to construct an experimental paradigm to enable the systematic measurement of the repeated recording illusion. The second aim was to investigate possible individual difference factors that contribute to the illusion (i.e., musical training, suggestibility, music preferences and personality). The third aim was to investigate extrinsic factors responsible for differences in musical judgements when the acoustic input remains the same (i.e., explicit information and repeated exposure). In addition, in order to capture higher-order interactions between the extrinsic and individual difference factors, an exploratory analysis of the same data aimed to identify conditions that lead to particularly positive or negative judgements.
In constructing the experimental paradigm of the repeated recording illusion, participants were misled to think that they had heard three different performances of an original music piece. However, we played the exact same recording three times in succession. Each time the recording was accompanied by a text suggesting low, medium or high prestige of the performer. We repeated this experimental procedure with two different pieces of music, a piece of classical music and a piece of popular music for which we assumed a high stylistic familiarity for most participants. In order to study the repeated recording illusion without an effect of explicit information, we examined a non-prestige group where we did not manipulate prestige of the performer.
C.2 Method
C.2.1 Participants
A sample of seventy-two university students took part in the experiment (36 male, 36 female), aged 19-39 (M = 24.26, SD = 3.60). Twenty-nine participants were considered as trained musicians (M = 45.74, SD = 5.73 on the Musical Training subscale of the Goldsmiths Musical Sophistication Index, Müllensiefen, Gingras, Musil, & Stewart, 2014; and had 6 to 8 years of formal musical training). Forty-five participants were considered as non-musicians (M = 22.71, SD = 7.34 on the Gold-MSI; and had 1 year of formal musical training on average). Twelve participants were randomly allocated to a non-prestige condition (6 male, 6 female), aged 21-29 (M = 24.34, SD = 3.45). Participation was on a volunteer basis and unpaid.

108 C.2 Method
C.2.2 Design
The study employed a 3x3x2 repeated measures design. Explicit information (low vs. medium vs. high prestige text), repeated exposure (first vs. second vs. third position), and genre of the original music piece (popular vs. classical music) were the within-participant factors. The three levels of the explicit information factor were fully counter-balanced with presentation order across participants. Half of the participants started with the popular music piece condition and the other half started with the piece of classical music. The dependent variables consisted of a diverse range of musical judgements provided immediately after each listening and at the end of each music condition. In order to explore the repeated recording illusion without an effect of explicit information, we examined a non-prestige group where we did not manipulate prestige of the performer. In addition, we measured individual difference factors that were expected to contribute to the illusion (i.e., musical training, suggestibility, music preferences and personality).
C.2.3 Materials
In the popular music condition participants listened to a live recording of ‘Jailhouse Rock’ by Elvis Presley recorded in NBC studios in 1968. The length of the recording was 1 minute and 36 seconds. This piece was selected because we assumed a high stylistic familiarity for most participants. In the classical music condition participants listened to the final part of a live recording of ‘Bruckner Symphony No. 4 Die Romantische’ conducted by Günter Wand and performed by the Berliner Philarmonic Orchestra in 1998. The length of the recording was 2 minutes and 48 seconds. This piece was selected in order to replicate empirically the experiment carried out in the German radio station WDR 3(Behne, 1987). The original recordings were edited and normalised using ableton live computer software. In the popular live recording we edited the start and end points of the original recording in order to contain only the musical performance element of the recording. Similar to the German radio experiment (Behne, 1987), the start and end points of the classical music piece were edited to contain the final part of the performance. We then normalised the volume of the two recordings to be fixed on the same threshold. Then each recording was duplicated three times and written to the same compact disc, using iTunes 12.2.2. Each copy of the music recording was saved under a different name, which included performers’ names as used in the texts suggesting different levels of prestige. In the non-prestige condition, the names were ‘performance 1’, ‘performance 2’, and ‘performance 3’.
To manipulate the effect of explicit information we created three texts suggesting low, medium and high prestige of the performer. The texts had the same format, organisation and
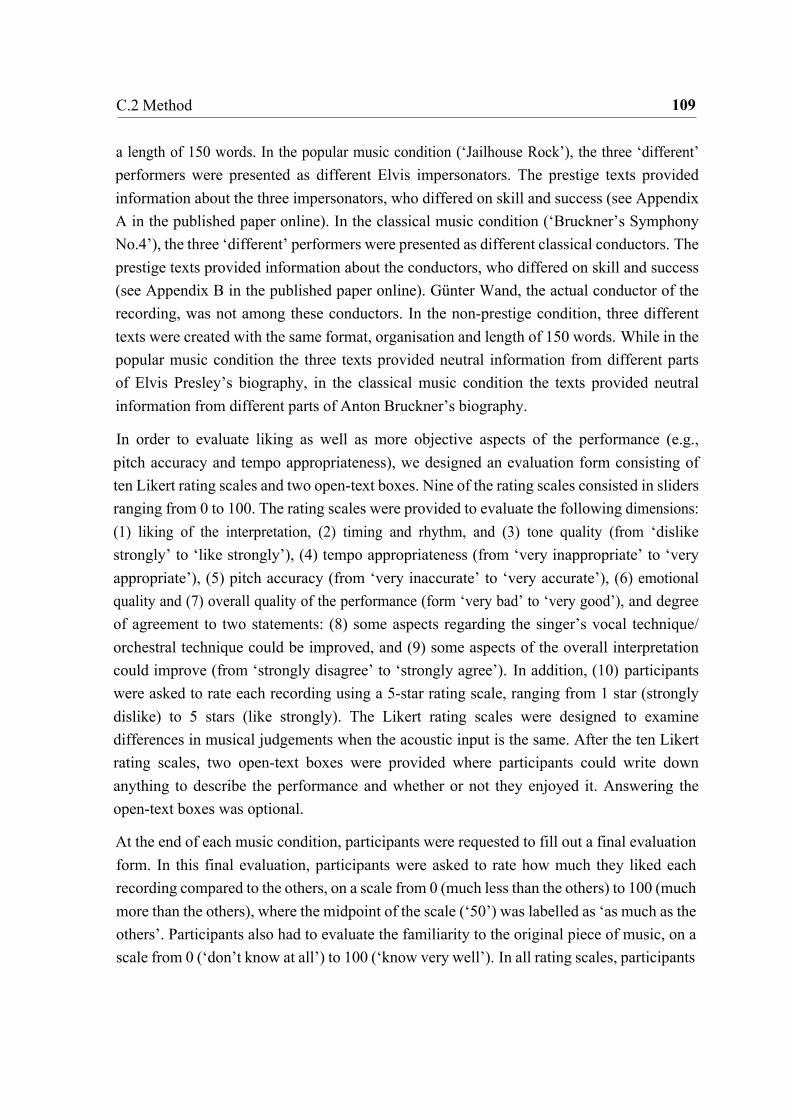
109 C.2 Method
a length of 150 words. In the popular music condition (‘Jailhouse Rock’), the three ‘different’ performers were presented as different Elvis impersonators. The prestige texts provided information about the three impersonators, who differed on skill and success (see Appendix A in the published paper online). In the classical music condition (‘Bruckner’s Symphony No.4’), the three ‘different’ performers were presented as different classical conductors. The prestige texts provided information about the conductors, who differed on skill and success (see Appendix B in the published paper online). Günter Wand, the actual conductor of the recording, was not among these conductors. In the non-prestige condition, three different texts were created with the same format, organisation and length of 150 words. While in the popular music condition the three texts provided neutral information from different parts of Elvis Presley’s biography, in the classical music condition the texts provided neutral information from different parts of Anton Bruckner’s biography.
In order to evaluate liking as well as more objective aspects of the performance (e.g., pitch accuracy and tempo appropriateness), we designed an evaluation form consisting of ten Likert rating scales and two open-text boxes. Nine of the rating scales consisted in sliders ranging from 0 to 100. The rating scales were provided to evaluate the following dimensions: (1) liking of the interpretation, (2) timing and rhythm, and (3) tone quality (from ‘dislike strongly’ to ‘like strongly’), (4) tempo appropriateness (from ‘very inappropriate’ to ‘very appropriate’), (5) pitch accuracy (from ‘very inaccurate’ to ‘very accurate’), (6) emotional quality and (7) overall quality of the performance (form ‘very bad’ to ‘very good’), and degree of agreement to two statements: (8) some aspects regarding the singer’s vocal technique/ orchestral technique could be improved, and (9) some aspects of the overall interpretation could improve (from ‘strongly disagree’ to ‘strongly agree’). In addition, (10) participants were asked to rate each recording using a 5-star rating scale, ranging from 1 star (strongly dislike) to 5 stars (like strongly). The Likert rating scales were designed to examine differences in musical judgements when the acoustic input is the same. After the ten Likert rating scales, two open-text boxes were provided where participants could write down anything to describe the performance and whether or not they enjoyed it. Answering the open-text boxes was optional.
At the end of each music condition, participants were requested to fill out a final evaluation form. In this final evaluation, participants were asked to rate how much they liked each recording compared to the others, on a scale from 0 (much less than the others) to 100 (much more than the others), where the midpoint of the scale (‘50’) was labelled as ‘as much as the others’. Participants also had to evaluate the familiarity to the original piece of music, on a scale from 0 (‘don’t know at all’) to 100 (‘know very well’). In all rating scales, participants
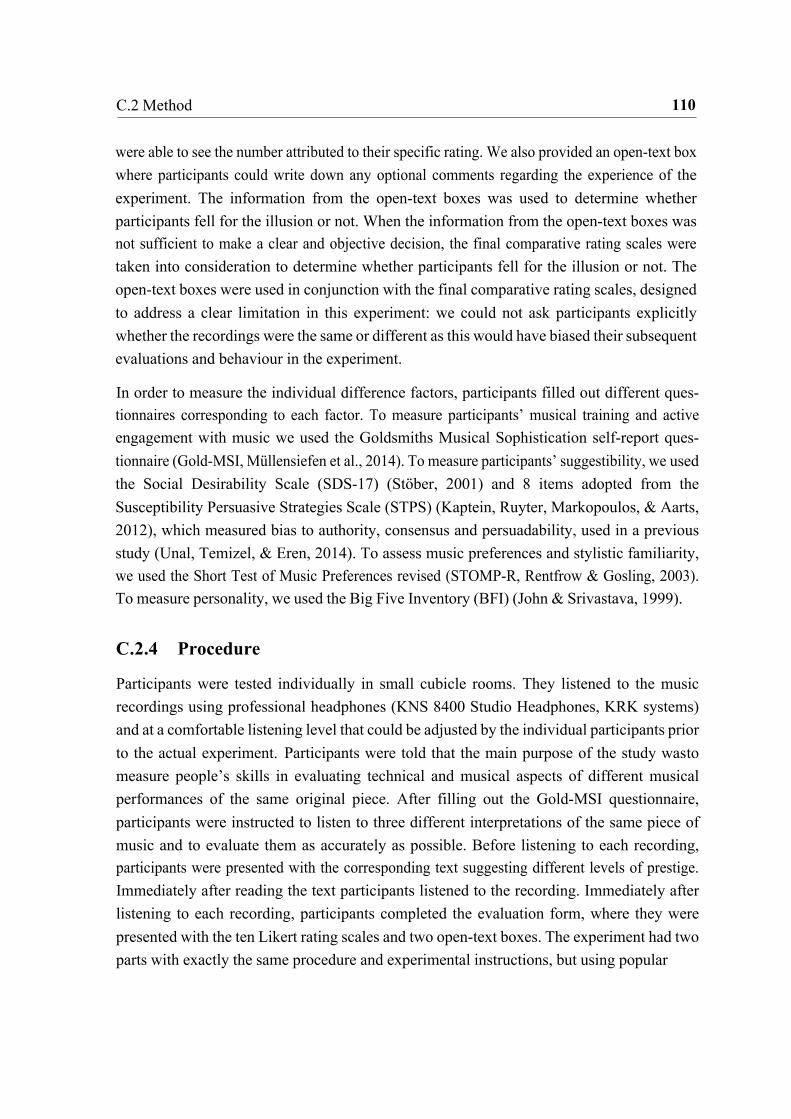
110 C.2 Method
were able to see the number attributed to their specific rating. We also provided an open-text box where participants could write down any optional comments regarding the experience of the experiment. The information from the open-text boxes was used to determine whether participants fell for the illusion or not. When the information from the open-text boxes was not sufficient to make a clear and objective decision, the final comparative rating scales were taken into consideration to determine whether participants fell for the illusion or not. The open-text boxes were used in conjunction with the final comparative rating scales, designed to address a clear limitation in this experiment: we could not ask participants explicitly whether the recordings were the same or different as this would have biased their subsequent evaluations and behaviour in the experiment.
In order to measure the individual difference factors, participants filled out different ques- tionnaires corresponding to each factor. To measure participants’ musical training and active engagement with music we used the Goldsmiths Musical Sophistication self-report ques- tionnaire (Gold-MSI, Müllensiefen et al., 2014). To measure participants’ suggestibility, we used the Social Desirability Scale (SDS-17) (Stöber, 2001) and 8 items adopted from the Susceptibility Persuasive Strategies Scale (STPS) (Kaptein, Ruyter, Markopoulos, & Aarts, 2012), which measured bias to authority, consensus and persuadability, used in a previous study (Unal, Temizel, & Eren, 2014). To assess music preferences and stylistic familiarity, we used the Short Test of Music Preferences revised (STOMP-R, Rentfrow & Gosling, 2003). To measure personality, we used the Big Five Inventory (BFI) (John & Srivastava, 1999).
C.2.4 Procedure
Participants were tested individually in small cubicle rooms. They listened to the music recordings using professional headphones (KNS 8400 Studio Headphones, KRK systems) and at a comfortable listening level that could be adjusted by the individual participants prior to the actual experiment. Participants were told that the main purpose of the study was to measure people’s skills in evaluating technical and musical aspects of different musical performances of the same original piece. After filling out the Gold-MSI questionnaire, participants were instructed to listen to three different interpretations of the same piece of music and to evaluate them as accurately as possible. Before listening to each recording, participants were presented with the corresponding text suggesting different levels of prestige. Immediately after reading the text participants listened to the recording. Immediately after listening to each recording, participants completed the evaluation form, where they were presented with the ten Likert rating scales and two open-text boxes. The experiment had two parts with exactly the same procedure and experimental instructions, but using popular

111 C.3 Results
music (‘Jailhouse Rock’) and classical music (‘Bruckner’s Symphony No.4’) respectively. Immediately after listening the three recordings of each part, participants filled the final evaluation form consisting in the final comparative rating scales and the open-text box. Between completing the two parts of the experiment participants were asked to fill out the STOMP-R questionnaire. In the non-prestige condition the procedure was the same. Participants were also instructed that they would listen to three different performances of the same piece, but the three recordings were presented as ‘performer 1’, ‘performer 2’, and ‘performer 3’, and the texts presented with the music did not induce any kind of prestige. Two weeks after the experiment, participants were asked via email to fill out the BFI, SDS-17, and the 8 items measuring suggestibility. The experiment and questionnaires were implemented in Qualtrics software (Qualtrics, Provo, UT). This research was granted ethical approval by the Ethics Committee of the Department of Psychology of Goldsmiths College, University of London.
C.3 Results
C.3.1 The Repeated Recording Illusion
In order to determine whether participants fell for the repeated recording illusion or not we used the following procedure: We first assessed the information provided in the open-text boxes. From a total of 14 open-text boxes (7 in the popular music condition and 7 in the classical music conditions), on average participants provided information in 12.65% of the boxes (6.33% in the popular music condition and 6.32% in the classical music condition). By using the information provided in the open-text boxes we were able to identify 48 participants out of 72 (66.67%) in the popular music condition and 50 participants out of 72 (69.45%) in the classical music condition, who provided specific information either reporting differences between performances or reporting that the recordings were the same.
There were cases wherein the information from the open-text boxes was not sufficient to make a clear and objective decision but suggested a direction: either that the participant was not aware that the recordings were identical or that the participant suspected that they were the same. In these cases, we took into consideration the scores from the final comparative rating scales where participants had to compare how much did they like each recording in comparison to the others, on a scale from 0 (much less than the others) to 100 (much more than the others), where the midpoint of the scale (‘50’) was labelled as ‘as much as the others’. We only classified the participant when the scores from the final comparative ratings

112 C.3 Results
confirmed the suggested direction from the text boxes. It is important to note that we never took into consideration the scores form the final comparative ratings on its own.
When the information from the open-text boxes was not sufficient and/or too ambiguous to make a clear and objective decision, we did not include the participant’s data in the subsequent analyses. Two participants provided highly ambiguous statements in the open- text boxes for both music conditions and the two participants were therefore excluded from the subsequent analyses. Furthermore, one participant provided ambiguous information in the popular music condition and a different participant in the classical music condition. Thus, we had a total of 69 participants in each music condition.
As a consequence of using the above mentioned procedure, we had a total of four possible criteria to determine whether participants fell for the repeated recording illusion or not (see Appendix C, in the paper published online, for a decision diagram depicting the decision procedure and criteria; Tables in Appendix F and G (in the paper published online) from the supplementary materials show the information used to make each individual decision per participant in the two music conditions):
1. When the information provided in the open-text boxes specifically indicated any differences between performances: In the popular music condition, 37 out of 69 par- ticipants (53.62%) specifically reported information indicating differences between performances, such as “more upbeat than the two others, a happier sounding perfor- mance” or “this piece sounds more aggressive than the previous one. The tempo for me is faster”. In the classical music condition, 42 out of 69 participants (60.87%) specifically reported information indicating differences between performances, such as “the mood in this piece seemed to escalate a lot more naturally than in the other pieces” or “this interpretation sounded a bit more hesitant. Again, it was not as dramatic as the first performance, but it was clearer than the second one”.
2. When the information in the open-text boxes specifically indicated that the participant realized that the recordings were the same: In the popular music condition, 11 out 69 participants (15.94%) specifically reported information indicating that the recordings were the same (e.g., “I reckon this is the same file repeated three time” or “this is absolutely the same as the first two”). In the classical music condition, 8 out 69 participants (11.59%) specifically reported information indicating that the recordings were the same (e.g., “This sounds exactly like the two others” or “I thought all 3 were the same”).
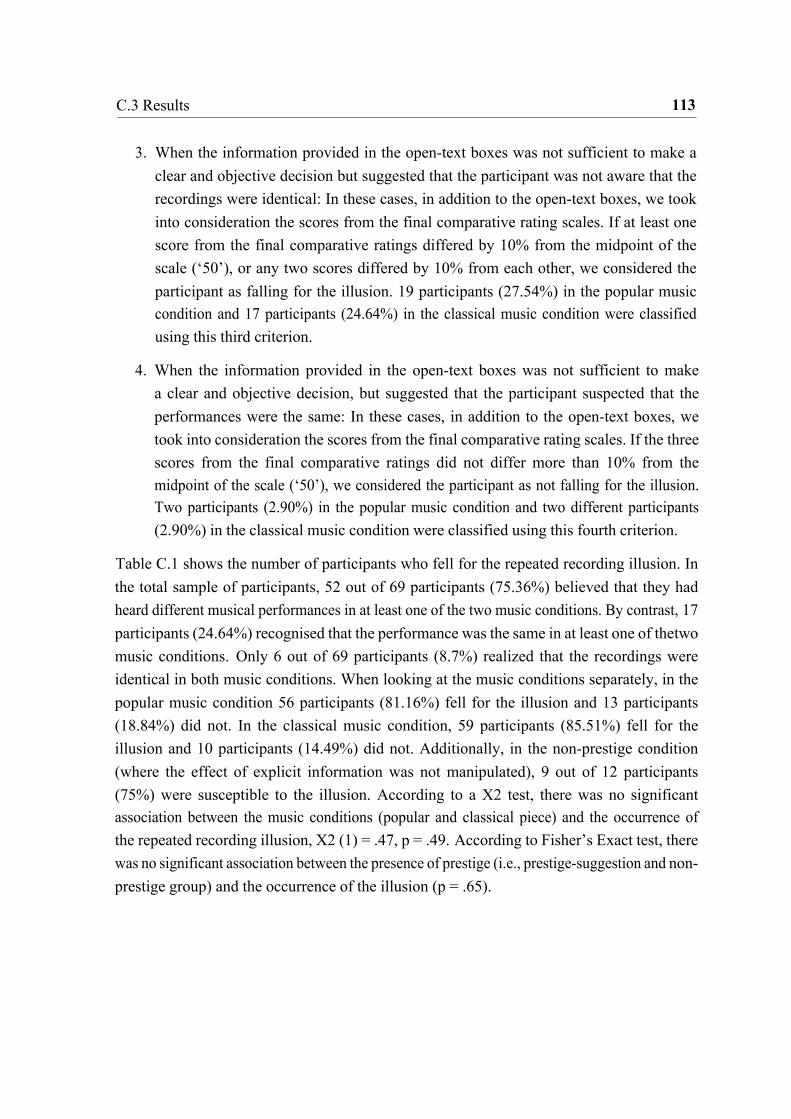
113 C.3 Results
3. When the information provided in the open-text boxes was not sufficient to make a
clear and objective decision but suggested that the participant was not aware that the recordings were identical: In these cases, in addition to the open-text boxes, we took into consideration the scores from the final comparative rating scales. If at least one score from the final comparative ratings differed by 10% from the midpoint of the scale (‘50’), or any two scores differed by 10% from each other, we considered the participant as falling for the illusion. 19 participants (27.54%) in the popular music condition and 17 participants (24.64%) in the classical music condition were classified using this third criterion.
4. When the information provided in the open-text boxes was not sufficient to make a clear and objective decision, but suggested that the participant suspected that the performances were the same: In these cases, in addition to the open-text boxes, we took into consideration the scores from the final comparative rating scales. If the three scores from the final comparative ratings did not differ more than 10% from the midpoint of the scale (‘50’), we considered the participant as not falling for the illusion. Two participants (2.90%) in the popular music condition and two different participants (2.90%) in the classical music condition were classified using this fourth criterion.
Table C.1 shows the number of participants who fell for the repeated recording illusion. In the total sample of participants, 52 out of 69 participants (75.36%) believed that they had heard different musical performances in at least one of the two music conditions. By contrast, 17 participants (24.64%) recognised that the performance was the same in at least one of the two music conditions. Only 6 out of 69 participants (8.7%) realized that the recordings were identical in both music conditions. When looking at the music conditions separately, in the popular music condition 56 participants (81.16%) fell for the illusion and 13 participants (18.84%) did not. In the classical music condition, 59 participants (85.51%) fell for the illusion and 10 participants (14.49%) did not. Additionally, in the non-prestige condition (where the effect of explicit information was not manipulated), 9 out of 12 participants (75%) were susceptible to the illusion. According to a X2 test, there was no significant association between the music conditions (popular and classical piece) and the occurrence of the repeated recording illusion, X2 (1) = .47, p = .49. According to Fisher’s Exact test, there was no significant association between the presence of prestige (i.e., prestige-suggestion and non-prestige group) and the occurrence of the illusion (p = .65).
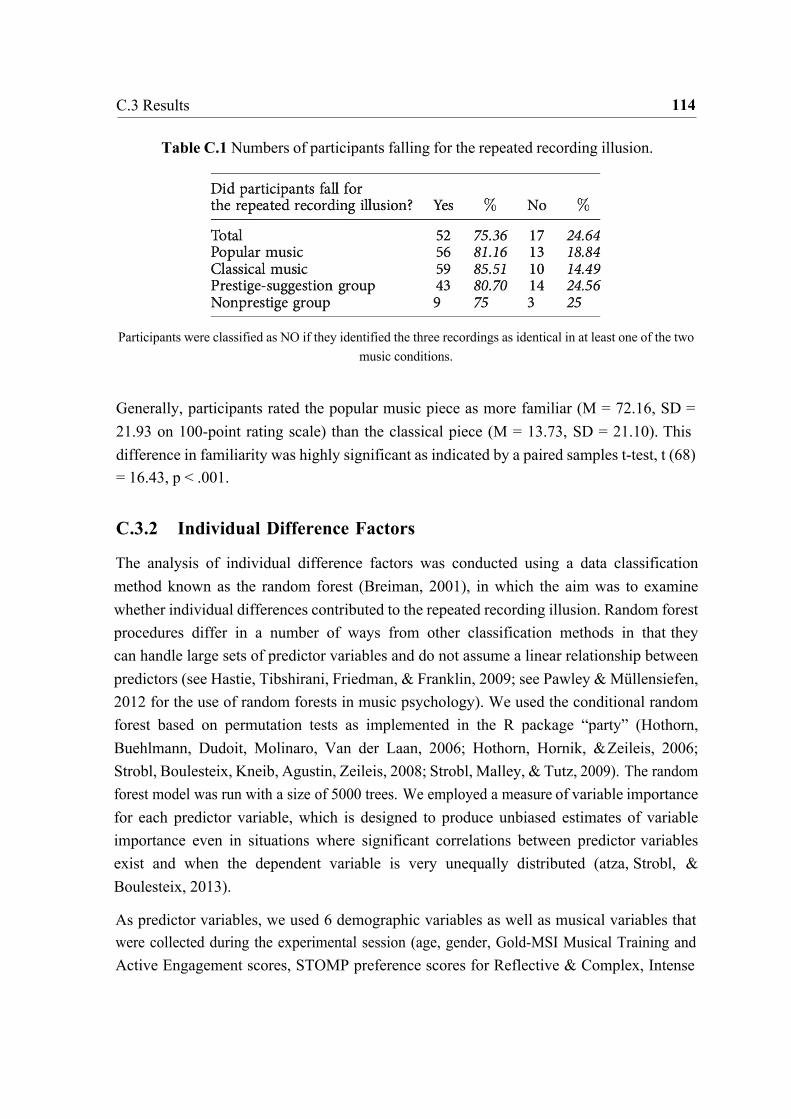
114 C.3 Results
Table C.1 Numbers of participants falling for the repeated recording illusion.
Participants were classified as NO if they identified the three recordings as identical in at least one of the two music conditions.
Generally, participants rated the popular music piece as more familiar (M = 72.16, SD = 21.93 on 100-point rating scale) than the classical piece (M = 13.73, SD = 21.10). This difference in familiarity was highly significant as indicated by a paired samples t-test, t (68) = 16.43, p < .001.
C.3.2 Individual Difference Factors
The analysis of individual difference factors was conducted using a data classification method known as the random forest (Breiman, 2001), in which the aim was to examine whether individual differences contributed to the repeated recording illusion. Random forest procedures differ in a number of ways from other classification methods in that they can handle large sets of predictor variables and do not assume a linear relationship between predictors (see Hastie, Tibshirani, Friedman, & Franklin, 2009; see Pawley & Müllensiefen, 2012 for the use of random forests in music psychology). We used the conditional random forest based on permutation tests as implemented in the R package “party” (Hothorn, Buehlmann, Dudoit, Molinaro, Van der Laan, 2006; Hothorn, Hornik, & Zeileis, 2006; Strobl, Boulesteix, Kneib, Agustin, Zeileis, 2008; Strobl, Malley, & Tutz, 2009). The random forest model was run with a size of 5000 trees. We employed a measure of variable importance for each predictor variable, which is designed to produce unbiased estimates of variable importance even in situations where significant correlations between predictor variables exist and when the dependent variable is very unequally distributed (atza, Strobl, & Boulesteix, 2013).
As predictor variables, we used 6 demographic variables as well as musical variables that were collected during the experimental session (age, gender, Gold-MSI Musical Training and Active Engagement scores, STOMP preference scores for Reflective & Complex, Intense
115 C.3 Results
& Rebellious, Upbeat & Conventional, and Energetic & Rhythmic). Data for 9 additional variables were collected via the follow-up questionnaire measuring the big five personality traits (Extraversion, Agreeableness, Conscientiousness, Neuroticism, and Openness) as well as suggestibility (Authority score, Consensus score, Persuadability score, and Social Desirability score). Using these 17 predictor variables we computed two different models with two different binary dependent variables: (a) a strict criterion model in which only those participants who fell for the illusion in both music conditions were considered as not falling for the illusion and, (b) a less strict criterion model where we considered as not falling for the illusion those participants who fell for the illusion in at least one of the two music conditions. A variable importance score was obtained for each predictor variable, describing how predictive each variable was compared to the others. We applied a “confidence interval” criterion in order to select the top performing variables. Only the variables whose variable importance scores were positive and greater than the absolute value of the lowest negative variable importance score were selected (Strobl et al., 2008; Strobl et al., 2009).
The two models (strict and less strict criterion) delivered very similar results, indicating that there were two variable importance scores that met the above criterion (neuroticism and openness). In both models, neuroticism was the most important variable contributing to the repeated recording illusion, followed by openness (see Appendix D, in the paper published online, for graphs with the 17 variable important scores in the two models). In the strict criterion model, neuroticism was approximately 3.5 times more important than openness. In this model, those participants falling for the illusion in the two music conditions had a higher mean neuroticism score of 23.41 (SD = 5.17) and a higher mean openness score of 40.12 (SD = 5.14) compared to those participants who did not fall for the illusion (M = 17.43, SD = 6.85 on the neuroticism factor; M = 35.28, SD = 7.02 on the openness factor). In the less strict criterion model, neuroticism was approximately 3 times more important than openness. In this model, those participants who fell for the illusion in at least one of the two music conditions had a higher mean neuroticism score of 23.14 (SD = 5.55) and a higher mean openness score of 40.12 (SD = 5.42) compared to those participants who did not fall for the illusion (M = 17.43, SD = 6.85 on the neuroticism factor; M = 35.28, SD = 7.02 on the openness factor).
C.3.3 Extrinsic Factors: The Effects of Explicit Information and Re-
peated Exposure
The subsequent analyses included the sixty participants of the main experimental group (i.e., where we manipulated the effect of explicit information). In the popular music condition,
116 C.3 Results
three participants were excluded from the analyses and ten fell for the illusion. Hence, in the popular music condition we had an overall of 47 participants. In the classical music condition, three participants were excluded from the analyses and nine fell for the illusion. Hence, in the classical music condition we had an overall of 48 participants.
Participants’ ratings on the ten Likert rating scales were aggregated into a single scale. First, ratings of each participant on each rating scale were transformed into z-scores across ratings of all six recordings (three in the popular music condition and three in the classical). Then, a principal component analysis (PCA) was conducted on the z-transformed data of the ten rating scales. The Kaiser-Meyer-Olkin (KMO) measure verified the sampling adequacy for the analysis, KMO = .93 (‘marvellous’ according to Hutcheson & Sofroniou, 1999). In addition, all KMO values for individual rating scales were greater than .86, which is well above commonly accepted limit of .5 (Field, 2013). The scree plot of the different factor solution was very clear and indicated a solution with just one factor. Moreover, there was only one PCA component with an eigenvalue >1 which explained 64.56% of the variance. Thus, this 1-factor PCA solution was accepted and component scores for all participant ratings were computed using the regression method.
Because the two music recordings used in the popular and classical music conditions differed substantially in several aspects (i.e., musical genre, familiarity, presence of words/ vocaliza- tions, duration of the excerpt and quality of the recording), we ran two separate models, one with the ratings obtained in the popular music condition and one with the ratings obtained in the classical music condition (see Appendix E, in the paper published online, for a summary table of both models). Participants’ ratings were standardised separately for each music condition.
To test the hypothesis regarding the effects of explicit information and repeated exposure we used the R packages lme4 (Bates, Mächler, Bolker, & Walker, 2015) and lmerTest (Kuznetsova, Brockhoff, & Christensen, 2016) to perform a linear mixed effects analysis with the z-scores of the participants’ ratings as the dependent variable. In the two models, explicit information (low, medium, and high prestige of the text) and repeated exposure (first, second, and third position) were the fixed effect independent factors, whereas participants were the random effect factor.
The linear mixed-effect model of the popular music condition revealed that there were signifi- cant main effects of explicit information (p < .001) and repeated exposure (p < .001). Because the interaction between explicit information and repeated exposure was not significant we ran the model again only with the two main factors. The effects of explicit information and
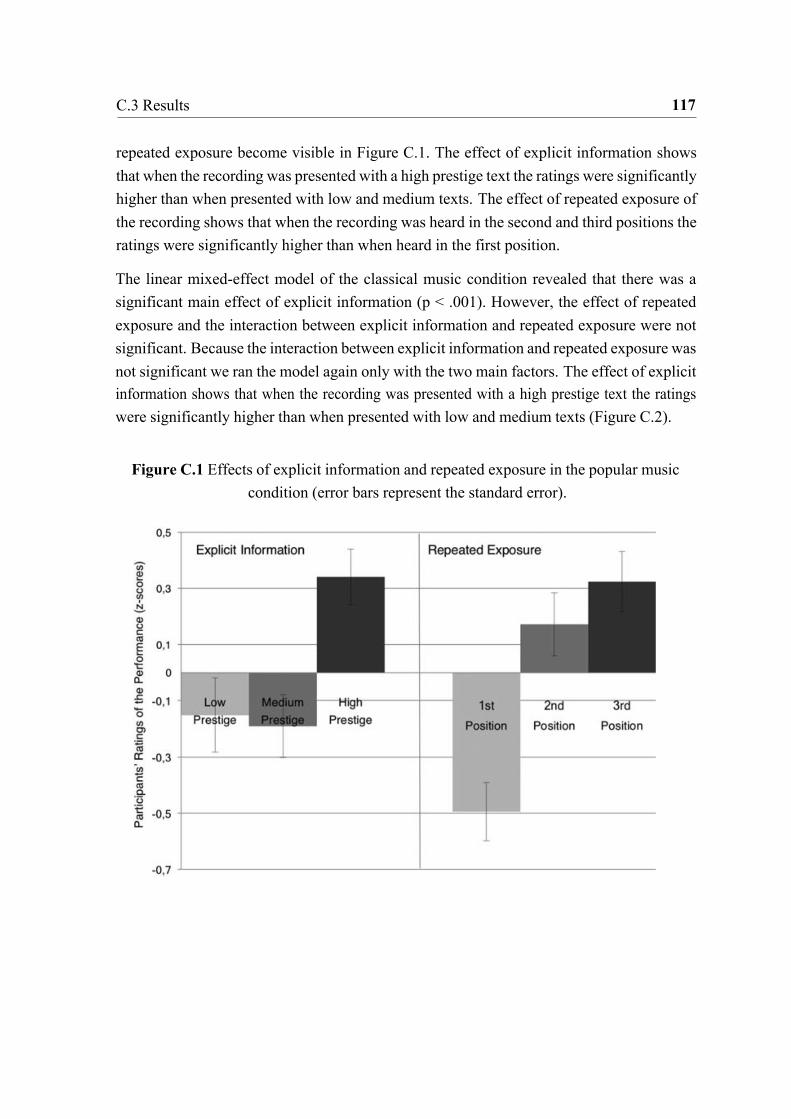
117 C.3 Results
repeated exposure become visible in Figure C.1. The effect of explicit information shows that when the recording was presented with a high prestige text the ratings were significantly higher than when presented with low and medium texts. The effect of repeated exposure of the recording shows that when the recording was heard in the second and third positions the ratings were significantly higher than when heard in the first position.
The linear mixed-effect model of the classical music condition revealed that there was a significant main effect of explicit information (p < .001). However, the effect of repeated exposure and the interaction between explicit information and repeated exposure were not significant. Because the interaction between explicit information and repeated exposure was not significant we ran the model again only with the two main factors. The effect of explicit information shows that when the recording was presented with a high prestige text the ratings were significantly higher than when presented with low and medium texts (Figure C.2).
Figure C.1 Effects of explicit information and repeated exposure in the popular music
condition (error bars represent the standard error).
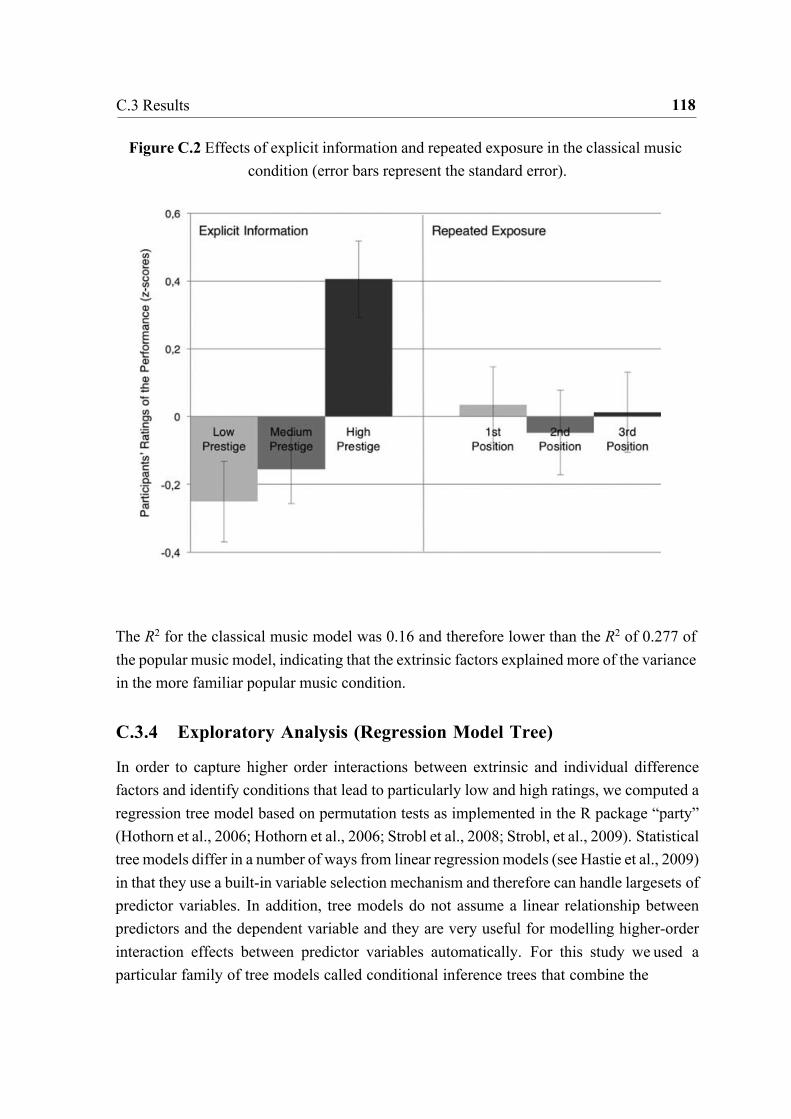
118 C.3 Results
Figure C.2 Effects of explicit information and repeated exposure in the classical music condition (error bars represent the standard error).
The R2 for the classical music model was 0.16 and therefore lower than the R2 of 0.277 of the popular music model, indicating that the extrinsic factors explained more of the variance in the more familiar popular music condition.
C.3.4 Exploratory Analysis (Regression Model Tree)
In order to capture higher order interactions between extrinsic and individual difference factors and identify conditions that lead to particularly low and high ratings, we computed a regression tree model based on permutation tests as implemented in the R package “party” (Hothorn et al., 2006; Hothorn et al., 2006; Strobl et al., 2008; Strobl, et al., 2009). Statistical tree models differ in a number of ways from linear regression models (see Hastie et al., 2009) in that they use a built-in variable selection mechanism and therefore can handle large sets of predictor variables. In addition, tree models do not assume a linear relationship between predictors and the dependent variable and they are very useful for modelling higher-order interaction effects between predictor variables automatically. For this study we used a particular family of tree models called conditional inference trees that combine the
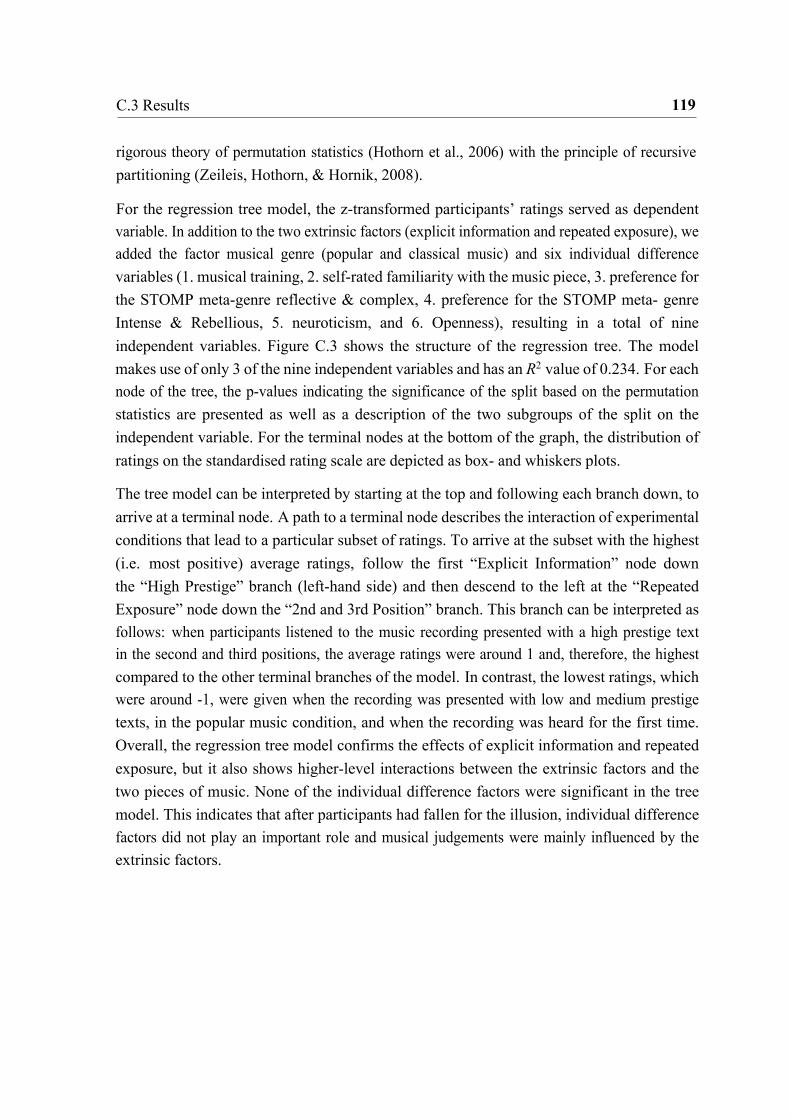
119 C.3 Results
rigorous theory of permutation statistics (Hothorn et al., 2006) with the principle of recursive partitioning (Zeileis, Hothorn, & Hornik, 2008).
For the regression tree model, the z-transformed participants’ ratings served as dependent variable. In addition to the two extrinsic factors (explicit information and repeated exposure), we added the factor musical genre (popular and classical music) and six individual difference variables (1. musical training, 2. self-rated familiarity with the music piece, 3. preference for the STOMP meta-genre reflective & complex, 4. preference for the STOMP meta- genre Intense & Rebellious, 5. neuroticism, and 6. Openness), resulting in a total of nine independent variables. Figure C.3 shows the structure of the regression tree. The model makes use of only 3 of the nine independent variables and has an R2 value of 0.234. For each node of the tree, the p-values indicating the significance of the split based on the permutation statistics are presented as well as a description of the two subgroups of the split on the independent variable. For the terminal nodes at the bottom of the graph, the distribution of ratings on the standardised rating scale are depicted as box- and whiskers plots.
The tree model can be interpreted by starting at the top and following each branch down, to arrive at a terminal node. A path to a terminal node describes the interaction of experimental conditions that lead to a particular subset of ratings. To arrive at the subset with the highest (i.e. most positive) average ratings, follow the first “Explicit Information” node down the “High Prestige” branch (left-hand side) and then descend to the left at the “Repeated Exposure” node down the “2nd and 3rd Position” branch. This branch can be interpreted as follows: when participants listened to the music recording presented with a high prestige text in the second and third positions, the average ratings were around 1 and, therefore, the highest compared to the other terminal branches of the model. In contrast, the lowest ratings, which were around -1, were given when the recording was presented with low and medium prestige texts, in the popular music condition, and when the recording was heard for the first time. Overall, the regression tree model confirms the effects of explicit information and repeated exposure, but it also shows higher-level interactions between the extrinsic factors and the two pieces of music. None of the individual difference factors were significant in the tree model. This indicates that after participants had fallen for the illusion, individual difference factors did not play an important role and musical judgements were mainly influenced by the extrinsic factors.
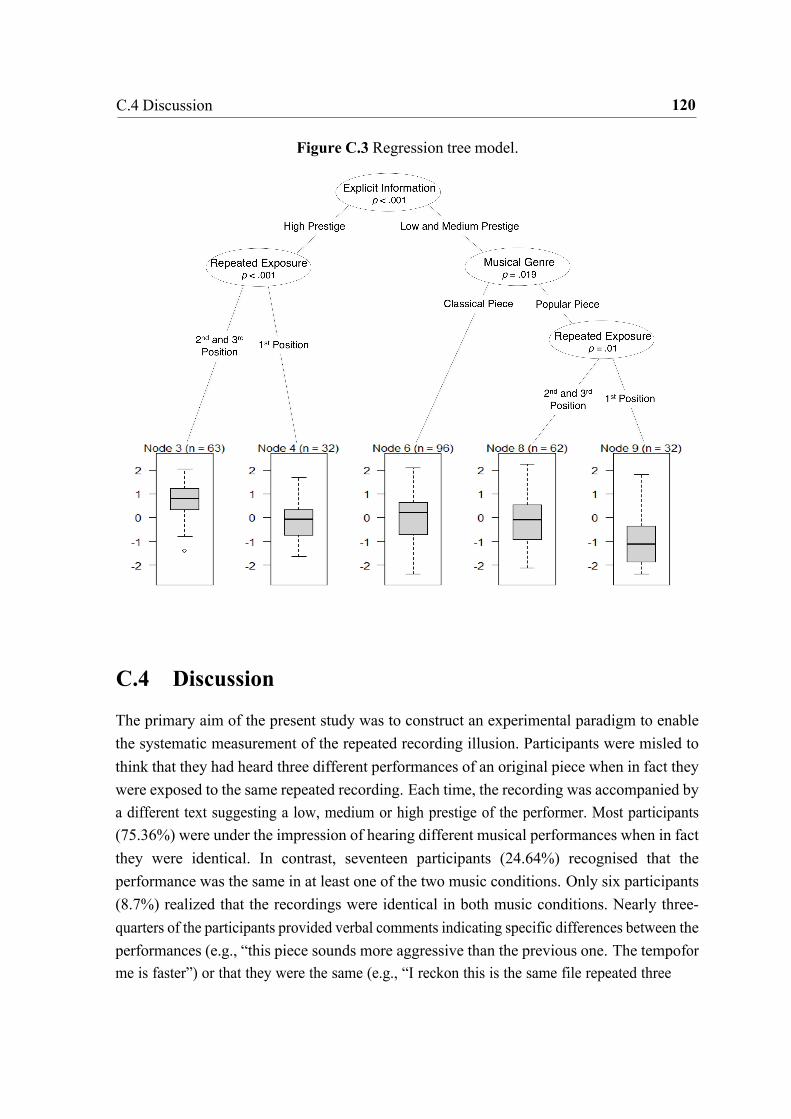
120 C.4 Discussion
Figure C.3 Regression tree model.
C.4 Discussion
The primary aim of the present study was to construct an experimental paradigm to enable the systematic measurement of the repeated recording illusion. Participants were misled to think that they had heard three different performances of an original piece when in fact they were exposed to the same repeated recording. Each time, the recording was accompanied by a different text suggesting a low, medium or high prestige of the performer. Most participants (75.36%) were under the impression of hearing different musical performances when in fact they were identical. In contrast, seventeen participants (24.64%) recognised that the performance was the same in at least one of the two music conditions. Only six participants (8.7%) realized that the recordings were identical in both music conditions. Nearly three- quarters of the participants provided verbal comments indicating specific differences between the performances (e.g., “this piece sounds more aggressive than the previous one. The tempo for me is faster”) or that they were the same (e.g., “I reckon this is the same file repeated three

121 C.4 Discussion
times”). Thus, it can be concluded that the majority of the participants fell for the repeated recording illusion. This finding suggests that musical judgements are sometimes not based on perceptual features and musical cues but are influenced by factors that do not depend on the music itself. This is at least true when a mild deception is applied and participants believe that they had heard different performances.
It could be argued that the repeated recording illusion occurs in part because participants are not familiar with the original piece of music. Therefore, we examined the illusion using two different pieces that were significantly different on familiarity, a highly familiar piece of popular music (‘Jailhouse Rock’ by Elvis Presley) and a highly unfamiliar piece of classical music (‘Bruckner’s Symphony No. 4’). The repeated recording illusion occurred similarly in the two music conditions. However, these two recordings differed substantially in several other aspects, including musical genre, complexity, length of the excerpt, presence of vocals and quality of the recording. Thus, these variables are confounded in this experimental setup. Any interpretation of differences between the two musical stimuli will have to take this into account. Further studies should explore the repeated recording illusion with a larger range of different performances and recordings.
It is important to note that there is a main methodological restriction to be considered in the experimental design used here: an implicit bias of authority figure. In other words, the fact that participants were told they would listen to ‘three different performances’ by an investigator in a lab situation may account, at least partly, for the occurrence of the illusion. It would be interesting for future research to investigate the repeated recording illusion using an experimental paradigm without any implicit bias of authority. This paradigm could consist in presenting participants with pairs of different and identical musical performances. Participants would be instructed to rate how different are the two performances using several rating scales. In the cases where the performances were identical, participants’ ratings would indicate to what extent people hear differences when listening to the same repeated recording without relying on a judgements bias excreted by a figure of authority.
The second aim of the study was to investigate possible individual difference factors that contribute to the repeated recording illusion. The most important individual difference factor related to the illusion was the personality trait of neuroticism, which is in line with previous research showing a positive (but low) link between vulnerability to suggestion and neuroticism (see Gudjonsson, 2003). This finding suggests that people who tend to be anxious, pessimistic, shy, fearful, vulnerable and emotionally unstable are more likely to fall for the repeated recording illusion. Although less important, openness to experience also was a significant factor related to the occurrence of the illusion, suggesting that people who tend

122 C.4 Discussion
to be curious, imaginative, artistic, excitable and unconventional are more likely to fall for the illusion. Importantly, none of the other individual difference factors that were expected to contribute to the illusion were significant, including musical training, suggestibility and preferences for music style. We consider particularly interesting that different levels of suggestibility (including bias to authority, consensus, persuadabiliy and social desirability) were not related with the occurrence of the illusion. Moreover, in our sample of participants, highly trained musicians were not any more or any less susceptible to the repeated recording illusion than participants with low levels of musical training. Thus, it remains still open the question of which are the main individual differences contributing to the repeated recording illusion. For instance, what would occur when using participants with a greater range of musical training and expertise (e.g., top-level professional musicians and music critics)? Would other individual differences (e.g., intelligence, memory, perceptual abilities) be able to explain why some people fall for the illusion while others seem no be unaffected by it?
The third aim of the present research was to investigate extrinsic factors responsible for differences in musical judgements when the acoustic input remains the same. As predicted, we found that the effect of explicit information contributed significantly to differences in musical judgements. This effect was clear in the two music conditions, where participants rated the same music recording significantly better when presented with a high prestige text than when presented with low and medium prestige texts. This finding is consistent with previous research on the effects of explicit information upon aesthetic reactions to music (e.g., Kroger & Margulis, 2016; Margulis, 2010; Margulis, Kisida, & Greene, 2015; North & Hargreaves, 2005). Using a similar paradigm, where identical artworks were presented with different contextual explicit information varying in prestige, Kirk et al. (2009) found that prefrontal and orbitofrontal cortices recruited by aesthetic judgements were significantly influenced by the explicit information presented with the same stimuli. We suggest that this neural system could also be responsible for the modulation of aesthetic reactions to music by explicit contextual information.
The effect of repeated exposure was only significant in the more familiar popular music condition, but not in the more unfamiliar classical music condition. This finding supports partly previous research on the effects of repeated exposure to music (North & Hargreaves, 2008 for a review). In one of the few studies using musical performances as stimuli, Kroger and Margulis (2016) found that evaluations of performances were driven by a combination of repeated exposure and the actual identity of the performer. Interestingly, in a second experiment, Kroger and Margulis (2016) found that the effect of explicit information was mitigated by the influence of the actual performer and repeated exposure, showing interplay
123 C.4 Discussion
between intrinsic and extrinsic factors. In the present study, the two original pieces of music differed in a number of important aspects. For instance, the classical piece was a minute longer than the popular piece, did not contain vocals and was highly unfamiliar to most of the participants. Furthermore, while the popular music piece was a live recording from 1968 that had a notably worse recording quality than ordinary studio recordings, the quality of the classical music piece (recorded live in 1998) was superior. Therefore, it may be possible that the effect of repeated exposure did not affect participants in the classical music condition because of the nature of the music recording. Moreover, the explicit information presented with the recordings might have had a different impact on participants in the two music conditions. Future studies will need to explore the strength of the effect of repeated exposure across a larger range of different performances and recordings.
In an attempt to explore higher-order interactions between the extrinsic and individual difference factors, we used a regression tree model in which we identified conditions that lead to particularly low and high ratings. The highest ratings were given when the music recording was presented with a high prestige text and heard in the second and third positions. In contrast, the lowest ratings were found when participants listened to the popular music piece in the first position and presented with low and medium prestige texts. Overall, the regression tree model confirmed the effects of explicit information and repeated exposure, but it also showed higher-level interactions between the extrinsic factors and the two pieces of music. None of the individual difference factors used in the model (musical training, familiarity with the original piece, music preferences, neuroticism and openness) were significant in the regression tree model. This finding suggests that after participants had fallen for the illusion, individual difference factors did not play an important role and musical judgements were mainly influenced by the extrinsic factors.
The present study focussed on extrinsic factors in order to examine differences in musical judgements when the acoustic input remains the same. Nevertheless, one could argue that the factors of explicit information and repeated exposure might also be responsible, in part, for the occurrence of the illusion. The results from a non-prestige group, where the effect of explicit information was not manipulated, indicated that 75 % participants were susceptible to the illusion. This finding suggests that the effect of explicit information is not essential for the occurrence of the illusion. By contrast, we consider it likely that the effect of repeated exposure contributes to the illusion. In an extensive investigation of repetition in musical experience, Margulis (2014) provides relevant insights to this matter. She stated that, “[a]t a minimum, a repeated element will sound different from its initial presentation by virtue of coming later and having been heard before” (Margulis, 2014, p. 35). Although in this
124 C.4 Discussion
quote Margulis refers to repetition within individual pieces of music, we find it plausible that the same principle should apply to the repeated recording illusion: while the musical input remains the same, repeated exposure modifies the listening experience, giving rise to the feeling that the performances are different.
Two relevant questions arise from the results of this study. Why are some individuals more susceptible to the illusion than others? One way to approach this question is the study of further individual difference factors (e.g. intelligence, memory, perceptual abilities) that may be associated with the repeated recording illusion. The second question refers to a more fundamental issue: did participants in this study actually perceive differences between the repetitions of the same recording? Or, alternatively, did they believe they heard differences because they were misled to think so? We encourage the use of neuroimaging techniques as one possible approach to investigate whether the illusion is a perceptual phenomenon or rather a bias in a secondary and later stage of cognitive processing and decision-making.
Taking a wider perspective, the research framework developed by Tversky and Kahneman (Kahneman & Tversky, 1984; Tversky & Kahneman, 1974; see Kahneman, 2011 for a review) could provide a theoretical framework by which the results of the current study could be interpreted. Although it does not involve music and is mainly concerned with economic decision processes, Tversky and Kahneman’s framework offers insight into how to investigate traditional psychological biases in musical judgements by using recent research on human judgements and decision-making. However, this framework has not yet been applied explicitly to the study of evaluative judgement processes involving music.
The effect of explicit information may fall within a broad heuristic principle, namely, the affect heuristic (Kahneman & Frederick, 2002; Slovic, Finucane, Peters, & MacGregor, 2002), which refers to the reliance on good or bad feelings experienced in relation to a stimulus. Thus, if the emotions associated with a stimulus are positive, people will be more likely to judge characteristics of the pertinent stimulus more positively, as found in the present study when the music recording was presented with a high prestige text. Similarly, the effect of repeated exposure is one of several mechanisms within the bias of perceptual fluency (Kahneman, 2011), which has been widely shown to influence human judgements and decision-making in many areas (see Reber, Schwarz, & Winkielman, 2004 for a review). Such findings suggest that perceptual fluency gives rise to feelings of familiarity and a positive affective response that results in an increase in preference judgements. In the present study, this is evident only when participants listened to the more familiar popular music recording.

125 C.5 References
Our results suggest that at least in certain situations, evaluations of music rely on judge- ment biases and heuristics that do not depend on the stimuli themselves, which is in line with models of decision-making and the research framework developed by Tversky and Kahneman. However, when applying Tversky and Kahneman’s framework to the study of evaluative and judgment processes involving music, one should consider the implications and difficulties of using music as stimuli (e.g., familiarity, complexity, presence of vocals, individual preferences to music, personality). This approach wherein biases in musical judgements are linked to comparable research in behavioural economics could be used to investigate and better understand musical judgements, preferences and choice behaviour. This general approach, that could be termed the behavioural economics of music, would attempt to create a solid understating of the role that behavioural economics can play in the study of musical judgements and preferences, two fields that have been surprisingly unconnected in the literature so far.
In summary, the findings of the present study show that most participants were under the impression of hearing different musical performances when in fact they were identical. This illusion occurred regardless of participants’ levels of suggestibility, musical training, and preferences for music style. However, high levels on the personality traits of neuroticism and openness made it significantly more likely that an individual would fall for the illusion. While the explicit information presented with the music influenced participants’ evaluations of music significantly, the effect of repeated exposure affected participants’ ratings only in the more familiar popular music recording. These findings support previous research showing that musical judgements are sometimes not based on musical cues and features but are influenced by factors that do not depend on the music itself. Beyond the findings and limitations of the present research, the repeated recording illusion can constitute a useful paradigm for investigating psychological biases and individual differences in aesthetic and musical judgements because the illusion allows for the study of their effects while the music remains the same.
C.5 References Bates, D., Mächler, M., Bolker, B., & Walker, S. (2015). Fitting linear mixed-effects models
using lme4. Journal of Statistical Software, 67(1), 1-48. Breiman, L. (2001). Random forests. Machine Learning, 45, 5–32. Behne, K. -E. (1987). Urteile und Vorurteile: Die Alltagsmusiktheorien jugendlicher Hörer.
In H. Motte-Haber (Ed.), Psychologische Grundlagen des Musiklernens (pp. 221-272). Kassel, DE: Bärenreiter.

126 C.5 References
Behne, K. -E., & Wöllner, C. (2011). Seeing or hearing the pianists? A synopsis of an early
audiovisual perception experiment and a replication. Musicae Scientiae, 15(3), 324-342.
Cassidy, J. W., & Sims, W. L. (1991). Effects of special education labels on peers’ and adults’ evaluations of a handicapped youth choir. Journal of Research in Music Education, 39(1), 23.
Deliege, I. (1987). Grouping conditions in listening to music: An approach to Lerdahl and Jackendoff’s grouping preference rules. Music Perception, 4(4), 325-60.
Dowling, W. J. (1978). Scale and contour: Two componenets of a theory of memory for melodies. Psychological Review, 85(4), 341-354.
Dowling, W. J., & Bartlett, J. C. (1981). The importance of interval information in long-term memory for melodies. Psychomusicology, 1, 30-49.
Duerksen, G. L. (1972). Some effects of expectation on evaluation of recorded musical performance. Journal of Research in Music Education, 20(2), 268-272.
Elliott, C. A. (1995). Race and gender as factors in judgments of musical performance. Bulletin of the Council for Research in Music Education, 127, 50-56.
Field, A. (2013). Discovering statistics using IBM SPSS statistics. London, UK: Sage. Greasley, A., & Lamont, A. (2016). Musical Preferences. In S. Hallam, I. Cross, & M. Thaut
(Eds.), Oxford handbook of music psychology (second edition) (pp. 263-281). Oxford, UK: Oxford University Press.
Griffiths, N. K. (2008). The effects of concert dress and physical appearance on perceptions of female solo performers. Musicae Scientiae, 12(2), 273-290.
Gudjonsson G.H. (2003). The psychology of interrogations and confessions: A handbook. West Sussex, UK: John Wiley & Sons.
Halpern. A. R., Bartlett, J., & Dowling, W. (1995). Aging and experience in the recognition of musical transpositions. Psychology and Aging, 10(3), 325–342.
Hastie, T., Tibshirani, R., & Friedman, J. (2009). Hierarchical Clustering. In T. Hastie, E. Tibshiran, & J. Friedman (Eds.), The elements of statistical learning: Data Mining, inference and prediction (2nd ed.) (pp. 520-528). New York, NY: Springer.
Hothorn, T., Buehlmann, P., Dudoit, S., Molinaro, A, & Van Der Laan, M. (2006). Survival ensembles. Biostatistics, 7(3), 355-373.
Hothorn, T., Hornik, K., & Zeileis, A. (2006). Unbiased recursive partitioning: A conditional inference framework. Journal of Computational and Graphical statistics, 15(3), 651- 674.
Janitza, S., Strobl, C., & Boulesteix, A. –L. (2013). An AUC-based permutation variable importance measure for random forests. BMC Bioinformatics, 14(1), 119.

127 C.5 References
John, O. P., & Srivastava, S. (1999). The Big Five trait taxonomy: History, measurement,
and theoretical perspectives. Handbook of Personality: Theory and Research, 2(510), 102-138.
Juchniewicz, J. (2008). The influence of physical movement on the perception of musical performance. Psychology of Music, 36, 417-427
Kahneman, D. (2011). Thinking, fast and slow. New York, NY: Farrar, Straus and Giroux. Kahneman, D., & Frederick, S. (2002). Representativeness revisited: Attribute substitution
in intuitive judgment. In T. Gilovich, D. Friffin, D. Kahneman (Eds.), Heuristics and biases: The psychology of intuitive thought (pp. 49-81). New York, USA: Cambridge University Press.
Kahneman, D., & Tversky, A. (1984). Choices, values, and frames. American psychologist, 39(4), 341.
Kaptein, M., De Ruyter, B., Markopoulos, P., & Aarts, E. (2012). Adaptive persuasive systems: A study of tailored persuasive text messages to reduce snacking. ACM Transactions on Interactive Intelligent Systems, 2(2), 1-25.
Kirk, U., Skov, M., Hulme, O., Christensen, M. S., & Zeki, S. (2009). Modulation of aesthetic value by semantic context: An fMRI study. NeuroImage, 44(3), 1125-1132.
Kroger, C., & Margulis, E. H. (2016). “But they told me it was professional”: Extrinsic factors in the evaluation of musical performance. Psychology of Music, 45(1), 49-64.
Margulis, E. H. (2010). When program notes don’t help: Music descriptions and enjoyment. Psychology of Music, 38, 285-302.
Margulis, E. H. (2014). On repeat: How music plays the mind. New York, NY: Ocford University Press.
Margulis, E. H., Kisida, B., & Greene, J. P. (2015). A knowing ear: The effect of explicit information on children’s experience of a musical performance. Psychology of Music, 43(4), 596-605.
Milgram, S. (1963). Behavioral study of obedience. Journal of Abnormal Psychology, 67(4), 371–378.
Müllensiefen, D., Gingras, B., Musil, J., & Stewart, L. (2014). The musicality of non- musicians: An index for assessing musical sophistication in the general population. PloS ONE, 9(2), e89642.
North, A. C., & Hargreaves, D. J. (2005). Brief report: Labelling effects on the perceived deleterious consequences of pop music listening. Journal of Adolescence, 28(3), 433- 440.
North, A., & Hargreaves, D. (2008). The social and applied psychology of music. New York, NY: Oxford University Press.
128 C.5 References
Orsmond, G. I., & Miller, L. K. (1999). Cognitive, musical and environmental correlates of
early music instruction. Psychology of Music, 27, 18-37. Pawley, A., & Müllensiefen, D. (2012). The science of singing along: A quantitative field
study on sing-along behavior in the north of England. Music Perception, 30(2), 129–146.
Pearce, M. T. (2015). Effects on processes involved in musical appreciation. In J. P. Huston, M. Nadal, F. Mora, L. Agnati, F. Mora, & C. J. Cela-Conde (Eds.), Art, aesthetics and the brain (pp. 319-338). Oxford, UK: Oxford University Press.
Radocy, R. E. (1976). Effects of authority figure biases on changing judgments of musical events. Journal of Research in Music Education, 24(3), 119-128.
Reber, R., Schwarz, N., & Winkielman, P. (2004). Processing fluency and aesthetic pleasure: Is beauty in the perceiver’s processing experience? Personality and Social Psychology Review, 8(4), 364-382.
Rentfrow, P. J., & Gosling, S. D. (2003). The do re mi’s of everyday life: The structure and personality correlates of music preferences. Journal of Personality and Social Psychology, 84(6), 1236-1256.
Silveira, J. M., & Diaz, F. M. (2014). The effect of subtitles on listeners’ perceptions of expressivity. Psychology of Music, 42(2), 233-250.
Silvey, B. A. (2009). The effects of band labels on evaluators’ judgments of musical performance. Applications of Research in Music Education, 28(1), 47-52.
Slovic, P., Finucane, M., Peters, E., & MacGregor, D. G. (2002). Rational actors or rational fools: Implications of the affect heuristic for behavioral economics. Journal of Socio- Economics, 31(4), 329-342.
Stöber, J. (2001). The Social Desirability Scale-17 (SDS-17): Convergent validity, discrimi- nant validity, and relationship with age. European Journal of Psychological Assessment, 17(3), 222-232.
Strobl, C., Boulesteix, A. -L., Kneib, T., Augustin, T. & Zeileis, A. (2008). Conditional variable importance for random forests. BMC Bioinformatics, 9(23), 307.
Strobl, C., Malley, J., & Tutz, G. (2009). An introduction to recursive partitioning: Rationale, application, and characteristics of classification and regression trees, bagging, and random forests. Psychological Methods, 14(4), 323–348.
Tversky, A., & Kahneman, D. (1974). Judgment under uncertainty: Heuristics and biases. Science (New York, N.Y.), 185(4157), 1124-31.
Unal, P., Temizel, T. T., & Eren, P. E. (2014, May). An exploratory study on the outcomes of influence stra-tegies in mobile application recommendations. Paper presented at Pro-

129 C.5 References
ceedings of the Second International Workshop on Behavior Change Support Systems (BCSS2014). Padova, IT.
Vuoskoski, J. K., & Eerola, T. (2013). Extramusical information contributes to emotions induced by music. Psychology of Music, 43(2), 262–274.
Zajonc, R. B. (1968). Attitudinal effects of mere exposure. Journal of Personality and Social Psychology, 9 (2p2), 1-27.
Zeileis, A., Hothorn, T., & Hornik, K. (2008). Model-based recursive partitioning. Journal of Computational and Graphical Statistics, 17(2), 492-514.
Appendix D False memories in music listening (S4)
This is an Accepted Manuscript of an article published by Taylor & Francis2 in Memory on 4th November 2018, available online: https://doi.org/10.1080/09658211.2018.1545858. The paper is not the copy of the record and may not exactly replicate the authoritative document published in the journal. For presentation in this thesis, the appendices of the paper have been removed and the passages referring to each Appendix in the text modified to indicate where to find the materials online. Moreover, there may be minor modifications in the text to guarantee a consistent typographic style throughout the thesis, such as the position of figures and tables. Please do not copy or cite without author’s permission. Citation Anglada-Tort, M., Baker, T., & Müllensiefen, D. (2019). False memories in music listening: exploring the misinformation effect and individual difference factors in auditory memory. Memory, 27(5), 612-627. DOI: https://doi.org/10.1080/09658211.2018.1545858
Author contribution I conceived the idea of this project and supervised it along with Prof. Dr. Daniel Müllensiefen (Goldsmiths, University of London). The study was conducted and developed by Thomas Baker as part of his master thesis in the MSc in Music, Mind, and Brain, at Goldsmiths, University of London (2017-2018). After Thomas completed his masters, I reanalysed the data and wrote the paper for publication.
2 The paper is deposited under the terms of the Creative Commons Attribution-NonCommercial 4.0 Internatinal License (http://creativecommons.org/licenses/by-nc/4.0/), which permits non-commercial re-use, distribution, and reproduction in any medium, provided the original work is properly cited

False memories in music listening: Exploring the
misinformation effect and individual difference factors in
auditory memory
The study of false memory has had a profound impact on our understanding of how and what we remember, as shown by the misinformation paradigm (Loftus, 2005). Though misinformation effects have been demonstrated extensively within visual tasks, they have not yet been explored in the realm of non-visual auditory stimuli. Thus, the present study aimed to investigate whether post-event information can create false memories of music listening episodes. In addition, we explored individual difference factors potentially associated with false memory susceptibility in music, including age, suggestibility, personality, and musical training. In two music recognition tasks, participants (N = 151) listened to an initial music track, which unbeknownst to them was missing an instrument. They were then presented with post-event information which either suggested the presence of the missing instrument or did not. The presence of misinformation resulted in significantly poorer performance on the music recognition tasks (d = .43), suggesting the existence of false musical memories. A random forest analysis indicated that none of the individual difference factors assessed were significantly associated with misinformation susceptibility. These findings support previous research on the fallibility of human memory and demonstrate, to some extent, the generality of the misinformation effect to a non-visual auditory domain.
Keywords: : false memory, misinformation effect, auditory memory, individual differences, music listening.

132 D.1 Introduction
D.1 Introduction
To have a false memory is to recall something which did not happen (Smelser & Baltes, 2001). Motivated in part by its potentially serious implications - such as within courtroom testimonies - false memory has become one of the most widely explored topics in psychology in recent decades (see Brainerd & Reyna, 2005; Loftus, 2005; Neuschatz, Lampinen, Toglia, Payne, & Cisneros, 2017; Shaw, 2016; Scoboria et al., 2017, for reviews). From this wealth of research, it has now become clear that false memories can significantly influence our visual memory, from deteriorating the accuracy of eyewitness’ memory (Davis & Loftus, 2007; Gabbert, Memon, & Allan, 2003; Liebman et al., 2002; Weingardt, Toland, & Loftus, 1994), to creating autobiographical memories of entire events that never occurred (Bernstein & Loftus, 2009a; Hyman, Husband, & Billings, 1995; Hyman & Kleinknecht, 1999; Wade, Garry, Read, & Lindsay, 2002). Nevertheless, it remains unclear to what extent memories of non-visual auditory stimuli, such as music, may prove exceptional or congruent within the broader realm of false memory. To what extent are false musical memories consistent with findings from the visual domain? The present study addresses this question by adapting for the first time the misinformation paradigm to use music instead of visual materials.
Two of the most prominent paradigms to induce false memory in the visual domain are the misinformation paradigm (see Frenda, Nichols, & Loftus, 2011; Loftus, 2005; Pickrell, McDonald, Bernstein, & Loftus, 2016, for reviews) and the Deese-Roediger-McDermoott (DRM) paradigm (Roediger & McDermott, 1995). The misinformation paradigm typically involves three stages: experiencing an event, receiving post-event misinformation, and a memory test. Findings across studies show that after exposure to post-event misinformation, the accuracy of individuals’ memory is altered (e.g., Loftus, Miller, & Burns, 1978; Loftus & Hoffman, 1989). In the original form of the DRM paradigm, participants are presented with a list of semantically related words (e.g., bed, night, rest, awake, dream, blanket, snore, nap). These words are all related by a word known as a “lure” (e.g., sleep), which is missing in the list. When participants are then required to remember as many words from the list as possible, they usually recall the lure as frequently as they recall the other presented words (Roediger & McDermott, 1995).
To the best of our knowledge, there are only two studies in the published literature that explored false memory in music, adapting a version of the DRM paradigm using music stimuli (Curtis & Bharucha, 2009; Vuvan, Podolak, & Schmuckler, 2014). In both studies, participants heard a melody followed by a test tone and were asked to indicate whether they had heard the test tone in the previously presented melody. Findings in both studies showed that participants were more likely to falsely remember context-congruent tones than
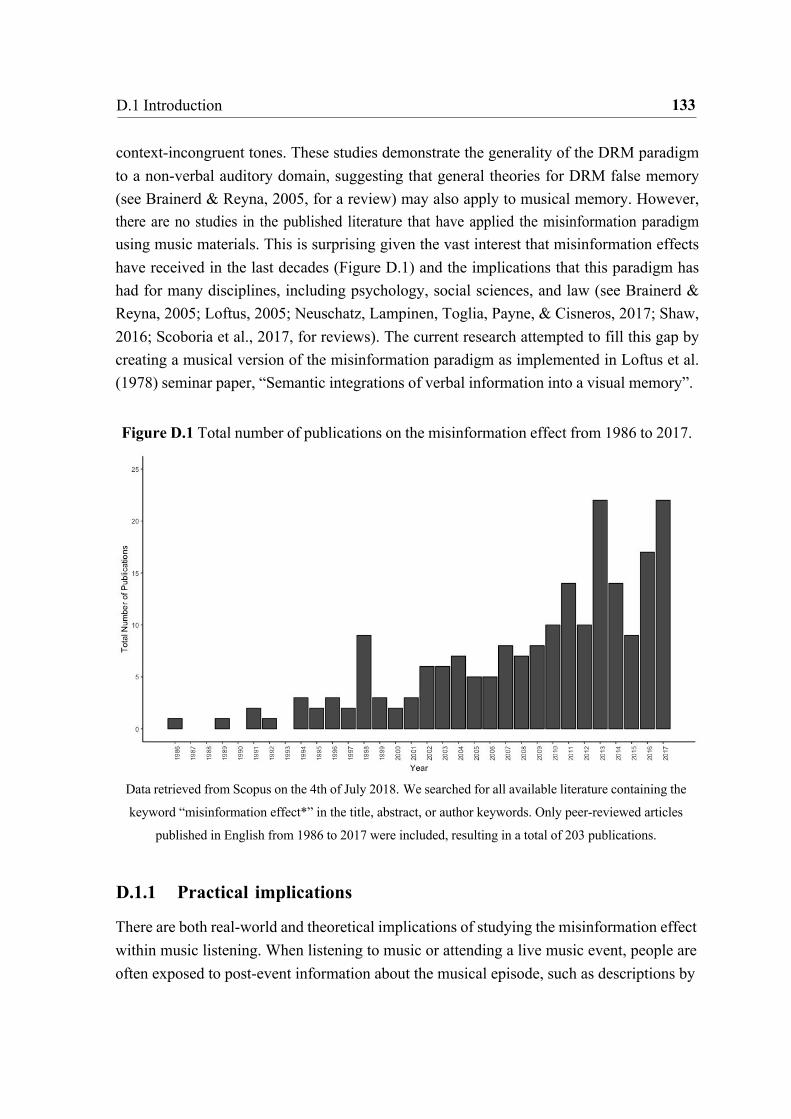
133 D.1 Introduction
context-incongruent tones. These studies demonstrate the generality of the DRM paradigm to a non-verbal auditory domain, suggesting that general theories for DRM false memory (see Brainerd & Reyna, 2005, for a review) may also apply to musical memory. However, there are no studies in the published literature that have applied the misinformation paradigm using music materials. This is surprising given the vast interest that misinformation effects have received in the last decades (Figure D.1) and the implications that this paradigm has had for many disciplines, including psychology, social sciences, and law (see Brainerd & Reyna, 2005; Loftus, 2005; Neuschatz, Lampinen, Toglia, Payne, & Cisneros, 2017; Shaw, 2016; Scoboria et al., 2017, for reviews). The current research attempted to fill this gap by creating a musical version of the misinformation paradigm as implemented in Loftus et al. (1978) seminar paper, “Semantic integrations of verbal information into a visual memory”.
Figure D.1 Total number of publications on the misinformation effect from 1986 to 2017.
Data retrieved from Scopus on the 4th of July 2018. We searched for all available literature containing the
keyword “misinformation effect*” in the title, abstract, or author keywords. Only peer-reviewed articles
published in English from 1986 to 2017 were included, resulting in a total of 203 publications.
D.1.1 Practical implications
There are both real-world and theoretical implications of studying the misinformation effect within music listening. When listening to music or attending a live music event, people are often exposed to post-event information about the musical episode, such as descriptions by

134 D.1 Introduction
peers, reports and reviews from concerts, or judgments from music auditions and competi- tions. In these situations, exposure to post-event misinformation could have an impact on listeners’ attitudes and behaviours towards music, influencing their preferences, taste, and habits. Evidence for this assumption comes from research on food preferences. For instance, suggesting to people that they had previously become ill after eating a certain food (e.g., boiled eggs or pickles) affects how much of that food the person consumes in the present (Bernstein & Loftus, 2009b; Bernstein, Laney, Morris, & Loftus, 2005; Bernstein, Scoboria, & Arnold, 2015). Interestingly, this influence in the individual’s current behaviour towards food can be reversed if the information suggests, instead, that he or she previously “loved” the food in question, increasing their current preference and consumption.
Under examination situations or competitions, music performances are often evaluated from memory. The outcome of these evaluative processes can be decisive for a musician’s career, determining, for example, whether a student is accepted in a prestigious music university or awarded in a competition situation. The Queen Elisabeth Musical Competition is one of the most well-known international competitions for violin and piano, considered among the most demanding in the world. Members of the examination board include some of the worlds’ greatest musicians, teachers, and music critics (Flôres & Ginsburgh, 1996). To win this competition would significantly change a musicians’ future career. In the first two stages of the competition, the members of the jury listen to a number of different performances each day. It is only at the end of the day that the jury provide the final scores of the witnessed candidates. These evaluations reduce the total number of musicians to the final list of candidates. In the last stage of the competition, the jury listens to two candidates per day. Again, it is only at the end of each day that the jury provides their final scores. The grades are given without any discussion between judges and cannot be changed (Flôres & Ginsburgh, 1996; see Delhasse, 1985, for further information about the working of the competition). Thus, it is likely that the evaluative process in this and similar music competitions is susceptible to post-event misinformation.
There are even court cases where misinformation about music events might be influential, such as court decisions on music plagiarism. In the context of western pop music, melodic plagiarism has been a passionately debated phenomenon (Fruehwald, 1992; Müllensiefen & Pendzich, 2009), often because of the royalties gained from author’s rights. In these cases, the goal of the courts and the Copyright Office is to judge whether the melodic material of two musical pieces (an original copyrighted piece and another performance by a different artist) is sufficiently similar or not. Although in most plagiarism cases there are music recordings that can be listened to repeatedly, there are also situations where recordings are not available.
135 D.1 Introduction
Thus, the evidence brought to court may instead simply rely on the memory of those who have attended concert performances from where music is alleged to have been plagiarised. For example, former Thin Lizzy guitarist Gary Moore had to pay damages after performing a guitar solo on a recording considered to be plagiarised from a song written by the German band Jud’s Gallery in 1974. This was even though the Jud’s Gallery song was not available on record at the time of Gary Moore’s recording (Graham, 2008). During court proceedings, Gary Moore was shown to be present at concert performances where the song was played, and it was argued that post-hoc information could have distorted his musical memory.
D.1.2 Theoretical implications
Beyond these implications, a musical version of the misinformation paradigm could provide valuable insights into the malleable nature of long-term representations of music. For in- stance, it could shed light on the interplay between abstract structure and surface features, the two types of musical information that people rely on when remembering music (Halpern & Müllensiefen, 2008; Peretz, Gaudreau, & Bonnel, 1998; Peretz & Zatorre, 2005; Schel- lenberg, Stalinski, & Marks, 2014; Trainor, Wu, & Tsang, 2004). A person’s ability to remember music relies, to some extent, on surfaces features of the music. This includes the exact key (pitch level), precise tempo (speed), and timbre (the instrument on which the melody is performed). Nevertheless, the abstract structure of the music also plays an important role, including the relative pitch patterns (i.e., the pitch distance between tones regardless of their absolute pitch), relative durations (i.e., the ratios between durations of subsequent notes regardless of their absolute length), and contour (i.e., the sequence of ups and downs in a melody regardless of interval size). When processing the abstract structure of a given piece of music, listeners’ commonly disregard surface characteristics. This is why people can effortlessly recognise “Happy Birthday” when played at almost any tempo, on any instrument, and sung at any pitch.
Based on this, one could expect misinformation effects to be likely in music listening: while a general abstract representation of the music piece may remain intact, specific perceptual features may be easily altered after exposure to post-event misinformation. However, we know that listeners (even when musically untrained) can remember the precise key, tempo, and timbre of familiar and unfamiliar music (Halpern & Müllensiefen, 2008; Levitin, 1994; Levitin & Cook, 1996; Poulin-Charronnat et al., 2004). These studies show that changes in these surface features significantly impair listeners’ ability to recognise music. Thus, it re- mains unclear to what degree perceived surface features will be susceptible to misinformation effects.
136 D.1 Introduction
Another important reason to study the misinformation paradigm within music listening tasks is to demonstrate the generality of the misinformation effect to the non-visual auditory domain, including theoretical accounts of false memory and general principles of memory. At a general level, the existence of misinformation effects in music could indicate that Bartlett’s (1932) view on the reconstructive nature of memory and schema-based effects (see Alba & Hasher, 1983, for a review) also applies to memory for music. That is, musical events are not stored in memory like songs on a CD. Instead, musical events are reconstructed from memory using available schemata and knowledge structures. But demonstrating misinformation effects in music could also allow us to test and generalise more specific accounts of false memory to the music domain, such as the source-monitoring framework (SMF; Johnson, Hashtroudi, & Lindsay, 1993; Johnson & Raye, 2000), or fuzzy trace theory (FTT; Brainerd & Reyna, 2002; Reyna & Brainerd, 1995). Today, the extent to which these and other theoretical accounts of false memory apply to the music domain is largely unknown.
D.1.3 Individual differences
Finally, a musical version of the misinformation paradigm could constitute a suitable individ- ual difference test to study listeners’ susceptibility to false musical memories. In fact, this paradigm has been repeatedly used to examine individual differences and memory distortion using visual materials, showing that not everyone is equally susceptible to false memory (see Eisen, Winograd, & Qin, 2002; Loftus, 2005; Zhu et al., 2010, for reviews). The present study focused on four individual difference aspects that could be potentially associated with misinformation susceptibility in music, namely, age, personality, suggestibility, and musical training.
Firstly, there is evidence indicating that age matters. In general, young children and the elderly are more susceptible to misinformation effects than adolescents and adults (Davis & Loftus, 2005; see Wylie et al., 2014, for a review). Secondly, studies have identified associations between particular personality traits and false memory. For example, introverts are more likely to be affected by false memories than extroverts (Loftus, 2005; Porter, Birt, Yuille, & Lehman, 2000; Ward & Loftus, 1985), although this relationship was not supported by Liebman et al. (2002), who instead found associations between neuroticism and false memory occurrence. Even though findings on the relationship between personality variables and false memory are not always consistent, personality traits may be useful to increase our understanding of the processes underlying memory distortion (Frenda, Nichols, & Loftus, 2011). The third individual difference factor is suggestibility, which has also been linked to susceptibility to false memory. For example, false memory was positively associated with

137 D.1 Introduction
measures of social desirability (Tousignant, 1983, as cited in Schooler & Loftus, 1993) and hypnotisability (e.g., Barnier & McConkey, 1992). Though potential associations between false memory and these three individual differences (age, personality, and suggestibility) have been demonstrated in past research (see Eisen et al., 2002; Loftus, 2005; Zhu et al., 2010, for reviews), the links between these individual differences and false memory in music have not yet been explored.
Musical training is another individual difference factor that could potentially mediate listeners’ performance in a musical version of the misinformation paradigm. Traditionally, studies on musical memory have compared two groups of participants varying in their level of musical expertise (see Talami, Altoè, Carreti, & Grassi, 2017, for a review): musicians (i.e., participants with expertise playing a musical instrument, determined by the number of years of musical training or attendance to music conservatories or music schools) and nonmusicians (i.e., participants with little or no experience of playing a musical instrument). Using music stimuli (e.g., tones, chords, melodies), there is evidence indicating a superiority of musicians over nonmusicians in short-term memory tasks (Bidelman, Hutka, & Moreona, 2013; Monahan, Kendall, & Carterette, 1987; Pallesen et al., 2010; Williamson, Baddeley, & Hitch, 2010) and working memory tasks (Pallesen et al., 2010; Schulze, Mueller, & Koelsch, 2011). However, in the domain of long-term memory the evidence is less consistent. Cohen, Evans, Horowitz, and Wolfe (2011) and Weiss, Vanzella, Schellenberg, and Trehub (2015) found empirical evidence suggesting that musicians long-term memory for melodies is superior to nonmusicians, whereas Schiavio and Timmers (2016) found no differences between these two groups. The paradigm used in the current study can shed light on this issue by examining whether high levels of musical training reduce susceptibility to misinformation in music recognition tasks. In this study, musical training is measured on metrical scales and, therefore, it overcomes the traditional musician vs. nonmusician dichotomy.
D.1.4 Aims
The main aim of the present study was to investigate whether false memories can be induced within music listening tasks through the misinformation paradigm. As false memory has been consistently demonstrated within a wide range of visual scenarios (e.g., Brainerd & Reyna, 2002; Brainerd & Reyna, 2005; Liebman et al., 2002; Loftus, 2005; Neuschatz et al., 2017; Scoboria et al., 2017), it was hypothesised that participants will demonstrate susceptibility to false memories in music listening tasks when presented with misinformation. The second aim of the current research was to explore potential individual difference factors related to misinformation susceptibility in music listening. Although this second analysis was
138 D.2 Methods
exploratory in nature, we had three hypotheses: (i) older participants will be more affected by post-event misinformation, (ii) suggestibility will be positively correlated with the effect of misinformation, (iii) and participants with more musical training will demonstrate less misinformation susceptibility. The assessment of the different measurements of personality traits and their potential to predict false memory occurrence was only exploratory within this study and no hypotheses were presented.
D.2 Methods
D.2.1 Participants
A sample of 151 participants took part in the experiment. Of those, 143 disclosed their gender (80 female, 63 male) and age, ranging from 18 to 63 (M = 31.04, SD = 8.10). A total of 93 participants were allocated to the misinformation group and a total of 58 participants were allocated to the control group. Participants’ mean score in the Gold-MSI musical training factor (Müllensiefen, Gingras, Musil, & Stewart, 2014) was 25.42 (SD = 11.36), which indicates an overall average level of musical training, corresponding to the 44th percentile of the data norms reported in Müllensiefen et al. (2014). In the misinformation group, 88 participants disclosed their gender (49 female, 39 male) and age, ranging from ages 21-63 (M = 33, SD = 8.27). In the control group, 55 participants disclosed their gender (31 female, 24 male) and age, ranging from ages 18-49 (M = 27.87, SD = 6.77). Participation was on a voluntary basis and was unpaid.
An a-priori power analysis using an F-test for mixed within- and between-participants designs, with two groups (misinformation vs. control) and eight within-participant measurements (the total number of critical pairs), indicated a total sample size of at least 114 participants was necessary to detect a significant main effect of misinformation. Based on the estimated effect size from the results reported in Experiment 5 by Loftus et al. (1978), we set the effect size to .20.
D.2.2 Design
The present study used a mixed within- and between-participants design. The within- participant variables were the type of clip (critical vs. noncritical clips), music piece (Bebop Jazz vs. Cool Jazz), and timbral manipulation (piano vs. drums). The between-participant variable was the presence of misinformation (misinformation vs. control group). The experiment had two parts. In each part, participants listened to and were tested on one

139 D.2 Methods
of the two music pieces, which unbeknownst to them was missing an instrument (either piano or drums). The second part of the experiment used exactly the same procedure as the first, but altered the music piece and instrumental manipulation. Thus, all participants were tested two times, using two different music pieces and instrumental manipulations. The order of presentation of the two pieces of music and the instrumental manipulation was fully counterbalanced across participants.
Constructing an adapted musical version of the misinformation paradigm
The experimental design used in our study was inspired by Experiments 5 from Loftus et al. (1978), where participants were first shown a series of 20 slides depicting an auto-pedestrian accident: “A male pedestrian is seen carrying some items in one hand and munching on an apple held with the other. He leaves a building and strolls toward a parking lot. In the lot, a maroon Triumph backs out of a parking space and hits the pedestrian” (pp. 28-29). Four of the 20 slides were critical. Each version of the critical slides contained a particular object (“a pair of skis leaning against a tree”), whereas the other version contained the same identical slide with a changed detail (“a shovel leaning against a tree”). Participants only saw one version of the critical slides. Following a series of filler activities for approximately 10 minutes, participants read a three-paragraph description of the event. The description contained four critical sentences that either did or did not mention the incorrect critical objects (e.g., “if the participant had seen skis leaning against a tree, the statement might include a sentence that mentioned the shovel leaning against the three). After another filler task of 10 min approximately, participants were given a two forced-choice recognition test, where they had to indicate which of the two slides on each pair was seen before. The test had an overall of 10 pairs of slides. Four of the 10 pairs were critical, containing a slide depicting the event as it corresponded with the incorrect information and another slide depicting the actual event. The authors found that the percentage of times a correct selection occurred was significantly lower (55.3%) when the information was misleading than when it was not (70.8%). This difference was statistically significant (Loftus et al., 1078).
The main challenge of constructing an adapted musical version of this paradigm was to use music stimuli instead of visual. In the exposure stage, instead of seeing 20 slides depicting an auto-pedestrian accident, participants listened to an instrumental piece of jazz music, which unbeknownst to them was missing an instrument, either piano or drums. Instead of manipulating 4 critical pieces of information, we only manipulated one: the presence or absence of an instrument (piano or drums). While the visual presentation of 20 different slides allowed for different manipulations of critical information, the auditory presentation
140 D.2 Methods
of a single piece of music did not. In the post-event information stage, participants read a descriptive text with a single critical piece of information, which could either suggest the presence of the missing instrument or did not. Finally, we tested participants using a two forced-choice recognition task analogous to Loftus et al. (1978). On this recognition task, participants had to decide which clip of the pair would correspond to the original recording they had heard. Four of the 10 pairs of clips were critical, containing a clip from the original track missing the target instrument (correct response) and a clip from the original track containing the target instrument (incorrect response). The order of presentation of the 10 trials as well as the order of presentation of the two clips within each trial was randomised for each participant.
D.2.3 Materials
Music stimuli
Two core tracks were used from the MedleyDB database (Bittner et al., 2014) by the artist “Music Delta”, namely the track “Bebop Jazz”, and the track “Cool Jazz”. MedleyDB is a dataset of annotated, royalty-free multitrack recordings, which were curated primarily to support music research (Bittner et al., 2014). Both tracks were instrumental jazz pieces, similar in style and using the same instrumentation. The original complete tracks both featured a drum set, a double bass, a piano, and a brass section. The original version of “Bebop Jazz” was 1 minute 43 seconds in length, and the original version of “Cool Jazz” was 1 minute 42 second in length. Alternative mixes were created using the Ableton Live software featuring the core tracks either without drums or without piano (all other instruments and attributes remained the same). Each track was then shortened to 60 seconds, featuring 50 seconds of the original track from the start, and then a gradual 10-second fade out. In addition, we used a third track from the MedleyDB database called “Fusion Jazz”. This track was also an instrumental jazz track featuring drum set and saxophone, though it also featured electric bass, electric piano and synthesizer (rather than only acoustic instruments), creating a clear distinction with the original tracks.
To create the testing stimuli, the original and alternative mixes were used along with the third track to create three types of pairs of clips: (i) critical pairs (i.e., a clip from the original track either missing piano or drums and a clip from the same original track including the suggested target instrument), (ii) noncritical-brass pairs (i.e., a clip from the original track either missing piano or drums and a clip from the same original track missing the target instrument as well as an additional instrument, namely, the brass section), and (iii) noncritical-easy pairs (i.e., a clip from the original track missing piano or drums and a clip from a different hitherto

141 D.2 Methods
unheard but stylistically similar track). The critical clips were used to measure the effect of post-event information on memory, whereas the noncritical clips were used to measure memory performance in the absence of misinformation. For each track and instrument condition, there was a total of 10 pairs of clips: four critical and six noncritical pairs (three noncritical-brass and three noncritical-easy pairs).
Post-event information
Descriptive texts consisting of a single paragraph of information on the original track were created. Except for the instrumentation referenced - which was incorrect only for the misinformation group - this text was wholly accurate and was identical across conditions. To increase credibility, the paragraph also included a web citation, pointing to the Music Delta website. To ensure that participants read the post-event information, a sentence from the descriptive text was copied at the bottom of the survey page, with a blank space instead of one of the words for the participant to fill in and show they had read the text (see Appendix A, in the paper published online, for the descriptive texts of all conditions, including the fill-in-the-blank sentence).
Individual difference factors
A variety of self-reporting questionnaires were used to measure individual difference factors. The Goldsmiths Musical Sophistication Index (Gold-MSI; Müllensiefen et al., 2014), a mea- surement instrument used to assess musical skills in the general population. The dimensions of musical sophistication measured by the Gold-MSI are (1) Active Engagement, Perceptual Abilities, Musical Training, Emotion, Singing Abilities, and General Musical Sophistication. Eight items from the Susceptibility to Persuade Strategies Scale (STPS; Kaptein, De Ruyter, Markopoulos, & Aarts, 2012; Eren, Unal & Temizel, 2014) that provide a measurement of general suggestibility in relation to two of the six persuasion principles identified by Cialdini (2001), namely, bias to authority and consensus. The Social Desirability Scale-17 (SDS-17; Stöber, 1999, 2001), which captures the tendency for individuals to self-describe with socially desirable attributes, as per Paulhus’ impression management construct (1986).The Big Five Inventory (BFI; John & Srivastava, 1999), which measures an individual on the Big Five Dimensions of personality defined by Goldberg (1993), namely, Extraversion, Introversion, Agreeableness, Conscientiousness, Neuroticism, and Openness. And the Revised Short Test of Music Preference (STOMP-R; Rentfrow & Gosling, 2003), measuring music preferences across 23 genres, which represent four higher-order dimensions of music preference. These four dimensions of music preference are named Intense and Rebellious, Upbeat and Conven-
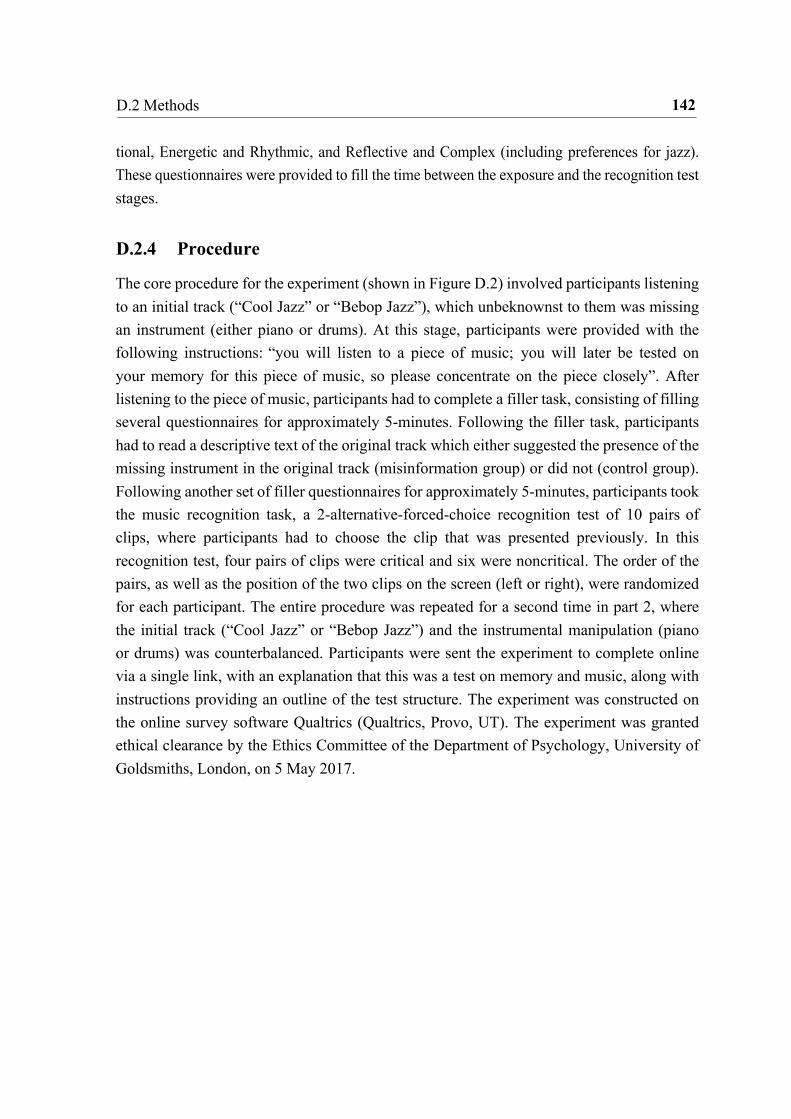
142 D.2 Methods
tional, Energetic and Rhythmic, and Reflective and Complex (including preferences for jazz). These questionnaires were provided to fill the time between the exposure and the recognition test stages.
D.2.4 Procedure
The core procedure for the experiment (shown in Figure D.2) involved participants listening to an initial track (“Cool Jazz” or “Bebop Jazz”), which unbeknownst to them was missing an instrument (either piano or drums). At this stage, participants were provided with the following instructions: “you will listen to a piece of music; you will later be tested on your memory for this piece of music, so please concentrate on the piece closely”. After listening to the piece of music, participants had to complete a filler task, consisting of filling several questionnaires for approximately 5-minutes. Following the filler task, participants had to read a descriptive text of the original track which either suggested the presence of the missing instrument in the original track (misinformation group) or did not (control group). Following another set of filler questionnaires for approximately 5-minutes, participants took the music recognition task, a 2-alternative-forced-choice recognition test of 10 pairs of clips, where participants had to choose the clip that was presented previously. In this recognition test, four pairs of clips were critical and six were noncritical. The order of the pairs, as well as the position of the two clips on the screen (left or right), were randomized for each participant. The entire procedure was repeated for a second time in part 2, where the initial track (“Cool Jazz” or “Bebop Jazz”) and the instrumental manipulation (piano or drums) was counterbalanced. Participants were sent the experiment to complete online via a single link, with an explanation that this was a test on memory and music, along with instructions providing an outline of the test structure. The experiment was constructed on the online survey software Qualtrics (Qualtrics, Provo, UT). The experiment was granted ethical clearance by the Ethics Committee of the Department of Psychology, University of Goldsmiths, London, on 5 May 2017.
143 D.2 Methods
Figure D.2 Diagram of the misinformation paradigm procedure used in the experiment.
The entire procedure was repeated once after a brief break, using a new track as well as a different instrumental
manipulation (drums or piano).
D.2.5 Statistical analysis
Three participants were excluded from the subsequent analysis because they scored 0% in either the noncritical-easy clips or the noncritical-brass clips in the two parts of the experiment, indicating that they did not understand the experimental task. The average time to complete the experiment was 105.36 minutes (SD = 342.88). Five participants took more than two standard deviations from the mean to complete the survey and were excluded, resulting on a total average time of 54 minutes (SD = 85.79). Thus, the subsequent analysis included an overall of 143 participants, 88 in the misinformation group and 55 in the control group.
Matching procedure
Because individual differences in age have been associated with the susceptibility to false memories (see Wylie et al., 2014, for a review) and individual’s musical training plays an important role in the ability to remember music (see Talami et al., 2017, for a review), we carried out a logistic regression analysis to investigate whether the two groups (misinforma- tion vs. control) differed on age and musical training. The binary dependent variable was the group, and the two predictors were age and musical training. Table 1 shows the output of
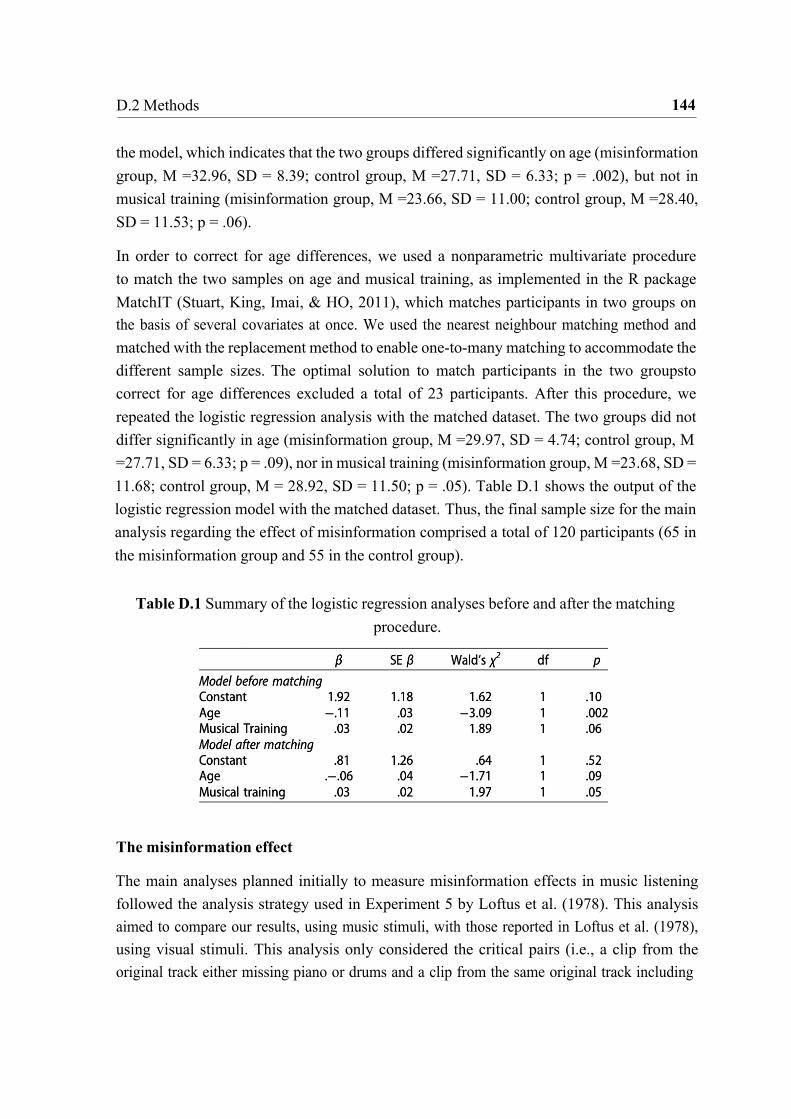
144 D.2 Methods
the model, which indicates that the two groups differed significantly on age (misinformation group, M =32.96, SD = 8.39; control group, M =27.71, SD = 6.33; p = .002), but not in musical training (misinformation group, M =23.66, SD = 11.00; control group, M =28.40, SD = 11.53; p = .06).
In order to correct for age differences, we used a nonparametric multivariate procedure to match the two samples on age and musical training, as implemented in the R package MatchIT (Stuart, King, Imai, & HO, 2011), which matches participants in two groups on the basis of several covariates at once. We used the nearest neighbour matching method and matched with the replacement method to enable one-to-many matching to accommodate the different sample sizes. The optimal solution to match participants in the two groups to correct for age differences excluded a total of 23 participants. After this procedure, we repeated the logistic regression analysis with the matched dataset. The two groups did not differ significantly in age (misinformation group, M =29.97, SD = 4.74; control group, M =27.71, SD = 6.33; p = .09), nor in musical training (misinformation group, M =23.68, SD = 11.68; control group, M = 28.92, SD = 11.50; p = .05). Table D.1 shows the output of the logistic regression model with the matched dataset. Thus, the final sample size for the main analysis regarding the effect of misinformation comprised a total of 120 participants (65 in the misinformation group and 55 in the control group).
Table D.1 Summary of the logistic regression analyses before and after the matching
procedure.
The misinformation effect
The main analyses planned initially to measure misinformation effects in music listening followed the analysis strategy used in Experiment 5 by Loftus et al. (1978). This analysis aimed to compare our results, using music stimuli, with those reported in Loftus et al. (1978), using visual stimuli. This analysis only considered the critical pairs (i.e., a clip from the original track either missing piano or drums and a clip from the same original track including
145 D.2 Methods
the suggested target instrument in the misinformation text). The dependent variable was the total number of correct and incorrect responses, collapsed across all critical pairs in the two parts of the experiment. The independent variable was the experimental group (misinformation group vs. control group). An independent t-test was employed to test for significant differences between groups. We reported effect sizes in terms of Cohen’s d because this measure can be used across several model types and is intuitively understood by most researchers. Moreover, we calculated the odds ratio to compare the effect sizes in our study and the ones reported in Loftus et al., (1978).
To expand this analysis using more advanced statistical techniques and also accounting for the timbral manipulation and different types of music clips, we performed an exploratory analysis using mixed-effects logistic regression as implemented in the R packages lme4 (Bates, Mächler, Bolker, & Walker, 2015) and car (Fox et al., 2017). Mixed-effects logistic regression models have several advantages compared to ordinary logistic regression models. They can handle missing values and binomial or non-normal distributions, do not assume independence among observations, and can work with correlated observations. Mixed-effects logistic regression can also model random variability by assuming random intercepts for different relevant factors, such as participants’ memory abilities, providing unbiased estimates of the coefficients of the predictor variables (Baayen, Davidson, & Bates, 2008; Pinheiro & Bates, 2000).
This analysis was exploratory and different combinations of predictor and outcome variables were considered. In this paper, we report what we consider the most comprehensive model, including fixed effect factors for misinformation (presence vs. absence), type of clip (critical vs. noncritical), timbral manipulation (piano vs. drums), and the interaction between misinformation and type of clip. The binary response on each pair of clips (correct or incorrect) was the dependent variable. In addition, we specified a random intercept for participants because the individual ability of the participants to perform on the recognition task contributed to the variance of the responses, inflating the overall variance of the data. The interaction term was used to study the effect of misinformation in the two types of pairs of clips, whereas the timbral manipulation factor was included to test whether memory performance was affected by the instrument under manipulation. The mixed-effects analysis was conducted using effects coding as opposed to the default treatment coding and Type-III Wald chi-square tests. The mixed-effect logistic regression model met the assumptions of linearity and normality. Collinearity was not an issue because the predictor variables were part of the orthogonal experimental design and, therefore, the association between these

146 D.2 Methods
variables was 0. In addition, there were no correlations between residuals and the error variance of the residuals did not change across the range of fitted values.
Individual differences
A person-wise dependent variable was created, using the ratio of the individual’s overall performance on the critical clips, divided by their performance on the noncritical clips. Ratio values of >1 suggested low susceptibility to false memories, whereas values of <1 indicated high susceptibility. For this analysis, we only used participants in the misinformation group, as they were the only exposed to incorrect information. We used the dataset from before the matching procedure was carried out, comprising a total of 88 participants. The subsequent analysis only includes the individual difference factors for which we had clear previous hypothesis based on the published literature (i.e., age, musical training, suggestibility, and personality; see Appendix B, in the paper published online, for a correlation matrix of the person-wise dependent variable and all 17 individual difference variables measured during the filler task phases of this study).
To examine which individual difference factors were associated with misinformation sus- ceptibility, we used a data analysis method known as random forest (Breiman, 2001), based on permutation tests, as implemented in the R package party (Hothorn, Bühlmann, Dudoit, Molinaro, & Van Der Laan, 2006; Hothorn, Hornik, & Zeileis, 2006; Strobl, Boulesteix, Kneib, Augustin, & Zeileis, 2008; Strobl, Malley, & Tutz, 2009). Compared to other classifi- cation and regression methods, random forests have several advantages, as they can handle complex interactions, large sets of predictor variables (even if they are highly correlated), and do not assume a linear relationship between predictors and dependent variable (see Hastie, Tibshirani, & Friedman, 2009). Moreover, random forest models use an in-built out-of-the-bag cross-validation mechanism that protects against alpha error inflations and overfitting.
The person-wise memory score was the dependent variable and the individual difference variables the predictors, including age, musical training, suggestibility (SPSS and SDS-17), and personality traits (i.e., Extraversion, Agreeableness, Conscientiousness, Neuroticism, and Openness). The model was run with a size of 10,000 trees. The number of randomly preselected predictor variables to be chosen in each split was 4. The R2 was calculated using the R package caret (Kuhn, 2008), which uses cross-validation and prevents model overfitting.
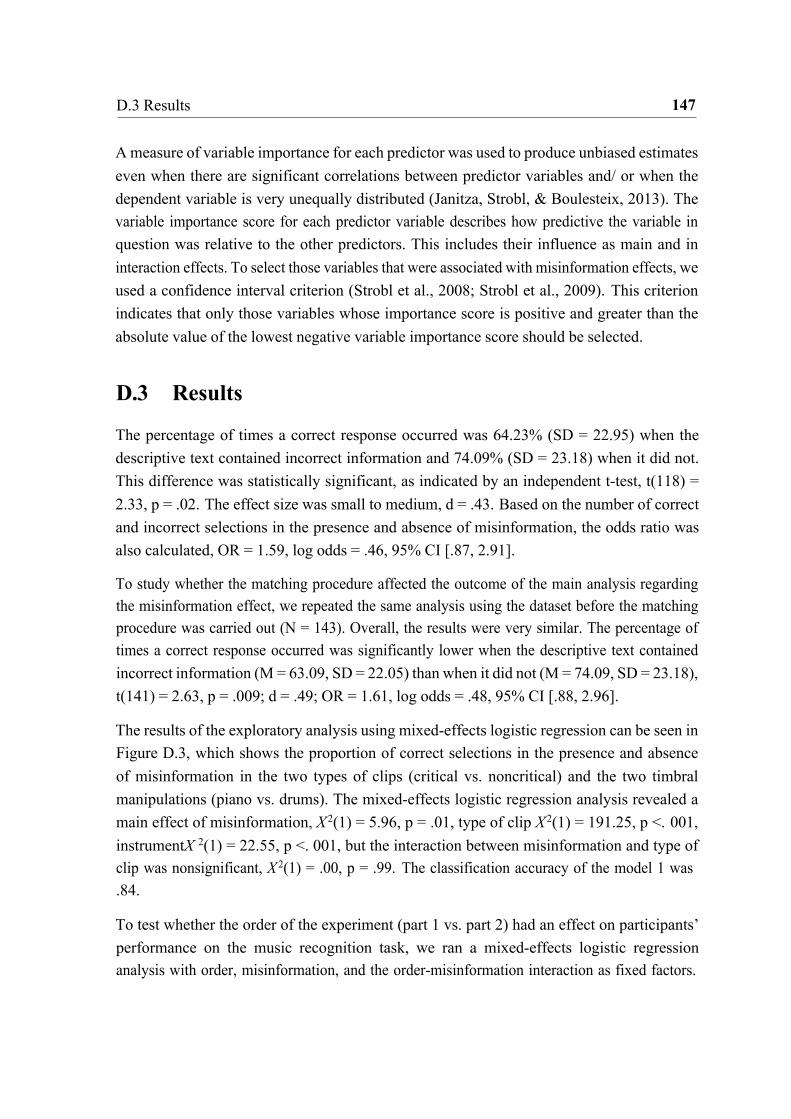
147 D.3 Results
A measure of variable importance for each predictor was used to produce unbiased estimates even when there are significant correlations between predictor variables and/ or when the dependent variable is very unequally distributed (Janitza, Strobl, & Boulesteix, 2013). The variable importance score for each predictor variable describes how predictive the variable in question was relative to the other predictors. This includes their influence as main and in interaction effects. To select those variables that were associated with misinformation effects, we used a confidence interval criterion (Strobl et al., 2008; Strobl et al., 2009). This criterion indicates that only those variables whose importance score is positive and greater than the absolute value of the lowest negative variable importance score should be selected.
D.3 Results
The percentage of times a correct response occurred was 64.23% (SD = 22.95) when the descriptive text contained incorrect information and 74.09% (SD = 23.18) when it did not. This difference was statistically significant, as indicated by an independent t-test, t(118) = 2.33, p = .02. The effect size was small to medium, d = .43. Based on the number of correct and incorrect selections in the presence and absence of misinformation, the odds ratio was also calculated, OR = 1.59, log odds = .46, 95% CI [.87, 2.91].
To study whether the matching procedure affected the outcome of the main analysis regarding the misinformation effect, we repeated the same analysis using the dataset before the matching procedure was carried out (N = 143). Overall, the results were very similar. The percentage of times a correct response occurred was significantly lower when the descriptive text contained incorrect information (M = 63.09, SD = 22.05) than when it did not (M = 74.09, SD = 23.18), t(141) = 2.63, p = .009; d = .49; OR = 1.61, log odds = .48, 95% CI [.88, 2.96].
The results of the exploratory analysis using mixed-effects logistic regression can be seen in Figure D.3, which shows the proportion of correct selections in the presence and absence of misinformation in the two types of clips (critical vs. noncritical) and the two timbral manipulations (piano vs. drums). The mixed-effects logistic regression analysis revealed a main effect of misinformation, X 2(1) = 5.96, p = .01, type of clip X 2(1) = 191.25, p <. 001, instrumentX 2(1) = 22.55, p <. 001, but the interaction between misinformation and type of clip was nonsignificant, X 2(1) = .00, p = .99. The classification accuracy of the model 1 was .84.
To test whether the order of the experiment (part 1 vs. part 2) had an effect on participants’ performance on the music recognition task, we ran a mixed-effects logistic regression analysis with order, misinformation, and the order-misinformation interaction as fixed factors.

148 D.3 Results
Participants ID was used as a random effect factor. The model indicated that the order of the experiment, clip X 2(1) = .22, p = .63, and the interaction term, clip X 2(1) = .1.32, p = .25, were nonsignificant, whereas the main effect of misinformation was significant, clip X 2(1) = 6.88, p =. 008.
Because timbral manipulation was significant we performed mixed-effect logistic regression models to study the effects of misinformation in the two timbral manipulation. In the two models, misinformation and the interaction between misinformation and type of clip were the fixed factors, whereas participants the random effect factor. The mixed-effects logistic regression model with piano indicated a main effect of misinformation, X 2(1) = 5.87, p = .01, and type of clip X 2(1) = 76.64, p <. 001, but no significant interaction between these two factors, X 2(1) = .00, p = .97. The classification accuracy of model 2 was .86. The model with drums revealed a main effect type of clip X 2(1) = 110.50, p <. 001, but misinformation, X 2(1) = 2.01, p = .16, and the interaction between these two factors, X 2(1) = .01, p = .92, were nonsignificant. The classification accuracy of model 2 was .88.
The random forests analysis revealed that none of the 9 individual difference factors were significantly associated with misinformation susceptibility. None of the positive variable importance scores were greater than the absolute value of the lowest negative variable importance score, indicating the person-wise dependent variable was not associated with any of the predictor variables. The overall R2 of the random forest model was .19.
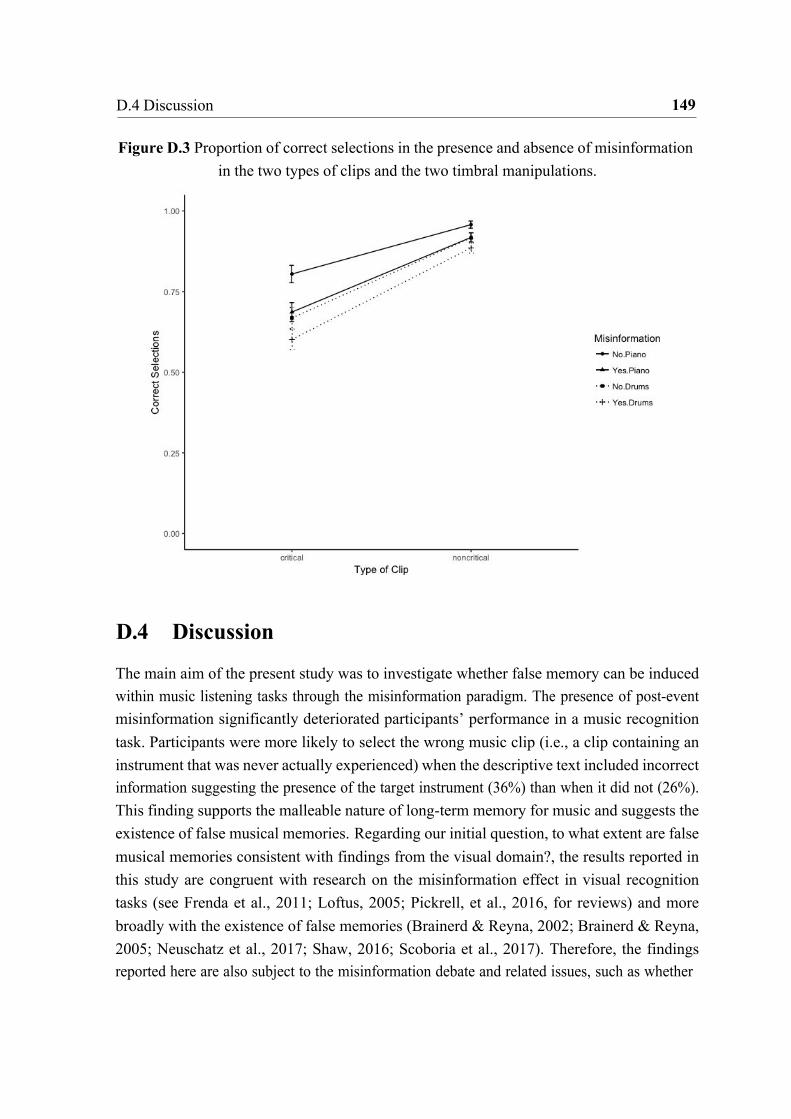
149 D.4 Discussion
Figure D.3 Proportion of correct selections in the presence and absence of misinformation in the two types of clips and the two timbral manipulations.
D.4 Discussion
The main aim of the present study was to investigate whether false memory can be induced within music listening tasks through the misinformation paradigm. The presence of post-event misinformation significantly deteriorated participants’ performance in a music recognition task. Participants were more likely to select the wrong music clip (i.e., a clip containing an instrument that was never actually experienced) when the descriptive text included incorrect information suggesting the presence of the target instrument (36%) than when it did not (26%). This finding supports the malleable nature of long-term memory for music and suggests the existence of false musical memories. Regarding our initial question, to what extent are false musical memories consistent with findings from the visual domain?, the results reported in this study are congruent with research on the misinformation effect in visual recognition tasks (see Frenda et al., 2011; Loftus, 2005; Pickrell, et al., 2016, for reviews) and more broadly with the existence of false memories (Brainerd & Reyna, 2002; Brainerd & Reyna, 2005; Neuschatz et al., 2017; Shaw, 2016; Scoboria et al., 2017). Therefore, the findings reported here are also subject to the misinformation debate and related issues, such as whether
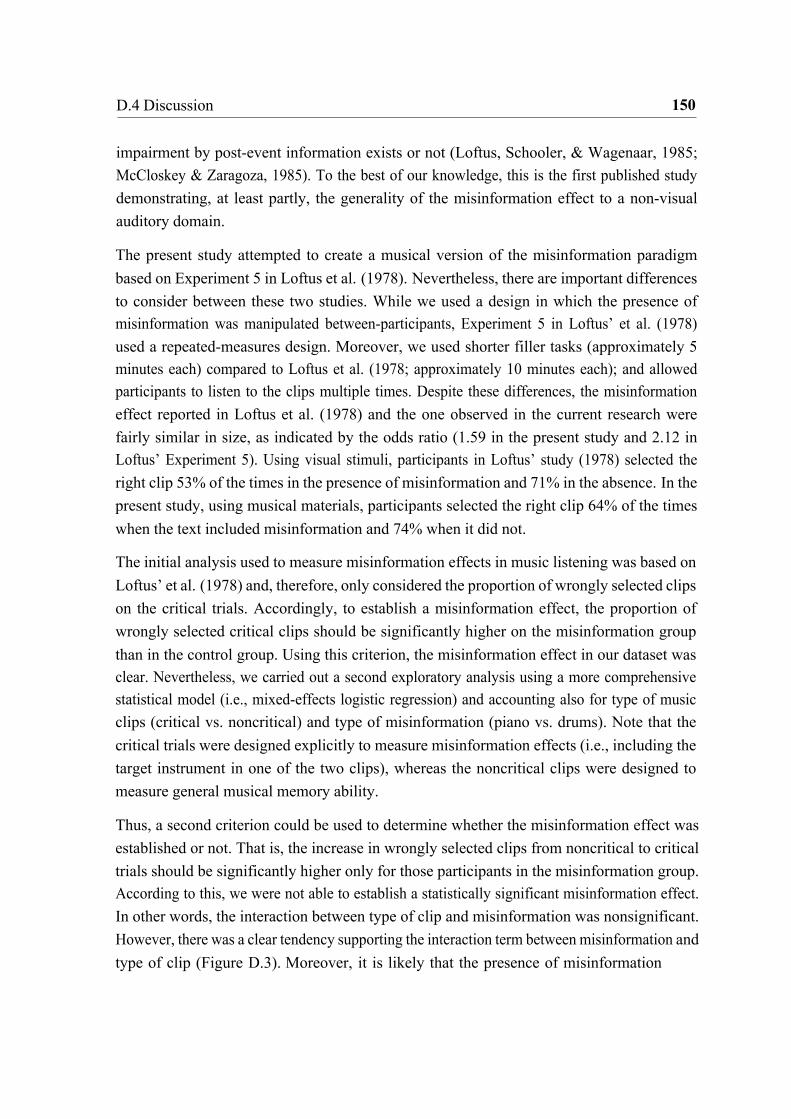
150 D.4 Discussion
impairment by post-event information exists or not (Loftus, Schooler, & Wagenaar, 1985; McCloskey & Zaragoza, 1985). To the best of our knowledge, this is the first published study demonstrating, at least partly, the generality of the misinformation effect to a non-visual auditory domain.
The present study attempted to create a musical version of the misinformation paradigm based on Experiment 5 in Loftus et al. (1978). Nevertheless, there are important differences to consider between these two studies. While we used a design in which the presence of misinformation was manipulated between-participants, Experiment 5 in Loftus’ et al. (1978) used a repeated-measures design. Moreover, we used shorter filler tasks (approximately 5 minutes each) compared to Loftus et al. (1978; approximately 10 minutes each); and allowed participants to listen to the clips multiple times. Despite these differences, the misinformation effect reported in Loftus et al. (1978) and the one observed in the current research were fairly similar in size, as indicated by the odds ratio (1.59 in the present study and 2.12 in Loftus’ Experiment 5). Using visual stimuli, participants in Loftus’ study (1978) selected the right clip 53% of the times in the presence of misinformation and 71% in the absence. In the present study, using musical materials, participants selected the right clip 64% of the times when the text included misinformation and 74% when it did not.
The initial analysis used to measure misinformation effects in music listening was based on Loftus’ et al. (1978) and, therefore, only considered the proportion of wrongly selected clips on the critical trials. Accordingly, to establish a misinformation effect, the proportion of wrongly selected critical clips should be significantly higher on the misinformation group than in the control group. Using this criterion, the misinformation effect in our dataset was clear. Nevertheless, we carried out a second exploratory analysis using a more comprehensive statistical model (i.e., mixed-effects logistic regression) and accounting also for type of music clips (critical vs. noncritical) and type of misinformation (piano vs. drums). Note that the critical trials were designed explicitly to measure misinformation effects (i.e., including the target instrument in one of the two clips), whereas the noncritical clips were designed to measure general musical memory ability.
Thus, a second criterion could be used to determine whether the misinformation effect was established or not. That is, the increase in wrongly selected clips from noncritical to critical trials should be significantly higher only for those participants in the misinformation group. According to this, we were not able to establish a statistically significant misinformation effect. In other words, the interaction between type of clip and misinformation was nonsignificant. However, there was a clear tendency supporting the interaction term between misinformation and type of clip (Figure D.3). Moreover, it is likely that the presence of misinformation
151 D.4 Discussion
increased the overall difficulty of the test only in the misinformation group, as they had to read and process counterfactual information. Thus, the interference produced by the post-event misinformation could have resulted in an overall poorer performance in both critical and noncritical pairs compared to the control group. This second analysis was only exploratory and future research could improve our design by planning this type of analysis in advance and using a measurement of general long-term memory for music in which misinformation is not confounded, such as Gordon (1989) or Harrison, Collins, and Müllensiefen (2017). We also encourage future researchers to use within-participants designs to avoid the comparison of independent groups as well as use more comprehensive analysis strategies that take the performance on critical and noncritical clips into account within the same model.
In addition, the mixed-effects logistic regression analysis also revealed a significant main effect of instrumental manipulation. Participants performed significantly better when the misinformation paradigm involved a piano manipulation than when it involved drums. To ex- plore this further we conducted two separate analyses for each instrument (piano and drums). Results indicated that misinformation regarding the presence of piano had a significant effect on participants’ performance in the recognition task, whereas misinformation suggesting the presence of drums did not. A potential explanation for this could be that drums are perceived as a louder and more prominent instrument than piano, occupying a larger range of the frequency spectrum in a recorded track. Because drums are perceptually a more obvious element to be missing or introduced into a musical piece, this timbral manipulation may be less susceptible to misinformation effects compared to a less prominent timbral manipulation, such as piano. However, this distinction on the two types of timbral manipulation did not affect the overall misinformation effect in the general model (including both piano and drums). This might be due to a clear trend supporting the misinformation effect in the drums manipulation as well (Figure D.3).
The present research focused on musical timbre and instrumentation, which has been iden- tified as a particularly important surface feature influencing the ability to remember music (Halpern & Müllensiefen, 2008; Poulin-Charronnat et al., 2004; Schellenberg & Habashi, 2015; Trainor et al., 2004). For example, research shows that participants’ long-term memory for music deteriorates significantly when the instrumentation used at the recognitions test phase does not match the one used at the learning phase (Halpern & Müllensiefen, 2008; Poulin-Charronnat et al., 2004). In addition, there is evidence that information about the key and tempo is forgotten at a faster rate than information about the timbre (Schellenberg & Habashi, 2015), with infants even retaining memory of timbre after 1 week of daily exposure to music (Trainor et al., 2004). Results from our study indicate that post-event information
152 D.4 Discussion
about instrumentation significantly interfered with the actual surface information encoded at the exposure phase.
When creating an adapted musical misinformation paradigm, there were practical reasons to manipulate timbre instead of other surface features. In order to manipulate misinformation in a given piece of music, a musical feature was required that could be addressed specifically in the post-event descriptive text and could be later scored unambiguously as correct/ incorrect in the recognition test. This is most easily done by using a categorical feature such as the presence of an instrument which most people, even without musical training, are able to identify. Extracting other types of information from a musical excerpt (e.g., key, mode, or tempo) requires special musical skills or training and would have limited our choice of participants and, therefore, the wider applicability of this study. Moreover, manipulating the presence or absence of an instrument in a piece of music is analogous to the missing objects manipulated in Loftus et al. (1978).
Nevertheless, there is a wide range of other musical aspects that could be manipulated, if these can be made congruent with the practical constraints of designing a task that does not require special musical trainings and skills. For example, the intonation accuracy of the vocalist, appropriateness of tempo, expressivity, emotionality, overall quality, and aesthetical aspects of the performance. Moreover, when creating false memories of music listening episodes, the perceived familiarity of the tracks and the jazz genre used may have played a role. Jazz music remains a relatively specialist and less popular music genre in the West, with jazz album sales accounting for only 2.1% of the total albums sold in the USA in 2014 (Nielsen, 2015). Thus, replications of this study should consider the use of a wider range of types of misinformation as well as music genres and styles in order to bolster the effects observed, and allow for a more nuanced understanding of what specific factors contribute to the fallibility of musical memory. Looking beyond misinformation there are clearly more experimental paradigms that could be employed to study false memory in music. For instance, Curtis and Bharucha (2009) and et al. (2014) studied false memories in music using an adapted version of Roediger and McDermott’s paradigm (1995). The authors found that participants falsely remembered more notes in situations where the target note was congruent with the context (more expected) than when it was incongruent (less expected).
The existence of misinformation effects in music listening situations sheds light into the nature of long-term memory for music. Our results suggest that memory for music is, to some extent, malleable and susceptible to post-event misinformation about surface features, such as timbre. Participants failed to accurately monitor the source of information, misattributing information from the musical source to the verbal one. This finding is in line with the source-

153 D.4 Discussion
monitoring framework (SMF; Johnson, Hashtroudi, & Lindsay, 1993; Johnson & Raye, 2000) and fuzzy trace theory (FTT; Brainerd & Reyna, 2002, 2004; Reyna & Brainerd, 1995). According to FTT, there are two parallel types of memory, namely, verbatim and gist. While verbatim memory represents the surface details of physical stimuli, gist memory represents the main meaning or theme. These two types of memories are encoded separately and can be retrieved independently (Brainerd & Reyna, 2002).Thus, false musical memory may have occurred because verbatim (surface features) declined faster than gist (abstract structure) and integrated with schematic-gist information (Brainerd & Reyna, 2002). Although providing a comprehensive theoretical account of the effect of misinformation in music is beyond the scope of this study, we consider that efforts in this direction are essential to demonstrate the generality of theoretical accounts of false memory and general principles of memory to the non-visual auditory domain.
Finally, the present study aimed to explore potential individual difference factors related to the susceptibility to false memories in music listening. Based on previous literature (see Eisen et al., 2002; Loftus, 2005; Talami et al., 2017; Zhu et al., 2010, for reviews), we explored the role of age, musical training, suggestibility, and personality traits. Contrary to our hypotheses, we found no evidence to support that any of these individual difference factors were significantly associated with misinformation susceptibility in music. It is important to mention, however, that this analysis was purely exploratory and one would need to devise and carefully calibrate a proper individual difference test of misinformation susceptibility in music in order to confirm and generalise these results. Moreover, we did not investigate a sample of professional musicians and this finding may change when testing individuals with greater musical expertise. However, this result is in line with Anglada-Tort and Müllensiefen (2017), who also showed that musical expertise did not have a protective effect against a musical memory illusion. It also supports Schiavio and Timmers (2016), who did not find an advantage of musicians’ long-term memory over nonmusicians.
Overall, our findings support, at least partly, previous research that post-event misinformation has a significant effect on the reliability of memory, suggesting that false memory can be induced in music listening tasks. When people listen to music or experience music in a live performance, they are normally exposed to related information at some point after the event. In our experimental setting, the presence of post-event misinformation about instrumentation impaired listeners’ ability to remember music. Participants used verbal information that was never actually experienced to reconstruct a memory of a piece of music, demonstrating the generality of the misinformation effect to the non-visual auditory domain. Furthermore, a random forest analysis indicated that the misinformation effect occurred

154 D.5 References
regardless of participants’ levels of musical training, suggestibility, age, and personality traits. The existence of misinformation effects in music listening situations has implications for any area in which musical memory is involved, including aesthetics, music education, performance evaluation, preferences for music, marketing, and advertising. We conclude that memory for non-visual auditory stimuli can be fallible and the extent to which humans can memorise and remember music reliably should be, at least, questioned and further investigated.
D.5 References Alba, J. W., & Hasher, L. (1983). Is memory schematic? Psychological Bulletin, 93, 203-231. Anglada-Tort, M., & Müllensiefen, D. (2017). The repeated recording illusion: The effects
of extrinsic and individual difference factors on musical judgements. Music Perception: An Interdisciplinary Journal, 35(1), 92-115.
Bates, D., Mächler, M., Bolker, B., & Walker, S. (2015). Fitting linear mixed-effects models using lme4. Journal of Statistical Software, 67(1), 1-48.
Baayen, R. H., Davidson, D. J., & Bates, D. M. (2008). Mixed-effects modeling with crossed random effects for subjects and items. Journal of memory and language, 59(4), 390-412.
Bartlett, F. C. (1932). Remembering: A study in experimental and social psychology. Cambridge: Cambridge University Press.
Barnier, A. J., & McConkey, K. M. (1992). Reports of real and false memories: The relevance of hypnosis, hypnotizability, and context of memory test. Journal of Abnormal Psychology, 101(3), 521.
Bernstein, D., & Loftus, E. F. (2009a). How to tell if a particular memory is true or false. Perspectives on Psychological Science, 4, 370–374.
Bernstein, D. M., & Loftus, E. F. (2009b). The consequences of false memories for food preferences and choices. Perspectives on Psychological Science, 4(2), 135-139.
Bernstein, D. M., Laney, C., Morris, E. K., & Loftus, E. F. (2005). False memories about food can lead to food avoidance. Social Cognition, 23(1), 11-34.
Bernstein, D., Scoboria, A., & Arnold, R. (2015). The consequences of suggesting false childhood food events. Acta Psychologica, 156, 1–7.
Brainerd, C. J., & Reyna, V. F. (2002). Fuzzy-trace theory and false memory. Current Directions in Psychological Science, 11(5), 164-169.
Brainerd, C. J., & Reyna, V. F. (2005). The science of false memory. Oxford: Oxford University Press.
155 D.5 References
Bidelman, G. M., Hutka, S., & Moreno, S. (2013). Tone language speakers and musicians
share enhanced perceptual and cognitive abilities for musical pitch: evidence for bidirectionality between the domains of language and music. PloS one, 8(4), e60676.
Bittner, R., Salamon, J., Tierney, M., Mauch, M., Cannam, C. & Bello, J.P. (2014, October). MedleyDB: A Multitrack Dataset for Annotation-Intensive MIR Research (pp.155-160).
Paper presented at the 15th International Society for Music Information Retrieval Conference, Taipei, Taiwan.
Breiman, L. (2001). Random forests. Machine Learning, 45, 5-32. Cialdini, R.B. (2001). Harnessing the Science of Persuasion. Harvard Business Review,
79(9), 72-81. Cohen, M. A., Evans, K. K., Horowitz, T. S., & Wolfe, J. M. (2011). Auditory and visual
memory in musicians and nonmusicians. Psychonomic bulletin & review, 18(3), 586- 591.
Costa, P. T., & McCrae, R. R. (1992). Normal personality assessment in clinical practice: The NEO Personality Inventory. Psychological assessment, 4(1), 5-13.
Curtis, M. E., & Bharucha, J. J. (2009). Memory and musical expectation for tones in cultural context. Music Perception: An Interdisciplinary Journal, 26(4), 365-375.
Davis, D., & Loftus, E. F. (2007). Internal and external sources of misinformation in adult witness memory. In M. P. Toglia, J. D. Read, D. F. Ross, & R. C. L. Lindsay (Eds.), The handbook of eyewitness psychology, Vol. 1. Memory for events (pp. 195-237). Mahwah, NJ: Lawrence Erlbaum Associates.
Delhasse, P. (1985). Le Concours Reine Elisabeth des Originesa Aujord’hui. Bruxelles: Vander.
Eisen, M. L., Winograd, E., & Qin, J. (2002). Individual differences in adults’ suggestibility and memory performance. In M. L. Eisen, J. A. Quas, & G. S. Goodman (Eds.), Memory and suggestibility in the forensic interview. New York, NY: Routledge.
Eren, P. E., Temizel, T. T., & Unal, P. (2014, May). An Exploratory Study on the Outcomes of Influence Stra-tegies in Mobile Application Recommendations. In Proceedings of the Second International Workshop on Behavior Change Support Systems (BCSS2014), Padova, Italy.
Faul, F., Erdfelder, E., Lang, A.-G., & Buchner, A. (2007). G*Power 3: A flexible statistical power analysis program for the social, behavioral, and biomedical sciences. Behavior Research Methods, 39, 175-191.
Flôres Jr, R. G., & Ginsburgh, V. A. (1996). The Queen Elisabeth musical competition: how fair is the final ranking?. The Statistician, 97-104.

156 D.5 References
Frenda, S. J., Nichols, R. M., & Loftus, E. F. (2011). Current issues and advances in
misinformation research. Current Directions in Psychological Science, 20(1), 20-23. Fruehwald, E. S. (1992). Copyright infringement of musical compositions: A systematic
approach. Akron Law Review, 26(1), 15–44. Gabbert, F., Memon, A., & Allan, K. (2003). Memory conformity: Can eyewitnesses
influence each other’s memories for an event? Applied Cognitive Psychology, 17(5), 533-543.
Graham, D. (2008, December 04). Ex-Thin Lizzy guitarist loses German plagiarism case. Retrieved from https://www.reuters.com/article/us-moore/ex-thin-lizzy-guitarist-loses- german-plagiarism-case-idUSTRE4B28HQ20081203
Goldberg, L. R. (1993). The structure of phenotypic personality traits. American Psychologist, 48(1), 26.
Gordon, E. E. (1989). Advanced measures of music audiation. Chicago, IL: GIA Publicaitons. Halpern, A. R., & Müllensiefen, D. (2008). Effects of timbre and tempo change on memory
for music. The Quarterly Journal of Experimental Psychology, 61(9), 1371-1384. Harrison, P. M., Collins, T., & Müllensiefen, D. (2017). Applying modern psychometric
techniques to melodic discrimination testing: item response theory, computerised adaptive testing, and automatic item generation. Scientific reports, 7(1), 3618.
Hastie, T., Tibshirani, R., & Friedman, J. (2009). Hierarchical clustering. In T. Hastie, E. Tibshirani, & J. Friedman (Eds.), The elements of statistical learning: Data mining, inference and prediction (2nd ed., pp. 520-528). New York: Springer.
Hothorn, T., Bühlmann, P., Dudoit, S., Molinaro, A., & Van Der Laan, M. (2006). Survival ensembles. Biostatistics, 7, 355-373.
Hothorn, T., Hornik, K., & Zeileis, A. (2006). Unbiased recursive partitioning: A conditional inference framework. Journal of Computational and Graphical Statistics, 15, 651-674.
Hyman, I. E., Husband, F., & Billings, J. (1995). False memories of childhood experiences. Applied Cognitive Psychology, 9, 181–197.
Hyman, I. E. Jr., & Kleinknecht, E. (1999). False childhood memories: Research, theory, and applications. In L. M. Williams & V. L. Banyard (Eds.), Trauma and memory (pp. 175–188). Thousand Oaks, CA: Sage.
Janitza, S., Strobl, C., & Boulesteix, A.–L. (2013). An AUC- based permutation variable importance measure for random forests. BMC Bioinformatics, 14, 119.
John, O. P., & Srivastava, S. (1999). The Big Five trait taxonomy: History, measurement, and theoretical perspectives. Handbook of Personality: Theory and Research, 2, 102-138.
Johnson, M. K., Hashtroudi, S., & Lindsay, D. S. (1993). Source monitoring. Psychological bulletin, 114(1), 3-28.

157 D.5 References
Johnson, M. K., & Raye, C. L. (2000). Cognitive and brain mechanisms of false memories
and beliefs. In D. L. Schacter & E. Scarry (Eds.), Memory, brain and beliefs (pp. 35-86). Cambridge, MA, USA: Harvard University Press.
Kaptein, M., De Ruyter, B., Markopoulos, P., & Aarts, E. (2012). Adaptive persuasive systems: a study of tailored persuasive text messages to reduce snacking. ACM Trans- actions on Interactive Intelligent Systems (TiiS), 2(2), 10.
Kuhn, M. (2008). Caret package. Journal of statistical software, 28(5), 1-26. Retrieved from http://www.download.nextag.com/cran/web/packages/caret/caret.pdf
Levitin, D. J. (1994). Absolute memory for musical pitch: Evidence from the production of learned melodies. Perception & Psychophysics, 56(4), 414-423.
Levitin, D. J., & Cook, P. R. (1996). Memory for musical tempo: Additional evidence that auditory memory is absolute. Perception & Psychophysics, 58(6), 927-935.
Liebman, J. I., McKinley-Pace, M. J., Leonard, A. M., Sheesley, L. A., Gallant, C. L., Renkey, M. E., & Lehman, E. B. (2002). Cognitive and psychosocial correlates of adults’ eyewitness accuracy and suggestibility. Personality and Individual Differences, 33(1), 49-66.
Loftus, E. F. (2005). Planting misinformation in the human mind: A 30-year investigation of the malleability of memory. Learning & Memory, 12(4), 361–366.
Loftus, E. F., & Hoffman, H. G. (1989). Misinformation and memory: The creation of new memories. Journal of Experimental Psychology: General, 118(1), 100-104.
Loftus, E. F., Miller, D. G., & Burns, H. J. (1978). Semantic integration of verbal information into a visual memory. Journal of Experimental Psychology: Human Learning and Memory, 4(1), 19-31.
Loftus, E. F., Schooler, J. W., & Wagenaar, W. A. (1985). The fate of memory: Comment on McCloskey and Zaragoza. Journal of Experimental Psychology: General, 114(3), 375-380.
McCloskey, M., & Zaragoza, M. (1985). Misleading postevent information and memory for events: Arguments and evidence against memory impairment hypotheses. Journal of Experimental Psychology: General, 114(1), 1-16.
Monahan, C. B., Kendall, R. A., & Carterette, E. C. (1987). The effect of melodic and temporal contour on recognition memory for pitch change. Perception & Psychophysics, 41(6), 576-600.
Müllensiefen, D., Gingras, B., Musil, J., & Stewart, L. (2014). The musicality of non- musicians: An index for assessing musical sophistication in the general population. PloS ONE, 9(2), e89642.

158 D.5 References
Müllensiefen, D., & Pendzich, M. (2009). Court decisions on music plagiarism and the
predictive value of similarity algorithms. Musicae Scientiae, 13, 257–295. Neuschatz, J. S., Lampinen, J. M., Toglia, M. P., Payne, D. G., & Cisneros, E. P. (2017). False
memory research: History, theory, and applied implications. In M. P. Toglia, J. D., Read, D. F. Ross, & R. C. Lindsay (Eds.), The Handbook of Eyewitness Psychology: Volume I: Memory for Events (pp. 239-260). Mahwah, NJ: Lawrence Erlbaum Associates.
Paulhus D.L. (1986) Self-Deception and Impression Management in Test Responses. In: Angleitner A., Wiggins J.S. (eds) Personality Assessment via Questionnaires. Springer, Berlin, Heidelberg.
Pickrell, J. E., McDonald, D., Bernstein, D. M., & Loftus, E. F. (2016). Misinformation effect. In R. F. Pohl (Ed.) Cognitive Illusions: Intriguing Phenomena in Judgement, Thinking and Memory (pp. 406-423). London: Psychology Press.
Porter, S., Birt, A. R., Yuille, J. C., & Lehman, D. R. (2000). Negotiating false memories: Interviewer and rememberer characteristics relate to memory distortion. Psychological Science, 11(6), 507-510.
Roediger, H. L., & McDermott, K. B. (1995). Creating false memories: Remembering words not presented in lists. Journal of Experimental Psychology: Learning, Memory, and Cognition, 21(4), 803-814.
Stuart, E. A., King, G., Imai, K., & Ho, D. E. (2011). MatchIt: nonparametric preprocessing for parametric causal inference. Journal of Statistical Software, 42(8).
Pallesen, K. J., Brattico, E., Bailey, C. J., Korvenoja, A., Koivisto, J., Gjedde, A., & Carlson, S. (2010). Cognitive control in auditory working memory is enhanced in musicians. PloS one, 5(6), e11120.
Peretz, I., Gaudreau, D., & Bonnel, A. M. (1998). Exposure effects on music preference and recognition. Memory & Cognition, 26(5), 884-902.
Peretz, I., & Zatorre, R. J. (2005). Brain organization for music processing. Annual Review of Psychology, 56, 89-114.
Poulin-Charronnat, B., Bigand, E., Lalitte, P., Madurell, F., Vieillard, S., & McAdams, S. (2004). Effects of a change in instrumentation on the recognition of musical materials. Music Perception: An Interdisciplinary Journal, 22(2), 239-263.
Reyna, V. F., & Brainerd, C. J. (1995). Fuzzy-trace theory: An interim synthesis. Learning and individual Differences, 7(1), 1-75.
Schellenberg, E. G., & Habashi, P. (2015). Remembering the melody and timbre, forgetting the key and tempo. Memory & Cognition, 43(7), 1021-1031.
159 D.5 References
Schellenberg, E. G., Stalinski, S. M., & Marks, B. M. (2014). Memory for surface features of
unfamiliar melodies: Independent effects of changes in pitch and tempo. Psychological research, 78(1), 84-95.
Schiavio, A., & Timmers, R. (2016). Motor and audiovisual learning consolidate auditory memory of tonally ambiguous melodies. Music Perception: An Interdisciplinary Journal, 34(1), 21-32.
Schooler, J. W., & Loftus, E. F. (1993). Multiple mechanisms mediate individual differences in eyewitness accuracy and suggestibility. Mechanisms of everyday cognition, 177-203.
Schulze, K., Mueller, K., & Koelsch, S. (2011). Neural correlates of strategy use during auditory working memory in musicians and non-musicians. European Journal of
Neuroscience, 33(1), 189-196. Scoboria, A., Wade, K. A., Lindsay, D. S., Azad, T., Strange, D., Ost, J., & Hyman, I. E.
(2017). A mega-analysis of memory reports from eight peer-reviewed false memory implantation studies. Memory, 25(2), 146–163.
Shaw, J. (2016). The Memory Illusion: Remembering, Forgetting, and the Science of False Memory. New York, NY: Random House.
Smelser, N. J., & Baltes, P. B. (Eds.). (2001). International encyclopedia of the social & behavioral sciences (Vol. 11). Amsterdam: Elsevier.
Stöber, J. (2001). The Social Desirability Scale-17 (SDS-17): Convergent validity, discrimi- nant validity, and relationship with age. European Journal of Psychological Assessment, 17, 222-232.
Strobl, C., Boulesteix, A.-L., Kneib, T., Augustin, T., & Zeileis, A. (2008). Conditional variable importance for random forests. BMC Bioinformatics, 9, 307.
Strobl, C., Malley, J., & Tutz, G. (2009). An introduction to recursive partitioning: Rationale, application, and characteristics of classification and regression trees, bagging, and random forests. Psychological Methods, 14, 323–348.
Talamini, F., Altoè, G., Carretti, B., & Grassi, M. (2017). Musicians have better memory than nonmusicians: A meta-analysis. PloS ONE, 12(10), e0186773.
Trainor, L. J., Wu, L., & Tsang, C. D. (2004). Long-term memory for music: Infants remember tempo and timbre. Developmental Science, 7(3), 289-296.
Vuvan, D. T., Podolak, O. M., & Schmuckler, M. A. (2014). Memory for musical tones: the impact of tonality and the creation of false memories. Frontiers in Psychology, 5, 582.
Wade, K. A., Garry, M., Read, J. D., & Lindsay, D. S. (2002). A picture is worth a thousand lies: Using false photographs to create false childhood memories. Psychonomic Bulletin
& Review, 9, 597–603.
160 D.5 References
Ward, R. A., & Loftus, E. F. (1985). Eyewitness performance in different psychological
types. The Journal of General Psychology, 112(2), 191-200. Weingardt, K. R., Toland, H. K., & Loftus, E. F. (1994). Reports of suggested memories:
Do people truly believe them? In D. F. Ross, J. D. Read, & M. P. Toglia (Eds.), Adult eyewitness testimony: Current trends and developments (pp. 3-26). Cambridge: Cambridge University Press.
Weiss, M. W., Vanzella, P., Schellenberg, E. G., & Trehub, S. E. (2015). Pianists exhibit enhanced memory for vocal melodies but not piano melodies. The Quarterly Journal of Experimental Psychology, 68(5), 866-877.
Williamson, V. J., Baddeley, A. D., & Hitch, G. J. (2010). Musicians’ and nonmusicians’ short-term memory for verbal and musical sequences: Comparing phonological similar- ity and pitch proximity. Memory & Cognition, 38(2), 163-175.
Wylie, L. E., Patihis, L., McCuller, L. L., Davis, D., Brank, E., Loftus, E. F., & Bornstein, B. (2014). Misinformation effect in older versus younger adults: A meta-analysis and review. In M. P. Toglia, D. F. Ross, J. Pozzulo, & E. Pica (Eds.), The Elderly Eyewitness in Court (pp. 38.66). London: Psychology Press.
Zhu, B., Chen, C., Loftus, E. F., Lin, C., He, Q., Chen, C., & Dong, Q. (2010). Individual differences in false memory from misinformation: Cognitive factors. Memory, 18(5), 543-555.
Ziegler, M., Danay, E., Heene, M., Asendorpf, J., & Bühner, M. (2012). Openness, fluid intelligence, and crystallized intelligence: Toward an integrative model. Journal of Research in Personality, 46(2), 173-183.
Appendix E Names and titles matter: Linguistic fluency and the affect heuristic (S5)
This is an Accepted Manuscript of an article published by APA in Psychology of Aesthetics, Creativity, and the Arts. ©American Psychological Association, 2019. This paper is not the copy of record and may not exactly replicate the authoritative document published in the APA journal. Please do not copy or cite without author's permission. The final article is available, upon publication, at: https://doi.org/10.1037/aca0000172. For presentation in this thesis, the appendices of the paper have been removed and the passages referring to each Appendix in the text modified to indicate where to find the materials online. Moreover, there may be minor modifications in the text to guarantee a consistent typographic style throughout the thesis, such as the position of figures and tables.
Citation Anglada-Tort, M., Steffens, J., & Müllensiefen, D. (2019). Names and titles matter: The impact of linguistic fluency and the affect heuristic on aesthetic and value judge- ments of music. Psychology of Aesthetics, Creativity, and the Arts, 13(3), 277–292. DOI: https://doi.org/10.1037/aca0000172
Author contribution I conceived the idea of this project, conducted the experiments, analysed the data, and write the paper. Prof. Dr. Daniel Müllensiefen (Goldsmiths, University of London) and Prof. Dr. Jochen Steffens (Technische Universität Berlin) supervised the work at all stages.
Names and Titles Matter: The Impact of Linguistic
Fluency and the Affect Heuristic on Aesthetic and Value
Judgements of Music
It has been shown that titles influence peoples’ evaluation of visual art. However, the question of whether titles and artist names affect listeners when evaluating music has not yet been investigated. By using two well-known cognitive heuristics, we investigated whether names presented with music pieces influenced aesthetic and value judgements of music. Experiment 1 (N = 48) focused on linguistic fluency. The same music excerpts were presented with easy-to-pronounce (fluent) and difficult-to-pronounce (disfluent) names. Experiment 2 (N = 100) studied the affect heuristic. The same music excerpts were presented with positive (e.g., Kiss), negative (e.g., Suicide), and neutral (e.g., Window) titles. In both studies, aesthetic and value judgements of music were significantly influenced by the linguistic manipulation of the names. Participants in Experiment 1 evaluated the same music more positively when presented with fluent names compared to disfluent names. In Experiment 2, presenting the music with negative titles resulted in the lowest judgements. Moreover, music excerpts presented with neutral and negative titles were remembered significantly more often than positive titles. Finally, a comparison of the music presented with and without titles indicated that music excerpts were more liked in the presence of titles than in their absence. The present research shows different ways in which aesthetic and value judgements can be influenced by the names presented with music. Results suggest that like any other human judgement, evaluations of music also rely on heuristic principles that do not necessarily depend on the aesthetic stimuli themselves.
Keywords: : music evaluation, artist name, title, fluency, affect heuristric.
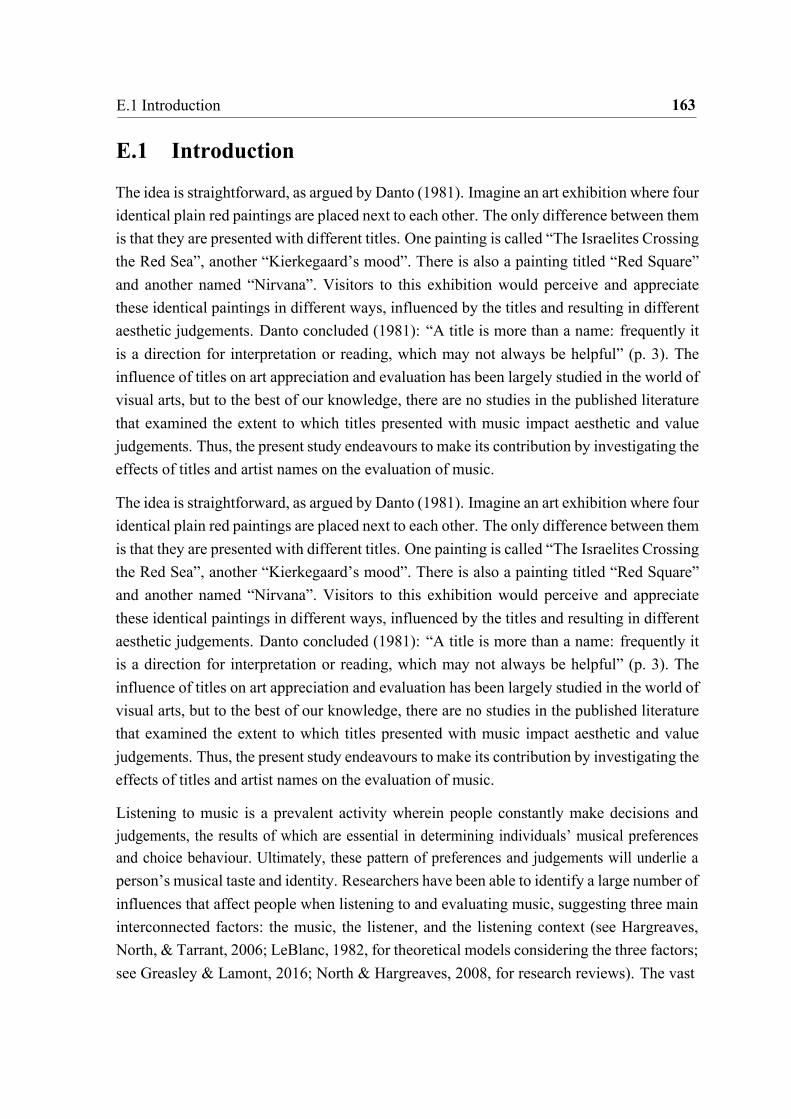
163 E.1 Introduction
E.1 Introduction
The idea is straightforward, as argued by Danto (1981). Imagine an art exhibition where four identical plain red paintings are placed next to each other. The only difference between them is that they are presented with different titles. One painting is called “The Israelites Crossing the Red Sea”, another “Kierkegaard’s mood”. There is also a painting titled “Red Square” and another named “Nirvana”. Visitors to this exhibition would perceive and appreciate these identical paintings in different ways, influenced by the titles and resulting in different aesthetic judgements. Danto concluded (1981): “A title is more than a name: frequently it is a direction for interpretation or reading, which may not always be helpful” (p. 3). The influence of titles on art appreciation and evaluation has been largely studied in the world of visual arts, but to the best of our knowledge, there are no studies in the published literature that examined the extent to which titles presented with music impact aesthetic and value judgements. Thus, the present study endeavours to make its contribution by investigating the effects of titles and artist names on the evaluation of music.
The idea is straightforward, as argued by Danto (1981). Imagine an art exhibition where four identical plain red paintings are placed next to each other. The only difference between them is that they are presented with different titles. One painting is called “The Israelites Crossing the Red Sea”, another “Kierkegaard’s mood”. There is also a painting titled “Red Square” and another named “Nirvana”. Visitors to this exhibition would perceive and appreciate these identical paintings in different ways, influenced by the titles and resulting in different aesthetic judgements. Danto concluded (1981): “A title is more than a name: frequently it is a direction for interpretation or reading, which may not always be helpful” (p. 3). The influence of titles on art appreciation and evaluation has been largely studied in the world of visual arts, but to the best of our knowledge, there are no studies in the published literature that examined the extent to which titles presented with music impact aesthetic and value judgements. Thus, the present study endeavours to make its contribution by investigating the effects of titles and artist names on the evaluation of music.
Listening to music is a prevalent activity wherein people constantly make decisions and judgements, the results of which are essential in determining individuals’ musical preferences and choice behaviour. Ultimately, these pattern of preferences and judgements will underlie a person’s musical taste and identity. Researchers have been able to identify a large number of influences that affect people when listening to and evaluating music, suggesting three main interconnected factors: the music, the listener, and the listening context (see Hargreaves, North, & Tarrant, 2006; LeBlanc, 1982, for theoretical models considering the three factors; see Greasley & Lamont, 2016; North & Hargreaves, 2008, for research reviews). The vast

164 E.1 Introduction
majority of studies have focused on the music and the listener, examining the effect of musical characteristics (e.g., complexity, familiarity, style, tempo, volume) on judgements and preferences (e.g., Berlyne, 1971; 1974; North & Hargreaves, 1995, 2000a; Russell, 1986); as well as individual aspects of the listener that influence preferences for music, including age, gender, personal values, cognitive styles, and personality (e.g., Bonneville- Roussy, Rentfrow, Xu, & Potter, 2013; Greenberg, Baron-Cohen, Stillwell, Kosinski, & Rentfrow, 2015; Lonsdale & North, 2011; North & Hargreaves, 2007; Rentfrow & Gosling, 2003). Comparatively, less attention has been paid to the listening context, although there are reasons to believe that they play a crucial role in the processes involved in listening to music and evaluation (e.g., Egermann et al., 2011; Greasley & Lamont, 2011;North & Hargreaves, 2000b; North, Hargreaves, & Hargreaves, 2004).
Sloboda (1999) stated that listening to music is ‘intensely situational’ (p. 355), suggesting that the context wherein people listen to music is crucial to understanding musical judgements, preferences, and choice behaviour. In support of this view, studies have identified a number of nonmusical factors, inseparable from the listening situation in the real-world, that affect people when perceiving and evaluating music. Visual information is one of the most salient (see Platz & Kopiez, 2012, for a review). There is evidence that performer’s body movements (e.g., Behne & Wöllner, 2011; Juchniewicz, 2008;), physical attractiveness (Ryan, Costa- Giomi, 2004; Wapnick , Mazza, & Darrow, 2000), appropriateness of dress (Griffiths, 2008; Wapnick et al., 2000), and race and gender (Davidson & Edgar, 2003; Elliot, 1995) are influential in the evaluation of music. Similarly, the explicit or contextual information, which frequently accompanies music, has also been shown to be a relevant factor. Presenting music with different types of explicit information, such as texts, labels, and subtitles, has a significant impact on evaluations of music (Anglada-Tort & Müllensiefen, 2017; Duerksen, 1972; Margulis, 2010; Margulis, Kisida, & Greene, 2015; Margulis, Levine, Simchy-Gross, & Kroger, 2017; North & Hargreaves, 2005; Silveira & Diaz, 2014; Vuoskoski & Eerola, 2013). When presented with music, explicit information can intensify the emotionality of the music (Vuoskoski & Eerola, 2013; Margulis et al., 2017), enhance children’s attention and comprehension of music performances (Margulis et al., 2015), and alter listeners’ evaluations of music on different dimensions of subjective judgement (e.g., liking, musical quality, pitch and rhythm accuracy) (Anglada-Tort & Müllensiefen, 2017; Duerksen, 1972).
Since artist names and song titles are a fundamental property of music and a type of explicit information normally presented with music, we deemed that they merit further empirical investigation. Although studies have found that song titles are relatively important in memory and metamemory for music (Barlett & Snelus, 1980; Korenmann & Peynircioglu, 2004;

165 E.1 Introduction
Peynircioglu, Rabinovitz, & Thompson, 2008), the question of whether titles and artist names influence people when listening to and evaluating music has not been empirically addressed.
In the world of visual art, however, the influence of titles on the appreciation and evaluation of paintings has been investigated repeatedly. Presenting pieces of art with titles has a significant effect on the understanding and interpretation (Millis, 2001; Leder, Carbon, & Ripsas, 2006; Russell, 2003; Swami, 2013), visual exploration (Hristova, Georgieva, & Grinberg, 2011; Kapoula, Daunys, Herbez, & Yang, 2009), and liking (Belke, Leder, Strobach, & Carbon, 2010; Gerger & Leder, 2015; Millis, 2001; Russell, 2003; Swami, 2013) of artworks. Researchers have also looked at the differences between the presence and absence of titles, showing that the same pieces of art are normally rated more favourably when they are presented with titles than in their absence (Cleeremans, Ginsburgh, Klein, & Noury, 2016; Leder, et al., 2006; Millis, 2001).
When manipulating the linguistic properties of names and titles, the present study made use of two heuristic principles that have been shown to play a crucial role in human judgement and decision making, namely processing fluency (see Reber, Schwarz, & Winkielman, 2004, for a review) and the affect heuristic (see Slovic, Finucane, Peters, & MacGregor, 2002, for a review). Processing fluency refers to the human tendency to evaluate information that is easy-to-process more positively than similar but more difficult-to-process information. Studies have shown that easy-to-process stimuli are believed to be more frequent (Tversky & Kahneman, 1973), true (Reber & Schwarz, 1999), famous (Jacoby, Kelly, Brown, & Jascheko, 1989), likeable (Reber, Winkielman, & Schwarz, 1998), and familiar (Whittlesea & Williams, 1998) than similar but less-fluent stimuli. Shah & Oppenheimer (2007) applied the principle of fluency to the evaluation of financial stocks, finding that when stocks were presented with easy-to-pronounce brokerage firm names they were evaluated more positively than when presented with hard to pronounce names. This kind of manipulation is known as linguistic fluency (Alter & Oppenheimer, 2006; Whittlesea & Leboe, 2000). One of the motivations of the present paper was to apply the same principle to study the effects of title and artist name on the evaluation of music (Experiment 1).
The affect heuristic refers to the reliance on good and bad feelings associated with a stimulus (Kahneman & Frederick, 2002; Slovic, Finucane, Peters, & MacGregor, 2002). Research from psychology, economics, and decision making strongly supports the existence of this heuristic principle, showing that people rely on subjective affective responses when making decisions and judgements (e.g., Finucane, Alhakami, Slovic, & Johnson, 2000; Hsee & Rottenstreich, 2004; Loewenstein, Weber, Hsee, & Welch, 2001; Pham & Avnet, 2009; Ratner & Herbst, 2005; Rottenstreich & Hsee, 2001). It is worth mentioning that these
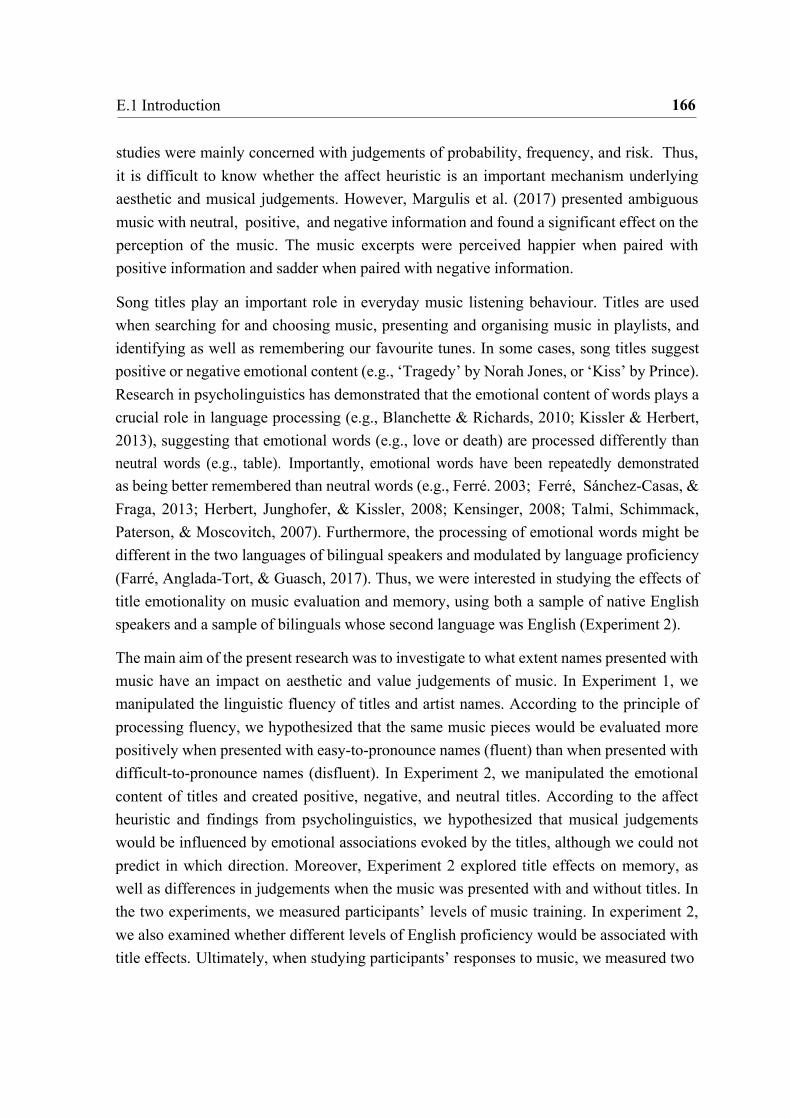
166 E.1 Introduction
studies were mainly concerned with judgements of probability, frequency, and risk. Thus, it is difficult to know whether the affect heuristic is an important mechanism underlying aesthetic and musical judgements. However, Margulis et al. (2017) presented ambiguous music with neutral, positive, and negative information and found a significant effect on the perception of the music. The music excerpts were perceived happier when paired with positive information and sadder when paired with negative information.
Song titles play an important role in everyday music listening behaviour. Titles are used when searching for and choosing music, presenting and organising music in playlists, and identifying as well as remembering our favourite tunes. In some cases, song titles suggest positive or negative emotional content (e.g., ‘Tragedy’ by Norah Jones, or ‘Kiss’ by Prince). Research in psycholinguistics has demonstrated that the emotional content of words plays a crucial role in language processing (e.g., Blanchette & Richards, 2010; Kissler & Herbert, 2013), suggesting that emotional words (e.g., love or death) are processed differently than neutral words (e.g., table). Importantly, emotional words have been repeatedly demonstrated as being better remembered than neutral words (e.g., Ferré. 2003; Ferré, Sánchez-Casas, & Fraga, 2013; Herbert, Junghofer, & Kissler, 2008; Kensinger, 2008; Talmi, Schimmack, Paterson, & Moscovitch, 2007). Furthermore, the processing of emotional words might be different in the two languages of bilingual speakers and modulated by language proficiency (Farré, Anglada-Tort, & Guasch, 2017). Thus, we were interested in studying the effects of title emotionality on music evaluation and memory, using both a sample of native English speakers and a sample of bilinguals whose second language was English (Experiment 2).
The main aim of the present research was to investigate to what extent names presented with music have an impact on aesthetic and value judgements of music. In Experiment 1, we manipulated the linguistic fluency of titles and artist names. According to the principle of processing fluency, we hypothesized that the same music pieces would be evaluated more positively when presented with easy-to-pronounce names (fluent) than when presented with difficult-to-pronounce names (disfluent). In Experiment 2, we manipulated the emotional content of titles and created positive, negative, and neutral titles. According to the affect heuristic and findings from psycholinguistics, we hypothesized that musical judgements would be influenced by emotional associations evoked by the titles, although we could not predict in which direction. Moreover, Experiment 2 explored title effects on memory, as well as differences in judgements when the music was presented with and without titles. In the two experiments, we measured participants’ levels of music training. In experiment 2, we also examined whether different levels of English proficiency would be associated with title effects. Ultimately, when studying participants’ responses to music, we measured two
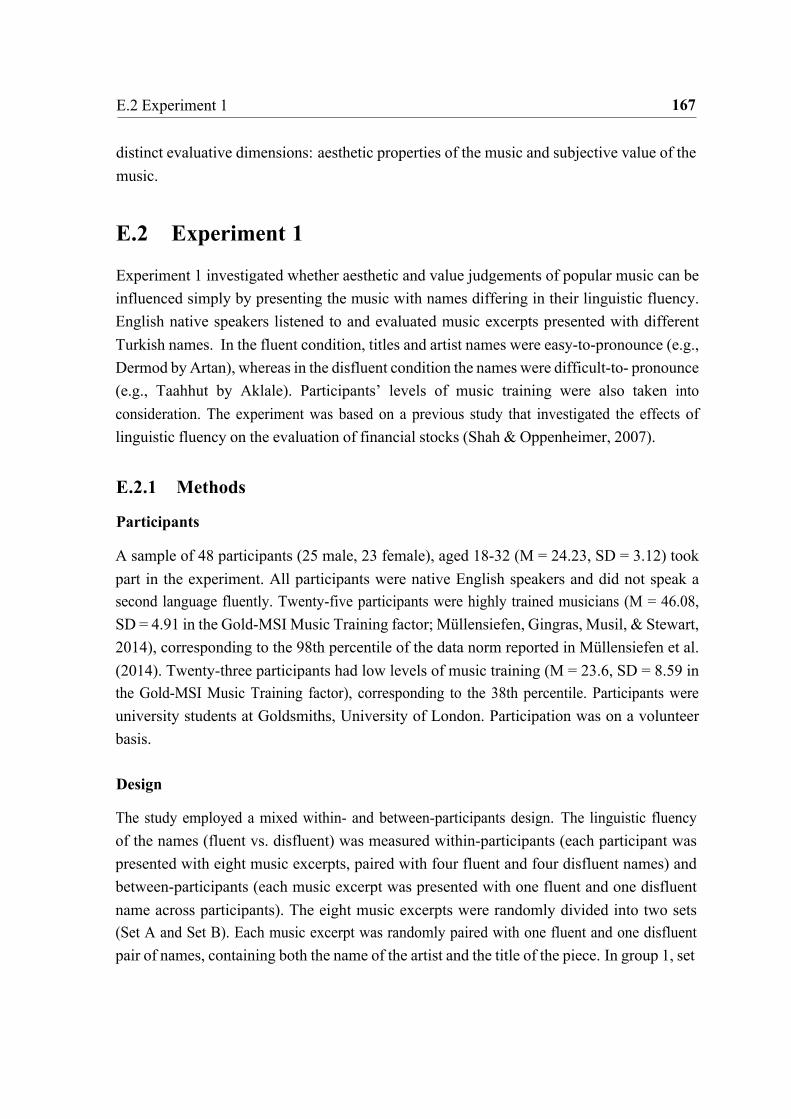
167 E.2 Experiment 1
distinct evaluative dimensions: aesthetic properties of the music and subjective value of the music.
E.2 Experiment 1
Experiment 1 investigated whether aesthetic and value judgements of popular music can be influenced simply by presenting the music with names differing in their linguistic fluency. English native speakers listened to and evaluated music excerpts presented with different Turkish names. In the fluent condition, titles and artist names were easy-to-pronounce (e.g., Dermod by Artan), whereas in the disfluent condition the names were difficult-to- pronounce (e.g., Taahhut by Aklale). Participants’ levels of music training were also taken into consideration. The experiment was based on a previous study that investigated the effects of linguistic fluency on the evaluation of financial stocks (Shah & Oppenheimer, 2007).
E.2.1 Methods
Participants
A sample of 48 participants (25 male, 23 female), aged 18-32 (M = 24.23, SD = 3.12) took part in the experiment. All participants were native English speakers and did not speak a second language fluently. Twenty-five participants were highly trained musicians (M = 46.08, SD = 4.91 in the Gold-MSI Music Training factor; Müllensiefen, Gingras, Musil, & Stewart, 2014), corresponding to the 98th percentile of the data norm reported in Müllensiefen et al. (2014). Twenty-three participants had low levels of music training (M = 23.6, SD = 8.59 in the Gold-MSI Music Training factor), corresponding to the 38th percentile. Participants were university students at Goldsmiths, University of London. Participation was on a volunteer basis.
Design
The study employed a mixed within- and between-participants design. The linguistic fluency of the names (fluent vs. disfluent) was measured within-participants (each participant was presented with eight music excerpts, paired with four fluent and four disfluent names) and between-participants (each music excerpt was presented with one fluent and one disfluent name across participants). The eight music excerpts were randomly divided into two sets (Set A and Set B). Each music excerpt was randomly paired with one fluent and one disfluent pair of names, containing both the name of the artist and the title of the piece. In group 1, set
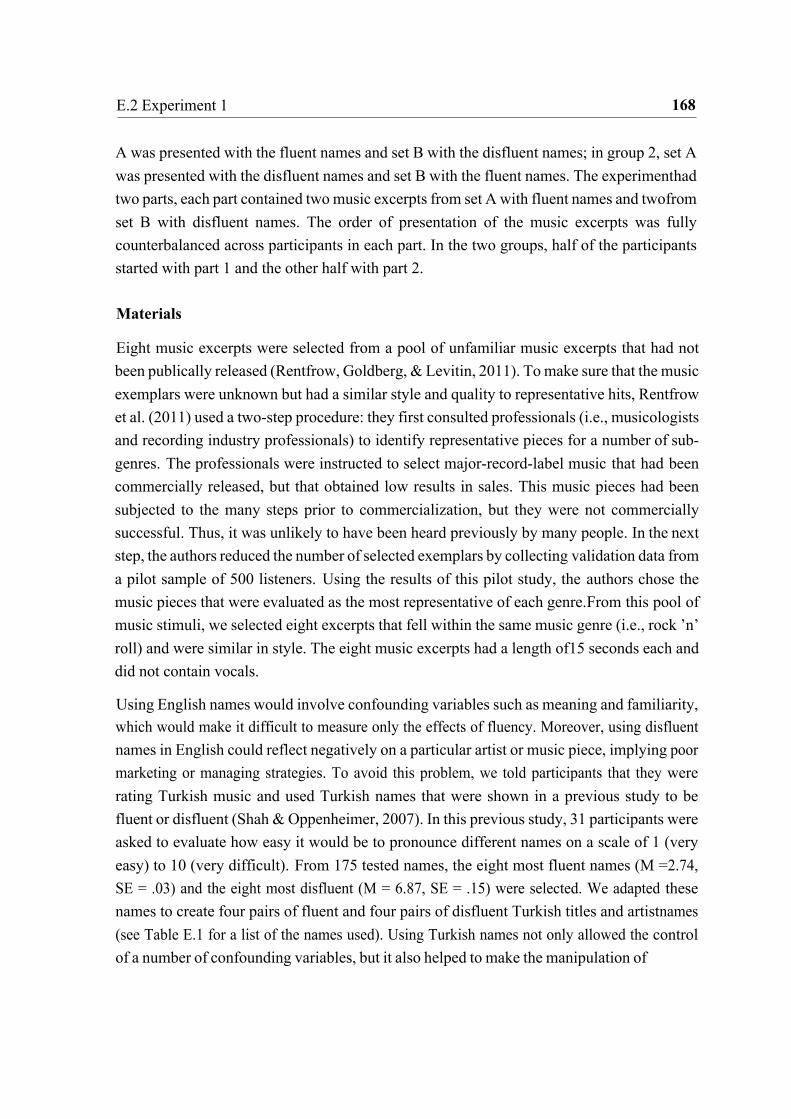
168 E.2 Experiment 1
A was presented with the fluent names and set B with the disfluent names; in group 2, set A was presented with the disfluent names and set B with the fluent names. The experiment had two parts, each part contained two music excerpts from set A with fluent names and two from set B with disfluent names. The order of presentation of the music excerpts was fully counterbalanced across participants in each part. In the two groups, half of the participants started with part 1 and the other half with part 2.
Materials
Eight music excerpts were selected from a pool of unfamiliar music excerpts that had not been publically released (Rentfrow, Goldberg, & Levitin, 2011). To make sure that the music exemplars were unknown but had a similar style and quality to representative hits, Rentfrow et al. (2011) used a two-step procedure: they first consulted professionals (i.e., musicologists and recording industry professionals) to identify representative pieces for a number of sub-genres. The professionals were instructed to select major-record-label music that had been commercially released, but that obtained low results in sales. This music pieces had been subjected to the many steps prior to commercialization, but they were not commercially successful. Thus, it was unlikely to have been heard previously by many people. In the next step, the authors reduced the number of selected exemplars by collecting validation data from a pilot sample of 500 listeners. Using the results of this pilot study, the authors chose the music pieces that were evaluated as the most representative of each genre. From this pool of music stimuli, we selected eight excerpts that fell within the same music genre (i.e., rock ’n’ roll) and were similar in style. The eight music excerpts had a length of 15 seconds each and did not contain vocals.
Using English names would involve confounding variables such as meaning and familiarity, which would make it difficult to measure only the effects of fluency. Moreover, using disfluent names in English could reflect negatively on a particular artist or music piece, implying poor marketing or managing strategies. To avoid this problem, we told participants that they were rating Turkish music and used Turkish names that were shown in a previous study to be fluent or disfluent (Shah & Oppenheimer, 2007). In this previous study, 31 participants were asked to evaluate how easy it would be to pronounce different names on a scale of 1 (very easy) to 10 (very difficult). From 175 tested names, the eight most fluent names (M = 2.74, SE = .03) and the eight most disfluent (M = 6.87, SE = .15) were selected. We adapted these names to create four pairs of fluent and four pairs of disfluent Turkish titles and artist names (see Table E.1 for a list of the names used). Using Turkish names not only allowed the control of a number of confounding variables, but it also helped to make the manipulation of

169 E.2 Experiment 1
linguistic fluency less obvious. The awareness of the fluency manipulation should be lower when using Turkish than when using English names, especially if the sample of participants are monolingual English speakers.
Table E.1 Fluent and disfluent Turkish titles and artist names.
Participants evaluated each music excerpt using six Likert rating scales. Three rating scales were intended to measure aesthetic properties of the music: (1) liking of the music, on a scale from 1 (dislike strongly) to 7 (like strongly), (2) emotional expressivity, on a scale from 1 (very bad) to 7 (very good), (3) musical quality, on a scale from 1 (very bad) to 7 (very good), whereas the other three were intended to measure the subjective value of the music: (4) how likely the “song” would succeed commercially, (5) how likely participants would be to attend a concert of the artist, and (6) how likely participants would be to recommend the “song” to a friend, on a scale from 1 (very unlikely) to 7 (very likely). Cronbach’s alphas for the three rating scales measuring aesthetic properties of the music and the three rating scales measuring the subjective value of the music were .84 and .82, respectively. At the end of the experiment, several questions were provided to assess whether participants were native English speakers and spoke a second language. Finally, participants were asked whether they thought that they were affected by the names presented with the music, on a scale from 1 (not at all) to 5 (always).
Procedure
Participants were tested individually in a cubicle room (150cm x 200cm) and sat in front of a computer located approximately 60-70 cm to them. The music excerpts were presented via professional headphones (KNS 8400 Studio Headphones KRK). Participants were told that the main purpose of the study was to examine how people evaluate music made by Turkish amateur musicians. First, participants filled out the Gold-MSI questionnaire. Then, participants were instructed to listen to the music excerpts and evaluate them as accurately as possible. The experiment had two parts with exactly the same procedure. In each part,

170 E.2 Experiment 1
participants listened to four music excerpts, two with fluent names and two with diffluent names. At the end of each part, participants had to fill the final evaluation form. The experiment was constructed on Qualtrics software (Qualtrics, Provo, UT). The experiment was granted ethical clearance by the Ethics Committee of the Department of Psychology of Goldsmiths College, University of London.
Statistical Analysis
To test the main hypothesis regarding the effects of linguistic fluency, we used the R packages lme4 (Bates, Mächler, Bolker, & Walker, 2015), AICcmodavg (Mazerolle, 2011), and lmerTest (Kuznetsova, Brockhoff, & Christensen, 2016) to perform a linear mixed-effects analysis with participants’ ratings as the dependent variable. Fluency (fluent and disfluent names) was the fixed independent factor. For selecting the random effect structure, we followed a strategy based on the corrected Akaike Information Criterion (AICc) and the Bayesian Information Criterion (BIC). We specified three different models with the same fixed effect structure but with (1) random intercept for participants only, (2) random intercepts for participants and music excerpts, and (3) random intercepts for participants, music excerpts, and a random slope for fluency affecting participants. Model 2 achieved the smallest AIC and BIC values and hence we chose the random effect structure to indicate random intercepts for participants and music excerpts.
E.2.2 Results
A principal component analysis (PCA) was conducted on the six rating scales. The Kaiser- Meyer-Olkin (KMO) measure verified the sampling adequacy for the analysis, KMO = .84 (values between .8 and .9 are considered ‘great’ according to Hutcheson & Sofroniou, 1999), and all KMO values for the individual rating scales were greater than .62, which is above the commonly accepted limit of .5. Barlett’s test of sphericity X 2(15) = 1401.27, p < .001, indicated that correlations between items were sufficiently large for PCA. The scree plot was very clear and indicated a solution with just one component. A single component had an eigenvalue of 3.85 which is above Kaiser’ criterion of 1 and explained 64.26% of the variance. Thus, the PCA clearly indicated a model with a single component only (see Appendix A, in the paper published online, for the loading of the six rating scales on the single component). Participants’ ratings on the six Likert scales were aggregated into a single score by averaging the six rating scales for each participant.
The linear mixed-effect model with the fluency of names as the fixed factor and the single ag- gregated component as the dependent variable revealed a significant main effect of linguistic
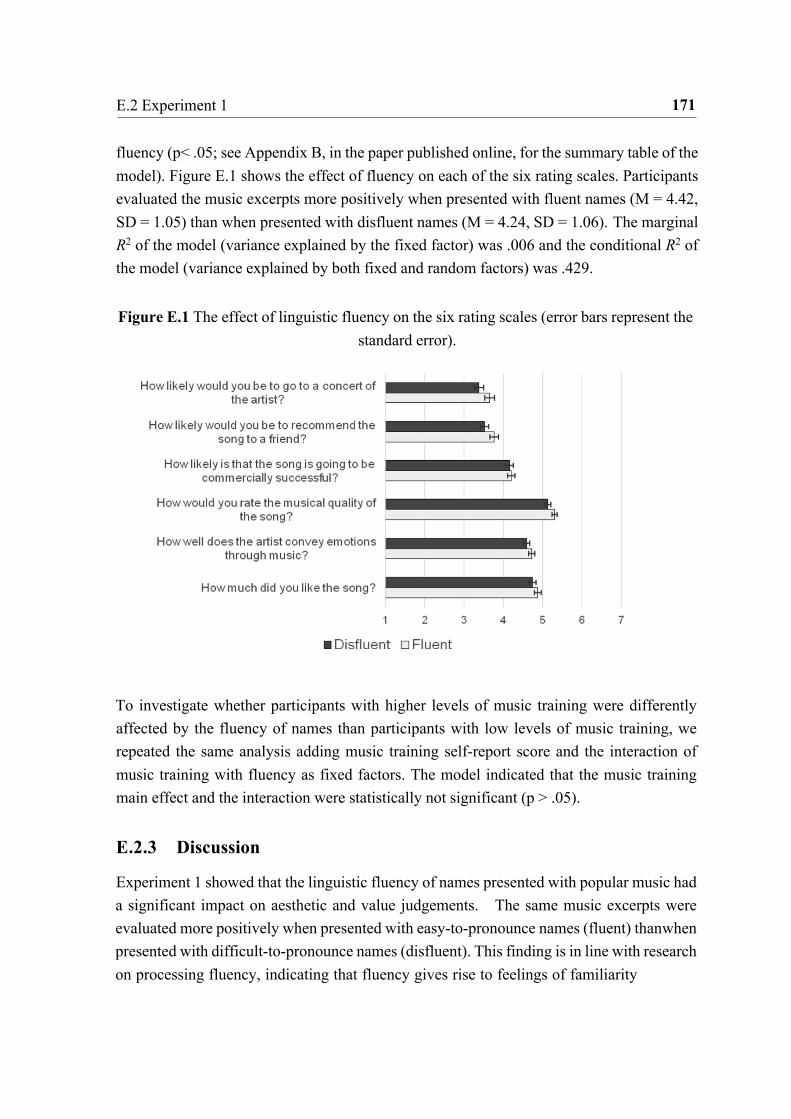
171 E.2 Experiment 1
fluency (p< .05; see Appendix B, in the paper published online, for the summary table of the model). Figure E.1 shows the effect of fluency on each of the six rating scales. Participants evaluated the music excerpts more positively when presented with fluent names (M = 4.42, SD = 1.05) than when presented with disfluent names (M = 4.24, SD = 1.06). The marginal R2 of the model (variance explained by the fixed factor) was .006 and the conditional R2 of the model (variance explained by both fixed and random factors) was .429.
Figure E.1 The effect of linguistic fluency on the six rating scales (error bars represent the
standard error).
To investigate whether participants with higher levels of music training were differently affected by the fluency of names than participants with low levels of music training, we repeated the same analysis adding music training self-report score and the interaction of music training with fluency as fixed factors. The model indicated that the music training main effect and the interaction were statistically not significant (p > .05).
E.2.3 Discussion
Experiment 1 showed that the linguistic fluency of names presented with popular music had a significant impact on aesthetic and value judgements. The same music excerpts were evaluated more positively when presented with easy-to-pronounce names (fluent) than when presented with difficult-to-pronounce names (disfluent). This finding is in line with research on processing fluency, indicating that fluency gives rise to feelings of familiarity
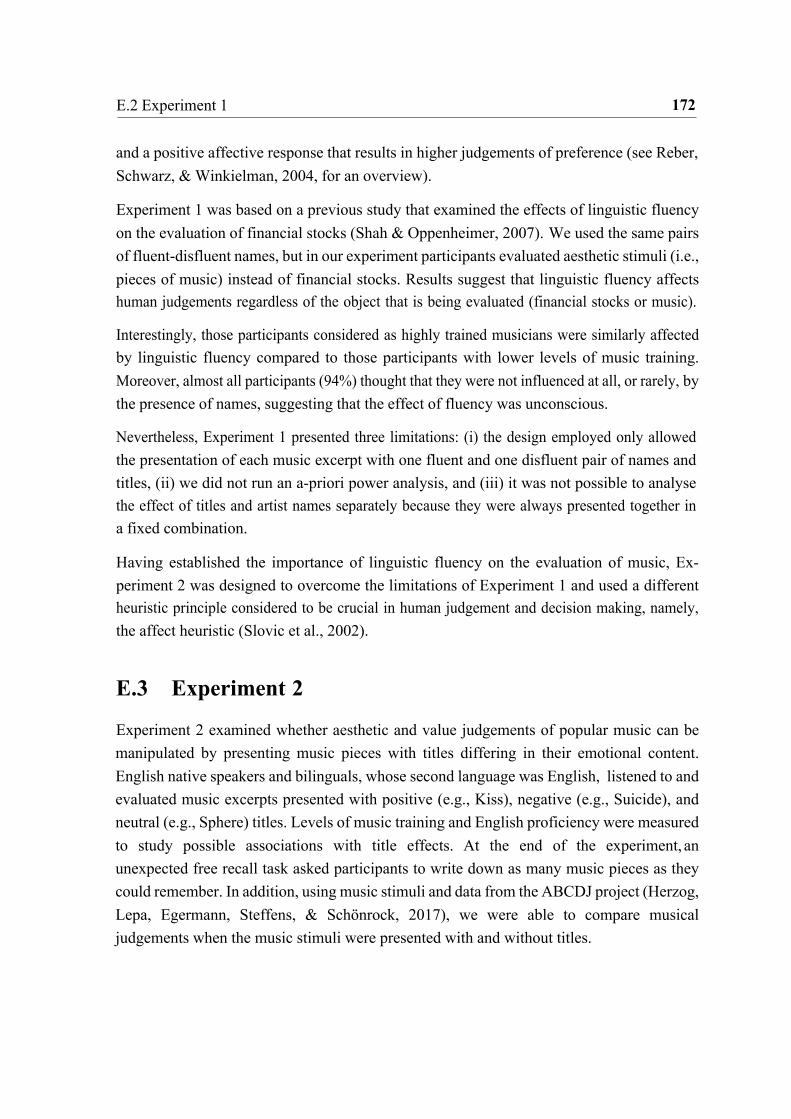
172 E.2 Experiment 1
and a positive affective response that results in higher judgements of preference (see Reber, Schwarz, & Winkielman, 2004, for an overview).
Experiment 1 was based on a previous study that examined the effects of linguistic fluency on the evaluation of financial stocks (Shah & Oppenheimer, 2007). We used the same pairs of fluent-disfluent names, but in our experiment participants evaluated aesthetic stimuli (i.e., pieces of music) instead of financial stocks. Results suggest that linguistic fluency affects human judgements regardless of the object that is being evaluated (financial stocks or music).
Interestingly, those participants considered as highly trained musicians were similarly affected by linguistic fluency compared to those participants with lower levels of music training. Moreover, almost all participants (94%) thought that they were not influenced at all, or rarely, by the presence of names, suggesting that the effect of fluency was unconscious.
Nevertheless, Experiment 1 presented three limitations: (i) the design employed only allowed the presentation of each music excerpt with one fluent and one disfluent pair of names and titles, (ii) we did not run an a-priori power analysis, and (iii) it was not possible to analyse the effect of titles and artist names separately because they were always presented together in a fixed combination.
Having established the importance of linguistic fluency on the evaluation of music, Ex- periment 2 was designed to overcome the limitations of Experiment 1 and used a different heuristic principle considered to be crucial in human judgement and decision making, namely, the affect heuristic (Slovic et al., 2002).
E.3 Experiment 2
Experiment 2 examined whether aesthetic and value judgements of popular music can be manipulated by presenting music pieces with titles differing in their emotional content. English native speakers and bilinguals, whose second language was English, listened to and evaluated music excerpts presented with positive (e.g., Kiss), negative (e.g., Suicide), and neutral (e.g., Sphere) titles. Levels of music training and English proficiency were measured to study possible associations with title effects. At the end of the experiment, an unexpected free recall task asked participants to write down as many music pieces as they could remember. In addition, using music stimuli and data from the ABCDJ project (Herzog, Lepa, Egermann, Steffens, & Schönrock, 2017), we were able to compare musical judgements when the music stimuli were presented with and without titles.

173 E.2 Experiment 1
E.3.1 methods
Participants
A sample of 100 participants (66 male, 34 female), aged 21 to 37 (M = 27.66, SD = 3.52) took part in the experiment. Twenty-seven participants were native English speakers and 73 were bilinguals who spoke English as a second language. Bilinguals’ level of English was fairly good (M = 5.85, SD = .80, on a 7-point self-assessment scale, where 1 was ‘very poor’ and 7 was ‘native-like’). Participants’ mean score in the Gold-MSI music training factor (Müllensiefen et al., 2014) was 26.47 (SD = 5.87), which indicates an overall average level of music training, corresponding to the 47th percentile of the data norm reported in Müllensiefen et al. (2014). While 23 Participants were tested under lab conditions, the remaining 77 were tested online. Participants were recruited via social media as well as at Goldsmiths, University of London and Technische Universität Berlin. Participation was on a volunteer basis.
Design
The present study employed a mixed within- and between-participants design. The effect of the emotionality of titles was measured within participants (each participant was presented with the nine music excerpts and the nine titles) and between-participants (each music excerpt was presented with the nine titles across participants). The nine titles (3 positive, 3 negative, and 3 neutral) were paired with the nine music excerpts using a randomized Latin Square design, which led to a total of nine possible combinations of titles and music excerpts. Nine surveys were created according to the outcome of the Latin Square. The order of presentation of the music excerpts was randomized for each participant. The dependent variables were obtained from 11 rating scales that participants were prompted with after each music excerpt. In addition, an unexpected free recall task was included at the end of the experiment.
Materials
Nine music excerpts were selected from a pool of 183 music excerpts created by the ABCDJ project (Herzog et al., 2017), where 3.485 participants evaluated the music excerpts using 51 semantic attributes (e.g., beautiful, inspiring, authentic, happy). Participants were asked to evaluate how well each semantic attribute fit the music excerpt, from 1 (very bad fit) to 6 (very good fit). In addition, participants also provided liking and familiarity ratings, from 1 (not liked/ familiar at all) to 6 (very much liked/ familiar). The 183 music pieces in the selection pool stemmed from 10 different major genres that had been evaluated by an expert.
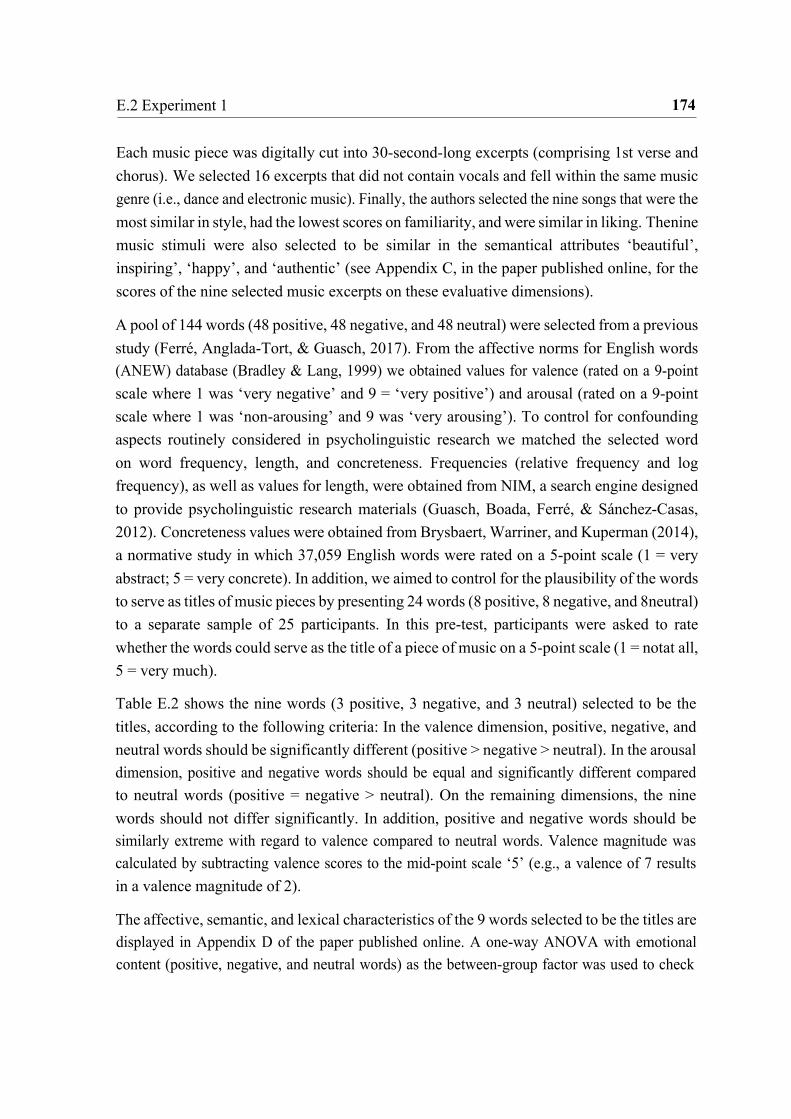
174 E.2 Experiment 1
Each music piece was digitally cut into 30-second-long excerpts (comprising 1st verse and chorus). We selected 16 excerpts that did not contain vocals and fell within the same music genre (i.e., dance and electronic music). Finally, the authors selected the nine songs that were the most similar in style, had the lowest scores on familiarity, and were similar in liking. The nine music stimuli were also selected to be similar in the semantical attributes ‘beautiful’, inspiring’, ‘happy’, and ‘authentic’ (see Appendix C, in the paper published online, for the scores of the nine selected music excerpts on these evaluative dimensions).
A pool of 144 words (48 positive, 48 negative, and 48 neutral) were selected from a previous study (Ferré, Anglada-Tort, & Guasch, 2017). From the affective norms for English words (ANEW) database (Bradley & Lang, 1999) we obtained values for valence (rated on a 9-point scale where 1 was ‘very negative’ and 9 = ‘very positive’) and arousal (rated on a 9-point scale where 1 was ‘non-arousing’ and 9 was ‘very arousing’). To control for confounding aspects routinely considered in psycholinguistic research we matched the selected word on word frequency, length, and concreteness. Frequencies (relative frequency and log frequency), as well as values for length, were obtained from NIM, a search engine designed to provide psycholinguistic research materials (Guasch, Boada, Ferré, & Sánchez-Casas, 2012). Concreteness values were obtained from Brysbaert, Warriner, and Kuperman (2014), a normative study in which 37,059 English words were rated on a 5-point scale (1 = very abstract; 5 = very concrete). In addition, we aimed to control for the plausibility of the words to serve as titles of music pieces by presenting 24 words (8 positive, 8 negative, and 8 neutral) to a separate sample of 25 participants. In this pre-test, participants were asked to rate whether the words could serve as the title of a piece of music on a 5-point scale (1 = not at all, 5 = very much).
Table E.2 shows the nine words (3 positive, 3 negative, and 3 neutral) selected to be the titles, according to the following criteria: In the valence dimension, positive, negative, and neutral words should be significantly different (positive > negative > neutral). In the arousal dimension, positive and negative words should be equal and significantly different compared to neutral words (positive = negative > neutral). On the remaining dimensions, the nine words should not differ significantly. In addition, positive and negative words should be similarly extreme with regard to valence compared to neutral words. Valence magnitude was calculated by subtracting valence scores to the mid-point scale ‘5’ (e.g., a valence of 7 results in a valence magnitude of 2).
The affective, semantic, and lexical characteristics of the 9 words selected to be the titles are displayed in Appendix D of the paper published online. A one-way ANOVA with emotional content (positive, negative, and neutral words) as the between-group factor was used to check

175 E.2 Experiment 1
that conditions differed in the manipulated variables. This analysis revealed that positive, negative, and neutral words were significantly different in valence, F(2, 8) = 315.78, p < .001; valence magnitude, F(2, 8) = 80.68, p < .001; and arousal, F(2, 8) = 16.01, p = .004. No other variables showed statistical differences among conditions (all p-values > .05). The analysis also showed that negative and positive words did not differ significantly in arousal and valence magnitude (p-values > .05).
Table E.2 The nine words selected to be titles differing in emotional content.
Participants evaluated each music excerpt using 11 Likert rating scales, which were used to measure different dimensions of music evaluation and appreciation. Five rating scales were selected from a previous study (Herzog et al., 2017) where participants evaluated the same music excerpts presented without titles. These rating scales consisted in (1) liking of the music, on a scale from 1 (not at all) to 6 (very much), and the evaluation of how well different positive attributes fitted the music excerpt, namely, (2) ‘Beautiful’, (3) ‘Happy’, (4) ‘Inspiring’, and (5) ‘Authentic’, on a scale from 1 (very bad fit) to 6 (very good fit). We selected these five rating scales to measure different aspects of the aesthetic value of the music, as well as to enable the comparison of music evaluations in the presence and absence of titles. Cronbach’s alpha for these five rating scales was .87.
In addition, we created two sets of ratings designed to measure different aspects of the subjective value of the music. A set of three rating scales was used to measure personal value. Participants had to evaluate the degree of agreement to three statements: (6) “I want to find out more about the artist of the song”, (7) “I would share the song with my friends”, and (8) “I want to see the artist of the song play live”, on a scale from 1 (strongly disagree) to 7 (strongly agree). The second set of three ratings was designed to measure estimated commercial value, using the same agreement-disagreement 7-point scale. Participants had to rate the degree of agreement to three statements: (9) “The song has the potential to succeed commercially”, (10) “I think the song comes from a successful artist”, (11) “I think many people would like the song”. Cronbach’s alphas for the three rating scales measuring personal value and the three rating scales measuring commercial value were .91 and .87, respectively.

176 E.2 Experiment 1
At the end of the experiment, participants were provided with an open-text box and asked the following: “write down all songs that you can remember in any order and separated by commas. Do not worry if you cannot remember any, then just leave the box blank”. This unexpected free recall task was used to measure the effect of the emotionality of titles on memory. At the end of the experiment, participants were asked whether they thought that they were affected by the names presented with the music, on a scale from 1 (not at all) to 5 (always).
Procedure
Participants were tested using Qualtrics software (Qualtrics, Provo, UT). The use of head- phones was mandatory. Participants were told that the main purpose of the study was to investigate how people evaluate music. After reading the instructions, they were presented with the nine music excepts consecutively. For each music excerpt, participants were first asked to listen the “song” and answer whether they had heard it before. If they answered yes, they skipped the music excerpt and were directed to the next one. Secondly, participants were presented with the music excerpt and its title. To ensure that participants read the title, they were asked to write the title into a text box. Then, participants were provided with the 11 rating scales. Participants could listen to the music excerpts as many times as they wanted. On the evaluation form, each music excerpt was presented with its corresponding title on top and in bold type. After repeating the same procedure with the nine music excerpts, participants were asked to fill out the Gold-MSI questionnaire asking about their music training (Müllensiefen et al., 2014) and the energetic and rhythmic factor of the Short Test of Music preferences (STOMP; Rentfrow & Gosling, 2003), which included preference for dance and electronic music. At the end of the experiment, participants were presented with an unexpected free recall task and the rating scale asking to what extent they thought they were affected by the titles. The experiment was granted ethical clearance by the Ethics Committee of the Technische Universität Berlin, Germany.
Statistical Analysis
To investigate the effect of the emotionality of titles on evaluations of music, we followed a very similar analysis strategy as in Experiment 1, using linear mixed-effect models. Three mixed-effect models were computed using aesthetic value, personal value, and commercial value as dependent variables. In all analyses, the emotional category of the title (positive, negative, and neutral) was the fixed independent factor. Similar to Experiment 1, we used the corrected Akaike Information Criterion (AICc) and the Bayesian Information Criterion

177 E.2 Experiment 1
(BIC) to select the random effect structure. We specified four different models with (1) random intercept for participants only, (2) random intercepts for participants and music excerpts, (3) random intercepts for participants, music excerpt, and title, and (4) random intercepts for participants, music excerpt, and random slope for the emotional category of the titles affecting participants. In all analyses, model 2 achieved the smallest AICc and BIC values and we, therefore, chose the random effect structure to indicate random intercepts for participants and music excerpts.
To analyse the effect of titles on memory, we carried out a linear mixed-effect model using the number of remembered titles as the dependent variable. The emotionality of the remembered titles (positive, negative, or neutral) was the fixed factor and participants was the random effect factor.
In a subsequent exploratory step, we investigated whether several individual difference factors, which could be acting as moderating or confounding variables, contributed to the effect of titles. Separate linear mixed-effect models were conducted for each individual difference factor, using two dependent variables: aesthetic value and number of remembered titles. In all analyses, the emotional category of the title (positive, negative, and neutral), the specific individual difference factor, and their interaction served as fixed factors. We examined participants’ levels of English, music training, the STOMP preference factor for energetic and rhythmic music (including dance and electronic music), and testing conditions (i.e., whether participants were tested online or under laboratory conditions).
To study differences on the evaluation of popular music when the music was presented with and without titles, we created a dataset comprising the data from the ABCDJ project (Herzog et al., 2017; where the same music excerpts had been evaluated without titles) and the present study. Participants in the two studies used the same five rating scales to evaluate the music (like, beautiful, happy, inspiring, and authentic). From this previous study (Herzog et al., 2017), where 3.485 participants had evaluated 183 music excerpts, we selected those 597 participants (289 female and 308 male, aged 18-68, M = 42.69, SD = 13.57) who had evaluated at least one of the nine music excerpts used in the present study. Twenty-eight participants had evaluated two music excerpts, the remaining participants only had given ratings for one of the nine music stimuli. Separate linear mixed-effect models for each individual rating scale as dependent variables were run, resulting in five models. While the title condition (non-title, positive, negative, and neutral titles) was the fixed effect factor, participants and music excerpts were the random effect factors The non-title condition was used as the reference level. Additionally, we employed a model-based confidence interval. Thus, 95% confidence intervals around the estimates of the fixed effects coefficients were

178 E.2 Experiment 1
extracted from the linear mixed-effect models using the likelihood profile method. The model-based CIs are useful to determine whether there were significant differences between the three title conditions and the non-title condition.
E.3.2 Results
Title Effects on Aesthetic Value
The five rating scales measuring aesthetic properties of the music showed great sampling adequacy (KMO = .86 and all KMO values for individual ratings were > .83; Barlett’s test of sphericity X 2(10) = 2042.97, p < .001). A single component had an eigenvalue of 3.33, which is above Kaiser’s criterion of 1, and explained 66.66% of the variance. The scree plot was clear and indicated a solution with one component (see Appendix E, in the paper published online, for the loading of the three rating scales on the single component solution). The five rating scales were averaged per participant to form a single component score for aesthetic value.
The linear mixed-effect model regarding aesthetic value showed a main significant effect of the emotionality of titles (p< .05; see Appendix F, in the paper published online, for a summary table of the model). The marginal R2 (variance explained by the fixed factor) was .006 and the conditional R2 (variance explained by both fixed and random factors) was .334. As visible in Figure E.2, the music excerpts were evaluated significantly lower when presented with negative titles than when presented with neutral titles (p< .01). Although the difference between negative and positive titles was not significant, music excerpts presented with positive titles scored higher on aesthetic value than when they were presented with negative titles.
Title Effects on Personal Value
The three rating scales measuring personal value indicated good sampling adequacy (KMO = .76 and all KMO values for individual ratings were > .75; Barlett’s test of sphericity X 2(3) = 1474.94, p < .001). A single component had an eigenvalue of 2.56 and explained 85.34% of the variance. The scree plot was clear and indicated a solution with one component (see Appendix E in the published paper online). The three rating scales were averaged per participant to form a single component score for personal value.
The linear mixed-effect model predicting personal value did not reveal any main significant effect of the emotionality of titles (see Appendix F in the published paper online); the marginal R2 was 0.002 and the conditional R2 was 0.27. Nevertheless, the direction of the

179 E.2 Experiment 1
results was consistent with the other analyses (Figure E.2), where negative titles led to the lowest ratings and neutral titles to the highest.
Title Effects on Commercial Value
The three ratings measuring commercial value showed good sampling adequacy (KMO = .72 and all KMO values for individual ratings were > .68; Barlett’s test of sphericity X 2(3) = 1116.8, p < .001). A single component had an eigenvalue of 2.37 and explained 78.97% of the variance. The scree plot was clear and indicated a solution with one component (see Appendix E in the published paper online). Thus, the three rating scales were averaged per participant to form a single component score for estimated commercial value.
The linear mixed-effect model predicting the commercial value showed a significant main significant effect of the emotionality of titles (p< .05; see Appendix F in the published paper online). The marginal and conditional R2 were .005 and .341 respectively. As visible in Figure E.2, participants evaluated the music significantly lower in commercial value when presented with negative titles than when presented with neutral titles (p< .01). Although the difference between negative and positive titles was not significant, when music excerpts were presented with positive titles they scored higher on commercial value than when presented with negative titles.
Figure E.2 Participants’ rating scores in the three dimensions of music evaluation (error
bars represent the standard error).
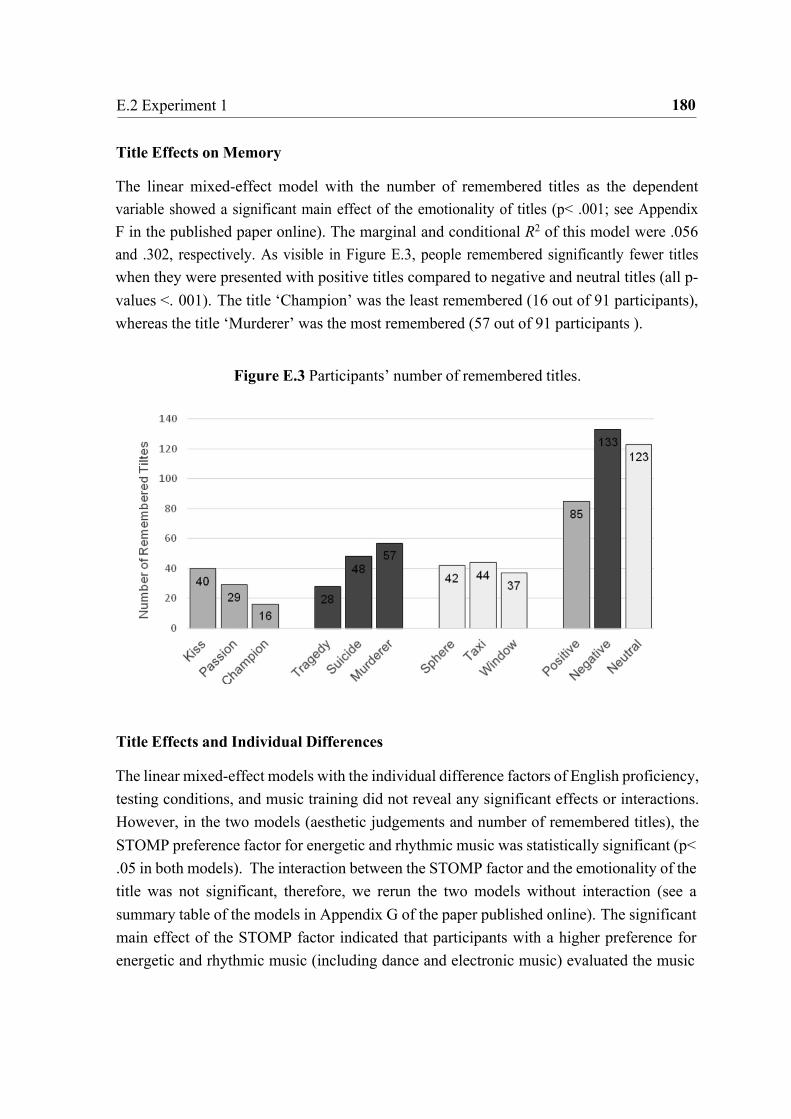
180 E.2 Experiment 1
Title Effects on Memory
The linear mixed-effect model with the number of remembered titles as the dependent variable showed a significant main effect of the emotionality of titles (p< .001; see Appendix F in the published paper online). The marginal and conditional R2 of this model were .056 and .302, respectively. As visible in Figure E.3, people remembered significantly fewer titles when they were presented with positive titles compared to negative and neutral titles (all p-values <. 001). The title ‘Champion’ was the least remembered (16 out of 91 participants), whereas the title ‘Murderer’ was the most remembered (57 out of 91 participants ).
Figure E.3 Participants’ number of remembered titles.
Title Effects and Individual Differences
The linear mixed-effect models with the individual difference factors of English proficiency, testing conditions, and music training did not reveal any significant effects or interactions. However, in the two models (aesthetic judgements and number of remembered titles), the STOMP preference factor for energetic and rhythmic music was statistically significant (p< .05 in both models). The interaction between the STOMP factor and the emotionality of the title was not significant, therefore, we rerun the two models without interaction (see a summary table of the models in Appendix G of the paper published online). The significant main effect of the STOMP factor indicated that participants with a higher preference for energetic and rhythmic music (including dance and electronic music) evaluated the music
181 E.2 Experiment 1
more positively and remembered more titles than those with a lower preference for this music style.
At the end of the experiment, participants were asked whether they thought that they were affected by the names presented with the music excerpts, on a scale from 1 (not at all) to 5 (always). The mean score of the 91 participants who had completed the experiment was 1.98 (SD = .97). In this question, 68.13 participants answered that they were ‘not at all’ (40.66%) or ‘rarely’ ( 27.47%) affected by the presence of titles.
Titles versus Non-Titles
The linear mixed-effect models with the five rating scales are summarised in Appendix H of the paper published online. Figure E.4 shows the outcome of the five linear mixed-effect models with the model-based CIs (95%) around the fixed effects. The linear mixed-effect model with the dependent variable ‘like’ revealed a significant main effect of titles (p< .001). The model-based CI showed that the same music excerpts were significantly less liked when presented without titles than when presented with titles, regardless of the emotional content of the title. The mixed-effect model with the dependent variable ‘inspiring’ also indicated a main effect of titles (p< .05). The model-based CI revealed that the same music excerpts were evaluated significantly less inspiring when presented without titles than in the presence of a title, although this difference was only significant when the non-title condition was compared with the neutral title group. Finally, the linear mixed-effect model with the dependent variable ‘beautiful’ showed a significant effect of titles (p< .05), although the model-based CI did not show any significant differences. This is probably because CIs were created using the likelihood profile method, which is considered more accurate and conservative compared to the Wald method used in the calculation of p-values in lmerTest (Kuznetsova et al., 2016). The models with the dependent variables ‘happy’ and ‘authentic’ were nonsignificant (p-values > .05).
Because the two samples of participants compared in this analysis were different in age range, we carried out an exploratory analysis to examine whether age was a significant factor. We repeated the same linear mixed-effect models adding age, title conditions, and the interaction between them as a fixed effect factors. Age and the title-age interaction were nonsignificant (p-values > .05).

182 E.2 Experiment 1
Figure E.4 Participants’ ratings in the four title conditions (error bars represent the confidence intervals extracted from the mixed-effect models).
E.3.3 Discussion
The results of Experiment 2 demonstrate that the emotional content of titles influences aes- thetic and value judgements of music. The titles also had a significant impact on participants’ memory for music. These findings support the existence of an affect heuristic making (Kah- neman & Frederick, 2002; Slovic et al., 2002) in aesthetic and music evaluations, in which emotional associations evoked by titles can influence listeners’ judgements and decisions.
Three different evaluative dimensions were measured: aesthetic value (e.g., liking or beau- tiful), estimated commercial value (e.g., I think many people would like this “song”), and personal value (e.g., I would share this “song” with my friends). Title effects were clear in the first two dimensions but did not have a significant impact on personal value. This suggests that the personal value of music may be more robust to the effects of titles and cognitive heuristics than other evaluative dimensions. It also provides some evidence for separating the two forms of the subjective value of music assessed in the study: a more personal dimension wherein people evaluate the individual satisfaction received from listening to the music and a more social dimension where the degree in which the music will be enjoyed by others is evaluated.
However, the interpretation of the direction and strength of the effect associated with the emotional content of titles is not simple: music is not necessarily influenced more positively

183 E.2 Experiment 1
by positive titles. In fact, participants gave the highest ratings when the music was presented with neutral titles. Arguably, these results could be justified by an interaction between the emotional content of the titles and the emotional content of the music, resulting in congruent and incongruent music-title pairs. An incongruent situation could arise from those cases where positively charged music was paired with a negative title or vice versa, resulting in negative judgements. Since neutral titles lacked emotional content, their combination with the music excerpts was mostly congruent, resulting in more positive judgements, regardless of the emotionality of the music. This hypothetical explanation is in line with a recent study by Margulis et al. (2017), who presented ambiguous music (i.e., music excerpts that could be perceived as positive or negative) with positive, negative, and neutral information. The authors found that ambiguous music was evaluated happier when presented with positive information and sadder when presented with negative information, suggesting that the emotional content of the music is key to determine the direction of the effects caused by the emotionality of the information. Moreover, in a study of art appreciation, Belke et al. (2010) found that titles related to the painting (congruent) were more liked than unrelated titles (incongruent). Importantly, the authors found that the effect of titles (whether they were related or unrelated) was moderated by the content of the paintings, in particular, by the degree of abstraction of the artworks, which lends some plausibility to our congruency hypothesis.
In an unexpected free recall task, music excerpts presented with neutral and negative titles were remembered significantly more often than positive titles. The title ‘murderer’, for instance, was remembered three times more frequently than the title ‘champion’. This result was unexpected, as it contradicts previous findings from the field of psycholinguistics, where researchers have found repeatedly a superiority for emotional words (positive and negative) over neutral words in memory (e.g., Ferré, 2003; Ferré et al., 2013; Herbert et al., 2008; Kensinger, 2008; Talami et al., 2007). This finding indicates that the interaction between the emotional content of titles and music is important to understand the effect of titles on music evaluation and memory.
Native English speakers and bilingual speakers were similarly influenced by titles. This result could be due to the sample of bilingual speakers used in this experiment, which was fairly proficient in their second language (English). Nevertheless, it is important to mention that in our sample of participants, there were twice as many bilinguals as native speakers. Future research should use a more balanced design in order to measure more accurately whether language proficiency may be associated with title effects. Additionally, there is evidence suggesting that the processing of emotional words is similar in the two languages of
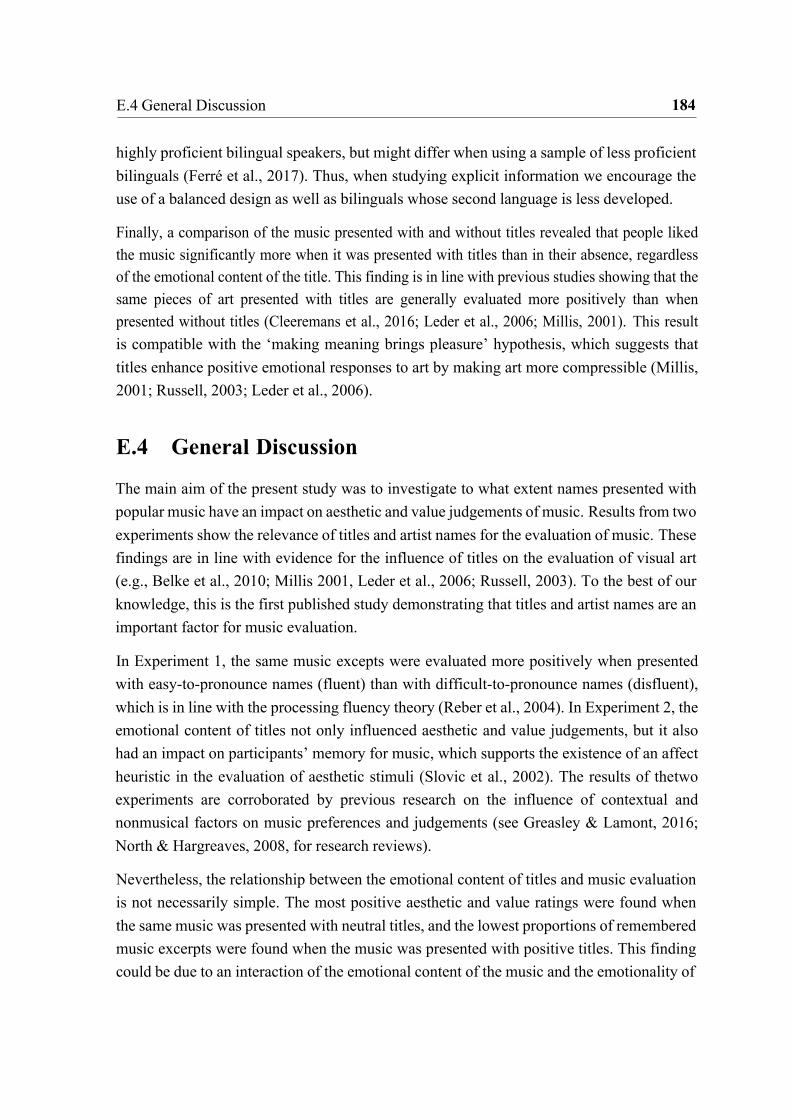
184 E.4 General Discussion
highly proficient bilingual speakers, but might differ when using a sample of less proficient bilinguals (Ferré et al., 2017). Thus, when studying explicit information we encourage the use of a balanced design as well as bilinguals whose second language is less developed.
Finally, a comparison of the music presented with and without titles revealed that people liked the music significantly more when it was presented with titles than in their absence, regardless of the emotional content of the title. This finding is in line with previous studies showing that the same pieces of art presented with titles are generally evaluated more positively than when presented without titles (Cleeremans et al., 2016; Leder et al., 2006; Millis, 2001). This result is compatible with the ‘making meaning brings pleasure’ hypothesis, which suggests that titles enhance positive emotional responses to art by making art more compressible (Millis, 2001; Russell, 2003; Leder et al., 2006).
E.4 General Discussion
The main aim of the present study was to investigate to what extent names presented with popular music have an impact on aesthetic and value judgements of music. Results from two experiments show the relevance of titles and artist names for the evaluation of music. These findings are in line with evidence for the influence of titles on the evaluation of visual art (e.g., Belke et al., 2010; Millis 2001, Leder et al., 2006; Russell, 2003). To the best of our knowledge, this is the first published study demonstrating that titles and artist names are an important factor for music evaluation.
In Experiment 1, the same music excepts were evaluated more positively when presented with easy-to-pronounce names (fluent) than with difficult-to-pronounce names (disfluent), which is in line with the processing fluency theory (Reber et al., 2004). In Experiment 2, the emotional content of titles not only influenced aesthetic and value judgements, but it also had an impact on participants’ memory for music, which supports the existence of an affect heuristic in the evaluation of aesthetic stimuli (Slovic et al., 2002). The results of the two experiments are corroborated by previous research on the influence of contextual and nonmusical factors on music preferences and judgements (see Greasley & Lamont, 2016; North & Hargreaves, 2008, for research reviews).
Nevertheless, the relationship between the emotional content of titles and music evaluation is not necessarily simple. The most positive aesthetic and value ratings were found when the same music was presented with neutral titles, and the lowest proportions of remembered music excerpts were found when the music was presented with positive titles. This finding could be due to an interaction of the emotional content of the music and the emotionality of

185 E.4 General Discussion
the title, resulting in congruent (e.g., positive music excerpts presented with a positive title) and incongruent (e.g., positive music excerpts presented with a negative title) situations. In order to explore this issue further, future research should control for the emotionality of the music in a more sophisticated way as well as assess the perceived congruency or fit between the music piece and the title.
It is important to mention that in the two experiments we only chose music excerpts from the same music genre (rock ‘n’ roll in Experiment 1 and dance/ electronica in Experiment 2). Thus, future research should investigate whether the effects of names presented with music are more or less important for different music styles, as well as further ways in which linguistic properties of the names can be manipulated. It would be also interesting to explore whether the names presented with the music will have a larger effect over time when the perceptual memory for the musical features fades, but the verbal information of the names might still be remembered.
In addition to measuring aesthetics properties of the music, the present research also studied evaluations of the perceived value of the music. In Experiment 2, we were able to distinguish between two types of judgements measuring the subjective value of the music: an evaluative dimension measuring personal satisfaction associated with the music stimuli and a more social dimension measuring the extent to which the music will be enjoyed by others. While the latter was significantly affected by the titles’ emotional content, the former was not.
In an attempt to show the relevance of title effects in the real-world, we used four rating scales shown by Egermann, Lepa, Schönrock, Herzog, and Steffens (2017) to be highly relevant for marketing practice. In this study, 305 marketing and audio branding experts were asked to choose from a list of 132 adjectives which they considered the most “relevant and important for marketing practice”. The attribute ‘authentic’ was chosen by the 87.54% (the most frequently chosen), ‘inspiring’ by 82.30%, ‘happy’ by 80.98%, and ‘beautiful’ by 80.33%. Results from Experiment 2 show that some of the most important attributes used by professionals to describe and evaluate music can be easily influenced by the content of titles.
It is important to mention that in the two experiments, the effects of titles and artist names were small in size. This is not surprising given that the music was not manipulated at all and the contextual information manipulated was minimal and could be processed very quickly by participants. The effects of titles on memory were the largest in size found in this study. In addition, participants’ levels of music training were not associated with the effects of titles and artist names in any of the two experiments. Interestingly, in Experiment 1 and 2 most
186 E.5 References
participants (94% and 77%, respectively) thought that they were not affected at all, or rarely, by the names presented with the music.
Research on behavioural economics and the psychology of decision making has been able to uncover systematic regularities that affect people when making decisions and judgements, known as heuristic principles (see Cartwright, 2014; Hastie & Dawes, 2010; Kahneman, 2011, for reviews). The study of these heuristic principles has laid the foundations of general psychological principles underlying and determining human judgement and decision making, such as the heuristic-and-biases framework (Kahneman & Tversky, 1984; Tversky & Kahneman, 1974) and the adaptive toolbox (Gigerenzer & Selten, 2002). Although these research frameworks have been highly influential in the fields of psychology, economics, political science and law, they have yet not been applied explicitly to the study of musical aesthetics, judgements, and choice behaviour. Results from the two experiments presented in this paper support the idea that like any other human judgement, evaluations of music also rely on cognitive heuristics that do not necessarily depend on the aesthetic stimuli themselves. Therefore, we hope to show potential applications and benefits of using knowledge from behavioural economics and decision making to study judgement and decision processes involving music, an approach we like to term the behavioural economics of music.
The present research shows that when presented with music, names and titles matter, they influence listeners’ evaluations of music, resulting in positive or negative judgement biases. Titles can also have an impact on memory. Finally, listeners liked the music significantly more when it was presented with titles than in their absence, regardless of the title’s emotional content. Demonstrating the relevance of titles and artist names for the evaluation of music has implications for many areas, including aesthetics, musical judgements and preferences, advertising, marketing, and audio branding. Using concepts from behavioural economics and decision making, we were able to identify two key heuristic principles (i.e., linguistic fluency and the affect heuristic) that play a significant role for music processing and evaluation. We can conclude, rephrasing Danto (1981), that titles and artist names are more than words, they are cues that influence the processes of perceiving and evaluating the music they accompany.
E.5 References Alter, A. L., & Oppenheimer, D. M. (2006). Predicting short-term stock fluctuations by
using processing fluency. Proceedings of the National Academy of Sciences, 103(24), 9369–9372.

187 E.5 References
Anglada-Tort, M., & Müllensiefen, D. (2017). The repeated recording illusion: The effects
of extrinsic and individual difference factors on musical judgements. Music Perception, 35(1), 92-115.
Bartlett, J. C., & Snelus, P. (1980). Lifespan memory for popular songs. The American Journal of Psychology, 93(3), 551.
Bates, D., Mächler, M., Bolker, B., & Walker, S. (2015). Fitting linear mixed-effects models using lme4. Journal of Statistical Software, 67(1), 1-48.
Behne, K.-E., & Wöllner, C. (2011). Seeing or hearing the pianists? A synopsis of an early audiovisual perception experiment and a replication. Musicae Scientiae, 15(3), 324-342.
Belke, B., Leder, H., Strobach, T., & Carbon, C. C. (2010). Cognitive fluency: High-level processing dynamics in art appreciation. Psychology of Aesthetics, Creativity, and the Arts, 4(4), 214–222.
Berlyne, D. E. (1971). Aesthetics and psychobiology. New York, NY: Appleton-Century- Crofts.
Berlyne, D. E. (1974). Studies in the new experimental aesthetics: steps toward an objective psychology of aesthetic appreciation. Oxford, UK: Hemisphere.
Blanchette, I., & Richards, A. (2010). The influence of affect on higher level cognition: A review of research on interpretation, judgement, decision making and reasoning. Cognition & Emotion, 24, 561-595.
Bonneville-Roussy, A., Rentfrow, P. J., Xu, M. K., & Potter, J. (2013). Music through the ages: Trends in musical engagement and preferences from adolescence through middle adulthood. Journal of Personality and Social Psychology, 105(4), 703–17.
Bradley, M. M., & Lang, P. P. J. (1999). Affective norms for English words ( ANEW ): Instruction manual and affective ratings. Technical Report C-1, The Center for Research in Psychophysiology, University of Florida.
Brysbaert, M., Warriner, A. B., & Kuperman, V. (2014). Concreteness ratings for 40 thousand generally known English word lemmas. Behavior Research Methods, 46(3), 904–911.
Cartwright, E. (2014). Behavioral Economics (2nd Ed.). New York: Routledge. Cleeremans A., Ginsburgh V., Klein O., Noury A. (2016) What’s in a name? The effect of an
artist’s name on aesthetic judgments. Empirical Studies of the Arts, 34, 126–139. Danto, A. C. (1981). The transfiguration of the commonplace: A philosophy of the art.
Cambridge, MA: Harvard University Press. Davidson, J. W., & Edgar, R. (2003). Gender and Race Bias in the Judgement of Western Art
Music Performance. Music Education Research, 5(2), 169–181.

188 E.5 References
Duerksen, G. L. (1972). Some effects of expectation on evaluation of recorded musical
performance. Journal of Research in Music Education, 20(2), 268-272. Egermann, H., Lepa, S., Schönrock, A., Herzog, M., & Stefenns, J. (2017). Development
and evaluation of a General Attribute Inventory for Music in Branding. In J. Ginsborg & A. Lamont (Eds.), Proceedings of the 25th Anniversary Conference of the European Society for the Cognitive Sciences of Music (ESCOM), Ghent, Belgium.
Egermann, H., Sutherland, M. E., Grewe, O., Nagel, F., Kopiez, R., Altenmüller, E., & Altenmuller, E. (2011). Does music listening in a social context alter experience? A physiological and psychological perspective on emotion. Musicae Scientiae, 15(3), 307–323.
Elliott, C. A. (1995). Race and gender as factors in judgments of musical performance. Bulletin of the Council for Research in Music Education, 127, 50-56.
Faul, F., Erdfelder, E., Lang, A.-G., & Buchner, A. (2007). G*Power 3: A flexible statistical power analysis program for the social, behavioral, and biomedical sciences. Behavior Research Methods, 39, 175-191.
Ferré, P. (2003). Effects of level of processing on memory for affectively valenced words. Cognition & Emotion, 17, 859-880.
Ferré, P., Anglada-Tort., M., Guash, M. (in press, 2017). Processing of emotional words in bilinguals: Testing the effects of words’ concreteness, task type, and language status. Second Language Research, 34(3), 371-394.
Ferré, P., Fraga, I., Comesaña, M., & Sánchez-Casas, R. (2015). Memory for emotional words: The role of semantic relatedness, encoding task and affective valence. Cognition & Emotion, 29(8), 1401-1410.
Finucane, M. L., Alhakami, A., Slovic, P., & Johnson, S. M. (2000). The affect heuristic in judgments of risks and benefits. Journal of Behavioral Decision Making, 13(1), 1-17.
Gerger, G., & Leder, H. (2015)Titles change the esthetic appreciations of paintings. Frontiers in Human Neuroscience, 9, 464.
Gigerenzer, G., & Selten, R. (2002). Bounded rationality: The adaptive toolbox. Cambridge, MA: MIT press.
Greasley, A. E., & Lamont, A. (2011). Exploring engagement with music in everyday life using experience sampling methodology. Musicae Scientiae, 15(1), 45–71.
Greasley, A., & Lamont, A. (2016). Musical preferences. In S. Hallam, I. Cross, & M. Thaut (Eds.), Oxford handbook of music psychology (2nd ed., pp. 263-281). Oxford, UK: Oxford University Press.
Greenberg, D. M., Baron-Cohen, S., Stillwell, D. J., Kosinski, M., & Rentfrow, P. J. (2015). Musical preferences are linked to cognitive styles. PLoS ONE, 10(7).

189 E.5 References
Griffiths, N. K. (2008). The effects of concert dress and physical appearance on perceptions
of female solo performers. Musicae Scientiae, 12(2), 273-290. Guasch, M., Boada, R., Ferré, P., & Sanchez-Casas, R. (2013). NIM: A web-based swiss
army knife to select stimuli for psycholinguistic studies. Behavior Research Methods, 45, 765–771.
Hargreaves, D. J., North, A. C., & Tarrant, M. (2006). Musical Preference and taste in child- hood and adolescence. In the child as musician: A handbook of musical development (pp. 135–154). Oxford, UK: Oxford University.
Hastie, R., & Dawes, R. M. (2010). Rational Choice in an Uncertain World: The Psychology of Judgement and Decision Making. Thousand Oaks, CA: SAGE Publications.
Herbert, C., Junghofer, M., & Kissler, J. (2008). Event related potentials to emotional adjectives during reading. Psychophysiology, 45, 487-498.
Herzog, M., Lepa, S., Egermann, H., Steffens, J., & Schönrock, A. (2017). Predicting musical meaning in audio branding scenarios. In J. Ginsborg & A. Lamont (Eds.), Proceedings of the 25th Anniversary Conference of the European Society for the Cognitive Sciences of Music (ESCOM), Ghent, Belgium.
Hsee, C. K., & Rottenstreich, Y. (2004). Music, pandas, and muggers: on the affective psychology of value. Journal of Experimental Psychology, 133(1), 23–30.
Jacoby, L. L., Kelley, C., Brown, J., & Jasechko, J. (1989). Becoming famous overnight: Limits on the ability to avoid unconscious influences of the past. Journal of Personality and Social Psychology, 56(3), 326–338.
Juchniewicz, J. (2008). The influence of physical movement on the perception of musical performance. Psychology of Music, 36, 417-427
Kahneman, D. (2011). Thinking, fast and slow. New York: Farrar, Straus and Giroux. Kahneman, D., & Frederick, S. (2002). Representativeness revisited: Attribute substitution
in intuitive judgment. In T. Gilovich, D. Friffin, D. Kahneman (Eds.), Heuristics and biases: The psychology of intuitive thought (pp. 49-81). New York: Cambridge University Press.
Kahneman, D., & Tversky, A. (1984). Choices, values, and frames. American psychologist, 39(4), 341.
Kapoula, Z., Daunys, G., Herbez, O., & Yang, Q. (2009). Effect of title on eye-movement exploration of cubist paintings by Fernand Léger. Perception, 38(4), 479–491.
Kensinger, E. A. (2008). Age differences in memory for arousing and nonarousing emotional words. The Journals of Gerontology Series B: Psychological Sciences and Social Sciences, 63, 13-18.

190 E.5 References
Kissler, J., & Herbert, C. (2013). Emotion, Etmnooi, or Emitoon?–Faster lexical access to
emotional than to neutral words during reading. Biological Psychology, 92, 464-479. Korenman, L. M., & Peynircioglu, Z. F. (2004). The role of familiarity in episodic memory
and metamemory for music. Journal of Experimental Psychology: Learning, Memory, and Cognition, 30(4), 917–22.
LeBlanc, A. (1982). An interactive theory of music preference. Journal of Music Therapy, 19(1), 28-45.
Leder, H., Carbon, C. C., & Ripsas, A. L. (2006). Entitling art: Influence of title information on understanding and appreciation of paintings. Acta Psychologica, 121(2), 176–198.
Loewenstein, G. F., Weber, E. U., Hsee, C. K., & Welch, N. (2001). Risks as feelings. Psychological Bulletin, , 127(2), 267.
Lonsdale, A. J., & North, A. C. (2011). Why do we listen to music? A uses and gratifications analysis. British Journal of Psychology, 102(1), 108–134.
Margulis, E. H. (2010). When program notes don’t help: Music descriptions and enjoyment. Psychology of Music, 38, 285-302.
Margulis, E. H., Kisida, B., & Greene, J. P. (2015). A knowing ear: The effect of explicit information on children’s experience of a musical performance. Psychology of Music, 43(4), 596-605.
Margulis, E. H., Levine, W. H., Simchy-Gross, R., & Kroger, C. (2017). Expressive intent, ambiguity, and aesthetic experiences of music and poetry. PloS ONE, 12(7), e0179145.
Millis, K. (2001). Making meaning brings pleasure: The influence of titles on aesthetic experiences. Emotion, 1(3), 320–329.
Müllensiefen, D., Gingras, B., Musil, J., & Stewart, L. (2014). The musicality of non- musicians: An index for assessing musical sophistication in the general population. PloS ONE, 9(2), e89642.
North, A. C., & Hargreaves, D. J. (1995). Subjective complexity, familiarity and liking for popular music. Psychomusicology, 14(1966), 77–93.
North, A. C. & Hargreaves, D. J. (2000a). Collative variables versus prototypicality. Empiri- cal Studies of the Arts, 18(1), 13–17.
North, A. C., & Hargreaves, D. J. (2005). Brief report: Labelling effects on the perceived deleterious consequences of pop music listening. Journal of adolescence, 28(3), 433- 440.
North, A. C., & Hargreaves, D. J. (2007). Lifestyle correlates of musical preference: 1. Relationships, living arrangements, beliefs, and crime. Psychology of Music, 35(1), 58–87.

191 E.5 References
North, A., & Hargreaves, D. (2008). The social and applied psychology of music. New York,
NY: Oxford University Press. North, A. C., Hargreaves, D. J., & Hargreaves, J. J. (2004). Uses of Music in Everyday Life.
Music Perception: An Interdisciplinary Journal, 22(1), 41–77. Pham, M. T., & Avnet, T. (2009). Contingent reliance on the affect heuristic as a function
of regulatory focus. Organizational Behavior and Human Decision Processes, 108(2), 267–278.
Platz, F., & Kopiez, R. (2012). When the eye listens: A meta-analysis of how audio-visual presentation enhances the appreciation of music performance. Music Perception, 30(1), 71–83.
Peynircioglu, Z. F., Rabinovitz, B. E., & Thompson, J. L. W. (2007). Memory and metamem- ory for songs: The relative effectiveness of titles, lyrics, and melodies as cues for each other. Psychology of Music, 36, 47–61.
Ratner, R. K., & Herbst, K. C. (2005). When good decisions have bad outcomes: The impact of affect on switching behavior. Organizational Behavior and Human Decision Processes, 96(1), 23–37.
Reber, R., Schwarz, N., & Winkielman, P. (2004). Processing fluency and aesthetic pleasure: Is beauty in the perceiver’s processing experience? Personality and Social Psychology Review, 8(4), 364-382.
Reber, R., Winkielman, P., & Schwarz, N. (1998). Effects of perceptual fluency on affective judgments. Psychological Science, 9(1), 45–48.
Rentfrow, P. J., Goldberg, L. R., & Levitin, D. J. (2011). The structure of musical preferences: a five-factor model. Journal of Personality and Social Psychology, 100(6), 1139–57.
Rentfrow, P. J., & Gosling, S. D. (2003). The do re mi’s of everyday life: The structure and personality correlates of music preferences. Journal of Personality and Social Psychology, 84(6), 1236-1256.
Rottenstreich, Y., & Hsee, C. K. (2001). Money, kisses, and electric shocks: on the affective psychology of risk. Psychological Science, 12(3), 185–190.
Russell, P. A. (1986). Experimental aesthetics of popular music recordings: Pleasingness, familiarity and chart performance. Psychology of Music, 14(1), 33–43.
Russell, P. A. (2003). Effort after meaning and the hedonic value of paintings. British Journal of Psychology, 94, 99–110.
Ryan, C., & Costa-Giomi, E. (2004). Attractiveness bias in the evaluation of young pianists’ performances. Journal of Research in Music Education, 52(2), 141.
Shah, A. K., & Oppenheimer, D. M. (2007). Easy does it: The role of fluency in cue weighting. Judgment and Decision Making, 2(6), 371–379.
192 E.5 References
Silveira, J. M., & Diaz, F. M. (2014). The effect of subtitles on listeners’ perceptions of
expressivity. Psychology of Music, 42(2), 233-250. Sloboda, J. A. (1999). Everyday uses of music listening: A preliminary study. In S. W. Yi
(Ed.) Music, mind and science (pp. 354-369). Seoul: Western Music Research Institute. Slovic, P., Finucane, M., Peters, E., & MacGregor, D. G. (2002). Rational actors or rational
fools: Implications of the affect heuristic for behavioral economics. Journal of Socio- Economics, 31(4), 329-342.
Swami, V. (2013). Context matters: Investigating the impact of contextual information on aesthetic appreciation of paintings by Max Ernst and Pablo Picasso. Psychology of Aesthetics, Creativity, and the Arts, 7(3), 285–295.
Talmi, D., Schimmack, U., Paterson, T., & Moscovitch, M. (2007). The role of attention and relatedness in emotionally enhanced memory. Emotion, 7(1), 89.
Tversky, A., & Kahneman, D. (1973). Availability: A heuristic for judging frequency and probability. Cognitive Psychology, 5(2), 207–232.
Tversky, A., & Kahneman, D. (1974). Judgment under uncertainty: Heuristics and biases. Science, 185(4157), 1124-1131.
Vuoskoski, J. K., & Eerola, T. (2013). Extramusical information contributes to emotions induced by music. Psychology of Music, 43(2), 262–274.
Wapnick, J., Mazza, J. K., & Darrow, A. A. (2000). Effects of performer attractiveness, stage behaviour, and dress on evaluation of children’s piano performances. Journal of Research in Music Education, 323(4), 323–335.
Whittlesea, B. W. A., & Leboe, J. P. (2000). The heuristic basis of remembering and classi- fication: Fluency, generation, and resemblance. Journal of Experimental Psychology: General, 129(1), 84–106.
Appendix F The effect of name recognition on listener choices (S6)
The following paper has not yet been accepted to a peer-reviewed journal. The text presented here is the most updated version of the manuscript as written by the time in which this thesis was published (August 2021). For presentation in this thesis, the appendices of the paper have been removed. Moreover, there may be minor modifications in the text to guarantee a consistent typographic style throughout the thesis, such as the position of figures and tables.
Author contribution I conceived the idea of this project and supervised it along with Prof. Dr. Jochen Steffens (Technische Universität Berlin). The study was conducted and developed by Till Noé as part of his master thesis in Audio Communication and Technology at Technische Universität Berlin (2018-2019). After Till completed his masters, I reanalyzed the data and Prof. Dr. Jochen Steffens wrote the paper for publication.
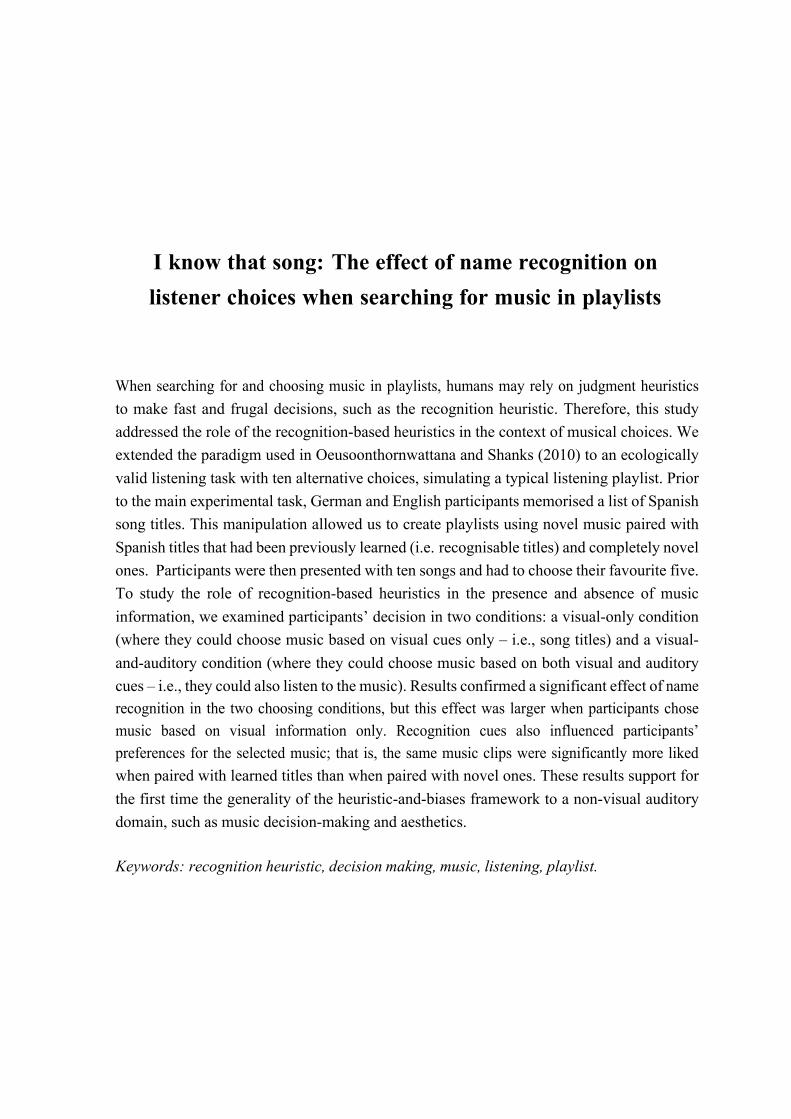
I know that song: The effect of name recognition on
listener choices when searching for music in playlists
When searching for and choosing music in playlists, humans may rely on judgment heuristics to make fast and frugal decisions, such as the recognition heuristic. Therefore, this study addressed the role of the recognition-based heuristics in the context of musical choices. We extended the paradigm used in Oeusoonthornwattana and Shanks (2010) to an ecologically valid listening task with ten alternative choices, simulating a typical listening playlist. Prior to the main experimental task, German and English participants memorised a list of Spanish song titles. This manipulation allowed us to create playlists using novel music paired with Spanish titles that had been previously learned (i.e. recognisable titles) and completely novel ones. Participants were then presented with ten songs and had to choose their favourite five. To study the role of recognition-based heuristics in the presence and absence of music information, we examined participants’ decision in two conditions: a visual-only condition (where they could choose music based on visual cues only – i.e., song titles) and a visual- and-auditory condition (where they could choose music based on both visual and auditory cues – i.e., they could also listen to the music). Results confirmed a significant effect of name recognition in the two choosing conditions, but this effect was larger when participants chose music based on visual information only. Recognition cues also influenced participants’ preferences for the selected music; that is, the same music clips were significantly more liked when paired with learned titles than when paired with novel ones. These results support for the first time the generality of the heuristic-and-biases framework to a non-visual auditory domain, such as music decision-making and aesthetics.
Keywords: recognition heuristic, decision making, music, listening, playlist.
195 F.1 Introduction
F.1 Introduction
In industrialised countries worldwide, people spend 18 hours a week on average listening to music (IFPI, 2019), thus constituting one of the most prominent activities in modern everyday life. In this digital era, listeners primarily rely on audio streaming services to choose and listen to music, such as Spotify, Apple Music, and Pandora. These services offer millions of songs and a myriad of curated, user-generated, and automatic playlists, confronting consumers with a seemingly endless range of musical choices. For artists and labels, the decisions of streaming users are crucial, as royalties depend on click counts which have become an essential element of monetisation after the steady decrease of record sales since the late 1990s (Routley, 2018). The increased importance of digital music listening for both the artist and the listener raises the theoretically and practically relevant question of how listeners choose music in this new era and which are the main mechanisms underlying such decision-making processes. In this paper, we examine the extent to which listeners rely on recognition-based heuristics when searching for and choosing music in playlists.
F.1.1 Choosing music in playlists
When listening to music, people permanently make decisions and judgements, which underlie specific patterns of musical preferences, choice behaviour, and contextual variables. This decision-making process becomes particularly interesting in the context of digital playlist listening, as musical choices are based on limited knowledge regarding the choices-at-hand. Over many years, research in music psychology has examined how the interplay between music, the listener, and the listening context determine individuals’ musical judgements and preferences (see Hargreaves, North, & Tarrant, 2006; Leblanc, 1982, for theoretical models; see Greasley & Lamont, 2016; North & Hargreaves, 2008, for research reviews). From this literature, it is clear that both music characteristics (e.g., loudness, tempo, familiarity) and individual differences across listeners (e.g., age, personality, personal values) play an essential role in determining music preferences and choices. Comparatively, the listening context has only received more considerable attention in recent years. Here, studies have focused on contextual and situational factors that influence music listening and evaluation, such as listening location (North, Hargreaves, & Hargreaves, 2004), activity (Greasley & Lamont, 2011), presence of others (e.g., Egermann et al., 2011), or time of day (e.g., North et al., 2004). For example, recent research presented comprehensive models of situational variables predicting musical choices, confirming that music preferences and choices are largely influenced by the listening context (Greb, Steffens, & Schlotz, 2018, 2019).

196 F.1 Introduction
Furthermore, studies have found that music evaluation does not always depend on the music itself but instead are influenced by several non-musical factors (e.g., Platz & Kopiez, 2012, Juchniewicz, 2008, Ryan & Costa-Giomi, 2004, Griffiths, 2010, Elliott, 1995). Amongst others, contextual information presented with a musical piece, such as descriptions about the music or artist (Anglada-Tort & Müllensiefen, 2017; Margulis, 2010), and even minimal linguistic manipulations in the title (Anglada-Tort, Steffens, & Müllensiefen, 2019) has been shown to significantly affect music evaluation. In line with the processing fluency (Reber, Schwarz, & Winkielman, 2004), Anglada-Tort et al. (2019) found that musical judgements were significantly more favourable when the music was presented with fluent titles (easy-to-pronounce names) compared to disfluent titles (difficult-to-pronounce names). However, to the best of our knowledge, no study has yet examined explicitly the role of cognitive biases and heuristics in music decision making, such as when choosing favourite songs in a music playlist.
Only recently, research in the field of Music Information Retrieval (MIR) has started to look into factors influencing the creation and evaluation of playlists, in particular, mostly provided by music recommendation algorithms (e.g., Barrington, Oda, & Lanckriet, 2009; Fields, 2011). A playlist can be defined as ‘a collection of songs grouped together under a particular principle’ (Barrington et al., 2009), or as ‘a set of songs meant to be listened to as a group, usually with an explicit order (Fields, Lamere, & Hornby, 2010). For example, a non-exhaustive list of factors influencing music selection and evaluation of playlists include a listener’s preference for and familiarity with a song, song coherence, the variety of songs and artists in the playlist, and other less specific factors such as a song’s freshness or coolness (Fields, 2011). As music is often consumed within a social context, factors such as song popularity are also assumed to play a crucial role in the perceived quality of the playlist (Barrington et al., 2009). Moreover, elements of the order in which the songs are arranged can have an effect, including song transitions, the overall structure of a playlist, and the occurrence of serendipity (Mooij & Verhaegh, 1997; Fields, 2011). A study by Barrington et al. (2009) further suggests that visibility of song and artist names can have a positive influence on playlist evaluations and decreased decision time compared to choosing songs from playlist where no such contextual information was presented.
Despite the wide range of psychological approaches that have been used to investigate music preferences and choice behaviour, the cognitive mechanisms underlying decision-making while listeners search for and choose music in playlists are still largely unknown. Here, we see great potential on the heuristics-and-biases framework (see Dawes & Hastie, 2010; Dhami, 2016; Kahneman, 2011, for reviews), a highly influential research agenda in behavioural
197 F.1 Introduction
economics and the psychology of decision making that has been rarely applied to the study of musical behaviour and aesthetics. Thus, this paper proposes that the heuristics-and-biases framework can provide a novel perspective on how humans make decisions while searching and listening to music in playlists. In particular, we focus on recognition-based heuristics.
F.1.2 Recognition-based heuristics
When searching for and choosing music in playlists, individuals may rely on judgment heuristics to make fast (in terms of computing time) and frugal (in the use of information) decisions. The adaptive toolbox of human judgment and decision making (Gigerenzer & Todd, 1999) proposes several judgemental heuristics that are ecologically rational – i.e., task-specific decision strategies that are simple to execute and allow people to make better decisions. A core heuristic in this tool-box is the recognition heuristic which states that when people are faced with recognized and unrecognized options, they infer that the recognized one has the higher value concerning the criterion being judged and, therefore, they tend to choose it (Goldstein & Gigerenzer, 2002). The original recognition heuristic was primarily developed in the context of inferential choice tasks, such as when deciding which of two cities has more inhabitants ( Gigerenzer & Goldstein, 2011). However, previous studies have shown that recognition-based strategies also apply in preferential choice tasks, such as in the domain of risk (Brandstätter, Gigerenzer, & Hertwig, 2006) and consumer choice (Oeusoonthornwattana & Shanks, 2010; Thoma & Williams, 2013). For example, Oeusoonthornwattana and Shanks (2010) found that participants’ choices of brands were primarily based on recognition, i.e., well-known brands were preferred and more frequently chosen than less known brands (although additional information about the well-known brands also had a significant impact on the proportion of chosen brands). Research on the mere exposure effect also supports the highly influential role of recognition on preference and choice (Zajonc, 1968; see Bornstein, 1989, for a review). Studies in different domains have shown that our preferences, for example for nonsense words (Zajonc, 1968), brands (Hoyer & Brown, 1990), or music (Szpunar, Schellenberg, & Pliner, 2004), are connected to their familiarity.
F.1.3 Aims and hypotheses
The present study aims to investigate the role of recognition-based heuristics when people search for and choose music in playlists. In particular, we extended the paradigm used in Oeusoonthornwattana and Shanks (2010) to a listening task with ten alternative choices, simulating a typical listening playlist. Prior to the main experimental task, participants (German and English speakers) had to learn a list of Spanish song titles. This manipulation

198 F.2 Methods
allowed us to create playlists using novel music paired with Spanish titles that had been previously learned (i.e. recognisable titles) and completely novel ones. In this 10-alternative- forced-choice paradigm, participants were presented with ten songs in a playlist format and had to choose their favourite five. To determine whether participants use recognition-based heuristics even when presented with music, they had to select music in two different playlist conditions: a visual-only condition (where they could only choose music based on verbal cues – i.e., song titles) and a visual-and-auditory condition (where they could choose music based on both verbal and music cues – i.e., they could also listen to the music). In the course of the experiment, we tested three hypotheses:
• H1 - Listeners will rely on recognition cues when searching for and choosing music in the two playlists conditions.
• H2 - The effect of name recognition will be larger when listeners choose music only based on verbal cues than when choosing music based on both verbal and music cues.
• H3 - Listeners’ preferences for the music will be significantly higher when the music is paired with recognized titles than with novel ones.
F.2 Methods
F.2.1 Participants
A total of 99 participants (35 female, 63 male, one divers) with an average age of 33.7 years (SD = 9.3) took part in the experiment and were included in the final analysis. The study was advertised via social media channels and university email lists and conducted online using LimeSurvey software. The experiment lasted about 10-15 minutes on average. The majority of the test subjects were German native speakers (92.9%), whereas the remaining 7.1% were English native speakers. None of the participants was fluent in Spanish.
F.2.2 Design
The experiment used a within-participants design measuring participants’ choices in a 10- alternative-forced choice task, resembling a common choosing situation in a music playlist. In two playlist conditions, participants were presented with a set of ten songs randomly paired with five recognisable titles and five new ones. In the visual-only condition, participants had to choose their five favourite songs based only on visual cues (i.e., song title), whereas in the visual-and-auditory condition they could also listen to the music clips. Thus, the independent
199 F.2 Methods
variables were the recognition of the music title (learned vs novel) and choosing condition (visual-only vs visual-and-auditory). The dependent variables were the participants’ choices and liking ratings of the chosen music.
F.2.3 Materials
We used an ecologically valid playlist design, comparable to common digital music platforms such as Spotify, Pandora, or Apple Music. This playlist enabled a parallel presentation of 10 titles and songs offering more than two choice options at the same time (as opposed to many studies restricted to two choices only, such as Oeusoonthornwattana & Shanks, 2010; Thoma & Williams, 2013). The music titles consisted of Spanish titles obtained from actual Spotify playlists. The decision to use Spanish titles was made to ensure that all titles were novel to our non-Spanish speaking participants. To reduce potential confounding effects associated with the linguistic properties of the titles, these were selected according to the following criteria: (i) all titles had to be similar in word count and length and thus only included titles consisting of one word and 5-9 characters, (ii) highly frequent words in Spanish (those with a relative frequency of more than 5,000) were excluded, and (iii) we also considered the orthographic similarity (OS) between the Spanish words of the song titles and their English and German translations, only including words with an OS value smaller than 0.3. To retrieve these linguistic variables from the Spanish titles, we used the NIM stimulus search engine for psycholinguists (Guasch, Boada, Ferré, & Sánchez-Casas, 2013). Based on these criteria, we selected 30 music titles. The titles were randomly divided to create two test versions (A and B). In the test version A, one set of the titles was novel, and the other set learned and, therefore, included in the learning phase. In the test version B, the order was reversed, i.e., the first set of titles was learned and the other set novel. Half of the participants were randomly allocated to version A and the other half to version B.
For the music stimuli, we used 30-seconds excerpts of 15 non-vocal dance/electronica tracks that had been previously evaluated by 62-116 participants regarding their familiarity, liking, and musical expression (Lepa, Herzog, Steffens, Schoenrock, & Egermann, 2020). To avoid the recognition of single tracks and associated popularity effects, we only selected songs with low familiarity scores (with a mean value of 1.8, on a scale of 1-6, SD = 0.6). To control for music liking, we selected music excerpts with similar liking ratings, with an average score of 3-4, on a scale of 1-6 (SD = 0.3). The assignment of the music pieces to the individual titles was randomly carried out over both experimental phases.

200 F.2 Methods
F.2.4 Procedure
Participants could choose between German and English as the language of instruction. First, a declaration of consent was issued, in which we explained the voluntary nature of participation and the possibility of quitting the study at any time. Then participants reported on sociodemographic variables age, gender and highest education, and language skills. As already announced in the advertisement for this study, only native German or English speakers who did not speak Spanish were allowed to the study. Participants who reported to speak Spanish were directly excluded. Participants were then randomly assigned to one of two test versions (test version A: 43 participants; version B: 56 participants) which differed only in the assignment of the music titles.
The first part of the experiment consisted of a learning phase in which participants were instructed to take as much time as they needed to memorise ten Spanish names displayed on the screen. To enhance the learning effect, they further were asked to write down the name of the song in a text field right to the respective titles and forced to remain on the slide for at least two minutes, as visualised by a continuous green bar at the top of the screen. The success of the learning phase was measured in a subsequent recognition task. In detail, participants were presented all ten Spanish names together with ten new (and henceforth unknown) ones. They had to select those names that had been shown previously without being informed about the exact number to be selected. Participants reported the recognized song titles using yes/no buttons. As feedback, correct and omitted hits were shown in green and yellow, respectively. If titles had been forgotten, participants were asked via to re-enter them in a text field. Titles that were falsely recognized were not reported back to participants in order not to draw further attention to them.
In the visual-only condition, participants were presented with a list formed by ten songs. For each participant, half of them were randomly paired with five previously learned names, while the other half was paired with five novel names. Participants were instructed that they should imagine that they are presented with this list of music titles, but are only allowed to listen to five titles and asked which five songs they would choose. Thus, in this phase, participants chose music only based on verbal information. Accordingly, they were asked to listen to these songs and to rate them on a five-step Likert scale ranging from ’I do not like it at all’ to ’I like it very much". The five selected songs were randomly assigned to five of the music excerpts.
In the visual-and-auditory condition, participants were presented with another playlist formed by ten songs. Again, half of them were randomly paired with five previously learned names
201 F.2 Methods
and the other half with five novel names. This time, participants were asked to listen to all ten songs by clicking on the respective play buttons and then to rate the songs on a five-step Likert scale. Also, they had to select five favourites from these ten songs; thus, in this phase, participants chose music based on both musical and visual information.
At the end of the experiment, participants reported on sociodemographic information (i.e., age, gender, and highest education). Besides, they filled out questionnaires related to the ’Active use of music’ and ’Musical education’ belonging to the ’The Goldsmiths Musical Sophistication Index’ (Gold-MSI) (Müllensiefen, Gingras, Musil, & Stewart, 2014). Finally, the general preference of the genre ’Dance/Electronica’ was obtained.
F.2.5 Statistical Analysis
Seven participants who reported less than four titles (40%) correctly in the recognition phase were excluded, resulting in 99 participants included in the subsequent analysis. To test the main hypotheses regarding the effect of title recognition on music choices, we used generalised linear mixed-effects models (GLMERs), using a binomial link function and an adaptive Gauss-Hermite approximation which is less prone to singularity problems (Handayani, Notodiputro, Sadik, & Kurnia, 2017). With binomial GLMERs, the non- aggregated data is analysed at the trial level, treating the dependent variable as binary (chosen vs not chosen) and taking the repeated measurement structure of the participant choices into account. Moreover, GLMER can model random variability by estimating assuming random intercepts for different relevant factors, such as participants and music clips (Baayen, Davidson, & Bates, 2008; Pinheiro & Bates, 2001).
Firstly, we combined the data of the two choosing conditions, visual-only (where participants chose music only based on verbal cues) and visual-and-auditory (where participants chose music based on both music and verbal cues), to examine the extent to which participants’ choices relied on the recognition-based heuristics in the two choosing conditions. Secondly, we conducted a generalized linear mixed-effects model using participants’ choice (chosen vs not chosen) as a binary dependent variable. The independent variables were the recognition of the title (learned vs novel), the choosing condition (visual-only vs visual-and-auditory), and the interaction term between these two factors. The random-effects structure included a random intercept for the titles and the participants. Furthermore, to analyse the effect of song recognition on liking judgments in both choosing phases, we computed a linear mixed-effects model using participants’ rating as the dependent variable and title recognition, the choosing phase and their interaction term as independent variables. The random-effects structure included a random intercept for the five (visual-only condition) or ten (visual-and-
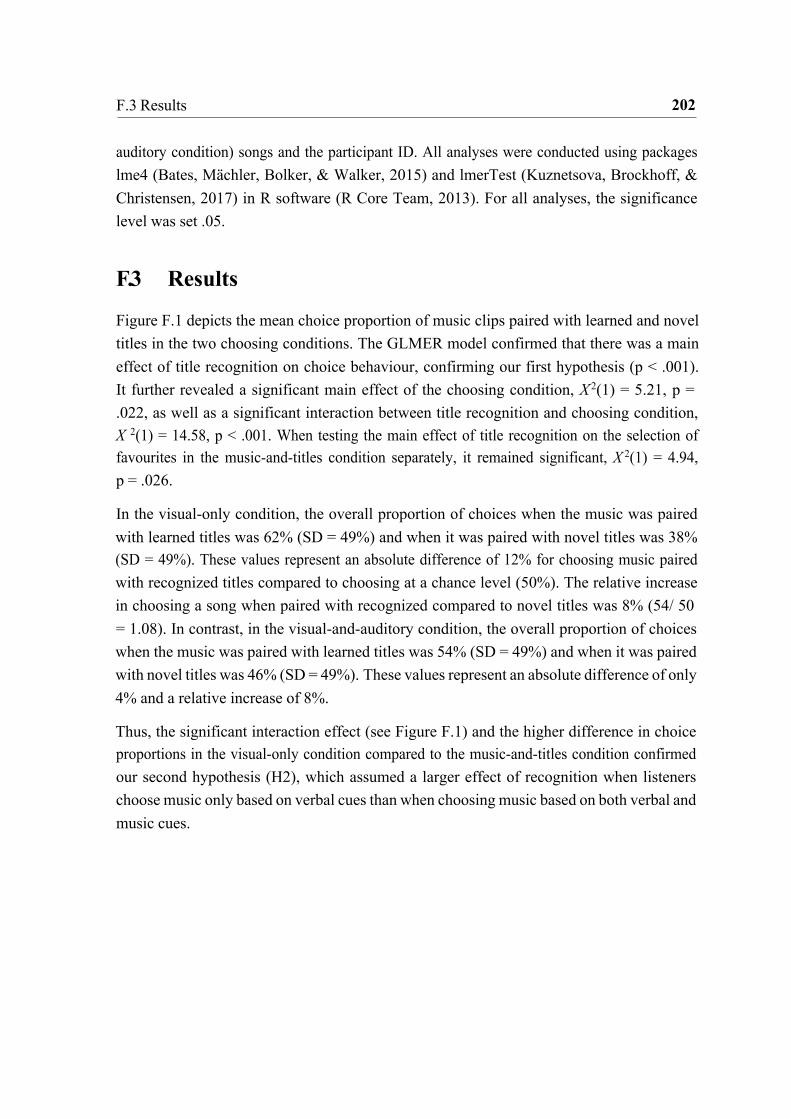
202 F.3 Results
auditory condition) songs and the participant ID. All analyses were conducted using packages lme4 (Bates, Mächler, Bolker, & Walker, 2015) and lmerTest (Kuznetsova, Brockhoff, & Christensen, 2017) in R software (R Core Team, 2013). For all analyses, the significance level was set .05.
F.3 Results
Figure F.1 depicts the mean choice proportion of music clips paired with learned and novel titles in the two choosing conditions. The GLMER model confirmed that there was a main effect of title recognition on choice behaviour, confirming our first hypothesis (p < .001). It further revealed a significant main effect of the choosing condition, X 2(1) = 5.21, p = .022, as well as a significant interaction between title recognition and choosing condition, X 2(1) = 14.58, p < .001. When testing the main effect of title recognition on the selection of favourites in the music-and-titles condition separately, it remained significant, X 2(1) = 4.94, p = .026.
In the visual-only condition, the overall proportion of choices when the music was paired with learned titles was 62% (SD = 49%) and when it was paired with novel titles was 38% (SD = 49%). These values represent an absolute difference of 12% for choosing music paired with recognized titles compared to choosing at a chance level (50%). The relative increase in choosing a song when paired with recognized compared to novel titles was 8% (54/ 50 = 1.08). In contrast, in the visual-and-auditory condition, the overall proportion of choices when the music was paired with learned titles was 54% (SD = 49%) and when it was paired with novel titles was 46% (SD = 49%). These values represent an absolute difference of only 4% and a relative increase of 8%.
Thus, the significant interaction effect (see Figure F.1) and the higher difference in choice proportions in the visual-only condition compared to the music-and-titles condition confirmed our second hypothesis (H2), which assumed a larger effect of recognition when listeners choose music only based on verbal cues than when choosing music based on both verbal and music cues.
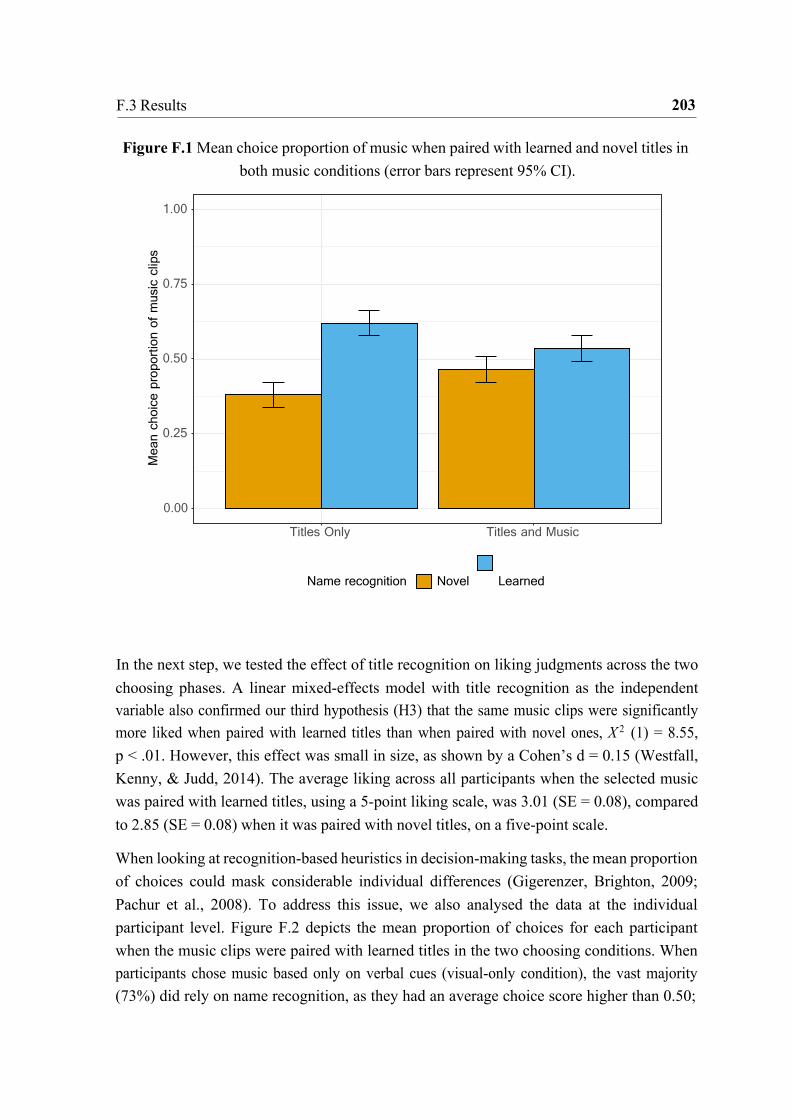
203 F.3 Results
Figure F.1 Mean choice proportion of music when paired with learned and novel titles in both music conditions (error bars represent 95% CI).
1.00
0.75
0.50
0.25
0.00
Titles Only
Titles and Music
Name recognition Novel Learned
In the next step, we tested the effect of title recognition on liking judgments across the two choosing phases. A linear mixed-effects model with title recognition as the independent variable also confirmed our third hypothesis (H3) that the same music clips were significantly more liked when paired with learned titles than when paired with novel ones, X 2 (1) = 8.55, p < .01. However, this effect was small in size, as shown by a Cohen’s d = 0.15 (Westfall, Kenny, & Judd, 2014). The average liking across all participants when the selected music was paired with learned titles, using a 5-point liking scale, was 3.01 (SE = 0.08), compared to 2.85 (SE = 0.08) when it was paired with novel titles, on a five-point scale.
When looking at recognition-based heuristics in decision-making tasks, the mean proportion of choices could mask considerable individual differences (Gigerenzer, Brighton, 2009; Pachur et al., 2008). To address this issue, we also analysed the data at the individual participant level. Figure F.2 depicts the mean proportion of choices for each participant when the music clips were paired with learned titles in the two choosing conditions. When participants chose music based only on verbal cues (visual-only condition), the vast majority (73%) did rely on name recognition, as they had an average choice score higher than 0.50;
Mea
n ch
oice
pro
port
ion
of m
usic
clip
s

204 F.3 Results
that is, they chose a music clip paired with a recognised title more than half of the time. The remaining 27% did not rely on recognition-based heuristics, as they had scores equal to or lower than .50. A sign test confirmed that the number of participants relying on recognition- based heuristics when choosing music in playlists (n = 72) was significantly higher than above chance (95% CI [0.63, 0.82], p < .001). When participants chose music based on both verbal and music cues (visual-and-auditory condition), the majority (61%) also relied on recognition-based heuristics, although to a lesser extent compared to the visual-only condition. The remaining 39% did not rely on recognition-based heuristics, as they had mean choice proportions equal to or lower than .50. A sign test confirmed that the number of participants relying on recognition-based heuristics when choosing music in playlists (n = 60) was significantly higher than above chance (95% CI [0.50, 0.70], p = .04), although this difference was marginal.
Figure F.2 Mean individual choice proportion of music clips when paired with recognized
titles in the two choosing conditions.
Each bar represents one participant, with the height showing the proportion of choice when the music clips
were paired with learned titles. Orange bars indicate those cases where the mean choice proportion was higher
than 50% and, therefore, participants relied on recognition cue, whereas blue bars indicate those cases where
the mean choice proportion was equal or lower than 50%.

205 F.4 Discussion
F.4 Discussion
The present study examined the influence of recognition-based heuristics on the selection and aesthetic evaluation of music in the context of playlist listening. Our results showed that the recognition of previously learned names positively affected both the likelihood of selecting the associated song as well as its subsequent aesthetic evaluation. The effect of title recognition on musical choices was more substantial when only visual information (i.e., song titles; visual-only condition) was available compared to both visual and music information. Nevertheless, participants’ choices were still influenced significantly by name recognition when they could listen to the actual music (visual-and-auditory condition). The findings were supported both by an aggregated analysis of participants’ mean proportion of choices as well as an analysis at the individual level. Thus, these results support previous work on the recognition heuristic in inferential choice tasks (Goldstein & Gigerenzer, 2002) and previous studies showing the role of recognition-based heuristics on preference (Oeusoonthornwattana & Shanks, 2010; Thoma & Williams, 2013). Moreover, our study corroborates previous findings suggesting that when listening to music, listeners are limited by their cognitive capacity, time, and information available and, consequently, they rely on cognitive biases and heuristics, including framing ( Anglada-Tort & Müllensiefen, 2017; Aydogan et al., 2018; North & Hargreaves, 2008), the availability heuristic (Vuvan, Podolak, & Schmuckler, 2014), processing fluency (Anglada-Tort et al., 2019; Nunes, Ordanini, & Valsesia, 2015), and the peak-end rule (Rozin, Rozin, & Goldberg, 2004).
It is essential to consider how recognition-based heuristics may be operating under ecological rationality when using names as a recognition cue for music selection and evaluation. In inferential choice tasks, the use of recognition-based heuristics is ecologically rational only if recognition is correlated with a mediator variable, which in turn is correlated with the criterion (Goldstein & Gigerenzer, 1999, 2002). For instance, the recognition of a city’s name is correlated with the frequency of its appearances in the media, which in turn is correlated with its size or population. This logic cannot be transferred to preferential choice tasks as preference is subjective by nature and cannot be assessed based on an objective criterion (Brandstätter et al., 2006). However, an explanation for ecological rationality in the context of this study could be that name recognition is a proxy for both the general popularity of and personal familiarity with a song. That is, as ‘good’ songs are likely to be popular (i.e., be liked by many other people), the popularity of a song can be a mediator that reliably correlates with someone’s own preferences. The popularity of a song might further trigger well-known social influences on music selection and evaluation (Crozier, 2009). Moreover, the recognition of a title could make the listener believe that they know the underlying

206 F.4 Discussion
musical piece. This feigned personal familiarity with a musical piece might thus function as a second mediator, as familiarity is linked with the liking for and enjoyment of a musical piece in the course of the mere-exposure effect (Zajonc, 1968; Peretz & Gaudreau, 1998).
Two limitations associated with our experimental design must be addressed. Firstly, according to Gigerenzer and Goldstein (2011), studies on recognition heuristics should rely on natural memories of the object to be recognised rather than artificially inducing memories through an experiment, since in this case the memory is exclusively attributable to the experiment and natural memories are usually not limited to a single source. The learning of the Spanish song titles affecting music selection and evaluation was learned within the experimental setting; it is thus possible that this design feature might have artificially enhanced the effect of the recognition-based heuristics. In analogy to Oeusoonthornwattana and Shanks (2010), the fact that we implemented a recall phase after the learning phase in which participants had to report on the learned titles may have created a task demand for participants to consider that information in making their choices. Secondly, we did not consider the degree of involvement of our participants while taking part in the study. Models of persuasion, including the Elaboration Likelihood Model (Petty & Cacioppo, 1986) and the Heuristic- Systematic Model (Chaiken, 1980), suggest that peripheral cues (such as title recognition) are more persuasive under low-involvement consumption. Thus, in a real-world situation, title recognition may be less influential when consumers are highly involved and motivated in listening to a specific piece. Thus, we encourage future research to use more ecological approaches to validate the findings in real-world situations, using personal playlists and taking into account moderating variables, such as the time available/spent to choose music in a specific situation and the associated functions of music listening (Greb, Schlotz, & Steffens, 2018).
Overall, however, the present study contributes to the literature by examining how people make choices when searching for music in playlists, utilising a naturalistic task with more than two choices. This is the first study supporting the generality of recognition-based heuristics to a non-visual auditory domain. Beyond the theoretical implications of these findings, the outcome of this study might be of particular interest for music industry practitioners and distributors. For example, one can use the results of our study to quantify the effectiveness of marketing strategies to increase artist name and song title recognition. That is, pairing novel music with titles that can be recognised by the target listener (as opposed to novel ones) increases the likelihood that they will choose that music by 12%, when screening playlists based on verbal cues only, and 4% when they also listen to the music. In conclusion, the growing role of music streaming services highlights both the theoretical and practical
207 F.5 References
relevance of investigating music selection behaviour in the digital era. Here, the findings of our study highlight the central role of contextual information presented with music, such as the recognition of song titles, and the need to understand better the decision-making processes underlying music decision making.
F.5 References Anglada-Tort, M., & Müllensiefen, D. (2017). The Repeated Recording Illusion. Music
Perception: An Interdisciplinary Journal, 35(1), 94–117. Anglada-Tort, M., Steffens, J., & Müllensiefen, D. (2019). Names and titles matter: The
impact of linguistic fluency and the affect heuristic on aesthetic and value judgements of music. Psychology of Aesthetics, Creativity, and the Arts, 13(3), 277–292.
Aydogan, G., Flaig, N., Ravi, S. N., Large, E. W., McClure, S. M., & Margulis, E. H. (2018). Overcoming bias: Cognitive control reduces susceptibility to framing effects in evaluating musical performance. Scientific Reports, 8(1), 1–9.
Baayen, R. H., Davidson, D. J., & Bates, D. M. (2008). Mixed-effects modeling with crossed random effects for subjects and items. Journal of Memory and Language, 59(4), 390–412.
Barrington, L., Oda, R., & Lanckriet, G. R. (2009). Smarter than Genius? Human Evaluation of Music Recommender Systems. In Proceedings of the 10th International Society for Music Information Retrieval Conference (ISMIR 2009), Kobe, Japan.
Bates, D., Mächler, M., Bolker, B., & Walker, S. (2015). Fitting Linear Mixed-Effects Models Using lme4. Journal of Statistical Software, 67(1).
Bornstein, R. F. (1989). Exposure and affect: overview and meta-analysis of research, 1968–1987. Psychological Bulletin, 106(2), 265.
Brandstätter, E., Gigerenzer, G., & Hertwig, R. (2006). The priority heuristic: making choices without trade-offs. Psychological Review, 113(2), 409.
Chaiken, S. (1980). Heuristic versus systematic information processing and the use of source versus message cues in persuasion. Journal of Personality and Social Psychology, 39(5), 752.
Crozier, W. R. (2009). Music and social influence. In D. J. Hargreaves & A. C. North (Eds.), The social psychology of music (pp. 67–83). Oxford: Oxford Univ. Press.
Egermann, H., Sutherland, M. E., Grewe, O., Nagel, F., Kopiez, R., & Altenmüller, E. (2011). Does music listening in a social context alter experience? A physiological and psychological perspective on emotion. Musicae Scientiae, 15(3), 307–323.

208 F.5 References
Elliott, C. A. (1995). Race and gender as factors in judgments of musical performance.
Bulletin of the Council for Research in Music Education, 50–56. Fields, B. (2011). Contextualize your listening: The playlist as recommendation engine (PhD
thesis). Goldsmiths College (University of London). Fields, B., Lamere, P., & Hornby, N. (2010). Finding a path through the juke box: The
playlist tutorial. In Proceedings of the 11th International Society for Music Information Retrieval Conference (ISMIR)., Utrecht, Netherlands.
Gigerenzer, G., & Goldstein, D. G. (2011). The recognition heuristic: A decade of research. Judgment and Decision Making, 6(1), 100–121.
Gigerenzer, G., & Todd, P. M. (1999). Fast and frugal heuristics: The adaptive toolbox. In Simple heuristics that make us smart (pp. 3–34). Oxford University Press.
Goldstein, D. G., & Gigerenzer, G. (2002). Models of ecological rationality: the recognition heuristic. Psychological Review, 109(1), 75–90.
Greasley, A. E., & Lamont, A. (2011). Exploring engagement with music in everyday life using experience sampling methodology. Musicae Scientiae, 15(1), 45–71.
Greasley, A. E., & Lamont, A. (2016). Musical preferences. In S. Hallam, I. Cross, & M. Thaut (Eds.), Oxford handbook of music psychology (2nd ed., pp. 263–284). Oxford University Press.
Greb, F., Schlotz, W., & Steffens, J. (2018). Personal and situational influences on the functions of music listening. Psychology of Music, 46(6), 763-794.
Greb, F., Steffens, J., & Schlotz, W. (2018). Understanding music-selection behavior via statistical learning. Music & Science, 1(2), 205920431875595.
Greb, F., Steffens, J., & Schlotz, W. (2019). Modeling Music-Selection Behavior in Everyday Life: A Multilevel Statistical Learning Approach and Mediation Analysis of Experience Sampling Data. Frontiers in Psychology, 10, 390.
Griffiths, N. K. (2010). ‘Posh music should equal posh dress’: an investigation into the concert dress and physical appearance of female soloists. Psychology of Music, 38(2), 159–177.
Guasch, M., Boada, R., Ferré, P., & Sánchez-Casas, R. (2013). NIM: A Web-based Swiss army knife to select stimuli for psycholinguistic studies.Behavior Research Methods, 45(3), 765–771.
Hargreaves, North, A. C., & Tarrant, M. (2006). Musical Preference and Taste in Childhood and Adolescence. In G. McPherson (Ed.), The Child as Musician (pp. 135–154). Oxford University Press.
Hoyer, W. D., & Brown, S. P. (1990). Effects of brand awareness on choice for a common, repeat-purchase product. Journal of Consumer Research, 17(2), 141–148.

209 F.5 References
Juchniewicz, J. (2008). The influence of physical movement on the perception of musical
performance. Psychology of Music, 36(4), 417–427. Kuznetsova, A., Brockhoff, P. B., & Christensen, R. H. B. (2017). lmerTest Package: Tests
in Linear Mixed Effects Models. Journal of Statistical Software, 82(13). Leblanc, A. (1982). An Interactive Theory of Music Preference. Journal of Music Therapy,
19(1), 28–45. Lepa, S., Herzog, M., Steffens, J., Schoenrock, A., & Egermann, H. (2020). A computational
model for predicting perceived musical expression in branding scenarios. Journal of New Music Research, 1–16.
Margulis, E. H. (2010). When program notes don’t help: Music descriptions and enjoyment. Psychology of Music, 38(3), 285–302.
Am de Mooij, & Verhaegh, W. F.J. (1997). Learning preferences for music playlists. Artificial Intelligence, 97(1-2), 245–271.
Müllensiefen, D., Gingras, B., Musil, J., & Stewart, L. (2014). The musicality of non- musicians: An index for assessing musical sophistication in the general population. PloS One, 9(2), e89642.
North, A. C., & Hargreaves, D. (2008). The social and applied psychology of music. Oxford: University Press.
North, A. C., Hargreaves, D. J., & Hargreaves, J. J. (2004). Uses of Music in Everyday Life. Music Perception: An Interdisciplinary Journal, 22(1), 41–77.
Nunes, J. C., Ordanini, A., & Valsesia, F. (2015). The power of repetition: repetitive lyrics in a song increase processing fluency and drive market success. Journal of Consumer Psychology, 25(2), 187–199.
Oeusoonthornwattana, O., & Shanks, D. R. (2010). I like what I know: Is recognition a non-compensatory determiner of consumer choice? Judgment and Decision Making, 5(4), 310–325.
Peretz, I., & Gaudreau, D. (1998). Exposure effects on music preference and recognition. Memory & Cognition, 26(5), 884–902.
Petty, R. E., & Cacioppo, J. T. (1986). The elaboration likelihood model of persuasion. Advances in Experimental Social Psychology, 19, 123–205.
Pinheiro, J. C., & Bates, D. M. (Eds.) (2001). Statistics and Computing. Mixed effects models in S and S-PLUS. New York: Springer-Verlag.
Platz, F., & Kopiez, R. (2012). When the eye listens: A meta-analysis of how audio-visual presentation enhances the appreciation of music performance. Music Perception: An Interdisciplinary Journal, 30(1), 71–83.
210 F.5 References
Reber, R., Schwarz, N., & Winkielman, P. (2004). Processing Fluency and Aesthetic Pleasure:
Is Beauty in the Perceiver’s Processing Experience? Personality and Social Psychology Review, 8(4), 364–382.
Rozin, A., Rozin, P., & Goldberg, E. (2004). The Feeling of Music Past: How Listeners Remember Musical Affect. Music Perception: An Interdisciplinary Journal, 22(1), 15–39.
Ryan, C., & Costa-Giomi, E. (2004). Attractiveness bias in the evaluation of young pianists’ performances. Journal of Research in Music Education, 52(2), 141–154.
Szpunar, K. K., Schellenberg, E. G., & Pliner, P. (2004). Liking and memory for musical stimuli as a function of exposure. Journal of Experimental Psychology: Learning, Memory, and Cognition, 30(2), 370–381.
Thoma, V., & Williams, A. (2013). The devil you know: The effect of brand recognition and product ratings on consumer choice. Judgment and Decision Making, 8(1), 34–44.
Vuvan, D. T., Podolak, O. M., & Schmuckler, M. A. (2014). Memory for musical tones: The impact of tonality and the creation of false memories. Frontiers in Psychology, 5, 582.
Westfall, J., Kenny, D. A., & Judd, C. M. (2014). Statistical power and optimal design in experiments in which samples of participants respond to samples of stimuli. Journal of Experimental Psychology: General, 143(5), 2020–2045.
Zajonc, R. B. (1968). Attitudinal effects of mere exposure. Journal of Personality and Social Psychology, 9(2p2), 1.
Appendix G Source effects on the evaluation of music for advertising (S7)
This is an Accepted Manuscript of an article published by WARC in Journal of Advertising Research on 6th December 2019, available online: https://doi.org/10.2501/JAR-2020-016. The paper is not the copy of the record and may not exactly replicate the authoritative document published in the journal. For presentation in this thesis, the appendices of the paper have been removed and the passages referring to each Appendix in the text modified to indicate where to find the materials online. Moreover, there may be minor modifications in the text to guarantee a consistent typographic style throughout the thesis, such as the position of figures and tables. Please do not copy or cite without author’s permission.
Citation Anglada-Tort, M., Keller, S., Steffens, J., & Müllensiefen, D. (2020). The Impact of Source Effects on the Evaluation of Music for Advertising: Are there Differences in How Advertising Professionals and Consumers Judge Music? Journal of Advertising Research. Advanced online publication. DOI: https://doi.org/10.2501/JAR-2020-016
Author contribution Steve Keller (Studio Resonate/ Pandora), Prof. Dr. Daniel Müllensifien (Goldsmiths, University of London), and I conceived the initial idea of this project. I conducted the experiments, analysed the data, and wrote the paper, whereas all other aspects were done collaboratively.
The Impact of Source Effects on the Evaluation of Music
for Advertising
When choosing music for advertisements, professionals are influenced by a large number of factors that could impair their judgement. This research examined source effects in the evaluation of advertising music by professionals and non-professionals. Results showed that advertising professionals gave significantly more favorable evaluations - higher in quality, authenticity, and expected cost - when they thought the music was sourced from performing artists compared to less credible and attractive sources. In contrast, non-professionals were not affected by source cues at all. The interplay between professionals and non-professionals’ perceptions of advertising music and the potential financial impact for brands are discussed.
Keywords: source effects, advertising music, professionals, consumers, music evaluation.

213 G.1 Introduction
G.1 Introduction
Music in advertising is big business, with brands spending millions of dollars to procure music for use in marketing campaigns, television and radio commercials, social media, and experiential events. In 2018, revenue generated from synchronization—i.e., the use of music in commercials, films, games, and television—totaled more than $400 million (IFPI, 2019); and music used in commercials aired during the Super Bowl alone were secured with licenses ranging in cost from $100,000 to more than $750,000 (Hamp, 2018).
Advertisers and marketers are certainly aware of the power of music to influence consumer perception and behavior. Advertising music can have a positive impact on consumers’ mood, memory, purchase intentions, involvement, cognitive and affective processing, and attitudes toward brands (Hecker, 1984; MacInnis & Park, 1991; Allan, 2007; North and Hargreaves, 2008; Shevy & Hung, 2013). It is therefore not surprising that music has played an important role in advertising since the first days of radio broadcasting in 1923 (Allan, 2008; Bullerjahn, 2006; Furnham, Abramsky, & Gunter, 1997; Hettinger, 1933; Kellaris, Cox, & Cox, 1993). A failure to adequately use music, and the associated extra-musical elements, nevertheless can decrease communication effectiveness (Lantos & Craton, 2012), resulting in detrimental effects on attitudes toward the brand and purchase intentions (Allan, 2007). Thus, when evaluating and selecting music for advertising, the use of efficient, reliable, and unbiased decision-making methods is indispensable to advertising practitioners and brands. This evaluative process, however, is complex, highly subjective, and poorly understood.
When people listen to and evaluate music, they are influenced by a large number of factors (Greasley & Lamont, 2016). When choosing music for advertisements, advertisers and marketers need to consider a complex interplay of four interconnected factors that influence consumers’ responses to advertising music (Lantos & Craton, 2012):
• The music—its genre, style and structural characteristics.
• The listener—his or her musical taste, age, personality, and culture.
• The listening situation— including ongoing activities and social context.
• The listener’s advertising processing strategy.
On top of that, this process becomes even more complex when considering the wide variety of decision makers involved, which can include agency producers, creative directors, music supervisors, account teams, brand managers, and chief marketing officers (Passmann, 2017).
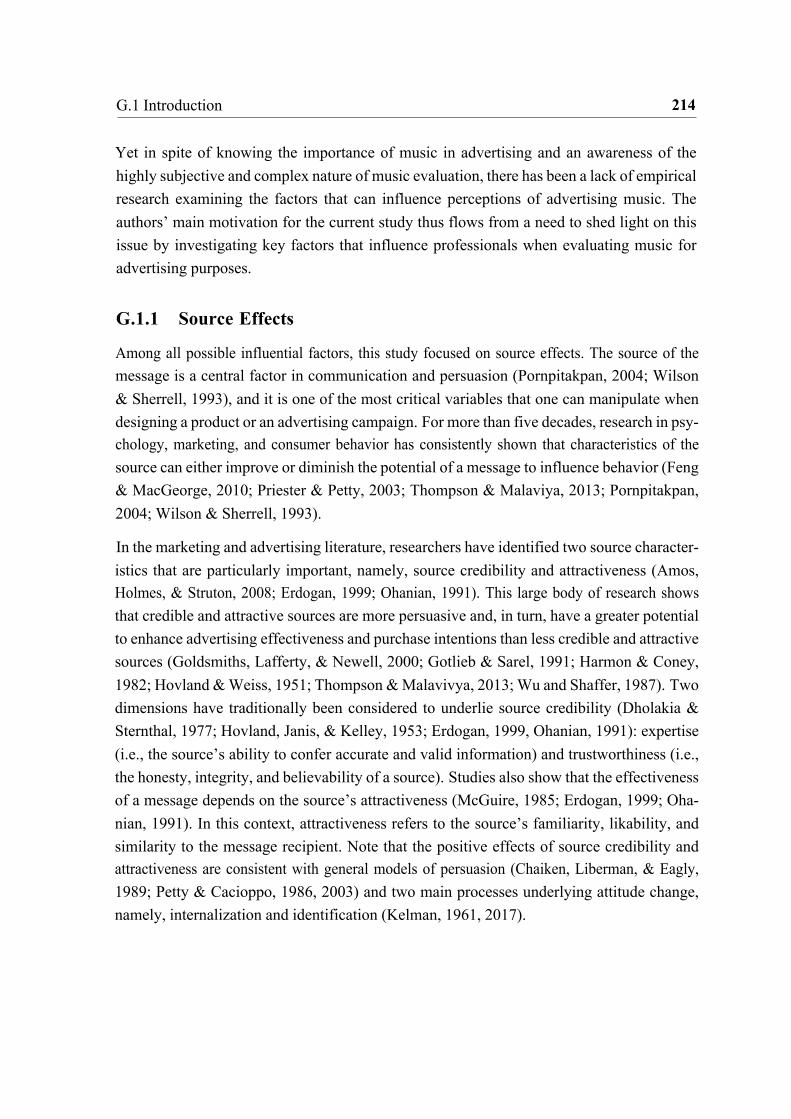
214 G.1 Introduction
Yet in spite of knowing the importance of music in advertising and an awareness of the highly subjective and complex nature of music evaluation, there has been a lack of empirical research examining the factors that can influence perceptions of advertising music. The authors’ main motivation for the current study thus flows from a need to shed light on this issue by investigating key factors that influence professionals when evaluating music for advertising purposes.
G.1.1 Source Effects
Among all possible influential factors, this study focused on source effects. The source of the message is a central factor in communication and persuasion (Pornpitakpan, 2004; Wilson & Sherrell, 1993), and it is one of the most critical variables that one can manipulate when designing a product or an advertising campaign. For more than five decades, research in psy- chology, marketing, and consumer behavior has consistently shown that characteristics of the source can either improve or diminish the potential of a message to influence behavior (Feng & MacGeorge, 2010; Priester & Petty, 2003; Thompson & Malaviya, 2013; Pornpitakpan, 2004; Wilson & Sherrell, 1993).
In the marketing and advertising literature, researchers have identified two source character- istics that are particularly important, namely, source credibility and attractiveness (Amos, Holmes, & Struton, 2008; Erdogan, 1999; Ohanian, 1991). This large body of research shows that credible and attractive sources are more persuasive and, in turn, have a greater potential to enhance advertising effectiveness and purchase intentions than less credible and attractive sources (Goldsmiths, Lafferty, & Newell, 2000; Gotlieb & Sarel, 1991; Harmon & Coney, 1982; Hovland & Weiss, 1951; Thompson & Malavivya, 2013; Wu and Shaffer, 1987). Two dimensions have traditionally been considered to underlie source credibility (Dholakia & Sternthal, 1977; Hovland, Janis, & Kelley, 1953; Erdogan, 1999, Ohanian, 1991): expertise (i.e., the source’s ability to confer accurate and valid information) and trustworthiness (i.e., the honesty, integrity, and believability of a source). Studies also show that the effectiveness of a message depends on the source’s attractiveness (McGuire, 1985; Erdogan, 1999; Oha- nian, 1991). In this context, attractiveness refers to the source’s familiarity, likability, and similarity to the message recipient. Note that the positive effects of source credibility and attractiveness are consistent with general models of persuasion (Chaiken, Liberman, & Eagly, 1989; Petty & Cacioppo, 1986, 2003) and two main processes underlying attitude change, namely, internalization and identification (Kelman, 1961, 2017).
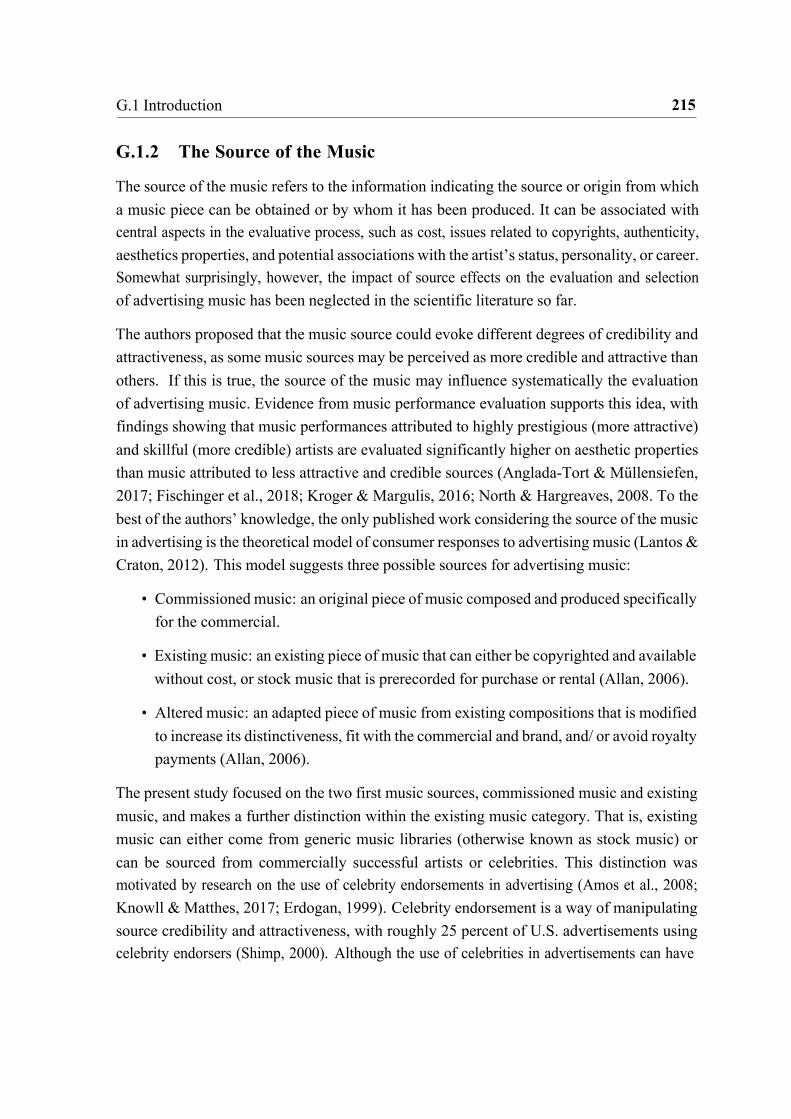
215 G.1 Introduction
G.1.2 The Source of the Music
The source of the music refers to the information indicating the source or origin from which a music piece can be obtained or by whom it has been produced. It can be associated with central aspects in the evaluative process, such as cost, issues related to copyrights, authenticity, aesthetics properties, and potential associations with the artist’s status, personality, or career. Somewhat surprisingly, however, the impact of source effects on the evaluation and selection of advertising music has been neglected in the scientific literature so far.
The authors proposed that the music source could evoke different degrees of credibility and attractiveness, as some music sources may be perceived as more credible and attractive than others. If this is true, the source of the music may influence systematically the evaluation of advertising music. Evidence from music performance evaluation supports this idea, with findings showing that music performances attributed to highly prestigious (more attractive) and skillful (more credible) artists are evaluated significantly higher on aesthetic properties than music attributed to less attractive and credible sources (Anglada-Tort & Müllensiefen, 2017; Fischinger et al., 2018; Kroger & Margulis, 2016; North & Hargreaves, 2008. To the best of the authors’ knowledge, the only published work considering the source of the music in advertising is the theoretical model of consumer responses to advertising music (Lantos & Craton, 2012). This model suggests three possible sources for advertising music:
• Commissioned music: an original piece of music composed and produced specifically for the commercial.
• Existing music: an existing piece of music that can either be copyrighted and available without cost, or stock music that is prerecorded for purchase or rental (Allan, 2006).
• Altered music: an adapted piece of music from existing compositions that is modified to increase its distinctiveness, fit with the commercial and brand, and/ or avoid royalty payments (Allan, 2006).
The present study focused on the two first music sources, commissioned music and existing music, and makes a further distinction within the existing music category. That is, existing music can either come from generic music libraries (otherwise known as stock music) or can be sourced from commercially successful artists or celebrities. This distinction was motivated by research on the use of celebrity endorsements in advertising (Amos et al., 2008; Knowll & Matthes, 2017; Erdogan, 1999). Celebrity endorsement is a way of manipulating source credibility and attractiveness, with roughly 25 percent of U.S. advertisements using celebrity endorsers (Shimp, 2000). Although the use of celebrities in advertisements can have
216 G.1 Introduction
advantages, such as increasing attention and polishing image, this practice is also susceptible to risks, including overshadowing the brand or creating public controversies (Erdogan, 1999). It has been found that negative information about the celebrity has the largest negative impact on advertising effectiveness (Amos et al., 2008). In this study, therefore, the presence of the following three sources was manipulated experimentally to examine source effects on the evaluation of advertising music:
• Performing artist source: existing music released commercially by performing artists. Music from performing artists is typically sourced from record labels and/or publishing companies. These music selections are licensed from the copyright holders and may require large fees for their use. Music coming from existing artists is expected to be perceived as more credible and attractive than music coming from other sources.
• Generic library source: existing music from generic music libraries or stock music. Music in this source is licensed from a generic music library, which often has hundreds if not thousands of recordings that can be licensed for commercial use. Typically, the licensing costs are significantly lower for these library tracks than those licensed from artists or commissioned from a music production company. Music licenses from generic libraries are normally non-exclusive, meaning that any brand can use the same track, with the potential result that music heard in a commercial for one brand might also be heard in a commercial for another. As a result, music obtained from these libraries is expected to be viewed as less credible and attractive than music from existing artists.
• Commissioned music source: music specifically commissioned by production compa- nies and/or composers in response to an advertising brief. Music obtained from this source is typically bespoke musical performances, commissioned specifically for use in the advertisement by an advertising agency or brand. Fees paid for these compositions often include the acquisition of the publishing and master recording. Commissioned music allows for better brand fit, as it is often scored and created to match specific creative criteria. The acquisition of the music copyrights saves licensing costs over time, which can be substantial. Commissioned music is also expected to be perceived as less credible and attractive than music sourced from performing artists. Thus:
Hypothesis 1 (H1): The same advertising music will be evaluated more positively when its associated source is performing artist compared to generic library or commissioned music.
Hypothesis 2 (H2): Evaluations of the same advertising music will differ between the associated sources generic library and commissioned music.
217 G.1 Introduction
H1 and H2 are hypothesized to hold regardless of the product category and will occur in the professional and non-professional group. Note that the direction of H2 cannot be specified due to the lack of research on this topic, but commissioned music and music from generic libraries differ in several critical aspects, such as cost, copyrights, authenticity, and fit with the brand.
G.1.3 Professionals versus non-professionals
With music playing such a consequential role in brand messaging and consumers’ buying behavior, choices about what music to use, and how much to pay for that use, are incredibly important. Advertising professionals are entrusted by their clients to make decisions about music that not only impact the advertising message, but also the cost associated with music procurement. Thus, the primary focus of the present study was on the evaluation of advertising music by advertising professionals. But to determine to what extent source effects are specific to this expert group and whether they may adversely affect brands, it is crucial to assess the degree to which source effects are also present in the non-professional population. If source effects influence advertising professionals and non-professionals equally, then being aware of source cues and choosing music based on this information could prove advantageous for advertisers and marketers, even though those choices may result in higher costs paid for music licenses. In contrast, if the general public (non-professionals) is not influenced by source effects, then advertising professionals are biased in a way that is inconsistent with the perception of ordinary consumers. If this is the case, why should brands spend more money on licensed tracks from performing artists than on tracks procured from more economical sources? Brands could be better served by commissioning music specifically for the commercial, which allows for better brand fit, greater creative freedom, lower costs, and the opportunity to acquire the publishing and master recording rights.
It is worth mentioning that there has been remarkably little research conducted on the differences between the general population and advertising practitioners. There is, however, evidence highlighting the differences between people working in advertising and the general public in a number of critical dimensions, such as age, personality, personal values, morality, and even the way they are influenced by cognitive biases (Tenzer & Murray, 2018, 2019). It thus is plausible that advertising professionals operate on a gut instinct about consumer preferences and beliefs that are disconnected from the empirical reality.
This disconnect may be amplified by the very nature of advertising itself, an industry dedicated to shaping consumer culture, tastes and trends. One examination of advertising, music, and the conquest of culture put it this way: “The advertising industry is populated
218 G.2 Experiment 1 - Ad Professionals
by real people on whom structures act, and they, with their increasingly important role not just in the purveyance but also in the production of popular culture, possess the ability to influence structures themselves, bringing their taste for hip music to the mainstream” (Taylor, 2012). In other words, the judgement of advertising professionals may be impaired not only by misguided beliefs about consumer preferences, but also by the belief that, as purveyors of culture, advertising professionals should be better judges of what consumers will consider artistic. Thus, there may be a systemic bias among advertising professionals against any music source that is not coming from an “artist,” and that music sourced from libraries or commissioned specifically for a commercial would (or should) never be considered as “hip, cool or trendy” by the mainstream.
To examine the role of expertise on source effects in the evaluation of advertising music, the present study investigated the degree to which source effects are also present in a group of non-professionals. Thus:
Hypothesis 3 (H3): Source effects will have a stronger influence on evaluations by advertising professionals than by non-professionals.
In sum, the present study investigated source effects in the evaluation of advertising music by advertising professionals (Experiment 1). To explore whether source effects are limited to this expert group or whether they extend to the general population as a whole, the authors also assessed the extent to which source effects are present to a group of non-professionals (Experiment 2). By measuring the differential effects of source in these two groups one could determine to what extent source effects in an advertising context are due to expertise and whether they may lead to a tangible financial impact for brands. The degree to which source effects exist and the interplay between professionals and non-professionals’ perceptions can, therefore, have major implications on how music creativity, quality, and cost were evaluated in the world of advertising.
G.2 Experiment 1 - Ad Professionals
G.2.1 Methods
Participants
A total of 50 advertising professionals participated in the experiment (20 female, 30 male), aged 29-64 (M = 40.74, SD = 6.99). Participants were professionals with an average of 15.69 (SD= 7.20) years of experience in synchronization revenues (64 percent in marketing and

219 G.2 Experiment 1 - Ad Professionals
advertising, and 26 percent in sectors related to media, television and film, production, and creative design). The majority of professionals (74 percent) reported that they worked in the Americas (including South and North America as well as Canada), whereas the remaining 26 percent worked in either Europe, both Europe and America, or other countries (i.e., one participant in Australia and one in Russia). The group of professionals had an average amount of musical training, as measured by the Gold-MSI musical training score (M = 23.22; SD = 10.77), equivalent to the 38-40th percentiles of the data norm reported in Müllensiefen, Gingras, Musil, & Stewart (2014). Note that the Gold-MSI is a widely established self-report inventory to measure individual differences in musical sophistication (Müllensiefen et al., 2014). It includes a factor to measure the formal musical training that an individual has received. Participants were recruited via e-mail from established New York City advertising agencies, as well as through the Berlin School of Creative Leadership (an EMBA program aimed toward mid-career creative professionals from around the world, working in fields such as advertising, marketing, and media).
Design
The present study used a 3 (music source) X 3 (product category) repeated measures design. Music source (artist versus commissioned versus library) and product category (soft drink versus lifestyle versus financial services) were the two within-participants factors. The three music sources were paired with three excerpts of advertising music on each product category. The pairing between song excerpts and music sources was fully counterbalanced within each product category and across participants using a Latin Square Design (Berman & Fryer, 2014). This resulted in six possible source-song combinations for each product category. Six surveys were created according to these six combinations. Participants were randomly allocated to one of the six surveys at the start. Thus, all participants listened to nine song excerpts without repeating any of the excerpts nor the music sources. The order of presentation of the three product categories and the three song excerpts within each product category were randomized for each participant.
Materials
Three product categories were chosen based on a list of the world’s largest advertisers: soft drink, lifestyle, and financial services. Music selections were matched to these categories by audio branding experts with experience aligning brand attributes, such as consumer demographics, tone of voice, brand personality, and so on, with musical elements, such as music style, genre, tempo, timbre, pitch lyrics, and so on. Each product category included
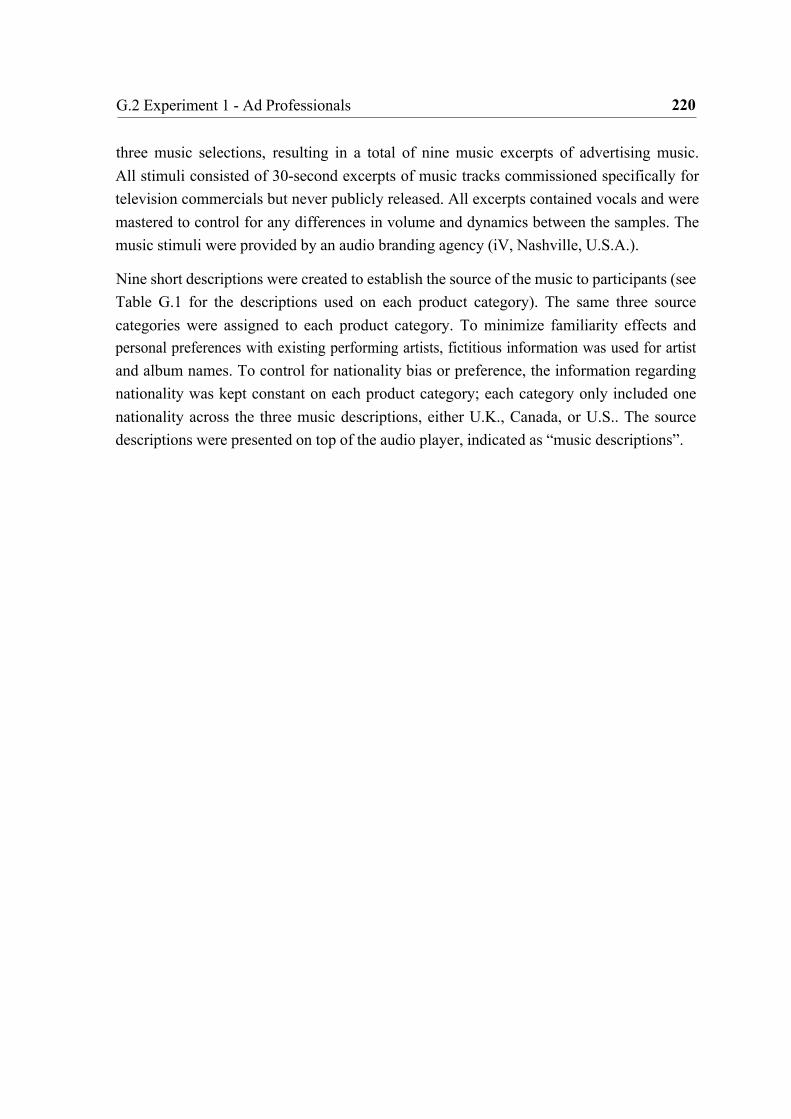
220 G.2 Experiment 1 - Ad Professionals
three music selections, resulting in a total of nine music excerpts of advertising music. All stimuli consisted of 30-second excerpts of music tracks commissioned specifically for television commercials but never publicly released. All excerpts contained vocals and were mastered to control for any differences in volume and dynamics between the samples. The music stimuli were provided by an audio branding agency (iV, Nashville, U.S.A.).
Nine short descriptions were created to establish the source of the music to participants (see Table G.1 for the descriptions used on each product category). The same three source categories were assigned to each product category. To minimize familiarity effects and personal preferences with existing performing artists, fictitious information was used for artist and album names. To control for nationality bias or preference, the information regarding nationality was kept constant on each product category; each category only included one nationality across the three music descriptions, either U.K., Canada, or U.S.. The source descriptions were presented on top of the audio player, indicated as “music descriptions”.

221 G.2 Experiment 1 - Ad Professionals
Table G.1 Descriptions of music source for each product category.
The evaluation form consisted of five Likert rating scales. The following four rating scales were used to measure different aspects of music aesthetics and quality: (1) liking of the music, on a scale from 1 (dislike extremely) to 6 (like extremely); (2) music quality, from 1 (very bad) to 6 (very good); authenticity of the music, from 1 (not at all) to 6 (very much); and musical fit with the product category, from 1 (very bad) to 6 (very good). In addition, the authors included a rating scale designed to measure the expected cost associated with the use of the music (“based on your experience, how much would you expect to pay for a one-year ‘all media’ license to use this music in a commercial?”; where 1 = “less than $1.000”, 2 = “between “1.000 and $5.000”, 3 = “between $5.000 and $10.000, 4 = between $10.000 and $100.000, 5 = between $100.000 and $500.000, 6 = between $500.000 and
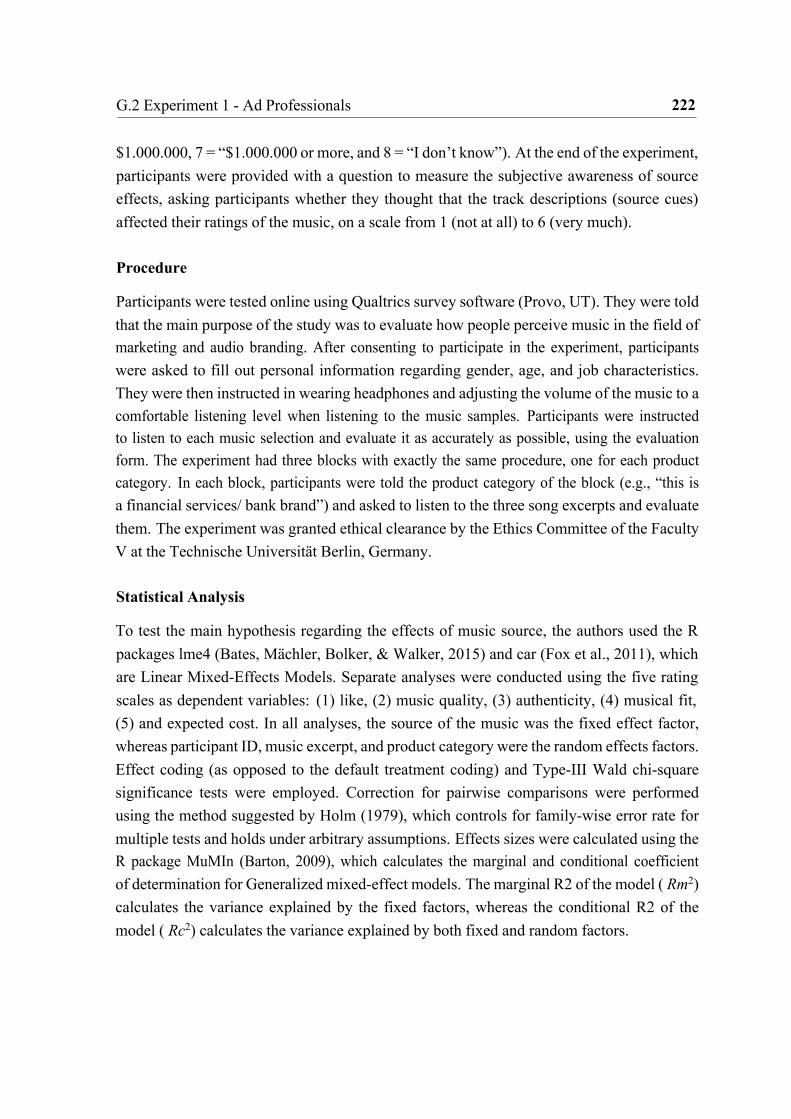
222 G.2 Experiment 1 - Ad Professionals
$1.000.000, 7 = “$1.000.000 or more, and 8 = “I don’t know”). At the end of the experiment, participants were provided with a question to measure the subjective awareness of source effects, asking participants whether they thought that the track descriptions (source cues) affected their ratings of the music, on a scale from 1 (not at all) to 6 (very much).
Procedure
Participants were tested online using Qualtrics survey software (Provo, UT). They were told that the main purpose of the study was to evaluate how people perceive music in the field of marketing and audio branding. After consenting to participate in the experiment, participants were asked to fill out personal information regarding gender, age, and job characteristics. They were then instructed in wearing headphones and adjusting the volume of the music to a comfortable listening level when listening to the music samples. Participants were instructed to listen to each music selection and evaluate it as accurately as possible, using the evaluation form. The experiment had three blocks with exactly the same procedure, one for each product category. In each block, participants were told the product category of the block (e.g., “this is a financial services/ bank brand”) and asked to listen to the three song excerpts and evaluate them. The experiment was granted ethical clearance by the Ethics Committee of the Faculty V at the Technische Universität Berlin, Germany.
Statistical Analysis
To test the main hypothesis regarding the effects of music source, the authors used the R packages lme4 (Bates, Mächler, Bolker, & Walker, 2015) and car (Fox et al., 2011), which are Linear Mixed-Effects Models. Separate analyses were conducted using the five rating scales as dependent variables: (1) like, (2) music quality, (3) authenticity, (4) musical fit, (5) and expected cost. In all analyses, the source of the music was the fixed effect factor, whereas participant ID, music excerpt, and product category were the random effects factors. Effect coding (as opposed to the default treatment coding) and Type-III Wald chi-square significance tests were employed. Correction for pairwise comparisons were performed using the method suggested by Holm (1979), which controls for family-wise error rate for multiple tests and holds under arbitrary assumptions. Effects sizes were calculated using the R package MuMIn (Barton, 2009), which calculates the marginal and conditional coefficient of determination for Generalized mixed-effect models. The marginal R2 of the model ( Rm2) calculates the variance explained by the fixed factors, whereas the conditional R2 of the model ( Rc2) calculates the variance explained by both fixed and random factors.
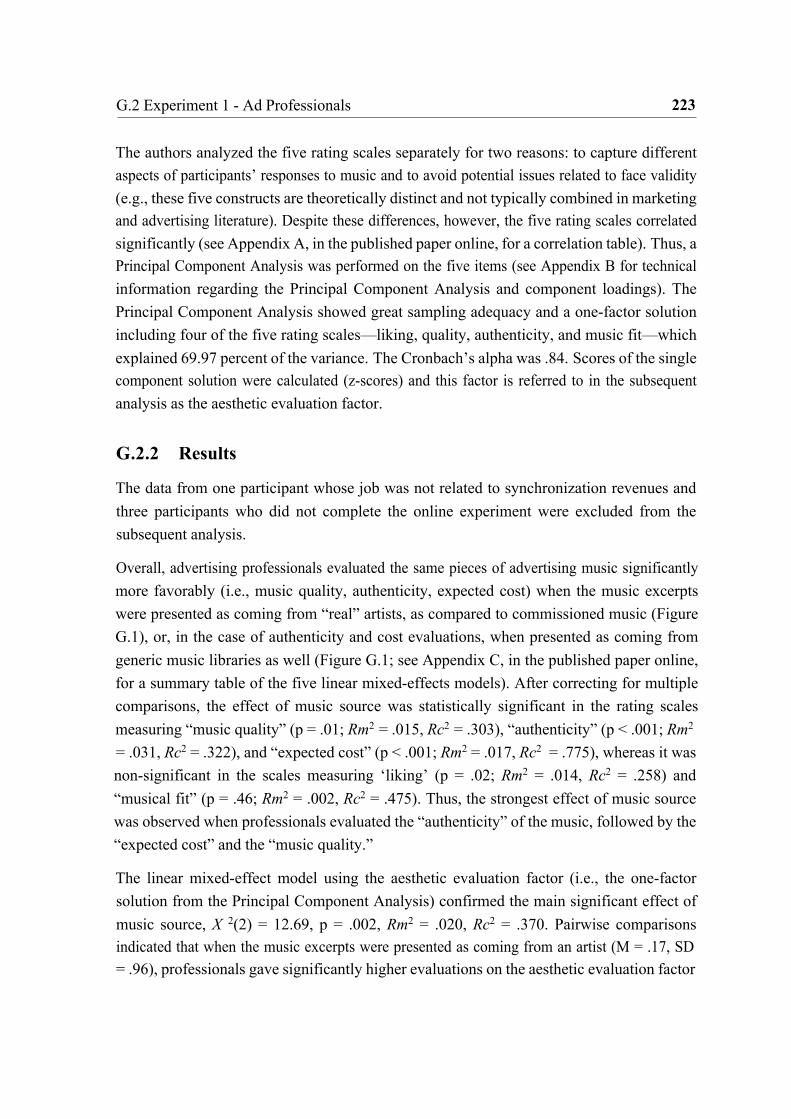
223 G.2 Experiment 1 - Ad Professionals
The authors analyzed the five rating scales separately for two reasons: to capture different aspects of participants’ responses to music and to avoid potential issues related to face validity (e.g., these five constructs are theoretically distinct and not typically combined in marketing and advertising literature). Despite these differences, however, the five rating scales correlated significantly (see Appendix A, in the published paper online, for a correlation table). Thus, a Principal Component Analysis was performed on the five items (see Appendix B for technical information regarding the Principal Component Analysis and component loadings). The Principal Component Analysis showed great sampling adequacy and a one-factor solution including four of the five rating scales—liking, quality, authenticity, and music fit—which explained 69.97 percent of the variance. The Cronbach’s alpha was .84. Scores of the single component solution were calculated (z-scores) and this factor is referred to in the subsequent analysis as the aesthetic evaluation factor.
G.2.2 Results
The data from one participant whose job was not related to synchronization revenues and three participants who did not complete the online experiment were excluded from the subsequent analysis.
Overall, advertising professionals evaluated the same pieces of advertising music significantly more favorably (i.e., music quality, authenticity, expected cost) when the music excerpts were presented as coming from “real” artists, as compared to commissioned music (Figure G.1), or, in the case of authenticity and cost evaluations, when presented as coming from generic music libraries as well (Figure G.1; see Appendix C, in the published paper online, for a summary table of the five linear mixed-effects models). After correcting for multiple comparisons, the effect of music source was statistically significant in the rating scales measuring “music quality” (p = .01; Rm2 = .015, Rc2 = .303), “authenticity” (p < .001; Rm2 = .031, Rc2 = .322), and “expected cost” (p < .001; Rm2 = .017, Rc2 = .775), whereas it was non-significant in the scales measuring ‘liking’ (p = .02; Rm2 = .014, Rc2 = .258) and “musical fit” (p = .46; Rm2 = .002, Rc2 = .475). Thus, the strongest effect of music source was observed when professionals evaluated the “authenticity” of the music, followed by the “expected cost” and the “music quality.”
The linear mixed-effect model using the aesthetic evaluation factor (i.e., the one-factor solution from the Principal Component Analysis) confirmed the main significant effect of music source, X 2(2) = 12.69, p = .002, Rm2 = .020, Rc2 = .370. Pairwise comparisons indicated that when the music excerpts were presented as coming from an artist (M = .17, SD = .96), professionals gave significantly higher evaluations on the aesthetic evaluation factor

224 G.2 Experiment 1 - Ad Professionals
than when the music was presented as commissioned music (M = -.13, SD = .99; p = .001) and generic library (M = -.04, SD = 1.03; p = .04). There were no significant differences between the source commissioned music and generic library (p = .21).
To test whether there were significant differences depending on the product category and gender of the participants, the authors repeated the analysis above adding product category and gender as fixed factors as well as specifying an interaction term with music source. The effects of product category and participants’ gender were nonsignificant (all p-values > .05).
Figure G.1 Effects of music source on the five rating scales (Ad professionals) (Error bars
represent the standard error).
* Denotes pairwise significant differences using Holm’s method (1979). Rating scales as follows: liking scale
from 1 (dislike extremely) to 6 (like extremely), music quality scale from 1 (very bad) to 6 (very good),
authenticity scale from 1 (not at all) to 6 (very much), musical fit scale from 1 (very bad) to 6 (very good),
expected cost scale from 1 (less than $1,000) to 7 ($1,000,000 or more).
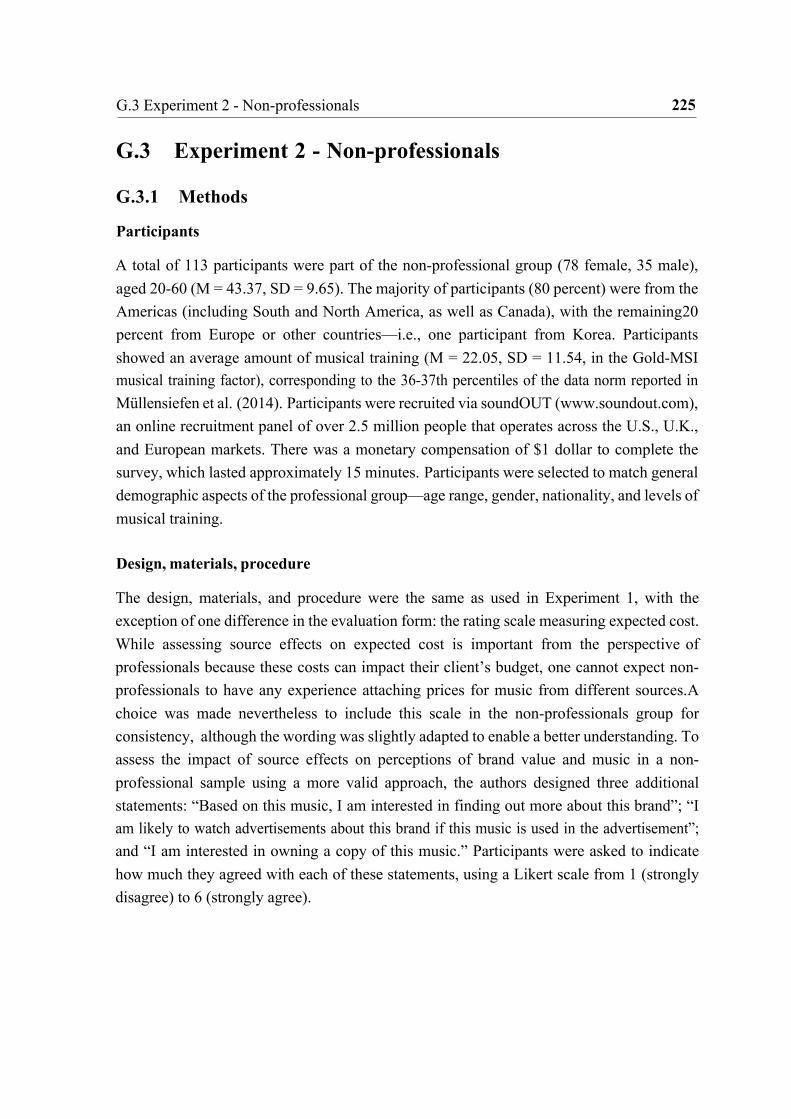
225 G.3 Experiment 2 - Non-professionals
G.3 Experiment 2 - Non-professionals
G.3.1 Methods
Participants
A total of 113 participants were part of the non-professional group (78 female, 35 male), aged 20-60 (M = 43.37, SD = 9.65). The majority of participants (80 percent) were from the Americas (including South and North America, as well as Canada), with the remaining 20 percent from Europe or other countries—i.e., one participant from Korea. Participants showed an average amount of musical training (M = 22.05, SD = 11.54, in the Gold-MSI musical training factor), corresponding to the 36-37th percentiles of the data norm reported in Müllensiefen et al. (2014). Participants were recruited via soundOUT (www.soundout.com), an online recruitment panel of over 2.5 million people that operates across the U.S., U.K., and European markets. There was a monetary compensation of $1 dollar to complete the survey, which lasted approximately 15 minutes. Participants were selected to match general demographic aspects of the professional group—age range, gender, nationality, and levels of musical training.
Design, materials, procedure
The design, materials, and procedure were the same as used in Experiment 1, with the exception of one difference in the evaluation form: the rating scale measuring expected cost. While assessing source effects on expected cost is important from the perspective of professionals because these costs can impact their client’s budget, one cannot expect non-professionals to have any experience attaching prices for music from different sources. A choice was made nevertheless to include this scale in the non-professionals group for consistency, although the wording was slightly adapted to enable a better understanding. To assess the impact of source effects on perceptions of brand value and music in a non- professional sample using a more valid approach, the authors designed three additional statements: “Based on this music, I am interested in finding out more about this brand”; “I am likely to watch advertisements about this brand if this music is used in the advertisement”; and “I am interested in owning a copy of this music.” Participants were asked to indicate how much they agreed with each of these statements, using a Likert scale from 1 (strongly disagree) to 6 (strongly agree).
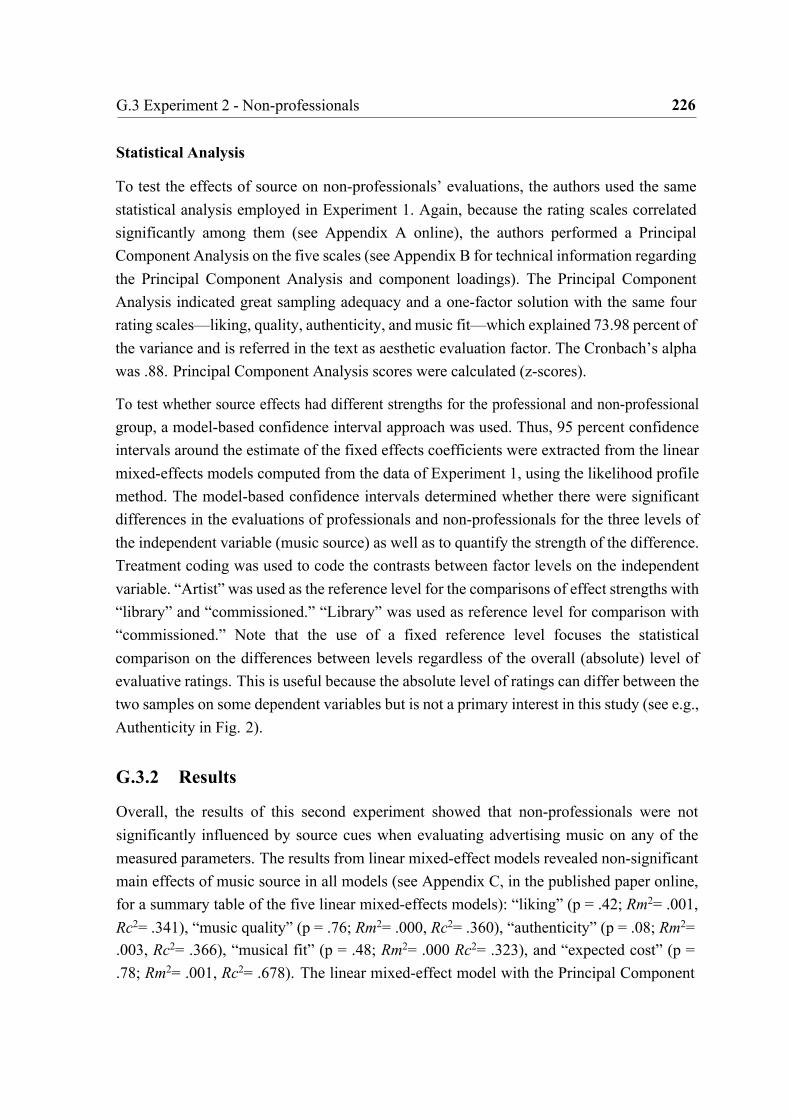
226 G.3 Experiment 2 - Non-professionals
Statistical Analysis
To test the effects of source on non-professionals’ evaluations, the authors used the same statistical analysis employed in Experiment 1. Again, because the rating scales correlated significantly among them (see Appendix A online), the authors performed a Principal Component Analysis on the five scales (see Appendix B for technical information regarding the Principal Component Analysis and component loadings). The Principal Component Analysis indicated great sampling adequacy and a one-factor solution with the same four rating scales—liking, quality, authenticity, and music fit—which explained 73.98 percent of the variance and is referred in the text as aesthetic evaluation factor. The Cronbach’s alpha was .88. Principal Component Analysis scores were calculated (z-scores).
To test whether source effects had different strengths for the professional and non-professional group, a model-based confidence interval approach was used. Thus, 95 percent confidence intervals around the estimate of the fixed effects coefficients were extracted from the linear mixed-effects models computed from the data of Experiment 1, using the likelihood profile method. The model-based confidence intervals determined whether there were significant differences in the evaluations of professionals and non-professionals for the three levels of the independent variable (music source) as well as to quantify the strength of the difference. Treatment coding was used to code the contrasts between factor levels on the independent variable. “Artist” was used as the reference level for the comparisons of effect strengths with “library” and “commissioned.” “Library” was used as reference level for comparison with “commissioned.” Note that the use of a fixed reference level focuses the statistical comparison on the differences between levels regardless of the overall (absolute) level of evaluative ratings. This is useful because the absolute level of ratings can differ between the two samples on some dependent variables but is not a primary interest in this study (see e.g., Authenticity in Fig. 2).
G.3.2 Results
Overall, the results of this second experiment showed that non-professionals were not significantly influenced by source cues when evaluating advertising music on any of the measured parameters. The results from linear mixed-effect models revealed non-significant main effects of music source in all models (see Appendix C, in the published paper online, for a summary table of the five linear mixed-effects models): “liking” (p = .42; Rm2= .001, Rc2= .341), “music quality” (p = .76; Rm2= .000, Rc2= .360), “authenticity” (p = .08; Rm2= .003, Rc2= .366), “musical fit” (p = .48; Rm2= .000 Rc2= .323), and “expected cost” (p = .78; Rm2= .001, Rc2= .678). The linear mixed-effect model with the Principal Component

227 G.3 Experiment 2 - Non-professionals
Analysis single solution factor (i.e., aesthetic evaluation) as dependent variable confirmed that the main effect of music source was nonsignificant, X 2(2) = 1.46, p = .48, Rm2= .001, Rc2= .392. In an effort to study further whether music source affected non-professionals’ perceptions of brand value and music, three linear mixed-effects analyses were conducted using the three additional agreement scales. The effect of music source was non-significant for all three: “I am interested in finding out more about this brand”, X 2(2) = 2.48, p = .29; “I am likely to watch advertisements about this brand if this music is used in the advertisement”, X 2(2) = 1.20, p = .55; and “I am interested in owning a copy of this music”, X 2(2) = 2.28, p = .32.
To test whether there were significant differences depending on the product category and participants’ gender, the authors repeated the analysis adding product category and gender as fixed factors as well as specifying an interaction term with music source. The effects of product category and participants’ gender were nonsignificant (all p-values > .05).
Figure G.2 shows the outcome of the linear mixed-effect models for each dependent variable comparing the two groups of participants. The model-based confidence intervals indicate that professionals’ evaluations of quality, authenticity, and expected cost were significantly different from non-professionals’ evaluations. When evaluating the quality of the music, the difference on coefficient estimates between “artists” and “commissioned” music were sig- nificantly larger in the professional group, -0.28 [-0.47, -0.09], than in the non-professional group= -0.05 [-0.17, 0.08]. There were no significant differences in the other compar- isons—artists versus library and commissioned versus library. When evaluating authenticity, the difference on coefficient estimates between artists and library were significantly larger in the professional group, -0.34[-0.58, -0.10], than in the non-professional group, -0.01 [- 0.16,0.13]. Similarly, the difference between artists and commissioned was also significantly larger in the professional group, at -0.52 [-0.77, -0.28], compared to the non-professional, -0.15 [-0.30, -0.01]. There were no significant differences between the source commis- sioned and library. Finally, when evaluating the expected cost for music use, the difference on coefficient estimates between artists and library" (-0.40 [-0.56, -0.24]) and artist and commissioned (0.2 [-0.36, -0.04]) in the professional group were both significantly larger than those in the non-professional group (artists versus library= 0.04 [-0.12, 0.20]; artists versus commissioned= 0.05 [-0.10, 0.21]). There were no significant differences between the sources commissioned and library. These results quantify the strength of source effects in the two groups, indicating that the impact of the effects was significantly larger in the professional group than in the non-professional group when giving evaluations of quality,

228 G.3 Experiment 2 - Non-professionals
authenticity, and expected cost. The impact of source effects on the non-professional group was almost nonexistent.
Figure G.2 The effects of music source on the evaluation of advertising music by
professionals and non-professionals (error bars represent the standard error).
Comm = Commissioned. Rating scales as follows: liking scale from 1 (dislike extremely) to 6 (like extremely),
music quality scale from 1 (very bad) to 6 (very good), authenticity scale from 1 (not at all) to 6 (very much),
musical fit scale from 1 (very bad) to 6 (very good), and expected cost scale from 1 (less than $1,000) to 7
($1,000,000 or more).
Finally, the authors compared the subjective awareness of source effects in the two groups. This was measured using a rating scale at the end of the experiment that asked participants whether they thought that the track descriptions (source cues) influenced their ratings of the music, on a scale from 1 (not at all) to 6 (very much). Figure G.3 shows a box plot of the responses to this question in the two groups. An independent t-test confirmed that advertising professionals were significantly more aware of source effects (M = 3.49, SD = 1.64) than non-professionals (M = 2.37, SD = 1.64), t(700)= -10, p < .001.
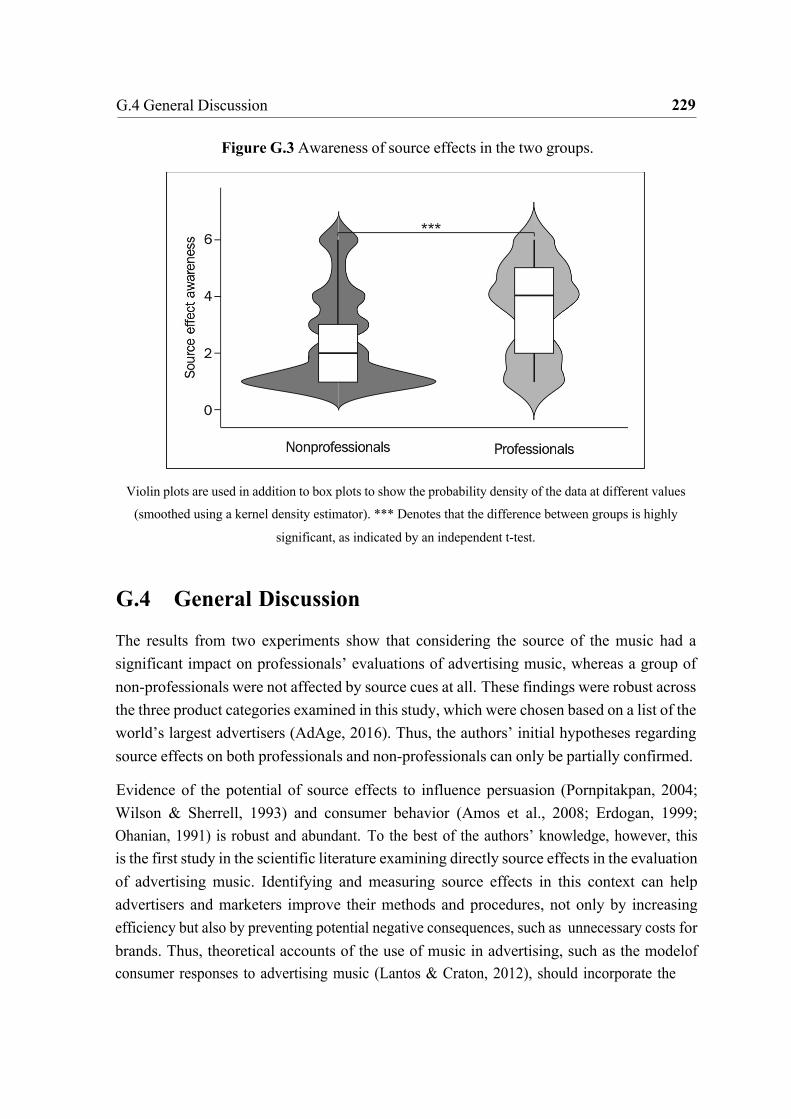
229 G.4 General Discussion
Figure G.3 Awareness of source effects in the two groups.
Violin plots are used in addition to box plots to show the probability density of the data at different values
(smoothed using a kernel density estimator). *** Denotes that the difference between groups is highly
significant, as indicated by an independent t-test.
G.4 General Discussion
The results from two experiments show that considering the source of the music had a significant impact on professionals’ evaluations of advertising music, whereas a group of non-professionals were not affected by source cues at all. These findings were robust across the three product categories examined in this study, which were chosen based on a list of the world’s largest advertisers (AdAge, 2016). Thus, the authors’ initial hypotheses regarding source effects on both professionals and non-professionals can only be partially confirmed.
Evidence of the potential of source effects to influence persuasion (Pornpitakpan, 2004; Wilson & Sherrell, 1993) and consumer behavior (Amos et al., 2008; Erdogan, 1999; Ohanian, 1991) is robust and abundant. To the best of the authors’ knowledge, however, this is the first study in the scientific literature examining directly source effects in the evaluation of advertising music. Identifying and measuring source effects in this context can help advertisers and marketers improve their methods and procedures, not only by increasing efficiency but also by preventing potential negative consequences, such as unnecessary costs for brands. Thus, theoretical accounts of the use of music in advertising, such as the model of consumer responses to advertising music (Lantos & Craton, 2012), should incorporate the

230 G.4 General Discussion
knowledge gained in this study. The distinction of music sources within the broader category of existing music (i.e., generic libraries versus performing artists); and the differential effects of music source on advertising professionals and non-professionals.
In the sample of professionals collected for this study, it was possible to gain significantly more favorable evaluations of music quality, authenticity, and expected cost by simply changing the attribution of the source— i.e., when the music was presented as coming from “real” artists. When assessing the expected cost of music use, this may not be surprising given that music recorded and released by performing artists is typically licensed at a premium. Rights for both the publishing (for the music composition) and the master (the recorded version of the music) must be negotiated and secured, creating an expectation that artist performances are of higher value, both aesthetically and monetarily. But why did professionals also evaluate music sourced from performing artists as more authentic and having greater quality than the other sources? This finding could be due to the associations of this source with higher levels of credibility and attractiveness compared to the other sources used in this study—i.e., commissioned music and generic libraries. Advertising research has consistently shown that credible and attractive sources have a positive impact on attitudes and behavior (Goldsmiths et al., 2000; Gotlieb & Sarel, 1991; Harmon & Coney, 1982; Wu & Shaffer, 1987). Studies on music performance evaluation confirm that presenting the same piece of music with attractive and credible sources influence its aesthetic evaluation positively (Anglada-Tort & Müllensiefen, 2017; Fischinger et al., 2018; Kroger & Margulis, 2016).
The authors also expected differences between the sources commissioned music and generic library, although no clear hypothesis regarding the direction of this difference was made. Interestingly, the music presented as commissioned received significantly lower ratings in quality and authenticity compared to music sourced in generic libraries. This finding is counterintuitive, as commissioned music can offer a better fit with both the brand and commercial. Commissioned music can be created specifically to match predetermined creative criteria. By contrast, music from generic libraries is accessible to anyone and, therefore, does not provide any unique aesthetic equity that could be owned by a brand. Future research is needed to better understand the differences between these two types of sources. It is worth noting, however, that this pattern of results was different when advertising professionals evaluated the expected cost of music use. In this case, music coming from generic libraries received the lowest ratings, suggesting that advertising professionals are aware that sourcing music in generic libraries is cheaper than licensing tracks from performing artists or commissioned from music agencies.
231 G.4 General Discussion
When it comes to brand messaging, music is a powerful tool in the advertiser’s toolbox. Music choices have a direct impact on brand marketing, not only creatively, but economically as well. It seems reasonable to expect that, when making judgements about aesthetics and costs for music used in advertising and marketing, experts in these fields would make more objective decisions than novices because they can take relevant information and experience into account. Yet results from this study suggest the opposite: while advertising experts were affected by source cues, non-experts were not. Although these results might seem counterintuitive at first, they are consistent with literature on the “expert problem” (e.g., Hall, Ariss, & Todorov, 2007; Reyna, Chick, Corbin, & Hsia, 2014; Taleb, 2007), showing that in certain conditions and disciplines, such as clinical psychology, finance, economy, and forecasting, more knowledge and expertise can reduce accuracy and consistency while increasing confidence in wrong decisions. This includes advertising and marketing professionals (Tenzer & Murray, 2018, 2019). In this study, the only group of participants assumed to be highly familiar with the music sources were advertising professionals. Importantly, a rating scale placed at the end of the experiment confirmed that advertising professionals were significantly more aware of the influence of source information than the group of non-professionals. This finding is a clear illustration that source effects can influence professional judgment even though advertising professionals are aware of the existence of this influence. For domain experts, it seems to be very difficult to build up effective cognitive defenses against source effects.
G.4.1 limitations
The present study has three limitations. First, the experimental control of potential confound- ing variables may have forced an artificial situation for participants. Participants were asked to evaluate music as being suitable for commercials in general product categories (i.e., soft drink, fashion, and financial services), without knowing the exact brands and products that were being evaluated. In addition, participants did not have access to information typically available in this kind of evaluative processes, including the target audience, the brand profile and personality, the visual content of the commercial, the communication strategy, or the marketing goals. In this regard, models of persuasion, such as the Elaboration Likelihood Model (Petty and Cacioppo, 1986, 2003) and the Heuristic-Systematic Model (Chaiken et al., 1989), suggest that the potential of source factors to persuade people depends on their involvement when processing a message. Under low-involvement conditions, when people are unmotivated or unable to process the message, source variables tend to be used as a simple cue or heuristic to assess the content, making source effects more likely to enhance persuasion regardless of message quality. Under high-involvement conditions, when people are motivated or able to process the message, however, this pattern is reversed and people are
232 G.4 General Discussion
less influenced by source cues. Thus, it is possible that in a real-world situation, professionals are more involved in the evaluative process of choosing music for brands and, in turn, less influenced by source cues. But to avoid confounding effects of individual preferences and familiarity for brands and specific products, as well as conflict of interest (e.g., it is plausible that some of the professionals in this study could have worked with the brands in question), a decision was made to use generic product categories and avoid specific information. The authors encourage future research to use more ecological approaches to investigate source effects in the real-world as well as a larger range of brand categories, products, and music stimuli.
Second, non-professionals were presented with source cues just like the group of advertising professionals, although it was not possible to know how these semantic frames were perceived by non-professionals. The third limitation concerns the comparison between the sample of professionals and non-professionals. Ideally, these two groups would be perfectly matched in relevant demographics, such as age, gender, nationality, and levels of musical training. In this study, however, there was a gender imbalance in the two groups. While there were more men than women in the professional group, this pattern was the opposite in the non-professional group. This imbalance in gender was a byproduct of the recruitment strategies used in the two experiments. Additional analyses nevertheless indicated that participants’ gender did not have a significant effect on music evaluations, nor did it interact with the effects of the music source.
G.4.2 Practical implications
Many advertisers believe there are benefits that come from associating their brands with celebrities and music artists. Yet are these benefits real? Do consumers perceive advertising music sourced from artists as having more quality and authenticity than advertising music commissioned by music agencies or sourced from generic music libraries? The findings from this study suggest that they do not. This adds to the body of research showing that advertisers should reconsider the conventional wisdom that these kinds of associations build stronger ties with consumers and generate greater sales (Ace Metrix, 2014). Advertisements using celebrities during the last five years of the Super Bowl underperformed those without celebrity endorsers (Taylor, 2016). Despite this fact, there was a considerable increase in celebrity endorsers in 2016’s Super Bowl (Poggi, 2016; Taylor, 2016). The findings observed in this study are in line with previous research highlighting the risks of using celebrities in advertisements (Amos et al., 2008; Knowll & Matthes, 2017; Erdogan, 1999).

233 G.4 General Discussion
In this study, all the music samples were produced by composers who were commissioned to write music specifically for a commercial. When played for advertising professionals, it was possible to significantly improve the subjective evaluation of these samples by simply changing the attribution of the music source. Perhaps more importantly for brands moni- toring advertising costs, it was also possible to change the cost expectations though source manipulation. An advertising professional would have paid more money for the same track when told that it was coming from an artist as compared to commissioned music or music sourced from a generic music library. In 2017, Spotify found itself roiled in a “fake artist” controversy when it offered playlists of songs that came from production music houses and music libraries that were operating under pseudonyms, making them appear like independent artists or bonafide acts (Gensler & Christman, 2017). This knowledge should give pause to brands and agencies when they are engaged in music searches. What if publishing companies were to employ their songwriters under a series of pseudonyms, offering tracks to advertising agencies and brands as if these recordings are coming from a working artist or band? The music itself may have been tailored for specific commercial usage, but source effects may contribute to advertising professionals having a more favorable opinion of the aesthetic qualities of the music and with it, a willingness to pay higher costs. In such a scenario, the advertiser pays a premium, even though they may see little or no added benefit from a consumer perspective.
Having identified the impact of source effects on advertising professionals, the inevitable question is how to mitigate this bias when making choices regarding music used in an advertising context. Certainly, making professionals aware of source effects is one step toward mitigating the effects of source bias, as there is some evidence that awareness of bias can bring about change (Pope, Price, & Wolfers, 2013). Another intervention might be to promote blind evaluations of music under consideration, without any type of contextual information presented in the music selections. But when considering all the potential decision makers in the selection process, including music supervisors, creative directors, producers, and brand managers, this may be easier said than done. Alternatively, music selections could be tested to measure their impact on target consumers, based on criteria designed to quantify the perceptual and behavioral outcomes desired by the advertisers and clients.
In the case of consumers, such effects might work for, or against, the advertiser. Attaching a Key Performance Indicator as a decision driver, and then testing to see which music selection offers the best probable outcome, could help professionals and brands make more effective choices and avoid potential negative impacts. Such an approach could also help address questions regarding music cost and return on investment. If using music sourced from
234 G.5 References
performing artists or celebrities have a generally positive impact, then the higher costs for the music would be justified. On the other hand, if music from another source, such as commissioned music or a music library, performs as well or better than higher cost options, then advertisers could make cost decisions accordingly. While a more methodical approach to music selection might add more time to the decision making process, it would certainly benefit both advertising professionals and their clients, helping them offset source effects while potentially improving advertising costs and effectiveness in the process.
G.5 References Allan, D. (2008). A content analysis of music placement in prime-time television advertising.
Journal of Advertising Research, 48(3), 404-417. Allan, D. (2007). Sound advertising: a review of the experimental evidence on the effects of
music in commercials on attention, memory, attitudes, and purchase intention. Journal of Media Psychology, 12(3), 1-35.
Allan, D. (2006). Effects of popular music in advertising on attention and memory. Journal of Advertising Research, 46(4), 434-444.
Amos, C., Holmes, G., and Strutton, D. (2008). Exploring the relationship between celebrity endorser effects and advertising effectiveness: A quantitative synthesis of effect size. International Journal of Advertising, 27(2), 209-234.
Anglada-Tort, M., and Müllensiefen, D. (2017). The repeated recording illusion: The effects of extrinsic and individual difference factors on musical judgements. Music Perception, 35(1), 92-115.
Barton, K., and Barton, M. K. (2018). Package ‘MuMIn’. R Package Version 1.42.1. Retrieved from https://cran.r-project.org/web/packages/MuMIn/MuMIn.pdf
Berman, G., and Fryer, K. D. (2014). Introduction to combinatorics. Elsevier. Bates, D., Mächler, M., Bolker, B., and Walker, S. (2015). Fitting linear mixed-effects
models using lme4. Journal of Statistical Software, 67(1), 1-48. Bullerjahn, C. (2006). The effectiveness of music in television commercials. In S. Brown,
and U.Volgsten (Eds.), Music and Manipulation: On the social uses and social control of music (pp-207-235). New York, NY: Berghahn Books.
Chaiken, S., Liberman, A., and Eagly, A. H. (1989). Heuristic and systematic processing within and beyond the persuasion context. In J. S. Uleman & J. A. Bargh (Eds.), Unintended thought (pp. 212–252). New York, NY: Guilford Press.
Erdogan, B. Z. (1999). Celebrity endorsement: A literature review. Journal of marketing management, 15(4), 291-314.

235 G.5 References
Fischinger, T., Kaufmann, M., and Schlotz, W. (2018). If it’s Mozart, it must be good? The
influence of textual information and age on musical appreciation. Psychology of Music, 0305735618812216.
Feng, B., and MacGeorge, E. L. (2010). The influences of message and source factors on advice outcomes. Communication Research, 37(4), 553-575.
Furnham, A., Abramsky, S., and Gunter, B. (1997). A cross-cultural content analysis of children’s television advertisements. Sex Roles, 37(1-2), 91-99.
Goldsmith, R. E., Lafferty, B. A., & Newell, S. J. (2000). The impact of corporate credibility and celebrity credibility on consumer reaction to advertisements and brands. Journal of advertising, 29(3), 43-54.
Gotlieb, J. B., and Sarel, D. (1991). Comparative advertising effectiveness: The role of involvement and source credibility. Journal of advertising, 20(1), 38-45.
Greasley, A., and Lamont, A. (2016). Musical preferences. In S. Hallam, I. Cross, & M. Thaut (Eds.), Oxford handbook of music psychology (2nd ed., pp. 263-281). Oxford, U.K.: Oxford University Press.
Hall, C. C., Ariss, L., and Todorov, A. (2007). The illusion of knowledge: When more information reduces accuracy and increases confidence. Organizational Behavior and Human Decision Processes, 103 (2), 277-290.
Harmon, R. R., and Coney, K. A. (1982). The persuasive effects of source credibility in buy and lease situations. Journal of Marketing research, 255-260.
Hecker, S. (1984). Music for advertising effect. Psychology & Marketing, 1(3-4), 3-8. Hettinger, H. (1993). A decade of radio advertising. Chicago, IL: University of Chicago
Press. Holm, S. (1979). A simple sequentially rejective multiple test procedure. Scandinavian
journal of statistics, 6, 65-70. Hovland, C. I., Janis, I. L., and Kelley, H. H. (1953). Communication and persuasion. New
Heaven, CT: Yale University Press. Hovland, C. I., and Weiss, W. (1951). The influence of source credibility on communication
effectiveness. Public Opinion Quarterly, 15(4), 635-650. IFPI, International Federation of the Phonographic Industry (2019). IFPI Global Music
Report 2018. Retrieved from http://www.ifpi.org/downloads/GMR2019.pdf Kellaris, J. J., Cox, A. D., and Cox, D. (1993). The effect of background music on ad
processing: A contingency explanation. The Journal of Marketing, 57 (4), 114-125. Kelman, H. C. (2017). Further thoughts on the processes of compliance, identification, and
internalization. In Social power and political influence (pp. 125-171). Routledge.

236 G.5 References
Kelman, H. C. (1961). Processes of opinion change. The Public Opinion Quarterly, 25 (1),
57-78. Knoll, J., and Matthes, J. (2017). The effectiveness of celebrity endorsements: a meta-
analysis. Journal of the Academy of Marketing Science, 45(1), 55-75. Kroger, C., and Margulis, E. H. (2016). “But they told me it was professional”: Extrinsic
factors in the evaluation of musical performance. Psychology of Music, 45(1), 49-64. Lantos, G. P., and Craton, L. G. (2012). A model of consumer response to advertising music.
Journal of Consumer Marketing, 29(1), 22-42. MacInnis, D. J., and Park, C. W. (1991). The differential role of characteristics of music on
high-and low-involvement consumers’ processing of ads. Journal of consumer Research, 18(2), 161-173.
Müllensiefen, D., Gingras, B., Stewart, L., Musil, J. (2014). The musicality of non-musicians: An index for measuring musical sophistication in the general population. PLoS ONE 9(2), e89642.
North, A., and Hargreaves, D. (2008). The social and applied psychology of music. New York, NY: Oxford University Press.
Passman, J. (2017, March 09). Forbes – The Gatekeepers that control the placement of music in commercials. Retrievedfromhttps://www.forbes.com/sites/jordanpassman/2017/03/ 09/the-gatekeepers-that-control-the-placement-of-music-in-commercials/#4e70c57c407f
Petty, R. E., and Cacioppo, J. T. (1986). The Elaboration Likelihood Model of persuasion. In L. Berkowitz (Ed.), Advances in experimental social psychology (Vol. 19, pp. 123–205). New York, NY: Academic Press.
Petty, R. E., Wheeler, S. C., and Tormala, Z. L. (2003). Persuasion and atti- tude change. In T. Millon & M. J. Lerner (Eds.), Handbook of psychology: Volume 5: Personality and social psychology (pp. 353–382). Hoboken, NJ: John Wiley.
Poggi, G. (2016, February 01). Why Super Bowl 50 is Poised to be ‘Celeb Bowl’. Ad- vertising Age, 1. Retrieved from https://adage.com/article/special-report-super-bowl/ super-bowl-50-poised-celeb-bowl/302457/
Pope, D., Price, P., and Wolfers, J. (2013). Awareness Reduces Racial Bias. National Bureau of Economic Research (NBER). Working paper 19765.
Pornpitakpan, C. (2004). The persuasiveness of source credibility: A critical review of five decades’ evidence. Journal of Applied Social Psychology, 34, 243–281.
Priester, J. R., and Petty, R. E. (2003). The influence of spokesperson trustworthiness on message elaboration, attitude strength, and advertising effectiveness. Journal of consumer psychology, 13(4), 408-421.
237 G.5 References
Reyna, V. F., Chick, C. F., Corbin, J. C., and Hsia, A. N. (2014). Developmental reversals
in risky decision making: Intelligence agents show larger decision biases than college students. Psychological science, 25(1), 76-84.
Dholakia, R., and Sternthal, B. (1977). Highly credible sources: Persuasive facilitators or persuasive liabilities? Journal of Consumer Research, 3(4), 223-232.
Taylor, C. R. (2016). Some Interesting Findings about Super Bowl Advertising. International Journal of Advertising, 35 (2), 157-170.
Taylor, T.D. (2012) The Sound of Capitalism: Advertising, Music and the Conquest of Culture (pp 238-239). Chicago, IL: The University of Chicago Press.
Taleb, N. N. (2007). The black swan: The impact of the highly improbable (Vol. 2). New York, NY: Random house.
Thompson, D. V., and Malaviya, P. (2013). Consumer-generated ads: does awareness of advertising co-creation help or hurt persuasion? Journal of Marketing, 77(3), 33-47.
Tenzer, A, and Murray, I. (2018). Why we shouldn’t trust our gut instincts [White paper]. Reach Solutions. Retrieved from https://www.trinitymirrorsolutions.co.uk/sites/default/ files/2018-07/TMSWhyWeShouldn%27tTrustOurGutInstinctWhitePaper.pdf
Tan, A. J. Cohen, S. D. Lipscomb, & R . A. Kendall (Eds.), The psychology of music in multimedia (pp. 315-38). Oxford, UK: Oxford University Press.
Shimp, T.A. (2000), Advertising Promotion: Supplemental Aspects of Integrated Marketing Communications, Dryden Press, Fort Worth, TX.
Wilson, E. J., and Sherrell, D. L. (1993). Source effects in communication and persuasion research: A meta-analysis of effect size. Journal of the Academy of Marketing Science, 21(2), 101.
Wu, C., and Shaffer, D. R. (1987). Susceptibility to persuasive appeals as a function of source credibility and prior experience with the attitude object. Journal of personality and social psychology, 52(4), 677.
Appendix H The effect of music recognition on consumer choice (S8)
The following paper has not yet been accepted to a peer-reviewed journal. The text presented here is the most updated version of the manuscript as written by the time in which this thesis was published (August 2021). For presentation in this thesis, the appendices of the paper have been removed. Moreover, there may be minor modifications in the text to guarantee a consistent typographic style throughout the thesis, such as the position of figures and tables.
Author contribution I conceived the idea of this project and supervised it along with Tabitha Trahan (SoundOUT) and Prof. Dr. Daniel Müllensiefen (Goldsmiths, University of London). The study was conducted and developed by Kerry Schfield as part of her master thesis in the MSc in Music, Mind, and Brain, at Goldsmiths, University of London (2018-2019). After Kerry completed her masters, I reanalysed the data and wrote the paper for publication.
I’ve heard that brand before: The effect of music as a
recognition cue to influence consumer choice
Despite the common belief that music can impact consumer behaviour, there is currently a lack of research quantifying the effectiveness of music strategies to influence consumer choice. In two experiments, we addressed this issue through recognition-based heuristics. Prior to the main experimental task, participants memorised several music clips. In a choice task, participants were then presented with pairs of brands, one presented with previously learned music and the other with novel music. Their task was to choose which brand they would purchase when buying different products (e.g., headphones, cameras). Results revealed that pairing brands with music that can be recognized by target consumers increases the likeli- hood that they will choose the brand by 6% (Experiment 2), which corresponds to a small but significant effect size (d = .21). Furthermore, music preferences were a key moderating factor in the success of recognition-based heuristics. Exploratory results indicated that participants only relied on music recognition when they liked the music, whereas recognition-based heuristics did not play an influential role when the music was disliked. Therefore, when using music to influence consumer behaviour, it is important to consider how recognition cues are processed in combination with other information, such as preferences.
Keywords: recognition heuristic, decision making, music, listening, playlist.
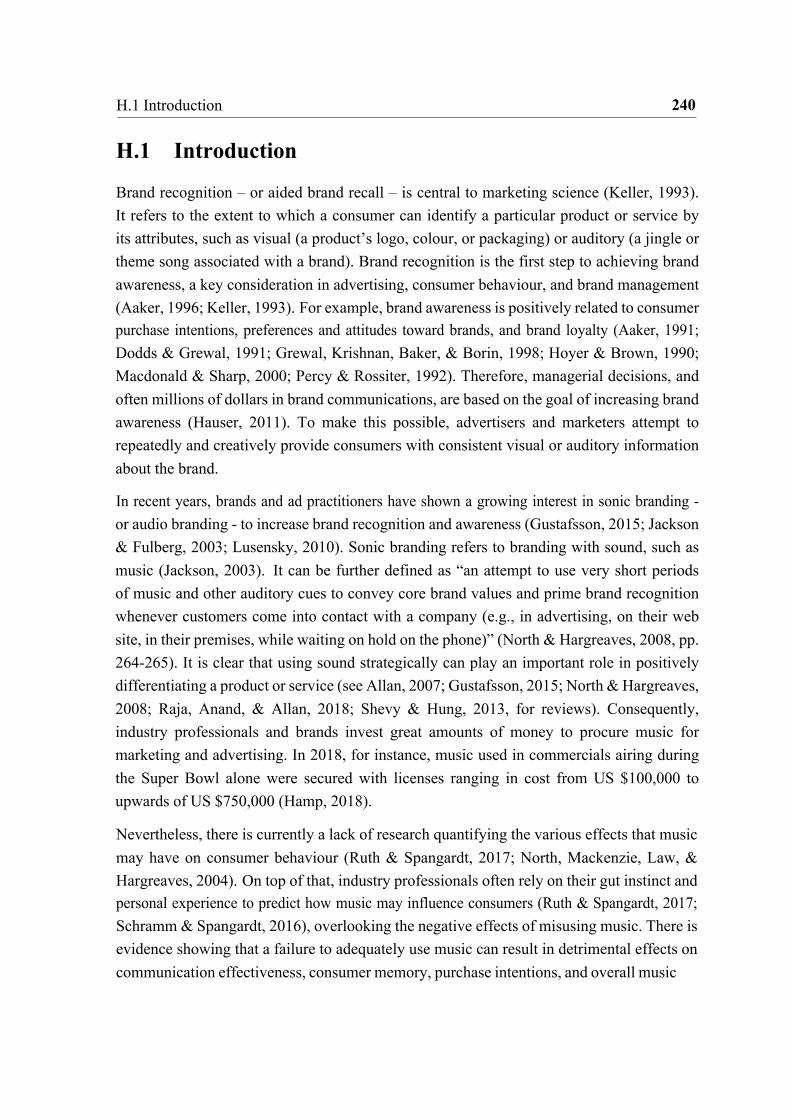
240 H.1 Introduction
H.1 Introduction
Brand recognition – or aided brand recall – is central to marketing science (Keller, 1993). It refers to the extent to which a consumer can identify a particular product or service by its attributes, such as visual (a product’s logo, colour, or packaging) or auditory (a jingle or theme song associated with a brand). Brand recognition is the first step to achieving brand awareness, a key consideration in advertising, consumer behaviour, and brand management (Aaker, 1996; Keller, 1993). For example, brand awareness is positively related to consumer purchase intentions, preferences and attitudes toward brands, and brand loyalty (Aaker, 1991; Dodds & Grewal, 1991; Grewal, Krishnan, Baker, & Borin, 1998; Hoyer & Brown, 1990; Macdonald & Sharp, 2000; Percy & Rossiter, 1992). Therefore, managerial decisions, and often millions of dollars in brand communications, are based on the goal of increasing brand awareness (Hauser, 2011). To make this possible, advertisers and marketers attempt to repeatedly and creatively provide consumers with consistent visual or auditory information about the brand.
In recent years, brands and ad practitioners have shown a growing interest in sonic branding - or audio branding - to increase brand recognition and awareness (Gustafsson, 2015; Jackson & Fulberg, 2003; Lusensky, 2010). Sonic branding refers to branding with sound, such as music (Jackson, 2003). It can be further defined as “an attempt to use very short periods of music and other auditory cues to convey core brand values and prime brand recognition whenever customers come into contact with a company (e.g., in advertising, on their web site, in their premises, while waiting on hold on the phone)” (North & Hargreaves, 2008, pp. 264-265). It is clear that using sound strategically can play an important role in positively differentiating a product or service (see Allan, 2007; Gustafsson, 2015; North & Hargreaves, 2008; Raja, Anand, & Allan, 2018; Shevy & Hung, 2013, for reviews). Consequently, industry professionals and brands invest great amounts of money to procure music for marketing and advertising. In 2018, for instance, music used in commercials airing during the Super Bowl alone were secured with licenses ranging in cost from US $100,000 to upwards of US $750,000 (Hamp, 2018).
Nevertheless, there is currently a lack of research quantifying the various effects that music may have on consumer behaviour (Ruth & Spangardt, 2017; North, Mackenzie, Law, & Hargreaves, 2004). On top of that, industry professionals often rely on their gut instinct and personal experience to predict how music may influence consumers (Ruth & Spangardt, 2017; Schramm & Spangardt, 2016), overlooking the negative effects of misusing music. There is evidence showing that a failure to adequately use music can result in detrimental effects on communication effectiveness, consumer memory, purchase intentions, and overall music
241 H.1 Introduction
costs (Anglada-Tort, Keller, Steffens, & Müllensiefen, 2020; Allan, 2007; Lantos & Craton, 2012). For example, Anglada-Tort et al. (2020) found that ad professionals evaluated the same pieces of advertising music more favourably (e.g., higher in quality and authenticity) when they thought it was coming from performing artists compared to less prestigious sources, such as music companies or generic libraries. As a result, ad professionals were willing to pay significantly more money when they thought the music was from performing artists. In contrast, a group of consumers was not affected by source cues at all, suggesting that professionals are biased toward certain music choices that are not only more expensive for brands but also may provide no return of their investment. Therefore, measuring the effectiveness of music on consumer behaviour has become incredibly important (Herget, Schramm, & Breves, 2018; Raja et al., 2018; Ruth & Spangardt, 2017). As found in Lusensky (2010), most brands reported that the largest obstacle when working with music is measuring the value of their investment.
The present study contributes to this issue by conducting two experiments that enable us to quantify the effectiveness of music to influence brand choice through recognition-based heuristics. In the following sections of this introduction, we present the relevant literature on recognition-based heuristics and important considerations when applying them to consumer choice. We follow by discussing the literature on music effects on brand recognition and consumer choice. Finally, we present the aims and hypothesis of this study.
H.1.1 Recognition-based heuristics in consumer choice
As humans, we develop preferences for things simply by becoming familiar with them. This is known as the mere exposure effect (Zajonc, 1968) and has been supported by decades of research in psychology and marketing. For example, studies show that people prefer stimuli they have previously seen, even if they were not aware of seeing them (see Bornstein, 1989, for a review); and consumer preferences for products relate to their familiarity or brand awareness (Hoyer and Brown, 1990; Coates, Butler, & Berry, 2004). In decision-making situations, the recognition heuristic has been proposed as a simple mental strategy to make inferences about the environment (Goldstein & Gigerenzer, 2002; Pachur, Todd, Gigerenzer, Schooler, & Goldstein, 2011). The recognition heuristic states that when only one of two objects is recognized, people infer that the recognized object has the higher value with respect to the criterion being judge and, therefore, they tend to choose it over the unrecognised one. Thus, the recognition heuristic only applies usefully in domains in which knowledge is limited and some (but not all) options in the choice set are unrecognized. As suggested by Hauser (2011), throughout the paper we will use the broader term recognition-based

242 H.1 Introduction
heuristics to avoid the many debates and problematic aspects of providing an exact definition of the original recognition heuristic (Goldstein & Gigerenzer, 2002), such as the extent to which it is non-compensatory or whether it applies when the cues are more than just brand names, such as music.
When choosing to buy new brands of frequently purchased products (e.g., headphones, juice drinks, etc.), consumer knowledge is often limited and, consequently, people often rely on recognition as a screening rule to guide their choices (Hauser, 2011). Below, we discuss several considerations regarding recognition-based heuristics in consumer choice. First, it is important to discuss the role of recognition in preference as opposed to inference. While inferential choice can be objectively assessed using some external criterion of accuracy (e.g., population size), preferential choice is subjective by nature and cannot be assessed based on an objective criterion (Brandstätter, Gigerenzer, & Hertwig, 2006). The original recognition heuristic was primarily developed in the context of inferential choice tasks, such as when deciding which of two cities has more inhabitants (Goldstein & Gigerenzer, 2002). Nevertheless, previous studies have shown that recognition-based strategies are also used in preferential choice tasks, such as in the domain of risky choice (Brandstätter et al., 2006) and consumer behaviour (Oeusoonthornwattana & Shanks, 2010; Thoma & Williams, 2013).
A second consideration is the extent to which recognition-based heuristics are ecologically rational (Goldstein & Gigerenzer, 2002). When consumers choose to buy a specific product over different alternatives, recognition-based heuristics are thought to be ecologically rational only if they exploit recognition cues in the environment to make better judgments and deci- sions (Hauser, 2011). In other words, in those situations where “using the heuristic will result in accurate decisions in environments in which the probability of recognizing alternatives is correlated with the criterion to be inferred” (Marewski, Gaissmaier, & Gigerenzer, 2010). Since a brand can only afford repeated advertising if it succeeds in selling their products, inferring that heavily advertised brands have higher quality than unknown brands can be an ecologically rational decision rule (Hauser, 2011). In this context, recognition-based heuristics allow consumers to use very little information, cognitive resources, and processing time to make decisions that approximate optimal consumption, at least to a certain degree.
Thirdly, there is the assumption that people use the recognition heuristic in a non-compensatory fashion (Goldstein & Gigerenzer, 2002). That is, if people recognize one object but not the other, and there is a substantial recognition validity, recognition is used as the only cue and no other cue knowledge is taken into account (Pachur et al., 2011). However, the non- compensatory use of recognition has been challenged in several studies (see Pachur, Bröder, & Marewski, 2008 for a review), including consumer behaviour studies using preferential
243 H.1 Introduction
choice tasks. For example, Oeusoonthornwattana and Shanks (2010) found that participants’ choices of brands were largely based on recognition, i.e., well-known brands were preferred and more frequently chosen than less known brands. Importantly, additional information about the well-known brands also had a significant impact on the proportion of chosen brands, suggesting that in preferential choice situations, recognition information is processed in a compensatory fashion, i.e., combined with the knowledge about other cues.
Finally, it remains unclear whether recognition-based heuristics also apply to situations where cues are more than just brand names. For example, whether we can use recognition-based heuristics with non-verbal auditory cues, such as music. To the best of our knowledge, previous studies on consumer choice have only used paradigms where recognition is manipu- lated through visual and verbal cues, such as brand names (e.g., presenting products with well-known names versus novel names). In these situations, it is clear that recognition is a powerful driver of preference and brand choice (Oeusoonthornwattana & Shanks, 2010; Thoma & Williams, 2013). In this study, we investigated the effect of music as a recognition cue to influence consumer choice when searching for new brands of frequently purchased products. This allows us to determine the generalizability of recognition-based heuristics to a non-verbal auditory domain and the effectiveness of music as a recognition cue in preferential choice.
H.1.2 The effect of music on brand recognition and consumer choice
Huron (1989) suggested “memorability” as one of the main six uses of music in advertising. He argued that the association of music with the identity of a product may substantially aid product recall (Huron, 1989). Nevertheless, empirical support of this claim is mixed. Some studies have shown that advertising music can significantly increase recall and recognition of brands and advertising content (Alexomanolaki, Loveday, & Kennett, 2007; Ali, Srinivas, & Bhat, 2012; Fraser & Bradford, 2013; Gerald Joseph Gorn, Chattopadhyay, & Litvack, 1991; Kellaris, Cox, & Cox, 1993; Tavassoli & Lee, 2003; Yalch, 1991), whereas others have found that advertising music can distract message processing and reduce recall (Anand & Sternthal, 1990; Fraser, 2014; Fraser & Bradford, 2013; Kellaris et al., 1993; Olsen, 1995; Tavassoli & Lee, 2003). These conflicting results can be explained several moderating factors, including structural cues of the music (characteristics such as tempo, instrumentation, emotionality, or complexity), the music fit or congruency with the ad, and consumers’ processing strategy (Fraser & Bradford, 2013; Kellaris et al., 1993; Macinnis & Park, 1991). For example, Kellaris et al. (1993) found that brand recall is influenced by the interplay of two musical properties: attention-gaining value (the activation potential of the music stimuli) and music-
244 H.1 Introduction
message congruency (the fit of the music stimuli with the brand or product advertised). Results showed that ad recall and recognition were enhanced only by attention-gaining music with high message congruency.
The other body of research relevant to this study concerns the effects of advertising music on consumer choice. Somewhat surprisingly, however, there are very few studies that attempted to quantify the effect of music on consumer choice. Alpert and colleagues (Alpert & Alpert, 1990; Alpert, Alpert, & Maltz, 2005) found a positive association between certain character- istics of advertising music and purchase intentions, although they only measured consumers’ intentions. Measuring actual choice, Gorn (1982) found that background music presented with generic products influenced participants’ choices through classical conditioning. Nev- ertheless, Gorn’s findings (1982) have been subject to controversy due to its problems of replicability (Kellaris & Cox, 1989; Vermeulen & Beukeboom, 2016). In addition, there is a broader body of research looking at the various effects of background music on product choice and spending behaviour (Areni & Kim, 1993; North, Schilcock, & Hargreaves, 2003; North, Hargreaves, & McKendrick, 1999; Yeoh & North, 2010; see North & Hargreaves, 2008, for a review). For instance, Areni and Kim (1993) found that customers in a wine cellar bought more expensive wine when the background music was classical as opposed to pop music. These studies, however, did not use music as a recognition cue to measure its effects on consumer choice. Moreover, there is often a weak connection between psychological theory and measurable effects of music that can successfully explain the positive (or negative) impact of music on consumer behaviour.
Despite this, there are good reasons to believe that familiar (or recognizable) music can be highly effective to increase recognition and influence consumer choice. First, the human auditory system exhibits a high sensitivity to familiar music (Filipic, Tillmann, & Bigand, 2010; Halpern & Bartlett, 2010; Jagiello et al., 2019; Krumhansl, 2010; Schellenberg, Iverson, & McKinnon, 1999). Second, musical cues can be more effective than verbal cues in eliciting recall of visual imagery in advertising (Stewart, Farmer, & Stannard, 1990; Stewart & Punj, 1998). Third, studies have consistently shown that music is a very efficient stimulus to induce repeated exposure effects (see Chmiel & Schubert, 2017; North & Hargreaves, 2008, for reviews), where listeners’ preferences for music increase rapidly with repeated listening. Finally, ads using music consistently (the same music pieces across consecutive campaigns) outperform ads using music inconsistently (changing across campaigns) (Bhattacharya, Zioga, & Lewis, 2017).

245 H.1 Introduction
H.1.3 Aims and hypothesis
Three conclusions can be drawn from the literature outlined above: (i) there is a need of quantifying the effectiveness of music in advertising and branding contexts; (ii) recognition- based heuristics are useful to predict consumer choice behaviour, but it remains unclear whether they also apply to situations with non-verbal auditory cues such as music; and (iii) although there are good reasons to believe that music can be effective in increasing brand recognition and choice, research on this topic is scarce, inconclusive, and does not offer testable and generalizable decision making theories. To address these gaps, the present study aimed to measure the effectiveness of music as a recognition cue to influence brand choice through recognition-based heuristics. Two experiments were conducted based on the paradigm used in Oeusoonthornwattana and Shanks (2010), who investigated recognition- based heuristics in consumer choice. However, instead of using verbal cues (e.g., brand names), the present study used music as the recognition cue to influence consumer choice when choosing between novel brands. Prior to the main experimental task, participants were instructed to learn several novel music clips. In the choice task, participants were presented with pairs of novel brands, one b paired with a previously learned music clip and the other with a novel one. Their task was to choose the brand they would purchase when buying from different product categories (e.g., headphones, cameras, cell phones).
In line with recognition-based heuristics, we hypothesized that brands paired with previously learned music would be chosen significantly more often than brands paired with novel music. In those situations where the conditions for recognition-based heuristics were not met – i.e., either because both music clips were novel or both were learned -, we expected consumer choices to be at chance level (50%). Since there are many information cues in music other than its recognition, it is plausible that inherent characteristics of the music stimuli generate different preferences in consumers, influencing brand choice. In an exploratory analysis (Experiment 2), we addressed this possibility by examining the extent to which music liking also influenced choice judgment in combination with the recognition status of the music clip. That is, whether recognition-based heuristics are used in a non-compensatory fashion, with music serving as a recognition cue. Due to the lack of research on this topic, no directed hypotheses were formulated.
246 H.2 Experiment 1
H.2 Experiment 1
H.2.1 Method
Participants
A total of 205 participants (143 female), aged 18-42 (M = 24.35, SD = 5.24), took part in the experiment. Participants were recruited in English speaking countries through the market research platform Slicethepie (www.slicethepie.com, owned and operated by SoundOut LLC.), an online recruitment panel of over 2.5 million people that operates across the US, UK, and European markets. There was a monetary compensation of US $1 to complete the experiment, which lasted 15-20 minutes.
Design and measures
The experiment used a within-participants design measuring participants’ choices in a two- alternative-forced choice task. The independent variables were the recognition of the music (learned vs. novel clips) and the type of pairs (critical vs. noncritical), whereas the dependent variable was the participants’ choice response. The experiment was conducted online using Qualtrics software (Provo, UT). The study was granted ethical clearance by the Ethics Committee of the Department of Psychology, University of Goldsmiths, London, on 5 May 2017.
Music stimuli selection (pilot study)
To test whether music can operate as a recognition cue to influence consumer choice, it was necessary to use brands and music stimuli that were unknown to participants. Thus, we conducted an online pilot study through the market research company SoundOut’s proprietary Slicethepie platform (slicethepie.com) to test the familiarity of brands and music clips. A total of 2,854 participants (1,910 female; Mean age 32, SD = 2.76) from UK and USA rated the stimuli, brand logos and music clips. Participants were asked to evaluate how familiar they were with the brand or song on a 10-point Likert scale (1 = extremely unfamiliar; 10 = extremely familiar). Sixty brands, representing five brand categories (i.e., headphones, tennis racquets, cameras, cell phones, and laptops), and 46 songs were tested. All music clips were produced by ‘unknown’ artists that were not signed to record companies. The brand names were taken from the appendix in Thoma and Williams (2013) and were all real brand names. The music stimuli were taken from SoundCloud (soundcloud.com). The familiarity scores for the brands and music clips were averaged across participants. The 24 most unfamiliar
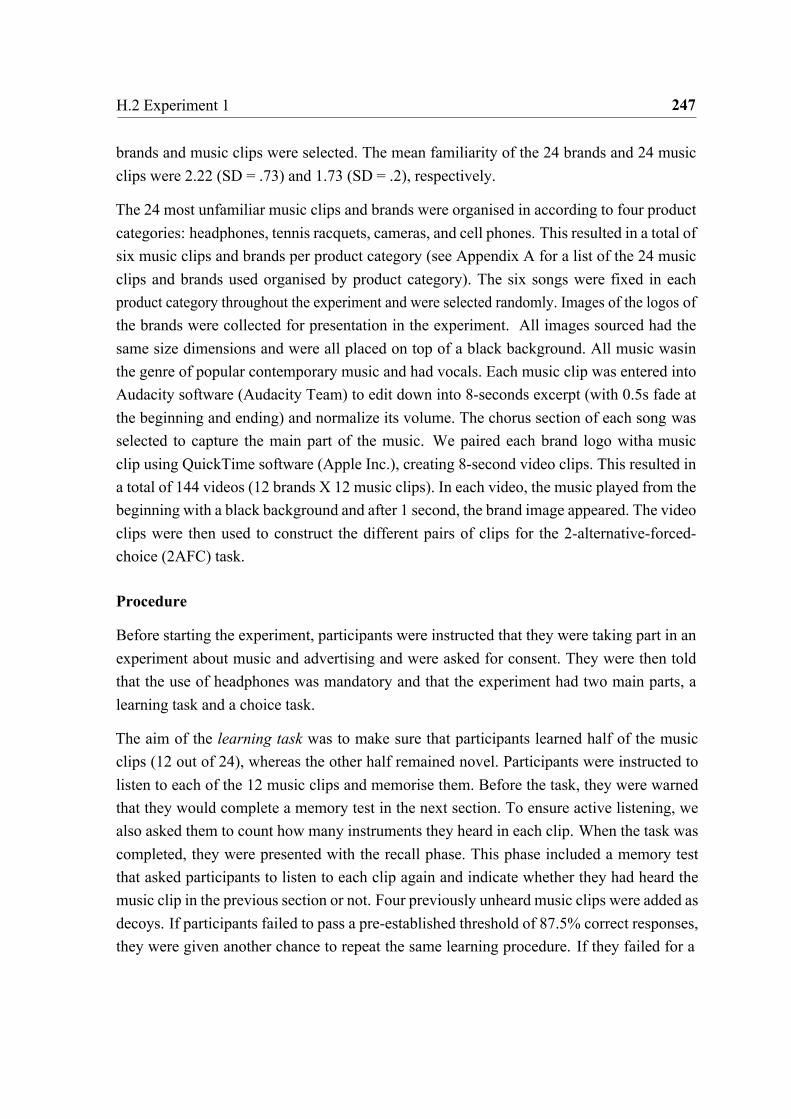
247 H.2 Experiment 1
brands and music clips were selected. The mean familiarity of the 24 brands and 24 music clips were 2.22 (SD = .73) and 1.73 (SD = .2), respectively.
The 24 most unfamiliar music clips and brands were organised in according to four product categories: headphones, tennis racquets, cameras, and cell phones. This resulted in a total of six music clips and brands per product category (see Appendix A for a list of the 24 music clips and brands used organised by product category). The six songs were fixed in each product category throughout the experiment and were selected randomly. Images of the logos of the brands were collected for presentation in the experiment. All images sourced had the same size dimensions and were all placed on top of a black background. All music was in the genre of popular contemporary music and had vocals. Each music clip was entered into Audacity software (Audacity Team) to edit down into 8-seconds excerpt (with 0.5s fade at the beginning and ending) and normalize its volume. The chorus section of each song was selected to capture the main part of the music. We paired each brand logo with a music clip using QuickTime software (Apple Inc.), creating 8-second video clips. This resulted in a total of 144 videos (12 brands X 12 music clips). In each video, the music played from the beginning with a black background and after 1 second, the brand image appeared. The video clips were then used to construct the different pairs of clips for the 2-alternative-forced-choice (2AFC) task.
Procedure
Before starting the experiment, participants were instructed that they were taking part in an experiment about music and advertising and were asked for consent. They were then told that the use of headphones was mandatory and that the experiment had two main parts, a learning task and a choice task.
The aim of the learning task was to make sure that participants learned half of the music clips (12 out of 24), whereas the other half remained novel. Participants were instructed to listen to each of the 12 music clips and memorise them. Before the task, they were warned that they would complete a memory test in the next section. To ensure active listening, we also asked them to count how many instruments they heard in each clip. When the task was completed, they were presented with the recall phase. This phase included a memory test that asked participants to listen to each clip again and indicate whether they had heard the music clip in the previous section or not. Four previously unheard music clips were added as decoys. If participants failed to pass a pre-established threshold of 87.5% correct responses, they were given another chance to repeat the same learning procedure. If they failed for a

248 H.2 Experiment 1
second time, they were excluded from the experiment. The order of the music clips in the two sections (learning and recall phase) was randomized.
The music clips that were presented in the learning phase were counterbalanced using two blocks. In block A, one set of the music clips were novel (1-12) and the other set learned (13-24), whereas, in block B, the order was reversed, i.e., the first set of music clips was learned (1-12) and the other set novel (13-24). Half of the participants were randomly allocated to block A and the other half to block B.
The choosing task consisted in a 2AFC paradigm. Participants were presented with the 12 pairs of videos, organised in the four brand categories. Each video contained a brand logo and a music clip. For each pair, participants were instructed to imagine they would like to buy a new product (according to each product category, e.g., headphones). Participants were then instructed to play each video and indicate which brand would they choose to purchase. After making a choice, participants were asked to evaluate how much they liked the music clips presented with the brands, using a 6-point Likert scale (1 = not at all; 6 = very much).
We used three types of pairs for the 2AFC task (see Figure H.1): critical pairs (one brand pair with a learned clip and one with a novel clip), noncritical learned pairs (the two brands paired with learned clips), and noncritical novel pairs (the two brands paired with novel clips). The noncritical pairs were used to examine consumer choice in situations where the recognition-based heuristics cannot operate because the two music clips are either novel or learned. Each participant was presented with a total of 12 pairs (three pairs for each product category), one after another. In each product category, one pair was always critical, one noncritical learned, and one noncritical novel. Thus, each participant was presented with 3 pairs of each type across the four brand categories, resulting in a total of 12 pairs (Figure H.1).

249 H.2 Experiment 1
Figure H.1Schematic visualization of the three types of pairs used in the choice task.
Each participant was presented with the three types of pairs in each product category, resulting in a total of 12
pairs per participant.
To pair the brands with the music clips within each product category, we used a randomised Latin Square Design (see Berman & Freuer. 2014). This allowed us to fully counterbalance the pairing of the brands with each music clip in each product category and across participants while controlling for potential confounding variables, such as order effects. Note, however, that only brands were fully counterbalanced in our design. This resulted in six possible brand-music combinations for each product category. Participants were randomly allocated to one of the six combinations at the beginning of the experiment. Thus, all participants were presented the same 24 brands and 24 music clips without any repetition. The order of presentation of the brand categories, type of pair within each category, and brand position within each pair were randomized for each participant.
H.2.2 Results
One participant who did not give consent and another who did not complete the entire experiment were excluded from the subsequent analysis. Thus, the following analysis included a total of 189 participants.
To examine the role of the recognition-based heuristics, one music clip in the critical pair had to be recognised (learned) and the other unrecognised (novel). To ensure that this was the case, we used the following two-fold exclusion criteria. First, participants who did not pass the pre-established threshold (i.e., to have 14 out of 16 correct answers, 87.5%) were removed automatically. Note, however, that in the case of failing, they were given a second chance to repeat the learning phase. A total of 42 participants did not meet the threshold

250 H.2 Experiment 1
both times and were excluded from the analysis. Thus, 147 participants, all of whom had successfully learned to recognize the set of music clips, were included in the following analysis. Second, for those participants who were included, we removed those trials in the main experiment where they were presented with a clip which they had not recognised in the learning phase. On average, 6.8% of the total number of observations were excluded due to this criterion.
In line with the analytic strategy used in (Oeusoonthornwattana & Shanks, 2010; Thoma & Williams, 2013), to test the main effect of music recognition on brand choice, we calculated participants’ mean choice proportions in the critical pairs (when one brand in the pair was presented with a learned music clip and the other with a novel one). In the critical trials, the proportion of choices across all participants when the brand was paired with learned music was 59% (SD = 26%) and when it was paired with novel music was 41% (SD = 26%). This represents an absolute difference of 9% for choosing brands paired with recognized music compared to choosing at a chance level (50%). The relative increase of choosing a brand when paired with recognized music compared to the novel was 18% (61/ 50 = 1.18), and the odds ratio to choose a brand paired with recognized music was 1.44 (44% higher). A paired-sample t-test indicated that this difference was statistically significant, t(126) = 3.97, p < .001, and had a small to medium effect size, d = .334.
We conducted a second analysis to examine the effect of music recognition across all choice conditions (critical and noncritical trials) and including all experimental design factors that could be confounders in our design – i.e., the role of brands (the 24 novel brands used throughout the choice task) and music clips (the 24 clips, 12 learned and 12 novel). This analysis allowed us to use the non-aggregated data at the trial level, treating the dependent variable as binary and taking the repeated measurement structure of participants’ choices into account. The analysis was conducted using a Bayesian mixed-effects model with a binomial link function, as implemented in the R package brms (Bürkner, 2017). The dependent variable was the binary response indicating whether the brand was chosen or not at each trial. The fixed factors were choice condition and the presentation position of the two choices in the 2AFC task (whether it was the first or second choice option). The choice condition was coded as a categorical variable with four levels indicating the recognition of the music clip (learned vs. novel) on each type of pair (critical vs. noncritical): (i) critical-novel (i.e., this brand was paired with a novel clip while the other brand in the pair was paired with a learned music clip), (ii) critical-learned (i.e., this brand was paired with a learned music clip while the other brand in the pair was paired with a novel music clip), (iii) noncritical-learned (i.e., both brands in the pair were paired with learned music clips), and (iv) noncritical-novel (i.e.,
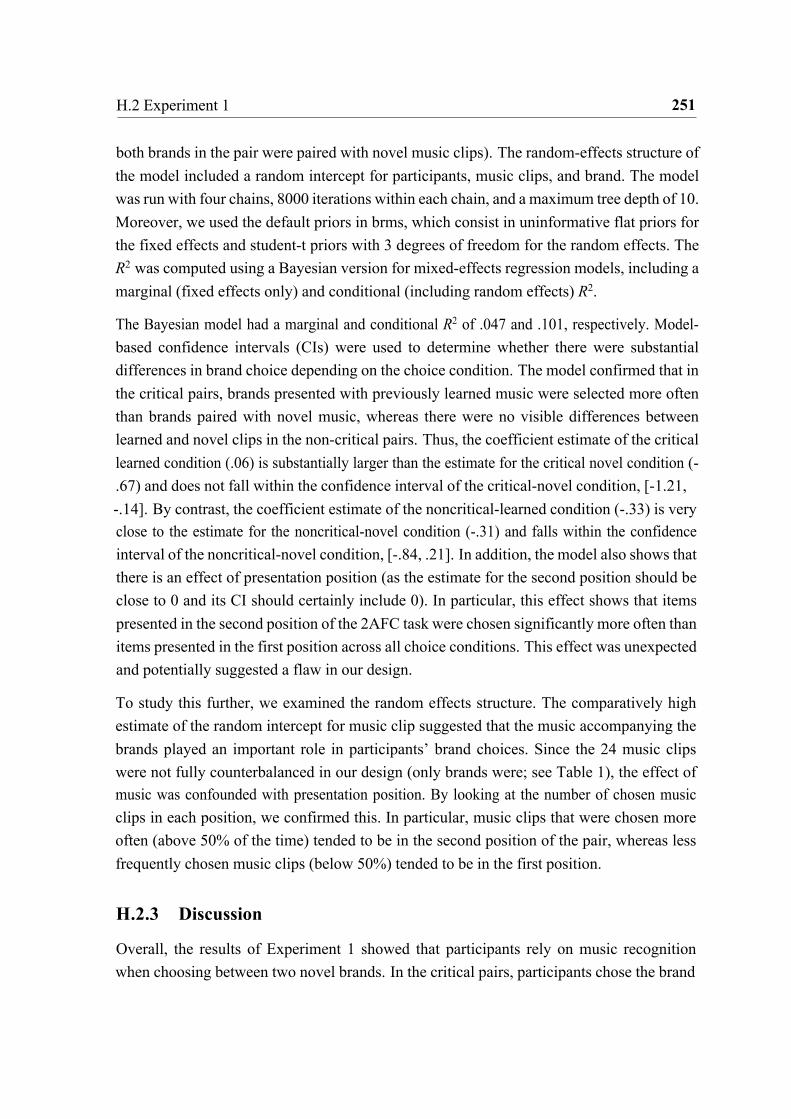
251 H.2 Experiment 1
both brands in the pair were paired with novel music clips). The random-effects structure of the model included a random intercept for participants, music clips, and brand. The model was run with four chains, 8000 iterations within each chain, and a maximum tree depth of 10. Moreover, we used the default priors in brms, which consist in uninformative flat priors for the fixed effects and student-t priors with 3 degrees of freedom for the random effects. The R2 was computed using a Bayesian version for mixed-effects regression models, including a marginal (fixed effects only) and conditional (including random effects) R2.
The Bayesian model had a marginal and conditional R2 of .047 and .101, respectively. Model- based confidence intervals (CIs) were used to determine whether there were substantial differences in brand choice depending on the choice condition. The model confirmed that in the critical pairs, brands presented with previously learned music were selected more often than brands paired with novel music, whereas there were no visible differences between learned and novel clips in the non-critical pairs. Thus, the coefficient estimate of the critical learned condition (.06) is substantially larger than the estimate for the critical novel condition (-.67) and does not fall within the confidence interval of the critical-novel condition, [-1.21, -.14]. By contrast, the coefficient estimate of the noncritical-learned condition (-.33) is very close to the estimate for the noncritical-novel condition (-.31) and falls within the confidence interval of the noncritical-novel condition, [-.84, .21]. In addition, the model also shows that there is an effect of presentation position (as the estimate for the second position should be close to 0 and its CI should certainly include 0). In particular, this effect shows that items presented in the second position of the 2AFC task were chosen significantly more often than items presented in the first position across all choice conditions. This effect was unexpected and potentially suggested a flaw in our design.
To study this further, we examined the random effects structure. The comparatively high estimate of the random intercept for music clip suggested that the music accompanying the brands played an important role in participants’ brand choices. Since the 24 music clips were not fully counterbalanced in our design (only brands were; see Table 1), the effect of music was confounded with presentation position. By looking at the number of chosen music clips in each position, we confirmed this. In particular, music clips that were chosen more often (above 50% of the time) tended to be in the second position of the pair, whereas less frequently chosen music clips (below 50%) tended to be in the first position.
H.2.3 Discussion
Overall, the results of Experiment 1 showed that participants rely on music recognition when choosing between two novel brands. In the critical pairs, participants chose the brand

252 H.2 Experiment 1
presented with learned music in 59% of all trials. In the noncritical pairs, participants’ choices were at chance level. However, we found a confounding effect of music in the presentation position of the two choices in the 2AFC task. That is, because some music clips were more preferred than others and the 24 music clips were not fully counterbalanced in our experimental design (each clip was always presented either with the first or the second choice in the pair), music and presentation position were confounded in our design and could be an alternative explanation for the observed findings. This finding shows that some music properties of the novel music generated higher preferences in our participant sample and, in turn, influenced their choices. With this in mind, we conducted Experiment 2 to solve this problem and examine further the role of music preferences when using music as a recognition cue to influence consumer choice. We used the same design and stimuli as in Experiment 1, but this time fully counterbalanced the order of music clip and presentation position across all trials and conditions. This allowed us to solve the issue outlined above and also conduct additional analyses to explore whether recognition-based heuristics are used in a compensatory fashion or combined with other information about the music.
H.3 Experiment 2
H.3.1 Method
Participants
A total of 281 participants (157 female), aged 18-63 (M = 28.92, SD = 10.54), took part in the experiment. Participants were recruited in English speaking countries through the market research platform Slicethepie (www.slicethepie.com), owned and operated by SoundOut (www.soundout.com). There was a monetary compensation of US $ 1 to complete the experiment, which lasted approximately 15-20 minutes.
Design, measures, and procedure
The only difference between Experiment 1 and 2 was in the design. Like in Experiment 1, we paired the brands with the music clips within each product category using a Latin Square Design. However, in each type of pair, we also fully counterbalanced the music clips with the presentation position of the two choices in the 2AFC task. Thus, if different music clips evoke different effects on participants’ choice (as seen in Experiment 1), the effect of specific music clip should influence similarly all conditions of our design. The stimuli, measures, and procedure were the same as used in Experiment 1.
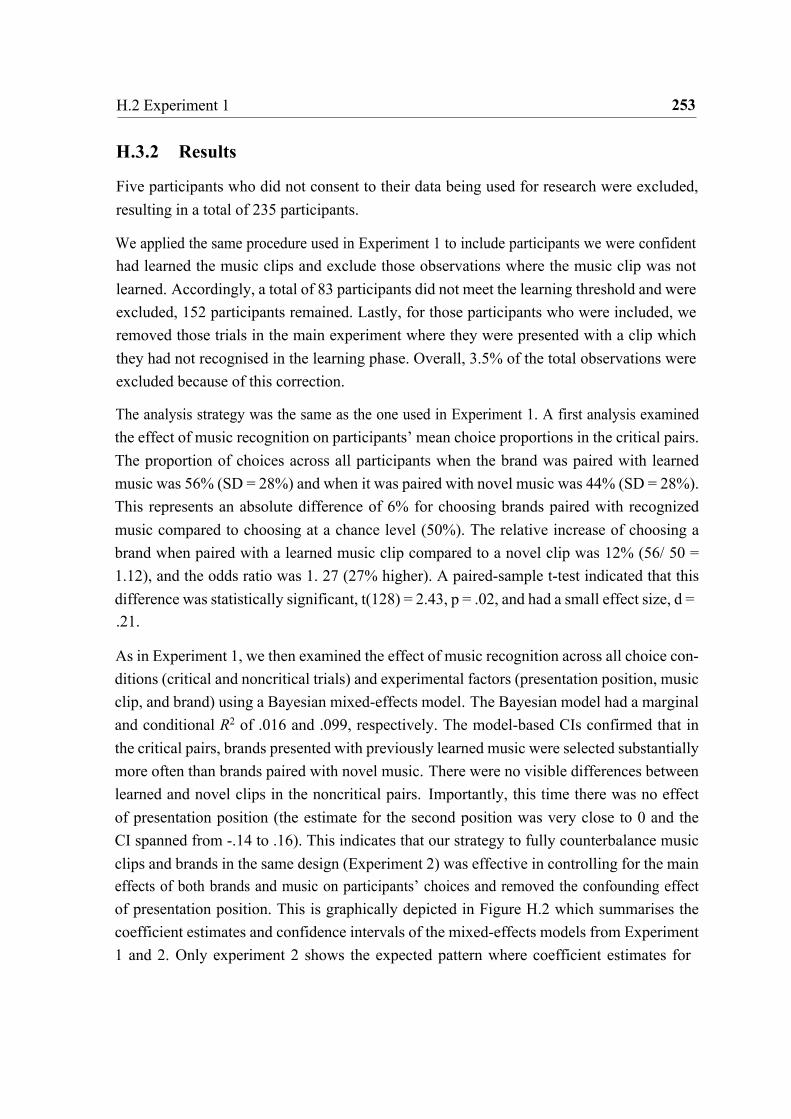
253 H.2 Experiment 1
H.3.2 Results
Five participants who did not consent to their data being used for research were excluded, resulting in a total of 235 participants.
We applied the same procedure used in Experiment 1 to include participants we were confident had learned the music clips and exclude those observations where the music clip was not learned. Accordingly, a total of 83 participants did not meet the learning threshold and were excluded, 152 participants remained. Lastly, for those participants who were included, we removed those trials in the main experiment where they were presented with a clip which they had not recognised in the learning phase. Overall, 3.5% of the total observations were excluded because of this correction.
The analysis strategy was the same as the one used in Experiment 1. A first analysis examined the effect of music recognition on participants’ mean choice proportions in the critical pairs. The proportion of choices across all participants when the brand was paired with learned music was 56% (SD = 28%) and when it was paired with novel music was 44% (SD = 28%). This represents an absolute difference of 6% for choosing brands paired with recognized music compared to choosing at a chance level (50%). The relative increase of choosing a brand when paired with a learned music clip compared to a novel clip was 12% (56/ 50 = 1.12), and the odds ratio was 1. 27 (27% higher). A paired-sample t-test indicated that this difference was statistically significant, t(128) = 2.43, p = .02, and had a small effect size, d = .21.
As in Experiment 1, we then examined the effect of music recognition across all choice con- ditions (critical and noncritical trials) and experimental factors (presentation position, music clip, and brand) using a Bayesian mixed-effects model. The Bayesian model had a marginal and conditional R2 of .016 and .099, respectively. The model-based CIs confirmed that in the critical pairs, brands presented with previously learned music were selected substantially more often than brands paired with novel music. There were no visible differences between learned and novel clips in the noncritical pairs. Importantly, this time there was no effect of presentation position (the estimate for the second position was very close to 0 and the CI spanned from -.14 to .16). This indicates that our strategy to fully counterbalance music clips and brands in the same design (Experiment 2) was effective in controlling for the main effects of both brands and music on participants’ choices and removed the confounding effect of presentation position. This is graphically depicted in Figure H.2 which summarises the coefficient estimates and confidence intervals of the mixed-effects models from Experiment 1 and 2. Only experiment 2 shows the expected pattern where coefficient estimates for

254 H.2 Experiment 1
both noncritical conditions are at 0 and the coefficients for the critical conditions show the expected sign - i.e. positive for learned, indicating a preference for brands presented with previously learned music; negative for brands presented with novel music.
Figure H.2 Effect of music recognition across choice conditions in the two experiments
(error bars represent 95% CI). Experiment 1
critical−learned critical−novel noncritical−learned noncritical−novel Choice condition
Experiment 2
critical−learned critical−novel noncritical−learned noncritical−novel Choice condition
We further explored the data to test whether or not the recognition-based heuristic was used in a compensatory fashion (Goldstein & Gigerenzer, 2002; see Oeusoonthornwattana & Shanks, 2010; Thoma & Williams, 2013, for examples in consumer choice). In particular, we examined the interaction between music recognition and liking on brand choice. To do so, we coded the music clips in the critical pairs according to how much participants liked them. Using the liking ratings of the music provided by each participant after choosing a brand, the music clips were coded either as liked (music clips rated as 4, 5, or 6 in the 6-point liking scale) or disliked (music clips rated as 1, 2, or 3 in the liking scale). We then performed a 2 (recognition) x 2 (liking) ANOVA with the mean proportion of choice as the dependent
Mod
el e
stim
ates
M
odel
est
imat
es
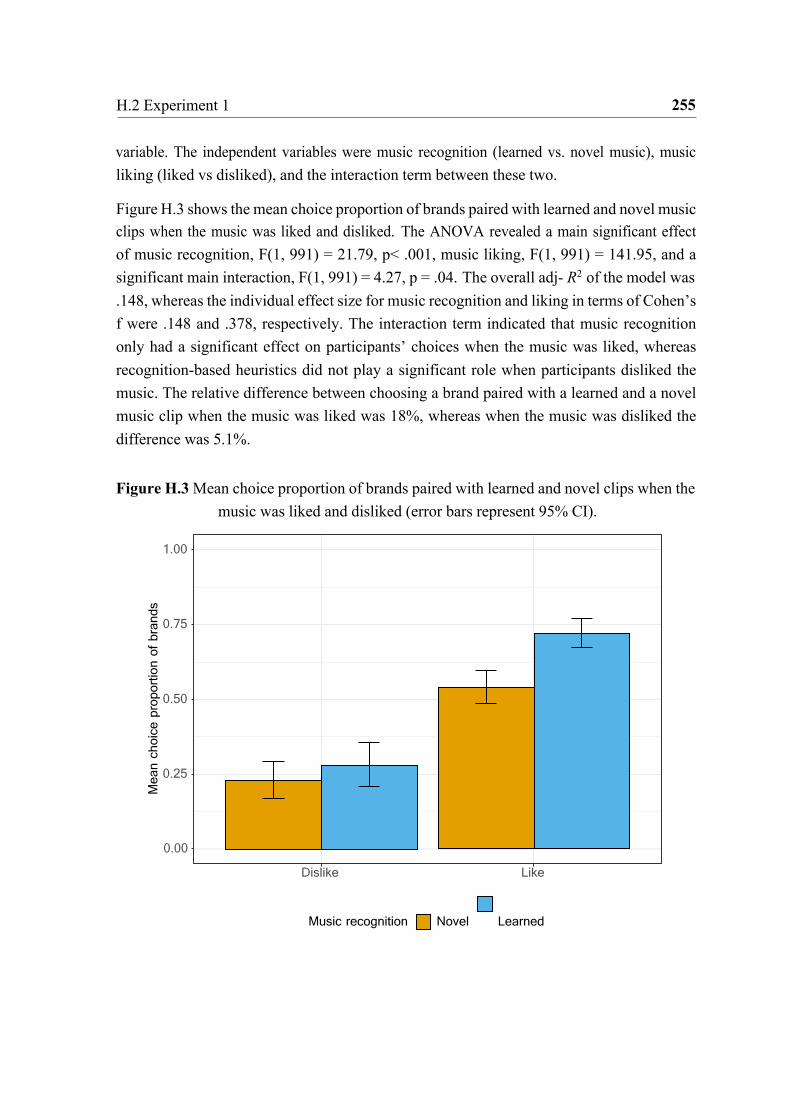
255 H.2 Experiment 1
variable. The independent variables were music recognition (learned vs. novel music), music liking (liked vs disliked), and the interaction term between these two.
Figure H.3 shows the mean choice proportion of brands paired with learned and novel music clips when the music was liked and disliked. The ANOVA revealed a main significant effect of music recognition, F(1, 991) = 21.79, p< .001, music liking, F(1, 991) = 141.95, and a significant main interaction, F(1, 991) = 4.27, p = .04. The overall adj- R2 of the model was .148, whereas the individual effect size for music recognition and liking in terms of Cohen’s f were .148 and .378, respectively. The interaction term indicated that music recognition only had a significant effect on participants’ choices when the music was liked, whereas recognition-based heuristics did not play a significant role when participants disliked the music. The relative difference between choosing a brand paired with a learned and a novel music clip when the music was liked was 18%, whereas when the music was disliked the difference was 5.1%.
Figure H.3 Mean choice proportion of brands paired with learned and novel clips when the
music was liked and disliked (error bars represent 95% CI).
1.00
0.75
0.50
0.25
0.00
Dislike
Like
Music recognition Novel Learned
Mea
n ch
oice
pro
port
ion
of b
rand
s
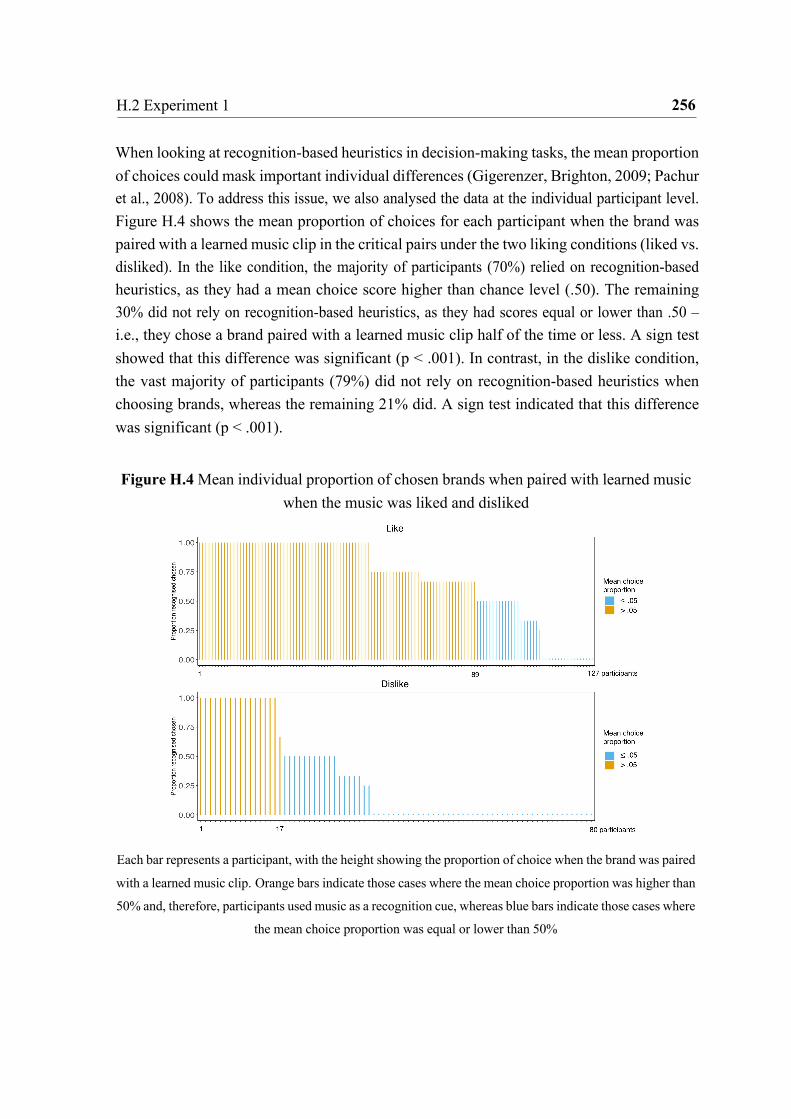
256 H.2 Experiment 1
When looking at recognition-based heuristics in decision-making tasks, the mean proportion of choices could mask important individual differences (Gigerenzer, Brighton, 2009; Pachur et al., 2008). To address this issue, we also analysed the data at the individual participant level. Figure H.4 shows the mean proportion of choices for each participant when the brand was paired with a learned music clip in the critical pairs under the two liking conditions (liked vs. disliked). In the like condition, the majority of participants (70%) relied on recognition-based heuristics, as they had a mean choice score higher than chance level (.50). The remaining 30% did not rely on recognition-based heuristics, as they had scores equal or lower than .50 – i.e., they chose a brand paired with a learned music clip half of the time or less. A sign test showed that this difference was significant (p < .001). In contrast, in the dislike condition, the vast majority of participants (79%) did not rely on recognition-based heuristics when choosing brands, whereas the remaining 21% did. A sign test indicated that this difference was significant (p < .001).
Figure H.4 Mean individual proportion of chosen brands when paired with learned music
when the music was liked and disliked
Each bar represents a participant, with the height showing the proportion of choice when the brand was paired
with a learned music clip. Orange bars indicate those cases where the mean choice proportion was higher than
50% and, therefore, participants used music as a recognition cue, whereas blue bars indicate those cases where
the mean choice proportion was equal or lower than 50%
257 H.4 General discussion
H.3.3 Discussion
Overall, the results of Experiment 2 confirmed that when choosing between two brands, music recognition has a significant impact on brand choice. In the critical pairs, participants chose the brand presented with learned music in 56% of all trials. This represents an absolute difference of 6% for choosing brands paired with recognized music compared to choosing at a chance level (50%), a relative increase of 12%, and an odds ratio of 1.127. In the noncritical pairs, participants’ choices were at chance level. Importantly, we did not find a confounding effect of music clip and presentation position. This confirms that our strategy – i.e., fully counterbalancing music clips in the two options of the 2AFC task - was effective in controlling for music effects and, therefore, removing the confounding effect of presentation position.
In a secondary and exploratory analysis, we examined whether recognition-based heuristics were used in a compensatory fashion or not. In particular, we explored whether additional music information, measured as participants’ liking for the music, was combined with music recognition to influence brand choice. Our results suggest that recognition-based heuristics are used in a compensatory fashion. That is, music recognition cues are combined with information about the liking of the music to influence brand choice. This was clearly indicated by a significant interaction between music recognition and liking, showing that recognition cues only had an impact on participants’ choices when they liked the music. Moreover, the effect of music liking (Cohen’s f = .378) was more than two times larger than the effect of music recognition (Cohen’s f = .148). Finally, we were able to confirm these findings when looking at the individual participant level. Overall, these results suggest that liking the music is necessary for recognition-based heuristics to work when using music as a recognition cue to influence brand choice.
H.4 General discussion
The recognition heuristic was primarily developed in the context of inferential choice tasks, such as when deciding which of two cities has more inhabitants (Gigerenzer et al., 1999; Goldstein & Gigerenzer, 2002). More recently, it has been applied successfully to study consumer choice based on preferences (Oeusoonthornwattana & Shanks, 2010; Thoma & Williams, 2013). The present study goes even further by asking to what extent can music be used as a recognition cue to influence consumers when choosing between brands of frequently purchased products.

258 H.4 General discussion
Our results show that music recognition is an important driver of choice in preferential tasks. Across both experiments, participants were significantly more likely to choose a brand when paired with recognised music (Experiment 1 = 59% and Experiment 2 = 56%) than when paired with novel music (Experiment 1 = 41% and Experiment 2 = 44%). Based on this, we can quantify the effectiveness of using music as a recognition cue to influence brand choice. Namely, pairing novel brands with music that can be recognized by the target consumers (as opposed to novel music) increases the likelihood that consumers will choose that brand by 6% (using the more conservative estimate found in Experiment 2). For example, if you were selling televisions at $100 per unit, you would see a gain of $600 for every 100 units sold when pairing your brand with recognized music, everything else being equal. Overall, these findings are in line with the literature on the recognition heuristic in inferential choice tasks (Goldstein & Gigerenzer, 2002; Pachur et al., 2011) as well as preferential tasks in consumer behaviour (Hauser, 2011; Oeusoonthornwattana & Shanks, 2010; Thoma & Williams, 2013). In addition, the present study adds to the existing body of research by showing, for the first time, the generalizability of recognition-based heuristics to a non-verbal auditory domain, such as when using music stimuli.
Importantly, we found that other information cues, such as music liking, also play a significant role in consumer choice. In an exploratory analysis (Experiment 2), we examined at the group and individual level if music recognition cues were combined with music liking to influence participants’ choices. We found that the effect of music liking was two times larger in size than the effect of music recognition. Moreover, a significant interaction revealed that music recognition only had a significant effect on brand choice when the music was liked, whereas recognition-based heuristics did not play a significant role when the music was disliked (Figure 3). In particular, the relative difference between choosing a brand paired with a learned and a novel music clip when the music was liked was 18%, whereas when the music was disliked the difference was 5.1%. The analysis at the individual participant level confirmed this finding. When participants liked the music stimuli, the majority of them (70%) relied on recognition-based heuristics to choose a brand. By contrast, when they disliked the music, only 21% of the participants relied on music recognition cues. These results suggest that recognition is an accessible cue that can be compensated for by other information, such as music liking. This finding supports previous literature showing that recognition-based heuristics are used in a compensatory fashion (e.g., Bröder & Eichler, 2006; Hilbig & Pohl, 2008; Newell & Shanks, 2004; Oeusoonthornwattana & Shanks, 2010; Thoma & Williams, 2013). However, we emphasize that this analysis was exploratory and future research would need to more carefully test for the compensatory use of music recognition in a similar choice task. For example, by previously manipulating the music stimuli to differ on various
259 H.4 General discussion
parameters, such as its liking, emotionality, quality, or fit with the brand. Future studies could also explore further why some individuals were more susceptible to music recognition than others by looking at individual differences such as musical sophistication and personality.
Naturally, our results are limited by a number of factors. First, the experimental design may have forced an artificial situation on our participants. Participants were asked to choose multiple times between two unknown brands without having access to information typically available in this type of decision-making situation, such as price, or further information about the brand or product. Second, our design required participants to decide between only two brands, which does not capture the complexity of many real-world consumer choices where there may be multiple options available to the consumer. Third, we did not consider the degree of involvement required of our participants while taking part in the study. Models of persuasion, including the Elaboration Likelihood Model (ELM; Petty & Cacioppo, 1986, 2003) and the Heuristic-Systematic Model (HSM; Chaiken et al., 1989), suggest that peripheral cues, such as music, are more persuasive under low-involvement consumption. Thus, in a real-world situation, music recognition may be less influential when consumers are highly involved and motivated in consuming a product. Having established the effectiveness of music as a recognition cue to influence consumer choice within the limits of our design, we encourage future research to use more ecological approaches to investigate the same effects in real-world situations, using a larger range of brand categories, products, and music stimuli.
It is worth noting that in both experiments, we used naturalistic stimuli by selecting existing brands of frequently purchased products and existing music from real artists. Moreover, by adding noncritical pairs in the choice task (i.e., two brands either paired with two learned or two novel music clips), we were able to examine participants’ choices when the conditions for the recognition-based heuristic were not met. That is, when the two alternatives were both recognized or unrecognized. Results confirmed that when recognition cannot operate, participants’ brand choices were at the chance level (not statistically different from 50%).
Furthermore, in Experiment 1 we found an unexpected confounding effect of music clip and the presentation position of the choice option in the 2AFC task. This occurred because the 24 music clips were not fully counterbalanced in the experimental design (only brands were; see Table 1). We were able to solve this issue in Experiment 2 by using a design that fully counterbalanced the 24 music clips in the two choice options of the 2AFC task. This time, we were able to control for the differential effects of specific music clips and did not find a significant confounding effect of presentation position. Such details in the design are

260 H.5 Conclusion
important for future research aiming to conduct studies using music stimuli, even if these are novel to participants and expected to have no influence.
As a final note, is important to consider how recognition-based heuristics may be operating under ecological rationality when using music as a recognition cue to influence consumer choice. In inferential choice tasks, the use of recognition-based heuristics is ecologically rational only if recognition is correlated with a mediator variable which in turn is correlated with the criterion (Goldstein & Gigerenzer, 2002). For example, city name recognition is correlated with the frequency of appearances in the media, which in turn is correlated with city size or population. This logic does not apply in preferential choice tasks because preference is subjective by nature and cannot be assessed based on an objective criterion (Brandstätter et al., 2006). An ecological explanation in the context of this study is that recognition can be a proxy for brand quality – i.e., only brands that sell their product can afford large scale advertising. Therefore, there are mediators (e.g., repeated advertising) that could reliably correlate with perceptions of quality (Hauser, 2011). An alternative explanation is that greater pleasure is derived from purchasing and consuming recognized products. For instance, there is evidence that the very same product is rated more pleasurable when it is identified than when it is unidentified (Allison & Uhl, 1964). This would provide another ecologically valid reason for consumers to rely on recognition cues when choosing between different products and brands.
H.5 Conclusion
Our results provide a first estimation of the effectiveness of using music as a recognition cue to influence consumer choice. This is valuable to inform brands in terms of measuring the value of their investment when working with music. Moreover, we found that music can only be successfully used as a recognition cue when it is liked by the target consumers, whereas recognition-based heuristics are not influential when the music is disliked. This finding adds to the body of research showing that music use in advertising and branding does not always have a positive effect on consumer behaviour and that there are many other factors that play a significant role, such as consumers’ preferences for the selected music. We hope these findings help raise awareness in the advertising and marketing community of the importance of using empirical findings and reliable theories to predict the effects of music on consumer behaviour.
261 H.6 References
H.6 References Aaker, D. A. (1996). Measuring brand equity across products and markets. California
management review, 38(3), 102-120. Anglada-Tort, M., Keller, S., Steffens, J., & Müllensiefen, D. (2020). The Impact of Source
Effects on the Evaluation of Music for Advertising: Are there Differences in How Advertising Professionals and Consumers Judge Music?. Journal of Advertising Research. Advanced online publication.
Alexomanolaki, M., Loveday, C., & Kennett, C. (2007). Music and memory in advertising: Music as a device of implicit learning and recall. Music, Sound, and the Moving Image, 1(1), 51-71.
Ali, M. A., Srinivas, Y. M., & Bhat, M. S. (2012). Effectiveness of Music in Humorous Advertisements. BVIMR Management Edge, 5(2), 103–117.
Alpert, M. I., Alpert, J. I., & Maltz, E. N. (2005). Purchase occasion influence on the role of music in advertising. Journal of business research, 58(3), 369-376.
Allan, D. (2007). Sound advertising: a review of the experimental evidence on the effects of music in commercials on attention, memory, attitudes, and purchase intention. Journal of Media Psychology, 12(3), 1-35.
Anand, P., & Sternthal, B. (1990). Ease of Message Processing as a Moderator of Repetition Effects in Advertising. Journal of Marketing Research, 27(3), 345–353.
Areni, C., & Kim, D. (1993). The influence of background music on shopping behavior: Classical versus top-forty music in a. Advances in Consumer Research, 20(1), 336–340.
Berman, G., & Fryer, K. D. (2014). Introduction to combinatorics. Elsevier. Bhattacharya, J., Zioga, I., & Lewis, R. (2017). Novel or consistent music? An electro-
physiological study investigating music use in advertising. Journal of Neuroscience, Psychology, and Economics, 10(4), 137–152.
Brandstätter, E., Gigerenzer, G., & Hertwig, R. (2006). The priority heuristic: making choices without trade-offs. Psychological review, 113(2), 409.
Bornstein, R. F. (1989). Exposure and affect: overview and meta-analysis of research, 1968–1987. Psychological bulletin, 106(2), 265.
Bürkner, P. C. (2017). brms: An R package for Bayesian multilevel models using Stan. Journal of statistical software, 80(1), 1-28.
Chmiel, A., & Schubert, E. (2017). Back to the inverted-U for music preference: A review of the literature, Psychology of Music, 45(6), 886–909.
Coates, S. L., Butler, L. T., & Berry, D. C. (2004). Implicit memory: A prime example for brand consideration and choice. Applied Cognitive Psychology, 18(9), 1195-1211.
262 H.6 References
Dodds, W. B., Monroe, K. B., & Grewal, D. (1991). Effects of price, brand, and store
information on buyers’ product evaluations. Journal of marketing research, 28(3), 307-319.
Filipic, S., Tillmann, B., & Bigand, E. (2010). Judging familiarity and emotion from very brief musical excerpts. Psychonomic Bulletin & Review, 17(3), 335-341.
Fraser, C. (2014). Music-evoked images: Music that inspires them and their influences on brand and message recall in the short and the longer term. Psychology & Marketing, 31(10), 813-827.
Fraser, C., & Bradford, J. A. (2013). Music to Your Brain: Background Music Changes Are Processed First, Reducing Ad Message Recall. Psychology and Marketing, 30(1), 62–75.
Czerlinski, J., Gigerenzer, G., & Goldstein, D. G. (1999). How good are simple heuristics?. In Simple heuristics that make us smart (pp. 97-118). Oxford University Press.
Goldstein, D. G., & Gigerenzer, G. (2002). Models of ecological rationality: the recognition heuristic. Psychological review, 109(1), 75.
Gorn, G. J. (1982). The Effects of Music in Advertising on Choice Behavior: A Classical Conditioning Approach. Journal of Marketing, 46(1), 94–101.
Gorn, G. J., Chattopadhyay, A., & Litvack, D. (1991). Music and Information in Commer- cials: Their Effects with an Elderly Sample. Journal of Advertising Research, 31(5), 23.
Grewal, D., Krishnan, R., Baker, J., & Borin, N. A. (1998). The effect of store name, brand name and price discounts on consumers’ evaluations and purchase intentions. Journal of retailing, 74(3), 331.
Halpern, A. R., & Bartlett, J. C. (2010). Memory for melodies. In Music perception (pp. 233-258). Springer, New York, NY.
Hoyer, W. D., & Brown, S. P. (1990). Effects of brand awareness on choice for a common, repeat-purchase product. Journal of consumer research, 17(2), 141-148.
Herget, A. K., Schramm, H., & Breves, P. (2018). Development and testing of an instrument to determine Musical Fit in audio–visual advertising. Musicae Scientiae, 22(3), 362- 376.
Huron, D. (1989). Music in advertising: An analytic paradigm. The Musical Quarterly, 73(4), 557-574.
Jackson, D. M., & Fulberg, P. (2003). Sonic branding: an introduction. Basingstoke: Palgrave Macmillan.

263 H.6 References
Jagiello, R., Pomper, U., Yoneya, M., Zhao, S., & Chait, M. (2019). Rapid Brain Responses
to familiar vs. Unfamiliar Music–an eeG and pupillometry study. Scientific reports, 9(1), 1-13.
Kellaris, J. J., & Cox, A. D. (1989). The Effects of Background Music in Advertising: A Reassessment. Journal of Consumer Research, 16(1), 113.
Kellaris, J. J., Cox, A. D., & Cox, D. (1993). The Effect of Background Music on Ad Processing: A Contingency Explanation. Journal of Marketing, 57(4), 114–125.
Keller, K. L. (1993). Conceptualizing, measuring, and managing customer-based brand equity. Journal of Marketing, 57(1), 1-22.
Krumhansl, C. L. (2010). Plink: “Thin slices” of music. Music Perception, 27(5), 337–354. Lantos, G. P., & Craton, L. G. (2012). A model of consumer response to advertising music.
Journal of Consumer Marketing, 29(1), 22-42. Lusensky, J., & Tinsley, S. (2010). Sounds like branding. Sweden: Heartbeats International. Macdonald, E. K., & Sharp, B. M. (2000). Brand awareness effects on consumer decision
making for a common, repeat purchase product: A replication. Journal of business research, 48(1), 5-15.
Macinnis, D. J., & Park, C. W. (1991). The Differential Role of Characteristics of Music on High- and Low- Involvement Consumers’ Processing of Ads. Journal of Consumer Research, 18(2), 161.
Marewski, J. N., Gaissmaier, W., & Gigerenzer, G. (2010). We favor formal models of heuristics rather than lists of loose dichotomies: A reply to Evans and Over. Cognitive Processing, 11(2), 177-179.
North, A. C., Hargreaves, D. J., & McKendrick, J. (1999). The influence of in-store music on wine selections. Journal of Applied psychology, 84(2), 271.
North, A. C.; Mackenzie, L. C.; Law, R. M. & Hargreaves, D. J. (2004). The Effects of Musical and Voice "Fit" on Responses to Advertisements. Journal of Applied Social Psychology, 34(8), 1675–1708.
North, A. C., Shilcock, A., & Hargreaves, D. J. (2003). The effect of musical style on restaurant customers’ spending. Environment and behavior, 35(5), 712-718.
Oeusoonthornwattana, O., & Shanks, D. R. (2010). I like what I know: Is recognition a non-compensatory determiner of consumer choice?. Judgment and Decision Making, 5(4), 310.
Olsen, G. D. (1995). Creating the Contrast: The Influence of Silence and Background Music on Recall and Attribute Importance. Journal of Advertising, 24(4), 29–44.

264 H.6 References
Pachur, T., Bröder, A., & Marewski, J. N. (2008). The recognition heuristic in memory-based
inference: Is recognition a non-compensatory cue?. Journal of Behavioral Decision Making, 21(2), 183-210.
Pachur, T., Todd, P. M., Gigerenzer, G., Schooler, L., & Goldstein, D. G. (2011). The recognition heuristic: A review of theory and tests. Frontiers in psychology, 2, 147.
Raja, M. W., Anand, S., & Kumar, I. (2018). Multi-item scale construction to measure consumers’ attitude toward advertising music. Journal of Marketing Communications, 1-14.
Ruth, N., & Spangardt, B. (2017). Research trends on music and advertising. Mediterranean Journal of Communication, 8(2), 18–23
Percy, L., & Rossiter, J. R. (1992). A model of brand awareness and brand attitude advertising strategies. Psychology & Marketing, 9(4), 263-274.
Shevy, M., & Hung, K. (2013). Music in television advertising and other persuasive media. In S.-L. Tan, A. J. Cohen, S. D. Lipscomb, & R . A. Kendall (Eds.), The psychology of music in multimedia (pp. 315-38). Oxford, UK: Oxford University Press.
Schellenberg, E. G., Iverson, P., & McKinnon, M. C. (1999). Name that tune: Identifying popular recordings from brief excerpts. Psychonomic Bulletin & Review, 6(4), 641–646.
Schramm, H. & Ruth, N. (2014). “The voice” of the music industry. New advertising options in music talent shows. En Flath, B. & Klein, E. (Eds.), Advertising and Design. Interdisciplinary Perspectives on a Cultural Field (pp. 175–190). Bielefeld, Germany: Transcript.
Stewart, D W, & Punj, G. N. (1998). Effects of using a nonverbal (Musical) cue on recall and playback of television advertising: Implications for advertising tracking. Journal of Business Research, 42(1), 39–51.
Thoma, V., & Williams, A. (2013). The devil you know: The effect of brand recognition and product ratings on consumer choice. Judgment and Decision Making, 8(1), 34-44.
Tavassoli, N. T., & Lee, Y. H. (2003). The Differential Interaction of Auditory and Visual Advertising Elements with Chinese and English. Journal of Marketing Research, 40(4), 468–480.
Vermeulen, I., & Beukeboom, C. J. (2016). Effects of music in advertising: Three experiments replicating single-exposure musical conditioning of consumer choice (Gorn 1982) in an individual setting. Journal of Advertising, 45(1), 53–61.
Zajonc, R. B. (1968). Attitudinal effects of mere exposure. Journal of personality and social psychology, 9(2p2), 1.
Yalch, R. F. (1991). Memory in a Jingle Jungle: Music as a Mnemonic Device in Communi- cating Advertising Slogans. Journal of Applied Psychology, 76(2), 268–275.

265 H.6 References
Yeoh, J. P. S., & North, A. C. (2010). The effects of musical fit on choice between two
competing foods. Musicae Scientiae, 14(1), 165–180.
Appendix I The busking experiment: A field study (S9)
This is an Accepted Manuscript of an article published by APA in Psychomusicology: music, mind, & brain. ©American Psychological Association, 2019. This paper is not the copy of record and may not exactly replicate the authoritative document published in the APA journal. Please do not copy or cite without author's permission. The final article is available, upon publication, at: https://doi.org/10.1037/pmu0000236. For presentation in this thesis, the appendices of the paper have been removed and the passages referring to each Appendix in the text modified to indicate where to find the materials online. Moreover, there may be minor modifications in the text to guarantee a consistent typographic style throughout the thesis, such as the position of figures and tables. Citation Anglada-Tort, M., Thueringer, H., & Omigie, D. (2019). The busking experiment: A field study measuring behavioral responses to street music performances. Psychomusicology: Music, Mind, and Brain, 29(1), 46. DOI: https://doi.org/10.1037/pmu0000236
Author contribution I conceived the idea of this project and supervised it along with Dr. Diana Omigie (Gold- smiths, University of London). The study was conducted and developed by Heather Thueringer as part of his master thesis in the MSc in Music, Mind, and Brain, at Goldsmiths, University of London (2018-2019). After Heather completed her masters, I reanalysed the data and wrote the paper for publication.

The busking experiment: A field study measuring
behavioral responses to street music performances
A field experiment was conducted with a professional busker in the London Underground over the course of 24 days. Its aim was to investigate the extent to which performative aspects influence behavioural responses to music street performances. Two aspects of the performance were manipulated: familiarity of the music (familiar vs. unfamiliar) and body movements (expressive vs. restricted). The amount of money donated and number of people who donated were recorded. A total of 278 people donated over the experiment. The music stimuli, which was selected in a pilot study to only differ in familiarity, had been previously recorded by the busker. During the experimental sessions, the busker lip-synced to the pre-recorded recordings. Thus, the audio input in the experiment remained identical across sessions and the only variables that changed across conditions were the familiarity of the music and the expressivity of performed body movements. The results indicated that neither music familiarity nor performer’s body movements had a significant impact on the amount of money donated (Rm2 = .033) nor the number of donors (Rm2 = .023). These results do not support previous literature on the influence of familiarity and performers’ body movements, typically conducted in lab and artificial environments. The findings are further discussed with regard to potential extraneous variables that are crucial to control for (i.e., location of the performance, physical appearance, the bandwagon effect) and the advantages of field versus laboratory experiments. A novel research framework to study music judgements and behaviour is introduced, namely, the behavioural economics of music.
Keywords: busking , street performance, familiarity, body movements, field study.
268 I.1 Introduction
I.1 Introduction
Busking – or street performance for money – has been a popular practice in cities’ public spaces for centuries (Cohen & Greenwood, 1981). As early as the 11th century, troubadours and jongleurs were entertaining the citizens of France, and in the 12th century, Germany was filled with Minnesingers and Spielleute (Smith, 1996). Since then, buskers have continued the tradition of street entertainment to the present day. However, despite the long history of street performance and the prevalence of buskers in most major cities across the globe, there has been remarkably little research conducted on this topic within the field of music psychology.
The majority of the literature on street musicians has focused on the history of busking (Campbell, 1981; Cohen & Greenwood, 1981; Smith, 1996) and single case studies about individual buskers, exploring the meaning and motivations behind busking the practice (Jef- freys & Wang, 2012; Rebeiro Gruhl, 2017; Williams, 2016). Other studies have approached the topic of busking within the fields of economics (Kushner & Brooks, 2000), law (Quilter & McNamara, 2015; McNamara & Quilter, 2016), and ethnography as well as ethnomusicology (Breyley, 2016; Marina, 2018; Wong, 2016). However, none of these studies used a scientific approach to measure people’s behavioural responses to street music performances or to explore potentially relevant factors mediating successful busking.
To the best of our knowledge, a study from Lemay and Bates (2013) is the only attempt in the scientific literature to investigate mediating factors contributing to busker donations. A sample of 103 undergraduate students were surveyed on their religion and attitudes toward busking. The best predictive model of giving to buskers was a three variable solution consisting of low religious fundamentalism, less experienced irritation toward buskers, and prior experience of giving to the homeless (Lemay & Bayes, 2013). Nevertheless, that study is limited in its reliance solely on survey methodology and a sample of undergraduate students, instead of measuring actual behaviour in real-world situations. Thus, a main motivation of the present study was to design a field experiment that investigates the impact of different performative aspects on people’s behavioural responses to buskers; and in doing so, allowing the collection of raw data in a natural busking environment.
Two additional questions guided the current research, namely: What makes a good music street performer? And which aspects of the performative act might influence people’s behavioural responses? To address these questions, we focused on two potential mediating factors that may be expected to influence the amount of donations and number of donors to busker performances. These were the familiarity of the music and the expressivity of the
269 I.1 Introduction
performer’s body movements. The connection between familiarity and music enjoyment has been extensively investigated through the “mere exposure effect” (Zajonc, 1968), with most studies showing that liking for music increases with repeated exposure, or familiarity (see North & Hargreaves, 2008, for a review). This effect has also been found in the evaluation of music performances (Anglada-Tort & Müllensifen, 2017; Korger & Margulis, 2016). Moreover, familiarity plays an important role in the emotional engagement of listeners with music (Pereira, Texeira, Figueiredo, Xavier, Castro, & Brattico, 2011); and familiar music has been positively associated with participants’ willingness to pay for the music (Tavani, Caroff, Storme, and Colange, 2016). Therefore, from a busker’s point of view, the evidence appears overwhelmingly in favour of using familiar music stimuli over unfamiliar to create positive affect and, therefore, maximize profits.
Field experiments offer important advantages compared to lab studies. However, field research is very scarce in the field of music psychology, where the majority of studies utilise laboratory experiments (Hallam, Cross, & Thaut,2018; some exceptions are Jacob, Guéguen, & Boulbry, 2010; North, Tarrant, & Hargreaves, 2004; Ruth, 2017). Controlled studies conducted in labs and other artificial environments are susceptible, amongst others, to two major problems (Carpenter, Harrison, & List, 2005; Reis & Judd, 2000): a lack of external validity – the extent to which the results are generalisable beyond the research setting and participants pool – and a lack of ecological validity – the degree to which the results apply to the real-world situation under study -. One can justify these problems by the high levels of internal validity - the extent to which an experiment controls for confounding variables – enabled by lab experiments. Nevertheless, it is also possible to control carefully for confounding variables in field research (Carpenter et al., 2005). The effects of familiarity and body movements on listeners’ perception and appreciation of music have been well documented in lab settings (see North & Hargreaves, 2008; Platz & Kopiez, 2012, for reviews). Yet, are these findings reproducible outside of the lab and under real-world conditions? The current research addresses this question with the aid of a novel experimental design that carefully controls for potential confounding variables while enabling the measurement of people’s economic responses to street music performances in a natural busking environment.
The present study aimed to investigate the extent to which music familiarity and expressivity of body movements influence behavioural responses to street music performances. A field experiment was conducted with a professional busker in the London Underground over 24 days. The amount of donations and number of donors were the measured dependent variables. Participants were London commuters and were not aware of taking part in a scientific study.
270 I.2 Methods
Based on the literature outlined above, the following two hypotheses formed the bases for the current research: (i) Busking performances employing familiar music and expressive body movements will lead to the highest amount of donations and number of donors: and (ii) busking performances with unfamiliar music and restrictive body movements will lead to the lowest amount of donations and number of donors.
I.2 Methods
I.2.1 Participants
Participants were commuters in the London Underground’s Waterloo Station who happened to pass by during the music performances. Participants were unaware they were involved in research of any kind. Due to the location of the experiment, ethical considerations, and the nature of the study itself, cameras recording footage for the study did not capture faces of participants but only filmed the busker’s donation bag and the feet of people walking nearby. The total number of people who passed within aural and visual range of the busker during the 24 sessions could not be estimated. However, the total number of donors over the experiment was 278.
I.2.2 Design
This research was granted ethical approval by the Ethics Committee of the Department of Psychology of Goldsmiths College, University of London (27th of March 2018). A field experiment in the London Underground was designed to measure the effects of music famil- iarity (familiar vs. unfamiliar) and performer’s body movements (expressive vs. restricted). The dependent variables were the amount of money donated and the number donors. Each session lasted approximately an hour and was comprised of four blocks: (i) familiar music with body movements, (ii) familiar music without body movements, (iii) unfamiliar music with body movements, and (iv) unfamiliar music without body movements. The order of the four blocks was fully counterbalanced across sessions using a Latin Square Design (see Berman & Fryer, 2014, for a review), resulting in a total of 24 possible orders.
I.2.3 Experimental setup
The field experiment was always performed in the same location, namely, busking pitch num- ber 3 in London’s Waterloo underground station. Waterloo is the second busiest underground station in London, servicing 95 million passengers per year (Carnegie, 2017). This location

271 I.2 Methods
was chosen primarily because the busker had previously performed there many times and as it was a relatively easy pitch to book compared to other locations. This ensured we could book the same pitch for all 24 experimental sessions. Moreover, a decision was made to conduct the field experiment in the Underground, instead of other outdoor locations, in order to be able to control for potential extraneous variables such as weather. The busker was a professional singer who has been licensed to busk in London Underground by Transport for London since 2017, when the first busking licenses were issued.
To set up the session, the iPod was plugged into the auxiliary input of a Roland Cube Street battery powered amplifier, along with a Shure SM58 microphone, which was turned off to avoid sending any noise or feedback through the amp during the mime. The volume of audio output was controlled from the iPod, and the level was kept constant across all sessions. A standard metal music stand was erected, and an Akaso EK5000 video camera set to 1080p/30fps mounted on a Rhodesy Octopus-style tripod was wrapped around the pole. The busker’s money collection bag, sized approximately 30cm x 60cm x 20cm, was positioned next to the music stand. The camera was aimed down at the money bag. This camera was used to record the amount of money donated as well as the number of people donating (see supplementary materials for the video footage of one of the sessions).
To determine the amount of money donated more efficiently after each block, four layers of scarves were arranged in the busker’s collection bag. Each block condition was assigned a different coloured scarf – green for familiar/expressive, blue for familiar/restricted, purple for unfamiliar/expressive, and magenta for unfamiliar/restricted. The scarf colour assigned to the last block condition of the session was placed on the bottom of the bag, followed by the penultimate block condition, until the colour ascribed to the first block condition which was placed on top. At the end of each block, the money donated by onlookers during that block was quickly scooped up in the scarf, tied up and set aside, leaving the bag empty and ready for donations to be given in the next block.
I.2.4 Music stimuli: a pilot studuy
In order to select music stimuli that differed only in their familiarity and were as similar as possible in other features (e.g., style, instrumentation, production), we conducted an online pilot study using Qualtrics software (Qualtrics, Provo, UT). A total of 40 songs were chosen from 10 artists, whereby the four songs from each artist had been released in the same album. The criteria for selection were female artists (or female-fronted bands) who had had a Top 10 hit on the UK singles charts. The hit song had to be on the same album as at least three other songs that were not released as singles in the UK and had, therefore, not achieved
272 I.2 Methods
as much popularity as the hit. Accordingly, these three songs, although similar in relevant music properties, including singer, year of release, style, instrumentation, and production, were unlikely to be as familiar to the general public. The ten hit songs deemed as highly familiar were trimmed to a 30 second excerpt, as close to the chorus or the most repeating (or familiar) segment of the track as possible, using the music creation software GarageBand, version 10.2.
A sample of 53 participants took part in the pilot study. Participation was on a voluntary basis and unpaid. Participants listened to the 10 hit songs from the different artists and rated how familiar each song was to them, on a scale from 1 (not at all) to 6 (very much). The order of presentation of the 10 hit songs was randomized for each participant. Along with the presentation of each hit, participants were presented with the three matched tracks from the same artist released in the same album, also in random order. They were asked to evaluate how familiar each of the three tracks was to them, using the same 6-point scale, as well as to evaluate their similarity to the hit, on scale from 1 (not at all) to 6 (very much). Participants were not prompted to consider precisely how the songs were similar (e.g., key, tempo, theme, chord progression, song structure). Rather, the question was left to the interpretation of the survey respondent.
Based on the results of the pilot study, for the familiar music condition we selected the following four highly popular (most familiar to respondents) hits: “Firework” by Katy Perry, “Stronger” by Kelly Clarkson, “Applause” by Lady Gaga, and “Sober” by Pink. For the unfamiliar music condition, matched songs by each of these four artists were selected based on their low familiarity ratings but high evaluations on similarity to the corresponding hit, namely, “Hummingbird Heartbeat” by Katy Perry, “Alone” by Kelly Clarkson, “Fashion!” by Lady Gaga, and “I Don’t Believe You” by Pink.
Instrumental versions of the four familiar and four matched-unfamiliar songs were down- loaded online (www.youtube.com and www.karaoke-version.com). The busker’s voice was recorded using Logic Pro X recording software and a Rode NT1 microphone, creating audio versions of the busker singing on each of the eight instrumental recordings. The songs were loaded into iTunes. Two separate playlists were created, one with the four familiar songs and one with the four unfamiliar songs, so that each playlist could be played according to the block condition. An extra track consisting of five seconds of silence was added as the starting track into each playlist to ensure that the songs would randomize correctly without the need to start the playlist manually from a particular tune. The two playlists were then downloaded onto a 4GB iPod Nano A1236. The total playing time was 15 minutes and 25

273 I.3 Results
seconds for the four songs in the familiar condition, and 15 minutes and 24 seconds for the four songs in the unfamiliar condition.
I.2.5 Procedure
At the start of the session, the busker was reminded of the block order for the session. The layers of scarves of different colours (representing different blocks) were arranged accordingly. The investigator moved some distance away as to be as unobtrusive and inconspicuous as possible. The order of the songs in each block were played in random order using iTunes. During the experimental sessions, the busker lip-synced to pre-recorded recordings so that audio input in the experiment remained identical across sessions. Thus, the only variables that changed across conditions were the familiarity of the music and the expressivity of the body movements, which could be expressive (e.g., swaying, hand gestures) or restricted (the performer remained as still as possible), depending on the assigned condition of the block. At the end of each block, the investigator approached the busker to collect the donations in the scarf and ensure that the busker was aware of the next block condition. At the end of the session, the investigator opened the scarves containing the money and counted the currency within each one on camera, logging the amount earned in donations for each block condition. The money was then given to the busker. Footage from the field sessions was later uploaded later and watched back in order to count the number of donors per block condition. The first experimental session was on the 21st of June 2018 and the last on the 2nd of August 2018.
I.3 Results
To test the main hypotheses regarding the effects of familiarity and body movements, a first analysis was conducted using a chi-square test. The frequency of donors was compared between the four experimental conditions. The results showed that there were no significant differences in the number of donors across the four different conditions, X2 (1) = .54, p = .46: familiar music with expressive movements (25.5%), familiar music with restricted movements (25.5%), unfamiliar music with expressive movements (22.3%), and unfamiliar movements with restricted movements (26.6%).
A second analysis used liner mixed-effect modelling, as implemented in the R package lme4 (Bates, Mächler, Bolker, & Walker, 2015), which is a more advanced statistical technique that takes into account the repeated measures structure of the data and can model random variability by assuming random intercepts for different relevant factors, such as the day of
274 I.3 Results
the experiment, time, and the order of the experimental blocks (Baayen, Davidson, & Bates, 2008; Pinheiro & Bates, 2000).
We ran separate analyses for the two dependent variables: the amount of money donated (donations) and the number of people who donated (donors). Based on Ekström (2012), the experimental sessions in a given day were taken as the repeated measure unit. In the two analyses, familiarity (familiar vs. unfamiliar music), body movements (expressive vs. restricted), and the interaction term were the fixed effect factors, while the day of the session was the random effect factor. Note that adding intercepts for order of the blocks, time of the day, week, and month did not improve the overall performance of the models and, therefore, they were not included. Effect coding (as opposed to the default treatment coding) as well as Type-III Wald chi-square significance test were used, as implemented in the R package car (Fox et al., 2011). Effects sizes were calculated using the R package MuMIn (Barton, 2009), which calculates the marginal (variance explained by the fixed factors) and the conditional (variance explained by both fixed and random factors) coefficient of determination for Generalized mixed-effect models. See Appendix A, in the paper published online, for a summary table of the two linear mixed-effects models (donations and donors).
Figure I.1 shows the effects of familiarity and body movements on the amount of money donated. The linear-mixed effect model revealed that familiarity, body movements, and the interaction term were all nonsignificant (all p-values > .05). The marginal and conditional effect sizes of the model were .033 and .107, respectively. Figure I.2 depicts the effects of familiarity and body movements on the number of people donating money (donors). The linear-mixed effect model, again, indicated that none of the fixed factors (i.e., familiarity, body movements, and the interaction) were statistically significant (all p-values > .05). The marginal and conditional effect sizes of the model were .023 and .023, respectively.
Overall, in the familiar music condition, the average monetary value of donations was £3.58 (SD = 2.92) and the average number of donors was 2.96 (SD = 1.74), whereas in the unfamiliar music condition, the averages were £3.10 (SD = 2.71) and 2.81 donors (SD = 1.50). In the expressive body movements condition, the average monetary value of donations was £3.14 (SD = 2.66) and the average number of donors was 2.73 (SD = 1.57), whereas in the restricted body movements condition, the averages were £3.55 (SD = 2.98) and 3.04 donators (SD = 1.66), respectively.

275 I.3 Results
Figure I.1 Effects of familiarity and body movements on the amount of money donated.
Error bars represent the standard error.
Figure I.2 Effects of familiarity and body movements on the number of donors.
Error bars represent the standard error.

276 I.4 Discussion
I.4 Discussion
The present study aimed to investigate the extent to which performative aspects (i.e., music familiarity and expressivity of body movements) influence behavioural responses to street music performances. The results from the field experiment did not support our previous hypotheses. Firstly, the familiarity of the music did not have a significant impact on the amount of donations and number of donors. This finding was initially surprising given the large amount of research showing the effects of familiarity on liking for music (see North & Hargreaves, 2008, for a review), music performances (Anglada-Tort & Müllensifen, 2017; Korger & Margulis, 2016), emotional engagement to music (Pereira et al., 2011), and willingness to pay for music (Tavani et al., 2016). This result occurred in spite of a pilot study in which we carefully selected music stimuli that differed only in their familiarity while remaining as similar as possible in other relevant features (e.g., artist, year of release, style, instrumentation, production). Thus, our study does not support previous literature on familiarity effects and music. Alternatively, it could be argued that the magnitude of any existing effect was too small to be detected by measuring donating behaviour alone. For example,within the expressive body movements condition, there was a trend supporting the hypothesis regarding familiarity (Figures H.1 and H.2) - i.e., familiar music led to more donations and donors than unfamiliar music. This trend was also present in the overall results across conditions, with higher donations and donors in the familiar music condition compared to the unfamiliar blocks. Based on our data, however, there is little to suggest that street music performers should opt to use familiar music stimuli over unfamiliar to create positive affect and maximize profits.
The second hypothesis with respect to expressivity of body movements was also rejected. Expressivity did not have a significant effect on the amount of donations and number of donors. Once again, this result fails to support previous studies on the influence of visual information on music evaluation (see Platz & Kopiez, 2012, for a review and meta-analysis study). In contrast, this finding could suggest that London commuters, in general, do not pay much attention to street music performances. A similar conclusion can be drawn from the performance of one of the world’s greatest violin soloists, Joshua Bell, in the Washington Metro system, who performed classical music during 43 minutes with a Stradivarius valued at 3.5 million dollars (Service, 2007). Out of 1,097 people that passed him by, only 27 donated any money and seven stopped to listen for more than a minute, earning a total of US $32 (Service, 2007). In addition, in the context of busking and, in particular, busking in the underground, visuals might play less of a role. Indeed, the time that London passengers were exposed visually to the busker’s performance in our experimental setup was limited compared

277 I.4 Discussion
to the acoustics. The busking pitch was near the bottom of an escalator, in a relatively hidden corner. Accordingly, passersby had sight of the busker potentially as little as 5 seconds and no more than 30 seconds. By contrast, in concert environments, where listeners are exposed to visual cues as much as auditory cues, visual information has been shown to be a prominent factor influencing the appreciation of music performances (see Platz & Kopiez, 2012, for a review). Thus, it is important to make a distinction between music street performances that happen in commuting spaces, such as the London Underground, and performances in open and more static spaces, such as city squares or parks. Visual information (e.g., the busker’s body movements) is likely less influential in the former than in the latter.
Three additional factors could be used to explain the observed findings. First, there are important individual differences between the amount and type of movement that performers use to express their emotional intentions (Dahl & Friberg, 2004, 2007; Vines et al., 2006; Wanderley, 2002). Second, not all performers use expressive movements in a distinct way that can be always interpreted by observers (Dahl & Friberg, 2004, 2007). Third, Wanderley (2002) reported that some of the clarinet performers under study moved while playing even when they were told not to move at all. Therefore, future studies would benefit from videoing the buskers so that an independent sample could provide judgements on variables such as authenticity and expressivity of body movements. It would also be interesting to take several buskers into account in the same study to examine potential individual differences between busker types.
Regarding our initial question - are findings from lab studies reproducible outside the lab and under real-world conditions? - the results reported in this study are incongruent with studies conducted in lab and artificial environments, looking at the effects of familiarity (see North & Hargreaves, 2008, for a review) and performer’s body movements (see Platz & Kopiez, 2012, for a review). These discrepancies might be due to differences in the ecologic validity between laboratory and field studies. Laboratory experiments normally suffer from low ecological validity (i.e., the extent to which an experiment approximates the real-world situation under study) and low external validity (i.e., the degree to which the results of the study can be generalizable beyond the research setting) (Carpenter, Harrison, & List, 2005; Reis & Judd, 2000). For instance, in the lab, participants are always aware of their participation in a scientific study and their only goal is to listen carefully to the music while evaluating it in a highly controlled and quiet environment. In contrast, the field experiment reported here offered high ecological validity. The 24 experimental sessions were conducted in a natural busking environment under real-world conditions, and participants did not know they were part of a scientific study. When measuring economic behaviour,

278 I.5 References
issues related to poor ecological validity and generalizability are taken particularly seriously by economists and behavioural scientists (Harrison & List, 2004; Levitt & List, 2007). As argued by Levitt and List (2007): “Perhaps the most fundamental question in experimental economics is whether findings from the lab are likely to provide reliable inferences outside of the laboratory” (p. 179). Overall, we hope to inspire both music psychologists and behavioural scientists to consider further ways to examine human behavioural responses to music and aesthetic stimuli in natural environments, once sufficient scientific grounding has been obtained based on lab-generated data.
By generating more realistic theories and making more accurate predictions than traditional economics, the field of behavioural economics has increased the realism of the psycho- logical underpinnings of economic analysis, improving substantially its explanatory power (Camerer & Loewenstein, 2011). Behavioural economics has not only transformed tradi- tional economics, but has also had far-reaching implications for many other fields, including psychology, political sciences, health, law, education, and marketing (see Hastie & Dawes, 2010; Kahneman, 2011; Thaler, 2015, for reviews). Nevertheless, despite the popularity of behavioural economics, the field has not yet been applied to the study of judgements and decision-making processes in the context of music listening and music-related phenomena. Thus, the behavioural economics of music (Anglada-Tort & Müllensiefen, 2017; Anglada- Tort, Baker, & Müllensiefen, 2018; Anglada-Tort, Steffens, & Müllensiefen) aims to create a solid understanding of the role that behavioural economics and the psychology of decision making can play to study music judgements, choice behaviour, and aesthetics. In the present study, we applied field research methodology commonly used by behavioural scientists and experimental economists to investigate donating behaviour and charitable giving in the real world (e.g., Ebeling, Feldhaus, & Femdrich, 2017; Ekström, 2012; Khadjavi, 2016; Moussaoui, Naef, Tissot, & Desrichard, 2016; Olda & Ichihashi, 2016). We hope to show potential applications and benefits of the behavioural economics of music and encourage future researchers to apply paradigms and knowledge from behavioural economics to study judgements and decision-making processes involving music.
I.5 References Anglada-Tort, M., & Müllensiefen, D. (2017). The repeated recording illusion: The effects
of extrinsic and individual difference factors on musical judgements. Music Perception, 35(1), 92-115.
279 I.5 References
Anglada-Tort, M., Baker, T., & Müllensiefen, D. (2018). False memories in music listen-
ing: exploring the misinformation effect and individual difference factors in auditory memory. Memory, 1-16. d
Anglada-Tort, M., Steffens, J., & Müllensiefen, D. (2018). Names and titles matter: The impact of linguistic fluency and the affect heuristic on aesthetic and value judgements of
music. Psychology of Aesthetics, Creativity, and the Arts. Advance online publication. Bates, D., Mächler, M., Bolker, B., & Walker, S. (2015). Fitting linear mixed-effects models
using lme4. Journal of Statistical Software, 67(1), 1-48. Barton, K., & Barton, M. K. (2018). Package ‘MuMIn’. R Package Version 1.42.1. Retrieved
from https://cran.r-project.org/web/packages/MuMIn/MuMIn.pdf Baayen, R. H., Davidson, D. J., & Bates, D. M. (2008). Mixed-effects mod- eling with
crossed random effects for subjects and items. Journal of Memory and Language, 59(4), 390–412.
Breyley, G. J. (2016). Between the cracks: Street music in Iran. Journal of Musicological Research, 35(2), 72-81.
Campbell, P. J. (1981). Passing the hat: Street performers in America. Delacorte Press. Carpenter, J. P., Harrison, G. W., & List, J. A. (Eds.). (2005). Field experiments in economics.
Elsevier JAI. Castellano, G., Mortillaro, M., Camurri, A., Volpe, G., & Scherer, K. (2008). Automated
analysis of body movement in emotionally expressive piano performances. Music Perception: An Interdisciplinary Journal, 26(2), 103-119.
Chapados, C., & Levitin, D. J. (2008). Cross-modal interactions in the experience of musical performances: Physiological correlates. Cognition, 108(3), 639-651.
Cohen, D., & Greenwood, B. (1981). The buskers: A history of street entertainment. London, England: David and Charles.
Dahl, S., & Friberg, A. (2004). Expressiveness of a marimba player’s body movements. TMH-SPSR, 46(1), 75-86.
Dahl, S., & Friberg, A. (2007). Visual perception of expressiveness in musicians’ body movements. Music Perception: An Interdisciplinary Journal, 24(5), 433-454.
Ebeling, F., Feldhaus, C., & Fendrich, J. (2017). A field experiment on the impact of a prior donor’s social status on subsequent charitable giving. Journal of Economic Psychology, 61, 124-133.
Ekström, M. (2012). Do watching eyes affect charitable giving? Evidence from a field experiment. Experimental Economics, 15(3), 530-546.

280 I.5 References
Griffiths, N. K. (2009). ‘Posh music should equal posh dress’: An investigation into the
concert dress and physical appearance of female soloists. Psychology of Music, 38(2), 159-177.
Hallam, s., Cross, I., & Thaut, M. (2011). Oxford handbook of music psychology (2nd ed.). Oxford, UK: Oxford University Press.
Harrison, G. W., & List, J. A. (2004). Field experiments. Journal of Economic literature, 42(4), 1009-1055.
Hastie, R., & Dawes, R. M. (2010). Rational Choice in an Uncertain World: The Psychology of Judgement and Decision Making. Thousand Oaks, CA: SAGE Publications.
Jacob, C., Guéguen, N., & Boulbry, G. (2010). Effects of songs with prosocial lyrics on tipping behavior in a restaurant. International Journal of Hospitality Management, 29(4), 761-763.
Jeffreys, E., & Wang, S. (2012). Migrant Beegars and buskers: China’s have-less celebrities. Critical Asian Studies, 44(4), 571-596.
Kahneman, D. (2011). Thinking, fast and slow. New York: Farrar, Straus and Giroux. Khadjavi, M. (2016). Indirect reciprocity and charitable giving—evidence from a field
experiment. Management Science, 63(11), 3708-3717. Kroger, C., & Margulis, E. H. (2016). “But they told me it was professional”: Extrinsic
factors in the evaluation of musical performance. Psychology of Music, 45(1), 49-64. Kushner, R. J., & Brooks, A. C. (2000). The one-man band by the quick lunch stand:
Modeling audience response to street performance. Journal of Cultural Economics, 24(1), 65-77.
Leibenstein, H. (1950). Bandwagon, snob, and Veblen effects in the theory of consumers’ demand. The Quarterly Journal of Economics, 64(2), 183-207.
Levitt, S. D., & List, J. A. (2007). What do laboratory experiments measuring social preferences reveal about the real world?. Journal of Economic Perspectives, 21(2), 153-174.
Lemay, J. O., & Bates, L. W. (2013). Exploration of charity toward busking (street perfor- mance) as a function of religion. Psychological Reports, 112(2), 578-592.
Marina, P. (2018). Buskers of New Orleans: Transgressive sociology in the urban underbelly. Journal of Contemporary Ethnography, 47(3), 306-335.
McNamara, L., & Quilter, J. (2016). Street music and the law in Australia: busker perspec- tives on the impact of local council rules and regulations. Journal of Musicological Research, 35(2), 113-127.

281 I.5 References
Moussaoui, L. S., Naef, D., Tissot, J. D., & Desrichard, O. (2016). “Save lives” arguments
might not be as effective as you think: A randomized field experiment on blood donation. Transfusion Clinique et Biologique, 23(2), 59-63.
North, A. C., & Hargreaves, D. J. (1997). The effect of physical attractiveness on responses to pop music performers and their music. Empirical Studies of the Arts, 15(1), 75-89.
North, A., & Hargreaves, D. (2008). The social and applied psychology of music. New York, NY: Oxford University Press.
North, A. C., Tarrant, M., & Hargreaves, D. J. (2004). The effects of music on helping behavior: A field study. Environment and Behavior, 36(2), 266-275.
Oda, R., & Ichihashi, R. (2016). Effects of eye images and norm cues on charitable donation: A field experiment in an izakaya. Evolutionary Psychology, 14(4), 1474704916668874.
Pereira, C. S., Teixeira, J., Figueiredo, P., Xavier, J., Castro, S. L., & Brattico, E. (2011). Music and emotions in the brain: familiarity matters. PloS ONE, 6(11), e27241.
Pinheiro, J. C., & Bates, D. M. (2000). Linear mixed-effects models: Basic concepts and examples. In Mixed-effects models in S and S-plus (pp. 3–56). New York: Springer.
Platz, F., & Kopiez, R. (2012). When the eye listens: A meta-analysis of how audio-visual presentation enhances the appreciation of music performance. Music Perception, 30(1), 71–83.
Reis, H. T., & Judd, C. M. (Eds.). (2000). Handbook of research methods in social and personality psychology. Cambridge University Press.
Ruth, N. (2017). “Heal the World”: A field experiment on the effects of music with prosocial lyrics on prosocial behavior. Psychology of Music, 45(2), 298-304.
Service, T. (2007, April 18). Joshua Bell: no ordinary busker. The Guardian. Retrieved from https://www.theguardian.com/music/tomserviceblog/2007/apr/18/joshuabellnoordinarybusker
Thaler, R. H., & Ganser, L. J. (2015). Misbehaving: The making of behavioral economics (p. 358). New York, NY: WW Norton.
Tavani, J. L., Caroff, X., Storme, M., & Collange, J. (2016). Familiarity and liking for music: The moderating effect of creative potential and what predict the market value. Learning and Individual Differences, 52, 197-203.
Quilter, J., & McNamara, L. (2015). Long may the buskers carry on busking: Street music and the law in Melbourne and Sydney. Melbourne University Law Review, 39, 539.
Rebeiro Gruhl, K. (2017). Becoming visible: Exploring the meaning of busking for a person with mental illness. Journal of Occupational Science, 24(2), 193-202.
Smith, M. (1996). Traditions, stereotypes, and tactics: A history of musical buskers in Toronto. Canadian Journal for Traditional Music, 24(6), 6-22.
282 I.5 References
Timmers, R., Marolt, M., Camurri, A., & Volpe, G. (2006). Listeners’ emotional engagement
with performances of a Scriabin étude: an explorative case study. Psychology of Music, 34(4), 481-510.
Vines, B., Krumhansl, C., Wanderley, M., & Levitin, D. (2006). Cross-modal interactions in the perception of musical performance. Cognition, 101(1), 80-113.
Vines, B. W., Wanderley, M. M., Krumhansl, C. L., Nuzzo, R. L., & Levitin, D. J. (2004). Performance gestures of musicians: What structural and emotional information do they convey? Gesture-Based Communication in Human-Computer Interaction, 468-478.
Wanderley, M. M. (2001). Quantitative analysis of non-obvious performer gestures. In International Gesture Workshop (pp. 241-253). Springer, Berlin, Heidelberg.
Williams, J. (2016). Busking in musical thought: value, affect, and becoming. Journal of Musicological Research, 35(2), 142-155.
Zajonc, R. B. (1968). Attitudinal effects of mere exposure. Journal of Personality and Social Psychology, 9 (2p2), 1-27.

Appendix J Popular music lyrics and musicians’ gender over time (S10)
This is an Accepted Manuscript of an article published by SAGE in Psychology of Music on 23rh of October 2019. Copyright © 2019 (SAGE), and available online: https://doi.org/10.1177/0305735619871602. The paper is not the copy of the record and may not exactly replicate the authoritative document published in the journal. For presentation in this thesis, the appendices of the paper have been removed and the passages referring to each Appendix in the text modified to indicate where to find the materials online. Moreover, there may be minor modifications in the text to guarantee a consistent typographic style throughout the thesis, such as the position of figures and tables. Please do not copy or cite without author’s permission
Citation Anglada-Tort, M., Krause, K., & North, A. C. (2019). Popular music lyrics and musicians’ gender over time: A computational approach. Psychology of Music. 0305735619871602. DOI: https://doi.org/10.1177/0305735619871602
Author contribution The idea of this paper was developed together with Prof. Dr. Adrian North (Curtin University) and Dr. Amanda Krause (James Cook University). I conceived the idea for the analysis strategy and wrote the paper, whereas all other aspects were done collaboratively.
Popular music lyrics and musicians’ gender over time: A
computational approach
The present study investigated how the gender distribution of the United Kingdom’s most popular artists has changed over time and the extent to which these changes might relate to popular music lyrics. Using data mining and machine learning techniques, we analysed all songs that reached the UK weekly top 5 sales charts from 1960 to 2015 (4,222 songs). DIC- TION software facilitated a computerised analysis of the lyrics, measuring a total of 36 lyrical variables per song. Results showed a significant inequality in gender representation on the charts. However, the presence of female musicians increased significantly over the time span. The most critical inflection points leading to changes in the prevalence of female musicians were in 1968, 1976, and 1984. Linear mixed-effect models showed that the total number of words and the use of self-reference in popular music lyrics changed significantly as a function of musicians’ gender distribution over time, and particularly around the three critical inflection points identified. Irrespective of gender, there was a significant trend towards increasing repetition in the lyrics over time. Results are discussed in terms of the potential advantages of using machine learning techniques to study naturalistic singles sales charts data.
Keywords: popular music , lyrics, gender, DICTION, sales charts, machine learning.

285 J.1 Introduction
J.1 Introduction
Popular music is a cultural product, an artefact of society that reflects people’s preferences, values, and psychological traits (DeWall, Pond, Campbell, & Twenge, 2011; Pettijohn & Sacco, 2009). As such, a critical study of popular music can provide valuable insights into different aspects of society at a specific point in time. Research suggests that listeners’ music preferences are a representation of their personality, cognitive styles, attitudes, and personal values (see Greasley & Lamont, 2016, for a review). Thus, by investigating properties of popular music (e.g., lyrics) and characteristics of the artists (e.g., gender), one could identify general attributes of the sociocultural context in which the music was produced and consumed.
Since the beginning of the modern music industry, top artists in the singles sales charts have been predominantly male (Dukes, Bisel, Borega, Lobato, & Owens, 2003; Hesbacher, Clasby, Clasby, & Berger, 1977; Lafrance, Worcester, & Burns, 2011; Wells, 1986, 1991, 2001). For example, Wells (1986) found that female artists were significantly underrepresented in US popular music from 1955 to 1984, accounting for approximately 10 of Billboard’s top 50 singles per year since 1955; and Lafrance et al. (2011) showed that artists in the Billboard top 40 charts between 1997 and 2007 continued to be predominantly male. In addition to American sales charts, Wells (1991) examined the success of female artists in the UK specifically. The peak year for female artists in the UK was 1985 (17 hits out of the year’s top 40 singles), followed by 1987 (15 hits), and 1986 (14 hits), indicating that in the mid 1980s female success rates in UK were higher than in earlier periods. Therefore, two main conclusions can be drawn from this body of research: top artists in the singles sales charts have been predominantly male, but the presence of female artists among rank orderings of the most successful musicians may increase over time and seem to indicate critical points of change.
To the best of our knowledge, Dukes et al.’s (2003) study covered the most extensive time period (40 years, from 1958 to 1998) while focusing on musicians’ gender. The authors found associations between musicians’ gender and specific lyrical themes, with the specific nature of the themes changing, depending on the period. For instance, from 1976 to 1984, female artists used five times more sexual references in lyrics than did males, but from 1991 to 1998, males used more sexual references. However, Dukes et al.’s (2003) dataset was limited, comprising only 100 songs. More recently,Krause and North (2017) investigated associations between the gender of musicians and the prevalence of specific lyrical themes, using a much larger dataset (4,534 observations) representing every song to have reached the United Kingdom’s top 5 singles chart from 1960 to 2015. The authors also identified

286 J.1 Introduction
associations between musicians’ gender and specific lyrical themes. For example, there was a positive relationship between the proportion of band members who were female and the use of words indicative of inspiration and negative relationships involving the use of words indicative of aggression and diversity (Krause and North, 2017). Nevertheless, variations over time were not considered, and so the main motivation of the present study was to add consideration of time into their analyses.
In addition to the relationship between popular music and artists’ gender, studies have considered changes in popular song lyrics over time, focusing on social, economic, and psychological changes in the USA (Christenson, Haan-Rietdijk, Roberts, & Bogt, 2018; DeWall, Pond, Campbell, & Twenger, 2011; McAuslan & Waung, 2016; Pettijohn & Sacco, 2009; Zullow, 1991), Germany (Ruth, 2018), and UK (Krause and North, 2017; Kane, & Sheridan, 2018). Despite finding a number of provocative results, these studies, did not consider the musicians’ gender or potential associations between gender and the various lyrical variables of interest. This is particularly unfortunate given the clear interest in gender equality that has characterised a significant amount of public discourse from the 1960s onwards (e.g., Alvarez, 1990; Chant, 2011; Dollar & Gatti, 1999; Gundersen, 2011; Lorber, 2001; Jeffreys, 2013; Ridgeway, 2011).
Furthermore, there are a number of limitations to previous research that has addressed trends in music lyrics over time and the correlation between properties of the music and the gender of performers. These include that (1) most studies are based on a relatively small number of songs (e.g., 1,000 songs) that enjoyed cultural prominence over a reasonably short period; (2) most studies have mainly focused on US culture and US popular music, overlooking whether trends are also present elsewhere; (3) studies have only looked at a very limited number of lyrical themes, with a particular focus on interpersonal relationships, so that we know little about other ways in which music lyrics and their relationship with gender have changed over time; and (4) most studies have used human coders to analyse the content of popular songs, limiting both the quantity of lyrics that can be analysed and the reliability and accuracy of the results. One of the motivations of the present study was to overcome the aforementioned limitations.
As part of a series of papers focusing on popular music lyrics in the UK (North et al., 2018; Krause and North, 2017), the present study extends the scope to consider lyrical content, musicians’ gender, and time within the same research design. The first aim was to investigate how the gender distribution of the UK’s most popular musicians has changed over time. Based on previous literature on the role of female artists in popular music (e.g., Dukes et al., 2003; Lafrance et al., 2001; Wells, 1986, 1991, 2001), it was hypothesized that popular music

287 J.2 Methods
in the United Kingdom would be characterized by a considerable gender inequality, although we expected a significant increase in the presence of female artists in more recent years. We also expected to find critical inflection points in which the prevalence of females increased considerably compared to earlier periods, although we could not hypothesize when these would occur. The second aim was to examine how popular music lyrics from the United Kingdom changed as function of musicians’ gender over time. Due to the lack of published literature on this topic and the techniques used to analyse the dataset (i.e., classification trees and random forest models), this second analysis was exploratory and, therefore, no specific hypotheses were formulated.
J.2 Methods
The dataset used in the present study is an adapted version of that used by North et al., (2018) and Krause and North (2017).
J.2.1 Data collection
All songs that reached the United Kingdom top 5 weekly sales charts from March 1960 to the end of December 2015 were included in the dataset. Chart information from 1960 to 1995 was obtained from Gambaccini, Rice, and Rice (1996), whereas the information from 1996 to 2015 was obtained from the official charts’ website (www.officialcharts.com). This chart information is the same used by the British Broadcasting Corporation (BBC), representing the most widely recognised chart in the country. This chart information is based on sales of physical music media, and more recently also digital downloads and streaming. Songs were included at the year level: any song that reached a top 5 position in more than one year was included as pertaining to each year. In the present investigation, a total of 81 instrumental songs (did not contain words) and 11 songs that had 15 words were excluded. As a result, the final dataset employed a total of 4,671 observations representing 4,222 unique songs performed by 2,287 artists.
The lyrics were retrieved from several sources and each set was verified against a second source (seeKrause and North, 2017, for a more detailed description of how the lyrics were obtained and processed). Missing lyrics were reintroduced in cases of previously eliminated redundancies or repetitions (e.g., “Chorus x 2” was replaced with two instances of the chorus), ensuring that each text file contained the same lyrics as the recorded version; and word processor operations were used to extend contractions to their full representation (e.g.,

288 J.3 Results
“it’s” was replaced with “it is”) and to correct misspellings (e.g., “wanna” was replaced with “want to”).
J.2.2 Coding
As in Krause & North (2017), DICTION 7.0 software (Hart et al., 2013) was used to conduct a computerised analysis of the lyrical content of the songs. DICTION has a built- in database consisting of 50,000 previously analysed texts. By analysing each given text against the normative database, the software calculates scores for 36 discrete “dictionaries” or lyrical variables. In the present study, we used the raw scores measured by DICTION’s ‘averaged’ option, which calculates one set of scores for the entire text, regardless of length, generating the score for each 500-word unit and then averaging the scores out. This option is specifically designed for processing large number of texts of varying size and allows for a direct comparison between them.
The gender of the musicians was coded as in Krause & North (2017). Coding was based on biographical sources (e.g., music industry web sites and music encyclopaedias) to create two specific variables for each song entry: the proportion of band members who were female (‘band gender’) and the proportion of singers who were female (‘singer gender’) calculated by dividing the total number of female members by the total number of members. Note that only named musicians listed as such during the year the song in question reached a top 5 chart position were included (excluding any recording studio staff, producers or other music industry professionals). For analysis, two datasets were created, in which those cases that had no information regarding the gender of the band or singer were excluded. The total number of observations in the band gender dataset was 4,604 and in the singer gender dataset 4,671.
J.3 Results
A three-step process was used to analyse the data. First, we examined the relationship between the gender of the artists and time (1960-2015), and identified critical inflection points in which the prevalence of female musicians changed significantly. Secondly, we identified the most relevant lyrical variables associated with changes in the distribution of band and singer gender. Finally, we examined whether the lyrical variables identified in the second step varied as a function of time and gender, focusing on those cases where the interaction term was statistically significant. All analyses were performed using both the band gender and singer gender datasets.
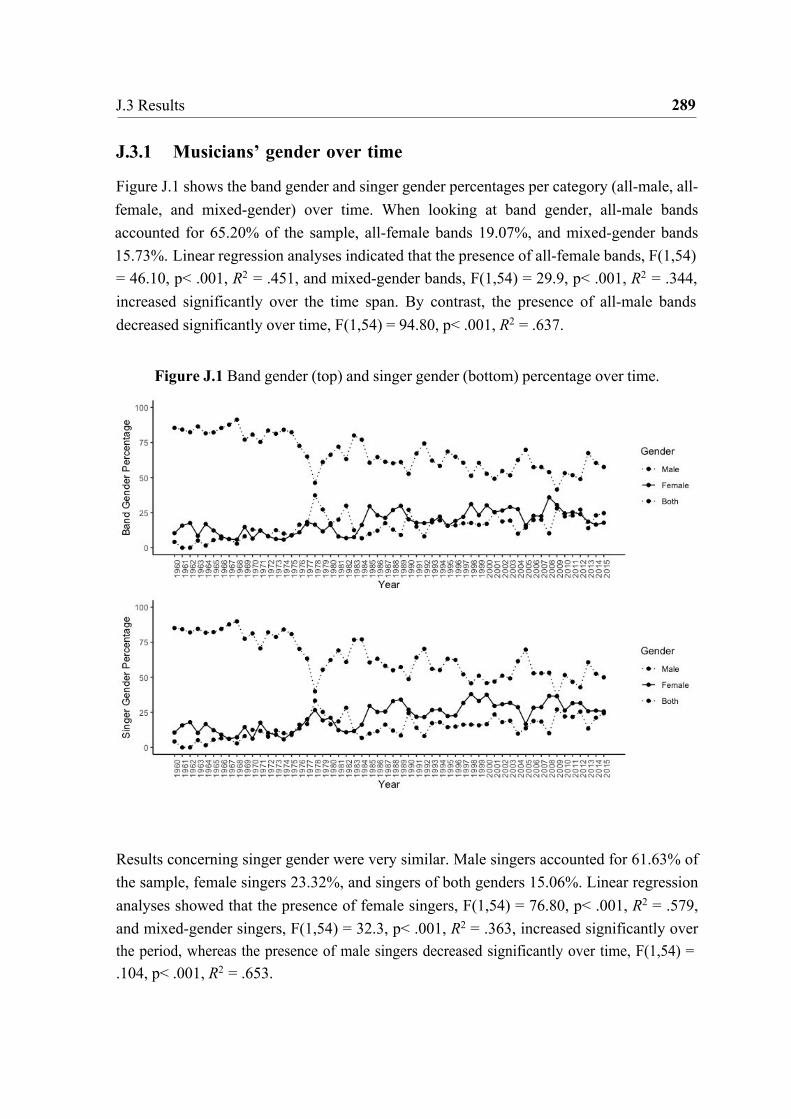
289 J.3 Results
J.3.1 Musicians’ gender over time
Figure J.1 shows the band gender and singer gender percentages per category (all-male, all-female, and mixed-gender) over time. When looking at band gender, all-male bands accounted for 65.20% of the sample, all-female bands 19.07%, and mixed-gender bands 15.73%. Linear regression analyses indicated that the presence of all-female bands, F(1,54) = 46.10, p< .001, R2 = .451, and mixed-gender bands, F(1,54) = 29.9, p< .001, R2 = .344, increased significantly over the time span. By contrast, the presence of all-male bands decreased significantly over time, F(1,54) = 94.80, p< .001, R2 = .637.
Figure J.1 Band gender (top) and singer gender (bottom) percentage over time.
Results concerning singer gender were very similar. Male singers accounted for 61.63% of the sample, female singers 23.32%, and singers of both genders 15.06%. Linear regression analyses showed that the presence of female singers, F(1,54) = 76.80, p< .001, R2 = .579, and mixed-gender singers, F(1,54) = 32.3, p< .001, R2 = .363, increased significantly over the period, whereas the presence of male singers decreased significantly over time, F(1,54) = .104, p< .001, R2 = .653.

290 J.3 Results
These results provide descriptive information about the proportion of male, female, and mixed-gender musicians across the time span. Nevertheless, we were also interested in identifying critical points in time at which the proportion of musicians’ gender changed significantly. Thus, we performed a classification tree model based on permutation tests. The classification tree model was implemented by the R package “party” (Hothorn, Buehlmann, Dudoit, Molinaro, Van der Laan, 2006; Hothorn, Hornik, & Zeileis, 2006; Strobl, Boulesteix, Kneib, Agustin, Zeileis, 2008; Strobl, Malley, & Tutz, 2009). This data mining and machine learning approach allows identification of specific situations in which the distribution of the dependent variable changes significantly, modelling higher-order interaction effects in the predictor variable. Moreover, statistical tree models offer a number of benefits compared to linear regression models in that they can handle large sets of predictor variables and do not assume a linear relationship between predictors and the dependent variable (see Hastie et al., 2009).
We ran separate models with (a) band gender and (b) singer gender as the dependent variables. In the two models, the variable time (at the year level) was the predictor variable (see Figure J.2 and Figure J.3 for the classification tree structure models). Gender was treated as a categorical variable and had three levels: 0% female (cases were the singer or band was exclusively male), mixed-gender (cases where the singers or band included both female and male members), and 100% female (cases where the singer or band was exclusively female). For each node of the tree, the p-values indicate the significance of the split based on the permutation statistics. For each terminal node at the bottom of the graph, bar plots depict the gender distributions of musicians’ gender (1 = all-male, 2 = all-female, and 3 = mixed-gender).
Interpretation of the tree models requires starting at the top and following each branch down, to arrive at a terminal node. To arrive at the subset with the highest proportion of male bands (Figure J.2, node 4), readers should follow the first “year” node down the “< 1976” branch (left-hand side), descend to the second “year” node down the “< 1968” branch, and then descend to the third “year” node down the “< 1965” branch. In contrast, to arrive at the subsets with the highest proportion of all-female bands (nodes 14 and 15), follow the first “year” node down the “> 1976” branch (right-hand side), descend to the second “year” node down the “> 1984” branch, and then descend to the third “year” node down the “> 2008” year branch. Therefore, each node of the tree identifies conditions that lead to particularly low and high combinations of all-male, all-female, and mixed-gender bands, suggesting different meaningful periods in which band gender changed significantly. The same logic applies to the singer gender model (Figure J.3).
291 J.3 Results
Figure J.2 Classification tree model of band gender over time.
1=male, 2=female, 3=mixed-gender.
Figure J.3 Classification tree model of singer gender over time.
1=male, 2=female, 3=mixed-gender.
In the band gender model, the classification tree revealed seven critical time points between 1960-2015: 1965, 1968, 1976, 1982, 1984, 2008, and 2012. The classification tree of the singer gender model also revealed seven critical years: 1968, 1976, 1980, 1982, 1984, 1996, and 2000.
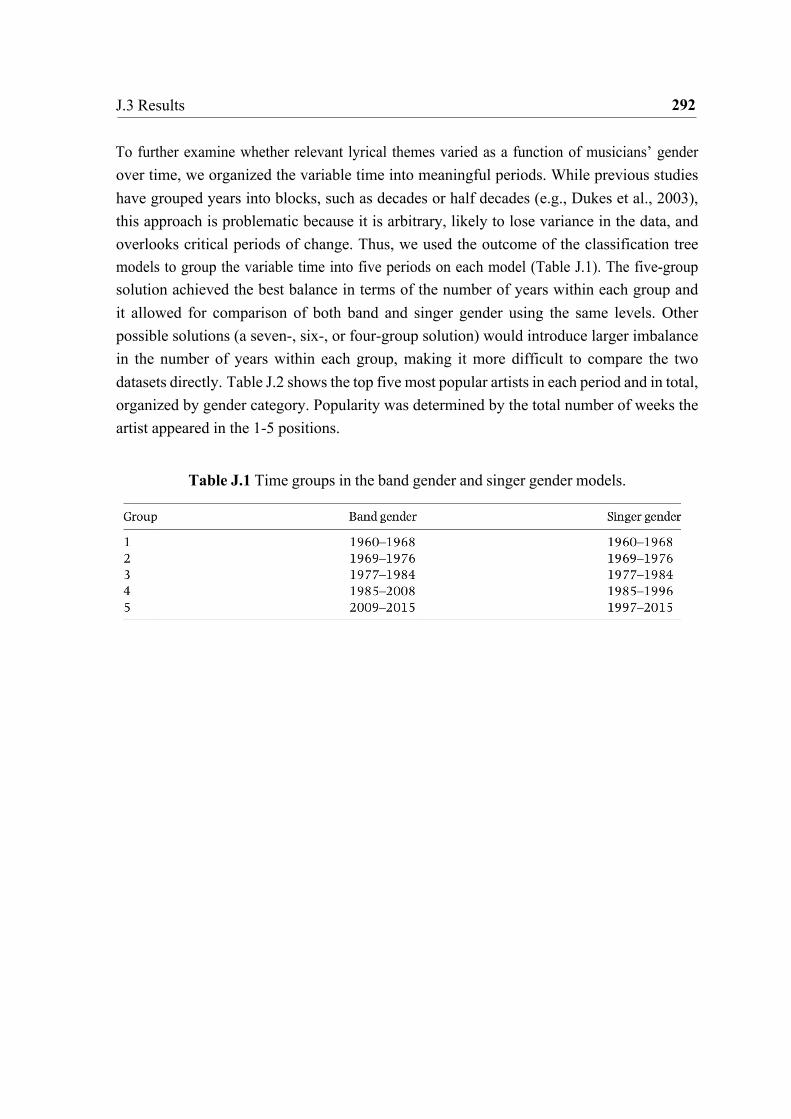
292 J.3 Results
To further examine whether relevant lyrical themes varied as a function of musicians’ gender over time, we organized the variable time into meaningful periods. While previous studies have grouped years into blocks, such as decades or half decades (e.g., Dukes et al., 2003), this approach is problematic because it is arbitrary, likely to lose variance in the data, and overlooks critical periods of change. Thus, we used the outcome of the classification tree models to group the variable time into five periods on each model (Table J.1). The five-group solution achieved the best balance in terms of the number of years within each group and it allowed for comparison of both band and singer gender using the same levels. Other possible solutions (a seven-, six-, or four-group solution) would introduce larger imbalance in the number of years within each group, making it more difficult to compare the two datasets directly. Table J.2 shows the top five most popular artists in each period and in total, organized by gender category. Popularity was determined by the total number of weeks the artist appeared in the 1-5 positions.
Table J.1 Time groups in the band gender and singer gender models.

293 J.3 Results
Table J.2 Top 5 most popular artists in each period and in total (with regard to the band gender model). Total number of weeks appears in brackets.
N: number of artists; M: mean weeks; SD: standard deviation. Popularity was determined by the total number
of weeks the artist appeared in a 1–5 chart position during the period in question. The artist/group was treated
as it appeared on the chart, so that the weekly count does not include additional appearances as a nominated or
featured artist in collaboration with other named musicians.

294 J.3 Results
J.3.2 Lyrics and musicians’ gender: Selecting the most important lyri-
cal themes
To investigate which of the 36 lyrical variables were more strongly associated with musicians’ gender, we ran two separate random forest models with band gender and singer gender as dependent variables (a continuous variable indicating the proportion of members or singers who were female). The 36 individual dictionaries were the predictor variables. The random forest algorithm was implemented in R, using the packages randomForest (Liaw & Wiener, 2002) and caret (Kuhn, 2008), which was also used for tuning of the models and to calculate the R2 using cross-validation. As with statistical tree models, random forest is a machine learning technique (Breiman, 2001) that can handle complex interactions and large sets of predictor variables, even if they are highly correlated (Hastie et al., 2009; for different applications in music psychology research see Anglada-Tort & Müllensiefen, 2017; Jakubowski, Finkel, Stewart, & Müllensiefen, 2016). Moreover, random forest models use an in-built out-of-the-bag cross-validation mechanism that protects against alpha error inflations and overfitting. The random forest models were run with a size of 10,000 trees. The number of randomly preselected predictor variables to be chosen in each split was six, as determined by a grid search using the R package caret (Kuhn, 2008).
To select the best predictive variables associated with changes in musicians’ gender, a measure of variable importance score for each predictor (the 36 lyrical variables) was estimated from the data. The variable importance score described how predictive each of the 36 lyrical variables were in comparison to the predictive ability of the other lyrical variables. Thus, a common procedure of feature selection is to rank predictor variables by importance score and select the top performing variables (Breiman, 2001; Kuhn, 2008).
Figure J.4 displays the importance scores for each lyrical variable in the band gender (left) and singer gender (right) models. Note that the absolute values of the variable importance scores have no ‘real world’ meaning: only the difference between variable importance scores should be used for meaningful comparison. For the subsequent analysis, we selected the five best performing variables in the two models, each of which had variable importance scores above 50. Note, however, that one could select further variables, although the strength of their association with the dependent variable would be weaker. Accordingly, total number of words, concreteness, self-reference, complexity, and variety were selected in the band gender model (R2 = .125); and total number of words, concreteness, complexity, self-reference, and denial were selected in the singer gender model (R2 =.121).

295 J.3 Results
Figure J.4 Variable importance scores for the 36 predictor variables in the random forest model with band gender (left) and singer gender (right).
totwd: total number of words; concrete: concreteness; self: self-reference; complex: complexity. The
difference between variable importance scores provides a meaningful comparison; however, the absolute values of the variable importance scores should not be interpreted because they are arbitrary.
J.3.3 Lyrics and band gender over time
A series of linear mixed effect analyses, using the R packages “lme4” (Bates, Mächler, Bolker, & Walker, 2015) and “lmerTest” (Kuznetsova, Brockhoff, & Christensen, 2016) investigated the relationship between lyrics and band gender over time. Linear mixed-effects models have several advantages compared to ordinary regression models, as they can handle missing values and non-normal distributions, do not assume independence among observations, and can work with correlated observations. Linear mixed-effects can also model random variability by assuming random intercepts for different relevant factors, such as artist and song titles, providing unbiased estimates of the coefficients of the predictor variables (Baayen, Davidson, & Bates, 2008; Pinheiro & Bates, 2000). Effect sizes were calculated using the R package MuMIn (Barton, 2009), which calculates the marginal and conditional coefficient of determination for generalized mixed-effect models. The marginal R2 of the model (Rm2) calculates the variance explained by the fixed factors, whereas the conditional R2 of the model (Rc2) calculates the variance explained by both fixed and random factors.

296 J.3 Results
Using the band gender dataset, separate analyses were performed for each of the five lyrical variables identified in the random forest procedure as dependent variables: total number of words, concreteness, self-reference, complexity, and variety. See Table J.3 for a summary of the five models concerning band gender. In all analyses, the fixed factors were band gender (categorical: all-male, all-female, and mixed-gender), time-group (categorical: 1960- 1968, 1969-1976, 1977-1984, 1985-2008, and 2009-2015), and the gender-time interaction, whereas artists and song title were the random effect factors. Here, we report in detail the total number of words and self-reference models for which the interaction term was significant. See Appendix A (in the paper published online) for the top five artists by gender in each period and in total concerning the number of total words per song and use of self-reference; and Appendix B for graphical figures with the models in which the interaction term was nonsignificant.
Table J.3 Summary table of the linear mixed-effects models with band gender.
aIndicates the models in which the interaction term is significant and, therefore, reported in detail in text.
The linear mixed effect model concerning total number of words as dependent variable (Figure J.5) revealed a significant main effect of time (p < .001), nonsignificant main effect of gender (p = .39), and a significant gender-time interaction (p < .001). The Rm2 (variance explained by the fixed factors alone) was .081 and the Rc2 (variance explained by both fixed
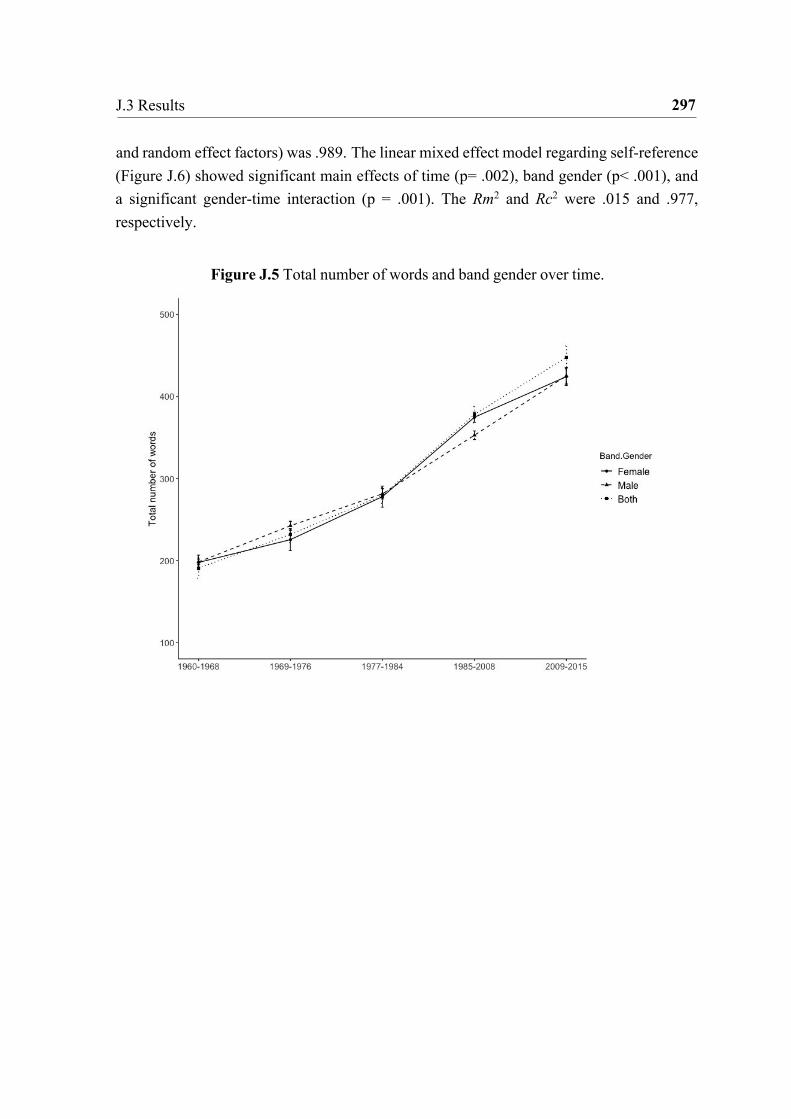
297 J.3 Results
and random effect factors) was .989. The linear mixed effect model regarding self-reference (Figure J.6) showed significant main effects of time (p= .002), band gender (p< .001), and a significant gender-time interaction (p = .001). The Rm2 and Rc2 were .015 and .977, respectively.
Figure J.5 Total number of words and band gender over time.

298 J.3 Results
Figure J.6 Self-reference (i.e., all first-person references) and band gender over time.
J.3.4 Lyrics and singer gender over time
Using the same analysis protocol, analyses were performed concerning singer gender em- ploying the total number of words, concreteness, complexity, self-reference, and denial as dependent variables. See Table J.4 for a summary of the five models concerning singer gender. The fixed factors were singer gender (categorical: male, female, and mixed-gender), time-group (categorical: 1960-1968, 1969-1976, 1977-1984, 1985-1996, and 1997-2015), and the gender-time interaction, whereas artists and song title were the random effect factors. The reported findings below concern the total number of words model in which the interaction term was significant. See Appendix C (in the paper published online) for graphical figures with the models in which the interaction term was nonsignificant.

299 J.3 Results
Table J.4 Summary table of the linear mixed-effects models with singer gender.
aIndicates the models in which the interaction term is significant and, therefore, reported in detail in text.
The linear mixed effect model with total number of words as dependent variable (Figure 7) revealed significant main effects of time (p< .001), singer gender (p< .001), and the gender-time interaction (p= .03). The Rm2 and Rc2 were .099 and .977, respectively.

300 J.4 Discussion
Figure J.7 Total number of words and singer gender over time.
J.4 Discussion
The present study investigated how the gender representation of the UK’s most popular musicians has changed over time and the extent to which these changes might relate to popular song lyrics. As predicted, there was a significant inequality in gender representation. Overall, all-male bands and singers accounted for more than 60% of the data. The gender gap also becomes apparent when looking at the top 10 most popular artists in our dataset (determined by the total number of weeks the artist charted in the 1-5 top positions): eight of the ten artists were male, with the Beatles ranking highest (with 142 weeks), followed by Elvis Presley (138 weeks), and Cliff Richard (137 weeks). Madonna, in the fourth position (126 weeks), was the only female artist in the top 10 and Abba, in the fifth position (87 weeks), the only mixed-gender artist.
We also found evidence supporting the hypothesis that the prevalence of female musicians in the single sales charts has increased significantly over time. This was true for both all-female bands and singers (Figure J.1), who went from a prevalence of 11.64% (all-female bands) and 12.08% (female singers) in the 1960s to a prevalence of 23.82% and 29.75% between 2006-

301 J.4 Discussion
2015, respectively. By contrast, the presence of all-male bands and male singers decreased significantly: from an initial prevalence of 84.35% (male bands) and 83.92% (male singers) to 54.95% and 49.97% in 2006-2015, respectively. These findings concerning the UK’s singles sales charts are consistent with previous American research on the role of female artists in popular music (Dukes et al., 2003; Hesbacher et al., 1977; Lafrance, et al., 2011; Wells, 1986, 1991, 2001).
Seven critical inflection points were identified at which the prevalence of all-female bands and singers changed considerably (Figure J.2 and J.3). In both band and singer gender models, the most relevant points of change were in the years 1968, 1976, and 1984. For instance, in 1977, all-male bands decreased from 75% (in 1976) to 65% (in 1977), but all-female bands increased from 11% (in 1976) to 18% (in 1977). Similarly, in 1985, all-female bands increased from 16% (in 1984) to 30% (in 1985) and all-male bands decreased from 77% (in 1984) to 61% (in 1985). Thus, the classification tree model indicated 1977 and 1984 as critical years of change. Note that the increase in the prevalence of female artists was highest in the 1985-2008 period. For example, the top 5 most popular female artists during 1985- 2008 were Madonna (122 weeks), Kylie Minogue (59 weeks), Whitney Houston (42 weeks), the Spice Girls (38 weeks), and Britney Spears (34 weeks; see Table J.2). Interestingly, Wells (1991) also identified a peak year for female artists in the UK in 1985 and found that the prominence of female artists in the US increased notably around 1985, 1996, and 1999 (Wells, 1991, 2001).
It is of course tempting to note that the inflection points highlighted coincide with some significant moments in UK culture. These include the surge in popularity of the women’s rights movements (1968), the rise of punk (1976), the peak in popularity of Margaret Thatcher’s prime ministership (1984), and, more generally, third wave feminism (1990-2012). Thus, these findings open up intriguing questions, namely, what particular factors contributed to the observed increase in female and mixed-gender artist in the UK and the global music market; and why did the critical years identified in this study lead to drastic changes on the prevalence of female and male artists in the singles sales charts? Future work may wish to address these questions, considering the extent to which this can be attributed to the quality of the music, societal factors, and music industry marketing.
The second research aim was to explore whether (and how) UK popular music lyrics might have changed over time as a function of musician gender. Random forest analyses allowed us to select the most important lyrical themes associated with the proportion of musicians’ gender. The results were very similar in both the band and singer gender models, identifying the total number of words, concreteness, self-reference, and complexity as the most important.

302 J.4 Discussion
Indeed, the total number of words was almost twice as important as the next-ranked variable (i.e., concreteness) in predicting musicians’ gender in the two models. Nevertheless, it is worth noting that the 36 lyrical variables explained only 10% of the variance in the outcome variable (i.e., the prevalence of band or singer members who were female). This suggests that the associations between the lyrical content of popular music and the artists’ gender, although existent, are rather small in size.
In the band gender analyses, two models resulted in significant gender-time interactions (i.e., total number of words and self-reference), whereas in the singer gender analyses, only one model gave rise to a significant interaction term (i.e., total number of words). When looking at the gender of the band, the analysis considering the total number of words showed that from 1960 to 2015, there was a significant increase in the total number of words used by musicians (Figure J.5). This increase was large in size, with an average of fewer than 200 words per song in the 1960s to an average of more than 400 words per song from 2006-2015. Overall, all-male bands, all-female bands, and mixed-gender bands did not differ significantly in the total number of words they used. However, the interaction between time and gender indicated that the total number of words used in songs by the three band gender categories differed significantly depending on the period. In 1969-1976, all-male bands used more words in their songs (average of 242.40 words per song) than did all-female (average of 225.46 words per song) and mixed-gender bands (average of 231.83 words per song). But in 1985-2008 all-female (average of 274.70 words per song) and mixed-gender bands (average of 379.02 words per song) used more words in their lyrics than all-male bands (average of 352.76 words per song). The model concerning singer gender led to similar results, but there were some notable differences (Figure J.6). For example, from 1960-1968 female and male singers used approximately the same number of words in their lyrics, but in the following four periods (spanning 1969 to 2015) male and mixed-gender singers used more words in their lyrics than did female singers. In addition, the total number of words used in songs by mixed-gender singers increased drastically in the last period (1997-2015) compared to the other two gender groups.
It is plausible that one of the most relevant factors contributing to the increase in the use of words per song over time is the rise of rap music in UK and US (see Dukes et al., 2013; and Smith, 2014). In fact, those bands and singers that use the highest number of words per song are predominantly hip hop and rap artists (see Appendix A in the paper published online; for example, it shows that the So Solid Crew had the greatest number of words, averaging 1112.5 words per song, followed by Nelly, with an average of 1095 words). The interaction between gender and time is, however, more difficult to interpret. One possibility is that this
303 J.4 Discussion
could be, at least partly, due to three different phases in the rise of rap and hip hop involving a first phase of predominantly male rappers, followed by an increase of female rappers, and, finally, a rise of collaborative rap performances leading to an increase of mixed-gender bands and singers (The Economist, 2018).
Regardless of gender, it is interesting to note that this general increase in the total number of words over time contrasts with the significant decrease observed in variety (i.e., the number of different words divided by the total words) and complexity (i.e., mean number of characters per word) (see Table J.4 and appendix B in the paper published online). Note that these two lyrical variables measure diversity of vocabulary. Thus, UK popular music lyrics have become longer, but simpler and more repetitive over time. This finding mirrors Morris’ study (2017; https://pudding.cool/2017/05/song-repetition/), which analysed the repetitiveness of a dataset of 15,000 songs that charted on the Billboard Hot 100 between 1958 and 2017.
The other significant time-gender interaction in the band gender model concerned self- reference. Overall, all-female bands used significantly more self-reference in their lyrics (M =45.47) than all-male bands (M = 40.37) and mixed-gender bands (M =38.97). However, the significant time-gender interaction revealed that this difference was particularly large in the periods 1960-1968 and 1977-1984 (Figure J.6). For example, in 1960-1968, all-female bands had a mean self-reference score of 51.71, whereas all-male and mixed-gender bands averaged 41.58 and 40.29, respectively. In this period, the female artists with highest use of self-reference were Millie Small (with the song “My Boy Lollipop”) and Nina Simone (with the song “Ain’t got no/ I got life)”. Nevertheless, in the 1969-1976 period, the use of self-reference in songs by all-female bands (M = 39.38) decreased almost to the levels of all-male bands (M = 38.77); and in the latest period studied (2009-2015), self-reference decreased (M = 44.60) again almost to the levels of all-male bands (M = 43.13) and below the levels of mixed-gender bands (M = 46.37). The decrease in the use of self-reference by female artists starting in 1968 and 2008 relate to two critical points in the history of feminism, namely, the surge in popularity of the women’s right movement in 1968 and third wave feminism from 1990 to 2012. Arguably, the increasing awareness of this collective movement in 1968 and the 1990s could explain female artists’ decreasing use of first-person references. Future research could explore this further by looking at the prevalence of the gender of composers, songwriters, and producers of popular music over time.
The research presented here has several limitations. First, by analysing the lyrics of those songs that reached the top 5 in the UK single sales charts, our results cannot be generalised to music charting in other positions or in other countries. Second, the classification of musicians’ gender was based on biographical sources (e.g., music industry web sites and

304 J.4 Discussion
music encyclopaedias). We had no data on the actual gender with which the artists identified themselves (nor the extent to which they identified with a particular gender). Third, we were not able to identify the specific contribution of each individual musician to the final composition (including the production of the lyrics) and recording. Further, we were unable to consider the role of other parties in this process, such as songwriters, managers, producers, and other music industry professionals. In this context, it is notable that female songwriters and producers are also underrepresented in the music industry, representing only 12% of songwriters and 2% of producers (Smith, Choueiti, & Pieper, 2018).
In summary, the present results show that the UK’s most popular music from 1960 to 2015 is characterized by a large gender inequality. This finding is similar to that found previously in the US music market, which is particularly regrettable since the US and UK represent two of the most powerful music industries in the world. The fact that female artists are still unrepresented in the single sales charts in the 2010s is concerning, and merits further investigation. However, we found that the presence of female and mixed-gender artists increased significantly over the time span considered. We were also able to identify the most important years leading to significant increases in the prevalence of female and mixed-gender artists, namely, 1968, 1976, and 1984. Additionally, our results indicated that the total number of words per song was the most important lyrical variable associated with changes in musicians’ gender. Nevertheless, the 36 lyrical themes examined only explained 10% of the variance in the proportion of musicians who were female, suggesting only a weak association between lyrical content and musicians’ gender. Despite this, we found interesting patterns of change over time in the use of specific lyrical variables (i.e., total number of words and self-reference) between male, female, and mixed-gender bands and artists. Moreover, our findings suggest that UK’s popular music lyrics became more repetitive over time: while the total number of words increased significantly over time, the diversity of vocabulary employed decreased.
Finally, the computational approach used in the current study presents important method- ological improvements over previous research. The majority of previous studies employed small datasets, a limited range of lyrical variables, and human coders to analyse the lyrical content of the songs. By contrast, the approach used in this study allowed for a computerised analysis of 36 discrete lyrical themes on a total of 4,222 songs performed by 2,287 artists, covering 55 years (1960-2015). The use of data mining and machine learning techniques (e.g., classification tree models and random forest) offered several advantages in comparison to the statistical tools (e.g., chi-squared tests, ANOVAs, and linear regression models) used in earlier studies. The potential applications of machine learning and data mining techniques are

305 J.5 References
particularly useful when working with large datasets with many variables, even when there are non-linear and complex relationships between dependent and predictor variables, and the predictor variables are highly correlated (Hastie et al., 2009). Note that these characteristics may well be common when considering data derived from the music industry, including naturalistic singles sales charts data. Thus, these techniques will be valuable for future music psychology research.
J.5 References Alvarez, S. E. (1990). Engendering democracy in Brazil: Women’s movements in transition
politics. Princeton University Press. Anglada-Tort, M., & Müllensiefen, D. (2017). The repeated recording illusion: The effects
of extrinsic and individual difference factors on musical judgements. Music Perception, 35(1), 92-115.
Baayen, R. H., Davidson, D. J., & Bates, D. M. (2008). Mixed-effects modeling with crossed random effects for subjects and items. Journal of memory and language, 59(4), 390-412.
Bates, D., Mächler, M., Bolker, B., & Walker, S. (2015). Fitting linear mixed-effects models using lme4. Journal of Statistical Software, 67(1), 1-48.
Chant, S. H. (Ed.). (2011). The international handbook of gender and poverty: Concepts, research, policy. Edward Elgar Publishing.
Breiman, L. (2001). Random forests. Machine Learning, 45, 5–32. DeWall, C. N., Pond, R. S., Campbell, W. K., & Twenge, J. M. (2011). Tuning in to
psychological change: Linguistic markers of psychological traits and emotions over time in popular U.S. song lyrics. Psychology of Aesthetics, Creativity, and the Arts, 5(3), 200–207.
Dollar, D., & Gatti, R. (1999). Gender inequality, income, and growth: are good times good for women? (Vol. 1). Washington, DC: Development Research Group, The World Bank.
Dukes, R. L., Bisel, T. M., Borega, K. N., Lobato, E. A., & Owens, M. D. (2003). Expression of love, sex, and hurt in popular songs: A content analysis of all-time greatest hits. Social Science Journal, 40(4), 643–650.
Gambaccini, P., Rice, T., Rice, J., & Rice, J. (1996). The Guinness book of British hit singles (9th ed.). Enfield, UK: Guinness Publishing.
306 J.5 References
Greasley, A., & Lamont, A. (2016). Musical Preferences. In S. Hallam, I. Cross, & M. Thaut
(Eds.), Oxford handbook of music psychology (second edition) (pp. 263-281). Oxford, UK: Oxford University Press.
Gundersen, D. E. (2011). American women and the gender pay gap: A changing demographic or the same old song. Advancing Women in Leadership, 31, 153-159.
Hart, R. P. (1997). Diction 4.0: The Text-analysis Program: User’s Manual. Scolari. Hart, R. P., Carroll, C. E., & Spiars, S. (2013). Diction 7.0: the text analysis program. Austin:
Digitext. Hart, R. P. (2001). Redeveloping DICTION: Theoretical considerations. In M. D. West (Ed.),
Theory, method, and practice in computer content analysis (pp. 43-60). New York: Springer.
Hastie, T., Tibshirani, R., & Friedman, J. (2009). Hierarchical Clustering. In T. Hastie, E. Tibshiran, & J. Friedman (Eds.), The elements of statistical learning: Data Mining, inference and prediction (2nd ed.) (pp. 520-528). New York, NY: Springer.
Hesbacher, P., Clasby, N., Clasby, H. G., & Berger, D. G. (1977). Solo female vocalists: Some shifts in stature and alterations in song. Popular Music and Society, 5(5), 1-16.
Hothorn, T., Buehlmann, P., Dudoit, S., Molinaro, A, & Van Der Laan, M. (2006). Survival ensembles. Biostatistics, 7(3), 355-373.
Hothorn, T., Hornik, K., & Zeileis, A. (2006). Unbiased recursive partitioning: A conditional inference framework. Journal of Computational and Graphical statistics, 15(3), 651- 674.
Jakubowski, K., Finkel, S., Stewart, L., & Mülllensiefen, D. (2016). Dissecting an earworm: Melodic features and song popularity predict involuntary musical imagery. Psychology of Aesthetics, Creativity, and the Arts, 11(2), 122–135.
Jeffreys, S. (2013). Man’s Dominion: The Rise of Religion and the Eclipse of Women’s Rights. Routledge.
Kuhn, M. (2008). Caret package. Journal of statistical software, 28(5), 1-26. Retrieved from http://www.download.nextag.com/cran/web/packages/caret/caret.pdf
Lafrance, M., Worcester, L., & Burns, L. (2011). Gender and the Billboard top 40 charts between 1997 and 2007. Popular Music and Society, 34(5), 557–570.
Liaw, A., & Wiener, M. (2002). Classification and regression by randomForest. R news, 2(3), 18-22.
Lorber, J. (2001). Gender inequality: Feminist theories and politics. Oxford University Press.
Morris, C. (2017, May 12). Are pop lyrics getting more repetitive? The Pudding. Retrieved from https://pudding.cool/2017/05/song-repetition/

307 J.5 References
Nunes, J. C., Ordanini, A., & Valsesia, F. (2015). The power of repetition: repetitive lyrics
in a song increase processing fluency and drive market success. Journal of Consumer Psychology, 25(2), 187-199.
Ogden, C. K. (1960). Basic English Dictionary. London, England: Evan Brothers. Pettijohn, T. F., & Sacco, D. F. (2009a). Tough times, meaningful music, mature perform-
ers: popular Billboard songs and performer preferences across social and economic conditions in the USA. Psychology of Music, 37(2), 155–179.
Pettijohn, T. F., & Sacco, D. F. (2009b). The language of lyrics: An analysis of popular Billboard songs across conditions of social and economic threat. Journal of Language and Social Psychology, 28, 297–311.
Ridgeway, C. L. (2011). Framed by gender: How gender inequality persists in the modern world. Oxford University Press.
Ruth, N. (2018). “Where is the love?” Topics and prosocial behavior in German popular music lyrics from 1954 to 2014. Musicae Scientiae, 1029864918763480.
Strobl, C., Boulesteix, A. -L., Kneib, T., Augustin, T. & Zeileis, A. (2008). Conditional variable importance for random forests. BMC Bioinformatics, 9(23), 307.
Smith, D. (2015, November 12). Is it still Hip-Hop? How Hip-Hop went from the music of the Bronx to a globally exploited commercialized genre. Retrieved from https://medium.com/@DylanSmith96/hip-hops-new-frontier-6bf5ea326f5d
Smith, S. L., Choueiti, M., & Pieper, K. (2018, January 25). Inclusion in the Recording Stu- dio? Gender and race/ ethnicity of artists, songwriters, and producers across 600 popular songs from 2012-2017. Retrieved from http://assets.uscannenberg.org/docs/inclusion- in-the-recording-studio.pdf
Strobl, C., Malley, J., & Tutz, G. (2009). An introduction to recursive partitioning: Rationale, application, and characteristics of classification and regression trees, bagging, and random forests. Psychological Methods, 14(4), 323–348.
The Economist (2018, February 02). Popular music is more collaborative than ever. Retrieved from https://www.economist.com/graphic-detail/2018/02/02/popular-music-is-more- collaborative-than-ever
Wells, A. (1986). Women in popular music changing fortunes from 1955 to 1984. Popular Music & Society, 10(4), 73-85.
Wells, A. (2001). Nationality, Race, and gender on the American pop charts: What happened in the ‘90s?. Popular Music & Society, 25(1-2), 221-231.
Zullow, H. M. (1991). Pessimistic rumination in popular songs and newsmagazines pre- dict economic recession via decreased consumer optimism and spending. Journal of Economic Psychology, 12(3), 501–526.