Generation Y students' attitudes and behavioural responses ...
222
Generation Y students’ attitudes and behavioural responses towards product placement T.T. Mareka orcid.org/0000-0001-8844-7904 Thesis submitted for the degree Doctor of Philosophy in Business Management at the North-West University Promoter: Prof A.L. Bevan-Dye Graduation: April 2019 Student number: 25741918
-
Upload
khangminh22 -
Category
Documents
-
view
1 -
download
0
Transcript of Generation Y students' attitudes and behavioural responses ...

Generation Y students’ attitudes and behavioural responses towards product
placement
T.T. Mareka
orcid.org/0000-0001-8844-7904
Thesis submitted for the degree Doctor of Philosophy in
Business Management at the North-West University
Promoter: Prof A.L. Bevan-Dye
Graduation: April 2019
Student number: 25741918

i
DECLARATION
I, TT Mareka, declare that GENERATION Y STUDENTS’ ATTITUDES AND
BEHAVIOURAL RESPONSES TOWARDS PRODUCT PLACEMENT is my own work
and that all the sources I have used or quoted have been indicated and acknowledged
by means of complete references and that this thesis has not previously been submitted
for a degree at any other university.
Signature:
Date:

ii
LETTER FROM THE LANGUAGE EDITOR

iii
PREFACE
A special word of thanks to the following persons who have assisted me in completing
this study:
To God who kept me alive despite my life’s adversities
To my mother, Julia Mareka, for her on-going love, support and motivation
To my brothers and sister, Richard, Neo, Karabo and Karabelo, for the interest
shown in my studies and continued motivation
To my sons, Mamello and Theophillus-Jnr. (T-J), for the constant motivation to never
give up on this endeavour, despite numerous temptations
To my promoter, Prof Ayesha Bevan-Dye, for her kind words, constant motivation,
guidance and expertise in assisting me to complete the study.
To Aldine Oosthuyzen of the North-West University (Vaal Triangle Campus) in
assisting me with expert advice and guidance for the formatting of the manuscript.
To Linda Scott for her professionalism in the language editing of this study
To the undergraduate students who participated in the main survey questionnaire
of the final study
To the rest of my family, friends and colleagues who gave additional support and
advice in assisting me to complete this study
To the ProGenY research entity at North-West University (Vaal Triangle Campus)
for their support and on-going commitment to profiling the consumer behaviour of
the Generation Y cohort.

iv
ABSTRACT
Keywords: product placement attitudes, purchase intentions, Generation Y students,
South Africa
Over recent years the traditional advertising industry has suffered some setbacks due to
media clutter, mass audience fragmentation, a growth in negative consumer attitudes
toward traditional advertising as well as their defence against television (TV) advertising
by zipping and zapping through the use of digital recording systems. The progressive loss
of a passive audience, therefore, has unequivocally challenged advertising professionals
to seek more innovative and effective solutions to brand communication strategies and
product placement has presented itself as such. Product placement involves brands
being placed in various media content such as movies, TV shows, songs, videogames,
websites, magazines and/or novels in an effort to create brand awareness, brand
association and, ultimately, brand loyalty.
This study endeavoured to explore the use of product placement as an alternative
advertising and brand communication tool that has the potential of breaking through the
inadequacies of traditional advertising and succeed in the battle to capture an audience’s
attention and influence their consumption-related behaviour. Various studies have
suggested that there are differences in the way in which consumers react to product
placement based on various demographic factors, including geographic, cultural and
even generational differences. With this in mind, the primary objective of this study was
to propose and empirically test a model of the relationships between Generation Y
students’ attitudes and behavioural responses towards product placement in movies and
TV shows and the factors of perceived ethics, entertainment, realism, character-product
associations and materialism of product placements, as well as attitude towards TV
advertising in the South African context. Globally, there are indications that this
generation has significant current and future purchasing power and that they exert an
influence on the purchasing behaviour of not only their peers but also members of other
generations. The focus on university students as a market segment was based on the
assumption that a graduate qualification typically correlates to a higher future earning

v
potential and, consequently, higher future disposable income, rendering them a
significantly lucrative target segment.
The sampling frame for the study comprised the 26 public registered higher education
institutions (HEIs) situated in South Africa. From this initial list of 26 registered institutions,
a judgement sample of three campuses from three HEIs in the Gauteng province was
chosen. These included a campus from a traditional university, one from a university of
technology and one from a comprehensive university. A convenience sample of 450
students across these three campuses was taken in 2018. Of the questionnaires
completed, 397 were usable.
The statistical analysis of the collected data included principle component analysis,
descriptive statistical analysis, correlation analysis, canonical correlation analysis and an
independent samples t-test. Findings of this study suggest character-product association,
perceived entertainment, perceived realism, perceived materialism and, to a much lesser
extent, attitude towards TV advertising have a direct positive relationship with dependent
variate and perceived ethicality a direct negative relationship and, as such, are predictors
of South African Generation Y students’ attitudes and purchase intentions toward product
placement in movies and TV shows. Furthermore, male and female participants did not
differ significantly on any of these dimensions.
The findings of this study contribute to the limited literature available concerning product
placement effectiveness in the South African market, with specific reference to the factors
that contribute to Generation Y students’ positive attitudes and purchase intentions
towards product placement. The model developed in the study represents an important
tool for predicting Generation Y’s attitudes and behavioural responses towards the
placements of brands across a range of entertainment content, including but not limited
to movies and TV shows in the South African context. The model may also have value in
shedding some light for policy makers with regards to the ethical concern and regulatory
frameworks around the placement of brands in non-commercial content. Moreover, an
understanding in this regard will enable marketers to realise the opportunities presented
by product placement techniques in developing markets such as South Africa and thus
tailor their brand communication strategies to maximise effectiveness. The study also
seeks to shed some light to policy makers with regards to the perceptions of consumers

vi
to the regulation of product placement, thereby making legislative contributions in this
regard.

vii
TABLE OF CONTENTS
DECLARATION .............................................................................................................. I
LETTER FROM THE LANGUAGE EDITOR .................................................................. II
PREFACE ..................................................................................................................... III
ABSTRACT ................................................................................................................... IV
TABLE OF CONTENTS ............................................................................................... VII
LIST OF TABLES ...................................................................................................... XIV
LIST OF FIGURES ...................................................................................................... XV
CHAPTER 1 INTRODUCTION AND PROBLEM STATEMENT .................................... 1
1.1 INTRODUCTION AND BACKGROUND TO THE STUDY ........................ 1
1.2 PROBLEM STATEMENT .......................................................................... 6
1.3 OBJECTIVES OF THE STUDY ................................................................. 8
1.3.1 Primary objective ....................................................................................... 8
1.3.2 Theoretical objectives ................................................................................ 8
1.3.3 Empirical objectives ................................................................................... 9
1.4 HYPOTHESES ........................................................................................ 10
1.5 RESEARCH DESIGN AND METHODOLOGY ....................................... 11
1.5.1 Literature review ...................................................................................... 11
1.5.2 Empirical study ........................................................................................ 11
1.5.2.1 Target population ..................................................................................... 11
1.5.2.2 Sampling frame ....................................................................................... 12
1.5.2.3 Sample method ....................................................................................... 12
1.5.2.4 Sample size ............................................................................................. 12
1.5.2.5 Measuring instrument and data collection method .................................. 13
viii
1.5.2.6 Statistical analysis ................................................................................... 14
1.6 ETHICAL CONSIDERATIONS ............................................................... 14
1.7 DEMARCATION OF THE STUDY .......................................................... 15
1.8 CLARIFICATION OF THE TERMINOLOGY ........................................... 15
1.9 CHAPTER CLASSIFICATION ................................................................ 15
1.10 GENERAL ............................................................................................... 17
1.11 CONCLUSION ........................................................................................ 17
CHAPTER 2 CONSUMER ATTITUDES TOWARD ADVERTISING ............................ 19
2.1 INTRODUCTION ..................................................................................... 19
2.2 DEFINITION AND CONCEPTUALISATION OF ADVERTISING ............ 21
2.3 OVERVIEW OF THE ADVERTISING MARKET ..................................... 23
2.4 DEFINITION AND CONCEPTUALISATION OF ATTITUDES ................ 26
2.5 STRUCTURE OF CONSUMER ATTITUDES ......................................... 28
2.6 THEORIES OF ATTITUDE FORMATION AND CHANGE ...................... 30
2.6.1 The theory of reasoned action and the theory of planned behaviour ....... 32
2.6.2 Elaboration Likelihood Model of persuasion (ELM) ................................. 37
2.7 STRUCTURE OF ATTITUDE TOWARDS ADVERTISING (AG) ............ 40
2.8 STRUCTURE OF ATTITUDES TOWARD THE AD MODEL (Aad) ........ 46
2.9 CONCLUSION ........................................................................................ 50
CHAPTER 3 PRODUCT PLACEMENT AND GENERATION Y .................................. 52
3.1 INTRODUCTION ..................................................................................... 52
3.2 PROFILING GENERATION Y COHORT ................................................ 53
3.3 PRODUCT PLACEMENT CONCEPTUALISATION ............................... 58
3.4 PRODUCT PLACEMENT INDUSTRY .................................................... 60
3.5 PURPOSE OF PRODUCT PLACEMENT ............................................... 60

ix
3.5.1 Achieve prominent target audience exposure, visibility, attention and
interest ..................................................................................................... 61
3.5.2 Increase brand awareness ...................................................................... 62
3.5.3 Increase brand recognition and recall ...................................................... 63
3.5.4 Bring about desired changes in consumers' brand attitudes .................... 64
3.5.5 Bring about a change in the audiences' purchase behaviours and
intent ........................................................................................................ 65
3.5.6 Create favourable practitioners' views on brand placement ..................... 66
3.6 PRODUCT PLACEMENT STRATEGIES ................................................ 67
3.6.1 Modality ................................................................................................... 68
3.6.2 Prominence ............................................................................................. 68
3.6.3 Plot connection ........................................................................................ 69
3.7 ANTECEDENTS OF PRODUCT PLACEMENT ATTITUDES ................. 70
3.7.1 Perceived realism .................................................................................... 71
3.7.2 Perceived entertainment .......................................................................... 72
3.7.3 Attitudes toward advertising on television ................................................ 74
3.7.4 Ethical concerns ...................................................................................... 75
3.7.5 Character-product association ................................................................. 79
3.7.6 Materialism .............................................................................................. 80
3.7.7 Purchase intentions ................................................................................. 82
3.8 GENDER DIFFERENCES IN PRODUCT PLACEMENT ATTITUDES ... 83
3.9 PROPOSED MODEL .............................................................................. 84
3.10 CONCLUSION ........................................................................................ 85
CHAPTER 4 RESEARCH DESIGN AND METHODOLOGY ....................................... 87
4.1 INTRODUCTION ..................................................................................... 87
4.2 MARKETING RESEARCH PROCESS ................................................... 88

x
4.3 RESEARCH DESIGN .............................................................................. 89
4.4 SAMPLING DESIGN PROCEDURE ....................................................... 91
4.4.1 Target population ..................................................................................... 91
4.4.2 Sampling frame ....................................................................................... 91
4.4.3 Sampling method ..................................................................................... 92
4.4.4 Sample size ............................................................................................. 92
4.5 DATA COLLECTION METHOD .............................................................. 93
4.6 MEASURING INSTRUMENT .................................................................. 93
4.6.1 Questionnaire structure and content........................................................ 94
4.6.2 Pre-testing of questionnaire ..................................................................... 95
4.6.3 Pilot testing .............................................................................................. 96
4.7 DATA PREPARATION ........................................................................... 96
4.7.1 Data editing ............................................................................................. 96
4.7.2 Data coding ............................................................................................. 97
4.7.3 Frequency tabulation ............................................................................... 98
4.8 STATISTICAL ANALYSIS ...................................................................... 99
4.8.1 Principle component analysis .................................................................. 99
4.8.2 Reliability ............................................................................................... 100
4.8.2.1 Test-retest reliability .............................................................................. 101
4.8.2.2 Alternative-forms reliability .................................................................... 101
4.8.2.3 Internal-consistency reliability ................................................................ 101
4.8.3 Validity ................................................................................................... 102
4.8.3.1 Face/content validity .............................................................................. 102
4.8.3.2 Criterion validity ..................................................................................... 102
4.8.3.3 Construct validity ................................................................................... 102

xi
4.8.4 Descriptive statistics .............................................................................. 103
4.8.4.1 Measures of location or central tendency .............................................. 104
4.8.4.2 Measures of dispersion ......................................................................... 104
4.8.4.3 Measures of shape ................................................................................ 104
4.8.5 Collinearity diagnostics .......................................................................... 105
4.8.6 Canonical correlation analysis ............................................................... 106
4.8.6.1 Estimating canonical functions .............................................................. 107
4.8.6.2 Assessing overall model fit .................................................................... 108
4.8.6.3 Redundancy analysis ............................................................................ 108
4.8.6.4 Interpreting the canonical variates ......................................................... 109
4.8.7 Independent-samples t-test ................................................................... 109
4.9 CONCLUSION ...................................................................................... 110
CHAPTER 5 ANALYSIS AND INTERPRETATION OF EMPIRICAL FINDINGS ....... 112
5.1 INTRODUCTION ................................................................................... 112
5.2 RESULTS OF THE PILOT TEST .......................................................... 112
5.3 DATA GATHERING PROCESS ............................................................ 114
5.4 PRELIMINARY DATA ANALYSIS ........................................................ 114
5.4.1 Data coding ........................................................................................... 114
5.4.2 Data cleaning ........................................................................................ 118
5.4.3 Frequency tabulations ........................................................................... 118
5.5 DEMOGRAPHIC AND MEDIA CONSUMPTION ANALYSIS ............... 121
5.5.1 Age distribution ...................................................................................... 121
5.5.2 Gender distribution ................................................................................ 122
5.5.3 Race distribution .................................................................................... 123
5.5.4 Province of origin ................................................................................... 124

xii
5.5.5 Level of study ........................................................................................ 126
5.5.6 Favourite entertainment content ............................................................ 127
5.5.7 Preferred medium for accessing entertainment content ........................ 128
5.5.8 Days per week spent on entertainment content ..................................... 129
5.5.9 Hours per day spent on favourite entertainment content ....................... 129
5.5.10 Awareness of product placement’s commercial intent ........................... 130
5.6 PRINCIPLE COMPONENT ANALYSIS ................................................ 131
5.6.1 Principle component analysis of independent variables ........................ 132
5.6.2 Principle component analysis of the dependent variables ..................... 135
5.7 RELIABILITY AND VALIDITY ANALYSIS OF MAIN SURVEY ............ 136
5.8 DESCRIPTIVE STATISTICS ................................................................. 138
5.9 NOMOLOGICAL VALIDITY ASSESSMENT AND COLLINEARITY
DIAGNOSTICS ..................................................................................... 139
5.10 HYPOTHESES TESTING ..................................................................... 142
5.11 CANONICAL CORRELATION .............................................................. 143
5.12 INDEPENDENT-SAMPLES T-TESTS .................................................. 147
5.13 CONCLUSION ...................................................................................... 149
CHAPTER 6 CONCLUSION AND RECOMMENDATIONS ....................................... 151
6.1 INTRODUCTION ................................................................................... 151
6.2 OVERVIEW OF THE STUDY ................................................................ 153
6.3 MAIN FINDINGS OF THE STUDY ........................................................ 155
6.4 CONTRIBUTIONS OF THE STUDY ..................................................... 159
6.5 RECOMMENDATIONS OF THE STUDY .............................................. 160
6.5.1 Self-regulation and continuous monitoring ............................................. 160
6.5.2 Design realistic product placement campaigns with integrated
strategies ............................................................................................... 161
xiii
6.5.3 Design entertaining product placement campaigns ............................... 162
6.5.4 Use product placement as part of the integrated marketing
communication (IMC) strategy ............................................................... 162
6.5.5 Increase brand exposure through increased product placement
budget ................................................................................................... 163
6.5.6 Create brand image by associating brands with appropriate
characters/shows................................................................................... 164
6.6 LIMITATIONS AND FUTURE RESEARCH OPPORTUNITIES ............ 164
6.7 CONCLUSION ...................................................................................... 165
BIBLIOGRAPHY ........................................................................................................ 167
ANNEXURES ............................................................................................................. 198
ANNEXURE A: QUESTIONNAIRE ............................................................................ 198

xiv
LIST OF TABLES
Table 3-1 South African entertainment and media spending 2016-2021
(R millions) .......................................................................................... 56
Table 4-1 Coding information .............................................................................. 98
Table 5-1 Summary table of pilot results ........................................................... 113
Table 5-2 Coding information ............................................................................ 114
Table 5-3 Frequency table of responses ........................................................... 119
Table 5-4 Rotated factors for the independent variables ................................... 133
Table 5-5 Rotated factors for the dependent variable ........................................ 136
Table 5-6 Cronbach alpha and average inter-item correlation values for the
main study ......................................................................................... 137
Table 5-7 Descriptive statistics .......................................................................... 138
Table 5-8 Pearson’s product-moment correlation matrix ................................... 140
Table 5-9 Collinearity diagnostics ...................................................................... 141
Table 5-10 Measures of overall model fit ............................................................. 144
Table 5-11 Redundancy analysis for the first canonical function ......................... 145
Table 5-12 Canonical weights, loadings and cross-loadings ............................... 146
Table 5-13 Gender difference .............................................................................. 148

xv
LIST OF FIGURES
Figure 1-1 Example of product placement .............................................................. 4
Figure 2-1 Global share of advertising expenditure by medium ............................ 24
Figure 2-2 South African advertising spend 2016-2018 by medium ..................... 25
Figure 2-3 Theory of planned behaviour ............................................................... 33
Figure 2-4 The ELM model ................................................................................... 37
Figure 2-5 Structural model of AG ........................................................................ 43
Figure 2-6 Framework for the relationships between attitude towards
advertising in general and attitudes toward advertising in specific
media .................................................................................................. 45
Figure 3-1 Proposed model of Generation Y students’ attitudes and
behavioural responses towards product placement in movies and
TV shows ............................................................................................ 85
Figure 4-1 Marketing research process ................................................................ 88
Figure 5-1 Age distribution of the sample ........................................................... 122
Figure 5-2 Gender distribution of the sample ..................................................... 123
Figure 5-3 Race distribution of the sample ......................................................... 124
Figure 5-4 Participants’ province of origin .......................................................... 125
Figure 5-5 Participants’ levels of study ............................................................... 126
Figure 5-6 Participants’ favourite entertainment content..................................... 127
Figure 5-7 Participants’ preferred entertainment media ...................................... 128
Figure 5-8 Media consumption frequency in days .............................................. 129
Figure 5-9 Entertainment media consumption frequency in hours ...................... 130
Figure 5-10 Participants’ awareness of product placement’s commercial intent .. 131

xvi
Figure 6-1 Generation Y students’ attitudes and behavioural intentions
towards product placements in movies and TV shows ...................... 158

1
CHAPTER 1 INTRODUCTION AND PROBLEM STATEMENT
1.1 INTRODUCTION AND BACKGROUND TO THE STUDY
Advertising is a pivotal element of the integrated marketing communication (IMC) mix,
with its core focus being on consumer edutainment (Newell et al., 2006:576; Sung et al.,
2009:258; Beneke, 2012:1069). However, over the past few decades, mass media
advertising was already experiencing problems, with a prognosis that was poor (Rust &
Oliver, 1994:71).
These problems facing mass media advertising have been attributed mainly to the
developments in new technologies, which have resulted in a subsequent fragmentation
of media and mass media audiences, as well as the empowerment of consumers in the
form of digital television recording systems (DTRs/PVRs) that allow them to avoid or skip
through television (TV) commercials should they so choose (Gupta & Lord, 1998:48;
Gould et al., 2000:45; De Gregorio & Sung, 2010; Williams et al., 2011:3; Babacan et al.,
2012:1329; Karisik, 2014:254). Consequently, marketers have needed to re-think their
brand communication strategies and tactics in an endeavour to interact with their target
markets more effectively.
Product placement is receiving increasing attention from both marketing academics and
practitioners as an alternative marketing communication technique (Sung et al.,
2009:258; Babacan et al., 2012:1329; Beneke, 2012:1069; Karisik, 2014:253). Product
placement, used synonymously with brand placement/branded entertainment, may be
defined as any “paid inclusion of branded products or brand identifiers through audio
and/or visual means within mass media programming” (Balasubramanian, 1994:30;
Karrh, 1998:31). That is, product placement involves brands being placed in various
media content such as movies, TV shows, songs, videogames, websites, magazines
and/or novels in an effort to create brand awareness, brand association and, ultimately,
brand loyalty.
Despite product placement having only gained in popularity in the 1980s, product
placement is certainly not a new phenomenon as the first reported product placement is
claimed to have been in 1896 through the placement of Uniliver’s Sunlight Soap in the

2
early Lumiere programmes (Newell et al., 2006; Sung et al., 2009; Kozary & Baxter, 2010;
Williams et al., 2011; Soba & Aydin, 2013). The practice was revolutionised in 1982,
following the success of the Resee’s Pieces placement in the Spielberg’s 1982 movie,
E.T. Following the success of product placements in this movie, brand marketers became
more enthusiastic about associating their brands with successful entertainment movies
and programmes. Furthermore, the practice has gained a new frontier through the use of
digital product placement as commercial messages can now be inserted digitally even
after the production of the entertainment content, thereby reinforcing product placement
as the future of TV advertising (Williams et al., 2011:3: PQ Media, 2018).
Morton and Friedman (2002:34) point out that even though product placement and brand
placement are used synonymously, a more realistic term should be brand placement,
especially since it is brands that are placed and not products per se. Notwithstanding this,
product placement is the more commonly used term and the one that will be used
throughout this study.
Even though product placement is said to have existed for many years, academic interest
in the topic has only recently sparked given marketers need to break through the ever-
increasing advertising clutter (Babacan et al., 2012:1320). The significance of academic
research around the topic of product placement is highlighted by Karrh (1998:31-32), who
indicates that the process of product placement has become big business in practice and
asserts that this topic presents an interesting, yet challenging area of research. It is worth
noting that the practice of product placement carries with it social as well as legal
implications (Gupta & Gould, 1997:38; Karrh, 1998:32; Sung et al., 2009:258; Al-Kadi,
2013:1).
According to Cowley and Barron (2008:91), automobile (motorcar) manufacturing
companies are the heaviest users of various product placement strategies, with
companies such as Austin Martin, BMW and Mercedes Benz featuring in movies such as
the James Bond series as well as General Motors in movies such as the Transformers.
This may be attributed to the size and financial muscle the automobile industry
possesses. Other prominently placed product categories include computers, cellular
phones and other technological devices, apparel and accessories, food and beverages,
travel and leisure, as well as travel and entertainment (Williams et al., 2011:4).

3
Notwithstanding the recently growing popularity around the topic of product placement by
research academics, Gould et al. (2000:43) point out that four aspects of empirical
research continue to remain noteworthy:
There is still an insufficient number of studies in this regard that exist.
Those that exist do not converge, which, consequently, renders many issues
unexplored, and therefore require further validation and generalisation.
Previous studies typically focus attention on only a few measures of effectiveness.
Research emphasis has stayed uneven across the message effectiveness studies
thus far, as the majority of research in this regard has focused primarily on memory-
related measures such as brand recall and recognition.
Similarly, in a comprehensive review of 20 years of product placement effectiveness
literature through 73 academic works that focused on movies, TV shows and video
games, Karisik (2014:253) point out that the majority of studies focus on memory-related
measures and attitudinal measures; however, other non-memory related measures
remain significantly scares because developments in the product placement industry
outpace research. This creates gaps in the literature and opportunities for further
research.
Figure 1-1, taken from the movie Taken 2, released in 2012, illustrates a basic example
of product placement by Mercedes Benz, which was awarded top spot for overall product
placement in 2013 by appearing in 29.4 percent of Hollywood’s top movies (Sauer, 2013).
The brand was prominent in numerous other top movies, including Think Like a Man, Act
of Valor, Argo, 21 Jump Street, Skyfall and Transformers.

4
Figure 1-1 Example of product placement
Source: Sauer (2013)
Product placement has become an important element of the modern day brand
communication strategy. Sung et al. (2009:257) indicate that in 2006 alone, the worldwide
spending on movie-based product placement stood at $885.1 million. According to PQ
Media (2018), global product placement revenues, including paid placements in TV,
movies, online and mobile platforms, videogames, music, and other media, rose at twice
the rate of overall advertising and marketing revenues in 2017 to exceed $100 billion for
the first time ever.
Examples of the marketing advantages offered by product placements include the
appearance of Reese’s Pieces products in the 1982 movie E. T., which resulted in a
significant increase in sales (Karrh et al., 2001:5). In addition, the Royal Doulton bulldog
figurine that appeared in the Bond movie, Skyfall, sold out quickly after the movie was
released. Similarly, shaving goods retailers reported over 400 percent sales increase for
‘cut-throat razors’ after this Bond movie. Furthermore, the brand that was reported to have
received the highest exposure was that of Macallan whisky, which appeared in several
scenes and was even called out by name as one of James Bond’s particular favourites.
The estimated value of Macallan's appearance in Skyfall was $8.98 million (theatrical

5
value) and a further $473,647 in (DVD/ Digital) and $256,667 (future broadcast airings)
(Sauer, 2013).
Along with its increased popularity, the practice of product placement has attracted a
great deal of criticism from various consumer groups abroad (Morton & Friedman,
2002:35). Critics argue that consumers are being manipulated and unduly influenced by
the practice because of its covert nature (Sung et al., 2009:260). The rationale of the
argument is based upon the notion that product placement uses subliminal advertising
messages, which, in turn, can influence consumer attitudes towards the attitude object
without any caution exercised by consumers upon exposure to the placement (Morton &
Friedman, 2002:36).
The increasing use of product placement, along with the frequent criticism this brand
communication method attracts, necessitates an in-depth understanding of how
consumers react to this marketing practice. Although various studies show a more
positive consumer attitude towards product placement (Gupta & Gould, 1997; Sung et al.,
2009; Babacan et al., 2012:1320; Morton & Friedman, 2012:35), in their cross-cultural
analysis of consumer attitudes towards product placement, Gould et al. (2000:43) argue
that product meanings are a cultural phenomenon and that consumers may react
differently to product placement depending on their socio-demographic characteristics.
With this in mind, this study focuses on attitudes towards product placement in the
South African context.
The conceptual framework for this study is derived from the almost inexhaustible literature
on attitudes towards advertising in general. Studies in this regard have reported attitudes
towards advertising in general to affect attitudes towards the advertisement and, in turn,
attitudes towards the advertised product or brand (MacKenzie et al., 1986:130).
Similarly, attitudes towards product placement are posited to affect attitudes towards the
placement itself and, in turn, the product or brand placed (Nebenzhal & Secunda,
1993:6; Sung et al., 2009:261).
The present study aims to propose a conceptual framework that measures the Generation
Y students’ attitudes and behavioural responses towards product placement in movies
and TV shows. A focus will primarily be on the South African TV and movie audience as

6
studies indicate that these media remain the most important in product placement studies
(Gupta & Gould, 1997; Gould et al., 2000; Morton & Friedman, 2002; Balasubramaniean
et al., 2006; Sung et al., 2009; Williams et al., 2011; Soba & Aydin, 2013; Karisik, 2014).
In a seminal study of 1012 Generation Y students and their perceptions of product
placement’s acceptability in movies, Gupta and Gould (1997) identified several factors
influencing attitudes towards product placement, which have been utilised in many
subsequent studies such as Gould et al. (2000), Sung et al. (2009), Morton and Friedman
(2002) and so on.
Unfortunately, Gupta and Gould (1997) did not propose a formal framework on how
consumers react to placements, but rather looked at perceptions of their ethicality.
Moreover, no attitudinal measures were correlated with behavioural responses as Morton
and Friedman (2002:34) assert that behavioural response is perhaps the most important
indicator of product placement effectiveness. This study will therefore modify and extend
upon the study by Gupta and Gould (1997) by formally proposing an empirical model that
measures South African Generation Y students’ attitudes and behavioural responses
towards product placement in movies and TV shows.
Based on the preceding literature, various factors are reviewed to influence placement
attitudes. These factors include perceived product placement ethics, realism, attitude
towards TV advertising, character-product association, materialism, perceived
entertainment and purchase intentions.
The following section discusses the problem statement as well as proposes a model that
comprehensively examines the antecedents that affect product placement attitudes and
behaviour.
1.2 PROBLEM STATEMENT
The youth represent an important current and future market segment (Wolburg &
Pokrywcznski, 2001:33; Kueh & Voon, 2007:657; Rahman & Azhar, 2011:93; Bevan-Dye,
2016:5; Canavan, 2018:184). According to generational research, the youth of today are
labelled Generation Y (Market, 2004:21). Markert (2004:21) defines Generation Y as
comprising individuals born between 1986 and 2005, which in 2018 would include
individuals aged between 13 and 32 years.

7
According to the South African mid-year population estimates, in 2018 approximately 35
percent of South Africa’s population was classified as members of Generation Y
(Statistics South Africa, 2018). The university student portion is of particular interest to
marketers given that a graduate qualification typically correlates to a higher future earning
potential and, consequently higher future disposable income, rendering them a
significantly lucrative target segment (Wolburg & Pokrywcznski, 2001:33; Kueh & Voon,
2007:657; Rahman & Azhar, 2011:93; Bevan-Dye, 2016:5; Canavan, 2018:184).
The literature notes that the Generation Y segment is the most highly sought after
segment by marketers as they are heavy consumers of entertainment media (Sung et al.,
2009:258; Williams et al., 2011:2; PQ Media, 2018). However, studies have also reported
that it has become increasingly difficult for marketers to reach members of this cohort
(Gould et al., 2000:43) given the increase in media clutter, audience fragmentation and
the new technologies that give consumers, especially the digital technology astute
Generation Y individuals, greater control over what advertisements to be exposed to, and
the amount thereof. In one study, two-thirds of American consumers were reported to cut
the sound during commercials, change channels or even skip them as they found them
irrelevant (Williams et al., 2011:3). Evidence points to the fact that given the decline in
traditional advertising effectiveness and the potential of product placement as a substitute
thereof, further research is needed to explore the viability of product placement and how
the Generation Y market respond to it.
Even though the amount of the academic literature pertaining to product placement has
grown significantly in recent years, many questions still prevail. Gould et al. (2000:43)
voiced a concern about the lack of consistencies in existing empirical results. Moreover,
Balasubramanian et al. (2006:116) highlight that the preoccupation of such studies is
mainly with cognitive measures of placement effectiveness, while Morton and Friedman
(2002:35) lament the lack of sufficient measures of behavioural outcomes in placement
effectiveness research.
Furthermore, most studies on product placement focus mainly on three areas of research;
that is, the effectiveness of product placement (Gupta & Lord, 1998:53: Lehu &
Bressound, 2008:2), attitudes towards product placement (Nebenzahl & Secunda,
1993:2; Gupta & Gould, 1997:38; Karrh et al., 2001:5; Schmoll et al., 2006:34; Sung et

8
al., 2009:259) as well as the acceptability of product placement (Nebenzahl & Secunda,
1993:2; Gibson & Maurer, 2000:1459; Gould et al., 2000:42; Fam et al., 2006:38). In
addition, Cholinski (2012:14) criticises the fact that the results from product placement
effectiveness studies are mostly laboratory based, which raises concerns with regards to
the validity and generalisability thereof, especially given the un-natural nature of
experimental research studies, the subsequent forced exposure, small samples scales,
heightened levels of involvement and so on.
It is therefore evident that more empirical research on the effectiveness of product
placement as well as consumer response thereof is still needed. The present study aims
to contribute to the existing body of literature in this regard in an attempt to shed light
particularly on the South African Generation Y context. Based on a preliminary literature
review, the study aims to propose and empirically test a model of the antecedents
affecting South African Generation Y students’ attitudes and behavioural responses
towards product placements in movies/TV shows.
1.3 OBJECTIVES OF THE STUDY
The following objectives were formulated for the study.
1.3.1 Primary objective
The main purpose of this study was to propose and empirically test a model of the
relationships between Generation Y students’ attitudes and behavioural responses
towards product placement in movies and TV shows and the factors of perceived ethics,
entertainment, realism, character-product associations and materialism of product
placements, as well as attitude towards TV advertising in the South African context.
1.3.2 Theoretical objectives
In order to achieve the primary objective, the following theoretical objectives were
formulated for the study:
Conduct a review of the literature on the conceptualisation of advertising.
Review the available literature on the advertising market.

9
Review the literature on consumer attitude formation and change.
Conduct a literature review on the consumer attitudes towards advertising.
Conduct a review of the literature regarding Generation Y.
Review the literature on product placement in the context of movies and TV shows.
Review the literature on the potential factors influencing attitude towards product
placements and intentions to purchase placed brands.
Propose a model of the relationships between the factors of perceived ethics,
entertainment, realism, character-product associations and materialism of product
placements, as well as attitude towards TV advertising, and South African
Generation Y students’ attitudes and behavioural responses towards product
placement in movies and TV shows.
1.3.3 Empirical objectives
In accordance with the primary objective of the study, the following empirical objectives
were formulated:
Determine South African Generation Y students’ attitudes towards product
placement in movies/ TV shows.
Determine South African Generation Y students’ intentions to purchase placed
brands.
Determine Generation Y students’ perceived ethics of product placements in
movies/ TV shows.
Determine Generation Y students’ perceived entertainment value of product
placements in movies/ TV shows.
Determine Generation Y students’ perceived realism of movies/ TV shows’ content
containing product placements.
Determine Generation Y students’ attitude towards TV advertising.
Determine Generation Y students’ character-product associations of product
placements in movies/ TV shows.
Determine Generation Y students’ perceived materialism-inducement of product
placements in movies/ TV shows.

10
Empirically test a model of the relationships between the factors of perceived ethics,
entertainment, realism, character-product associations and materialism of product
placements, as well as attitude towards TV advertising, and South African
Generation Y students’ attitudes and behavioural responses towards product
placement in movies and TV shows.
Determine whether there are any statistically and practically significant differences
between male and female Generation Y students’ attitude towards TV advertising,
and their perceived ethics, realism, character-product association, materialism,
entertainment and attitude towards product placement, as well as their purchase
intentions towards such products.
1.4 HYPOTHESES
In accordance with the empirical objectives of the study, the following two hypotheses
were formulated:
Ho1: The correlations between all possible linear combinations of the multivariate
dependent variables of South African Generation Y students’ attitudes towards
product placement in movies and TV shows, and purchase intensions towards such
products, and the independent variables of their general attitude toward TV
advertising, their perceived ethicality, perceived realism, character-product
association, perceived materialism and perceived entertainment value of product
placements are zero.
Ha1: There is at least one combination of the multivariate dependent variables of South
African Generation Y students’ attitudes towards product placement in movies and
TV shows, and purchase intensions towards such products, and the independent
variables of their general attitude toward TV advertising, their perceived ethicality,
perceived realism, character-product association, perceived materialism and
perceived entertainment value of product placements.
Ho2: There is no statistically or practically significant difference between male and female
Generation Y students’ attitude towards TV advertising, and their perceived ethics,
realism, character-product association, materialism, entertainment and attitude

11
towards product placement, as well as their purchase intentions towards such
products.
Ha2: There is a statistically and practically significant difference between male and female
Generation Y students’ attitude towards TV advertising, and their perceived ethics,
realism, character-product association, materialism, entertainment and attitude
towards product placement, as well as their purchase intentions towards such
products.
In the following section, the research design and methodology used within the study is
outlined.
1.5 RESEARCH DESIGN AND METHODOLOGY
The study provides both theoretical as well as empirical evidence on how consumers
react to product placement tactics. A descriptive research design was followed for the
empirical component of the study.
1.5.1 Literature review
As a background and foundation to this study, a review of the literature from local and
international sources on product placement attitudes was undertaken. The secondary
data sources that were reviewed were from textbooks, business and newspaper articles,
as well as academic databases.
1.5.2 Empirical study
The empirical methodology of this research project is briefly described in the following
sections.
1.5.2.1 Target population
The relevant target population that this study focused on included Generation Y university
students aged between 18-24 years who, during 2018, were registered at South African
public higher education institutions (HEIs). The target population was defined as follows:

12
Element: Full-time undergraduate Generation Y students aged between 18 and 24
years.
Sampling unit: South African registered public HEIs
Extent: South Africa, Gauteng
Time: 2018
1.5.2.2 Sampling frame
Given the target population, the sampling frame comprised the 26 registered South
African public HEIs (Department of Higher Education and Training, 2018). In order to
narrow this initial sampling frame, the judgment sampling technique was used to select
three HEI campuses located in South Africa’s Gauteng province − one traditional
university campus, one comprehensive university campus and one university of
technology campus. The focus on the Gauteng province in this study was because this
province has the highest percentage of South Africa’s 26 registered public HEIs’
campuses (Bevan-Dye & Surujlal, 2011:49; Statistics South Africa, 2018).
1.5.2.3 Sample method
For the main survey, a single cross-sectional of Generation Y university students was
drawn using the non-probability convenience sampling technique. In an effort to
compensate for the known limitations of the convenience sampling method, several
demographic questions, such as age, province of origin and gender were added to the
questionnaire. The purpose of these demographic questions was to provide information
concerning the degree to which the sample reflected the specified target population.
1.5.2.4 Sample size
A sample size of 450 tertiary students was selected for the research project. This sample
size may be likened to other studies that have focused on product placement attitudes
such as Morton and Friedman (2002:36) (N=132), Hernandez et al. (2004:77) (N=315),
Lee et al. (2011:366) (N= 471), and as such, the sample size is deemed sufficient. More
importantly, the sample size satisfies the requirement of 10 responses per variable for
principle component analysis and canonical correlation (Hair et al., 2010:102&243). The

13
sample of 450 full-time tertiary students was divided equally between the three HEI
campuses, with a sample of 150 per campus.
1.5.2.5 Measuring instrument and data collection method
For the study, a structured, self-administered questionnaire was developed to gather the
relevant primary data. Prior works on product placement attitudes were reviewed to
construct a scale for this study. The questionnaire comprised items measured along a
six-point Likert-type scale, with one being “strongly disagree” and six being “strongly
agree”.
The majority of items were adopted from the scale developed by Gupta and Gould
(1997:38), which measures the realism enhancing attributes of product placement (5
items), perceptions of product placement ethics (8 items), its perceived material influence
on consumers (4 items) as well as attitudes towards advertising on TV (4 items). An
additional scale was constructed from the prior product placement literature, which
comprises eight items intended to measure character-product association. Moreover, a
three-item scale measuring perceived entertainment was adopted from (Hernandez et al.,
2004:77). Finally, the last two scales forming the endogenous variables of this study were
attitudes towards product placement in movies and TV shows (3 items) as well as
purchase intentions (4 items). These scales were adopted from Tan and Chia (2007:357)
as well as Morton and Friedman (2002:38).
The instrument also included a section on the participants’ demographical profile as well
as their media consumption habits. Furthermore, the instrument included a cover letter
that described the nature of the study and provided relevant contact details.
The instrument was examined by two experienced researchers to establish its face
validity and further analysed by four academics with marketing experience to ascertain
its content validity. Next, the instrument was piloted on a convenience sample of 50
Generation Y students who were not included in the main study in order to ascertain its
reliability. The reliability was tested using the Cronbach alpha, where the guideline for the
overall scale and sub-scale inter-item correlation is 0.6 or above (Malhotra, 2010:319).

14
Lecturers at each of the three campuses included in the sampling frame were contacted
and asked to allow their students to complete the questionnaire during lectures. The
lecturers were informed that the questionnaire was to be completed on a voluntary basis
only. The hand-delivered, self-administered questionnaires were distributed to the full-
time Generation Y undergraduate students during class time at each of the three
campuses in 2018.
1.5.2.6 Statistical analysis
The captured data was analysed using the statistical package for Social Sciences (SPSS)
Version 25.0 for Windows. The following statistical methods were used on the empirical
data sets:
Frequencies
Principle component analysis
Internal-consistency reliability and construct validity analysis
Collinearity diagnostics
Descriptive statistical analysis
Canonical correlation analysis
Independent-samples t-test
Cohen’s D-statistic.
1.6 ETHICAL CONSIDERATIONS
Ethics are an important consideration in any empirical research project, including those
in the field of marketing research. This research project strove to meet all of the ethical
conventions typical for academic research projects. Amongst the most important
conventions adhered to in this project were ensuring voluntary participation in the study
and the protection of the identities and interest of the sample’s participants, and treating
the information supplied by the participants as confidential.
In addition, before embarking on the data collection stage of the study, the questionnaire
and an overview of the research methodology that was to be followed was evaluated by
North-West University’s Ethics Committee in order to ensure that the measurement
instrument and intended target population presented a low risk; that is, the target

15
population was not deemed as a vulnerable segment and that the questionnaire did not
sensitive information to be supplied by participants. Both the questionnaire and the
proposed research methodology met with the Committee’s standards and the research
project was assigned the following ethical clearance number: Econit-Econit-2016-059.
1.7 DEMARCATION OF THE STUDY
The study focused on 18- to 24-year old Generation Y tertiary students, registered at
South African public HEIs in 2018. This study’s sampling frame included campuses from
three public HEI campuses situated in South Africa’s Gauteng province.
1.8 CLARIFICATION OF THE TERMINOLOGY
Generation Y: people who were born between 1986 and 2005
Product placement: Refers to the paid insertion of a brand within an entertainment
content for advertising purposes
Attitudes: Refers to the individual’s overall feelings towards an object
Behavioural response: Refers to individuals’ behaviour with respect to products
seen on TV shows or in movies
The following section outlines the chapter classification of this thesis.
1.9 CHAPTER CLASSIFICATION
This thesis includes the following chapters:
Chapter 1: Introduction and background to the study
This chapter featured the introduction and background to the research study. It included
an outline of the problem statement, the primary, theoretical and empirical objectives of
the study, and an overview of the research methodology that was utilised in addressing
the objectives of the study. This chapter concluded with the organisation and structure of
the research study.

16
Chapter 2: Consumer attitudes towards advertising
In this chapter, a detailed literature review on consumer attitudes is conducted, with a
primary focus on various structures of attitudes. In addition, the chapter includes a review
of the literature concerning attitude formation and attitude change. Furthermore, the
relevant literature on attitude models will be reviewed primarily focusing on attitude
towards advertising models.
Chapter 3: Product placement and Generation Y
This chapter provides a conceptualisation of Generation Y in general, together with a
profile of the South African Generation Y. Furthermore, the chapter provides a detailed
review of the literature on product placement in terms of its definition, industry growth,
objectives, strategies, as well as factors that influence attitudes towards product
placement.
Chapter 4: Research design and methodology
Chapter 4 includes a discussion of the questionnaire design, preparation, coding and
distribution. Furthermore, the target population, sampling frame, sampling method and
sample size are described. The data analysis and statistical procedures utilised within the
study are also discussed in this chapter.
Chapter 5: Results and findings
This chapter comprises the study’s findings, which were analysed and interpreted. The
statistical analysis findings discussed in this chapter include frequencies and
percentages, principle component analysis, reliability and validity measures, Pearson’s
product-moment correlation coefficients, collinearity diagnostics, canonical correlation
and an independent samples t-test.
Chapter 6: Conclusions and recommendations
In Chapter 6, there is a review of the entire study and the conclusions observed from the
study. In addition, the recommendations emanating from the findings of the study are
discussed in this chapter. Proposals for further research are also given within the chapter.

17
1.10 GENERAL
Annexures are located in the end matter of the thesis
Tables and figures are placed on the relevant pages throughout the thesis
Where no source reference appears for tables and figures, it refers to own research
Referencing was based on the 2014 version of the NWU referencing guide: Harvard
style.
1.11 CONCLUSION
Chapter 1 provided an introduction and context of product placement. The chapter
highlighted the significance of the product placement technique as an alternative brand
communication tool, especially in the face of the declining effectiveness of traditional TV
advertising. Moreover, the chapter briefly outlined the compelling advantages associated
with product placement as well as the size of the industry.
In addition, the prior literature on product placement research was highlighted, with
specific reference to the gaps that continue to prevail in the literature, thereby
necessitating further research in this regard. The prior literature suggests that the
effectiveness of brand communication tools is to be evaluated on the basis of its influence
on consumers’ behavioural responses to those strategies. This study aimed to measure
product placement effectiveness on the basis of how South African Generation Y students
respond to such promotional tactics in the context of movies and TV shows.
In addition, this chapter highlighted the importance of Generation Y as a market segment,
especially on the basis of its size, future earning potential, current spending power and
the fact that it is the highest consumer of entertainment media. There is, therefore, no
doubt that brand marketers need to have a deeper understanding of this cohort for
segmenting purposes. This consequently suggests the need to understand the consumer
behaviour of this target segment further.

18
Chapter 2, therefore, discusses the concept of consumer attitudes in detail. This will focus
on prior literature of attitude formation and change. Various attitude formation models will
also be discussed, with specific attention to attitude towards advertising models.

19
CHAPTER 2 CONSUMER ATTITUDES TOWARDS ADVERTISING
2.1 INTRODUCTION
Advertising is the most important element of an organisation’s marketing communication
strategy as advertisements can reach mass audiences with a single marketing
communication message (Belch & Belch, 2004:3). Advertising is a part of the marketing
communication mix (along with personal selling, sales promotions, sponsorships, direct
marketing and publicity) and is used to persuade a targeted audience to take or continue
a certain action, usually concerning a market offering, or a political or ideological issue
(Kotler & Amstrong, 2010:450). The aim of commercial advertising is typically to increase
the consumption of products or services through branding, which involves creating an
association in the minds of consumers between a product/service name or image and
certain positive qualities (Aaker et al., 2004:3).
The demise of traditional advertising has been foretold since the 1990s after the
realisation that digital age was here to stay. Early research into advertising’s effectiveness
yielded results suggesting negative attitudes by consumers towards advertising,
supported by evidence into the declining profits of advertising agencies, as well as a
growth in digital advertising spend by marketers around the globe (Zanot, 1984:5).
Notwithstanding this argument however, statistics show that traditional advertising
continues to thrive to date, long after critics have predicted its obsolescence as a brand
communication tool (Hanekom & Scriven, 2002:50). This may be attributed to the fact that
some researchers believe that advertising will gradually evolve into a hybrid form or
context, rather than disappearing completely (Dahlen & Rosengren, 2016:335)
Indeed, the purpose of advertising over the years has been to influence consumers’
perceptions of the marketed brand through persuasion (Petty & Cacioppo, 1986:2). In the
contemporary world, advertising seems to be everywhere and is ever present. This
omnipresence of advertising exerts a far-reaching influence in the daily lives of
consumers, and in developing self-concepts in order to induce purchase decisions. In
2009, a typical consumer was said to be exposed to over 5000 marketing messages daily
(Keller, 2009:141).

20
The advent of new technologies has broadened the scope of advertising from print media
to broadcast media and then, since the early 1990s to the Internet. Moreover, other
marketing communication tools such as direct mail, telemarketing, product placement,
publicity and social media marketing have become commonplace (Jin & Lutz, 2013:344).
Consequently, media clutter and mass audience fragmentation has seen an increase in
advertising scepticism, a decline in traditional advertising effectiveness as well as a
resultant growth in negative consumer attitudes towards traditional advertising (Gupta &
Lord, 1998:48; Gould et al., 2000:45; De Gregorio & Sung, 2010:84; Babacan et al.,
2012:1329).
Owing to media clutter, marketers have had to seek more innovative ways of
disseminating persuasive commercial content in order to gain consumers’ all-important
attention. This has given rise to various other new media advertising platforms in addition
to the traditional above-the-line advertising. The focus of this present study is on exploring
the concept of product placement as an alternative advertising platform available for
advertisers to pursue to attract consumer attention to advertising messages and, in turn,
change consumer attitudes, since attitude change is one of the many objectives of
advertising (Kotler & Amstrong, 2010:551).
Chapter 1 marked out the purpose of this study, which was to propose and empirically
test the model of the Generation Y students’ attitudes towards product placement and
how these attitudes influence their consumption-related behavioural intentions.
Theoretical and empirical objectives were also highlighted as well as the research design
and methodology. Chapter 2 reviews the literature on consumers’ attitudes towards
advertising, with the purpose of addressing the first four theoretical objectives formulated
in Chapter 1. This will focus more in-depth on a review of the literature on consumer
attitudes. This will include discussions on the concept and structure of attitudes, various
attitude formation and change theories, as well as the various structural attitude models
deemed relevant for the establishment of the theoretical underpinnings of this study. The
chapter begins with the definition and conceptualisation of advertising, and a brief
overview of the advertising market.

21
2.2 DEFINITION AND CONCEPTUALISATION OF ADVERTISING
Advertising as an institution has long been considered a salient economic and social
force. Supporters of advertising view it as a “capitalistic virtue, facilitating the free market
economy and promoting consumer welfare” (Mittal, 1994:35). In contrast, its critics
perceive it to have many sins, “ranging from economic waste to purveying of harmful
products, from sexism to deceit and manipulation, from triviality to intellectual and moral
pollution” (Pollay & Mittal 1993:101). More than two decades have passed since Zanot
(1984:5) and Rust and Oliver (1994:73) predicted the death of advertising, especially in
the advent of the shift in negative attitudes by consumers towards advertising, a decline
in profits for advertising agencies, as well as the realisation that digital/new media was
here to stay. Support of these predictions continues to exist, even in recent years among
some researchers (Rust, 2016:346; Dahlen & Rosengren, 2016:335). Despite this,
however, Hanekom and Scriven (2002:335) argue that advertising will not become
obsolete, but rather evolve into a more hybrid form of brand communication tool. This
has, to a large extent, fue lled the necessity to redefine advertising in order to
encapsulate the era in which advertising operates. This section endeavours to address
this issue, as suggested in recent literature.
Indeed, the advertising of today differs significantly from that of 20 years ago as new
media spending patterns and advertising formats and changes in consumer behaviour
have changed the advertising landscape, thus calling for a re-conceptualisation of
advertising. Richards and Kurran (2002:74) had formulated a standard definition of
advertising as “a paid, mediated form of communication from an identifiable source,
designed to persuade the receiver to take some action, now or in the future”. This
definition was still in use a decade later as Kotler and Keller (2012:21), still define
advertising as “a paid form of non-personal, one-way marketing of persuasive information
from an identified sponsor, disseminated through channels of mass communication to
promote the adoption of goods, services or ideas”. Answering recent calls for a new
definition of advertising, Dahlen and Rosengren (2016:334) propose an updated working
definition of advertising (which will also be the definition used in this study), as “brand-
initiated communication intent on impacting people.”

22
Eisend (2016:353) supports this conceptualisation, pointing out that it takes into account
the recent changes in media formats, consumer behaviour and advertising effects, as
such a definition can advance thinking around the field of research. In addition, Dahlen
and Rosengren (2016:334) provide a comprehensive and sophisticated conceptual
dissection of the current definition of advertising and clearly indicate which elements of
the definition are obsolete and in need of refinement. Their conceptualisation was
supported by empirical evidence collected in two studies, from both academia and
practice, thereby providing further credence to such a conceptualisation.
The history of advertising dates back to the beginning of civilization, with hawkers using
word-of-mouth advertising to announce and promote their goods for sale, and merchants
spreading awareness of their art and goods by roaming from town to town. Naturally, over
time it has evolved from simply informing people about products and services to becoming
a highly sophisticated and personalised tool of persuasion, from being restricted to print
media to being available on digital media platforms, followed by interactive social media
platforms and mobile short message services (SMS) (Kumar & Gupta, 2016:303).
Moreover, Schultz (2016:278) points out that what began as the simple activity of a
vendors attempting to attract potential buyers and convince them to purchase their wares
has evolved into a ubiquitous collection of, inter alia public relations, product placements,
social media, talking characters, content marketing, direct selling, timed coupons, some
of which represent traditional marketing communication and others new digital marketing
communication. Nevertheless, moving through various stages of advertising and media
platforms, advertising appears to have come full circle by arriving right back at the word-
of-mouth promotion stage (Kumar & Gupta, 2016:3.4; Chu & Kim, 2018:2-3). No doubt
that the concept of advertising will continue to evolve, especially with marketers now
having to contend not only with the digital advertising era, but now also with the IoT
(Internet of Things) era as well (Aksu et al., 2018)
Notwithstanding reports regarding the progressive decline in the effectiveness of
traditional advertising (Ogilvy & Mather, 1985:63; Muehling, 1987:34; Andrews, 1989:28),
marketers have tried to stay relevant through various innovative platforms and techniques
to use to push their messages across to potential customers and seize their attention.
Nevertheless, despite the calls for change in the role of advertising, especially in the

23
advent of new media, Percy et al. (2016:4) argue that the role of advertising does not
change. The next section looks at the global advertising industry to establish an
understanding of the economic worth and significance of advertising as a marketing
communication tool.
2.3 OVERVIEW OF THE ADVERTISING MARKET
The institution of advertising has long been said to play a significant role in any market’s
economy as well as society at large by earlier research, see (Bauer & Greyser, 1968).
The positive economic impact of advertising can be realised in the way advertising
changes the economic value of products, educates consumers about products and
services, as well as helps raise the standard of living in communities through continued
education regarding various social issues such as health and safety. Advertising, in
addition, can be argued to play an important role through its financial contribution to any
economy, as well as the employment opportunities it presents. Despite its social and
economic benefits, however, advertising has also long come under heavy criticism since
the 1980s for moral pollution and promoting materialism, among others (Reid & Soley,
1982:4). Strasburger et al. (2013:958) caution about the negative impact of both
traditional media as well as new media especially on children and the youth as these
segments are most vulnerable to commercial content consumed through various media
types including social networks.
The advertising market is a multibillion-dollar industry, with its total market share expected
to grow 4.1 percent to reach US$557 billion in 2018 (ZenithOptMedia, 2018). According
to eMarketer (2018), North America remains the world’s largest advertising market,
having risen 6.6 percent in 2017 to reach US$232.48 billion and the region’s 37 percent
share of global media spend is said to be fuelled by its mobile advertising market. This is
followed by Asia-Pacific at US$210.43 billion, which is expected to account for 33.5
percent of the global advertising expenditure and it is said to be the fastest-growing
region, with its 10.7 percent growth rate driven mainly by China, which has 45.5 percent
of the regional advertising market. Advertising spending in Latin America is expected to
grow 8.7 percent to reach US$38.04 billion in 2018. Although several markets in this
region faced economic challenges in 2018, key elections in these countries and the FIFA
World Cup (hosted in Russia) are expected keep the advertising market resilient.

24
TV was the dominant advertising medium between 1996 (when it overtook newspapers
with a 37 percent market share) and 2016 (when it attracted 35 percent of total advertising
expenditure). The Internet appears to have overtaken TV to become the largest
advertising medium. Looking at the advertising market as a whole, TVs share peaked at
39.1 percent in 2012, fell to 34.1 percent in 2017 and is estimated to reach 31.2 percent
in 2020, its lowest share since 1981 (ZenithOptmedia, 2018). Figure 2-1 illustrates the
global share of advertising expenditure by medium between 2017 and 2020.
Figure 2-1 Global share of advertising expenditure by medium
Source: ZenithOptmedia (2018)
From the data in Figure 2-1, it can be noted that if audio-visual advertising is considered
as a whole (TV plus online video), then it can be deduced that audio-visual is in fact
consolidating its dominant share of display advertising. While TV offers incomparable
capacity to build reach, online video offers more exact targeting and the potential for
0
500
2017
2020
1000
1500
2000
2500
Global advertising expenditure by medium (%)

25
personalising marketing communication messages. Both represent powerful tools for
establishing brand awareness and associations. This potentially presents attractive future
prospects for product placement as an alternative way to revitalise such media.
According to Bratt (2018), advertising spending figures were hard to pin down and even
harder to forecast future trends for the African continent, including South African markets.
The author claim that the level of accurate measurement of advertising spending was
largely negated by the fact that while some countries could accurately measure broadcast
media, it was not the case with other media such as print and out-of-home, as was the
case with economies like Angola who had very little measurement techniques in place.
The South African advertising market is said to have contributed US$3.1 billion in 2018,
accounting for less than a percentage of the global advertising market (Statista, 2018).
Figure 2-2 illustrates advertising spending in South Africa from 2016 to 2018, broken
down by medium.
Figure 2-2 South African advertising spend 2016-2018 by medium
Source: Statista (2018)
Despite the fast growth in Internet advertising since 2016, TV advertising remains the
largest medium used by South African advertisers to date (Moerdykon, 2018). Between
2017 and 2018, the five advertisers who spent the most on advertising has remained
Medium
0
2018 200
400 2017
2016
1400
1200
1000
800
600
South African Ad spend 2016-2018 by medium
Am
ou
nt
in m
illio
n U
S d
olla
rs

26
relatively constant. Shoprite come out top both years, while Clientele Life and Unilever
SA were both in the top five. SABMiller and ABSA moved into the top five in the last year,
and Outsurance Insurance and Coca-Cola SA were both featured the previous year, but
dropped out of the top five (Bratt, 2018).
In light of this study focusing on attitudes, the following section defines and
conceptualises attitudes.
2.4 DEFINITION AND CONCEPTUALISATION OF ATTITUDES
Attitudes have long been considered a concept central to social psychology, with early
academics having defined social psychology as “the scientific study of attitudes” (Thomas
& Znaniecki, 1918:2). The definitions of attitudes have changed over time, as prior
definitions were broad and included cognitive, affective, motivational and behavioural
elements. According to Allport (1935:810), attitudes are a “mental and neural state of
readiness, organised through experience, exerting a directive and dynamic influence
upon the individual’s response to objects and situations with which it is related”. Krech et
al. (1962:35) later redefined attitudes as “an enduring organisation of motivational,
emotional, perceptual and cognitive processes with respect to aspects of an individual’s
world.” The concept of attitudes was consequently reduced to its evaluative component
and defined as simply “likes and dislikes” (Bem, 1970:14). The definition by Eagly and
Chaiken (1993:1) also became quite compelling when they defined attitudes as “a
psychological tendency that is expressed by evaluating a particular entity with some
degree of favour or disfavour”.
Indeed, social psychology, dictates that the concept of attitudes be used to refer to a
general, enduring positive or negative feeling towards an individual, object or issue (Petty
et al., 1981:847). O’Donohoe (2001:92) add that attitudes can be viewed as a positive, a
negative, or a mixed reaction to a particular object, thereby pointing out the potential
mixed feelings consumers may experience with regard to an attitude object.
In the consumer behaviour context, the term attitude refers to “a learned predisposition
to behave in a consistently favourable or unfavourable manner with respect to a given
object” (Lutz et al., 1983:533). Solomon et al. (2012:2) point out that anything that a
consumer has an attitude towards can be referred to as an attitude object; therefore, in

27
the marketing context, an attitude object can be operationalised as “a specific
consumption- or marketing-related construct such as product, product category, brand,
service, possession, product use, cause or issue, person, advertisement, Internet site,
price, medium, and so on”.
Attitudes are hypothetical constructs given that they are not directly observable. As such,
they can only be measured by asking direct questions or by observing behaviour (Betsch
et al., 2004:252). This suggests that if a consumer consistently purchases a product and
recommends it to friends and family, then it is possible to infer that the consumer has a
positive attitude towards the brand. In conducting attitudinal studies, therefore,
researchers tend to be object specific.
In addition, it is relevant to note the distinction between explicit attitudes vis-à-vis implicit
attitudes, whereby the former are a conscious set of beliefs that can guide behaviour, and
the latter are a set of subconscious beliefs that can still influence consumer decision
making (Ajzen, 2011:1121).
According to earlier research by Olson and Mitchell (1975:250), consumer behaviourists
have used the concept of attitude for a variety of applied purposes, including predicting
consumer choice behaviour (Bass & Talarzyk, 1972:95; Ginter, 1974:32), as a market
segmentation basis (Myers & Alpert, 1968:15; Mitchell, 1974:1053), as a criterion for
measuring advertising effectiveness (Greene & Stock, 1966:15; Shimp, 1981:10;
MacKenzie & Lutz, 1989:49) and as an explanatory construct in theoretical models of
consumer behaviour. Moreover, consumer psychology researchers have focussed on
three dimensions of attitudinal studies, namely attitude strength, accessibility and
ambivalence.
Attitude strength refers to the extent to which an attitude is resistant to change and
influences an individual’s cognitions and behaviour. A strong attitude is that which an
individual holds firmly and that influences his/her behaviour. Attitudes that are salient to
people also tend to be strong. Another point of interest is that people tend to have stronger
attitudes about things, events, ideas or people when they have considerable knowledge
and information about those things, events, ideas or people (Krosnick & Petty, 1995:9)

28
Attitude accessibility refers to the degree of ease to which an attitude is activated from
memory (Solomon et al., 2012:31). When attitudes are more accessible from memory
they tend to be more predictive of behaviour and are more stable across time. Moreover,
attitude accessibility influences what messages consumers pay attention to, and how the
process those messages (Fazio et al., 1986:281).
In contrast, attitudinal ambivalence refers to the extent to which “an attitude object is
evaluated positively and negatively at the same time or the ratio of positive and negative
evaluations that make up that attitude” (Jonas et al., 2000:37). The ambivalence of an
attitude is said to increase as positive and negative evaluations reach equilibrium.
Furthermore, O’Donohoe (2001:93) and Tan and Chia (2007:353) point out that there is
much ambivalence about consumers’ attitudes towards advertising, depending on the
media/platform being examined. It is therefore important to understand the structure of
consumer attitudes before an in-depth literature review is carried out. This is discussed
in the next section.
2.5 STRUCTURE OF CONSUMER ATTITUDES
The purpose of attitudes is fundamentally to evaluate objects so that consumers can
quickly decide whether to associate themselves with the object positively or negatively,
and consist of affective, cognitive and behavioural components (Olson & Mitchell,
1975:249). This tripartite conceptualisation of attitudes has been said to have many
unique benefits (Triandis, 1971:66) despite other criticisms, particularly with regards to its
operational difficulties as earlier pointed out by some authors (see Chaiken & Stangor,
1987).
The first component is the cognitively-based attitude, which comprises a consumer’s
cognitions. This is the knowledge and perceptions that an individual acquires through a
combination of direct experience with the attitude object and related information from
various sources (Vakratsas & Ambler, 1999:26). This knowledge and consequent
perceptions typically manifest beliefs. In other words, “the consumer believes that the
attitude object possesses various attributes and that specific behaviour will lead to
specific outcomes” (Fishbein & Ajzen, 1975:890; Ajzen & Fishbein, 1977:888).

29
Wilkie and Pessemier (1973:30) concluded that the dominant explanation of attitude
formation and change throughout the 1960s and 1970s was based on cognitive factors,
whereby there was a general acceptance of belief-based models such as the various
versions the expectancy-value model and multi-attribute utility models. Fishbein and
Middlestadt (1995:181) attest that these models all tend to view attitudes as a function of
beliefs and the values or utilities associated with these beliefs.
Consistent with the above notion, therefore, it was assumed that attitude change required
a change in the consumer’s underlying cognitive structure; that is, changing a consumer’s
beliefs about the object and/or in the evaluative aspects of these beliefs (Ajzen &
Fishbein, 1977:888; Fishbein & Middlestadt, 1995:181). This however was only until the
1980s, when the cognitive based attitude formation and change concepts were
challenged with the distinctions between two types of persuasion through the works of
among others, Petty and Cacioppo (1986:5) as well as Chaiken and Stangor (1987:599),
which will be reviewed in detail later in this chapter.
Conversely, the affectively-based attitude component comprises a consumer's emotions
or feelings about a particular object and such emotions and feelings are often treated as
primarily evaluative in nature by consumer researchers. This component captures a
person's direct or global assessment of the attitude object such as the extent to which the
consumer rates the advertisement as favourable or unfavourable, good or bad (Aronson
et al., 2010:5).
Affectively-based experiences also manifest as emotionally charged states such as
happiness, sadness, shame, disgust, anger, distress, guilt or surprise. Research findings
suggest that such emotional states may enhance or amplify positive or negative
experiences, and that later recollections of such experiences may influence what comes
to mind and how the individual acts (Batra & Ray, 1986:235; Derbaix, 1995:471).
According to social psychology literature (Fishbein & Ajzen, 1975), affective-based
attitudes stem from a variety of sources including values (for example, religion and
culture), sensory reactions (for example, not liking chocolate) and conditioning (for
example, classical and instrumental conditioning). In addition, it is worth noting that the
pure affect models have long been criticised for their operational problems as the

30
cognitive element constantly appears in the measurements of such models (Olson &
Mitchell, 1975:250).
Lastly, behaviourally-based attitudes refer to a person’s likelihood or tendency to
undertake a specific action or behave in a particular way with regard to the attitude object.
This is the conative component and may include actual behaviour. In marketing and
consumer research, this conative component is generally treated as an indication of a
consumer's intention to buy, and purchase intention scales are used to measure the
likelihood of a consumer purchasing a product/service or behaving in a certain way
towards the product/service. Moreover, Aronson (2010:5) asserts that behaviourally-
based attitudes stem from people’s observations of how they behave toward an attitude
object. This line of thinking is consistent with Bem’s (1972:3) self-perception theory, which
posits that under certain circumstances, people may not know how they feel, until they
see how they behave.
The next section of this chapter reviews some of the relevant theories, frameworks and
models that explain the theoretical underpinnings of how attitudes may be initially formed
or subsequently changed.
2.6 THEORIES OF ATTITUDE FORMATION AND CHANGE
Research on attitude formation and change has received a great deal of attention over
the years since the introduction of the concept by Thomas and Znaniecki (1918:2), and
expounded upon by Allport (1935:810), such that some researchers in social psychology
have come to a conclusion that the topic of attitudes formation and change has become
the central focus of consumer behaviour research (Petty et al., 1983:136). In the same
spirit, Olson and Mitchell (1975:251) previously cautioned that ignoring or side-stepping
the basic conceptual issues underlying attitude formation and change, as well as the
related topic of attitude structure (discussed in the previous section) may lead to several
problematic issues which are clearly evident in the consumer research literature,
particularly in the areas of communications/advertising research and attitude models.
Therefore, given that attitudes have long been a primary criterion measure of advertising
effectiveness, necessity demands that an examination of the theories of attitude formation
and change be conducted, as this may provide insights regarding the effectiveness of

31
persuasive communications (such as in this case, product placement). An understanding
in this regard would be useful to both marketing management and other regulatory
agencies as product placement presents both managerial and legal implications. It is
important to note that no persons are born with an attitude, and although enduring, those
attitudes are not cast in stone either. Therefore, how consumer attitudes are initially
formed and how they may be changed are two closely related phenomena in consumer
psychology, as they are pertinent to marketing academics and practitioners. A lack of
appreciation in this regard would result in marketers not being able to understand or even
influence consumer attitudes and behavioural responses towards their market offerings.
By definition, attitudes are learned predispositions (as alluded to in Section 2.4);
therefore, several consumer-learning theories provide key insights as to how attitudes
initially may be formed. Vakratsas and Ambler (1999:27) propose that direct personal
experience, along with the influence of the ideas and experiences of friends and family
members and exposure to mass media, facilitates attitude formation. Bian and Forsythe
(2012:1444) add that it is likely that an individual’s personality also plays a major role in
this attitude formation.
There is endless literature on the many models and theories of attitude formation and
change in social psychology, behavioural psychology and consumer psychology.
However, the discussion in this section will pay greater attention to the models deemed
most prominent in the attitude formation and change literature. These will include the
theories of reasoned action and planned behaviour, as well as the elaboration likelihood
model of persuasion.
According to Betsch et al. (2004:251), the 1930s witnessed numerous models of attitude
formation and change, which generally subscribed to the general cognitive processes
such as the classical and operant conditioning theories. Cognitive theorist in this domain
argued that attitude formation and change should be seen as an active, cognitive process
involving understanding and elaboration of persuasive information such that judgements
and behaviour are argued to primarily reflect thinking and reasoning, rather than
automatic operations. The theory of reasoned action proposed by Fishbein and Ajzen
(1975) is a classical illustration of such line of theorising.

32
The theory of reasoned action and the theory of planned behaviour are discussed in the
next section.
2.6.1 The theory of reasoned action and the theory of planned
behaviour
According to the theory of reasoned action, attitude formation is a result of explicit
deliberation involving the anticipation and weighted integration of valued results
associated with an attitude object (Ajzen, 2011:1114). The fundamental assumptions of
this model are borrowed from subjectively expected utility theory (Edwards, 1954:259)
which itself was based on Von Neumann and Morganstern’s (1944) economic theory. The
theory of reasoned action was deemed a comprehensive theory of the interrelationship
among attitudes, intention as well as behaviour. Developed by Ajzen (1991:180), the
model proposes that an individual’s “behavioural intention depends on the person's
attitude about the behaviour and subjective norms”.
The primary premise of the theory holds that people are rational and that reasoning is the
core consequence of behavioural intention (Ajzen & Fishbein, 2000: 5; Bestch et al.,
2004:253). This, therefore, suggests that to apply the theory of reasoned action, it is
assumed that people behave in a rational way and that their actions are not based on
spontaneity, but rather on a systematic premeditation. Furthermore, the theory of
reasoned action distinguishes between the attitude toward an object and an attitude
toward a behaviour.
According to the attitude-behaviour consistency theory, individuals may have not always
behave in a manner that is consistent with their attitudes for various reasons (Ajzen &
Fishbein, 1977:888). Whilst an individual consumer may have a positive attitude towards
an Austin Martin product placement in a James Bond movie for instance (attitude towards
the object), that particular consumer may not necessarily harbour similar attitudes
towards the purchase of the product (attitude towards behaviour) due to various reasons
such as affordability among others.
Miller (2005:172) outlines the three components of the theory of reasoned action as
attitudes (the sum of beliefs about a behaviour weighted by evaluations of these beliefs),

33
subjective norms (beliefs regarding the social desirability of the behaviour) and
behavioural intentions (perceived likelihood to perform the behaviour), in an illustration of
how the constructs can be measured. This is depicted in Figure 2-3.
Figure 2-3 Theory of planned behaviour
Source: Ajzen (1991:189)
In Figure 2-3, the upper blue section of the model depicts the theory of reasoned action,
while the rest of the figure represents the theory of planned behaviour.
According to Sheppard et al. (1988:325), the theory of reasoned action had justifiably
received considerable attention within the field of consumer behaviour as not only did it
seem to predict consumer intentions and behaviour quite well, it also provided a relatively
basic premise for identifying where and how to target consumers' behavioural change
attempts. In addition, after the realisation of the model’s shortcomings, Ajzen (1991:180)
revised and extended the model to the theory of planned behaviour. The limitations put
forth by Sheppard et al. (1988:325) included the distinction between goal intention and
behavioural intention. According to Sheppard et al. (1988:325), people may have an
intention to act in a particular way, yet, due to various reasons end up acting in a different
way.

34
Another limitation pointed out by Sheppard et al. (1988:325) was choice among
alternatives. The presence of choice may significantly alter the nature of the intention
formation process and the role of intentions in the performance of behaviour. Therefore,
a consumer may have an intention to purchase a specific brand of a motor vehicle, yet
due to his/her financial position may end up purchasing a cost effective alternative mode
of transportation. In addition, the role of intention and behavioural performance was
deemed to be another limitation, as the inability to carry out the intention would likely
result in no correlation between intention and behaviour. Furthermore, the last challenge
with the theory of reasoned action was the difference between intention and expectation
(Hausenblas et al, 1997:36).
The theory of planned behaviour (Ajzen, 1991:180) was a subsequent extension of the
theory of reasoned action, which then led to the inclusion of one major predictor
(perceived behavioural control), to the existing model. This addition was made to account
for times when people have the intention of carrying out a behaviour, but the actual
behaviour is negated because they lack confidence or control over behaviour (Miller,
2005:127). The theory of planned behaviour postulates that individuals are likely to have
increased behavioural intentions if they believe that they can perform a given behaviour
successfully (Ajzen, 1991:181). Increased perceived behavioural control is thus a
combination of self-efficacy and controllability previously proposed by Bandura
(1977:191). “Self-efficacy refers to the level of difficulty that is required to perform the
behaviour, or one's belief in their own ability to succeed in performing the behaviour”,
whereas controllability/perceived power refers to the outside factors, and one's belief that
they personally have control over the performance of the behaviour (Rodgers & Gauvin,
1998:1016). This suggests that if a person has high perceived behavioural control, then
they have an increased confidence that they can perform the specific behaviour
successfully.
The theory of planned behaviour has received considerable attention in the literature with
citations of over 4 550 by the year 2010 and found to have the highest scientific impact
score amongst the United States and Canadian social psychologists (Lee, 2010:366).
With this popularity, however, came a great deal of criticism, as many researchers tend
to question the predictive validity of the model (Ajzen 2011:1113). In a quantitative

35
integration and review of 185 independent studies published up to the end of 1997 for
instance, Armitage and Conner (2001:471) concluded that the theory of planned
behaviour accounted for 27 percent and 39 percent of the variance in behaviour and
intention, respectively, while the perceived behavioural control construct accounted for
significant amounts of variance in intention and behaviour, independent of theory of
reasoned action variables. The authors further noted that when behaviour measures were
self-reports, the theory of planned behaviour accounted for 11 percent more of the
variance in behaviour than when behaviour measures were objective or observed (R2s =
.31 and .21, respectively). It can thus be argued that, the major drawback of the model is
the fact that it relies heavily on self-reported measures of behaviour, which tend to lack
validity as compared to more objective/observed measures of behaviour.
Furthermore, Ajzen (2011:1115) concedes that even when all the theory of planned
behaviour measures are assessed, they contain measurement error and despite the best
scale measurements, a reliability coefficient of 0.75 or 0.80 is rare. The author further
points that these measures often yield a correlation of around 0.60 on average. In
addition, another finger has been pointed at the theory of planned behaviour’s correlation
between intention and behaviour. Results in this regard vary significantly; however, the
temporal distance between the measured intentions and the behaviour observed has
been identified as the main variable moderating this relationship (McEachan et al.,
2011:144). It thus stands to reason that the longer the time between intentions measures
and behaviour observations, the less significant the predictive reliability of behaviour and
vice versa (Conner et al., 2000:469). While a general view of a poor predictive validity
exists with respect to the theory of planned behaviour’s ability to differentiate behaviour
from intentions, Ajzen (2011:1115) attributes this low correlation to the respondent’s
ability to override or inhibit impulses.
Moreover, the theory of planned behaviour has often been criticised of being too rational
and not considering the affective and emotional components of human psychology (Ajzen
& Fishbein, 2000:15). This concern is said to be based partly on the erroneous perception
that the theory posits a rational person who is unaffected by emotions and partly on the
standard methodology that is typically used to operationalise the theory’s constructs
(Sheppard et al., 1988:325; Sniehotta et al., 2014:2). However, Ajzen (2011:1116) argues

36
that while the theory of planned behaviour “emphasises the controlled aspects of human
information processing and decision making, there is no assumption in the theory of
planned behaviour that behavioural, normative and control beliefs are formed in a rational,
unbiased fashion or that they accurately represent reality”.
Finally, suggestions have been made to explore the prospect of adding one or more
factors to the theory of planned behaviour model to increase the amount of explained
variance in the intentions or behaviour construct (Conner & Armitage, 1998:429). Ajzen
and Fishbein (2000:3) caution, however, that additional predictors to the model must only
be considered after careful deliberation and empirical exploration and proposed the
following criteria in this regard:
“As with the existing predictors in the theory, the proposed variable should be
behaviour-specific, conforming to the principle of compatibility. This means that it
should be possible to define and measure the proposed factor in terms of the target,
action, context and time elements that describe the behavioural criterion.
It should be possible to conceive of the proposed variable as a causal factor
determining intention and action.
The proposed addition should be conceptually independent of the theory’s existing
predictors.
The factor considered should potentially be applicable to a wide range of behaviours
studied by social scientists.
Lastly, the proposed variable should consistently improve prediction of intentions or
behaviour if it is to be made part of the theory”.
Notwithstanding the subsequent criticism, the theories of reasoned action and planned
behaviour have no doubt made a significant contribution to attitude formation literature as
their popularity over the years bares evidence.
The next section looks at the elaboration likelihood model as another pertinent theory
explaining consumer attitude formation and change.

37
2.6.2 Elaboration Likelihood Model of persuasion (ELM)
The scepticism around human rationality emerged in the 1970s subsequent to the
introduction of the heuristics and biases programme and the subsequent empirical
evidence amassed suggested that individuals utilise basic judgment heuristics instead of
systematic and deliberative modes of information processing (Nisbett & Ross, 1980:2).
Owing to these findings, the dual process models such as Chaiken (1980:141), and Petty
and Cacioppo (1986:6) were necessitated (Betsch et al., 2004:252). The elaboration
likelihood model of persuasion (ELM), is a dual process model that describes how
attitudes form and change. The model seeks to explain various processes of processing
information. According to the ELM, there are two routes to persuasive communication,
namely the central route to persuasion as well as peripheral route to persuasion (Petty
et al., 1983:136). Figure 2-4 below is a simple representation of the ELM.
Figure 2-4 The ELM model
Source: Petty and Cacioppo (1986:10)
HIGH Involvement LOW
Central route Peripheral route
Message arguments
influence attitudes
Peripheral cues
influence attitudes

38
The central route to persuasion is proposed to likely result from an individual’s careful
and thoughtful consideration of the true benefits of the information presented in support
of an attitude object (Petty et al., 1983:139). Moreover, the central route entails a high
level of message elaboration in which a significant amount of cognition about the
arguments are generated by the individual receiving the message and the resulting
attitude change will be relatively enduring, resistant and predictive of behaviour (Duane,
1999:41).
In contrast, the peripheral route to persuasion results from an individual’s association with
positive or negative cues in the stimulus or making a simple inference about the merits of
the advertised product (Kruglanski & Van Lange, 2012:225). The cues received by the
individual under the peripheral route are generally unrelated to the logical quality of the
advertised product and typically involve factors such as the credibility or attractiveness of
the sources of the message, or the production quality of the message (Miller, 2005:129).
It can thus be argued that a product placement advertisement uses the peripheral route
to persuasion since a typical placement does not focus on the strong message argument
per se, but rather on the presentation of the brand on set, or the subtle TV character
endorsement of the placed brand.
The ELM is based on the two most influential factors that affect which processing route a
message recipient uses, namely motivation and ability (Petty et al., 1983:139; Petty &
Cacioppo, 1986:5). Motivation refers to the individual’s desire to process the message
and the extent of motivation, in turn, is affected by attitude towards the message, personal
relevance as well as the individual’s need for cognition (Kunda, 1990:482). The ELM
further posits that a person’s motivation is affected by the message’s personal relevance,
thereby suggesting that, consumers are likely to elaborate on the message that relates to
their current circumstances (Petty et al., 1983:135). In addition, regardless of the
message’s personal relevance, some individuals take pleasure in cognitive thinking which
may also affect the extent of their motivation to elaborate on a persuasive message (Petty
& Cacioppo, 1986:5).
The second determinant of the ELM’s route is the individual’s ability to process the
persuasive message. This includes the availability of cognitive resources such as the
presence or absence of time pressures or distractions, and the relevant knowledge
39
required to evaluate the message argument (Miller, 2005:129). Distractions such as
channel surfing during advertisements on TV can affect a person's ability to process a
message (Williams et al., 2011:2). Moreover, cognitive busyness, which can also serve
as distractions, inhibits an amount of cognitive resources otherwise available for the
elaboration (Griffin, 2012:205). Another factor of ability is a person's knowledge of the
relevant subject. Although one may not be distracted nor cognitively busy, their
insufficiency in knowledge can limit them from engaging in high involvement elaboration
(Petty et al., 1983:135).
Kruglanski and Van Lange (2012:224-245) delineate the four essential concepts to the
elaboration likelihood model of persuasion:
First, according to the ELM, when an individual encounters some form of
communication, he/she can process this communication applying varying levels of
thought (elaboration), ranging from a low degree of thought (low elaboration) to a
high degree of thought (high elaboration).
Secondly, according to the ELM, there are different psychological processes of
change that operate to varying degrees as a function of an individual's level of
elaboration. Relatively little thought is required on the lower end of the continuum
processes, including classical conditioning and mere exposure. In contrast, on the
higher end of the continuum, relatively more thought is required, including
expectancy-value and cognitive response processes. An individual is said to be
using the peripheral route when lower elaboration processes predominate and the
central route when higher elaboration processes predominate.
Thirdly, according to the ELM, how consequential the resultant attitude becomes
depends on the degree of thought used in a persuasion context. Therefore, attitudes
that are formed through central route processes tend to persist over time, resist
persuasion, and be influential in guiding other judgments and behaviours to a
greater extent than attitudes formed through low thought, peripheral route
processes.
Lastly, according to the ELM, any given variable may have multiple roles to
persuasion, including acting as a cue to judgment or by biasing the direction of

40
thought about a message. The ELM assumes that the specific role by which a
variable operates is determined by the extent of elaboration.
The ELM has been applied in various fields including advertising, marketing and
consumer behaviour (Petty et al., 1983:135) and has proven to be the theory that could
offer an explanation on attitude change that most researchers could not.
The next section of this chapter turns its attention towards advertising as an attitude object
in order to fulfil the theoretical objectives of this study as set out in Section 1.3.2 of the
previous chapter.
2.7 STRUCTURE OF ATTITUDE TOWARDS ADVERTISING (AG)
Numerous studies have been conducted globally over the years on attitudes towards
advertising in general (AG), in an attempt to understand advertising effectiveness (Larkin,
1977; Pollay & Mittal, 1993; Mehta & Purvis, 1995; Eze & Lee, 2012). Many of these
studies point out that attitudes towards advertising is an important construct for further
examination as it an important and valid predictor of advertising outcomes. It is therefore
not surprising that this construct is a reoccurring topic in advertising research to date as
is remains an important construct to consider in theoretical explanations of advertising
effectiveness (Jin & Lutz, 2013:343).
AG has been posited to predict consumers’ level of involvement or engagement with
advertisements during exposure (James & Kover, 1992:80). Moreover, the construct has
been postulated to be an underlying determinant of the attitudes toward specific
advertisements (Lutz 1985:46), advertising attitudes, in turn, affect brand attitudes
(MacKenzie et al., 1986:130; MacKenzie & Lutz, 1989:51). In addition, AG has also
garnered significant academic attention because of its implications for public policy
initiatives especially those aimed at protecting consumers from the negative effects of
advertising (Mittal, 1994:5).
According to Zanot (1984:5), consumer attitudes toward advertising were mixed during
the 1960s and showed a downward trend since the 1970s. In contrast, Shavitt et al.
(1998:7) reported different findings claiming that consumers’ attitudes were in fact more
favourable than previous data had suggested. These contradictions had been previously

41
attributed to, amongst others, incorrect theoretical conceptualisations for operational
ease (Olson & Mitchell, 1975:250). On the other hand, O’Donohoe (1995:250) point out
that these attitudinal ambivalences depend on the type of media being examined.
Evidently, it can be argued that the fundamental problem with the measurement of attitude
towards advertising rests with the definition of the concept (Tan & Chia, 2007:360;
Dianoux et al., 2014:87).
AG is not specific, so that a type of selection bias is likely to occur when consumers
respond to advertising attitudes measurement scales. Jin and Lutz (2014:345) argue this
selection bias is not random, but rather systematic, as consumers may perceive certain
types of advertising as more typical (more likely to be advertising) and others as less
typical (less likely to be advertising). The authors further argue that this often leads to
selection bias in that the most typical type of advertising is activated as top-of-mind when
attitudes are being assessed, which, in turn, affects the observed results.
Notwithstanding other preceding studies, the seminal work by Bauer and Greyser (1968)
is considered the most comprehensive that focused on the topic of AG. Numerous studies
have since then adopted, replicated, modified and extended upon the structural model
such as, inter alia Larkin (1977), Sandage and Leckenby (1980), Reid and Soley (1982),
Muehling (1987), Andrews (1989), Pollay and Mittal (1993), Mehta and Purvis (1995),
Shavitt et al. (1998), Mumusamy and Wong (2007), Eze and Lee (2012) to gain more
understanding on how consumers react to advertising in general.
Based on the Bauer and Greyser (1968) conceptualisation, therefore, this study defines
attitudes toward advertising in general as a learned predisposition to respond in a
consistently favourable or unfavourable manner toward advertising in general (Lutz,
1985:53; MacKenzie & Lutz, 1989:51). Pollay and Mittal (1993:101) add that such
attitudes can be predicted by beliefs about advertising, which can be described as specific
statements about the attributes of an attitude object. This is consistent with the previous
contextualisation by Ajzen and Fishbein (1977:888) that a belief is an expressed
likelihood that an “object” (such as product placement) possesses or is associated with
an “attribute” (such as, entertaining or manipulative). This, therefore, suggests that a
belief must be combined with an evaluative factor before it can be said to represent an
attitude and that studies that undertake to investigate consumer attitudes toward a

42
specific object are basically dealing with beliefs about that particular object (Muehling,
1987:33).
The study by Bauer and Greyser (1968) assessed beliefs and attitudes about advertising
systematically as a two-dimensional construct. Their study proposed that the construct
can be better understood as comprising two major dimensions. AG is made up of the
institutional component as well as instrumental component, whereby the institutional
component has been operationalised as the social and economic functions that society
has assigned to the institution of advertising while the instrument component has been
operationalised as the executional qualities and inadequacies of advertising’s instrument
(Sandage & Leckenby, 1980:30).
Moreover, apart from the structural attitude model proposed by Lutz (1985:50) where he
posits that AG is an antecedent to attitude towards the advertisement, extensive research
has examined the structural attitude models mainly in terms of the belief dimensions
forming attitudes towards advertising. These dimensions have been classified into two
levels of attitudinal beliefs referred to as specific beliefs as well as generalised beliefs of
advertising (Tan & Chia, 2007:354-355).
Nevertheless, O’Donohoe (1995:250) previously concluded in a comprehensive study,
that reviewed both American and British research on attitude towards advertising. Despite
different dimensions found or terminologies used to describe the various dimensions, a
consensus could be reached that AG comprises two levels of attitudinal beliefs, namely
personal experience of advertising and the macro level type of beliefs.
O’Donohoe (1995:251) further marked out the personal experience dimension of
advertising beliefs as comprising items such as perceptions of advertising’s entertainment
and information value, attitudes towards advertising in different media and for different
products, wariness of advertising’s persuasive or manipulative qualities as well as
perceptions of its repetitive nature.
In addition, for the belief dimensions regarding the institution of advertising, O’Donohoe
(1995:250) included beliefs about the economic and social effects of advertising.

43
Figure 2-5 is adopted to depict the constructs used by O’Donohoe (1995) in her proposed
structural model of AG.
Figure 2-5 Structural model of AG
Source: O'Donohoe (1995:251)
For the economic and social effect of advertising, O’Donohoe (1995:250) adopted a two-
dimensional scale developed by Bauer and Greyser (1968), where the economic
construct refers to the role advertising plays in enhancing an economy and how significant
advertising contributes to the living standards of the population in a country. The social
construct is said to establish the degree to which advertising influences the values and
lifestyles of consumers (Greyser, 1972:33). The economic construct in the Bauer and
Greyser (1968) study was measured using statements such as, “advertising helps raise
our standard of living”, “advertising results in better products for the public”, and
“advertising results in lower prices”. To measure the social dimension, they use the
following statements, namely “advertising persuades people to buy things they should not
buy”, “most advertising insults the intelligence of the average consumer”, and
“advertisements present a true picture of the product advertised”.
Given the definition and conceptualisation of AG, however, the question that should be
asked is what AG means to respondents when responding to studies measuring attitudes
towards advertising. While researchers may intend to measure generalised attitudes
Entertainment and
information value
Aadv in different
media/products
Ad persuasive/
manipulative effect Ad repetition effect
General attitude towards advertising
Social dimensions Economic
dimensions

44
towards advertising in such studies, evidence suggests that respondents tend to have a
mental representation of what advertising is and thus respond to the AG measurement
from varied frames of references, which then potentially negates the intended objective
(Tan & Chia, 2007:357; Jin & Lutz, 2013:345). This accentuates the importance for
researchers to further study the concept of AG and clarify its meaning to say with
confidence that they know what they are measuring.
Following a categorisation by Triandis (1971:65) that attitudes are recognised as
categories of beliefs that can be rank-ordered from the abstract to the concrete, Tan and
Chia (2007:352) argue that consumers hold AG at different abstraction levels, ranging
from the abstract beliefs to the more concrete beliefs about advertising. This line of
thinking is also consistent with O’Donohoe’s (1995:250) classification of advertising
attitudes into generalised and more specific (personal experience) attitudinal beliefs. In
their conceptual model, Tan and Chia (2007:353) propose that different extent belief
dimensions support different levels of attitude towards advertising ranging from specific
attitudes to the more abstract attitudes. Their model endeavoured to explore the
relationship between general attitude towards advertising and attitude towards
advertising in specific media (print and TV). They propose that attitude toward advertising
is an abstract/macro-level construct while, in contrast, attitude toward advertising in
specific media is a personal experience based construct.
Furthermore, Tan and Chia (2007:365) criticise past research on attitudes toward
advertising by pointing out the fact that such studies examined only the abstract levels of
attitudes (for example, Zanot, 1984; Shavitt et al., 1998; Schlosser et al., 1999; Mehta,
2000); thereby, creating a gap in the study of consumer attitudes toward advertising. They
further caution that previous research models created by Bauer and Greyser (1968), as
well as subsequent studies that utilised the Bauer and Greyser (1968) model, such as
Sandage and Leckenby (1980), Muehling (1987) and Pollay and Mittal (1993) may well
be changed with the inclusion of the media constructs into the traditional AG model in
order to get a more thorough understanding of how consumers react to advertising in
general, as well as in specific media. This is based on the rationale that consumers hold
different expectations about different media, such as information value from print media

45
and entertainment from broadcast media (Speck & Elliot, 1997:65; Shavitt et al., 1998:9).
Figure 2-6 depicts the framework as proposed in their study.
Figure 2-6 Framework for the relationships between attitude towards advertising
in general and attitudes toward advertising in specific media
Source: Tan and Chia (2007:354)
Based on the above proposed framework, the personal experience and generalised belief
constructs of product information, hedonic/pleasure, falsity/no sense, good for the
economy, and materialism were adopted from the Pollay and Mittal’s (1993:100) study
except for dimensions that measured attitudes toward TV and print advertising, which
were adopted from Mittal (1994:9). The major benefit of the Pollay and Mittal model is
that it can be used to study consumers’ attitudes towards advertising in general (Petrovici
& Marinov, 2007:307; Eze & Lee, 2012:94) and, in some cases, may be adapted to study
consumers’ attitudes towards advertising in a specific media (Speck & Elliott, 1997:70;
Shavitt et al., 1998:9; Jin & Lutz, 2013:345). It, therefore, can be argued that the inclusion
of the media construct into the traditional model of AG bears significant contribution to
the advertising literature as it helps explain some of the ambivalences reported by past
research. The following section reviews the structure of attitudes toward the
advertisement and its relationship with AG.
Abstract
Specific
General attitudes
towards
advertising (AG)
Macro level shared
beliefs
Materialism, good
for the economy
Specific attitude
towards TV
advertising
Specific attitude
towards print
advertising
Personal experience
factors:
Product information,
hedonic, falsity, no
sense, social image

46
2.8 STRUCTURE OF ATTITUDES TOWARD THE AD MODEL
(Aad)
In an endeavour to understand the effect of advertising on consumers’ reactions toward
various market offerings, considerable attention has been paid to the topic of attitude
toward the ad and the role that it plays in advertising effectiveness. According to Lutz
(1985:48), attitude toward the advertisement (Aad), can be defined as a predisposition to
respond in a favourable or unfavourable manner toward a particular advertising stimulus
during a particular exposure occasion. Aad has two different components, namely an
affective component reflecting the emotions evoked by the ad and a cognitive component
reflecting executional qualities of the advertisement, as well as the message content
thereof (Shimp, 1981:10; MacKenzie & Lutz, 1989:49). The Aad model postulates that
the recipients of an advertising message develop an attitude toward the advertisement,
which, in turn, exerts an influence on subsequent measures of advertising effectiveness
such as brand attitude and purchase intentions (Shimp, 1981:10; Lutz et al., 1983:533;
Lutz, 1985:49; MacKenzie et al., 1986:135; Muehling, 1987:35; MacKenzie & Lutz,
1989:89;
Mehta, 2000:69; Dianoux et al., 2014:88).
The Aad model highlights the influence of an advertisement, either in digital, print or in
audio-visual on the formation of an individual’s attitude towards product and service
offerings and/or brands. The theory behind the model states that consumers form
judgments and feelings subsequent to exposure to an advertisement. In addition to the
formation of attitudes towards the advertisement, consumers are posited to further
formulate opinions and judgements about the advertised brand (Raluca & Ioan,
2010:729). The model proposes that consumers’ affect (feelings) and (cognition)
judgements are formulated as a direct result of exposure to an advertisement, which,
therefore, affects their attitude toward the advertisement itself, which, in turn, affects the
consumers’ attitude toward the advertised product or brand. The brand cognitions are
then reported to affect the consumers’ assessment of the likelihood that the product or
brand will be purchased in the future (Lutz, 1985:50)
In their conceptual framework, MacKenzie and Lutz (1989:51) posit that there are four
competing explanations for the impact of attitude toward the advertisement on purchase

47
intentions. All four structural models are based on a general hierarchy-of-effects
framework, which postulates that cognitions act as predictors of attitudes, and then
behavioural responses such as purchase intentions (Lutz et al., 1983:533). For example,
in each of the four alternatives, advertisement cognitions influence attitude toward the
advertisement, and brand cognitions influence brand attitude. Each of these attitudes
ultimately has linkages with purchase intentions, depending on the role of attitude toward
the advertisement.
The four alternative models of advertising attitude describe the way in which antecedent
variables relate to advertising outcomes and are mediated by attitude toward advertising.
These four models are referred to as the affect transfer (ATH), dual mediation (DMH),
reciprocal mediation (RMH), and independent influences (IIH) hypotheses (Dianourx et
al., 2014:89). ATH assumes a direct one-way causal influence of Aad on attitude towards
the brand (Mitchell & Olson, 1981:320; Shimp, 1981:85). On the other hand, DMH
explains both of direct one-way causal influence and indirect one-way causal influence,
whereby, the indirect one-way causal influence indicates that brand cognitions connect
Aad affects to attitudes towards the brand and direct one-way causal influence refers to
the process proposed by ATH. DMH is in accordance to the traditional communication’s
theory treatment of message source, as proposed by MacKenzie and Lutz (1989:50).
This suggests that consumers' affective response to an advertisement has an influence
on their propensity to accept the advertisement claims that relate to the brand. In other
words, the more favourable consumers’ feelings are towards the advertisement, the more
they remember the claims made in the advertisement. As such, it may be assumed that
there is a relationship between Aad and brand cognitions (Holbrook, 1978:545).
RMH, in comparison, assumes that Aad and brand attitude influence each other. RMH is
based on a balance theory introduced by Heider (1946), which postulates that individuals
attempt to maintain the cognitive balance in that a balanced configuration exists if
attitudes towards the parts of a causal unit are similar (Heider, 1946:109).
The IIH assumes that there is no relationship between Aad and brand attitudes. According
to this theory, both Aad and brand attitudes independently influence purchase intention
(Gorn, 1982:96). The IIH theory is founded on a modification of the distinction between
brand concept (that is, brand attitudes) and impersonal attitude (that is, attitude towards
the conditions of purchase) that was put forward by Howard (1977:1), who opined that

48
situational pressures such as availability and deals play a salient part in a purchase. In
the advertising exposure setting, the construction of Aad may represent one of those
situational variables (Gorm, 1982:96). A comprehensive discussion of these models can
be reviewed from earlier research by Lutz (1975).
In order to comprehend how the Aad influences brand attitude it is necessary to determine
the kind of attitudes consumers develop towards the advertisement itself. If the feelings
that the advertisement create are positive and if the way the advertisement is made and
the information in it are evaluated favourably, then the advertisement should result in a
favourable attitude (Raluca & Ioan, 2010:730). An advertisement can thus be liked either
because of its entertaining value or because it is considered useful, or both. In the call to
determine the origins of Aad, therefore, MacKenzie and Lutz (1989:51-53) propose the
structural antecedents of Aad as consisting of advertisement credibility, advertisement
perceptions, attitudes toward the advertiser, attitudes toward advertising and the
consumer’s mood.
Brown and Stayman (1992:37), further postulate that Aad is influenced by the attitude
towards advertisements in general, as well as attitude towards the message source (that
is, the advertiser), the viewer’s mood, the feelings the advertisement evokes, the viewer’s
evaluation of the advertisement’s format and the perceived the credibility of the
advertisement. In the opinion of Solomon et al. (2012:23) the determining factors that
affect Aad as attitude toward advertiser include evaluation of the message format, the
viewer’s mood, the feelings the advertisement evokes with the viewer, the
advertisement’s ability of the to elicit reactions on the part of the consumer. Similarly,
Dobre (2005:172) suggests a framework for Aad by identifying a series of specific
perceptual factors for each type of reaction, namely positive cognitive reactions
(relevance, credibility, creativity, realism, familiarity and/or imagination), negative
cognitive reactions (confusion, hate), positive affective reactions (entertainment, humour,
activity, vitality, liking, sensuousness, empathy) and negative affective reactions (irritation
& sluggishness).
Another factor, which has an influence on the impact of Aad on brand attitudes is the
consumer’s level of involvement with the purchase decision (Raluca & Loan, 2010:730;
Jin & Lutz, 2013:343). According to the ELM (see previous section), the influence of

49
peripheral cues on brand attitudes increases under low-involvement conditions, thereby
suggesting that the effect of Aad on brand attitudes is greater under low-involvement
conditions because the feelings that play a major part in shaping Aad are considered to
be peripheral cues (Homer, 1990:78). It is important to note the apparent lack of empirical
consensus in this regard; nevertheless, MacKenzie and Lutz (1989:51) posit that Aad
affects brand attitudes under both high-involvement and low-involvement conditions
based on their proposed structural antecedents of Aad as consumers require both central
and peripheral processing of the advertisement message.
Despite the inclusion of specific media in the measurement of AG, there is evidence to
suggest that TV advertising remains the most typical form of advertising to which
consumers are exposed (Jin & Lutz, 2013:343). This was apparent in a study by Shavitt
et al. (1998:9) who measured Aad in selected advertising media such as TV, catalogue,
classified advertisements, radio, and outdoor along with advertising in general.
Interestingly, the consumers’ evaluations of AG, in many cases, closely resembled those
for TV advertising. Similarly, Tan and Chia (2007:343) suggest that when consumers are
asked to evaluate AG, TV advertising was the frame of reference likely used. Evidently,
the measurement of AG implicitly reflects the measurement of attitudes towards TV
advertising. This merely accentuates the importance of proper conceptualisation when
dealing with consumers’ attitudes toward advertising, especially since the advent of new
technology has extended the advertising scope to include new marketing communication
tools such as social media and product placement among others.
Therefore, whilst the relationships between AG and Aad have been established in the
advertising literature and the influence of Aad on brand attitudes and purchase intentions,
the important role of specific media/platform has also been established. Even though the
measurement of AG might be interesting, some researchers may argue that it bears little
managerial significance, hence, the call to further examine the concept in specific
contexts (Tan & Chia, 2007:358; Jin & Lutz, 2013:349; Dianourx et al., 2014:5). Similarly,
the purpose of this study is not to measure AG in particular, but rather to examine Aad in
the context of product placement as another form of advertising (Sung et al., 2009:257).

50
2.9 CONCLUSION
It has been established that attitude have indeed long been considered a central concept
of social psychology, with authors such as Thomas and Znaniecki (1918:2) among others
having defined the social psychology as a scientific study of attitudes. Many findings in
attitude research have also indicated that self-reports of attitudes are largely contextual.
In fact, such attitude measurements are a mere construction of evaluative judgements by
consumers at the time they are surveyed, based on the information they are able to
access at that point.
With a further caution by Mitchell and Olson (1981:320) on some researchers who are
guilty of inaccurate conceptualisation for operational ease, many inconsistencies and
difficulties have surfaced in the quest to develop theories of attitude formation and
structure over the years. This may explain some of the reported ambivalences in
attitudinal researches reviewed by O’Donohoe (2001:93). Moreover, following a
categorisation by Triandis (1971:66), that attitudes are a set of evaluative beliefs about
the attitude object which can be rank-ordered from the abstract level to the very concrete
as well as the contextual nature of attitudes, researchers may reduce the measurement
inconsistencies by asking specific questions instead of generic/abstract questions as
respondents would be susceptible to responding according to their individualised frame
of references, thereby subjecting the studies to various measurement errors (Tan & Chia,
2007:355).
A review of the attitude toward the advertising literature was pertinent in this chapter so
as to achieve the theoretical objective of this study as articulated in Section 1.3.2. Indeed,
product placement is a form of advertising (Gupta & Gould, 1997:38) and many proposed
frameworks in that regard are mostly extensions of the attitudes towards advertising
literature. Moreover, the framework for this study was grounded in the MacKenzie and
Lutz’s (1989:50) structural model of attitudes towards the advertisement. Furthermore,
the study was structured from a perspective of the Vakratsas and Ambler (1999) study on
how advertising works. The authors in that regard posit that advertising effectiveness
should be looked at from the impact it has on consumers; hence, the chapter conducted
a review on the structure and various formations of attitudes. This approach is posited to
benefit marketers on their various media strategies (Vakratsas & Ambler, 1999:26). In

51
fact, the need to take into consideration media differences is important, particularly with
the advent of new advertising media such as product placement, as people hold different
expectations about different media (Tan & Chia, 2007:353).
Finally, the efforts by advertisers to capture consumer attention to their commercial
messages are a continuous endeavour. Studies have determined that media consumers
typically have positive perceptions of advertising. That being said, consumers’ positive
attitudes are limited in certain products, media genres, executional tactics, and
demographic variables (Gupta & Gould, 1997:38; Sung et al., 2009:258). Therefore, the
next chapter addresses the above by reviewing literature on Generation Y and their
attitudes toward product placement, especially since studies have shown that an
individual’s predisposition to avoid advertisements in a medium is related to categorical
beliefs and perceptions about them (Cronin & Menelly, 1992:2; Speck & Elliot, 1997:63).

52
CHAPTER 3 PRODUCT PLACEMENT AND GENERATION Y
3.1 INTRODUCTION
Chapter 2 reviewed the literature on consumers’ attitude formation and change, as well
as consumer attitudes toward advertising, in keeping with the first and second theoretical
objectives of this study as laid out in Section 1.3.2 of the first chapter. Past research has
identified attitude toward the advertisement as an important constructs mediating the
effect of brand attitude and purchase intentions (MacKenzie & Lutz, 1989:50). The
authors went on to further propose and test the structural antecedents of attitudes towards
the advertisement. Product placement literature borrows from the same theory, as the
practice is another form of advertising (Balasubramanian et al., 2006:116).
It is evident that over recent years the traditional advertising industry has suffered some
setbacks due to media clutter, mass audience fragmentation, a growth in negative
consumer attitudes toward traditional advertising as well as their defence against TV
advertising by zipping and zapping through the use of digital recording systems
(Balasubramanian et al., 2006:116; Beneke, 2012:1069). According to Gutnik et al.
(2007:4), a group of 28 TV studios (including Disney, Paramount Pictures, ABC, NBC,
CBS, and others) sued SonicBlue, claiming that the company's commercial-skipping
technology in ReplayTV constituted a “contributory and vicarious infringement of plaintiff's
copyrights”. Indeed, two-thirds of American consumers were reported to cut the sound
during commercials, change channels or even skip them as they found them irrelevant
(Williams et al., 2011:5). The progressive loss of a passive audience, therefore, has
unequivocally challenged advertising professionals to seek more innovative and effective
solutions to brand communication strategies and product placement has presented itself
as such.
The purpose of this chapter is to propose a model of the factors influencing the South
African Generation Y students’ attitudes and behavioural responses towards product
placement in movies and TV shows. Leading up to this proposition, this chapter will
discuss product placement in terms of its definition, industry growth, purpose, strategies
as well as antecedents of product placement attitudes. This chapter first looks into the

53
Generation Y cohort. This is in keeping up with the third and fourth theoretical objectives
of the study as outlined in Section 1.3.2.
3.2 PROFILING GENERATION Y COHORT
The success of any business strategy depends on the ability of an organisation to clearly
understand its current and potential customers (Jang et al., 2011:804). The complexities
of market segmentation strategies or often result of the constantly changing business
landscape and the highly fragmented consumers with their heterogeneous needs and
desires (Williams et al., 2011:2). As such, remaining relevant necessitates that
organisations constantly strive to be in symbiosis with the ever-changing consumer
needs. While it may be useful for marketers to segment their customers in terms of age
demographics, Parment (2013:304) points out that generational cohort segmentation
provides both the stability of age segmentation as well as the insight into consumer
motivations, which are a result of their shared values, attitudes and beliefs. This section
explores the Generation Y student cohort as an elusive, but lucrative target segment for
marketing practitioners.
South Africa has gone through a complete metamorphosis in terms of its economic, social
as well as political system. During this transformation process, many organisations have
been slow to realise that such changes imply a need to make changes in business
practices as well. Typically, economic and political changes lead to social changes, which
ultimately result in changes in attitudes, preferences and consumer behaviour (Schewe
& Meredith, 2004:52; Bevan-Dye et al., 2009:172; Gardiner, Grace & King, 2014:706).
According to generational theory, four distinct generational cohorts can be distinguished,
namely the Silent Generation, Baby Boomers, Generation X and Generation Y (Bevan-
Dye, 2016:4), although recent studies have begun conceptualising Generation Z
(Lorgulescu, 2016:9; Priporas et al., 2017:374). Nevertheless, the focus of this section
examines Generation Y in part fulfilment of the objectives of this present study as
articulated in Section 1.3.2 of the first chapter.
Individuals born in the mid-1980s grew up in a new world order. In 2018, these individuals
make up a generation that constitutes the youth and are referred to as the Generation Y.
This generation, whose member are also referred to as Gen Y, genWHY, Millennials,

54
Echo Boomers, Born-Frees, Model-C and so on) describe an age demographic that was
born into the ‘new’ democratic South Africa (Bevan-Dye et al., 2012:5579; Bolton et al.,
2013:246).
While there is yet a consensus on the start and end date of a generational cohort, in part
mainly due to a lack of agreement as to the length of a cohort, Schewe and Meredith
(2004:52) assert that a generational cohort may be defined by the events that shape it. In
an attempt for more specificity, however, Markert (2004:21) instead defines/categorises
a generational cohort into 20-year increments, which he further sub-divides into 10-year
cohorts (Parment, 2013:305; Bevan-Dye & Akpojivi, 2016:116). Therefore, South
African Generation Y cohort is, thus, for the purpose of this study defined as those
members born between 1986 and 2006, as proposed by Market (2004:21)
According to the South African mid-year population estimates, in 2018, approximately
20.28 million of South Africa’s population of 57.72 million fell into the Generation Y cohort,
accounting for approximately 35 percent of the country’s population (Statistics South
Africa, 2018). The size and growth estimates of this generational segment, together with
the increased opportunities afforded to them when compared to members of previous
generations, suggests that members this generation represent a significantly lucrative
target segment for marketers (Wolburg & Pokrywcznski, 2001:33; Kueh & Voon,
2007:657; Rahman & Azhar, 2011:93; Bevan-Dye, 2016:5; Canavan, 2018:184). This is
most especially true with reference to Generation Y university students and university
graduates in that a university degree is often associated with future success, high earning
potential and wealth creation (Bevan-Dye, 2016:5).
In comparison to other generations, Generation Y has a higher disposable income and,
as such, more disposable money to spend (Thompson et al., 2018:158). In the United
States alone, Generation Y spends over US$200 billion annually on personal
consumption and their net income is expected to exceed that of the preceding generations
by 2018 (Priporas et al., 2017:375). With an estimated global spend of US$2.45 trillion in
2015 (Thompson et al., 2018:158), this cohort is described as highly “powerful and
influential” (Bevan-Dye, 2016;4; Thompson et al., 2018;158). In addition, Generation Y
exerts a strong influence on parental and household spending, which means that they
influence the purchasing behaviour of members of other generations (Priporas et al.,

55
2017:375). Overall, Generation Y represents a highly profitable and lucrative market
segment, both currently and in the future. From a marketing standpoint it is important to
understand that Generation Y’s unique relationships with brands, their power to influence
marketers and marketing strategies, as well as their peers, together with their love of
technology and technological prowess are instrumental in reshaping the market
landscape (Bolton et al., 2013:246; Thompson et al., 2018:160).
As noted by Parment (2013:305-306), the early cohort of Generation Y’s (individuals born
between 1986 and 1995) formative years were marked by a period of economic growth,
the advent and rapid popularisation of social media and reality TV shows, and the fading
of modernist values, supported by ever-increasing globalisation and strong influences
from popular culture. This generation is a confident, optimistic group whose members
feels empowered to take positive action when things go wrong, and who have multi-
tasking abilities due to their high speed and energy (Williams et al., 2017:111). Members
of Generation Y are characterised as being generally optimistic, technologically astute,
casual and fun loving (Wang et al., 2015:571). A significant portion of their daily activities
is mediated by the use of digital technologies, including social interactions and
entertainment via online social media. They are often referred to as digital natives, given
that they grew up in the digital age and have never really experienced any other way of
life (Hills et al., 2017:12).
Indeed, members of this generation possess unique characteristics as compared to their
generational predecessors, which present unique challenges and opportunities for
marketers trying to reach them, but the key formative characteristic of this generation
cohort is its early exposure to technology, which has empowered them with information
and rendered them impervious to traditional advertising media (Bolton et al., 2013:246).
An understanding of this segment for marketers is pertinent as advertising budgets, media
planning and precision targeting would be key in successful brand communication
strategies. The student Generation Y cohort has been identified as the highest consumers
of entertainment media, making them especially lucrative for targeting (Williams et al.,
2011:3; Bevan-Dye, 2016:4; PWC, 2017).
According to a report by Price Water Coopers (PWC, 2017), South Africa will see a
continued annual growth rate of 7.2 percent for consumer revenue over the forecast

56
period, increasing from R87.4 billion in 2016 to R123.7 billion in 2021. Unsurprisingly, the
largest contributor will be Internet access, with a 48 percent share in 2016 increasing to
56 percent in 2021. Even though entertainment and media companies may appear
justifiably threatened by the expectation of free content seemingly created on the Internet,
there are many consumer revenue opportunities enabled by the Internet’s ubiquitous
nature. These may stem from subscriber video on demand (SVOD) such as Netflix,
transaction video on demand (TVOD) such as iTunes, advertised video on demand
(AVOD) such as YouTube, and music streaming to the rapidly expanding social/casual
gaming environment and new virtual reality (VR) market (PWC, 2017). The Table 3-1
details the South African entertainment media consumption from 2016-2021.
Table 3-1 South African entertainment and media spending 2016-2021
(R millions)
2016
2017
2018
2019
2020
2021
CAGR %
2016-21
Books 3 821 3 842 3 863 3 881 3 886 3 891 0.4%
B2B 4 905 5 094 5 252 5 396 5 517 5 611 2.7%
Cinema 1 169 1 133 1 172 1 215 1 256 1 296 2.1%
Internet 42 298 49 744 56 219 61 595 65 915 69 319 10.4%
Magazine 5 310 5 118 4 970 4 845 4 721 4 608 -2.8%
Music 1 885 1 942 2 031 2 134 2 251 2 355 4.6%
Newspaper 2 643 2 606 2 553 2 486 2 406 2 315 -2.6%
TV & Video 23 194 24 365 25 942 27 092 28 109 29 022 4.6%

57
Table 3-1 South African entertainment and media spending 2016-2021
(R millions) (continued …)
2016
2017
2018
2019
2020
2021
CAGR %
2016-21
Video games 2 581 3 009 3 499 4 039 4 634 5 317 15.6%
E-sports 3 5 7 9 11 14 32.5%
VR 30 84 212 305 367 455 72.6%
Total consumer 87 383 96 468 105 231 112 498 118 564 123 690
YOY growth
(%)
13.7%
10.4%
9.1%
6.9%
5.4%
4.3%
7.5%
Source: PWC (2017)
Notwithstanding the impact of digital entertainment media over the years and in future, it
can be deduced from Table 3-1 that consumers in South Africa continue to spend heavily
on TV based media and are expected to continue this trend into the future. This clearly
presents a challenge to South African marketers with regards to their budgetary
allocations on various integrated marketing communication strategies going forward.
Nevertheless, regardless of the entertainment platform, product placement no doubt
presents widespread opportunities for brand communication strategies of the present and
future.
With regards to their consumption patterns, Generation Y has been brought up in an era
where shopping is not regarded as a simple act of purchase, but rather of an
entertainment oriented experience (Thompson et al., 2018:4). These members are said
to have been socialised in a materialistic society (Bevan-Dye et al., 2012:5578; Duh,
2016:134) and having extensive social networks (Parment, 2013:190). In addition,
members of Generation Y are accustomed to making decisions faster and with less
deliberation than members of other generations and are swifter at adopting new
opportunities (Parment, 2013:190). As a result, individuals of this cohort make more
frequent and more impulsive purchases than previous generation consumers.

58
Given the vast amount of information at their disposal, advertising scepticism and the
many brand choices these consumers have to make, brand loyalty has been shown to be
low among Generation Y members. As such, marketers have been encouraged to
stimulate brand loyalty through innovative means such as social media, mobile games
and other brand identification strategies that may help this segment to connect with the
brand (Balakrishnan et al., 2014:178; Ordun, 2015:41). The use of product placement
strategies present alternative tools as brands may be placed in various media platforms
as outlined in earlier discussions.
In addition, significant portions of the total discretionary income are reported to be spent
on product categories such as fast foods, gadgets, entertainment, alcohol, cosmetics,
fashion and so on, and that this segment is influenced mostly by celebrity endorsements
and non-traditional advertising media such as product placement (Tiwsakul & Hackley,
2005:97; Kit & P’ng, 2014:138).
It is worth noting that members of this generation dislike being patronised and are less
likely to be influenced by advertising, mostly because they are aware of the marketing
activities imposed on them. That being said, they do appear to have a positive attitude
towards shopping, and even though they display lack of loyalty as compared to their Baby
Boomers and Generation X predecessors, they are brand conscious. Other
characteristics associated with this generation include being family centrism and
achievement oriented, having a short attention span, craving attention and indulging in
disruptive behaviour. They are also characterised as being globally and environmentally
conscious, having a low boredom threshold and, perhaps most pertinent to this study,
being mistrustful of the media (Rahman & Azhar, 2011:93-96). The next section
conceptualises product placement and discusses it in the context of movies and TV
shows.
3.3 PRODUCT PLACEMENT CONCEPTUALISATION
Product placement involves the inclusion of brands in fiction/nonfiction medium in order
to stimulate consumer awareness and interest in the placed product. Nebenzahl and
Secunda (1993:2) define product placement as “the inclusion of a brand name, product
package, signage or other trademark merchandise within a motion picture TV show or

59
music video”. Along the same lines, Balasubramanian (1994:31) defines this strategy as
“a paid product message aimed at influencing movie or TV audiences via a planned and
unobtrusive entry of a branded product into a movie or TV programme”. Similarly, Karrh
(1998:34) presents his rendition of the product placement definition as “a paid inclusion
of branded products or brand identifiers through audio and/or visual means within mass
media programmes”.
These versions were the widely used definitions in the product placement literature but
soon became obsolete, especially with further research and shifts towards the inclusion
of new media context, Subsequently, Russell and Belch (2005:74) redefined product
placement as the purposeful inclusion of a brand into entertainment content. As alluded
to in Chapter 1, product placement is not a new marketing phenomenon; in fact, the
practice can be traced as far back as the late 1890s, with the deliberate inclusion of a box
of Unilever’s Sunlight soap in various Lumière movies (Sung et al., 2009:257).
After the placement of Reese's Pieces products in the movie (E. T. 1982), significant
interest sparked among both Hollywood and marketers especially after Hershey
management attributed more than 65 percent increase in Reese's Pieces’ sales to this
placement (Newel et al., 2006:576). Consequently, other marketers realised the benefits
of associating their brands with popular TV programmes and actors and have since then
sought to replicate the practise using brands of their own (Gutnik et al., 2007:4). In the
pursuit of these benefits, the prominent roles for brands in entertainment content
transcended to other entertainment media such as trending music videos (Schemer et
al., 2008:923), popular novels (Nebenzahl & Secunda, 1993:1),video games (Nelson et
al., 2004:3), musicals (Hudson & Hudson, 2006:490), and even reality TV shows, which
significantly increased opportunities for brand placement because their format typically
relies on a brand and its sponsor (Balasubramanian et al., 2006:116).
This study will, however, focus on the South African Generation Y movie and TV audience
as placements based on different media platforms presents different consumer attitude
structures and advertising, and value creation models. This is supported further by the
Tan and Chia (2007:357) model, which points out the significance of measuring specific
attitudes rather than generic attitudes, a categorisation adopted from Triandis (1971:66).
Movies and TV shows, therefore, will be operationalised as a single construct.

60
The placement of products in movies and TV shows sparked both industry and academic
interest as TV still presents the largest entertainment media today and a significant
portion of the product placement budget still goes to movies and TV shows such as soaps,
reality shows and TV series (PQ Media, 2018). Following the success of the E. T. (1982),
many placements have taken place on screen in too many instances to mention, including
movies such as Skyfall (2012), which was one of the movies to contain the highest
number of placements in a single movie.
3.4 PRODUCT PLACEMENT INDUSTRY
After the Hollywood industry revolutionised product placement in the 1980s, the global
product placement market has since then seen a significant growth. This resulted in an
equally significant academic interest as well, especially during the past two decades
(Babacan, 2012:1320). Product placement has indeed presented itself as a powerful tool
within the integrated marketing communications strategies and advertising professionals
accord that to date, no other advertising or consumer-driven media tactic compares to
the consistency, durability or growth trajectory that mark product placements (PQ Media,
2018).
According to a report by PQ Media (2018), globally, product placement revenues, which
encompass paid placements in TV, movies, Internet and mobile platforms, videogames,
music, and other media, increased at twice the rate of overall advertising and marketing
revenues in 2017 to exceed US$100 billion for the first time ever.
The United States conspicuously remains the largest product placement market by far.
Product placement market in this region rose 13.7 percent to US$8.78 billion in 2017 and
is moving towards a ninth consecutive year of double-digit growth in 2018, and its value
is estimated to reach US$11.44 billion by 2019 (Statista, 2018). This is, in part, due to the
increased value of brand integrations in live and on-demand TV, recorded music and
digital video (Mandes, 2014).
3.5 PURPOSE OF PRODUCT PLACEMENT
As noted by Williams et al. (2011:5), the ultimate goal of product placement among
various parties (for example, content producers, corporate brands and agencies),

61
primarily, is directly or indirectly financially motivated. Production companies use paid
product placements to generate revenues to significantly reduce their production budget.
This, in turn, allows them to reinvest the money elsewhere, while marketers use product
placements to drive purchase behaviour and ultimately sales. This is evident in the James
Bond movie Skyfall; whereby, Heineken is said to have spent US$45 million on brand
placements in the movie (Sung et al., 2009:257).
The strategy of product placement has several objectives. These include striving to
achieve prominent target audience exposure, visibility attention and interest, increasing
consumers’ brand awareness, memory and recall, creating instant brand recognition in
the media vehicle and at the point of purchase, positively changing consumers' attitudes
towards or overall evaluations of the brand, and changing the target audiences' purchase
behaviours and intent. In addition, product placement aims to create favourable
practitioners' views on brand placement, and improve consumers’ attitudes towards this
practice, as well as towards the various product placement vehicles (Panda, 2004;
Kureshi & Sood, 2010:23; Williams et al., 2011:5-7).
Overall, an understanding of the main purposes of product placement is pertinent to
marketers, as it will assist in developing appropriate product placement strategies. A
typical approach to an advertising campaign needs to have predetermined outcomes,
typically organised in three categories (cognitive, affective and conative outcomes)
consistent with the hierarchy of Effect model (Balasubramanian et al., 2006:131). These
factors are briefly outlined below.
3.5.1 Achieve prominent target audience exposure, visibility,
attention and interest
Owing to the inadequacies brought about by traditional advertising, marketers have since
had to face the challenges of declining revenues from investments in traditional
advertising and have had to seek out new and innovative strategies to attract consumer
attention and evoke interest in the brand. Having to contend with media clutter, less
captive audiences and advertisement skipping technologies, product placement seem to
present itself as a formidable alternative. As noted by Russell and Stern (2006:9), the
difference between traditional advertising and product placement is that with the former,

62
the viewers are instantly aware of the promotional messages communicated; whereas,
with the latter, promotional messages are blended into entertainment content, which then
makes it difficult for consumers to be aware of the promotional intent, let alone avoid
exposure to the promotional message. Moreover, tying a brand with a successful show
may result, not only, in longer shelf live, but significant attention and interest in the placed
brand by consumers (Williams et al., 2011:6)
Advertising reach refers to the number of consumers exposed at least once to a particular
advertisement out of the total/theoretical size of that consumer market (Dahlen &
Rosengren, 2016:335). The value of prominent brand exposure through product
placement is evident, especially when considering the impact on the brands. In the James
Bond movie (Tomorrow Never Dies, 1997), BMW is reported to have gained over 100
million dollars in audience exposure value due to its products (the Z3 car, the 15OILs and
the R1200c motorbike) being prominently associated with the movie character (Gould et
al., 2000:42). Similarly, in the music video platform, the Lady Gaga video, which contained
placements from Miracle Whip and Virgin Mobile, was viewed 62 million times and
updated 91.8 million times as of November 14, 2010 on YouTube (Williams et al., 2011:6).
The visibility and attention enjoyed by these placed brands are usually not coincidental
as moviemakers strategically place the brands into the script for a fee or some
promotional ties in an effort to offset production costs (Williams et al., 2011:6). Moreover,
Karrh (1998:68) had previously argued that the attention audiences pay to the
development of the scenes in movies and TV shows, as well as their emotional
involvement with the storyline cannot be equalled by any other type of brand
communication media. As a general rule, however, marketers have been cautioned that
the placed brands need to be visible for a long enough period to attract consumers’
attention and interest, but not so long as to annoy the viewers (Beneke, 2012:1069), a
paradox of product placement that South African marketers and TV industry seem to be
struggling with currently (Moerdykon, 2014; News24, 2014).
3.5.2 Increase brand awareness
Brand awareness refers to the number of people in a given population who know about a
specific brand or its message (Chi et al., 2009:135). Corniani (2001:72) further alludes to

63
brand awareness as a quantitative indicator that may vary according to a specific segment
of consumer’s familiarity with a particular brand. It is important to note, however, that the
effects of product placement on consumer brand awareness cannot be predetermined as
it is dependent on consumers’ reactions to the particular movie or show and such
reactions are further subject to various uncontrollable factors such as the movie/show’s
appeal (Kumar, 2017:165).
Another important consideration in this regard is the type of product to be placed as
product placement would not be typically suitable for the launch of new product as
optimum brand awareness is largely dependent on brand familiarity as well as the fact
that placements are meant to appear naturally and incidentally in to the content to mask
the promotional intent (Corniani, 2001:73; Nelson & McLeod, 2005:516; Chan et al.,
2016:6).
While product placement may be a riskier alternative, its successes seem to make a
compelling argument compared to traditional advertising. Priceonomics (2013) reported
that TV product placements have the ability to increase brand awareness by up to 20
percent and further claims have been made that the number can climb to 43 percent if
the placement is well integrated, especially into an emotionally engaging programme and
is associated with a likable character or celebrity. That being said, the numbers on
awareness or reach/frequency are not exact and the overall evaluation must be qualitative
rather than quantitative (Karrh, 1998:35).
3.5.3 Increase brand recognition and recall
According to Panda (2004), product placement indeed has a significant impact on brand
memory. The majority of studies regarding the effectiveness of product placement have
focused on memory-related measures whereby changes in product placement recall,
recognition and brand salience/brand awareness are examined, which are effects of
brand exposure (Cholinski, 2012:15; Priceonomics, 2014). Finding from most of these
empirical studies indeed support the notion that product placement boosts consumers’
brand recall and recognition (Babin & Carder, 1996:141; Gupta & Lord, 1998:49; Delorme
& Reid, 1999:71; Rössler & Bacher, 2002:100; Karrh, et al., 2003:140; Brennan et al.,
2004:3; Williams et al., 2011:6; Soba & Aydin, 2013:113).

64
Karrh (1998:35) indicates that product placement effectiveness measures are still
unsophisticated and that researchers rely on aided and unaided recognition and recall
tests of which advertisers are usually happy with a 25 percent correct recognition scores
for subtle placements. Even though a typical, brand recognition score is no more than 30
percent (Williams et al., 2011:6) other studies indicate that for audio only placements this
figure ranges from 50 to 75 percent while for visual placements only it ranges from 40 to
60 percent (Karrh, 1998:31). Moreover, consumers with advertisement skipping
technologies such as DVRs are also reported to being 38 percent less likely to recall
brands shown in TV advertisements, irrespective of whether they have skipped them or
not (Priceonomics, 2013).
3.5.4 Bring about desired changes in consumers' brand attitudes
As noted by Cholinski (2012:16), studies on the influence of product placement on
attitudes towards placed brands have revealed mixed findings over the last two product
placement decades and thus attracted significant academic interest. These findings can
be traced back to various academic works of the attitudes toward advertising literature as
reviewed in the previous chapter. Some of these studies reported no product placement
influence on attitudes (Karrh, 1998:31; Babin & Carder, 1996:140) or, in certain cases,
even a negative influence (Homer, 2009:25; Matthes et al., 2007:477; Schemer et al.,
2008:923; Cowley & Barron, 2008:89; Jeong et al., 2011:60). Nevertheless, most
empirical research in this regard conclude that product placement has a positive influence
on brand attitudes (Russell, 1998:357; Russell, 2002:308; Rössler & Bacher, 2002:100,
Sheehan & Guo, 2005:80; Matthes et al., 2007:477; Schemer et al., 2008:923; Cowley &
Barron, 2008:91).
Furthermore, initial studies suggest that consumers align their attitudes toward placed
products with the characters’ attitudes to the particular product as the process is driven
by the degree of consumers’ attachments to the character (Karrh, 1998:33; Nelson &
McLeod, 2005:517; Russell & Stern, 2006:10; Williams et al., 2011:7).
Therefore, an important question for academics and practitioners remains as to which
executional variables are instrumental in promoting product placement effectiveness to

65
positively change brand attitudes. This topic will be further reviewed later in this chapter
as it forms an important part of the objectives of this present study.
3.5.5 Bring about a change in the audiences' purchase
behaviours and intent
Similar to attitudinal studies, Cholinski (2012:15) also point out that studies regarding the
influence of product placement on purchase intentions and brand choice have also failed
to converge. Some studies have found that product placement has a positive influence
on purchase intentions and choice (Law & Braun, 2000:1060; Morton & Friedman,
2002:35; Auty & Lewis, 2004:697; Yang & Roskos-Ewoldsen, 2007:470), whilst other
studies found no significant influence (Ong, 1995:160; Van Reijmersdal, 2009:430).
Generally, product placement can influence purchase intentions and brand choice
positively, but this influence depends largely on the manner in which a brand is exposed
and the brand characteristics. However, it is evident that the impact of product placement
on consumers’ purchase intentions is a topic in need of further empirical examination and
the purpose of this study is to make a contribution in this regard. This construct will further
be reviewed in the next sections of this chapter as it forms one of the constructs under
examination for the proposed model of this present study.
Notwithstanding the ambiguous nature of some field and experimental studies research
results, evidence from various case studies have demonstrated the significant impact that
successful product placement has had on purchase intent, brand choice and actual sales
such as:
Reese's Pieces candy in the 1982 blockbuster movie E.T. significantly energised
both Hollywood and marketers especially after Hershey management attributed a
65 percent increase in Reese's Pieces sales to the placement (Newell et al.,
2006:576; Sung et al., 2009:259; De Gregorio & Sung, 2010:85).
Similarly, when Tom Cruise wore Bausch and Lomb’s Ray-Ban Wayfarer
sunglasses in the 1983 film Risky Business and the Aviator model in the 1986 film
Top Gun, sales reportedly increased significantly both times (Babacan et al.,
2012:1320)

66
Furthermore, the placement of Dairy Queen in The Apprentice, where the
contestants were required to create a promotional campaign for the Blizzard (a Dairy
Queen signature milkshake); during that week of the broadcast, Blizzard sales
increased by more than 30 percent. In addition, Website hits also increased
significantly on the corporate and Blizzard Fan Club sites as well as the Blizzard
promotional site (Karrh, 1998:31).
Tom Cruise worked his product placement magic once again, driving up sales of
Red Stripe beer by 50 percent in the US in 30 days through a very blatant placement
in the movie Sideways (2004) (Priceonomics, 2013).
BMW reportedly spent US$3 million integrating its Z3 into the 1995 Bond film
Golden Eye and then witnessed a US$240 million increase in sales of the model
as a direct result of the placement (De Gregorio & Sung, 2010:85), and the list
goes on.
3.5.6 Create favourable practitioners' views on brand placement
Even though some marketing practitioners are somewhat disinclined to acquiesce to
academic recommendations regarding product placements in movies and TV shows
(Craig-Lees et al., 2008:521) there is a universal accord that practitioners hold favourable
attitudes toward product placement in general as long as it does not harm the brand, bring
about sales and changes consumers’ perceptions about the brand (Williams et al.,
2011:7). This notion holds true, especially when the current product market and growth
rate is considered. Moreover, product placement brings necessary alternatives to the
current inadequacies brought about by traditional advertising means as has been alluded
to throughout this study.
For instance, in a survey reported on by Lehu and Bressoud (2007:1083) approximately
63 percent of the American advertising practitioners who responded already integrated
product placement activities in their brand communication strategies, whilst 52 percent
stated that financing for those product placement strategies had been transferred from
their TV advertising budget.
Moreover, as noted by Lee et al. (2010:524), the first study conducted on practitioners’
attitudes toward product placement, (Karrh, 1998:31) reported that these practitioners

67
were of the opinion that unaided recall is the best measure of product placement
effectiveness and that depicting the product or service in a favourable light was the most
crucial executional factor. Other subsequent studies reported national viewing potential,
placement price and movie theme as the most salient factors in product placement
strategies (Karrh et al., 2003:140; Russell & Belch, 2005:75).
Generally, it must be noted that the effects of product placement consistent with the
hierarchy of effect model (Balasubramanian et al., 2006:116) depend on various
executional strategies, which affect how the placed brand is portrayed in the movie or TV
show (Cholinski, 2012:15). The next section briefly reviews various types of product
placement strategies.
3.6 PRODUCT PLACEMENT STRATEGIES
Owing to its successes and potential failures, decisions on how best to promote a product
within a movie content or TV programme are one of the most pertinent strategic decisions
a brand has to make. According to reports from the results of an experimental study that
examined the influence of different product placement strategies on consumer reactions
in the context of TV, product placement strategies were reported to influence on
consumers' attitudes and behavioural responses differently and that their effects interact
with the type of TV programme (d’Astous & Seguin, 1999:896).
Similarly, findings from Lee et al. (2010:368) also suggest that consumers’ evaluations of
product placement strategies differ across different media genres and product/service
types. Overall, various executional factors need to be considered when deciding on an
appropriate product placement strategy. This section briefly outlines the various product
placement strategies in the context of movies and TV shows as proposed in the product
placement literature.
Modality and prominence are posited to be the key strategic issues with regards to the
ease with which a product can be plugged into an entertainment medium and the cost
thereof to marketers. Gupta and Lord (1998:48) identify a two-dimensional approach to
categorising different types of product placements. The first of which is the mode of
presentation (the senses activated by the stimulus) and the second, its level of
prominence (the extent to which the product placement possesses characteristics

68
designed to make it a central focus of audience attention). Similarly, Russell (1998:357)
also proposed modality and plot connection, which refers to the degree to which the brand
is assimilated into the story (Williams et al., 2011:8).
3.6.1 Modality
Modality in the context of product placement refers to the senses that are activated by
the placement stimulus (Avery & Ferraro, 2000:220). Based on Gupta and Lord’s
(1998:48-49) conceptualisation, product placement strategies can be classified into three
modes, namely audio, visual, as well as audio-visual.
In a visual-only mode, only visual stimuli are presented in the production of a movie or TV
show such as a logo, billboard or any other brand identifier without any relevant
promotional message that can draw obvious attention to the product (Gupta & Lord,
1998:48-49). This is the mostly used mode compared to the other modes, mainly due to
the relatively low cost and executional ease, however, Gupta and Lord (1998:49) caution
against the risk of diminished viewer attention with the absence of audio reinforcement.
In contrast, audio-only mode refers to the verbal mentioning of the brand in the script by
the character without showing the actual product on the screen. The third mode refers to
a combination of both audio and visual strategies; whereby, the product is shown on the
screen and at the same time being verbally referred to by the character (Gupta & Lord,
1998:49).
Previous academic studies have confirmed findings from cognitive psychology and
advertising literature that audio-visual placements are the most effective modes in
influencing memory vis-à-vis audio-only placements and visual-only placements but are
however the most expensive (Gupta and Lord, 1998:49; Homer, 2009:22).
3.6.2 Prominence
As noted by Kozary and Baxter (2010), prominence refers to “the extent to which the
product placement possesses characteristics designed to make it a central focus of
audience attention” (Avery & Ferraro, 2000:225). Gupta and Lord (1998:49) highlight that
placements in any of the three above mentioned modes can either be prominent or subtle.

69
The prominent product placement technique involves making a brand conspicuous by
explicitly showing, using, referring to or integrating it into the editorial content to make it
easily noticeable to target audiences (Gupta & Lord, 1998:49). The objective of prominent
product placement is to draw the audience’s attention to the brand in order to make the
brand the focal point of the editorial content. Research suggests that, in comparison to
other product placement techniques, prominent placements are positively linked to
improved brand recognition (Homer, 2009:21) and brand recall (Gupta & Lord, 1998:52).
However, prominent placements have the negative consequence of promoting negative
brand attitudes (Gupta & Lord, 1998:49; Homer, 2009:21; Lord & Gupta, 2010:188).
In contrast, the subtle product placement technique makes use of less explicit tactics.
With this method, brands only feature in the background and are not overtly referred in
editorial content (Gupta & Lord, 1998:52). Studies report that consumers tend to have
more favourable attitudes towards subtle placements, especially due to their unobtrusive
nature (Cowley & Barron, 2008:90; De Gregorio & Sung, 2010:85; Kit & P’ng, 2014:138).
However, there is a risk that this unobtrusive characteristic may lead to audiences failing
to even notice the featured brand in subtle placements (Gupta & Lord, 1998:53).
3.6.3 Plot connection
In her framework, Russell (1998:357) proposes a third dimension referred to as plot
connection. According to Russell (1998:357) and Russell (2002:306), this is the degree
of connection between the product and the plot, where higher plot placement is highly
connected to the plot thereby forming an integral element of the story, taking a salient
place in the story line or building the persona of a character. This can be illustrated by
well-known association of the James Bond character with the Austin Martin car brand.
Conversely, lower plot placement does not contribute much to the story (Russell et al.,
2009:108).
Empirical evidence has suggested that highly connected to the plot product placement
tend to have a positive impact on consumers’ brand awareness, recognition/recall, brand
attitudes and purchase intentions more than those that are not highly connected to the
plot (d’Astous & Chartier, 2000:37; Bressoud et al., 2010:375; Williams et al., 2011:7;
Cholinski, 2012:14).

70
Generally, three dimensions can thus be distinguished, namely modality, prominence and
plot connection. Given the above discussion, it may be deduced that the ultimate strategic
decisions regarding placements are basically a trade-off between costs and consumer
brand recall. This merely accentuates the importance of further research on the
relationships between various product placement strategies and consumers’ cognitive
responses thereof as proposed by Gupta and Lord (1998:50). The next section discusses
the proposed factors that affect Generation Y students’ attitudes towards product
placement in movies and TV shows.
3.7 ANTECEDENTS OF PRODUCT PLACEMENT ATTITUDES
Even though product placement practices have enjoyed significant growth over the years,
an understanding of how such a technique affect consumers is yet to evolve fully. One of
the reasons cited by Balasubramanian et al. (2006:119) is the fact that most academic
research on product placements is laboratory based; whereas, marketers prefer field
research; however, the authors further caution the difficulties associated with measuring
placement effects on both instances.
The dynamic nature of product placement as an advertising technique suggests the
necessity for marketers to understand various factors that may influence how audiences
react to the practice. This section, therefore, draws upon the literature, the various factors
that are likely to inform consumers’ attitudes toward product placement, and how such
attitudes affect consumption related behavioural intentions thereof. An understanding in
this regard will enable the development and testing of the conceptual model of the South
African Generation Y students’ attitudes and behavioural responses towards product
placement in movies and TV shows.
Studies have yet to model the antecedents of product placement attitudes formally,
though Gupta and Gould (1997:37) did significant work. This section examines several
factors that may contribute to Generation Y students’ attitudes and behavioural responses
to product placements in movies and TV shows, including perceived realism, perceived
ethicality, character-product association, perceived entertainment value, perceived
materialism-inducement of product placements, as well as attitudes toward TV
advertising.

71
3.7.1 Perceived realism
TV and movie producers have used the realism value to justify their utilisation of product
placements in that it authenticates the entertainment content and provides an accurate
reflection of the lived experiences of the audiences in terms of being surrounded by
brands in the real world (Nebenzahl & Secunda, 1993:2; Gupta & Gould, 1997:37; Gould
et al., 2000:42; Sung et al., 2009:257). Indeed, consumers have also indicated that placed
brands reinforce the integrity of a movie world and are instrumental to audiences
becoming absorbed within the storyline, while at the same time expressing admiration for
naturalistic portrayals of brands (DeLorme & Reid, 1999:75; Lee et al., 2010:366).
On the other hand, critics of product placements have questioned the moviemakers’
argument that placements enhance realism in movies, asserting that product placement
in movies and TV shows have reached excessive levels (Gould et al., 2000:44). Gould et
al. (2000:44) go on to point out a few examples to counter the realism value of placements
such as the movie Bull Durham, which mentions Miller beer 21 times and showcases 28
other products 55 times. Other examples pointed out are the hit movie Big, where the
lead actor (Tom Hanks) has a Pepsi vending machine in his living room, and Coca-Cola's
product placement in the movie Mac and Me being another transparent example as it
features an alien who survives solely on Coca-Cola (Williams et al., 2011: 4).
In support of the above, Lee et al. (2010:368) argue that obvious placements are
perceived to be less realistic and more distracting, and that they tend to interfere with the
plot/ storyline. Indeed, studies have pointed out that audiences have responded
negatively to blatant placements especially in popular soaps/TV shows due to the poor
execution of TV placements (Beneke, 2012:1069; Kumar, 2017:165; Gillespie et al.,
2018:1458). At the same time, Auty and Lewis (2004:697), Hudson and Hudson
(2006:189) and Eagle and Dahl (2018:606) caution that the practice of product placement
should remain unobtrusive enough so as not to digress from the storyline. This, however,
still leaves South African marketers with the paradox of product placement that “if you
see it, it’s bad, but if you don’t see it, it’s worthless”.
Notwithstanding the criticism, however, there appears to be a strong consensus overall
that product placements enhance the realism of the settings in movies and TV content

72
and that consumers’ perceptions about the realism enhancing role of movie and TV show
placements indeed influences their attitudes toward product placement (Nebenzahl &
Secunda, 1993:3; Gould et al., 2000:45; Sung et al., 2009:258; Williams et al., 2011:9;
Redondo et al., 2018:368). This study, therefore, seeks to examine the relationship
between perceived realism and hypothesises a positive association between attitudes
towards product placement in movies and TV shows and perceived realism.
3.7.2 Perceived entertainment
Hedonism is a philosophical notion that assumes that individuals are motivated mainly by
pleasure and happiness and the avoidance of pain. “Pleasure and pain refer, respectively,
to all pleasurable or unpleasant feelings, experiences, states, things, properties and
events” (Higgins, 2011:29). In the context of advertising research dating back to the 1960s
and 1970s, the hedonic attribute of advertising was empirically proposed to be one of the
determinants of consumer attitudes towards advertising (Lutz, 1975:50). This notion was
further supported by subsequent research, which established a positive correlation
between attitudes towards advertising and the hedonic/pleasure value that it provides
(Soley & Reid, 1983:28; Pollay & Mittal, 1993:102; O’ Donohoe, 1995:250; Speck & Elliott,
1997:65; Petruvici & Marinov, 2007:308). The perceived entertainment value of
advertising relates to the concept of the hedonic or pleasure principle; whereby,
advertisements are viewed as amusing or enjoyable (Pollay & Mittal, 1993:102).
According to Fam and Waller (2006:40), individuals watch TV to be entertained and to
gain access to information, thereby using it as an opportunity to escape reality rather than
using the medium to watch, absorb and analyse advertising messages. This notion is
further supported in the Petty and Cacioppo’s (1981:847) elaboration likelihood model
theory, which suggests ad likability to be one of the cues to the peripheral route of
persuasion. In accordance with this theoretical framework, Russell (1998:358) suggests
that product placements typically mirror the transformational rather than
the informational message strategy given that the majority of product placements do not
provide audiences with factual information about the brand but rather engage consumers
experientially with brands in an entertainment context.

73
In their empirical study, Fam and Waller (2006:403) determined that one of the seven
determinants of advertising likability to be its entertainment value and further found a
positive correlation between ad likability and brand attitude. The entertainment attribute
of advertising, in addition, was previously suggested by O’Donohoe (1995:250) and
further alluded to by Tan and Chia (2007:3) in the study on attitudes towards advertising
on specific media.
Whilst traditionally, advertising has been placed adjacent to entertainment, the
advertising industry, over the years, has witnessed a mass media fragmentation and
consequently a proliferation of platforms through which entertainment content was
distributed and consumed, which opened the door for product placement as a more
alternative method of providing integration between commercial content and
entertainment (Hudson & Hudson, 2006:491; Soba & Aydin, 2013:114).
In a focus group survey conducted on how moviegoers interpret product placement in
movies, some respondents indicated that product placement not only enhance the
entertainment value of movies, it also contributed to audiences’ own self-perception
(DeLorme & Reid, 1999:79). Further evidence supporting this notion was found by
Hernandez et al. (2004:81) in the advergaming platform who found lack of entertainment
to be a precursor to irritation and a negative attitude towards product placement in
advergames. In addition, while some research findings have explored the benefits of
using real brands on entertainment, Nelson et al. (2004:14) argue that even the use of
fictitious brands do somehow contribute to the entertainment value of product placement.
Attitudes towards advertising, over the years, have been met with some level of
ambivalence (O’Donohoe, 1995:250). Whilst some consumers have appreciated the
informative and entertaining value of advertising, others have feared its subliminal
manipulative nature (Pollay & Mittal, 1993:101). Similarly, the construct of entertainment
has also been examined in the context of product placement in recent years (Nebenzahl
& Secunda 1993:4; Gupta & Gould 1997:37; DeLorme & Reid 1999:80; Hernandez et al.,
2004:75; Nelson et al., 2004:5) where it has been shown to strongly correlate with attitude
towards product placement in various platforms. There, therefore, is evidence to suggest
that entertainment is an important construct to examine as it has been shown to be an
indicator of consumer attitudes towards product placement in various media. The present

74
study, therefore, posits a positive association between perceived entertainment and
consumer attitudes towards product placement in movies and TV shows.
3.7.3 Attitudes toward advertising on television
Relying on advertising revenues is not as effective anymore given the number of TV
channels that exist nowadays and a subsequent reduction in number of viewership per
channel, the deepening penetration of online streaming platforms such as Netflix not to
mention advertisement skipping techniques in the form of DVRs (Al-Kadi, 2013:5) thereby
challenging the effectiveness of TV advertising. Product placement, therefore, presents
a potential to eclipse TV as a lucrative promotional tool that cannot be skipped or avoided.
According to Sabour et al. (2016:113), approximately 90 percent of the United States’
media consumers with digital recorders (DVRs) indeed skip TV advertisements.
Since Zanot (1984:5) reported a negative consumer opinion towards advertising, there
seems to be empirical consensus in this regard to date (Sandage & Leckenby, 1980:30;
Muehling, 1987:34; Andrews, 1989:26; Pollay & Mittal, 1993:101; Alwitt & Prabhaker,
1994:18; Mehta, 2000:67; Tan & Chia, 2007:356). Some noteworthy arguments were
presented in calling for more specificities when measuring attitudes towards advertising
(Tan & Chia, 2007:356) especially given the ambivalences reported by O’Donohoe
(1995:250) regarding attitude toward advertising measures. Other studies have indeed
supported this notion through empirical evidence that consumers hold different attitudes
at different abstraction levels depending on the media examined (Tan & Chia, 2007:356),
for example, TV advertising has been reported to consistently being negatively perceived
vis-à-vis other media (Alwitt & Prabhaker, 1994:18; Mitttal, 1994:36). The intrusive tactics
marketers employ in order to push commercial messages constantly annoy consumers;
thereby, negatively impacting on TV advertising, a construct commonly examined in the
advertising literature (Pollay & Mittal, 1993:101; O’Donohoe, 1995:250).
According to practitioners however, these reports are insufficient to make conclusions
regarding the effectiveness of TV advertising as recent research indicates that TV
advertising still holds a prominent position as the most effective medium to drive
consumer purchases despite a 1.5 percent decline between 2012 and 2015 as compared
to a 10.3 percent decline to the online medium (Crupi, 2015). Furthermore, contrary to

75
findings from various United States and European markets regarding negative
perceptions about traditional TV advertising, results from the South African Generation Y
consumers show a somewhat positive attitude towards advertising (Bevan-Dye,
2013:160),
TV represents a powerful communication medium and a significant marketing tool and
people often engage with it on a daily basis and in a domestic environment. This gives it
the dual quality of normalising, as well as glamorising consumption practices. On TV,
brands are ubiquitous as they are part of everyday life – TV show producers require
brands to populate storylines with familiar objects that can connect with the viewers’ own
reality (PWC, 2018; PQ Media, 2018). TV can thus be argued to be an ideal vehicle for
product placement.
Owing to the apparent empirical consensus regarding negative consumer attitudes
toward advertising on TV, the inclusion of this construct as an antecedent to product
placement attitudes on TV becomes paramount to achieving the main objective of this
study. It, therefore, is posited that those respondents with an unfavourable attitude toward
TV advertisements will more likely have a favourable attitude towards product placement
in movies and TV shows.
3.7.4 Ethical concerns
Although product placement has grown in popularity and use over the years, it has also
been subject to heavy criticism and public scrutiny. Ethical concerns have emerged as an
important topic in the advertising literature and have also been linked to public policy and
legal considerations (Gupta & Gould, 1997:39). Ethical concerns about product
placements may be seen as an antecedent to attitudes toward the placement, toward the
brand and in turn, toward its purchase. Such an assumption borrows form the MacKenzie
and Lutz (1989:52) advertising models as reviewed in Chapter 2 of this study.
Gupta and Gould (1997:39) have reviewed two aspect of ethical concerns relating to
product placement, namely, a general ethical concern about product placement as well
as concerns about some product vis-à-vis the other. With regards to general ethical
concerns about product placement, Balasubramanian (1994:31) points out that since
product placements are not labelled as advertisements, they can thus be seen as covert

76
commercial content camouflaged as part of the entertainment content. Critics of product
placements, therefore, argue that such subliminal advertising is unfair on consumers as
they are unable to defend themselves against placements as they would with traditional
advertising. Furthermore, with the inclusion of advertising messages in entertainment
content, consumers are unable to escape exposure since doing so would interrupt the
programme experience, whilst the use of zipping and zapping is available with traditional
TV advertising (Williams et al., 2011:2). Moreover, critics of product placement practices
have further alleged that such placements have a negative economic impact in that it
promotes materialism and that consumers may develop favourable attitudes towards
those brands that are associated with the glamor of TV world at the expense of other
more functional brands (Gupta & Gould, 1997:40).
Despite its persuasive and deceptive nature, studies on attitudes towards product
placement in general have shown a positive attitudes and those that indicated a negative
attitude were with respect to specific products such as those that are ethically charged
(Nebenzahl & Secunda, 1993:5; Balasubramanian, 1994:127; Gupta & Gould, 1997:41;
Gould et al., 2000:47; Sung et al., 2009:260. Gupta and Gould (1997:41) further point out
that the use of cigarettes placements could be an unethical tactic to go around the
prohibition of cigarette advertising on TV.
In addition to cigarettes, other products such as guns and alcohol are considered as
ethically charged products (Gupta & Gould, 1997:41). Moreover, the ethicality of
placements into children’s content has also come under scrutiny s studies show that
children are especially easy to be persuaded by marketing and advertising efforts
(Hudson & Elliot, 2013:179). It may be argued, therefore, that advertisers may use
product placement as a backdoor to marketing ethically charged products such as
alcohol, especially with the lack of clear guidelines on the advertising code of conduct.
This is especially true with the Advertising Standards Authority of South Africa as no clear
provision is made for alcohol advertising through product placement (Moerdykon, 2014).
For the purposes of this study, the ethically charged product construct refers to alcohol,
tobacco and guns specifically and this study, therefore, predicts a negative relationship
between ethics and product placement attitudes in movies and TV shows.

77
Owing to its nature as a paid form of “hybrid message” (Balasubramanian, 1994:31), and
the ethical concerns that come with it, product placement has since been a subject of
public scrutiny and call for regulation. Al-Kadi (2013:2) notes that the instance of product
placement regulation was in 1949 whereby a placement of Southern Comfort was
removed from a TV show for being over-commercialised. In their recent study, Eagle and
Dahl (2017:607) argue that the increasingly diverse nature of product placement within
entertainment content means that awareness campaigns and warnings concerning their
presence are unlikely to be effective in countering any negative effects of this marketing
practice on vulnerable groups such as children and young adults.
Previous reviews on product placement regulation may be deemed somewhat
controversial as they depict regulations are mainly focuses on media platforms of movie
and TV (Al-Kadi, 2013:5). Similarly, Kwon et al. (2012:803) argue that there has been a
failure to generate consistent policies regarding product placement by the regulatory
framework as, for instance, product placements in syndicated movies produced
specifically for TV have to comply with the regulatory rules on sponsorship identification,
while product placements in feature movies produced for theatrical exhibition are not
subject to the sponsorship identification rules.
In a comprehensive review of product placement regulation, Al-Kadi (2013:7) points out,
the main differences in product placement policies, as primarily dependent on the
perceived role of TV in a particular state. For example, the USA broadcast model tends
to fulfil a role that compliments and supports a commercial society based on free trade
and the opening up new markets for products and services. In contrast, Europe and the
United Kingdom product placement were only allowed in 2011, though under strict rules
(Al-Kadi, 2013:7; Mandes, 2014). The main objective of the regulation is that placements
must be editorially justifiable and emphasis is put on prior warning to consumers of any
promotional content within broadcast material (Mandes, 2014). The regulation further
prevents the promotion of other products such as tobacco and prescription medication,
junk food, baby milk and gambling (Al-Kadi, 2013:7-8).
Compared to the United States, Europe and other international markets however, South
African TV industry lacks legislative policies that govern exactly how product placement
should be conducted (Moerdykon, 2014). Some practitioners do not believe government

78
regulation is the key to solving concerns brought about by product placement but believe
that consumers are ultimately the ones judge as they can choose to tune away from the
sponsored programme if they feel it is over-commercialised, which would, in turn, result
in loss of ratings for the programme and ultimately the diminished value of the placement
itself (Moerdykon, 2014). Other consumer protection groups argue however that the
South African TV industry needs to properly address problems with product placement
for the sake of better local programming and rightly to make consumers aware of product
placement’s commercial intent (News24, 2014).
Siegel (2004:90) offers an in-depth review on the evolution of the Supreme Court’s
commercial speech doctrine and concludes that product placements are unlikely to be
considered commercial speech at all. He adds that even if product placements were found
to be commercial speech, the court’s evolving doctrine would likely protect the
placements from regulation.
Overall, policy makers and regulators across the globe have responded differently to
product placement tactics as some see it as a legitimate source of funding while others
see it as covert marketing and have imposed limitations or completely prohibited the
practice (Al-Kadi, 2013:7).
Furthermore, product placement regulation has also been met with some degree of
ambivalence from consumers however, studies in this regard posit that different factors
such as culture, product type, movie watching frequency, and individual demographics
serve as antecedents to the perceived regulation of product placement but the overall
inverse relationship between product placement attitude and support for government
regulation (especially for ethically charged products) seem to exist (Gupta & Gould, 1997;
Gould et al., 2000; Sung et al., 2009; Lee et al., 2010; Williams et al., 2011; Al-Kadi,
2013). Therefore, this study examines the placement regulation as a sub-construct and
hypothesises that consumers who have a favourable attitude toward product placement
will unlikely support the need to ban or regulate product placement in movies and TV
shows with the exception of ethically charged products.

79
3.7.5 Character-product association
Research has suggested that product placement in movies and TV shows can be made
effective through positive positioning and favourable association with a movie/TV
character (Karrh, 1998:32; Gould et al., 2000:43). Morton and Friedman (2002:34) add
that as with advertising, a brand that appears with, or used by a character in a movie or
TV show can reinforce its credibility by including it with traits of the movie character or of
the actual actor personalities depicted in the character roles. The use of the Austin Martin
brand’s association with the James Bond character is one such example. Similarly, Karrh
et al. (2001:5) asserts that the paring of a brand and the character in placements diverts
more attention to the brand while at the same time though, may also prompt a certain
level of thinking by the consumer regarding the appropriateness of the paring itself.
Russell and Stern (2006:9) note the difference between a movie and a TV show
character, in that the latter is designed to be familiar, recognisable and stereotypical due
to the recurrent nature of a TV show. This suggests that regardless of the attitude toward
the character from the beginning of the show, consumers in time become familiar with the
character and may therefore develop a relationship in this regard, which, in turn, would
give credibility to the brand owing the way the favourite character interacts with it. Positive
character association and identification is thus posited to lead consumers into adopting
some character traits such as the products or brands they use (Karrh, 1998:33)
In addition, Karrh (1998:33) points out that some retailers have also embraced the
concept of product placement as stores such as Gap and Amani have established their
own service outlets to production studios so that costume designers may use their
clothing merchandise to fit the characters in the production set. Examples in this regard
can be pointed out in the movie, White House Down (2014), where the U.S. president is
wearing and explicitly mentions Nike’s Jordan sneakers in a movie scene, in addition,
Coca Cola is said to have a dedicated product placement office at its headquarters (PQ
Media, 2018).
Individuals’ association with a brand depend, in part, on the person who is promoting or
endorsing the brand and thus bringing the brand to life (Sobour et al., 2013:116). Such
brand/character associations also depend on the type of placement strategy being used,

80
as Karrh (1998:33) reported a 50 to 75 percent recognition rate by audiences when a
brand is explicitly mentioned by the character, as opposed to a 40 to 60 percent
recognition rate when the product is merely used by character. In addition, d’Astous and
Chartier (2000:32) had previously drawn similar conclusions regarding the use of different
product placement strategies, as they reported that consumer memory of the placed
product is enhanced and consumer attitudes towards placements is favourable when the
lead actor/character is present, when the placement is prominent and when it is well
integrated within the movie scene or the programme.
Product placement is closely related to the celebrity endorsement marketing
phenomenon as characters in entertainment content inconspicuously endorse placed
brands (Bergkvist et al., 2016:171; Russell & Rasolofoarison, 2017:761). Celebrity
endorsements have indeed been found to have a positive relationship with the brand and
purchase intentions thereof (Russel, 1998:975; Bevan-Dye et al., 2009:172). It is thus
posited that if consumers like the character, they are more likely to like the placed product
(Russell & Stern, 2006:9; Beneke, 2012:1070; Dias et al., 2017:125). Therefore, given
the existence of the relationship between character association and consumer attitudes
towards product placement in movies and TV shows, the construct will be examined as
forming part of the conceptual framework in this study.
3.7.6 Materialism
Based on discussions undertaken in the previous chapter regarding the involvement
theory, the theoretical underpinning of the perceived influence of product placement on
consumers’ attitudes and behavioural responses can be drawn. As cited by Lee et al.
(2010:369), following the conceptualisation of the informational versus transformational
message styles in the advertising literature (Puto & Wells, 1984:638), marketers can
develop strong persuasive advertising messages to influence consumer behaviour of
targeted consumers. According to Puto and Wells (1984:638), an informational message
strategy is the one that provides consumers with factual and relevant information about
the product such that exposure to commercial messages of that nature aids in the
consumers purchase intentions. Conversely, the transformational strategy instead
characterised by associating the experience derived from “using the advertised brand
with a unique set of psychological characteristics, which would not typically be associated

81
with the brand experience to the same degree without exposure to the advertisement”
(Lee et al., 2010:369).
Similar conceptualisation can be drawn from Petty and Cacioppo’s (1981:847) conceptual
framework of the central versus peripheral route of persuasion. With regards to product
placement, Russell (1998:975) adopted the above mentioned framework by proposing
that product placement is reflective of a typical transformational message strategy vis-à-
vis the informational message strategy as placements do not provide factual information
regarding the placed brand but rather showcases the brand in an entertainment context
One of the major criticisms of product placement practices is that it is subliminal
advertising in that consumers may not be aware that they are being marketed to, thereby
being unduly influenced, as opposed to traditional advertising whereby the commercial
intent is apparent (Balasubramanian, 1994:30). The authors in this regard argue that
consumers are being influenced in a subtle and harmful manner and, therefore, propose
a more thorough examination of the perceived influence of product placement on
consumers for future research. Notwithstanding this, however, studies have shown a
more consistent indication that consumers are indeed influenced by product placement
but do not seem to mind (Nelson & McLeod, 2005:520; Sung et al., 2009:259). The
findings of a recent study that investigated the importance of consumer materialism and
consumer ethical evaluation of product placement in movies indicate that moviegoers
who score higher on materialism tendencies find product placement more acceptable
than those who score lower (Manyiwa & Brennan, 2016:65).
Generation Y consumers are believed to be especially susceptible to the effects of
product placements because of their insecurities and susceptibility to peer influence
(Caspi & Roberts, 2001:50; Voorveld et al., 2017:240). “The more insecure adolescents
are, the more their personalities are subjective to change, and the more likely it is that
they use brands for constructing their identity” (Rhee & Johnson, 2012:75). The more
insecure these consumers are, Giles and Maltby (2004:815) argue, the more they turn to
celebrities or movie characters as role models. Evidence seem to exist suggesting that
Generation Y consumers show heightened levels of materialism (Nelson & McLeod,
2005:30; Bevan-Dye et al., 2012:5578; Rhee & Johnson, 2012:75; Cartwright & Opree,
2016:183; Jaspers & Pieters, 2016:451; Cartwright, Opree & van Reijmersdal, 2018:18).

82
This is yet another reason why Generation Y consumers are particularly vulnerable to
product placement persuasion.
This study therefore, hypothesises a positive relationship between materialism and
Generation Y students’ attitudes towards product placement in movies and TV shows.
3.7.7 Purchase intentions
In the consumer attitude structure, purchase intention is said to be the most efficient way
of measuring actual behaviour. Ajzen (1985:13) demonstrated this in the theory of
planned behaviour (Section 2.6.1). The theory proposes that the most logical way to
predict behaviour is with behavioural intention. This construct is also examined in this
present study.
Product placements are said to be associated with increased purchase intention and
sales when executed appropriately (Russell & Stern, 2006:9; Williams et al., 2011:8). This
is evident especially when considering the placement of Reese’s Pieces candy in the
Hollywood block buster movie E. T., which resulted in a 65 percent sales increase (Newell
et al., 2006:576). The lack of academic works in this regard, however, has been much
lamented by some researchers in recent years, as the construct is believed to be the most
effective measure of product placement effectiveness (Morton & Friedman, 2002:34; Van
Reijmersdal et al., 2009:430; Chen & Deterding, 2013:43)
A significant contribution of note in this regard is by Morton and Friedman (2002:35) who
extended research in product placement attitudes and purchase intentions by including
the brand usage, trial and search constructs to modify the original Gupta and Gould’s
(1997:45) wildly used attitude scale. Findings suggest that a subset of beliefs may be
useful in predicting product usage behaviour following exposure (Morton & Friedman,
2002:32). Similarly, Gould et al. (2000:44) conducted a cross-cultural analysis of Austrian,
French and American consumers where it was reported that American consumers were
more likely to purchase brands from movie placements. Furthermore, in another cross-
cultural comparison of American versus Korean consumers, Lee et al. (2010:369)
reported that both segments were equally likely to pay attention to placements in movies
and TV shows and further admitted that the product placement does indeed influence
their purchase intention.

83
Indeed, few studies have established a significant relationship between product
placement attitudes and subsequent purchase intentions; however, Balasubramanian et
al. (2006:133) caution that while marketers may claim that placements significantly
increase product sales, more empirical measures may help shed some light on the
rationales underlying such phenomena. Therefore, in the call for such measures, this
study examines the purchase intention construct and proposes that consumers with
positive attitudes towards product placement in movies and TV shows will likely have
positive attitudes toward purchasing the placed brand.
3.8 GENDER DIFFERENCES IN PRODUCT PLACEMENT
ATTITUDES
Since the spark of a wide academic interest in the product placement research two
decades ago, a general consensus seems to exist that affirms product placement as an
effective alternative to traditional TV advertising. Earlier research by Nebenzahl and
Secunda (1993:4), reveal that consumers have favourable evaluations of product
placements in movies, and those who do not, cited concerns with regards to the ethical
practices of some placements. These findings were later supported by Gupta and Gould
(1997:38) and their study, subsequently, was replicated across various countries,
including France and Austria (Gould et al., 2000), China (McKechnie & Zhou, 2003),
Australia (Brennan et al., 2004) amongst others, where similar findings emerged with
regards to product placement attitudes.
Findings from these various studies show that while attitudes towards product placement
and subsequent behavioural responses may change due to factors such as consumers’
perceptions of placement ethicality, realism, entertainment value, attitudes towards TV
advertising, materialism and character-product association, these attitudes may also be
influenced by individual differences, such as gender and age as well as movie watching
frequency (Nebenzahl & Secunda, 1993:4; Karrh, 1998:33; Gupta & Gould, 1997:45;
Gould et al., 2000:48; McKechnie & Zhou, 2003:350; Balasubramanian et al., 2006:133;
Sung et al., 2009:257; Lee et al., 2010:524; Guido et al., 2010:34; Karisik, 2014:253).
Attempts to further examine and provide more detailed assessments of demographic
differences in placement attitudes have been few in number, and limited for the most part

84
to gender considerations (De Gregorio & Sung, 2010:84). An analysis of these results
broadly suggest that males and those who watched a greater number of movies are more
open to product placement especially with regards to the placement of ethically charged
products such as alcohol, tobacco and guns (Gould et al. 2000:44; Brennan et al., 2004:3;
De Gregorio & Sung, 2010:84).
Results emanating from Guido et al. (2010:35) also examined individual differences
pertaining to personality, and found females to be less inclined to product placement. The
authors attribute this to the notion that females are more susceptible to moral and social
standards compared to their male counterparts (Guido et al., 2010:37). In contrast,
however, other studies that attempted to assess these gender differences found no
evidence to support this notion (Nelson & McLeod, 2005:515; Schmoll et al., 2006:33;
Sung et al., 2009:259; Lee et al., 2010: 369).
Taking into account the limited literature that exists regarding gender differences in
product placement research, this construct remains an open topic for further investigation.
As such, the present study seeks to address this gap by exploring the gender differences,
if any, that may exist in attitudes and behavioural responses towards movies and TV
shows amongst South African Generation Y students. This is in part fulfilment of the last
empirical objective of the present study as set out in Section 1.3.3.
3.9 PROPOSED MODEL
In accordance with the literature reviewed in this chapter, the following model of the
antecedents of South African Generation Y students’ attitudes and behavioural responses
towards product placement in movies and TV shows is proposed, as depicted in Figure
3-1.

85
Figure 3-1 Proposed model of Generation Y students’ attitudes and behavioural
responses towards product placement in movies and TV shows
3.10 CONCLUSION
Chapter 2 reviewed the past literature on consumer attitudes towards advertising, which,
in Chapter 3 was then extended to the product placement context in an endeavour to
construct an integrative framework of the antecedents of product placement attitudes, to
develop a framework to measure the Generation Y students’ attitudes and behavioural
responses towards product placement in movies and TV shows. Based on the attitude
literature, the study proposed a model consisting of various factors theorised to influence
consumers’ attitudes towards product placements
The paradox of product placement (that is, if you see it, it’s bad, but if you don’t see it, it’s
worthless) has presented a significant challenge to brand marketers globally given the
potential benefits that the practice has to offer vis-a-vis the shortcomings of traditional TV
advertising. This model aims to shed more light into the impact of this marketing
communication tool on consumers. An understanding in this regard will help marketers
further understand consumer responses to the practice, as well as gain additional insights
on how best to develop and execute different product placement strategies in order to
appeal to different types of consumers so as to maximise the potential of placing brands
in entertainment media. In addition, the model further presents pertinent public policy
issues, which both government and practitioners have to consider in this regard.
Perceived ethics
Perceived entertainment value
Perceived realism
Attitude towards TV advertising
Character-product association
Perceived materialism inducement
Generation Y students’
Attitudes towards product
placements
Behavioural responses towards
product placements

86
The next chapter examines the research approach and methodology used in order to test
the proposed model of the Generation Y students’ attitudes and behavioural responses
towards product placement in movies and TV shows empirically.

87
CHAPTER 4
RESEARCH DESIGN AND METHODOLOGY
4.1 INTRODUCTION
Chapter 2 and 3 of this study consisted of a review of the literature pertinent to
establishing the theoretical framework of the present research. Against this theoretical
framework set out in the previous two chapters, this chapter seeks to conduct an outline
of the research methodology utilised to realise the empirical objectives of the study. In an
endeavour to model the South African Generation Y students’ attitudes and behavioural
responses towards product placement in movies and TV shows, 10 empirical objectives
were formulated (Section 1.3.3). These empirical objectives necessitated a collection of
data into the following:
South African Generation Y students’ profile in terms of demographics and media
consumption habits
South African Generation Y students’ attitudes towards product placement in movies
and TV shows
South African Generation Y students’ attitudes towards TV advertising
South African Generation Y students’ perceptions of product placement’s ethics,
realism, materialism, entertainment as well as character-product association
South African Generation Y students’ intentions to purchase the placed brands.
Chapter 4 elaborates on the theoretical background of the research design and
methodology that was followed for the empirical section of the study. It outlines the
sampling procedure, including the target population, sampling frame, sample size,
together with the method of data collection and the administration of the survey
questionnaire.
The statistical analysis techniques used in this study to address the research question
are also explained. These include principle component analysis, reliability and validity
analysis, descriptive statistics analysis, collinearity diagnostics, canonical correlation
analysis, as well as the independent samples t-test and Cohen’s-D statistic.

88
With reference to empirical research, Hair et al. (2015:133) point out to importance of
adhering to a strict research process that follows a systematic and planned approach to
the research project and ensures that all aspects of the research project are consistent
with one another. This emphasises the necessity of making sure that the research design
and methodology, as well as the implementation thereof, are in accordance with the
research objectives formulated for the study. The following section considers the
marketing research process.
4.2 MARKETING RESEARCH PROCESS
Marketing research encompasses a set of systematic and objective steps to be followed
in the gathering of information for marketing decisions (Babin & Zikmund, 2015:5).
Although there is a lack of universal consensus among researchers as to the precise
number of steps involved in the marketing research process, Figure 4.1 illustrates the
typical steps to be followed in the marketing research process as suggested by, among
others, Aaker et al. (2004:73), Burns and Bush (2006:84), Zikmund et al. (2013:7) and
Malhotra (2010:41). These steps were adhered to in this study.
Problem definition
Developing an approach
Research design
Data collection
Data preparation and analysis
Report preparation and presentation
Figure 4-1 Marketing research process
Source: Malhotra (2010:57)
The six steps illustrated in Figure 4-1 indicate the chronology of tasks that need to be
undertaken when conducting a marketing research project. The steps include the problem
definition that justifies the reason for undertaking the study, the development of an

89
approach to that problem in terms of specifying the objectives to be achieved by the study,
the selection of an appropriate research design to guide the study, the collection of the
required data through fieldwork and the preparation and analysis of the data collected.
Once these steps have been carried out, the concluding step in the process requires the
preparation and presentation of a report on the findings of the study (Malhotra, 2010:41-
42; Babin & Zikmund, 2015:49).
Section 1.2 of the first chapter articulated the problem statement in this study, which
identified a need to develop and empirically test the attitudes and behavioural responses
towards product placement in movies and television shows amongst Generation Y
students in South Africa. Following the problem statement and indication of the research
design used to guide this study, the primary objective, theoretical objectives and empirical
objectives were formulated (refer to Chapter 1, Section 1.3).
In the following section, the research design that guided the empirical section of this study
is described.
4.3 RESEARCH DESIGN
A research design can be described as a set of methods and procedures used to guide
a researcher in collecting and analysing measures of the variables specified in the
research problem (Zikmund et al., 2013:48; Babin & Zikmund, 2015:166; Bryman & Bell,
2015:9). Simply put, a research design can be viewed as a framework that has been
created to find answers to research questions (Hair et al., 2015:133; Rubin & Babbie,
2016:44). There are three broad streams of research designs, namely exploratory
research, causal research and descriptive research (Hair et al., 2013:36-37).
Whilst these three different categories may differ in length and complexity, Malhotra
(2010:103), points out that any well-developed design will achieve the following:
Provide a clear identification of the research design and justify its selection from
alternative designs
Provide a review and synthesis of the relevant literature
Specify the hypotheses central to the problem in a clear and explicit manner

90
Describe the data required for testing the hypotheses and explain how that data will
be gathered
Describe the methods of analysis to be applied to that data in order to test the
hypotheses.
The first main type of research design is that of exploratory research. Exploratory
research is characterised as being flexible and unstructured (Malhotra, 2010:104). The
purpose of exploratory research is to gain greater clarity and understanding of a concept
or to aid in the defining of a problem (McDaniel & Gates, 2010:43). Exploratory research
may be used to narrow down the scope of a research topic and refine ambiguous
research problems (Zikmund & Babin, 2013:58), and may also help in the formulation of
hypotheses (Iacobucci & Churchill, 2010:60).
The second main type of research design is causal research, which focuses on gathering
information regarding cause-and-effect relationships (Fienberg et al., 2013:59). In other
words, the purpose of a causal research design is to ascertain conclusively whether two
or more variables are causally related (Hair et al., 2013:37; Silver et al, 2013:76); that is,
how an independent variable influences a dependent variable in a specified situation
(Malhotra, 2010:113).
The third main type of research design, the descriptive research design, as with causal
research, is a conclusive form of research. Another form of conclusive research used in
the majority of marketing research studies is the descriptive research design (Feinberg et
al., 2013:57). This type of research design is used when researching the characteristics,
attitudes and/or perceptions of groups, people, objects, organisations or environments
(Zikmund & Babin, 2013:49); in other words, it is used to describe phenomena, such as
market characteristics (Hair et al., 2013:36; Malhotra, 2010:106). In contrast to
exploratory research, the descriptive research design is highly structured. Moreover,
while exploratory research aids in formulating hypotheses, it is the descriptive research
design that is used to test those hypotheses (Silver et al, 2013:71).
A descriptive research design may take the form of a longitudinal study or the form of a
cross-sectional study (Iacobucci & Churchill, 2010:86; Shukla, 2008:41). In comparison
to a longitudinal study, which involves taking repeated measurements of the same

91
population elements over a specified period of time, a cross-sectional study involves the
collection of data from a single sample (single cross-sectional design) or more than one
sample (multiple cross-sectional design) only once (Malhotra, 2010:108-110).
In this study, a descriptive research design, using the single cross-sectional approach
was utilised as the blueprint for conducting the research project.
In the next section, the sampling process employed in the study is described.
4.4 SAMPLING DESIGN PROCEDURE
This section describes the sampling procedure followed in this study as set out in the
marketing research literature. The target population, sampling frame, sampling method
and sample size are described.
4.4.1 Target population
The fundamental consideration in developing a sampling procedure is to specify clearly
the characteristics of those individuals from whom or about whom information is needed
to meet the objectives formulated for the research project, which suggests that these
elements must be homogeneous in nature (Hair et al., 2015:165; Zikmund et al.,
2013:68). A target population refers to “a collection of homogeneous elements or objects
that possess the information sought by the researcher and about which inferences are to
be made” (Malhotra et al., 2013:258).
In this study, the target population was defined as 18- to 24-year old university students
who, during 2018, were registered at a public HEI in South Africa.
4.4.2 Sampling frame
The second stage in the sampling design procedure is to identify the sampling frame for
the study. This sampling frame is a master list of the elements of the target population
that includes a list of directions for identifying the elements of the target population (Babin
& Zikmund, 2015:340). Unfortunately, in the real world, such lists are not often easily
available - something which can prove challenging (Zikmund et al., 2013:391).

92
In the current study, the initial sampling frame identified for this study was a list of the 26
South African public HEIs. The final sampling frame selected for the study comprised the
campuses of three public HEIs situated in the Gauteng province. The public HEI
campuses included one from a comprehensive university, one from a traditional university
as well as one from a university of technology. This decision was motivated by the cost
and time constraints associated with accessing all Generation Y students from all the nine
provinces in the country. In addition, the Gauteng province is home to the highest number
of HEIs (7), as well as the highest student population amounting to over 60 percent of the
country’s student population at the end of 2017 (Statistic South Africa, 2018).
4.4.3 Sampling method
From the sampling frame of the three HEI campuses, a non-probability sampling method
was utilised to gather the required data. There are two main categories of sampling
methods, namely probability sampling, which involves each and every target population
element having a known chance of being selected as part of the sample, and non-
probability sampling, which involves the selection of elements for inclusion in a sample
based on the judgement of the researcher. While probability sampling is preferred over
non-probability sampling given it offers the benefits of ensuring that the sample will be
representative of the population (Malhotra 2010:376), it is not always feasible. Probability
sampling methods require a complete list of the sampling elements in a target population,
which, as explained by Zikmund et al. (2013:391), is not always readily available. Given
that in this study it was not feasible to obtain a complete list of students registered at the
three HEI campuses making up the sampling frame, the non-probability sampling method
was applied. Despite its limitations, Eze and Lee (2012:99) point out that non-probability
samples can often produce relatively good estimates of the characteristics of a target
population, with convenience sampling being suitable when the sample elements are
highly relevant to the study topic, represent the population of interest and serve the
research purpose.
4.4.4 Sample size
The sample size is the number of sample elements to be included in the sample drawn
from the sampling frame. Factors such as cost implications, accessibility of respondents,

93
importance of the decision and the statistical techniques to be conducted on the collected
data help in determining an appropriate sample size (Malhotra, 2010:374).
For the purpose of this study, a sample size of 450 participants was selected. This was
based on the planned statistical analysis techniques, whereby principle component
analysis requires 5 to 10 observations per item in the scale, and canonical correlation
analysis 10 observations per independent variable (Hair et al., 2010:102&243). Given that
the measurement instrument used in the study comprised 40 items, a sample size of 450
was deemed acceptable.
4.5 DATA COLLECTION METHOD
Data collection involves the process of gathering the required data from the elements in
the sample. With quantitative research studies, such as the study reported in this thesis,
the typical data collection methods are the observation method and the survey method
(Malhotra, 2010:209).
For this study, the survey data collection method was the most appropriate choice and
entailed the distribution of a structured self-administered questionnaire. After obtaining
ethical clearance from the Ethics Committee of the Faculty of Economic Sciences and
Information Technology at the North-West University (Vaal Triangle Campus) (Ethics
Clearance Number: ECONIT-2016-059), lecturers at each of the three campuses were
contacted, shown the questionnaire together with the ethics clearance certificate and
asked if they would act as gatekeepers to the student participants. Those lecturers who
agreed were then requested to ask the students in their class if they would be prepared
to complete the questionnaire straight after that particular lecture.
4.6 MEASURING INSTRUMENT
Structured questionnaires are the most typical type of measurement instrument employed
in the survey data collection method (Feinburg et al., 2013:236; Shukla, 2008:47-48).
When designing a questionnaire, several guidelines have been suggested, namely:
Must be presented in a structured and logical manner

94
Must be presented in simple and direct language, avoiding ambiguous or double-
barrelled questions
Must contain a physically attractive cover letter that explains the study and enticing
to respondents to encourage participation
Must avoid lengthy question that would discourage respondents from participating
The questionnaire in this study consisted of a six-page document with simple and brief
objectives. The first page of the questionnaire was a cover letter, which included the
purpose of the study, relevant contact details and an explanation concerning why the
study focused on Generation Y students. In addition, a definition of product placement
and two pictures illustrating a typical product placement in a movie and a television show
were also included. The use of simple English terminology ensured a clear understanding
of all the questions.
4.6.1 Questionnaire structure and content
The survey questionnaire consisted of 40 items measured along a six-point Likert-scale
with 1=strongly disagree and 6=strongly agree. The questionnaire was divided into eight
sections with Section A consisting of 10 closed-ended questions aimed at soliciting the
respondents’ demographic information as well as media consumption habits.
Section B of the survey instrument consisted of an eight-item scale measuring Generation
Y students’ perceptions of product placement ethicality. These items were adopted from
Gupta and Gould (1997:42) and were modified to be in line with the context of the present
research. In addition, Section C (5 items) and Section D (4 items) were also adopted from
Gupta and Gould (1997:42) and measured the respondents’ perceptions of the realism
value of product placement as well as general attitudes towards television advertising
respectively.
Furthermore, an eight-item scale was constructed in Section E of the questionnaire, which
was aimed to measure character-product association. Three of the items in this scale
were adopted from connectedness scale by Russell et al. (2004:154), whilst one item was
included from Gupta and Gould (1997:42). Three items were adopted from Karrh et al.
(2001:10) and the final item was adopted from Beneke (2012:1071). All the items

95
combined were carefully selected, as they were deemed appropriate in addressing the
research objectives of this study.
In addition, Section F of the questionnaire consisted of five items measuring the perceived
materialism of product placement on respondents. The items were adopted from Gupta
and Gould (1997:42) whilst Section G of the questionnaire consisted of four-item scale
intended to measure behavioural responses were adopted from Morton and Friedman
(2002:37).
The last section of the questionnaire (Section H) consisted of six items which measured
two constructs. The first three items were adopted from Tan and Chia (2007:362), which
measured attitudes towards product placement in movies and TV shows. The last three
items were adopted from Hernandez et al. (2004:79) and measured perceived
entertainment value of product placements in movies and TV shows.
4.6.2 Pre-testing of questionnaire
Malhotra et al. (2013:217) warn that no research should be conducted without a pre-test.
This can be attributed to the fact that no researcher can develop a perfect questionnaire
at the first attempt. The purpose of a pre-test is to check that the questionnaire does not
have any potential problems in terms of the question content, wording, layout and or
instructions.
Bryman and Bell (2015:272) explain that during a pre-test, researchers look for any
potential misinterpretations of questions and questionnaire instructions by participants,
as well as participants’ general reactions to the questions. Importantly, the pre-test should
be administered in the same survey mode as the main study.
A pre-test using five respondents was conducted for the present study. After the
respondents were debriefed, the instrument was deemed fit for a pilot test, with the
exception of minor concerns, especially with the length of the survey questions in
particular.

96
4.6.3 Pilot testing
It is worth noting that a pre-test differs from a pilot test, in that a pre-test is carried out on
a small number of participants to ensure that it measures what it is meant to measure and
that there are no problems in completing the questionnaire, while a pilot test is carried out
using participants similar to the targeted population in order to establishing its reliability
(Eze & Lee, 2012:99). This means simply that the pre-test tests for any shortcomings
concerning the questionnaire and the pilot serves as a simulation of the main study and
tests the reliability of the instrument.
The questionnaire consisting of 40 Likert-scale items was piloted on a convenience
sample of 50 Generation Y students who were not included in the main study. In order to
ensure that the pilot sample participants were not unintentionally included in the main
study, the pilot was conducted on a HEI campus that did not form part of the sampling
frame. The Cronbach alpha was used to test the internal-consistency reliability of the
scaled responses in the pilot study, where the guideline for the overall scale and sub-
scales is >0.6 (Malhotra et al., 2010: 319).
4.7 DATA PREPARATION
Once the fieldwork was complete, the research questionnaires were subjected to
validation (editing) and coding, a task necessary especially in ensuring that all questions
were answered properly and fully. This is mostly applied in interview-based surveys, as
researchers are aware that fieldwork can be subject to interviewer cheating (Malhotra et
al., 2013:293).
The data preparation entails editing, coding, capturing and storing raw data obtained from
the completed questionnaires. Despite being somewhat of a tedious exercise, it is a
crucial step in the research process as the final results and the interpretation thereof are
largely dependent on the accuracy of such raw data (Rubin & Babbie, 2016:506).
4.7.1 Data editing
The purpose of data editing is to make sure that the gathered data is not only complete
and accurate, but also organised in a simple manner to code and tabulate (Shukla,

97
2008:95). As such, editing involves checking questionnaires for errors, illegibility and
inconsistency (Zikmund & Babin, 2013:64).
In this study, a two-phase data editing process was undertaken. In the first phase,
questionnaires completed by respondents younger than 18 years or older than 24 years
were discarded because they fell out of the parameters specified in the target population.
In the second phase, any questionnaire that had less than 90 percent of the scaled-
response items completed was discarded.
4.7.2 Data coding
In addition, data coding is yet another task that needs to be completed to enable data
entry for statistical analysis. This is a manual task performed by the coder whereby
numbers are assigned to responses in order to transcribe raw data in to symbols or
numeric formats to enable statistical analysis in that regard.
The questionnaire was divided into eight Sections, where Section A measured
respondents’ demographic and media consumption habits. Section B measured product
placement ethics, while Section C measured perceived realism. Moreover, Section D
measured attitude towards television advertising, Section E character-product
association, Section F measured perceived materialism and Section G measured
purchase intention. Lastly, Section H comprised two scales measuring attitude towards
product placement and perceived entertainment. The above tasks were conducted in
conjunction with the statistician.
Data concerning this study were coded accordingly per construct as presented in
Table 4-1.

98
Table 4-1 Coding information
TYPE OF DATA VARIABLE QUESTION NUMBER
Demographic and media consumption
habits
A1 to A10
Section A, Questions A1-A10
Ethics B1 to B8 Section B, Items B1-B8
Realism C1 to C5 Section C, Items C1-C5
Attitude towards television advertising D1to D4 Section D, Items D1-D4
Character-product association E1 to E8 Section E, Items E1-E8
Materialism F1 to F4 Section F, Item F1-F4
Purchase intentions G1 to G4 Section G, Item G1-G4
Attitude towards product placement H1 to H3 Section H, Items H1-H3
Entertainment H4 to H6 Section H, Items H4-H5
4.7.3 Frequency tabulation
The third step in the data preparation process involves tabulating the data. This entails
setting up a tabulation table, which involves organising the captured data into an orderly
presented or arranged classification system. Such a table involves computing the number
of responses allocated for each of the questions (Silver et al., 2013:232; Iacobucci &
Churchill, 2010:32). There are different forms of tabulation, including bivariate tabulation,
univariate tabulation and multivariate tabulation (Struwig & Stead, 2011:152; Malhotra,
2010:467). This study used univariate tabulation, whereby the data were computed and
tabulated individually; that is, one response for each given question.
Having completed the data preparation step, the next step was to analysis the data by
applying predetermined statistical analysis techniques. In the following sections, the
statistical methods applied to the empirical data set are outlined.

99
4.8 STATISTICAL ANALYSIS
In this study, the statistical program, SPSS, Version 25, was used to analyse the captured
data. Data analysis included frequencies, principle component analysis, internal-
consistency reliability analysis, construct validity analysis (convergent validity,
discriminant validity and nomological validity), collinearity diagnostics, canonical
correlation analysis and an independent samples t-test.
These methods are outlined in the following sections.
4.8.1 Principle component analysis
The primary focus of factor analysis is to understand the underlying structure amongst
the variable included in a data set (Hair et al., 2010:94). While factor analysis incorporates
various techniques, the two fundamental approaches are that of common factor analysis
and principal component analysis (Malhotra et al., 2013:382). In this study, principle
component analysis was applied for the specific purpose of assessing the underlying
dimensionality of the set of independent and set of dependent constructs included in the
proposed model of South African Generation Y students’ attitudes and behavioural
responses towards product placement in movies and TV shows.
Before principle component analysis is performed, necessity demands that a data set be
examined for suitability to perform the analysis. This involves determining whether the
sample size is sufficiently large to produce meaningful and reliable results (Pallant,
2010:182). According to McDaniel and Gates (2014:448), while there is no consensus
amongst researchers as to what constitutes a suitable sample size, the larger the sample
size, the better. That being said, a sample size of 200 or a ratio of five observations for
each item has also been suggested as being suitable for factor analysis (Malhotra et al.,
2013:383)
The two methods that can be utilised to assess the appropriateness of the data for factor
analysis are the Bartlett’s test of sphericity and the KaiserMeyer-Olkin (KMO) measure of
sampling adequacy. A KMO value greater than 0.6 and significant Bartlett’s test of
sphericity indicates that the data set is suitable for factor analysis (Pallant, 2010:183;
Malhotra et al., 201:643).

100
The next stage in principle analysis is to determine the actual component extraction by
determining the smallest number of items that can be used to best represent the
correlations amongst those items (Kline, 2014:56). Simply put, this stage entails
determining how many of the factors should be retained.
Whilst the decision on how many factors to retain ultimately depends on the researcher,
three approaches serves to guide the decision. First, the theoretical background of the
phenomena under investigation serves as a useful guide. Other approaches are based
on mathematical models, namely the eigenvalue method and the scree plot. This study
utilised the eigenvalue approach. The eigenvalue approach stipulates keeping all factors
with an eigenvalue of one or greater and discarding those with eigenvalues lower than
one (Malhotra et al., 2013:385).
The final stage in principle component analysis is factor rotation and interpretation. This
happens after the components have been extracted and it involves rotating the factors in
order to assist with the ease of interpretation thereof. Whilst this process does not change
the outcome of the results per se, factor rotation is a mathematical way to identify a
pattern that assists in interpreting those results based on their factor loadings (Zikmund
et al., 2013:589). The two main categories of rotation methods are the orthogonal and the
oblique approaches, where the orthogonal approach includes varimax, quatimax and
equamax rotation, and the oblique approach includes promax and direct oblimin rotation
(Pallant, 2010:185).
In this study, the orthogonal approach using varimax rotation was applied.
4.8.2 Reliability
Bryman and Bell (2015:49) define reliability as the extent to which a measurement scale
produces consistent results when repeated measurements are taken. This is assessed
by determining the association between scores obtained from different administrations of
a measurement scale. As such, a measurement scale is viewed as reliable if the
association is high. The approach followed for assessing reliability will depend on whether
the purpose is to measure stability of results over time or the internal consistency of items
in measurement scale (Rubin & Babbie, 2016:194). There are several types of reliability

101
assessment techniques, including test-retest, alternative forms and internal-consistency
reliability.
4.8.2.1 Test-retest reliability
The test-retest reliability approach seeks to measure the stability of a measurement over
time. With this approach, the same respondents are given identical instruments at two
different times (generally at two or four week intervals) under similar conditions and then
the results of those two tests are correlated the results. (Malhotra, 2010:319).
4.8.2.2 Alternative-forms reliability
The alternative-forms approach to measuring reliability involves the same study
participants completing alternative forms of a measurement at two different times. Once
again, the results of those two tests are correlated to evaluate the reliability of the
measure (Zikmund et al., 2013:310).
4.8.2.3 Internal-consistency reliability
The internal-consistency approach is a popular measure of the reliability of the summated
items within a construct. Two methods may be used to measure internal-consistency
reliability, namely the split-half method or the Cronbach alpha method. The split-half
approach merely involves splitting the items in a summated scale in half (according to
odd or even numbered items, or randomly) and then running a correlation analysis on the
two half scores (Malhotra, 2010:319).
The Cronbach alpha test of internal-consistency reliability offers an improvement to the
split-half method in that it computes the average of all possible different ways of splitting
the scale (Malhotra, 2010:319; Cronbach, 1951:300). The computed coefficient alpha
values range from zero to one, and values of 0.6 and higher are considered to indicate
acceptable internal-consistency reliability (Malhotra, 2010:319), while those of 0.7 and
above indicate good internal-consistency reliability (Pallant, 2010:97). One possible
limitation of the Cronbach alpha is that it artificially increases as the number of items in a
summated scale increases, and vice versa (Zikmund et al., 2013:309). For this reason,
Pallant (2010:97) suggests also considering the average inter-item correlation, especially
with scales that have fewer than 10 items.

102
Validity measures are discussed next.
4.8.3 Validity
Zikmund et al. (2013:304) note that a good measurement instrument should exhibit both
consistency and accuracy. Whilst consistency issues are covered through reliability
measures, accuracy deals more with whether the instrument indeed measures what it is
supposed to measure. The basic approaches to determine the validity of the instrument
include face-, content-, construct- and criterion validity.
4.8.3.1 Face/content validity
Face validity or content validity refers to the subjective consensus among subject experts
that the instrument under evaluation logically reflects the phenomenon being measured
(Malhotra, 2010:320). While face validity may seem easy, Zikmund et al. (2013:304)
caution that in the case of complex business research such as attitudes measures, face
validity becomes somewhat illusive and researchers prefer to use additional methods.
The instrument used in this study was examined by two experienced researchers and by
four marketing academics to establish its face validity.
4.8.3.2 Criterion validity
Criterion validity, which includes predictive and concurrent validity, refers to the
association between the results obtained from the measurement scale and performance
on certain other meaningful variables (Malhotra, 2010:320). Predictive validity seeks to
ascertain whether test scores obtained from the first time of administration correlate with
those acquired in the future. With concurrent validity, the test score and the criterion of
interest are ascertained at the same time (Punch, 2014:242-243).
4.8.3.3 Construct validity
The focus of construct validity is on assessing theoretically-expected patterns of
relationships among item scores or between test scores and other measures (Voorhees
et al., 2016:121). The primary aim of conducting construct validity is to “explore constructs
accounting for a variance in test performance” (Cronbach & Meehl, 1955:177).

103
Construct validity includes three measures, namely convergent validity, discriminant
validity and nomological validity. In order to conclude the presence of convergent validity,
the measure used needs to correlate with other measures designed to measure the same
thing. Discriminant validity, in contrast, necessitates that a measure does not correlate
highly with measures from which it is supposed to differ (Malhotra et al., 2013:157). Clark
and Watson (1995:316) stipulate that summated scales with an average inter-item
correlation value of between 0.15 and 0.50 are indicative that the items within that scale
exhibit convergent validity, as well as discriminant validity.
The third measure of construct validity is nomological validity, which Malhotra (2010:321)
indicates is the degree to which measures correlate with different but related measures
in a theoretically predicted manner. Hair et al. (2010:710) advise that a Pearson’s product-
moment correlation matrix be constructed to assess the extent of the nomological validity
between constructs designated for inclusion in a measurement model.
Pearson’s product-moment correlation analysis measures the direction and strength of
the relationships among variables, whereby the direction is indicated by a
positive/negative sign before the correlation value. A positive correlation suggests that as
the value of one variable increases, so does the other. In contrast, a negative correlation
suggests that if the value of one variable increase, then the other variable decreases.
Moreover, the strength of the relationships among variables is determined by the actual
value of the correlation coefficient. These values range between negative one (-1) and
positive one (+1). In general, a correlation coefficient value closer to one (regardless of
the direction) implies a strong relationship while a value closer to zero implies a weak
relationship. A correlation coefficient value of one, therefore, can be interpreted as a
perfect linear relationship (Zikmund et al., 2013:554-555; Hair et al., 2015:152).
The descriptive statistics computed in this study are discussed next.
4.8.4 Descriptive statistics
Descriptive statistics is the term given to summary measures of a data set. These
measures include location measures (mean, median and mode), dispersion measures
(range, variance and standard deviation) and shape of the distribution measures
(skewness and kurtosis) (Malhotra, 2010:486-488).

104
4.8.4.1 Measures of location or central tendency
Location measures are measures of the central tendency; that is, they describe the centre
of the data set distribution. These location measures include the mean, mode and median
(Anderson et al., 2016:64). In this study, the mean measure of location was used to
describe the central tendency, which, according to Malhotra (2010:486), is the most
typically used measure of central tendency for data collected using interval or ratio scales.
This arithmetic mean is calculated by summing the values of all the observations for a
specific variable and then dividing that amount by the number of observations (McDaniel
& Gates, 2014:414).
4.8.4.2 Measures of dispersion
Dispersion measures give additional information about the central location values, in that
these measures describe the dispersion of the data set’s distribution (Rubin & Babbie,
2016:510). Zikmund et al. (2013:415) indicate that the standard deviation is one of the
most useful indices to measure the dispersion of the data set and was utilised in this
study.
A standard deviation is used when seeking to quantify the amount of variation or
dispersion of data, whereby a low standard deviation value suggests that the data tends
to be closer to the mean, and a high value suggests the data to be more widely spread
(Bryman & Bell, 2015:349). The variance refers to the average squared deviation of all
the values in a data set from the mean and, thus, the standard deviation represents the
square root of the variance (Malhotra et al., 2013:487). Therefore, unlike the variance,
the standard deviation is presented in the same units as the data.
4.8.4.3 Measures of shape
In addition to the measures of central location and dispersion, measures of shape are
computed to describe a data set. These measures involve determining the skewness and
kurtosis of the data. Skewness describes the amount and direction of the data’s departure
from the horizontal symmetry. The direction can be observed graphically whereby a
positively skewed distribution is suggested by a pile up of the date gravitating towards the
left, thus leaving a more conspicuous right tail on the distribution curve. In contrast, a
105
negatively skewed distribution is suggested by a more noticeable left tail (Malhotra,
2010:488). Moreover, the amount of skewness can be expressed as high, moderate or
approximately symmetrical. A value of zero, though unlikely, suggests a symmetrical
distribution, while a value of more than (+1/-1) is highly skewed (Anderson et al.,
2016:63). Therefore, in the case whereby the distribution is highly skewed, a
determination of the kurtosis may not be recommended given that the distribution is
already not normal (Gupta & Yadav, 2017:394)
According to Rubin and Babbie (2016:510), kurtosis refers to the measurement of a
distribution’s normality, flatness or peak. When calculating the kurtosis, a normally
distributed data will have a coefficient of zero, commonly referred to as mesokurtic.
However, if the excess kurtosis value is greater than one, then the distribution will be too
peaked to be considered normal and referred to as leptokurtic. In the case whereby the
kurtosis value is less than one instead, the distribution would thus be considered too flat
to be normal and would be called platykurtic (de Winter et al., 2016:273; Westfall,
2014:193).
4.8.5 Collinearity diagnostics
An important issue to consider when using multivariate statistical analysis to a data set is
whether there are any serious multi-collinearity issues (Hair et al., 2010:21). Given that
canonical correlation, which is a multivariate statistical technique, was used to empirically
test the proposed model emanating from the review of the literature, it was necessary to
run collinearity diagnostics.
Multi-collinearity is said to be present when the association between the independent
variables is very strong. The presence of serious multi-collinearity makes it difficult to
determine the relative strength of a predictor variable in explaining the variation in the
dependent variable (Malhotra, 2010:586).
There are two commonly used tests of multi-collinearity, namely the tolerance test and
the variance inflation factor (VIF). In terms of these two collinearity diagnostic tests, high
tolerance values and a low average VIF suggest that multi-collinearity is not a serious
concern (Hair et al., 2010:201). Pallant (2010:158) indicates that tolerance values less

106
than 0.10 and an average variance inflation factor (VIF) above 10 should be cause for
series concern as it indicates the presence of multi-collinearity.
The next section discusses the canonical correlation analysis as one of the statistical
techniques computed in the present study.
4.8.6 Canonical correlation analysis
Originally proposed by Hotelling (1936:139), canonical correlation analysis is a
multivariate statistical modelling method that is used to measure the existence of linear
relationships between two sets of variables, with one set called the independent variables
and the other set, the dependent variables (Alkenani & Yu, 2013:692).
Whereas multiple regression allows for the prediction of a single dependent variable
based on the linear function of more than one independent variables, canonical
correlation allows for the study of the relationships between several independent and
dependent variables (Hair et al., 2010:235). Canonical correlation analysis is presented
as a general perspective of other multivariate statistical analysis techniques, with several
other of these techniques, including multivariate analysis of variance (MANOVA) and
multivariate multiple regression, being special cases of it, as suggested by Baggaley
(1981:125) and Thompson (1991:6) among others. More specifically, Knapp (1978:410),
among others, assert that nearly all of the commonly used parametric tests of significance
may be considered as special cases of canonical correlation analysis.
Canonical correlation may be defined as a multivariate statistical analysis that seeks the
weighted linear composite of a set of dependent and independent variables in order to
maximise the overlap in their distribution (Sherry & Henson, 2005:39). While the use of
the dependent and independent variables may be thought of as having a certain degree
of temporal precedence, the use of the dependent and independent variables in canonical
correlation analysis is used indiscriminately as the procedure seeks to examine
relationships instead of causality. Therefore, the main objective of canonical correlation
is to maximise the correlation, rather than the variance extracted as is the case with other
multivariate techniques such as principal component analysis (Chatfield, 2018:457).

107
Canonical correlation involves several steps that include estimating the canonical
functions, assessing overall model fit, running a redundancy analysis and interpreting the
canonical variates (Hair et al., 2010:253, 254).
4.8.6.1 Estimating canonical functions
The point of departure in canonical correlation analysis is to derive one or more canonical
functions. This process of deriving successive canonical functions may be likened to the
process applied to derive a factor analysis model. In a factor analysis, the first extracted
factor accounts for the most amount of variance in the set of variables; whilst the
successive factors are extracted from the residual variance of preceding factors (see
Section 4.7.1). Accordingly, in canonical correlation analysis the first canonical function
is derived to maximise the correlation between the set of variables (Sherry & Henson,
2005:39). The successive functions are then extracted from the residual variance of
preceding functions. As canonical functions are based on residual variance, each function
is uncorrelated (that is, orthogonal) from other functions derived from the same data set
and the canonical function reflects the strength of the relationship between the pairs of
variates (Alkenani & Yu, 2013:693).
There is lack of general consensus regarding suitable number for canonical functions to
retain for interpretation; however, Hair et al. (2010:253) suggests that it is necessary to
consider both the statistical and practical significance when deciding on the number of
functions to subject to further analysis and interpretation.
It is possible to obtain a relatively strong canonical correlation (> 0.30, corresponding to
about 10% of variance explained) between two canonical variates, even though these
linear variates may not extract significant portions of variance from their respective sets
of variables (Hardoon et al., 2004:2640). When squared, a canonical root is
representative of the amount of variance in one optimally-weighted canonical variate
accounted for by the other optimally-weighted canonical variate. This shared variance
between the two canonical variates is also called the canonical root or eigenvalue.
Although the canonical root seems to be a simple and appealing measure of the shared
variance, Sherry and Henson (2005:38) caution that it can lead to some misinterpretation
in that the squared canonical correlation represents the variance shared by the linear

108
composites of the sets of variables, and not the variance extracted from the sets of
variables themselves.
4.8.6.2 Assessing overall model fit
With regards to assessing the canonical model fit, the general practice is to analyse those
functions where canonical correlation coefficients are statistically significant (for example,
at p < 0.05). There are several multivariate tests of the statistical significance of all
canonical roots, including Wilks’ lambda, Hotelling’s trace, Pillai’s trace, and Roy’s largest
root (Wilks, 2011:265). The Pillai-Bartlett trace is viewed as the most robust to violations
of assumptions, whilst the Wilks’ lambda is the most widely used and the Pillai-Bartlett
trace is the most conservative of the four F-tests. That being said, it is a viable alternative
if there are reasons to suspect that the assumptions of canonical correlation analysis are
untenable (Coetzee & Harry, 2014:91).
4.8.6.3 Redundancy analysis
While canonical correlation coefficients measure the overall relationships among the set
of variables, redundancy measures the magnitude of the relationship. Redundancy index
represents the amount of variance in the original variables of one set of variables in a
canonical function that is explained by the canonical variate of the other set of variables
in that canonical function (Cohen et al., 2013:57). A high redundancy infers a high ability
to predict. When the defined relationship between a set of independent variables and
dependent variables are clear, the redundancy index of interest would primarily be that of
the independent canonical variate in predicting the variance in the set of original variables
in the dependent set. The redundancy index is determined by calculating the amount of
shared variance in a variable set measured by its canonical variate and calculating the
amount of shared variance between the independent and the dependent canonical
variates. The redundancy index of a variate is then derived by multiplying the two
components (shared variance of the variate multiplied by the squared canonical
correlation) to find the amount of shared variance explained by the opposite variate
(Lazraq & Cleroux, 2002:413; Sherry & Henson, 2005:40).
It is necessary to note that although the canonical correlation is the same for both variates
in the canonical function, the redundancy index may vary between the two variates (Kaya

109
et al., 2014:3758), as each variate will have a differing amount of shared variance. As
with the canonical root, it is important to determine whether each redundancy index is
sufficiently large to justify interpretation in light of its theoretical and practical significance
of the research problem being investigated.
4.8.6.4 Interpreting the canonical variates
The next step in canonical correlation analysis is to interpret the canonical variates, based
on a multivariate F-test (Dattalo, 2014:26). Even though canonical loadings are
considered relatively more valid than weights as a way of interpreting the nature of
canonical relationships, it is still necessary to be cautious when using loadings for
interpreting canonical relationships, particularly with regard to the external validity of the
findings (Shen, Sun & Yuan, 2015:397). Both of these two methods for interpreting
canonical variates (standardised canonical coefficients and canonical loadings) provide
a unique perspective on the variates and, as such, it is advisable to utilise both
methods. In the case of the results of the two methods converging, there is evidence for
the veracity of these results (Dattalo, 2014:28).
4.8.7 Independent-samples t-test
The t-test is a statistical analysis technique that is used for testing differences between
means (Silver et al., 2013:211; Pallant, 2010:105). While a z-test is typically used for
sample sizes greater to 30, and a t-test for sample sizes smaller than 30, SPSS refers to
both as the t-test. The three types of t-tests include the one sample t-test, the two
independent-samples t-test and the paired sample t-test (Zikmund & Babin, 2013:390,
394). In this study, use was made of the two independent-samples t-test given that the
objective was to test if there were any statistically significant differences in the means in
Generation Y students’ attitudes and behavioural responses towards product placement
in movies and TV shows based on gender. This was the suitable method given that a
two-independent samples t-test measures possible differences between means that have
been sampled from two independent groups or population samples (Zikmund & Babin,
2013:390; Pallant, 2010:239).
While testing for statistically significant difference between means is important, it is also
necessary to compute the Cohen D-statistic in order to determine if the statistically

110
significant difference is practically significant (Silver et al., 2013:211; Ofori-Dankwa &
Tierman, 2002:280). Practical significance is indicative of the strength of different effect
sizes (Pallant, 2010:210). Pallant (2010:210) provides the following guidelines for
interpreting Cohen’s D-statistics:
0.20 ≤ d ≤ 0.50: indicate a small, relatively non-significant effect
0.50 ≤ d ≤ 0.80: indicate a medium-sized effect steering towards practical
significance
0.80 ≤ d: indicate a large effect that has attained practical significance.
The following section, the conclusion, summarises the methodology and statistical
methods used in this study.
4.9 CONCLUSION
The research methodology applied in this study was covered extensively in this chapter,
together with an overview of the statistical analysis methods applied with regards to the
analysis of empirical data. In this chapter, the three main categories of research designs
were discussed and it was explained that due to the nature of this study and its objectives
that the descriptive design was used as a blueprint for the study.
Thereafter, the sampling procedure utilised in the study was described. The initial
sampling frame of 26 HEIs was narrowed down to three HEIs in the Gauteng province.
From this sampling frame, a convenience sample of 450 university students was drawn;
that is, 150 per campus.
The chapter included a discussion concerning the measurement instrument used for data
collection. This measurement instrument was a self-administered survey questionnaire
that included 40 scaled items, divided into eight constructs, and measured on a six-point
Likert scale. Prior to the main survey, this questionnaire was subject to both a pre-test
and a pilot test.
The methods used in preparing the collected data were also outlined in the chapter. The
chapter then progressed onto discussing the various statistical analysis techniques
applied to the data. These statistical analysis techniques included principle component

111
analysis, internal-consistency reliability analysis, construct validity analysis (convergent
validity, discriminant validity and nomological validity), collinearity diagnostics, canonical
correlation analysis and an independent samples t-test.
The following chapter, Chapter 5 reports the empirical findings of the pilot study as well
as the main study. The chapter will determine whether the hypothesised relationships in
the proposed model are supported.

112
CHAPTER 5 ANALYSIS AND INTERPRETATION OF EMPIRICAL FINDINGS
5.1 INTRODUCTION
As outlined in Chapter 1, the prime objective of this study was to model the relationship
between Generation Y students’ attitudes towards product placement in movies and TV
shows and their consumption-related behavioural intentions towards placed products,
and the factors of perceived realism, ethics, character-product association, materialism,
attitude towards TV advertising and entertainment. These factors were proposed and
reviewed in Chapter 3 as some of the potential contributors to product placement attitudes
and resultant purchase intentions. This chapter also included a profile of the Generation
Y cohort in South Africa. Chapter 4 went on to elaborate on the research approach
employed in the present study, including the measurement instrument and the statistical
techniques applied in the analysis of the empirical data after the fieldwork had been
conducted.
In this chapter, a report on the statistical analysis and interpretation of the empirical
findings of the data collected is provided. The pilot study results are reported on first in
Section 5.2. This is followed by a discussion on the data gathering process in Section 5.3
and the preliminary data analysis in Section 5.4. Section 5.5 then reports on the
demographics and media consumption of the sample, which is followed by sections on
focusing on the statistical analysis methods applied to the data gathered in this study.
5.2 RESULTS OF THE PILOT TEST
Section 4.5 of the previous chapter elaborated on a pilot study and its purpose. The pilot
data were evaluated to assess the reliability and validity of the measuring instrument, and
to determine whether the questions and statements were appropriately worded. The
Cronbach alpha was used to assess the internal-consistency reliability of the eight scales
used in the instrument, to which responses were recorded on a six-point Likert scale,
ranging from 1=strongly disagree to 6=strongly agree. The convergent and discriminant
validity of the items within each of the scales were assessed using the average inter-item
correlation coefficients. After pre-test the questionnaire using the debriefing approach,

113
the instrument was piloted on a sample of 50 Generation Y students. These results of this
pilot test are depicted in Table 5-1.
Table 5-1 Summary table of pilot results
Items
Number of
variables
Mean
Standard deviation
N
Cronbach Alpha
Average inter-item correlation
B1-B8 8 3.3116 .81992 71 0.618 0.17
C1-C5 5 4.6282 .99329 71 0.823 0.48
D1-D4 4 3.7183 1.48861 71 0.855 0.59
E1-E8 8 4.2183 .98736 71 0.846 0.47
F1-F5 5 4.3887 1.11247 71 0.856 0.54
G1-G4 4 4.0986 1.21264 71 0.877 0.64
H1-H3 3 4.1761 1.16390 71 0.913 0.77
H4-H6 3 4.1268 1.26160 71 0.893 0.73
As can be noted in Table 5-1, the coefficient alphas for the scales ranged from 0.618 to
0.913, which is indicative of internal-consistency reliability. In accordance with the
guidelines developed by Clark and Watson (1995:316), all of the scales had average
inter-item correlation values exceeding 0.15, thereby suggesting that the items within
each of the scales exhibits convergent validity. However, five of the scales had average
inter-item correlation values above the recommended level of 0.50 - a situation that raises
concerns regarding the discriminant validity of the items within those scales.
However, Pallant (2010:100) points out that this simply suggests a stronger relationship
between the items in a construct. Moreover, the scales used were adopted from prior
studies that were proven to be robust measuring instruments in previous product
placement studies, as outlined in Chapter 4. The pilot instrument, therefore, was deemed
satisfactory for the main study.

114
5.3 DATA GATHERING PROCESS
The data set for this study was collected using a self-administered questionnaire that was
distributed to a convenience sample of Generation Y students registered at the three HEI
campuses that were selected as the sampling frame. Certain lecturers at these campuses
were asked if they would allow the questionnaires to be distributed to students following
their lectures. It was made clear to the students that participation was voluntary. In an
effort to ensure an even distribution of responses across the three campuses, 150
questionnaires were distributed at each of the campuses.
5.4 PRELIMINARY DATA ANALYSIS
Before the data set was analysed, a preliminary analysis of data was conducted on the
data set, which entailed coding, cleaning and doing frequency tabulations. These
procedures are outlined in the following sections.
5.4.1 Data coding
In the questionnaire used in the present study, the questions were classified into eight
sections, as shown in Table 5-2. The same questionnaire was administered to all of
the participants in the sample. The variable codes, together with their assigned values
are presented in Table 5-2.
Table 5-2 Coding information
Section A: Demographical data and media consumption
Items Code Variable Value assigned to responses
Item 1 A1 Age Younger than 18 years (1); 18 years (2); 19 years
(3); 20 years (4); 21 years (5); 22 years (6); 23
years (7); 24 years (8); older than 24 years (9)
Item 2 A2 Gender Male (1); Female (2)

115
Table 5-2 Coding information (continued …)
Section A: Demographical data and media consumption
Items Code Variable Value assigned to responses
Item 3 A3 Race Black/African (1); White (2); Coloured (3);
Asian/Indian (4); other (5)
Item 4 A4 Home province Eastern Cape (1); Free State (2): Gauteng (3);
KwaZulu Natal (4); Limpopo (5); Mpumalanga
(6); Northern Cape (7); North West (8); Western
Cape (9)
Item 5 A5 Level of study 1st year (1); 2nd year (2); 3rd year (3); post
graduate (4)
Item 6 A6 Favourite media
content
Movies (1); TV series (2); local drama/soaps (3);
reality shows (4); sports (5); other (6)
Item 7 A7 Means with which
you access your
favourite media
content
TV (1); laptop (2); tablet (3); online (4)
Item 8 A8 Days per week Every day (1); 5 days (2); 4 days (3); 3 days (4);
2 days (5); 1 day (6); never (7)
Item 9 A9 Hours per day Less than an hour (1); up to 2 hours (2); two to
four hours (3); four to six hours (4); six to eight
hours (5); more than eight hours (6)
Item 10 A10 Awareness of product
placement’s
commercial intent
Yes (1); not before today (2)

116
Table 5-2 Coding information (continued …)
Section B: Perceived ethics
Items Code Variable Value assigned to responses
Item 11
Item 12
Item 13
B1
B2
B3
Product placement
ethics
Strongly disagree (1); Disagree (2); Slightly
disagree (3); Slightly agree (4); Agree (5); Strongly
agree (6)
Item 14 B4
Item 15 B5
Item 16 B6
Item 17 B7
Item 18 B8
Section C: Perceived realism
Items Code Variable Value assigned to responses
Item 19 C1 Realism Strongly disagree (1); Disagree (2); Slightly
disagree (3); Slightly agree (4); Agree (5); Strongly
agree (6) Item 20 C2
Item 21 C3
Item 22 C4
Item 23 C5
Section D: Attitude towards television advertising
Items Code Variable Value assigned to responses
Item 24 D1 Attitude towards TV
advertising Item 25 D2
Item 26 D3
Item 27 D4
Strongly disagree (1); Disagree (2); Slightly
disagree (3); Slightly agree (4); Agree (5); Strongly
agree (6)

117
Table 5-2 Coding information (continued …)
Section E: Character-product association
Items Code Variable Value assigned to responses
Item 28 E1 Character-product
association Item 29 E2
Item 30 E3
Item 31 E4
Item 32 E5
Item 33 E6
Item 34 E7
Item 35 E8
Strongly disagree (1); Disagree (2); Slightly
disagree (3); Slightly agree (4); Agree (5); Strongly
agree (6)
Section F: Materialism
Items Code Variable Value assigned to responses
Item 36 F1 Materialism Strongly disagree (1); Disagree (2); Slightly
disagree (3); Slightly agree (4); Agree (5); Strongly Item 37 F2
Item 38 F3
Item 39 F4
Item 40 F5
agree (6)

118
Table 5-2 Coding information (continued …)
Section G: Purchase intentions
Items Code Variable Value assigned to responses
Item 41 G1 Purchase intentions Strongly disagree (1); Disagree (2); Slightly
disagree (3); Slightly agree (4); Agree (5); Strongly
agree (6) Item 42 G2
Item 43 G3
Item 44 G4
Section H:
Items Code Variable Value assigned to responses
Item 45
Item 46
H1
H2
Attitude towards
product placement
Strongly disagree (1); Disagree (2); Slightly
disagree (3); Slightly agree (4); Agree (5); Strongly
agree (6)
Item 47 H3
Item 48
Item 49
H4
H5
Perceived
entertainment
Strongly disagree (1); Disagree (2); Slightly
disagree (3); Slightly agree (4); Agree (5); Strongly
agree (6)
Item 50 H6
5.4.2 Data cleaning
In the first step of the data cleaning process, questionnaires completed by individuals that
were not within the defined target population’s age parameters were discarded.
Thereafter, questionnaires that had missing values exceeding 10 percent on the scaled-
responses items were discarded. For questionnaires with missing values of less than 10
percent on the scaled-response items, those values were estimated based on the mode.
5.4.3 Frequency tabulations
The frequencies of the scaled-response items were tabulated at this point, as reported in
Table 5-3.

119
Table 5-3 Frequency table of responses
Scale item
Strongly disagree
Disagree Slightly disagree
Slightly agree
Agree Strongly
agree
1 2 3 4 5 6
B1 62 98 61 93 92 41
B2 146 120 89 46 36 10
B3 42 63 86 109 107 40
B4 84 101 71 79 65 47
B5 44 59 92 90 89 73
B6 40 45 50 57 93 62
B7 39 44 57 55 109 143
B8 90 91 78 68 51 69
C1 27 30 48 54 41 147
C2 5 35 46 91 45 125
C3 7 22 57 111 138 112
C4 10 28 37 75 147 150
C5 25 44 82 112 83 101
D1 54 69 46 54 83 141
D2 42 64 55 76 96 114
D3 53 79 73 83 78 81
D4 55 65 51 75 80 121

120
Table 5-3 Frequency table of responses (continued …)
Scale item
Strongly disagree
Disagree Slightly disagree
Slightly agree
Agree Strongly
agree
1 2 3 4 5 6
E1 28 60 52 103 105 99
E2 49 64 80 106 114 34
E4 52 88 119 103 61 24
E5 34 56 82 124 97 54
E6 33 51 70 107 103 83
E7 29 21 50 75 105 167
E8 42 29 49 108 107 112
F1 17 42 48 85 61 104
F2 13 25 55 130 142 82
F3 17 25 64 105 123 113
F4 14 20 63 100 127 123
F5 15 37 48 99 120 128
G1 36 61 59 109 123 59
G2 10 49 91 132 110 55
G3 28 56 93 124 103 43
G4 36 49 76 84 136 66
H1 36 56 50 135 122 48
H2 9 36 53 106 149 94
H3 11 38 85 140 115 58
H4 18 33 86 130 113 67
H5 22 46 70 106 127 76
H6 19 45 89 126 115 53

121
5.5 DEMOGRAPHIC AND MEDIA CONSUMPTION ANALYSIS
This section provides a description of the sample in terms of their demographics, as well
as a description of the sample’s reported media consumption habits. This section
measured aspects relating to the participants’ age, gender, level of study, race and
province of origin.
In addition, media consumption aspects such as preferred entertainment content type
and media type, together with typical duration of media consumption (in days and hours
per day) and awareness of product placement’s commercial intent were measured.
Of the 450 questionnaires distributed, 447 were returned. Out of those 447 returned, 397
questionnaires were usable; thereby, resulting in the final response rate of 88 percent.
The demographic data of the main study are presented next.
5.5.1 Age distribution
The sample of the study consisted of participants with ages ranging from 18 years
(17.1%), 19 years (15.4%), 20 years (20.9%), 21 years (16.1%), 22 years (14.4%), 23
years (7.8%) and 24 years (8.3%). The age distribution of the sample is presented in
Figure 5-1.

122
Figure 5-1 Age distribution of the sample
As is evident from Figure 5-1, each of the specified seven age categories are represented
in the sample.
5.5.2 Gender distribution
The sample’s gender was measured in order to compute further statistical measures as
outlined in the empirical objectives section of the study. Figure 5-2 illustrates the gender
distribution of the sample.

123
Figure 5-2 Gender distribution of the sample
As can be noted in Figure 5-2, the gender distribution of the sample participants was
approximately evenly spread. The male participants in this study made up approximately
53 percent of the sample’s population, while the female participants made up
approximately 47 percent.
5.5.3 Race distribution
Figure 5-3 illustrates the race representation of the participants in the present study. The
majority of the respondents in the sample identified themselves as Black Africans
(95.5%), followed by Coloureds (2.3%). The White portion of the sample made up only 1
percent, while the Asian/Indian portion of the sample made up 0.5 percent. Some
participants failed to specify this category.

124
Figure 5-3 Race distribution of the sample
The results in Figure 5-3 came as no surprise as they are relatively consistent with the
general South African population statistics. According to Statistics South Africa (2018),
approximately 81 percent of the country’s population is Black African.
5.5.4 Province of origin
Figure 5-4 indicates that in terms of the participants’ province of origin, the sample is
relatively representative of the country, with all nine South African provinces represented
in the sample.

125
Figure 5-4 Participants’ province of origin
As can be noted Figure 5-4, the majority of the participants in the sample reported their
province of origin as Limpopo province (32.7%) and Gauteng province (32.5%). This was
followed by Mpumalanga (11.8%), Free State (8.3%), North West (5.3%), KwaZulu Natal
(4%) and Eastern Cape (3.8%). The two provinces with the lowest number of participants
were Western Cape and Northern Cape (0.8% and 0.5% respectively), while one
participant (0.3%) did not select any given option on the questionnaire.

126
These results are not surprising given that the Gauteng province is considered an
economic hub of South Africa, as outlined in Section 3.2. In addition, the latest migration
statistics reveal that Gauteng province has the highest migration levels (47%) especially
from Limpopo, KwaZulu-Natal, Eastern Cape and Free State, with those people in pursuit
of better economic, environmental and social prospects (Statistics South Africa, 2018).
5.5.5 Level of study
Figure 5-5 is a representation of the participants’ levels of study at their respective tertiary
institutions.
Figure 5-5 Participants’ levels of study
As shown in Figure 5-5, the majority of the participants indicated to be in their first-year
of study (45.8%), followed by those at their third-year of study (30%). Second-year

127
students and postgraduate students amounted to 18.9 percent and 5 percent
respectively, while one participant (0.3%) failed to answer this question.
5.5.6 Favourite entertainment content
Concerning entertainment content, the majority of participants indicated preferring movies
the most (35%), followed by TV series (24.4%). Local drama/soaps and sports made up
13.1 percent and 12.8 percent respectively, while reality shows made up 8.8 percent.
Some respondents indicated their favourite entertainment content as other (5.3%), while
two respondents (0.5%) failed to answer the question. This information is illustrated in
Figure 5-6.
Figure 5-6 Participants’ favourite entertainment content
The results depicted in Figure 5-6 are consistent with reports by PWC (2018) and PQ
Media (2018), as discussed in the first three chapters of this study. Indeed, TV series and
movies are still the most popular types of content to utilise for product placement (PQ
Media, 2018).

128
5.5.7 Preferred medium for accessing entertainment content
Figure 5-7 illustrates the respondents’ preferred medium of accessing their favourite
entertainment content.
Figure 5-7 Participants’ preferred entertainment media
As can be expected from the specified target population, the majority of the respondents
indicated utilising laptops (52.7%) as their preferred means of accessing their favourite
entertainment content. This was followed by TV (30.5%), online/Internet (12.1%) and
tablets (4.5%). One respondent selected other (0.3%) but did not specify the media type.
Notwithstanding the pace at which digital is growing, a typical student population,
especially those residing away from home, depend on their respective institutions’
Internet infrastructure, with mobile devices such as laptops and tablets being more easily
accessible through various student financial aid schemes and bursaries.

129
5.5.8 Days per week spent on entertainment content
When asked how many days per week they spend viewing their favourite entertainment
content, the majority of the participants indicated that they do so on a daily basis (37.3%).
This was followed by those who indicated three days (14.6%) and two days per week
(14.6%). The remaining respondents indicated six days (5.3%), five days (9.3%), four
days (9.6%) and one day a week (8.1%). Surprisingly though, 1.3 percent of respondents
claimed to not spend any day on any entertainment media, which seemed inconsistent
with other media consumption questions asked in this section of the questionnaire. This
information is depicted in Figure 5-8.
Figure 5-8 Media consumption frequency in days
5.5.9 Hours per day spent on favourite entertainment content
Question A9 asked respondents to indicate how many hours per day they spend viewing
their favourite entertainment content. Respondents indicated spending less than 2 hours
(10.1%), up to 2 hours (38%), 2 to 4 hours (29.7%), 4 to 6 hours (13.9%), 6 to 8 hours

130
(5.8%), while 2.5 percent indicated spending more than 8 hours per day on viewing
entertainment content. This is illustrated in Figure 5-9.
Figure 5-9 Entertainment media consumption frequency in hours
A final categorical question was included in the questionnaire to determine the sample’s
awareness of the purpose of product placements in entertainment content, as discussed
in Section 5.5.10.
5.5.10 Awareness of product placement’s commercial intent
When asked if they were aware of product placement’s commercial intent, 55.7 percent
of the participants in the sample indicated that they were not aware, while 44.3 percent
indicated that they were aware of product placement’s commercial intent. This information
is illustrated in Figure 5-10.

131
Figure 5-10 Participants’ awareness of product placement’s commercial intent
As Cowley and Barron (2008:89) indicate, previous research has found a positive shift in
brand attitudes after exposure to product placement. The authors posit that this shift
depends on the audiences’ awareness of product placement’s commercial intent. The
prominence of a placement was the main reasoning behind the study, as highly prominent
placements tend to give away the commercial motive of the product placement endeavour
(Section 3.6.2).
The following sections pertain to the findings concerning the metric scales used in the
measurement instrument.
5.6 PRINCIPLE COMPONENT ANALYSIS
As discussed in Section 4.9 of the previous chapter, factor analysis, including principle
component analysis, is a useful tool in investigating relationships among variables of

132
complex nature such as attitudinal scales. The technique allows researchers to measure
concepts that are difficult to measure directly by simply collapsing a large number of
measurement items into a few interpretable key factors (Punch, 2014:243). In order to
assess the dimensionality of the eight scales used in the study, principle component
analysis was undertaken, first on the independent constructs and then on the dependent
constructs. These results are reported on separately in the next sections.
5.6.1 Principle component analysis of independent variables
Prior to conducting the principle component analysis, the data were screened in order to
ascertain its suitability for factor analysis. The sample size (N=397) was deemed large
enough to carry on with the analysis. This sample size is in line with the views of McDaniel
and Gates (2014:448), who suggest a sample size of at least 200, or a ratio of five
observations for each item. In addition, a Kaiser-Meyer-Olkin (KMO) test for sampling
adequacy, together with Bartlett’s test of sphericity were run in order to ascertain the
suitability of the data for factor analysis. As indicated in Chapter 4, according to Pallant
(2010:183), a KMO value of 0.6 or above and a significant Bartlett’s test of sphericity
value indicates that the data are suitable for factor analysis. Satisfactory results on the
independent variables were computed for these two tests, with a KMO of 0.883 and a
significant Bartlett’s test value (chi-square =7028.032, df:820, p=0.000<0.05), thereby
confirming the data’s suitability for factor analysis.
Principle component analysis, using varimax rotation, was subsequently applied to the
data set since the primary purpose was to ascertain the structural integrity of the 33 items
of the independent variable set. As per the literature, the procedure extracted six factors
with eigenvalues above 1.0, and these six factors explained 51.52 percent of the total
variance. The rotated factors are presented in Table 5-4.

133
Table 5-4 Rotated factors for the independent variables
Factors
Items 1 2 3 4 5 6
B1 .461
B2
.523
B3
.376
B4
.323
B5
.522
B6
.526
B7
.565
B8
.612
C1 .722
C2 .743
C3 .697
C4 .668
C5 .343
D1
.741
D2
.811
D3
.809
D4
.694

134
Table 5-4 Rotated factors for the independent variables (continued …)
Factors
Items 1 2 3 4 5 6
E1
.583
E2
.708
E3
.655
E4
.644
E5
.579
E6
.690
E7
.350
E8
.514
F1 .636
F2 .770
F3 .764
F4 .774
F5 .739
.642
H4
.776
H5
.818
H6
.642
Eigenvalues 6.17 3.34 2.63 2.00 1.47 1.39
% Variance 18.70 10.12 7.96 6.10 4.47 4.21
As indicated in Table 5-4, initial eigenvalues indicated that the first factor, labelled
‘materialism’ (F1 to F5), explained approximately 19 percent of the total variance. The
second factor labelled ‘character-product association’ consisted of eight items (E1-E8)

135
and explained 10 percent of the variance. The third factor, labelled ‘realism’, comprised
five items (C1-C5), and explained approximately 8 percent of the variance. The fourth
factor labelled ‘attitudes toward TV advertising’ (D1-D5), explained 6 percent of the
variance. The fifth factor, labelled ‘ethics’ (B1-B8) explained 4.47 percent of the variance.
This factor included items related to the placement of ethically charged products such as
alcohol and tobacco, as well as items related to the support for government regulation.
While some studies measure these items separately (see Gupta & Gould, 1997; Gould et
al., 2000), the results of the present study indicate that respondents do not consider them
as separate issues. Finally, the sixth factor, labelled ‘entertainment’, explained 4.21
percent of the variance. This six-factor solution using varimax rotation confirmed the
dimensionality of the independent variables because of its previous theoretical support
and the fact that all items loaded cleanly without any cross-loadings.
5.6.2 Principle component analysis of the dependent variables
Principle component analysis was then repeated for the dependent variables of the
proposed model of the Generation Y students’ attitudes and behavioural responses
towards product placement. The dependent variables comprised seven items also
measured on a six-point Likert scale with 1=strongly disagree and 6=strongly agree.
Results revealed a KMO of 0.844 and a significant Bartlett’s test value (chi-square
=1069.511, df:21, p=0.000<0.05), again confirming the data’s suitability for factor
analysis.
Principle component analysis, using varimax rotation was performed on items in the
dependent variables. In accordance with the literature, two factors were extracted, which
had eigenvalues greater than one and explained 67.88 percent of the total variance.
The first factor labelled ‘purchase intentions, (G1-G4), explained approximately 52
percent of the variance, while the second factor, labelled ‘attitudes toward product
placement’ (H1-H3), explained approximately 16 percent of the variance. All items loaded
effectively and, therefore, none was deleted. The rotated factors are presented in Table
5-5.

136
Table 5-5 Rotated factors for the dependent variable
Factors
Item 1 2
H1
.797
H2
.801
H3
.781
G1 .826
G2 .735
G3 .819
G4 .830
Eigenvalues 3.64 1.11
% Variance 51.96 15.92
The following section discusses the reliability and validity of the scales used in the main
survey.
5.7 RELIABILITY AND VALIDITY ANALYSIS OF MAIN SURVEY
Reliability and validity assessments are central to the trustworthiness of the data collected
as it ensures interpretability. As such, after principle component analysis, the eight
constructs in the measuring instrument of this study were examined to determine their
reliability and validity. Table 5-6 lists the Cronbach alpha values and average inter-item
correlation values for the eight constructs.

137
Table 5-6 Cronbach alpha and average inter-item correlation values for the
main study
Constructs
Number of
variables
Valid N
Cronbach Alpha
Average inter-item correlation
Ethics (I) 8 397 0.636 0.18
Realism (I) 5 397 0.764 0.40
Attitude towards TV
advertising (I)
4
397
0.801
0.50
Character-product
association (I)
8
397
0.788
0.32
Materialism (i) 5 397 0.834 0.50
Purchase intentions (D) 4 397 0.819 0.54
Attitude towards Product
Placement (D)
3
397
0.764
0.52
Perceived entertainment (I) 3 397 0.746 0.50
D= Dependant variables; I= Independent variables
As can be noted from Table 5-6, the Cronbach alpha coefficients ranged from 0.636 to
0.834, thereby indicating satisfactory internal-consistency reliability.
Concerning construct validity, the average inter-item correlation values for each of the
constructs computed exceeded 0.15, thereby suggesting convergent validity of the items
within each construct. Discriminant validity is also evident given the majority of the
constructs had average inter-item correlation values equal to or less than 0.50. The
average inter-item correlation values for the two dependent variables exceeded the
recommended value of 0.50; however, they did so by a negligible amount of 0.02 and
0.04. As such, it was reasonable to assume convergent and discriminant validity. The
third measure of construct validity, nomological validity, is reported on in Section 5.9. In

138
the following section, the summary measures of the constructs in the study are reported
on and discussed.
5.8 DESCRIPTIVE STATISTICS
The summary measures selected for computation in this study included the mean,
standard deviation, skewness and kurtosis. Bearing in mind that the scaled responses
were measured on a six-point Likert scale, higher means are indicative of a greater
degree of agreement. This section addresses the first eight empirical objectives set out
in Chapter 1.
An outline of these descriptive statistical measures are given in Table 5-7.
Table 5-7 Descriptive statistics
Construct
Mean Standard deviation
Skewness
Kurtosis
Ethics 3.53 0.83 0.07 -0.76
Realism 4.49 0.98 -0.42 -0.49
Attitude towards TV advertising 3.92 1.34 -0.25 -0.91
Character-product association 3.92 0.93 -0.15 -0.35
Materialism 4.42 1.04 -0.51 --0.17
Purchase intentions 3.92 1.11 -0.16 -0.51
Attitude towards product placement 4.14 1.07 -0.41 -0.33
Perceived entertainment 4.08 1.10 -0.49 -0.02
As can be noted from Table 5-7, means above 3.5 were computed on all eight of the
constructs. The highest means were recorded on the perceived realism of product
placement in movies and TV shows (mean=4.49), materialism (mean=4.42), attitude
towards product placement in movies and TV shows (mean=4.14) and entertainment
value of product placement in movies and TV shows (mean=4.18). in addition, attitude

139
towards TV advertising, character-product association as well as purchase intentions all
recorded the same means (mean=3.92). The lowest mean recorded was on perceived
ethicality of product placements (mean=3.28).
This suggests that Generation Y students have a positive attitude towards product
placement in movies and TV shows, and feel that it is both entertaining and makes movies
and TV shows more realistic by using existing/real brands. Furthermore, the results
suggest that the sample feel influenced by scenes containing product placement, are
influenced by movie/TV show characters associated with particular brands and are likely
to purchase such brands in the future. Even though the sample reported to be in favour
of product placements in movies and TV shows, these results also suggest that the
Generation Y students are also aware of, although not opposed to, the practice’s ethical
issues. Interestingly, despite the literature, the evidence in this sample suggests that
Generation Y individuals still have a relatively positive attitude towards traditional TV
advertising. Moreover, the evidence in this sample indicates that Generation Y students
perceive product placements in movies and TV shows as inducing materialistic
tendencies among viewers.
The highest standard deviation occurred on attitude towards TV advertising (Std.
Dev.=1.34), indicating a greater dispersion in responses to the items in that construct.
The data set appears to be distributed normally in that none of the skewness values fall
outside the -2 to +2 range. The kurtosis values suggest that the data set is relatively flat.
After computing the descriptive statistics, the relationships between the constructs were
assessed in order to assess the nomological validity of the model and to determine
whether there were any multi-collinearity issues, as outlined in the following section.
5.9 NOMOLOGICAL VALIDITY ASSESSMENT AND
COLLINEARITY DIAGNOSTICS
According to Hair et al. (2010:710), constructing a correlation matrix of constructs aids in
assessing the nomological validity of a proposed model. As such, prior to conducting
canonical correlation, Pearson’s product-moment correlation coefficients between each
pair of constructs were calculated.

140
This correlation matrix is outlined in Table 5-8.
Table 5-8 Pearson’s product-moment correlation matrix
Constructs 1 2 3 4 5 6 7
1 Ethics
2 Realism -0.107*
3 Attitude towards TV
advertising
0.258**
0.227**
4 Character-product
association
0.135**
0.339**
0.113*
5 Materialism 0.197** 0.386** 0.244** 0.345**
6 Entertainment -0.114* 0.373** -0.016 0.373** 0.183**
7 Attitude towards
product placement
-0.092
0.503**
0.109*
0.528**
0.407**
0.526**
8 Purchase intentions 0.051 0.258** 0.018 0.663** 0.354** 0.330** 0.542**
*Correlation is significant at the 0.05 level (2-tailed)
**Correlation is significant at the 0.01 level (2-tailed)
An examination of the correlation analysis coefficients between the two dependent
variables was undertaken. Results revealed a statistically significant positive relationship
between attitude towards product placement and purchase intentions. These constructs
correlated highly at (r = 542, p ≤ 0.01). Findings from this study suggest that Generation
Y students’ attitudes towards product placement in movies and TV shows and their
consumption-related behavioural intentions are strongly associated with each other. The
preoccupation of past researches with the cognitive effects of product placement has
been lamented (Karisik, 2014:253) and resulted in calls for the testing the conative effect
of product placement by determining the relationship between product placement
attitudes and purchase intentions (Morton & Friedman, 2002). Attitude towards product

141
placement and purchase intentions have been reported in the video gaming context
(Nelson et al., 2004) and social games (Zhu & Chang, 2015), but not in movies and TV
shows in the South African context, thereby making this finding unique.
Furthermore, there was a statistically significant positive relationship between attitude
towards product placement and realism (r = 0.503, p ≤ 0.01), attitude towards TV
advertising (r = 0.109, p ≤ 0.05), character-product association (r = 0.528, p ≤ 0.01),
materialism (r = 0.407, p ≤ 0.01) and entertainment (r = 0.526, p ≤ 0.01). Likewise, there
was a statistically significant positive relationship between the purchase intention
construct ad realism (r = 0.258, p ≤ 0.01), character-product association (r = 0.663, p ≤
0.01), materialism (r = 0.354, p ≤ 0.01) and entertainment (r = 0.330, p ≤ 0.01).
There were no significant relationships between attitude towards product placement and
ethics (r = -0.092, p > 0.05) or between attitudes towards TV advertising and
entertainment (r = -0.016, p > 0.05); however, the direction of these relationships were in
accordance with the literature. In addition, there was no significant relationship between
purchase intentions and ethics (r =0.051, p > 0.05), which was to be expected. With the
exception of ethics and attitude towards TV advertising, results of this study are in support
of past literature on product placement as reviewed in Section 3.7, and hypothesised in
Section 1.4. As such, the proposed model appears to exhibit nomological validity.
Once nomological validity was established, the next step required in the statistical
analysis was to run collinearity diagnostics on the constructs intended for inclusion in the
proposed model. The results of the collinearity diagnostics are presented in Table 5-9.
Table 5-9 Collinearity diagnostics
Constructs Collinearity Statistics
Tolerance VIF
Ethics 0.774 1.291
Realism 0.655 1.526
Attitude towards TV advertising 0.832 1.202

142
Table 5-9 Collinearity diagnostics (continued …)
Constructs Collinearity Statistics
Tolerance VIF
Character-product association 0.474 2.109
Materialism 0.677 1.477
Entertainment 0.682 1.465
Attitude towards product placement 0.455 2.199
Purchase intentions 0.491 2.038
Table 5-9 gives the computed results of the collinearity diagnostics. Tolerance values
between 0.455 and 0.832 were returned, which are all above the cut-off value of 0.10,
and the average VIF value equalled 1.66, which is below the cut-off value of 10. Given
these values, there were no serious concerns as regards multi-collinearity
Given that there is evidence of internal-consistency reliability, convergent and
discriminant validity (refer to Table 5-6), as well as nomological validity (refer to Table 5-
8), the model proposed at the end of Chapter 3 was tested using canonical correlation.
The following section outlines the study’s hypotheses that were tested through canonical
correlation analysis.
5.10 HYPOTHESES TESTING
In undertaking hypotheses testing, the significance level was set at the conventional a =
0.01. Based on the relationships observed in the correlation analysis as well as the
literature review carried out in Chapter 3, the following hypotheses were formulated:
Ho1: The correlations between all possible linear combinations of the multivariate
dependent variables of South African Generation Y students’ attitudes towards
product placement in movies and TV shows, and purchase intensions towards
such products, and the independent variables of their general attitude toward TV
advertising, their perceived ethicality, perceived realism, character-product

143
association, perceived materialism and perceived entertainment value of
product placements are zero.
Ha1: There is at least one combination of the multivariate dependent variables of
South African Generation Y students’ attitudes towards product placement in
movies and TV shows, and purchase intensions towards such products, and the
independent variables of their general attitude toward TV advertising, their
perceived ethicality, perceived realism, character-product association, perceived
materialism and perceived entertainment value of product placements.
Ho2:
There is no statistically significant difference between male and female
Generation Y students’ attitude towards TV advertising, and their perceived
ethics, realism, character-product association, materialism, entertainment and
attitude towards product placement, as well as their purchase intentions towards
such products.
Ha2:
There is a statistically significant difference between male and female
Generation Y students’ attitude towards TV advertising, and their perceived
ethics, realism, character-product association, materialism, entertainment and
attitude towards product placement, as well as their purchase intentions towards
such products.
The following section reports on the canonical correlation analysis carried out in order to
test the first formulated hypothesis.
5.11 CANONICAL CORRELATION
After the proposed variables were factor analysed, tested for internal-consistency
reliability and construct validity, canonical correlation analysis was undertaken to identify
any relationships between the variates formed by South African Generation Y students’
attitudes and behavioural responses towards product placement in movies and TV
shows. This was done to address the ninth empirical objective and test the first
hypothesis.

144
The set of independent variables was defined as product placement’s perceived
ethicality, perceived realism, attitude towards TV advertising, character-product
association, perceived materialism, perceived entertainment. The set of dependent
variables was defined as attitudes towards product placement in movies and TV shows
as well as purchase intentions. The canonical correlation analysis was run using the
MANOVA and CANCORR macro syntax in SPSS.
As the smallest set of variables contained only two indicators, only two canonical
functions were derived. These two functions, together with the measures of the overall
model fit are outlined in Table 5-10.
Table 5-10 Measures of overall model fit
Canonical function
Canonical correlation
Canonical R2
F statistics
Probability
1 0.771 0.594 46.937 0.000
2 0.414 0.172 16.163 0.000
Multivariate test of significance
Statistic
Value Approximate F
statistic
Probability
Wilk’s lambda 0.336 46.937
0.000
Pilia’s trace 0.765 40.302
0.000
Hotelling’s trace 1.669 53.969
0.000
Roy’s gcr 0.594
As indicated in Table 5-9, the analysis resulted in two functions with squared canonical
correlations of 0.594 and 0.172 for each successive function. Collectively, Wilk’s lambda,
Pilia’s trace, Hotelling’s trace and Roy’s greater characteristic root (gcr) indicate that the
overall model across all functions is statistically significant and explained 66 percent (1-
ΛCV1) of the variance shared between the two variable sets. This result indicates that

145
there is a relationship between the variable sets. As such, the null hypothesis, Ho1 is
rejected and its alternative concluded.
The canonical correlation of the first function was 0.771, while that of the second was
0.414. While both functions were statistically significant (p ≤ 0.01), only the first function
was analysed further because it accounted for substantially higher than the second
function; that is, Function 1 explained 59 percent of the amount of shared variance
between the two sets of canonical variate scores, while Function 2 only explained 17
percent of the overlapping variance, which, despite being statistically significant, is not
practically significant.
A redundancy analysis for the independent and dependent variables of the first function
was run and the results are reported in Table 5-11.
Table 5-11 Redundancy analysis for the first canonical function
Standardised variance of the dependent variables explained by
Shared variance Redundancy
Canonical function
Percentage Cumulative percentage
Canonical R2
Percentage Cumulative percentage
1 0.769 0.769 0.594 0.457 0.457
Standardised variance of the independent variables explained by
Shared variance Redundancy
Canonical function
Percentage Cumulative percentage
Canonical R2
Percentage Cumulative percentage
1 0.306 0.306 0.594 0.182 0.182
Table 5-11 illustrates that the redundancy for the dependent variate (0.457) is higher than
that of the independent variate (0.182). Therefore, the independent variate is able to
predict 18 percent of the variance in the dependent variate. Having established that the
canonical relationship was statistically significant and that the redundancy index

146
acceptable, the next stage was to analyse the canonical weights, canonical loadings and
canonical cross-loadings, which are presented in Table 5-12.
Table 5-12 Canonical weights, loadings and cross-loadings
Canonical weights
Canonical loadings
Canonical cross- loadings
Independent variables
Perceived ethicality -0.198 -0.019 -0.015
Perceived realism 0.144 0.580 0.447
Attitude towards TV
advertising
-0.012
0.100
0.077
Character-product
association
0.654
0.869
0.670
Materialism 0.290 0.566 0.436
Perceived entertainment 0.281 0.646 0.498
Dependent variables
Attitude towards product
placement
0.625
0.903
0.695
Purchase intentions 0.512 0.851 0.656
The canonical weights, loadings and cross-loadings are reported on in Table 5-12. Hair
et al. (2010:250) indicate that when interpreting the nature of canonical relationships, it is
preferable to analyse the canonical cross-loadings. In terms of the squared canonical
cross-loadings of the dependent variables, 48.3 percent of the variance in attitude
towards product placement in movies and TV shows and 43 percent of the variance in
purchase intentions is explained by the first canonical function.
An examination of the independent variables’ cross-loadings reveals that the character-
product association has the highest correlation with the dependent variate (0.670),

147
followed by perceived entertainment (0.498), perceived realism (0.447), materialism
(0.436), whereas perceived ethicality (-0.015) and attitude towards TV advertising (0.077)
have the lowest correlations with the dependent variables. It is interesting to note that
even though Generation Y students perceive product placements in movies and TV
shows to be materialism inducers, they do not necessarily view that as something
negative. This finding is in line with that of Sung et al. (2009:259).
Approximately 45 percent of the variance in character-product association, 25 percent of
the variance in the perceived entertainment value, 20 percent variance in perceived
realism, 19 percent of the variance in perceived materialism, 0.6 percent of the variance
in attitude towards TV advertising and 0.02 percent of the variance in perceived ethicality
are explained by the dependent variate.
Therefore, it can be deduced that the character-product association, perceived
entertainment, perceived realism, perceived materialism and, to a much lesser extent,
attitude towards TV advertising have a direct positive relationship with dependent variate
and perceived ethicality a direct negative relationship and, as such, are predictors of
South African Generation Y students’ attitudes and purchase intentions toward product
placement in movies and TV shows.
5.12 INDEPENDENT-SAMPLES T-TESTS
In order to address the last empirical objective and second hypothesis of the study, an
independent samples t-test was run to determine if any significant differences exist
between male and female Generation Y students’ attitude towards TV advertising, ethics,
realism, character-product association, materialism, entertainment, attitude towards
product placement as well as purchase intentions. The significance level was set at the 1
percent level; that is, a ≤ 0.01.
Table 5-13 shows the mean, standard deviation, t-statistics and p-values for the genders
concerning the eight variables of the proposed model.

148
Table 5-13 Gender difference
Male
Mean N=210
Male Std. Dev.
Female Mean N=187
Female Std. Dev.
t-value
p-value
Cohen’s D
Ethics 3.532 0.807 3.530 0.867 0.017 0.378 *****
Realism 4.508 0.974 4.478 0.987 0.381 0.966 *****
Attitude towards
TV advertising
3.905
1.403
3.935
1.279
-0.220
0.083
*****
Character-
product
association
3.948
0.867
3.885
0.993
0.677
0.100
*****
Materialism 4.503 0.982 4.332 1.091 1.647 0.410 *****
Entertainment 4.198 1.057 3.941 1.126 2.347 0.405 *****
Attitude towards
product
placement
4.218
1.020
4.052
1.118
1.545
0.326
*****
Purchase
intentions
3.957
1.126
3.869
1.098
0.788
0.789
*****
* Statistically significant at p ≤ 0.01
** Small effect, practically non-significant
*** Medium effect and moving toward practical significance
**** Large effect, practically significant
***** Cohen’s D-statistic not calculated as the variable was not statistically significant
As Table 5-13 shows, there was no statistical significant difference between male and
female Generation Y students pertaining to their attitudes towards TV advertising,
evaluation of product placement’s ethical concerns, perceived realism, entertainment,
materialism, character-product association, attitudes towards product placement in
movies and TV shows nor their consumption-related behavioural intentions. Furthermore,
as there was no statistically significant difference, there was no need to calculate the

149
Cohen’s D-statistic. Therefore, at the 5 percent significance level the null hypothesis Ho2
could not be rejected.
5.13 CONCLUSION
This chapter reported on the empirical findings of the study and provided a discussion
concerning the outcomes of the pilot study, including the reliability and validity, which
indicated that the scale used was both reliable and valid. The preliminary data analysis,
which involved coding, data cleaning and tabulation, was then discussed.
The demographic and media consumption analysis was then carried out. While the
sample contained participants from each of the seven age categories specified in the
target population definition, the 20-year old category comprised the largest percentage of
the sample. In terms of gender, there were slightly more male than female participants in
the sample. In line with the population demographics of South Africa, the majority of the
participants in the sample were Black African. Each of South Africa’s nine provinces was
represented in the sample, with the majority of the participants indicating their province
of origin as either Gauteng or Limpopo. The majority of the sample indicated a preference
for movies and TV shows, and indicated that they typically consume that entertainment
content on their laptops.
In order to assess the factorability of the data and the dimensionality of the eight scales
used in the study, exploratory factor analysis, specifically principal component, analysis
was employed. In accordance with the literature, six independent and two dependent
factors were extracted.
The data were then tested for reliability and validity. The results suggest the presence of
internal-consistency reliability, convergent validity, discriminant validity and nomological
validity.
Descriptive statistics, including mean, standard deviation, skewness and kurtosis values.
Means above 3.5 were returned on each of the eight constructs, suggesting that despite
being aware of the questionable ethicality of product placements in movies and TV shows
and recognising that it may induce materialism, Generation Y students have a positive
attitude and behavioural response to this advertising strategy.

150
Canonical correlation analysis was then carried out in order to understand the structure
of the relationships across the hypothesised variables. The results from the canonical
analysis reveal that character-product association, perceived entertainment, perceived
realism, perceived materialism and, to a much lesser extent, attitude towards TV
advertising have a direct positive relationship with dependent variate and perceived
ethicality a direct negative relationship and, as such, are contributors to South African
Generation Y students’ attitudes and purchase intentions toward product placement in
movies and TV shows.
Furthermore, an independent samples t-test revealed that there were no statistically
significant differences between males and female participants on any of the eight
constructs included in the study.
The next chapter, Chapter 6, provides further interpretations regarding the empirical
findings in the study. Furthermore, the objectives will be re-examined to determine
whether they have been answered. In addition, the conclusions and final
recommendations pertaining to the study will be specified and discussed.

151
CHAPTER 6 CONCLUSION AND RECOMMENDATIONS
6.1 INTRODUCTION
The advent of digital technologies and new advertising platforms has given rise to
increasing media clutter, as well as mass audience fragmentation, which, in turn, has
caused an increase in advertising scepticism, a decline in traditional advertising
effectiveness and a growth in negative consumer attitudes towards traditional advertising.
Even though marketers continue to invest heavily in traditional advertising, they face a
continuous challenge concerning how best to capture their target audiences’ attention
and make their marketing communication strategy more effective (Section 2.1).
This study endeavoured to explore the use of product placement as an alternative
advertising and brand communication tool that has the potential of breaking through the
inadequacies of traditional advertising and succeeding in the battle to capture an
audience’s attention and influence their consumption-related behaviour. Various studies
have suggested that there are differences in the way in which consumers react to product
placement based on various demographic factors, including geographic, cultural and
even generational differences. With this in mind, this study focused on determining
Generation Y students’ perceptions of and attitudes towards product placements in
movies and TV shows in the South African market.
As discussed in Section 3.2, in 2018 approximately 20.28 million of South Africa’s
population of 57.72 million fell into the Generation Y age classification, accounting for
approximately 35 percent of the country’s population, which renders them a market
segment of interest, given their sheer numbers. Globally, there are indications that this
generation has significant current and future purchasing power and that they exert an
influence on the purchasing behaviour of not only their peers but also members of other
generations.
Furthermore, as indicated in Section 1.2, the university student portion of this generation
is particularly valuable from a marketing perspective in that a graduate qualification
generally equates to a higher future earning potential. In addition, a graduate qualification

152
often results in a higher social status in a community, making them potential opinion
setters amongst their peers.
The size of Generation Y, their current and future purchasing power and general ability
to influence the consumer behaviour of other generational cohorts, suggests that they are
a suitable target population for understanding attitudes towards the practice of product
placement – something which is particularly true of the university student portion of this
generation, given their potential influence on their peers.
Consequently, understanding the factors the influence Generation Y students’ attitudes
and behavioural responses towards product placement in movies and TV shows is likely
to contribute to designing effective product placement campaigns targeting members of
this generation. Based on this assumption, the primary objective of this study was to
propose and empirically test a model of the relationships between South African
Generation Y students’ attitudes towards product placement in movies and TV shows,
and purchase intensions towards such products, and the independent variables of their
general attitude toward TV advertising, their perceived ethicality, perceived realism,
character-product association, perceived materialism and perceived entertainment value
of product placements.
This chapter represents the climax of the study. To start, it offers a summary of the study,
which is then followed by a discourse of the main findings of the study, set out in
accordance with the empirical objectives outlined in Chapter 1. Figure 6.1 illustrates a
model of the relationships between South African Generation Y students’ attitudes
towards product placement in movies and TV shows, and purchase intensions towards
such products, and the independent variables of their general attitude toward TV
advertising, their perceived ethicality, perceived realism, character-product association,
perceived materialism and perceived entertainment value of product placements. This is
followed by a discussion of the recommendations based on these findings. In the last
section of this chapter there is a discussion of the study’s limitations and suggestions for
further research, together with the concluding remarks of study.

153
6.2 OVERVIEW OF THE STUDY
In order to aid comprehension of the main findings (Section 6.3) and resulting
recommendations (Section 6.4) of this study, this section provides a synopsis of the
preceding five chapters.
Chapter 1 provided a brief introduction and background to the product placement market.
The chapter briefly outlined the role of product placement in today’s advertising strategies
and made mention of various product placement success stories that have attracted both
industry and academic attention to this area of research. In addition, aspects pertaining
to the ethical concerns and legal implications were also touched upon. Based on the
problem identified, one primary objective, eight theoretical objectives and nine empirical
objectives were formulated in Section 1.3. The empirical objectives were then translated
into two hypotheses in Section 1.4. The remainder of the chapter provided a summary of
the research methodology (Section 1.5) and a discussion of the ethical considerations
(Section 1.6) of the study.
The purpose of Chapter 2 was to address the first four theoretical objectives of the study
in the form of a literature review. The concept of advertising is explained in Section 2.2,
with particular emphasis on the conceptualisation of advertising especially given the
changes in society and how the role of advertising has had to adjust to such changes to
incorporate traditional, social, mobile and digital advancements into its structure. In
Section 2.3, an examination into the advertising industry is carried out, indicating the size,
growth and role of advertising in society.
This is followed by a review of the literature on consumer attitudes in Section 2.4,
including a discussion concerning the structure of consumer attitudes (Section 2.5) and
the theories of attitude formation and change (Section 2.6). At the heart of advertising
effectiveness, is the ability for advertising to change consumer behaviour and it has been
argued that consumer attitudes are central to this topic, which warranted discussions in
this regard.
Chapter 2 went on to review the literature on the various structural models of attitudes
towards advertising in general (Section 2.7), as well as attitudes towards the
advertisement (Section 2.8). The main findings emanating from the literature reviewed in

154
this chapter are that there are many inconsistencies concerning advertising effectiveness
research, mainly because such measures have been more abstract in nature and failed
to consider specific media. Self-reported evaluations of advertising depend on the
respondent’s conceptualisation of advertising, thereby subjecting the research to various
measurement errors. Attitude towards the advertisement was identified as an important
construct mediating the effect of brand attitude and purchase intentions and structural
antecedents of attitudes towards the advertisement were outlined as they overlap with
product placement literature as well.
Chapter 3 sought to address the remaining four theoretical objectives of the study. This
chapter began with a discussion pertaining to the profile of Generation Y in terms of its
definition, size, economic worth, justification for targeting such a segment and general
consumer behaviour, especially the consumption of entertainment media (Section 3.2).
As indicated in this section, Generation Y comprises technologically savvy people who
grew up in an environment saturated with various media platforms, through which they
were inundated with commercial advertising messages. As a consequence of this, while
they tend to be better informed than members of the preceding generation, they have
also developed a certain degree of scepticism towards traditional advertising methods. In
South Africa, the size of Generation Y as a market segment means that they have and
will continue to have a significant influence on the country’s current and future interaction
with brands (Section 3.2).
In Section 3.3, a review of the literature on product placement was carried out in terms of
its definition, industry growth (Section 3.4), purpose (Section 3.5) and strategies (Section
3.6). As product placement research is a new and complex topic, scholars have attempted
to define, characterise and identify consumer attitudes towards this marketing
phenomenon by using various attitudinal models borrowed from the inexhaustible
advertising literature as alluded to in Chapter 2 and this literature has been extended to
the product placement literature.
The different variables thought to predict attitudes towards product placement and its
influence on purchase intentions were reviewed in Section 3.7. The main findings from
this literature review suggest that factors such as perceived product placement ethics,
realism, entertainment, materialism, attitude towards TV advertising and character-

155
product association influence attitude towards product placement and resultant purchase
behaviour. These variables were subsequently included in the proposed model. The
chapter continued with a discussion concerning gender differences in attitudes towards
product placement in movies and TV shows as identified in previous published studies
(Section 3.8). The concluding section of Chapter 3, Section 3.9, focuses on the model
proposed for empirical testing based on the literature and depicted in Figure 3-1.
Chapter 4 focused on discussing the research methodology that guided the empirical
study. As indicated in Section 4.3, the study followed a descriptive research design. The
population targeted in the study included Generation Y tertiary students registered at
South African public HEI in 2018 (Section 4.4.1). The study’s sampling frame consisted
of three of these HEI campuses that are located in the Gauteng province. The three
campuses consisted of one traditional university, one comprehensive university and one
university of technology. Following the definition of the sampling frame, a single cross-
sectional convenience sample of 450 Generation Y students (150 per campus) was drawn
(Section 4.4.3 & Section 4.4.4).
The data collection process is discussed in Section 4.5. Data were collected using a self-
administered questionnaire that included existing validated scales (Section 4.6.1). In
Section 4.7, the data preparation process followed on the data gathered is outlined. The
statistical methods computed in this study are reviewed in Section 4.8 and include
principle component analysis (Section 4.8.1), measures of reliability (Section 4.8.2) and
validity (Section 4.8.3), descriptive statistics (Section 4.8.4), collinearity diagnostics
(Section 4.8.5), canonical correlation analysis (Section 4.8.6) and independent sample t-
tests (Section 4.8.7).
Following on the discussion of the study’s research methodology in Chapter 4, Chapter 5
provides a discourse on the empirical findings of the study, in line with the empirical
objectives outlined in Chapter 1, Section 1.3.3.
6.3 MAIN FINDINGS OF THE STUDY
The main findings reported in this section are in accordance with the empirical objectives
set out in Chapter 1.

156
A principle component analysis (Section 5.6) conducted on the independent variables
yielded a six-factor solution comprising ethics, realism, attitude towards TV advertising,
character-product association, materialism and entertainment, which explained 51.52
percent of the total variance. The second principle component analysis conducted on the
dependent variables yielded a two-factor solution, comprising attitude towards product
placement in movies and TV shows, as well as purchase intentions towards placed
products, which explained 67.88 percent of the total variance. The principle component
analyses performed on both the independent and dependent variables yielded factors
that are in accordance with the literature.
The Cronbach alpha values and average inter-item correlation coefficients computed and
reported in Section 5.7 indicate that each of the scales exhibited internal-consistency
reliability and that the items within each scale exhibited both convergent and discriminant
validity.
Descriptive statistics (Section 5.8) were the computed to address the first eight empirical
objectives formulated in Chapter 1. Means in the agreement area of the six-point Likert
scale were recorded on all construct-related items. This suggests that Generation Y
students have a positive attitude towards product placement in movies and TV shows and
feel that it is both entertaining and makes movies and TV shows more realistic by using
existing/real brands. Results further suggest that the sample feel influenced by scenes
containing product placements, are influenced by movie/TV show characters associated
with particular brands and are likely to purchase such brands in the future. Even though
the sample reported to be in favour of product placement in movies and TV shows, these
results also suggest that Generation Y students are sceptical of the practice’s ethical
challenges (though not opposed to it), and seem to still enjoy traditional TV advertising
despite popular advertising literature. The results also indicate that Generation Y students
perceive product placements in movies and TV shows as inducing materialism in viewers.
Correlation analysis (Section 5.9) was performed based on the components extracted
from the principle component analyses. This was done prior to the canonical correlation
analysis for the purpose of assessing the nomological validity of the proposed model. The
results from the correlation analysis indicated that there was significant correlation
between the majority of the pairs of constructs. Where there was not significant

157
correlation, the relationships were in the correct direction (whether positive or negative)
and the lack of association made logical sense. For example, there was a negative non-
significant association between attitudes towards TV advertising and the perceived
entertainment value of product placements. As such, there were no obvious nomological
validity concerns. In addition, there were no serious issues of multi-collinearity between
the constructs (Section 5.9). As such, canonical correlation analysis was deemed
appropriate.
In accordance with the ninth empirical objective, canonical correlation analysis was then
undertaken to identify whether there were any relationships between the variates formed
by South African Generation Y students’ attitudes and behavioural responses towards
product placement in movies and TV shows, and their attitude towards TV advertising,
character-product associations, perceived ethics, entertainment, realism, and materialism
of product placements (Section 5.11). The set of independent variables were defined as
product placement’s perceived ethicality, perceived realism, attitude towards TV
advertising, character-product association, perceived materialism, perceived
entertainment. The set of dependent variables was defined as attitudes towards product
placement in movies and TV shows as well as purchase intentions
The analysis resulted in two functions with squared canonical correlations of 0.594 and
0.172 for each successive function. Collectively, Wilk’s lambda, Pilia’s trace, Hotelling’s
trace and Roy’s greater characteristic root (gcr) indicate that the overall model across all
functions was statistically significant and explained 66 percent (1-ΛCV1) of the variance
shared between the two variable sets.
Despite both canonical functions being statistically significant (p ≤ 0.01), only the first
function was practically significant. As such, only the first function was subjected to further
analysis and interpretation. The redundancy analysis indicated that the dependent variate
set predicted 45.7 percent of the variance in the independent variate set, whilst the
independent variate set predicted 18 percent of the variance in the dependent variate set.
Based on an analysis of the canonical cross loadings, it was concluded that character-
product association, perceived entertainment, perceived realism, perceived materialism
and to a much lesser extent, attitude towards TV advertising and have a direct positive
relationship with the dependent variate. Perceived ethicality, as expected, was related

158
negatively to the dependent variate set. These findings suggest that character-product
association, perceived entertainment, perceived realism, perceived materialism, attitude
towards TV advertising and perceived ethicality of product placements are all contributors
to South African Generation Y students’ attitudes and purchase intentions toward product
placement in movies and TV shows.
As such, the findings of this study suggest that the model presented in Figure 6-1 may
explain the antecedents of Generation Y students’ attitudes and behavioural responses
towards product placement in movies and TV shows.
Figure 6-1 Generation Y students’ attitudes and behavioural intentions towards
product placements in movies and TV shows
In order to address the tenth empirical objective and test the second hypothesis and
address the last empirical objective pertaining to gender differences, a two-independent

159
samples t-tests was conducted. There was no statistically or practically significant
difference between male and female Generation Y students pertaining to their evaluations
of product placement’s perceived ethics, realism, materialism, entertainment, attitude
towards TV advertising, character-product association or attitude towards product
placement in movies and TV shows and purchase intentions towards placed products
(Section 5.12).
The following section explains the contribution made by this study.
6.4 CONTRIBUTIONS OF THE STUDY
The popularity of product placement in entertainment media has been a worldwide
growing phenomenon over the past decades. Alongside its growing importance however,
came with it growing concerns from various critics with regard to its alleged influence on
consumers as well as calls for government to regulate the practice. This study seeks to
determine empirically how the Generation Y students’ segment of consumers react to
product placement practices with particular emphasis on their overall evaluation of
product placement’s ethics, its entertainment value, the realism impact, material
influence, character-product association and their attitudes toward TV advertising.
The findings of this study contribute to the limited literature available concerning product
placement effectiveness in the South African market, with specific reference to the factors
that contribute to Generation Y students’ positive attitudes and purchase intentions
towards product placement.
This was done by empirically testing a model of factors that contribute towards Generation
Y students’ attitudes and behavioural responses towards product placement in movies
and TV shows. The hypothesised model comprised the set of independent variates of
attitude towards TV advertising, character-product association, perceived ethics, realism,
materialism, entertainment and the set of dependent variates of attitude towards product
placement in movies and TV shows and purchase intentions towards placed products.
This model represents an important tool for understanding Generation Y individuals’
attitudes towards and behavioural responses towards the placements of brands across a
range of entertainment content, including but not limited to movies and TV shows in the

160
South African context. The model may also have value in shedding some light for policy
makers with regards to the ethical concern and regulatory frameworks around the
placement of brands in non-commercial content.
Moreover, an understanding in this regard will enable marketers to realise the
opportunities presented by product placement techniques in developing markets such as
South Africa and thus tailor their brand communication strategies to maximise
effectiveness. The study also seeks to shed some light to policy makers with regards to
the perceptions of consumers to the regulation of product placement, thereby making
legislative contributions in this regard.
In addition, the findings of this study will contribute to the literature on product placement
attitudes as well as the literature on South Africa’s Generation Y students’ consumer
behaviour. The latter contribution to the literature is in accordance with the aims of the
ProGenY (profiling the consumer behaviour of Generation Y in South Africa) project at
North-West University (Vaal Triangle Campus).
In addition, the recommendations discussed in the following section will enable marketers
targeting the Generation Y cohort with product placements to tailor their marketing efforts
accordingly.
6.5 RECOMMENDATIONS OF THE STUDY
In accordance with the findings of this study, the following section outlines the
recommendations for effective product placement.
6.5.1 Self-regulation and continuous monitoring
In this study, results show that Generation Y students are in favour of product placement
in movies and TV shows, and while they appear cognoscente of the ethical issues raised
by product placement, these concerns only mildly affect their attitude and behavioural
responses to such placements. Although caution must be exercised when generalising
the findings herein, given that today’s youth has demonstrated the ability to influence
government policies. This can be illustrated by the recent free education bill passed as a
result of mass student protests in South Africa (Heffeman, 2018; Moolman & Jacobs,

161
2018). Based on the results therefore, the study recommends no need for governmental
regulation into product placement, but for government to monitor the developments and
practices in the product placement industry continuously, should the need for regulation
arise. This is particularly with respect to the type of products placed as well as the type of
content within which brands are placed. This will ensure that ethically-charged products
such as alcohol, tobacco, guns as well as other controversial products such as
prescription medication and political parties do not open a backdoor to commercial
advertising through the use of product placement.
In addition, while results show respondents to be against the ban of product placements,
marketers are presented with a unique opportunity to take advantage of the benefits of
product placements. However, the study recommends that marketers and content
producers self-regulate in the absence of formal government regulation, so as not to
attract negative perceptions and attitudes towards the practice of product placement from
consumer advocate groups and government bodies. Care, therefore, must be exercised
as to the type of products placed and the manner in which they are placed.
6.5.2 Design realistic product placement campaigns with
integrated strategies
Theoretical and empirical evidence leave no doubt that movie and TV audience
appreciate the realism enhancing abilities of product placements through the use of non-
fictitious brands as they portray everyday lived experiences of consumers. Product
placement strategies that integrate brands in plots, rather than throwing them in a
conspicuous manner such that audiences are aware of the commercial intent, have
proven more effective (Gillespie et al., 2018; Naderer et al., 2018). Therefore, this study
recommends that marketers design campaigns that seamlessly integrate brands into the
storyline and create an authentic scene rather than commercial advertisements in movie
scenes and TV programming.
In addition, realistic product placements may aid in achieving the information objective of
advertising since audiences are able to relate to how brands are used and receive real-
time demonstrations, features and benefits of the product depending on how the products
are placed. The use of the Mini Cooper car brand in the movie, The Italian Job may be

162
an example of product demonstration, while the Chevrolet Camaro in the movie
Transformers is used for static entertainment and brand awareness purposes.
6.5.3 Design entertaining product placement campaigns
The results of the study show that respondents find product placements entertaining to
watch. The entertainment construct was also found to be a significant predictor of product
placement attitudes and purchase intentions. These results are in support of the literature
reviewed in Section 3.7.2 of the study. Based on the findings, this study recommends that
marketers incorporate entertainment when integrating brands into the movie plot or TV
scene. Marketers should consider using humorous appeals or thought-provoking scenes
and avoid negative depictions of the brand that may give the brand a negative image or
have audiences questions its appearance. Pranam (2018:125) asserts that even great
products can unintentionally tarnish their reputation through careless placements, as
every single element of the product tells a piece of the complete story and, thus, product
placement needs to be handled with care. Such placements have already been evident
such, as among others, the placement of Sony products, including the Sony PlayStation
in the Johannesburg based movie plot Chappie, produced by Sony. Whilst the
placements were meant to be entertaining, the unrealistic portrayal of Sony products in
the movie saw the movie appearing in the category of movies with worst product
placement scenes.
6.5.4 Use product placement as part of the integrated marketing
communication (IMC) strategy
Empirical evidence in this study show that respondents prefer product placements in
movies and TV shows over traditional TV advertising. Approximately 63 percent of
respondents admitted to using their mobile devices such as laptops and tablets to access
movie content just so they can avoid TV advertisements. Theoretical evidence, however,
shows that traditional TV advertising is still dominant, especially in the South African
market (PQ Media, 2018; PWC, 2018).
Based on the findings, therefore, this study, recommends that marketers increase
promotional budgets and use product placements to reinforce their promotional

163
strategies. Product placements may be used in conjunction with the traditional TV
advertising campaigns as part of the integrated marketing communication mix strategy to
reinforce brand awareness and spontaneous recall (Van Reijmersdal, 2011; Uribe, 2016).
6.5.5 Increase brand exposure through increased product
placement budget
Notwithstanding the reluctance of South African brand marketers to invest in product
placement the same as or even more than traditional advertising, results from the present
study show that approximately half of the respondents are aware of product placement’s
commercial intent. Furthermore, the results indicate that materialism is one of the most
significant predictors of product placement attitudes and subsequent consumption-related
behavioural intentions. Past research also suggest that high exposure to mass media
increases brand consciousness and awareness (Nelson & McLeod, 2005), and people
with high material tendencies are associated with increased consumption behaviours
either for status or utilitarian reasons (Bevan-Dye et al., 2012).
Based on the notion that the more people see brands on marketing platforms, the more
they want to acquire and own them, this study recommends that marketers invest more
in product placement campaigns in movies and other TV shows so as to increase brand
exposure and take advantage of the already materialistic consumers who enjoy seeing
brands in movies. Both theoretical and empirical evidence exist that increased exposure
to advertising stimuli influences brand attitudes and consumption behavioural intentions
(Gardner, 1985; MacKenzie & Lutz, 1986; Mittal, 1990; Nelson & McLeod, 2005;
Ganesan, Sridhar & Priyadharsani, 2017).
Whiles the study recommends increased product placement exposure, marketers should
also be careful of movie saturation and placement prominence as placements still need
to appear seamless and natural so as not to be perceived negatively by consumers
(Beneke, 2012).

164
6.5.6 Create brand image by associating brands with appropriate
characters/shows
As alluded to in Section 3.7.5, celebrity endorsements have proven to be a less effective
tool today as consumers become more and more sophisticated. Marketers also have to
battle with the enduring reputation and credibility of the celebrity endorser. Product
placement, however, provides an opportunity for subtle endorsements by movies and TV
characters. Results from the present study reveal that respondents pay attention to
brands used by their favourite characters, are more likely to buy such brands and in some
cases feel closer to their favourite movie characters through the consumption of the
associated brands. The successful association of the Austin Martin car brand with the
James Bond character in the James Bond franchise is a classic example that tying a
brand with a successful character or show can increase the shelf life of a product and
achieve prominent exposure, visibility, interest and brand recall.
As such, this study recommends that marketers create brand image or brand status by
associating their brands with appropriate movie or TV show characters. Bevan-Dye et al.
(2012) have also previously suggested that international brands enjoy more status-
related consumption compared to South African brands, which makes Generation Y
consumers less prone to the consumption of the latter brands. Therefore, local brands
with a status-conferring cue (as a result of character-product association) present
opportunities for these brands to compete with their international brand counterparts.
These recommendations are also supported by the theories of character-product
interaction as previously researched by Russell and Stern (2006, Muzellec, Kanitz, and
Lynn (2013), as well as Kamleitner and Khair (2013), who all postulate that consumers
are more inclined to purchasing brands used by their favourite characters if they feel
attached to such characters, thus making product placement in movies and TV shows
more effective.
6.6 LIMITATIONS AND FUTURE RESEARCH OPPORTUNITIES
This study measured the antecedents of attitudes and behavioural responses towards
product placements in movies and TV shows amongst Generation Y students in South

165
Africa. As with any other study, this study had certain limitations that may present several
future research opportunities.
A non-probability convenience sampling method was utilised to select the sample.
Despite the inclusion of a several demographic questions to determine the extent to which
the sample was representative of the target population, care should be taken in
generalising the results to the population (Section 4.4.3). In addition, a single cross-
sectional research design was undertaken (Section 4.3). Future research, utilising a
longitudinal study, may provide a more accurate reflection of the extent to which the
factors identified in this study influence Generation Y students’ attitudes and behavioural
responses towards product placement in movies and TV shows.
This study relied on self-reporting to measure purchase intentions. An observational
research approach may provide a more accurate measure of product placement purchase
behaviour.
Future research directed at testing this model amongst non-student members of South
Africa’s Generation Y, as well as amongst other generational cohorts would also
contribute to the literature on South African’s overall reactions to product placement and
its effectiveness as a marketing tool.
Future research directed at testing this model against genre specific content (for example,
comedy, drama and action), other online media platforms (for example, social games)
and other video-on-demand/streaming platforms (for example, TVOD, SVOD, AVOD, and
the like) may also contribute to the literature on South African’s overall reactions to
product placement marketing tactics.
6.7 CONCLUSION
In conclusion, there is little dispute that product placement is the future of advertising in
old media, digital media and beyond, and that the old and intrusive ways of pushing
commercial messages onto consumers are a thing of the past. This study empirically
tested a model of the antecedents of Generation Y students’ attitudes and behavioural
responses towards product placement in movies and TV shows. Understanding the
factors that influence different segments to interact favourably with placed brands helps

166
marketers to tailor their brand communication efforts. This model may be applied to
predict attitudes and purchase intentions towards product placements across various
entertainment content in various media platforms and amongst different segments of the
population.

167
BIBLIOGRAPHY
Aaker, D.A., Kumar, V. & Day, G.S. 2004. Essentials of marketing research. 2nd ed.
New York: John Wiley & Sons.
Ajzen, I. 1985. From intentions to actions: a theory of planned behavior. (In. Kuhl J., &
Beckmann J. ed. Action control. SSSP Springer series in social psychology. Berlin,
Heidelberg: Springer. p: 11-39).
Ajzen, I. 1991. The theory of planned behavior. Organizational behavior and human
decision processes, 50(2):179-211.
Ajzen, I. 2011. The theory of planned behaviour: reactions and reflections. Journal of
psychology and health, 26(9):1113-1127.
Ajzen, I. & Fishbein, M. 1977. Attitude-behavior relations: a theoretical analysis and
review of empirical research. Psychological bulletin, 84(5):888-918.
Ajzen, I. & Fishbein, M. 2000. Attitudes and the attitude-behavior relation: reasoned
and automatic processes. European review of social psychology, 11(1):1-33.
Aksu H., Babun L., Conti M., Tolomei G. & Uluagac, A.S. 2018. Advertising in the IoT
era: vision and challenges. IEEE Communications magazine. 13 Apr.
https://ieeexplore.ieee.org/abstract/document/8337812 Date of access: 10 Sep 2018.
Al-Kadi, T. 2013. Product placement: a booming industry in search of appropriate
regulation. Journal of marketing research and case studies, 2013:1-13.
Alkenani, A. & Yu, K. 2013. A comparative study for robust canonical correlation
methods. Journal of statistical computation and simulation, 83(4):692-720.
Allport, G.W. 1935. Attitudes. (In Murchison, C. ed, Handbook of social psychology.
Worcester, MA: Clark University Press. p. 798–844).
Alwitt, L.F. & Prabhaker, P.R. 1994. Identifying who dislikes television advertising: not
by demographics alone. Journal of advertising research, 34(6):17-30.

168
Anderson, D.R., Sweeney, D.J., Williams, T.A., Camm, J.D. & Cochran, J.J. 2016.
Statistics for business & economics. 4th ed. Mason, Ohio: Nelson Education.
Andrews, J.C. 1989. The dimensionality of beliefs toward advertising in general.
journal of advertising, 18(1):26-35.
Armitage, C.J. & Conner, M. 2001. Efficacy of the theory of planned behaviour: a
meta‐analytic review. British journal of social psychology, 40(4):471-499.
Aronson, Z., Shenhar, A. & Reilly, R. 2010. Project spirit: placing partakers' emotions,
attitudes and norms in the context of project vision, artifacts, leader values, contextual
performance and success. The journal of high technology management research,
21(1):2-13.
Ashikali, E., Dittmar, H. & Ayers, S. 2017. The impact of cosmetic surgery advertising
on women’s body image and attitudes towards cosmetic surgery. Psychology of
popular media culture, 6(3):255-273.
Ashill, N.J. & Yavas, U. 2005. Dimensions of advertising attitudes: congruence
between Turkish and New Zealand consumers. Marketing intelligence & planning,
23(4):340-349.
Auty, S. & Lewis, C. 2004. Exploring children's choice: the reminder effect of product
placement. Psychology & marketing, 21(9):697-713.
Avery, R.J. & Ferraro, R. 2000. Verisimilitude or advertising? brand appearances on
prime‐time television. Journal of consumer affairs, 34(2):217-244.
Babacan, E., Akcali, S.İ. & Baytekin, E.P. 2012. Product placement as a rising
marketing communication activity: an assessment on television serials. Procedia-social
and behavioral sciences, 62:1319-1331.
Babin, L.A. & Carder, S.T. 1996. Viewers' recognition of brands placed within a film.
International journal of advertising, 15(2):140-151.
Babin, B.J. & Zikmund, W.G. 2015. Essentials of marketing research, Boston, MA:
South-Western Cengage Learning.

169
Baggaley, A. R. 1981. Multivariate analysis: an introduction for consumers of
behavioral research. Evaluation review, 5:123-131.
Balakrishnan, B.K., Dahnil, M.I. & Yi, W.J. 2014. The impact of social media marketing
medium toward purchase intention and brand loyalty among Generation Y. Procedia-
social and behavioral sciences, 148(2):177-185.
Balasubramanian, S.K. 1994. Beyond advertising and publicity: hybrid messages and
public policy issues. Journal of advertising, 23(4):29-46.
Balasubramanian, S.K., Karrh, J.A. & Patwardhan, H. 2006. Audience response to
product placements: an integrative framework and future research agenda. Journal of
advertising, 35(3):115-141.
Bandura, A. 1977. Self-efficacy: toward a unifying theory of behavioral change.
Psychological review, 84(2):191-215.
Barn, S. 2009. Product placement in Bollywood movies. Marketing intelligence & plan,
27(7):976-980.
Bass, F.M. & Talarzyk, W.W. 1972. An attitude model for the study of brand
preference. Journal of marketing research, 9(1):93-96.
Bathgate, C.J., Edinger, J.D. & Krystal, A.D. 2017. Insomnia patients with objective
short sleep duration have a blunted response to cognitive behavioral therapy for
insomnia. Sleep, 40(1). https://doi.org/10.1093/sleep/zsw012 Date of access: 15 Mar.
2018.
Batra, R. & Ray, M.L. 1 986. Affective responses mediating acceptance of advertising.
Journal of consumer research, 13(2):234-249.
Bauer, R.A. & Greyser, S.A. 1968. Advertising in America, the consumer view. Journal
of marketing research, 6(2):240-257.
Belch, G.E. & Belch, M.A. 2004. Advertising and Promotion: An integrated marketing
communications perspective. 6th ed. New York, NY: McGraw-Hill.
Bem, D. J. 1970. Beliefs, attitudes, and human affairs. England: Brooks/Cole Oxford.
170
Bem, D.J. 1972. Self-perception theory. Advances in experimental social psychology,
6:1-62.
Beneke, J. 2012. Product placement in South Africa: piercing through the packaging.
African journal of business management, 6(3):1068-1075.
Bentler, P.M. & Bonett, D.G. 1980. Significance tests and goodness of fit in the
analysis of covariance structures. Psychological bulletin, 88(3):588-606.
Berger, A.A. 2015. Media and communication research methods: an introduction to
qualitative and quantitative approaches. Thousand Oaks Calif: Sage Publications.
Bergkvist, L., Hjalmarson, H. & Mägi, A.W. 2016. A new model of how celebrity
endorsements work: attitude toward the endorsement as a mediator of celebrity source
and endorsement effects. International journal of advertising, 35(2):171-184.
Betsch, T., Plessner, H. & Schallies, E. 2004. The value-account model of attitude
formation. (In Haddock, G & Maio, G.R. ed, Contemporary perspectives on the
psychology of attitudes. Psychology Press. p. 251-274).
Bettiga, D., Lamberti, L. & Noci, G. 2017. Do mind and body agree? Unconscious
versus conscious arousal in product attitude formation. Journal of business research,
75:108-117.
Bevan-Dye, A.L. 2013. Black Generation Y students’ attitudes towards web advertising
value. Mediterranean journal of social sciences, 4(2):155-164.
Bevan-Dye, A. 2016. Profiling the Generation Y cohort. Inaugural lecture, 23
November. Vanderbijlpark: North-West University, Vaal Triangle Campus.
https://repository.nwu.ac.za/handle/10394/19706 Date accessed: 10 Jan. 2017.
Bevan-Dye, A.L. & Akpojivi, U. 2016. South African Generation Y students’ self-
disclosure on facebook. South African journal of psychology, 46(1):114-129.

171
Bevan-Dye, A.L., Dhurup, M. & Surujlal, J. 2009. Black Generation Y students'
perceptions of national sport celebrity endorsers as role models: sport management.
African journal for physical health education, recreation and dance, 9(1):172-188.
Bevan-Dye, A.L., Garnett, A. & De Klerk, N. 2012. Materialism, status consumption
and consumer ethnocentrism amongst black Generation Y students in South Africa.
African journal of business management, 6(16):5578-5586.
Bevan-Dye, A.L. & Surujlal, J. 2011. Attitude towards materialism in sport and materialism
tendencies amongst black Generation Y students. African journal for physical health
education, recreation and dance, 17(2):43-55.
Bian, Q. & Forsythe, S. 2012. Purchase intention for luxury brands: a cross cultural
comparison. Journal of business research, 65(10):1443-1451.
Bolton, R.N., Parasuraman, A., Hoefnagels, A., Migchels, N., Kabadayi, S., Gruber, T.,
Komarova Loureiro, Y. & Solnet, D. 2013. Understanding Generation Y and their use
of social media: a review and research agenda. Journal of service management,
24(3):245-267.
Borborjafari, M., Khorshid, S. & Rastegar, A. 2016. Evaluating the relationship of
rational advertising appeals, cognitive information processing styles of consumers and
advertising effectiveness. International business management, 10(15):2928-2934.
Bratt, M. 2018. Gloomy picture for TV and radio advertising spend in South Africa.
The Media Online, 9 Mar. https://themediaonline.co.za/2018/03/gloomy-picture-for-tv-
and-radio-advertising-spend-in-sa/ Date of access: 15 May 2018.
Breckler, S.J. 1984. Empirical validation of affect, behavior, and cognition as distinct
components of attitude. Journal of personality and social psychology, 47(6)1191-1205.
Brennan, S., Rosenberger III, P.J. & Hementera, V. 2004. Product placements in
movies: An Australian consumer perspective on their ethicality and acceptability.
Marketing bulletin, 15(1):1-16.

172
Bressoud, E., Lehu, J. & Russell, C.A. 2010. The product well placed: the relative
impact of placement and audience characteristics on placement recall. Journal of
advertising research, 50(4):374-385.
Brown, S.P. & Stayman, D.M. 1992. Antecedents and consequences of attitude toward
the ad: a meta-analysis. Journal of consumer research, 19(1):34-51.
Bryman, A. & Bell, E. 2015. Business research methods. USA: Oxford University
Press.
Burns, A. & Bush, R. 2006. Marketing research. 5th ed. Upper Saddle River, N.J:
Pearson.
Canavan, B. 2018. The complex cohort: a netnographic review of Generation Y
backpackers. Leisure studies, 37(2):184-196.
Cartwright, R.F. & Opree, S.J. 2016. All that glitters is not gold: do materialistic cues in
advertising yield resistance? Young consumers, 17(2):183-196.
Cartwright R.F., Opree S.J., van Reijmersdal E.A. 2018. Fool’s gold”: linking materialism to
persuasion knowledge activation and susceptibility to embedded advertising. (In:
Cauberghe V., Hudders L. & Eisend M. ed. Advances in advertising research IX. European
Advertising Academy. Wiesbaden: Springer Gabler. p:17-18)
Caspi, A. & Roberts, B.W. 2001. Personality development across the life course: the
argument for change and continuity. Psychological inquiry, 12(2):49-66.
Chaiken, S. 1980. Heuristic versus systematic information processing and the use of
source versus message cues in persuasion. Journal of personality and social
psychology, 39(5):752-766.
Chaiken, S. & Stangor, C. 1987. Attitudes and attitude change. Annual review of
psychology, 38(1):575-630.
Chan, F.F.Y., Petrovici, D. & Lowe, B. 2016. Antecedents of product placement
effectiveness across cultures. International marketing review, 33(1):5-24.

173
Chatfield, C. 2018. Introduction to multivariate analysis. New York: Routledge.
Chen, H. & Deterding, A. 2013. College-aged young consumers' interpretations of
product placement in social games. Young consumers, 14(1):41-51.
Chi, H.K., Yeh, H.R. & Yang, Y.T. 2009. The impact of brand awareness on consumer
purchase intention: the mediating effect of perceived quality and brand loyalty. The
journal of international management studies, 4(1):135-144.
Cholinski, A. 2012. The effectiveness of product placement: a field quasi-experiment.
International journal of marketing studies, 4(5):14-25.
Chu, S. & Kim, J. 2018. The current state of knowledge on electronic word-of-mouth in
advertising research. International journal of advertising, 37(1):1-13.
Clark, L.A. & Watson, D. 1995. Constructing validity: basic issues in objective scale
development. Psychological assessment, 7(3):309-319.
Coetzee, M. & Harry, N. 2014. Emotional intelligence as a predictor of employees'
career adaptability. Journal of vocational behavior, 84(1): 90-97.
Cohen, J., Cohen, P., West, S.G. & Aiken, L.S. 2013. Applied multiple
regression/correlation analysis for the behavioral sciences. New York: Routledge.
Conner, M. & Armitage, C.J. 1998. Extending the theory of planned behavior: a review
and avenues for further research. Journal of applied social psychology, 28(15):1429-
1464.
Conner, M., Sheeran, P., Norman, P. & Armitage, C.J. 2000. Temporal stability as a
moderator of relationships in the theory of planned behaviour. British journal of social
psychology, 39(4):469-493.
Corniani, M. 2001. Product Placement and brand equity. Symphonya: emerging
issues in management, 1(1): 66-82.
Cowley, E. & Barron, C. 2008. When product placement goes wrong: the effects of
program liking and placement prominence. Journal of advertising, 37(1):89-98.

174
Craig-Lees, M., Scott, J. & Wong, R. 2008. Perceptions of product placement practice
across Australian and US practitioners. Marketing intelligence & planning, 26(5):521-
538.
Cronbach, L.J. 1951. Coeficient Alpha and the Internal Structure of Test.
Psychometrika, 16(3):297-305.
Cronbach, L.J. & Meehl, P.E. 1955. Construct validity in psychological tests.
Psychological bulletin, 52(4):281-302.
Cronin, J.J. & Menelly, N.E. 1992. Discrimination vs. avoidance: “Zipping” of television
commercials. Journal of advertising, 21(2):1-7.
Crupi, A. 2015. TV is Still the Most Effective Ad Vehicle. Adage, 19 Jun.
https://adage.com/article/media/study/298943/ Date of access: 15 Mar. 2017.
d'Astous, A. & Chartier, F. 2000. A study of factors affecting consumer evaluations
and memory of product placements in movies. Journal of current issues & research in
advertising, 22(2):31-40.
d’Astous, A. & Seguin, N. 1999. Consumer reactions to product placement strategies
in television sponsorship. European journal of marketing, 33(9/10):896-910.
Dahlen, M. & Rosengren, S. 2016. If advertising won't die, what will it be? toward a
working definition of advertising. Journal of advertising, 45(3):334-345.
Dattalo, P.V. 2014. A demonstration of canonical correlation analysis with orthogonal
rotation to facilitate interpretation. https://scholarscompass.vcu.edu/socialwork_pubs/2/
Date of access: 25 Apr. 2018.
Davtyan, D. & Cunningham, I. 2017. An investigation of brand placement effects on
brand attitudes and purchase intentions: brand placements versus TV commercials.
Journal of business research, 70:160-167.
De Gregorio, F. & Sung, Y. 2010. Understanding attitudes toward and behaviors in
response to product placement. Journal of advertising, 39(1):83-96.

175
DeLorme, D.E. & Reid, L.N. 1999. Moviegoers experiences and interpretations of
brands in films revisited. Journal of advertising, 28(2):71-95.
de Winter, J.C., Gosling, S.D. & Potter, J. 2016. Comparing the Pearson and
Spearman correlation coefficients across distributions and sample sizes: a tutorial using
simulations and empirical data. Psychological methods, 21(3):273-290.
Department of Higher Education and Training. 2018. University Education.
www.dhet.gov.za/SitePages/UniversityEducation.aspx Date of access: 27 January
2019.
Derbaix, C.M. 1995. The impact of affective reactions on attitudes toward the
advertisement and the brand: a step toward ecological validity. Journal of marketing
research, 32(4):470-479.
Dianoux, C., Linhart, Z. & Vnoucková, L. 2014. Attitude toward advertising in general
and attitude toward a specific type of advertising-a first empirical approach. Journal of
competitiveness, 6(1): 87-104.
Dias, J.A., Dias, J.G. & Lages, C. 2017. Can negative characters in soap operas be
positive for product placement? Journal of business research, 71(1):125-132.
Dobre, A.M. 2005. The dynamics of Europeanisation, regionalisation and regionalism:
The Romanian case of regional re-construction. Südosteuropa. Zeitschrift für
Gegenwartsforschung, 53(4): 540-556.
Duane, T., 1999. The elaboration likelihood model: current status and controversies.
dual-process theories in social psychology, 41(1).
https://scholar.google.co.za/scholar?hl=en&as_sdt=0%2C5&q=Duane+1999%2C+The+
elaboration+likelihood+model&btnG= Date of access: 20 Dec. 2016.
Duh, H.I. 2016. Childhood family experiences and young Generation Y money
attitudes and materialism. Personality and individual differences, 95:134-139.
Eagle, L. & Dahl, S. 2018. Product placement in old and new media: examining the
evidence for concern. Journal of business ethics, 147(3):605-618.

176
Eagly, A.H. & Chaiken, S. 1993. The psychology of attitudes. USA, Calif: Harcourt
Brace Jovanovich College Publishers.
Edwards, A.L. 1954. Experiments: Their planning and execution. Handbook of social
psychology, 51(1): 259-288.
Eisend, M. 2016. Comment: advertising, communication, and brands. Journal of
advertising, 45(3):353-355.
Eisend, M. & Tarrahi, F. 2016. The effectiveness of advertising: a meta-meta-analysis
of advertising inputs and outcomes. Journal of advertising, 45(4):519-531.
eMarketer. 2018. eMarketer releases new global media ad spending estimates.
https://www.emarketer.com/.../emarketer-total-media-ad-spending-worldwide-will-rise-7
Date of access: 6 Jun. 2018.
Eze, U.C. & Lee, C.H. 2012. Consumers' attitude towards advertising. International
journal of business and management, 7(13):94.
Fam, K. & Waller, D.S. 2006. Identifying likeable attributes: a qualitative study of
television advertisements in Asia. Qualitative market research: an international journal,
9(1):38-50.
Farris, R., Chong, F. & Danning, D. 2002. Generation Y: purchasing power and
implications for marketing. Academy of marketing studies journal, 6(1-2): 89.
Fazio, R.H., Sanbonmatsu, D.M., Powell, M.C. & Kardes, F.R. 1986. On the automatic
activation of attitudes. Journal of personality and social psychology, 50(2):229-238.
Feinberg, M.F., Kinnear, C.T., & Taylor, R.J. 2013. Modern marketing research
concepts, methods, and cases. 2nd ed. Austria: South-Western, Cengage Learning.
Fishbein, M. & Ajzen, I. 1975. Belief, attitude, intention and behavior: an introduction to
theory and research. Reading, MA: Addison-Wesley.
Fishbein, M. & Middlestadt, S. 1995. Noncognitive effects on attitude formation and
change: fact or artefact? Journal of consumer psychology, 4(2):181-202.

177
Ganesan, P., Sridhar, M. & Priyadharsani, S. 2017. Reciprocal relationship and the
mediating role between dimensions of attitude towards advertisement (Aad), brand
attitude (Abr) and purchase intention (PI): A case study of ready-to-eat food products.
Journal of contemporary management research, 11(2):25-53.
Gardiner, S., Grace, D. & King, C. 2014. The generation effect: the future of domestic
tourism in Australia. Journal of travel research, 53(6):705-720.
Gardner, M.P. 1985. Does attitude toward the ad affect brand attitude under a brand
evaluation set? Journal of marketing research 22(2):192-198.
Gerrard, M., Gibbons, F.X., Houlihan, A.E., Stock, M.L. & Pomery, E.A. 2008. A dual-
process approach to health risk decision making: the prototype willingness model.
Developmental review, 28(1):29-61.
Gibson, B. & Maurer, J. 2000. Cigarette Smoking in the Movies: the influence of
product placement on attitudes toward smoking and smokers1. Journal of applied
social psychology, 30(7):1457-1473.
Giles, D.C. & Maltby, J., 2004. The role of media figures in adolescent development:
relations between autonomy, attachment, and interest in celebrities. Personality and
individual differences, 36(4):813-822.
Gillespie, B., Muehling, D.D. & Kareklas, I. 2018. Fitting product placements: affective
fit and cognitive fit as determinants of consumer evaluations of placed brands. Journal
of business research, 82:90-102.
Ginter, J.L. 1974. An experimental investigation of attitude change and choice of a new
brand. Journal of marketing research, 11(1):30-40.
Gorn, G.J. 1982. The effects of music in advertising on choice behavior: a classical
conditioning approach. The journal of marketing, 46(1):94-101.
Gould, S.J., Gupta, P.B. & Grabner-Kräuter, S. 2000. Product placements in movies: a
cross-cultural analysis of Austrian, French and American consumers' attitudes toward
this emerging, international promotional medium. Journal of advertising, 29(4):41-58.

178
Greene, J.D. & Stock, J.S. 1966. Brand attitudes as measures of advertising effects.
Journal of advertising research, 6(2):14-22.
Guido, G., Peluso, A.M., Tedeschi, P., Nicole, C., Lauretti, C. & Caciula, A. 2010.
Acceptance of product placement in Italy: effects of personality and product/consumer
interactions. International journal of marketing studies, 2(2):34.
Gupta, P.B. & Gould, S.J. 1997. Consumers' perceptions of the ethics and
acceptability of product placements in movies: product category and individual
differences. Journal of current issues & research in advertising, 19(1):37-50.
Gupta, P.B. & Lord, K.R. 1998. Product placement in movies: the effect of prominence
and mode on audience recall. Journal of current issues & research in advertising,
20(1):47-59.
Gupta, R.K. & Yadav, S.K. 2017. New efficient estimators of population mean using
non-traditional measures of dispersion. Open journal of statistics, 7(3): 394-404.
Gutnik, L., Huang, T., Lin, J.B. & Schmidt, T. 2007. New trends in product placement.
Strategic computing and communication technology. people.ischool.berkeley.edu/~hal/
Courses/StratTech07/Tech/Preso/D-placement.do Date of access: 15 Mar. 2016.
Greyser, S.A. 1972. Advertising-attacks and counters. Harvard business review,
50(2):33-41.
Griffin, E. 2012. A first look at communication theory. 8th ed. New York: McGraw-Hill.
Hair, J.F., Black, W.C., Babin, B.J. & Anderson, R.E. 2010. Multivariate data analysis:
a global perspective. 7th ed. Upper Saddle River, N.J: Pearson.
Hair, J.F., Wolfinbarger, M., Ortinau, D.J. & Bush, R.P. 2013. Essentials of marketing
research. 3r d ed. New York: McGraw-Hill.
Hair Jr, J.F., Wolfinbarger, M., Money, A.H., Samouel, P. & Page, M.J. 2015.
Essentials of business research methods. New York: Routledge.

179
Hanekom, J. & Scriven, C. 2002. Traditional and online advertising: an explanation of
current and future trends. Communication. South African Journal of communication
theory and research, 28(1):4959.
Hardoon, D.R., Szedmak, S. & Shawe-Taylor, J. 2004. Canonical correlation analysis:
an overview with application to learning methods. Neural computation, 16(12): 2639-
2664.
Hausenblas, H.A., Carron, A.V. & Mack, D.E. 1997. Application of the theories of
reasoned action and planned behavior to exercise behavior: a meta-analysis. Journal
of sport and exercise psychology, 19(1):36-51.
Heffernan, A. 2018. Fees must fall: student revolt, decolonisation, and governance in
South Africa/as by fire: the end of the South African university. South African historical
journal, 70(2):434-452.
Heider, F. 1946. Attitudes and cognitive organization. The journal of psychology,
21(1):107-112.
Hernandez, M.D., Chapa, S., Minor, M.S., Maldonado, C. & Barranzuela, F. 2004.
Hispanic attitudes toward advergames: a proposed model of their antecedents. Journal
of interactive advertising, 5(1):74-83.
Higgins, E.T. 2011. Beyond pleasure and pain: how motivation works. USA : Oxford
University Press.
Hills, C.M., Levett-Jones, T., Lapkin, S. & Warren-Forward, H. 2017. Generation Y
health professional students’ preferred teaching and learning approaches: a systematic
review. The open journal of occupational therapy, 5(1):12-29.
Holbrook, M.B. 1978. Beyond attitude structure: toward the informational determinants
of attitude. Journal of marketing research, 15(4):545-556.
Homer, P.M. 1990. The mediating role of attitude toward the ad: some additional
evidence. Journal of marketing research, 27(1):78-86.
Homer, P.M. 2009. Product placements. Journal of advertising, 38(3):21-32.

180
Hotelling, H. 1936. Relations between two sets of variates. Biometrika, 28(3-4):321-
377.
Howard, J.A. 1977. Consumer behavior: application of theory. New York: McGraw-Hill
Companies.
Hudson, S. & Elliott, C. 2013. Measuring the impact of product placement on children
using digital brand integration. Journal of food products marketing, 19(3):176-200.
Hudson, S. & Hudson, D. 2006. Branded entertainment: a new advertising technique
or product placement in disguise? Journal of marketing management, 22(5-6):489-504.
Huh, J., Delorme, D.E. & Reid, L.N. 2016. A model of consumer response to over-the-
counter drug advertising: antecedents and influencing factors. Journal of health
communication, 21(1):109-117.
Iacobucci, D. & Churchill, A.G. 2010. Marketing research: methodological foundations.
10th ed. Mason, OH: Cengage Learning.
James, W.L. & Kover, A.J. 1992. Do overall attitudes toward advertising affect
involvement with specific advertisements? Journal of advertising research, 32(5):78-83.
Jang, Y.J., Kim, W.G. & Bonn, M.A. 2011. Generation Y consumers’ selection
attributes and behavioral intentions concerning green restaurants. International journal
of hospitality management, 30(4):803-811.
Jaspers, E.D. & Pieters, R.G. 2016. Materialism across the life span: an age-period-cohort analysis. Journal of personality and social psychology, 111(3):451-469. Jeong, E.J., Bohil, C.J. & Biocca, F.A. 2011. Brand logo placements in violent games.
Journal of advertising, 40(3):59-72.
Jin, H.S. & Lutz, R.J. 2013. The typicality and accessibility of consumer attitudes
toward television advertising: implications for the measurement of attitudes toward
advertising in genera. Journal of advertising, 42(4): 343-357.
Jonas, K., Broemer, P. & Diehl, M. 2000. Attitudinal ambivalence. European review of
social psychology, 11(1):35-74.

181
Kamleitner, B. & Khair J, A. 2013. How using versus showing interaction between
characters and products boosts product placement effectiveness. International journal
of advertising, 32(4) 633-653.
Karisik, V.J. 2014. 20 years of research on product placement in movie, television and
video game media. Journal of economic & social studies (JECOSS), 4(2):253-285.
Karrh, J.A. 1998. Brand placement: a review. Journal of current issues & research in
advertising, 20(2):31-49.
Karrh, J.A., Frith, K.T. & Callison, C. 2001. Audience attitudes towards brand (product)
placement: Singapore and the United States. International journal of advertising,
20(1):3-24.
Karrh, J.A., McKee, K.B. & McKee, C.J. 2003. Practitioners' evolving views on product
placement effectiveness. Journal of advertising research, 43(2):138-149.
Kaya, H., Eyben, F., Salah, A.A. & Schuller, B. 2014. CCA based feature selection with
application to continuous depression recognition from acoustic speech features. In
Proceedings 39th IEEE international conference on acoustics, speech, and signal
processing), Florence, Italy. https://ieeexplore.ieee.org/document/6854298/ Date of access:
15 Mar. 2017.
Keller, K.L. 2009. Building strong brands in a modern marketing communications
environment. Journal of marketing communications, 15(2-3):139-155.
Kit, L.C. & P'ng, E.L.Q. 2014. The effectiveness of product placement: the influence of
product placement towards consumer behavior of the millennial generation.
International journal of social science and humanity, 4(2):138-156.
Kline, P. 2014. An easy guide to factor analysis. New York: Routledge.
Knapp, T.R. 1978. Canonical correlation analysis: a general parametric significance-
testing system. Psychological bulletin, 85(2):410-416.
Kotler, P. & Armstrong, G. 2010. Principles of marketing: global and South African
perspectives. Cape Town: Pearson education.

182
Kotler, P. & Keller, K. 2012. Building brand equity through corporate societal
marketing. Journal of public policy & marketing, 21(1): 78-89.
Kozary, B. & Baxter, S. 2010. The influence of product placement prominence on
consumer attitudes and intentions: a theoretical framework. Proceedings of the
Australian and New Zealand Marketing Academy Conference: Doing more with lesss.
Canterbury, New Zealand. 29 November. https://ogma.newcastle.edu.au/vital/access/
%20/manager/Repository/uon:11643 Date of access: 15 Apr. 2016.
Krech, D., Crutchfield, R. S., & Ballachey, E. L. 1962. Individual in society: A textbook
of social psychology. New York, NY, USA: McGraw-Hill.
Krosnick, J. A., & Petty, R. E. 1995. Attitude strength: an overview. (In Petty, R.E. &
Krosnick, J.A. ed. Ohio State University series on attitudes and persuasion, Vol. 4.
Hillsdale, NJ, US: Lawrence Erlbaum Associates, Inc. p:1-24).
Kruglanski, A.W. & Van Lange, P.A.M. 2012. Handbook of theories of social
psychology. London, England: Sage.
Kueh, K. & Voon, B.H. 2007. Culture and service quality expectations: Evidence from
Generation Y consumers in Malaysia. Managing service quality: An international
journal, 17(6):656-680.
Kumar, S. 2017. Influence of product placements in films and television on consumers’
brand awareness. Archives of business research, 5(2):163-172.
Kumar, V. & Gupta, S. 2016. Conceptualizing the evolution and future of advertising.
Journal of advertising, 45(3):302-317.
Kunda, Z. 1990. The case for motivated reasoning. Psychological bulletin,
103(3):480–498.
Kureshi, S. & Sood, V. 2010. A review of placement literature: conceptual and
managerial implications. IUP journal of marketing management, 9(1/2):23-39.
Kwon, E.S. 2012. Exploring consumers' attitudes and behavior toward product placement in
television shows. Syracuse, New York: Syracuse University. (Thesis-MA)

183
Larkin, E.F. 1977. A factor analysis of college student attitudes toward advertising.
Journal of advertising, 6(2):42-46.
Law, S. & Braun, K.A. 2000. I'll have what she's having: gauging the impact of product
placements on viewers. Psychology & marketing, 17(12):1059-1075.
Lazraq, A. & Cléroux, R. 2002. Testing the significance of the successive components
in redundancy analysis. Psychometrika, 67(3): 411-419.
Lee, M. 2010. Explaining and predicting users’ continuance intention toward e-
learning: An extension of the expectation–confirmation model. Computers & education,
54(2): 506-516.
Lee, T., Sung, Y. & de Gregorio, F. 2011. Cross-cultural challenges in product
placement. Marketing intelligence & planning, 29(4):366-384.
Lehu, J. & Bressoud, E. 2008. Effectiveness of brand placement: new insights about
viewers. Journal of business research, 61(10);1083-1090.
Lord, K.R. & Gupta, P.B. 2010. Response of buying-center participants to B2B product
placements. Journal of business & industrial marketing, 25(3):188-195.
Lorgulescu, M.C. 2016. Generation Z and its perception of work. Cross-cultural
management journal, 18(1):9-21.
Lutz, R.J. 1985. Affective and cognitive antecedents of attitude toward the ad: a
conceptual framework. Psychological process and advertising effects: theory, research,
and application: 45-63.
Lutz, R.J. 1975. Changing brand attitudes through modification of cognitive structure.
Journal of consumer research, 1(4):49-59.
Lutz, R.J., MacKenzie, S.B. & Belch, G.E. 1983. Attitude toward the ad as a mediator
of advertising effectiveness: determinants and consequences. NA-Advances in
consumer research, 10:532-539.

184
MacKenzie, S.B. & Lutz, R.J. 1989. An empirical examination of the structural
antecedents of attitude toward the ad in an advertising pretesting context. The journal
of marketing, 53(2):48-65.
MacKenzie, S.B., Lutz, R.J. & Belch, G.E. 1986. The role of attitude toward the ad as a
mediator of advertising effectiveness: a test of competing explanations. Journal of
marketing research, 23(2)130-143.
Malhotra, K.N. 2010. Marketing research: an applied orientation. 6th ed. Upper Saddle
River, N.J: Pearson Education.
Malhotra, N.K. 2012. Basic marketing research: Integration of social media. Boston:
Pearson Education.
Malhotra, N.K., Birks, D.F. & Wills, P. 2013. Essentials of marketing research. Harlow,
England: Pearson Education.
Mandes, J. 2014. Product placement poised to top $10 billion: report cites fewer, more
valuable deals including upfronts, Netflix. Media Post, 13 Jun. https://www.mediapost.
com/.../product-placement-poised-to-top-10-billion-repor.html Date of access: 2 Sep.
2018.
Manyiwa, S. & Brennan, R. 2016. Impact of materialism on consumers' ethical
evaluation and acceptance of product placement in movies. Social business, 6(1):65-
82.
Markert, J. 2004. Demographics of age: generational and cohort confusion. Journal of
current issues & research in advertising, 26(2):11-25.
Matthes, J., Schemer, C. & Wirth, W. 2007. More than meets the eye: investigating the
hidden impact of brand placements in television magazines. International journal of
advertising, 26(4):477-503.
McDaniel, C. & Gates, R. 2014. Marketing Research, 10th ed. Hoboken, N.J: Wiley.

185
McEachan, R.R.C., Conner, M., Taylor, N.J. & Lawton, R.J. 2011. Prospective
prediction of health-related behaviours with the theory of planned behaviour: a meta-
analysis. Health psychology review, 5(2):97-144.
McGuire, W. J. 1968. Personality and attitude change: an information-processing
theory. (In Greenwald, A.G., Brock, T.C. & Ostrom, T.M. ed, Psychological
foundations of attitudes. New York: Academic Press. p:171-196).
McKechnie, S.A. & Zhou, J. 2003. Product placement in movies: a comparison of
Chinese and American consumers’ attitudes. International journal of advertising,
22(3):349-374.
Mehta, A. 2000. Advertising attitudes and advertising effectiveness. Journal of
advertising research, 40(3):67-72.
Mehta, A. & Purvis, S.C. 1995. When attitudes towards advertising in general influence
advertising success. In Conference proceedings of the 1995 American Academy of
Advertising. Waco, TX: Baylor University, Norfolk, VA.
https://scholar.google.co.za/scholar?hl=en&as_sdt=0%2C5&q=Mehta%2C+A.+%26+P
urvis%2C+S.C.%2C++1995%2C++May.+When+attitudes+towards+advertising+in+gen
eral+influence+advertising+success.+In+Conference+proceedings+of+the+American+
Academy+of+Advertising.+Waco%2C+TX%3A+Baylor+University%2C+Norfolk%2C+V
A.&btnG= Date accessed: 2 December 2016.
Meyers, L.S., Gamst, G. & Guarino, A.J. 2016. Applied multivariate research: design
and interpretation. Thousand Oaks, Calif: Sage publications.
Miller, K. 2005. Communication theories: perspectives, processes, and contexts.
Boston: McGraw-Hill.
Mitchell, T.R. 1974. Expectancy models of job satisfaction, occupational preference
and effort: A theoretical, methodological, and empirical appraisal. Psychological
bulletin, 81(12):1053-1077.
Mitchell, A.A. & Olson, J.C. 1981. Are product attribute beliefs the only mediator of
advertising effects on brand attitude? Journal of marketing research, 18(3):318-332.

186
Mittal, B. 1994. Public assessment of TV advertising: faint praise and harsh criticism.
Journal of advertising research, 34(1):35-54.
Moerdykon, C. 2014. Justifiable anger over clumsy TV product placement. 23 Nan.
The Midia Online, https://themediaonline.co.za › Advertising Date of access: 15 Mar.
2017.
Moolman, A. & Jacobs, L. 2018. Responses to the short-term effect of the zero per cent
fee increase on South African universities. South African journal of higher education,
32(1): 178-191.
Morton, C.R. & Friedman, M. 2012. I saw it in the movies, exploring the link between
product placement beliefs and reported usage behavior. Journal of current issues &
research in advertising, 24(2):33-40.
Muehling, D.D. 1987. An investigation of factors underlying attitude-toward-advertising-
in-general. Journal of advertising, 16(1):32-40.
Mumusamy, J. & Wong, C.H. 2007. Attitude towards advertising among students at
private higher learning institutions in Selangor. Unitar e-journal, 3(1):31-51.
Muzellec, L., Kanitz, C. & Lynn, T. 2013. Fancy a coffee with Friends in ‘Central Perk’?
reverse product placement, fictional brands and purchase intention. International journal
of advertising, 32(3):399-417
Myers, J.H. & Alpert, M.I. 1968. Determinant buying attitudes: meaning and
measurement. Journal of marketing, 32(4):13-20.
Naderer, B., Matthes, J., Marquart, F. & Mayrhofer, M. 2018. Children's attitudinal and
behavioral reactions to product placements: investigating the role of placement
frequency, placement integration, and parental mediation. International journal of
advertising, 37(2):236-255.
Nebenzahl, I.D. & Jaffe, E.D. 1996. Measuring the joint effect of brand and country
image in consumer evaluation of global products. International marketing review,
13(4):5-22.

187
Nebenzahl, I.D. & Secunda, E. 1993. Consumers' attitudes toward product placement
in movies. International journal of advertising, 12(1):1-11.
Nelson, M.R., Keum, H. & Yaros, R.A. 2004. Advertainment or adcreep game players’
attitudes toward advertising and product placements in computer games. Journal of
interactive advertising, 5(1):3-21.
Nelson, M.R. & McLeod, L.E. 2005. Adolescent brand consciousness and product
placements: awareness, liking and perceived effects on self and others. International
journal of consumer studies, 29(6):515-528.
Newell, J., Salmon, C.T. & Chang, S. 2006. The hidden history of product placement. Journal of broadcasting & electronic media, 50(4):575-594.
News24. 2014. TV’s growing peepee problems. City Press. 4 Jun. https://www.
news24.com/Archives/City.../TVs-growing-peepee-problem-20150429 Date of access:
15 Mar. 2017.
Nisbett, R.E. & Ross, L. 1980. Human inference: strategies and shortcomings of social
judgment. Englewood-Cliffs, NJ: Prentice-Hall.
O'Donohoe, S. 1995. Attitudes to advertising: a review of British and American
research. International journal of advertising, 14(3):245-261.
O’Donohoe, S. 2001. Living with ambivalence: attitudes to advertising in postmodern
times. Marketing theory, 1(1):91-108.
Ofori-Dankwa, J. & Tierman, A. 2002. The effect of researchers’ focus on interpretation
of diversity data. Journal of social psychology, 142(3):277- 293.
Ogilvy, S. & Mather, S. 1985. Advertiser to consumer: how'm I doing. Listening post,
61(2):2-21.
Olson, M.A. & Fazio, R.H. 2001. Implicit attitude formation through classical
conditioning. Psychological science, 12(5):413-417.

188
Olson, J.C. & Mitchell, A.A. 1975. The process of attitude acquisition: the value of a
developmental, approach to consumer attitude research. NA - advances in consumer
research, 2(1):249-264.
Ong, B.S. 1995. Should product placement in movies be banned? Journal of
promotion management, 2(3-4):159-176.
Ordun, G. 2015. Millennial (generation Y) consumer behaviour: their shopping
preferences and perceptual maps associated with brand loyalty. Canadian social
science, 11(4):40-55.
Pallant, J. 2010. SPSS survival manual: a step by step guide to data analysis using
SPSS. 4th ed. England: Open University Press.
Panda, T.K. 2004. Effectiveness of product placements in Indian films and its effects
on brand memory and attitude with special reference to Hindi films. The ICFAI journal
of marketing management. http://hdl.handle.net/2259/555 Date of access: 15 Mar.
2017.
Park, C.W. & Young, S.M. 1986. Consumer response to television commercials: the
impact of involvement and background music on brand attitude formation. Journal of
marketing research. 23(1):11-24.
Parment, A. 2013. Generation Y vs. Baby Boomers: shopping behavior, buyer
involvement and implications for retailing. Journal of retailing and consumer services,
20(2):189-199.
Percy, L., Elliott, R.H. & Rosenbaum-Elliott, R. 2016. Strategic advertising
management, New York: Oxford University Press.
Petrovici, D. & Marinov, M. 2007. Determinants and antecedents of general attitudes
towards advertising: a study of two EU accession countries. European journal of
marketing, 41(3/4):307-326.
Petty, R.E. & Cacioppo, J.T. 1986. The elaboration likelihood model of persuasion. (in
Kennear, T. ed. Communication and persuasion. Springer series in social psychology.
New York, NY: Springer, p. 1-24).

189
Petty, R.E., Cacioppo, J.T. & Goldman, R. 1981. Personal involvement as a
determinant of argument-based persuasion. Journal of personality and social
psychology, 41(5):847-855.
Petty, R.E., Cacioppo, J.T. & Schumann, D. 1983. Central and peripheral
routes to advertising effectiveness: the moderating role of involvement.
Journal of consumer research, 10(2):135-146.
Pollay, R.W. & Mittal, B. 1993. Here's the beef: factors, determinants, and segments in
consumer criticism of advertising. The journal of marketing,57(3):99-114.
PQ Media. 2018. Custom media research. 27 Aug. https://www.pqmedia.com/press/
Date of access: 2 Sep. 2018.
Pranam, A. 2018. The good, the bad, and the unusable. Product management
essentials. Berkeley, CA: Apress, Springer.
Priceonomics. 2013. The economics of product placement. 4 Dec. https://price
onomics.com/the-economics-of-product-placements/ Date of access: 15 March 2017.
Priporas, C.V., Stylos, N. & Fotiadis, A.K. 2017. Generation Z consumers' expectations
of interactions in smart retailing: a future agenda. Computers in human behavior,
77(1):374-381.
Punch, K.F. & Oancea, A. 2014. Introduction to research methods in education.
Thousand Oaks, CA: Sage Publications.
PWC. 2017. Entertainment and media outlook 2017-2021.
https://www.pwc.co.za/en/assets/pdf/entertainment-and-media-outlook-2017.pdf Date
of access: 2 Sep. 2018.
Puto, C.P. & Wells, W.D., 1984. Informational and transformational advertising: the
differential effects of time. Advances in consumer research, 11(1):638-643.
PWC. 2018. Entertainment and media outlook 2018-2022: An African perspective. 9th
ed. https://www.pwc.co.za/en/assets/pdf/entertainment-and-media-outlook-2018-
2022.pdf Date of access: 2 Sep. 2018.

190
Rahman, M.A. 2016. University students’ attitudes towards advertising: a study of
Dhaka city of Bangladesh. International journal of marketing studies, 8(4):146157.
Rahman, S. & Azhar, S. 2011. Xpressions of Generation Y: perceptions of the mobile
phone service industry in Pakistan. Asia pacific journal of marketing and logistics,
23(1): 91-107.
Raluca, C. & Loan, P. 2010. The impact of consumers’ attitude toward advertising on
product attitude. Interdisciplinary management research, 6:727-738.
Redondo, I., Russell, C.A. & Bernal, J. 2018. To brand or not to brand a product
placement? evidence from a field study of two influence mechanisms of positive
portrayals of alcohol in film. Drug and alcohol review, 37(1):366-374.
Reid, L.N. & Soley, L.C. 1982. Generalized and personalized attitudes toward
advertising's social and economic effects. Journal of advertising, 11(3):3-7.
Rhee, J. & Johnson, K.K. 2012. Investigating relationships between adolescents' liking
for an apparel brand and brand self-congruency. Young consumers, 13(1):74-85.
Richards, J.I. & Curran, C.M. 2002. Oracles on “advertising”: searching for a definition.
Journal of advertising, 31(2):63-77.
Rodgers, W.M. & Gauvin, L. 1998. Heterogeneity of incentives for physical activity and
self‐efficacy in highly active and moderately active women exercisers. Journal of
applied social psychology, 28(11):1016-1029.
Rössler, P. & Bacher, J. 2002. Transcultural effects of product placement in movies: a
comparison of placement impact in Germany and the USA. Zeitschrift für
medienpsychologie, 14(3):98-108.
Rubin, A. & Babbie, E.R. 2016. Empowerment series: research methods for social
work. Boston, MA: Cengage Learning.
Ruiz, S. & Sicilia, M. 2004. The impact of cognitive and/or affective processing styles
on consumer response to advertising appeals. Journal of business research, 57(6):657-
664.

191
Russell, C.A. 1998. Toward a framework of product placement: theoretical
propositions. ACR North American advances in consumer research, 25(1): 357-362.
Russell, C.A. 2002. Investigating the effectiveness of product placements in television
shows: the role of modality and plot connection congruence on brand memory and
attitude. Journal of consumer research, 29(3):306-318.
Russell, C.A. & Belch, M. 2005. A managerial investigation into the product placement
industry. Journal of advertising research, 45(1):73-92.
Russell, C.A., Norman, A.T. & Heckler, S.E. 2004. The consumption of television
programming: development and validation of the connectedness scale. Journal of
consumer research, 31(1):150-161.
Russell, C.A. & Rasolofoarison, D. 2017. Uncovering the power of natural
endorsements: a comparison with celebrity-endorsed advertising and product
placements. International journal of advertising, 36(5):761-778.
Russell, C.A., Russell, D.W. & Grube, J.W. 2009. Nature and impact of alcohol
messages in a youth-oriented television series. Journal of advertising, 38(3):97-112.
Russell, C.A. & Stern, B.B. 2006. Consumers, characters, and products: a balance model of
sitcom product placement effects. Journal of advertising, 35(1):7-21.
Rust, R.T. 2016. Comment: is advertising a zombie? Journal of advertising, 45(3):346-
347.
Rust, R.T. & Oliver, R.W. 1994. The death of advertising. Journal of advertising,
23(4):71-77.
Sabour, N.I., Pillai, D., Gistri, G. & Balasubramanian, S.K. 2016. Attitudes and related
perceptions about product placement: a comparison of Finland, Italy and the United
States. International journal of advertising, 35(2):362-387.
Sandage, C.H. & Leckenby, J.D. 1980. Student attitudes toward advertising: institution
vs. instrument. Journal of advertising, 9(2):29-44.

192
Sauer, A. 2013. Announcing the 2013 Brandcameo Product Placement Award Winners.
Brand Channel, 25 Feb. https://www.brandchannel.com/2013/02/25/ announcing-the-
2013-brandcameo-product-placement-award-winners/. Date of access: 19 Dec. 2013.
Schemer, C., Matthes, J., Wirth, W. & Textor, S. 2008. Does “passing the courvoisier”
always pay off? positive and negative evaluative conditioning effects of brand
placements in music videos. Psychology & marketing, 25(10):923-943.
Schewe, C.D. & Meredith, G. 2004. Segmenting global markets by generational
cohorts: determining motivations by age. Journal of consumer behaviour: an
international research review, 4(1):51-63.
Schlosser, A.E. 1998. Applying the functional theory of attitudes to understanding the
influence of store atmosphere on store inferences. Journal of consumer psychology,
7(4):345-369.
Schlosser, A.E., Shavitt, S. & Kanfer, A. 1999. Survey of Internet users' attitudes
toward Internet advertising. Journal of interactive marketing, 13(3):34-54.
Schmoll, N.M., Hafer, J., Hilt, M. & Reilly, H. 2006. Baby boomers' attitudes towards
product placements. Journal of current issues & research in advertising, 28(2):33-53.
Schultz, D. 2016. The future of advertising or whatever we're going to call it. Journal
of advertising, 45(3):276-285.
Shavitt, S., Lowrey, P. & Haefner, J. 1998. Public attitudes toward advertising: more
favorable than you might think. Journal of advertising research, 38(4):7-22.
Sheehan, K.B. & Guo, A. 2005. Leaving on a (branded) Jet plane: an exploration of
audience attitudes towards product assimilation in television content. Journal of current
issues & research in advertising, 27(1):79-91.
Shen, X., Sun, Q. & Yuan, Y. 2015. A unified multiset canonical correlation analysis
framework based on graph embedding for multiple feature extraction. Neurocomputing,
14(8):397-408.

193
Sheppard, B.H., Hartwick, J. & Warshaw, P.R. 1988. The theory of reasoned action: a
meta-analysis of past research with recommendations for modifications and future
research. Journal of consumer research, 15(3):325-343.
Sherry, A. & Henson, R.K. 2005. Conducting and interpreting canonical correlation
analysis in personality research: a user-friendly primer. Journal of personality
assessment, 84(1):37-48.
Shimp, T.A. 1981. Attitude toward the ad as a mediator of consumer brand choice.
Journal of advertising, 10(2):9-48.
Shukla, P. 2008. Essentials of marketing research. Bookboon.
https://books.google.co.za/books?hl=en&lr=&id=aBZRBEbQWkoC&oi=fnd&pg=PA12
&dq=Shukla,+P.,+2008.+Essentials+of+marketing+research.+Bookboon.&ots=fA8TcJ
JSrB&sig=N9RsewoD6b9WWMr1cUefjkueQO8#v=onepage&q=Shukla%2C%20P.%2
C%202008.%20Essentials%20of%20marketing%20research.%20Bookboon.&f=false
Date accessed: 15 March 2016.
Siegel, P. 2004. Product placement and the law. Journal of promotion management,
10(1-2):89-100.
Silver, L., Stevens, R., Wrenn, B. & Loudon, D. 2013. The essentials of marketing
research. 3rd. USA, New York: Routledge, Taylor & Francis Group.
Smith, S.W., Atkin, C.K., Martell, D., Allen, R. & Hembroff, L. 2006. A social judgment theory
approach to conducting formative research in a social norms campaign.
Communication theory, 16(1):141-152.Communication theory, 16(1):141-152.
Sniehotta, F.F., Presseau, J. & Araújo-Soares, V. 2014. Time to retire the theory of
planned behaviour. Health psychology review, 8(1):1-7.
Soba, M. & Aydin, M. 2013. Product placement efficiency in marketing communication
strategy. International journal of business and management, 8(12): 111-117.
Soley, L.C. & Reid, L.N. 1983. Satisfaction with the informational value of magazine
and television advertising. Journal of advertising, 12(3):27-31.

194
Solomon, M., Russell-Bennett, R. & Previte, J. 2012. Consumer behaviour. Australia,
AU: Pearson Higher Education.
Speck, P.S. & Elliott, M.T. 1997. Predictors of advertising avoidance in print and
broadcast media. Journal of advertising, 26(3):61-76.
Statista. 2018. Product Placement revenue worldwide 2016-2018.
https://www.statista.com/statistics/915182/product-placement-revenue-us/ Date accessed:
28 March 2018.
Statistics South Africa. 2018. Mid-year population estimates 2018.
www.statssa.gov.za/?p=11341 Date of access: 2 Sep. 2018.
Strasburger, V.C., Hogan, M.J., Mulligan, D.A., Ameenuddin, N., Christakis, D.A.,
Cross, C., Fagbuyi, D.B., Hill, D.L., Levine, A.E. & McCarthy, C. 2013. Children,
adolescents, and the media. Pediatrics, 132(5):958-961.
Struwig, W.F. & Stead, B.G. 2011. Planning, designing, and reporting research. Cape
Town: Pearson Education South Africa.
Sung, Y., De Gregorio, F. & Jung, J. 2009. Non-student consumer attitudes towards
product placement: implications for public policy and advertisers. International journal
of advertising, 28 (2):257-285.
Taejun (David) Lee, Sung, Y. & Federico, d.G. 2011. Cross‐cultural challenges in
product placement. Marketing intelligence & plan, 29(4):366-384. F
Tan, S.J. & Chia, L. 2007. Are we measuring the same attitude? understanding media
effects on attitude towards advertising. Marketing theory, 7(4):353-377.
Thomas, W.I. & Znaniecki, F. 1918. The polish peasant in Europe and America:
monograph of an immigrant group. USA: University of Chicago Press.
Thompson, B. 1991. A primer on the logic and use of canonical correlation analysis.
Measurement and evaluation in counselling and development, 24(2): 80-95.

195
Thompson, K.H., Ellis, D., Soni, S. & Paterson, S. 2018. Attributes influencing clothing
store choice for an emerging market’s Generation Y Twixter customers. The
international review of retail, distribution and consumer research, 28(2):157-173.
Tiwsakul, R., Hackley, C. & Szmigin, I. 2005. Explicit, non-integrated product placement in
British television programmes. International journal of advertising, 24(1):95-111.
Triandis, H.C. 1971. Attitude and attitude change. New York: Wiley.
Uribe, R. 2016. Separate and joint effects of advertising and placement. Journal of
business research, 69(2):459-465.
Vakratsas, D. & Ambler, T. 1999. How advertising works: what do we really know?
The journal of marketing, 63(1):26-43.
Van Reijmersdal, E. 2009. Brand placement prominence: good for memory! bad for
attitudes? Journal of advertising research, 49(2):151-153.
Van Reijmersdal, E., Neijens, P. & Smit, E.G. 2009. A new branch of advertising.
Journal of advertising research, 49(4):429-449.
Von Neumann, J. & Morgenstern, O. 1944. Theory of games and economic
behaviour. Princeton: Princeton University Press.
Voorhees, C.M., Brady, M.K., Calantone, R. & Ramirez, E. 2016. Discriminant validity
testing in marketing: an analysis, causes for concern, and proposed remedies. Journal
of the academy of marketing science, 44(1): 119-134.
Voorveld, H.A., Fakkert, M. & van Reijmersdal, E.A. 2017. Materialistic girls watching a
materialistic world: fashion TV series and women’s copy-cat intentions. The European
journal of communication research, 42(2): 239-251.
Westfall, P.H. 2014. Kurtosis as peakedness. The American statistician, 68(3): 191-
195.

196
Whitaker, L., Long, J., Petróczi, A. & Backhouse, S. 2014. Using the prototype
willingness model to predict doping in sport. Scandinavian journal of medicine &
science in sports, 24(5): 398-405.
Wilkie, W.L. & Pessemier, E.A. 1973. Issues in marketing's use of multi-attribute
attitude models. Journal of marketing research, 10(4): 428-441.
Wilks, D.S. 2011. Statistical methods in the atmospheric sciences. Waltham, MA:
Oxford Academic Press.
Williams, K., Petrosky, A., Hernandez, E. & Page Jr, R. 2011. Product placement
effectiveness: revisited and renewed. Journal of management and marketing research,
7(1):1-24.
Williams, V.N., Medina, J., Medina, A. & Clifton, S. 2017. Bridging the millennial
generation expectation gap: perspectives and strategies for physician and inter-
professional faculty. The American journal of the medical sciences, 353(2):109-115.
Wolburg, J.M. & Pokrywczynski, J. 2001. A psychographic analysis of Generation Y
college students. Journal of advertising research, 41(5):33-52.
Yang, M. & Roskos‐Ewoldsen, D.R. 2007. The effectiveness of brand placements in
the movies: levels of placements, explicit and implicit memory, and brand‐choice
behavior. Journal of communication, 57(3):469-489.
Yoon, S., Choi, Y.K. & Song, S. 2011. When intrusive can be likable. Journal of
advertising, 40(2):63-76.
Zanot, E.J. 1984. Public attitudes towards advertising: the American experience.
International journal of advertising, 3(1):3-15.
ZenithOptMedia. 2018. Advertising Expenditure Forecasts March 2018, https://www.
zenithmedia.com/.../uploads/2018/.../Adspend-forecasts-March-2018-Exe. Date of
access: 2 Sep. 2018.

197
Zhu, D.H. & Chang, Y.P. 2015. Effects of interactions and product information on initial
purchase intention in product placement in social games: the moderating role of product
familiarity. Journal of electronic commerce research, 16(1):22-34.
Zikmund, G.W. & Babin, J.B. 2013. Essentials of marketing research. 5th ed. Mason,
Ohio: South-Western: Cengage Learning.
Zikmund, W.G., Babin, B.J., Carr, J.C. & Griffin, M. 2013. Business research methods.
Mason, OH: Cengage Learning.

198
ANNEXURES ANNEXURE A: QUESTIONNAIRE
GENERATION Y STUDENTS’ ATTITUDES AND BEHAVIOURAL RESPONSES
TOWARDS PRODUCT PLACEMENT
Dear Student,
I am conducting research on the factors that influence Generation Y students’ attitudes and
behavioural responses towards product placement in movies and TV shows for my Ph.D. at North-
West University (Vaal triangle campus) and my study promoter is Prof. Ayesha Bevan-Dye.
Product Placement refers a purposeful inclusion of brand name products into entertainment
media such as movies and TV shows (see pictures below). This study focuses on Generation Y
students who are between 18 and 24 years of age, who are recorded as being the heaviest
consumers of movies and TV shows. As such, your input is invaluable to this study.
Taken from the TV Show: American Idols Taken from the movie: Taken 2
Please complete all questions in the enclosed questionnaire. I assure you that the information
that you provide will be treated with the strictest confidentiality. The responses will be used for
academic purposes only. The questionnaire has also been cleared by the ethics committee of the
NWU (ethical clearance no: ECONIT-2016-059). The questionnaire will take approximately 15
minutes to complete.
Many Thanks
Mr. Theo Mareka
Cell number: 078 781 5536
E-mail: [email protected]

199
Section A: DEMOGRAPHICS AND MEDIA CONSUMPTION
This section seeks some background information about you. Please indicate your answer by
crossing (x) in the appropriate block.
A1 Please indicate your age.
Younger than 18 years
18 years old
19 years old
20 years old
21 years old
22 years old
23 years old
24 years old
Older than 24 years
A2 Please indicate your gender.
Male 1 Female 2
A3 Please indicate your race
Black/African 1 White 2 Coloured 3 Asian/Indian 4 Other (specify)
A4 Please indicate your home province.
Eastern Cape Free State Gauteng KwaZulu-Natal Limpopo
Mpumalanga Northern Cape North West Western Cape
A5 Please indicate your level of study.
1st year 1 2nd year 2 3rd year 3 Post graduate 4
A6 Please indicate your favourite media entertainment content.
Movies 1 TV
series 2 Local
drama/soaps 3 Reality
shows 4 Sports 5 Other 6
A7 Please indicate the means with which you access your favourite entertainment content.
Television 1 Laptop 2 Tablet 3 Online 4

200
A8 How many days per week do you spend on your favourite media content?
Every day 6 days 5 days 4 days 3 days 2 days 1 days Never
A9 On average, how many hours per day do you spend on your favourite programme/content?
Less than an hour
1
Up to two hours
2
Two to four hours
3
Four to six hours
4
Six to eight hours
5
More than eight hours
6
A10 Were you aware that product placement is in fact “advertising in disguise”?
Yes 1 Not before today 2
SECTION B: Product placement ethics
Please indicate using a cross (X) the extent to which you agree/disagree with the following
statements concerning product placement.
What you think about the ethics around product placement.
Str
ong
ly d
isa
gre
e
Dis
agre
e
Slig
htly d
isa
gre
e
Slig
htly a
gre
e
Ag
ree
Str
ong
ly a
gre
e
B1 Advertisers mislead viewers by including their brands as props in movies/TV shows.
1
2
3
4
5
6
B2 The practice of placing brands in movies/TV shows should be banned completely.
1
2
3
4
5
6
B3 The government should regulate the practice of product placements in movies/TV shows.
1
2
3
4
5
6
B4 I would pay more to see a movie/TV show without product placement.
1
2
3
4
5
6
B5 If advertisers pay to have their brands shown in movies/TV shows, this information should be disclosed at the beginning of the show.
1
2
3
4
5
6

201
What you think about the ethics around product placement.
Str
ong
ly d
isa
gre
e
Dis
agre
e
Slig
htly d
isa
gre
e
Slig
htly a
gre
e
Ag
ree
Str
ong
ly a
gre
e
B6 The use of brand name tobacco & alcohol products should be banned from PG and PG-13 rated movies/TV shows as kids watch such shows.
1
2
3
4
5
6
B7 The use of brand name tobacco & alcohol products should only be placed in movies/TV shows that kids do not watch.
1
2
3
4
5
6
B8 The use of brand name tobacco & alcohol products should be banned from all movies/TV shows.
1
2
3
4
5
6
SECTION C: Perceived realism
Please indicate using a cross (X) the extent to which you agree/disagree with the following
statements concerning product placement.
Perceived realism
Str
ong
ly d
isa
gre
e
Dis
agre
e
Slig
htly d
isa
gre
e
Slig
htly a
gre
e
Ag
ree
Str
ong
ly a
gre
e
C1 I prefer to see real brands in movies/TV shows rather than fake/fictitious brands.
1
2
3
4
5
6
C2 Movies/TV shows should use real brands. 1 2 3 4 5 6
C3 The presence of brand name products in a movie/TV show makes it more realistic.
1
2
3
4
5
6
C4 I don’t mind seeing real brands in movies/TV shows. 1 2 3 4 5 6
C5
I don’t mind if brand name products appear in movies/TV
shows, as long as they are not unrealistically shown.
1
2
3
4
5
6

202
SECTION D: Attitudes towards TV advertising in general.
Please indicate using a cross (X) the extent to which you agree/disagree with the following
statements concerning TV advertising.
How you feel about TV adverts.
Str
ong
ly d
isa
gre
e
Dis
agre
e
Slig
htly d
isa
gre
e
Slig
htly a
gre
e
Ag
ree
Str
ong
ly a
gre
e
D1 I hate watching adverts on TV during a movie/TV show. 1 2 3 4 5 6
D2 While watching a TV programme, I frequently switch channels to avoid adverts.
1
2
3
4
5
6
D3 When an advert appears on my TV, I stop watching until the programme starts again.
1
2
3
4
5
6
D4 I watch movies on my laptop/tablet to escape from TV adverts.
1
2
3
4
5
6
SECTION E: Character-product association
Please indicate using a cross (X) the extent to which you agree/disagree with the following
statements concerning movie/TV characters.
How movie/TV stars influence your choice of brand name
products.
Str
ong
ly d
isa
gre
e
Dis
agre
e
Slig
htly d
isa
gre
e
Slig
htly a
gre
e
Ag
ree
Str
ong
ly a
gre
e
E1 When I see movie/TV show characters I like, I pay attention to the products they use.
1
2
3
4
5
6
E2 I am likely to buy brand name products I see movie/TV characters using.
1
2
3
4
5
6
E3 Movie/TV characters show useful examples of how to present myself to others.
1
2
3
4
5
6

203
How movie/TV stars influence your choice of brand name
products.
Str
ong
ly d
isa
gre
e
Dis
agre
e
Slig
htly d
isa
gre
e
Slig
htly a
gre
e
Ag
ree
Str
ong
ly a
gre
e
E4 The brand name products in movies/TV are “true” to what the characters would use in real life.
1
2
3
4
5
6
E5 Some brand name products help me relate to my favourite movie/TV show characters.
1
2
3
4
5
6
E6 I would like to own brand name products that relate to some of my favourite movie/TV characters.
1
2
3
4
5
6
E7 I would like to meet some of my favourite movie/TV characters someday.
1
2
3
4
5
6
E8 I sometimes imitate (e.g. gestures, phrases, facial expressions or fashion) from the characters in my favourite movies/TV shows.
1
2
3
4
5
6
SECTION F: Materialism
Please indicate using a cross (X) the extent to which you agree/disagree with the following
statements concerning product placement.
How product placement influences people and their choice
of products.
Str
ong
ly d
isa
gre
e
Dis
agre
e
Slig
htly d
isa
gre
e
Slig
htly a
gre
e
Ag
ree
Str
ong
ly a
gre
e
F1 Most people are subconsciously influenced by the brands they see in movies/TV shows.
1
2
3
4
5
6
F2 Product placement promotes a materialistic society. 1 2 3 4 5 6
F3 Product placements makes people want to buy products they cannot afford just to show off.
1
2
3
4
5
6
F4 Because of product placement, people wish to buy a lot of things that they do not really need.
1
2
3
4
5
6
F5 Product placement makes people live in the world of fantasy 1 2 3 4 5 6
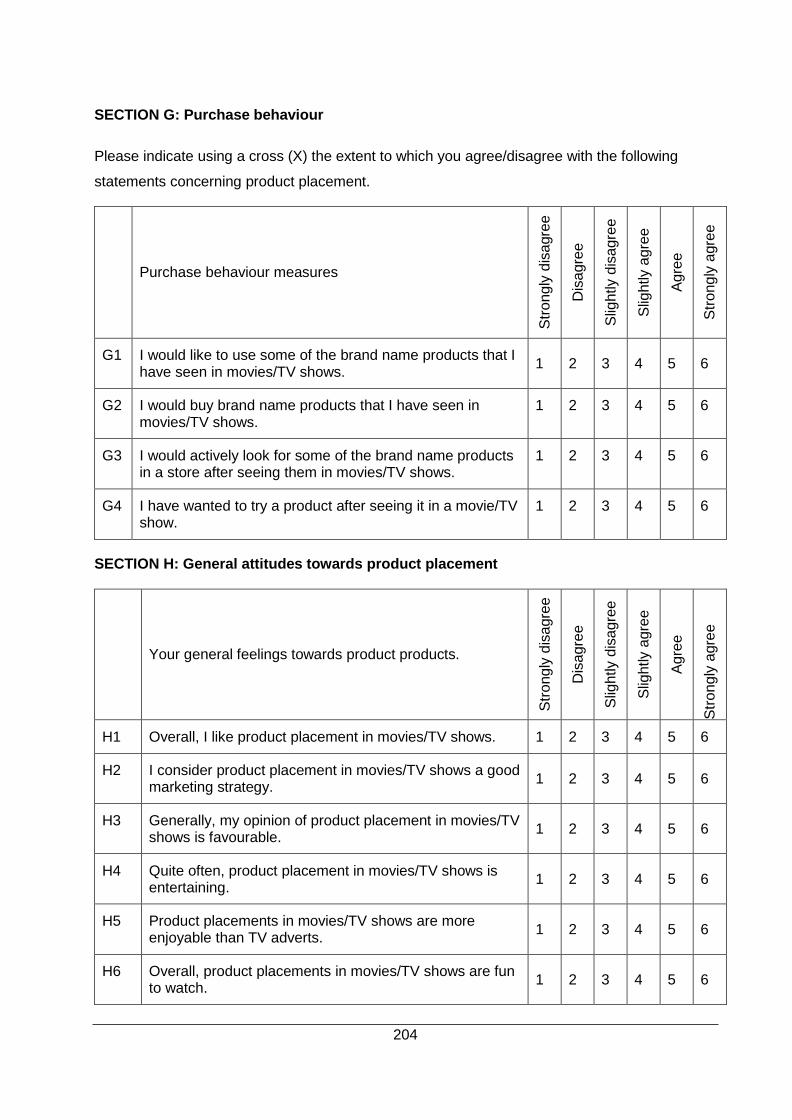
204
SECTION G: Purchase behaviour
Please indicate using a cross (X) the extent to which you agree/disagree with the following
statements concerning product placement.
Purchase behaviour measures
Str
ong
ly d
isa
gre
e
Dis
agre
e
Slig
htly d
isa
gre
e
Slig
htly a
gre
e
Ag
ree
Str
ong
ly a
gre
e
G1 I would like to use some of the brand name products that I have seen in movies/TV shows.
1
2
3
4
5
6
G2 I would buy brand name products that I have seen in movies/TV shows.
1 2 3 4 5 6
G3 I would actively look for some of the brand name products in a store after seeing them in movies/TV shows.
1 2 3 4 5 6
G4 I have wanted to try a product after seeing it in a movie/TV show.
1 2 3 4 5 6
SECTION H: General attitudes towards product placement
Your general feelings towards product products.
Str
ong
ly d
isa
gre
e
Dis
agre
e
Slig
htly d
isa
gre
e
Slig
htly a
gre
e
Ag
ree
Str
ong
ly a
gre
e
H1 Overall, I like product placement in movies/TV shows. 1 2 3 4 5 6
H2 I consider product placement in movies/TV shows a good marketing strategy.
1
2
3
4
5
6
H3 Generally, my opinion of product placement in movies/TV shows is favourable.
1
2
3
4
5
6
H4 Quite often, product placement in movies/TV shows is entertaining.
1
2
3
4
5
6
H5 Product placements in movies/TV shows are more enjoyable than TV adverts.
1
2
3
4
5
6
H6 Overall, product placements in movies/TV shows are fun to watch.
1
2
3
4
5
6

205