Behavioural responses of two cetacean species to natural and ...
266
UNIVERSITÉ DE STRASBOURG ÉCOLE DOCTORALE 414 : Sciences de la Vie et de la Santé Équipe ECS, UMR 7247-85 CNRS, INRA, IFCE, Université de Tours THÈSE présentée par : Benjamin BENTI Soutenue le : 16 janvier 2020 pour obtenir le grade de : Docteur de l’université de Strasbourg Discipline/ Spécialité : écologie – éthologie Behavioural responses of two cetacean species to natural and anthropogenic sounds Réponses de deux espèces de cétacés aux stimuli acoustiques d’origine naturelle et anthropique THÈSE dirigée par : Dr. DUFOUR Valérie Chargée de recherche, CNRS, équipe ECS Co-encadrée par : Dr. CURÉ Charlotte Chargée de recherche, Cerema (UMRAE, Laboratoire de Strasbourg) Pr. MILLER Patrick Professor, SMRU, University of Saint-Andrews, UK RAPPORTEURS : Dr. CHARRIER Isabelle Directrice de recherche CNRS, Université Paris-Saclay Pr. CHARRASSIN Jean-Benoît Professeur, MNHN, Sorbonne Université EXAMINATEUR : Dr. ROBIN Jean-Patrice Directeur de recherche, CNRS, IPHC-DEPE
-
Upload
khangminh22 -
Category
Documents
-
view
2 -
download
0
Transcript of Behavioural responses of two cetacean species to natural and ...

UNIVERSITÉ DE STRASBOURG
ÉCOLE DOCTORALE 414 : Sciences de la Vie et de la Santé
Équipe ECS, UMR 7247-85 CNRS, INRA, IFCE, Université de Tours
THÈSE présentée par :
Benjamin BENTI
Soutenue le : 16 janvier 2020
pour obtenir le grade de : Docteur de l’université de Strasbourg
Discipline/ Spécialité : écologie – éthologie
Behavioural responses of two cetacean
species to natural and anthropogenic sounds
Réponses de deux espèces de cétacés aux stimuli
acoustiques d’origine naturelle et anthropique
THÈSE dirigée par : Dr. DUFOUR Valérie Chargée de recherche, CNRS, équipe ECS
Co-encadrée par :
Dr. CURÉ Charlotte Chargée de recherche, Cerema (UMRAE, Laboratoire de Strasbourg)
Pr. MILLER Patrick Professor, SMRU, University of Saint-Andrews, UK
RAPPORTEURS : Dr. CHARRIER Isabelle Directrice de recherche CNRS, Université Paris-Saclay
Pr. CHARRASSIN Jean-Benoît Professeur, MNHN, Sorbonne Université
EXAMINATEUR : Dr. ROBIN Jean-Patrice Directeur de recherche, CNRS, IPHC-DEPE


1
ACKNOWLEDGEMENTS
First and foremost, I would like to thank my three Ph.D. supervisors: Charlotte Curé,
Patrick Miller, and Valérie Dufour. Charlotte, merci de m’avoir proposé ce projet de
recherche il y a trois ans et demi, et merci pour ton soutien et tes conseils tout au long de
cette thèse. Patrick, I would like to thank you for your warm welcome in Saint Andrews.
I’m glad that you encouraged me to follow up my own ideas, while providing such
acute comments. Valérie, merci pour ta présence depuis notre première rencontre, lors
de mon premier stage de recherche en 2013. Merci d’avoir su me recadrer à chaque fois
que j’ai eu trop d’idées et pas assez de temps.
I would like to thank the research teams that hosted me during my Ph.D. Merci à
l’équipe éthologie cognitive et sociale : Odile Petit, Bernard Thierry, Nancy Rebout,
Thomas Huraux, et les autres. J’ai une pensée particulière pour Aïcha Mohamed
Benkada, qui m’a devancé de peu sur ce long chemin qui mène au doctorat: merci pour
toutes ces discussions farfelues qui nous ont remonté le moral dans les moments
difficiles. Merci aux Cerema de Strasbourg et de Rouen. Merci à Cyrille Fauchard et
toute son équipe pour leur accueil. I’m grateful to the Sea Mammal and Research Unit
for their warm welcome and how much they taught me when I was just starting to
study marine mammal biology. Thanks to Saana Isojunno and Steve Balfour, Eilidh
Siegal, Gui Bortolotto, Alec Burslem, and the others.

2
I would like to thank all the institutions that made the research in this thesis possible.
Merci à l’Ecole Normale Supérieure de Lyon et au Ministère de l’Enseignement
Supérieur et de la Recherche de m’avoir donné la possibilité de me lancer dans la
recherche en finançant mon contrat doctoral. I’m really grateful to the 3S consortium
(Sea mammal Sonar Safety) which funded the fieldwork campaigns I took part in.
Thanks to Petter Kvadsheim, Frans-Peter Lam, Lars Kleivane, Paul Wensveen, Lise Sivle,
and all the others for their effort on the field and outside, and for having collected part
of the data I analysed during my Ph.D. I will never forget the midnight swims in the
Arctic ocean with Lucia Martin Lòpez and Rune Hansen. Nor will I forget being stuck in
the Spildra harbour, with nothing to do but sip whisky in a hot tub with Takashi Iwata
and wait for better weather.
I would like to thank all of my co-authors, for their useful advice and comments on the
different chapters of my thesis: Martin Biuw, Heike Vester, and Florencia Noriega.
J’adresse un grand merci à toute ma famille: Maman (joyeux anniversaire !), Papa, Zack,
Tom, mais aussi mes grand-parents, mes oncles et tantes, et mes cousins et cousines.
Merci de m’avoir soutenu sans cesse et de m’avoir permis de m’échapper de la thèse
quelques jours quand le besoin s’en est fait sentir.
Un énorme merci à Léa Lemaire, mon plus grand soutien, sans qui cette thèse n’aurait
très certainement jamais vu le jour. Merci d’avoir toujours essayé de comprendre mes
travaux et de les avoir parfois éclairés d’une lumière nouvelle. Merci d’avoir veillé à

3
mon sommeil et à mon alimentation lorsque le travail les reléguait au rang d’options. Ti
amo.
Merci à tous mes amis de Lyon : Ronan Duchesne, mon ex-colocataire préféré, Baptiste
Busi, Valentin Lefèvre, Robin Frot, Alexandre Torzynski, Thomas Cometx, Antonin
Lentz, et tous les autres. Merci à Grégoire Beaudoire, Pierre-Louis Alzieu, et François
Bojarski pour ces repas à peu près mensuels où tout était permis. Merci aux volleyeurs
et volleyeuses de l’Ecole Normale Supérieure de Lyon: Chloé Serrÿn, Sébastien Maulat,
Céleste Odier, Margaux Galland, ...
And thanks to all the ones I have forgotten who had a part in these three and a half
years of Ph.D. Et merci à tous ceux et celles que j’oublie mais qui ont joué un rôle durant
ces trois ans et demi de thèse.

4
EXTENDED SUMMARY (IN FRENCH)
Les stimuli environnementaux peuvent être porteurs d’information sur la localisation, la
quantité, ou la qualité des ressources et des menaces existantes pour les individus. Il est
crucial pour ces derniers d’identifier la signification biologique des signaux perçus afin
d’adopter des réponses comportementales adaptées. Ne pas répondre à un stimulus
lorsqu’il est présent peut exposer les animaux à un risque létal, si le stimulus est associé
à une menace de prédation, ou à la pénurie alimentaire, si le stimulus permet de
localiser un type de nourriture. Inversement, répondre à un stimulus alors qu’il n’est
pas présent peut avoir un double coût pour les individus : le coût de la réponse
comportementale déclenchée, et la perte des bénéfices liés à l’activité interrompue. Le
risque de prédation fait partie des menaces les plus importantes qui pèsent sur les
animaux. Il existe de nombreuses stratégies de réponse au risque de prédation :
certaines d’entre elles visent à éviter de rencontrer le prédateur, d’autres ont pour but de
survivre à une rencontre avec lui. Certaines de ces stratégies nécessitent de détecter le
prédateur avant que celui-ci ne lance son attaque. Dans l’environnement, plusieurs
types de signaux peuvent indiquer un risque immédiat de prédation et permettre
d’exprimer de telles stratégies comportementales en amont d’une éventuelle attaque. On
distingue les signaux de communication, qui sont dirigés depuis un émetteur vers un
receveur et modifient le comportement de ce dernier, et les signaux interceptés, qui ne
sont pas intentionnellement émis vers l’individu qui les reçoit. Les signaux de

5
communication sont communément échangés entre individus de la même espèce, mais
peuvent également être dirigés vers des individus d’autres espèces dans des contextes
comme la prédation et la compétition. Parmi les signaux interceptés, on peut séparer
l’interception de signaux involontairement émis et l’interception de signaux de
communication échangés entre tierce parties (« eavesdropping »). Ces différents types
de signaux peuvent passer par une ou plusieurs modalités sensorielles comme le
toucher, la vision, l’odorat, ou l’ouïe. Chaque modalité sensorielle présente des
avantages et des inconvénients liés à la nature des signaux, leurs propriétés de
transmission dans le milieu environnant, et l’écologie et la biologie des espèces. Dans le
milieu marin, les sons sont la principale source d’information. Dans l’océan, la lumière
disparaît rapidement avec la profondeur et la turbidité de l’eau, et les signaux
chimiques ne diffusent pas aussi librement que dans l’air. Les sons, quant à eux, se
propagent cinq fois plus vite que dans l’air et sont peu absorbés, surtout dans les basses
fréquences, par l’eau de mer. En milieu marin, les sons fournissent un support
d’information rapide et longue portée comparé aux autres types de signaux sensoriels.
D’ailleurs, les cétacés utilisent les sons pour de nombreuses fonctions biologiques
essentielles à leur survie, comme la navigation, l’alimentation, la cohésion au sein des
groupes sociaux, et la reproduction. Les cétacés se répartissent en deux sous-ordres : les
mysticètes, ou baleines à fanons, et les odontocètes, ou baleines à dents. Les mysticètes
sont des baleines de grande taille qui se nourrissent par filtration à travers des fanons.

6
La plupart des mysticètes migrent annuellement entre des aires de reproduction dans
les eaux tropicales et des aires d’alimentation dans les eaux tempérées ou polaires. Les
mysticètes produisent et ont une audition adaptée aux sons basse fréquences (ordre de
grandeur : de 10 Hz à 10 kHz). Ils ne peuvent pas utiliser l’écholocation. Les odontocètes
sont des baleines de taille variable. La plupart d’entre eux vivent en groupes sociaux
tout au long de l’année. Tous les odontocètes produisent des clics d’écholocation dont ils
se servent pour détecter les obstacles présents dans leur environnement et pour trouver
leur nourriture. La production vocale des différentes espèces d’odontocètes est variable,
mais leur répertoire vocal se décline en catégories de sons distinctes : les clics
d’écholocation, les sifflements (des sons harmoniques dont la fréquence fondamentale
est très modulée), et les cris pulsés (des répétitions de clics à haute fréquence qui
paraissent tonales à l’oreille humaine). Les gammes de fréquence audibles par les
cétacés se recoupent largement entre espèces, et les sons se propagent sur de longues
distances dans l’océan ; ainsi, les cétacés sont susceptibles de détecter les sons produits
par d’autres espèces de cétacés et d’en tirer des informations. Parmi ces sons, les sons
d’orques présentent un intérêt particulier pour les autres espèces de cétacés. Les orques
sont une espèce cosmopolite qui interagit avec la plupart des autres espèces de cétacés.
Ce sont des prédateurs apicaux qui peuvent chasser la majorité des espèces de
mammifères marins présentes dans leur habitat. De nombreuses espèces de cétacés
adoptent des réponses anti-prédatrices en présence d’orques : certaines espèces

7
s’enfuient quand elles rencontrent des orques, d’autres se regroupent et montrent des
réponses agressives. Toutefois, toutes les interactions entre les orques et les autres
espèces de cétacés n’impliquent pas des relations de prédation. De nombreuses
observations font état de cétacés voyageant ou se reposant en groupes mixtes avec des
orques sans montrer de réaction. Certaines espèces, comme les baleines à bosse, se
nourrissent parfois dans la même zone que les orques, et occasionnellement de la même
proie. Cette variabilité dans la nature des interactions entre les orques et les autres
cétacés est à relier à la variabilité écologique des orques et de leurs relations trophiques
avec les autres cétacés. Dans certaines populations, il existe des écotypes sympatriques
qui ont des régimes alimentaires et des comportements différents. Les premiers écotypes
d’orques ont été décrits dans le Pacifique nord : les orques « resident » se nourrissent
majoritairement de poisson, alors que les orques « transient » chassent exclusivement
des mammifères marins (surtout des pinnipèdes, mais aussi des odontocètes et des
mysticètes). Ces deux écotypes ont également des comportements vocaux différents ;
notamment, les orques « resident » se servent de l’écholocation pour trouver leur proie,
alors que les orques « transient » chassent en silence et ne deviennent vocales que
lorsqu’elles lancent une attaque. Les cris et sifflements des orques « resident » sont plus
forts, plus longs, et de plus haute fréquence que les cris et sifflements des orques
« transient ». Toutes les populations d’orques ne présentent pas une différentiation aussi
marquée que les orques « resident » et « transient ». Néanmoins, l’existence de

8
différences comportementales, et plus particulièrement de différences de comportement
vocal, entre les orques se nourrissant à différents niveaux trophiques se retrouve dans
plusieurs populations d’orques, dont celle du nord-est Atlantique. Les différents
écotypes d’orques produisent donc des sons différents, et sont engagés dans des
relations écologiques différentes avec les autres cétacés : il serait avantageux pour les
autres espèces de cétacés de différentier les sons des écotypes d’orques et d’adapter leur
réponse au type d’orque identifié.
Le premier axe de ma thèse a porté sur les réponses des cétacés aux sons
hétérospécifiques, avec l’étude des réponses comportementales aux repasses de sons de
différents écotypes d’orques. La capacité à discriminer entre les sons de différents
écotypes d’orques a été démontrée chez une espèce de pinnipède, le phoque commun, et
une espèce d’odontocètes, le globicéphale noir. Dans la première partie de ma thèse
(chapitre 1), j’ai étudié les réponses comportementales d’une espèce de mysticète, la
baleine à bosse, à des repasses (« playbacks ») de sons d’orques afin de déterminer si
elles pouvaient différentier les sons produits par différents écotypes d’orques. J’ai utilisé
les sons de deux écotypes d’orques : les orques mangeuses de mammifères marins du
nord-est Pacifique (« transient »), et les orques mangeuses de hareng de Norvège. J’ai
effectué les expériences de repasse de ces sons d’orques à des baleines à bosse au large
de la Norvège. Les individus testés étaient familiers avec les orques mangeuses de
hareng : les deux espèces se nourrissent de la même proie dans les fjords en hiver.

9
L’hypothèse émise est que les sons d’orques mangeuses de hareng pourraient signaler la
présence d’un compétiteur (et donc éventuellement la présence de nourriture). Les
baleines à bosse testées en Norvège étaient au contraire non-familières avec les sons des
orques mangeuses de mammifères marins du Pacifique. L’hypothèse émise est que ce
stimulus, de par sa nouveauté et ses caractéristiques communes aux sons d’orques
mangeuses de mammifères marins, pourrait être perçu comme une menace intense par
les baleines à bosse. J’ai suivi le comportement des baleines à bosse avant, pendant, et
après la diffusion des sons d’orques en combinant des observations visuelles du
comportement exprimé en surface et le déploiement de balises multi-capteur non-
invasives (accrochées aux individus pour quelques heures avec des ventouses). J’ai
analysé la réponse comportementale des baleines à bosse en me focalisant sur les
déplacements horizontaux, en quantifiant l’approche ou l’évitement de la source sonore
en réponse à la présentation du stimulus ainsi que la tortuosité de la trajectoire de
baleines à bosse, et de mouvement verticaux, en mesurant la profondeur et la durée
maximale de plongée des baleines à bosse avant, pendant, et après la diffusion des sons
d’orques. J’ai démontré que les baleines à bosse répondent différemment aux sons de
différents écotypes d’orques, et qu’elles étaient donc capables de différentier ces sons.
Pendant la repasse de sons d’orques compétitrices familières, les baleines à bosse se sont
approchées du haut-parleur (situé à environ 8 m de profondeur) et se sont mises à
plonger plus profondément. En comparaison, les baleines à bosses ont eu tendance à

10
éviter horizontalement la source des sons d’orques potentiellement prédatrices et non-
familières. De plus, les réponses comportementales des baleines à bosse aux sons
d’orques n’étaient pas les mêmes au large pendant l’été et en hiver dans les fjords :
l’évitement horizontal était clair et très marqué au large pendant l’été, et plus mitigé
(réponses variables et moins marquées) pendant l’hiver dans les fjords. La composante
verticale de la réponse présentait également des différences entre les deux contextes
écologiques. J’ai émis deux hypothèses pour expliquer cette différence de réponses entre
les deux contextes. D’une part, les baleines à bosse avaient des réserves lipidiques
réduites au large pendant l’été, qui correspondait au début de la saison d’alimentation :
les baleines avaient passé toute la saison de reproduction dans les eaux tropicales, ainsi
que les migrations dans les deux sens, en se nourrissant peu ou pas. En hiver dans les
fjords, la saison d’alimentation touchait à sa fin et les baleines étaient en condition
optimale, prêtes à partir vers les aires de reproduction. De ce fait, pendant l’été, les
baleines à bosses étaient à la fois plus vulnérables à la prédation par les orques, et
avaient également plus de besoins énergétiques que pendant l’hiver, ce qui a pu
influencer leur prise de décision. D’autre part, la présence d’orques mangeuses de
hareng, compétitrices des baleines à bosse, en grand nombre dans les fjords pendant
l’hiver aurait pu réduire la capacité des baleines à bosse à reconnaître les sons d’orques
non-familières potentiellement prédatrices.

11
Les activités humaines, qui ne cessent de croître dans l’environnement, représentent une
autre source d’information pour les animaux. Les stimuli sensoriels produits par les
activités humaines, aussi appelés stimuli anthropiques, jouent un double rôle pour les
animaux : ils peuvent représenter une source de nuisance directe pour les animaux, et ils
peuvent signaler certains risques associés aux activités humaines, tels que des blessures
physiques et des dommages physiologiques. En milieu marin, l’utilisation des sonars
militaires fait partie des sources de perturbations anthropiques (ici, des sons) les plus
intenses. La corrélation spatiale et temporelle entre des exercices impliquant des sonars
militaires et des échouages massifs de cétacés a soulevé des préoccupations sur les
impacts des sonars militaires sur l’écosystème marin, et sur les cétacés en particulier. Les
émissions sonar peuvent provoquer des dommages physiques directs chez les cétacés
(pertes temporaires et permanentes d’audition), perturber leur comportement, et
masquer les signaux de communication et d’écholocation qui sous-tendent de
nombreuses de leurs fonctions biologiques. Au cours des deux dernières décennies,
plusieurs projets de recherche se sont succédé pour caractériser les réponses
comportementales des cétacés aux sonars militaires. Les réponses les plus
communément observées ont été l’évitement (horizontal ou vertical) et l’interruption de
certaines activités fonctionnelles importantes pour la survie des individus, comme
l’alimentation et le repos. D’autres réponses comportementales observées ont montré
des changements de comportements sociaux (e.g. regroupement et perte de cohésion

12
sociale), des changements du profil de plongée, et des modifications du comportement
vocal. Toutefois, les réponses comportementales des cétacés aux sonars militaires sont
très variables entre les espèces et entre les individus. Certaines espèces, comme les
baleines à bec, apparaissent très sensibles aux sonars militaires : lorsqu’elles sont
exposées aux sonars militaires, elles cessent de se nourrir et quittent leur zone
d’alimentation pendant plusieurs heures après la fin de la transmission sonar. Au
contraire, certaines espèces comme le globicéphale noir semblent moins sensibles aux
sonars militaires : leurs réponses comportementales sont déclenchées à des niveaux
sonores plus élevés, et cessent généralement avec la fin de la transmission sonar. Mais
les réponses comportementales des cétacés exposés au sonar militaire varient également
au sein d’une espèce, en fonction du type de signal, de l’activité comportementale dans
laquelle les individus sont engagés avant l’exposition au sonar, et de la procédure
d’émission des signaux sonar. Il est donc nécessaire de mieux caractériser les réponses
des cétacés aux sonars militaires. Il faut aussi parvenir à interpréter la signification
biologique des comportements que les cétacés adoptent en réponse au sonar militaire.
En effet, les sons anthropiques comme les sonars militaires ont fait irruption récemment
dans l’environnement, à l’échelle évolutive. De fait, les coûts et bénéfices évolutifs des
stratégies de réponses des cétacés au sonar n’ont certainement pas encore été intégrés au
processus de sélection naturelle. Une des approches méthodologiques possibles pour
comprendre la signification biologique des réponses comportementales aux sonars

13
militaires est de les comparer aux réponses provoquées par des stimuli naturels
perturbation de signification biologique connue (e.g. risque immédiat de prédation). Les
réponses comportementales aux stimuli naturels sont stables évolutivement si les
bénéfices qu’elles apportent à long terme sont plus importants que leurs coûts à court
terme (en temps, en énergie, en opportunités perdues). Par exemple, les réponses
comportementales au risque de prédation sont coûteuses (fuite, affrontement), mais le
bénéfice à long-terme (la survie) est plus important que leurs coûts. Les réponses aux
stimuli naturels devraient modeler les réponses aux stimuli anthropiques. Ainsi, même
si les coûts et bénéfices exacts des différentes réponses ne sont pas les mêmes, comparer
les réponses comportementales aux sonars militaires aux réponses anti-prédation
permet d’évaluer le niveau de menace auquel sont perçus les sonars militaires par les
animaux. En milieu marin, les stimuli utilisés pour simuler le risque de prédation sont
les sons d’orques. Le second axe de ma thèse a porté sur l’étude des réponses
comportementales des cétacés à un stimulus anthropique, le sonar militaire, et leur
comparaison aux comportements anti-prédateurs exprimés en réponse à la détection de
sons d’orques, afin d’interpréter leur signification biologique.
Dans la seconde partie de ma thèse (qui regroupe les chapitres 2 et 3), j’ai étudié en
particulier les réponses vocales des globicéphales noirs à certains types de sonars
militaires communément utilisés à l’échelle internationale, et à des repasses de sons
d’orques simulant la présence de ces derniers. Une partie des réponses

14
comportementales des globicéphales noirs aux sonars militaires est présentée dans de
précédentes publications, mais leurs réponses vocales n’avaient que peu été étudiées.
Les globicéphales noirs produisent des sons typiques d’odontocètes : des clics
d’écholocation, des sifflements et des cris pulsés. Leurs cris pulsés sont composés de
plusieurs sous-unités qui peuvent être harmoniques, pulsées, ou bruitées, voire
présenter des sons intermédiaires entre ces différents types de sons. Les globicéphales
ont un répertoire vocal étendu : l’inspection audio-visuelle d’enregistrement a permis de
définir 125 types de cris. Cette classification manuelle s’est concentrée sur les cris
stéréotypés, mais la plupart des vocalisations de globicéphale noir semblent varier
graduellement le long d’un continuum, ce qui rend leur classification particulièrement
difficile. Dans le chapitre 2 de cette thèse, j’ai développé un algorithme de classification
autonome qui prend en compte l’aspect graduel, ou non-stéréotypé, des vocalisations
animales. Cet algorithme repose sur le principe du « fuzzy clustering » et sur les
coefficients cepstraux en fréquence Mel. Au lieu d’assigner à chaque vocalisation un
unique type, comme le font les procédures de classification strictes, le « fuzzy
clustering » définit des stéréotypes apparents dans le jeu de données : chaque cri a un
score d’appartenance à chaque catégorie, qui correspond à sa similarité avec le
stéréotype de la catégorie. Les stéréotypes apparents sont définis à partir de la
distribution des vocalisations dans le jeu de donnée : ni le nombre de catégories, ni leurs
caractéristiques ne sont renseignées par l’utilisateur. Afin de décrire les vocalisations,

15
j’ai eu recours aux coefficients cepstraux en fréquence Mel. Cette méthode, initialement
utilisée pour automatiser la segmentation et l’identification des phonèmes dans la
production vocale humaine, est de plus en plus utilisée pour étudier les comportements
vocaux des animaux. En effet, les coefficients cepstraux en fréquence Mel représentent
une méthode efficace pour comprimer l’information sur la distribution de l’énergie le
long du spectre fréquentiel en un nombre réduit de variables. Dans un but de
classification, ils sont donc à la fois plus complets que les paramètres acoustiques
mesurés sur les spectrogrammes, et ont un sens acoustique plus clair que d’autres
méthodes de description basées sur les descripteurs d’images ou impliquant des
procédures de transformation des paramètres. Les coefficients cepstraux en fréquence
Mel présentent aussi l’avantage d’être définis pour tous les types de cris (harmoniques,
pulsés, bruités, …), contrairement à d’autres paramètres acoustiques comme ceux liés à
la fréquence fondamentale. J’ai testé cette procédure de classification sur un jeu de 279
cris de globicéphale noir. Ces cris ont été préalablement classés selon le catalogue le plus
récent pour l’espèce. Ce jeu de données représente une fraction du répertoire vocal des
globicéphales noirs : il contient huit types de cris (dix en incluant les sous-types) sur les
125 définis. La procédure de classification que j’ai développée n’a pas atteint la même
précision que celle impliquant des opérateurs humains entraînés quatre catégories vec le
« fuzzy clustering » contre huit types de cris du catalogue défini par les opérateurs. Les
catégories définies par le « fuzzy clustering » étaient basées sur la présence ou absence

16
de motifs de distribution d’énergie à l’échelle du cri complet, alors que l’identification
des cris définis dans le catalogue est basée sur l’association de sous-unités séparées par
des courts silences ou des changements dans les caractéristiques fréquentielles. Cette
différence de résolution temporelle peut être à l’origine de la précision moindre du
« fuzzy clustering ». Toutefois, la procédure du « fuzzy clustering » fournit des outils
pour quantifier et visualiser la variation graduelle des vocalisations entre les stéréotypes
apparents. Ces outils pourraient permettre d’analyser les aspects fonctionnels de cette
variation graduelle.
Dans le chapitre 3 de cette thèse, j’ai utilisé l’outil de classification développé dans le
chapitre 2 pour analyser les réponses vocales des globicéphales noirs à différents types
de sonar militaires ainsi qu’à la repasse de sons d’orques potentiellement prédatrices.
J’ai enregistré le comportement vocal de globicéphales noirs à l’aide de balises
accrochées temporairement sur le dos des individus par des ventouses. En plus des
enregistrements effectués par la balise, des paramètres sur la taille du groupe et sa
cohésion étaient notées lors d’observations visuelles réalisées depuis la surface. J’ai
utilisé trois types de sonar militaire : des signaux en augmentation hyperbolique de 1 à 2
kHz, en augmentation hyperbolique de 6 à 7 kHz, et en diminution hyperbolique de 2 à
1 kHz. Les trois sonars étaient pulsés et suivaient le même schéma de transmission : des
signaux de 1 s séparés par des silences de 19 s. Comme dans les conditions d’exercices
militaires, les sonars militaires étaient transmis depuis une source sonore remorquée par

17
un navire (le navire source). Le navire source approchait un globicéphale noir focal
pendant les transmissions. Pour tester l’effet de l’approche du navire tractant la source
sonar seule (sans transmission sonar), j’ai également effectué des expériences lors
desquelles le navire remorquant la source sonar approchait l’individu focal, mais sans
émettre de signal. Pour interpréter les réponses vocales des globicéphales noirs aux
sonars militaires, j’ai aussi effectué des repasses de sons d’orques mangeuses de
mammifères marins. J’ai utilisé deux types de signaux contrôles pour les expériences de
repasse : des enregistrements de bruits ambiant sans vocalisations d’orques (contrôle
négatif) et des signaux artificiels de 1 s dont la fréquence augmentait de façon
hyperbolique de 1 à 2 kHz (contrôle positif). Je me suis intéressé à trois paramètres du
comportement vocal des globicéphales noirs : le niveau global d’activité vocale, le type
de cris produits, et la typicalité (c’est-à-dire le caractère stéréotypé ou graduel) des cris
produits. J’ai mesuré l’activité vocale des globicéphales noirs en utilisant les
enregistrements acoustiques de la balise. Toutes les vocalisations de globicéphales noirs
ont été annotées dans les enregistrements : des opérateurs entraînés ont noté leur temps
de commencement et de fin, et les ont classés en signaux d’écholocation ou en signaux
sociaux. J’ai compté le nombre de cris annotés et leur durée cumulée avant, pendant, et
après l’exposition des globicéphales noirs aux différents stimuli acoustiques. Je n’ai pris
en compte que les cris dont le rapport signal sur bruit dépassait 3 dB (mesuré en
comparant la moyenne quadratique du niveau sonore entre le cri de globicéphale noir et
18
une fenêtre de bruit ambient de 0.2 s juste avant le cri). Toutes les phases expérimentales
(avant, pendant, et après l’exposition) n’ayant pas la même durée, j’ai divisé le nombre
et la durée cumulée des cris par la durée de chaque phase expérimentale. De plus, les
balises n’enregistrent pas uniquement les vocalisations de l’individu balisé, mais aussi
celles produites par ses congénères situés à proximité. Le nombre et la durée cumulée
des cris sont donc des mesures de l’activité vocale au niveau du groupe social de
l’individu balisé. J’ai divisé ces paramètres vocaux par la taille moyenne du groupe de
l’individu balisé (estimée lors des observations visuelles à la surface) pendant chaque
phase expérimentale pour obtenir une mesure de l’activité individuelle des membres du
groupe de l’individu balisé. Pour déterminer le type et la typicalité des cris, j’ai classé les
vocalisations enregistrées par la balise en utilisant la procédure définie au chapitre 2. J’ai
pris en compte les cris dont le rapport signal sur bruit dépassait 6 dB et qui n’étaient pas
recoupés par d’autres cris, par des signaux d’écholocation, et pas des bruits ambiants.
J’ai mesuré le changement des scores d’appartenance moyens des cris (une mesure du
changement d’utilisation des différents types de cris) et le changement de la typicalité
moyenne des cris (une mesure du caractère stéréotypé ou graduel des cris) entre les
phases expérimentales. J’ai observé une augmentation de l’activité vocale en réponse au
sonar de 1 à 2 kHz et à la repasse de signaux artificiels. Les changements d’activité
vocale en réponse aux autres type de sonar (de 6 à 7 kHz et de 2 à 1 kHz), aux repasse de
sons d’orques, et aux différentes expériences contrôles étaient variables. J’ai observé des

19
changements dans les types de cris utilisé en réponse à toutes les expériences. Toutefois,
aucun type de cris n’était constamment produit en réponse aux stimuli acoustiques
diffusés. Les réponses aux sonars militaires étaient globalement plus importantes que les
réponses aux repasses de sons d’orques. Le sonar de 1 à 2 kHz semblait être perçu
différemment des autres signaux sonars. La ressemblance des réponses à la repasse de
sons d’orques et de signaux artificiels ayant la même structure que le sonar de 1 à 2 kHz
(même type de cri utilisé pendant la présentation des deux stimuli) m’a mené à
l’hypothèse que la combinaison de la bande de fréquence et du motif de modulation
fréquentielle du sonar de 1 à 2 kHz pourraient s’approcher de a structure acoustique des
sons d’orques par rapport à d’autres signaux sonar, et engendreraient des réponses plus
proches des réponses anti-prédation. Les différences dans les conditions d’exposition
des cétacés aux sonars militaires (grand navire remorquant la source sonore,
transmission initialement longue distance puis approche de l’individu balisé, niveaux
sonores intenses jusqu’à 214 dB re 1 µPa) et aux sons d’orques (sons diffusés depuis un
plus petit navire, moteur à l’arrêt pendant la diffusion, à une distance moyenne de
l’individu balisé, et à plus bas niveaux sonores) peuvent expliquer une partie des
différences entre les réponses comportementales aux sons d’orques et aux sonars
militaires. Au cours de cette thèse, j’ai démontré qu’une espèce de mysticète, la baleine à
bosse, répondait différemment aux sons d’écotypes d’orques indiquant des situations
écologiques différentes (risque de prédation et présence d’un compétiteur alimentaire),

20
et qu’elles étaient donc capables de différencier ces stimuli. Cette capacité à différencier
les sons de différents écotypes d’orques et à adopter une réponse comportementale
adaptée à la relation écologique avec le type d’orque détecté a également été démontrée
chez une espèce de pinnipède, le phoque commun, et une espèce d’odontocète, le
globicéphale noir. Il semblerait donc que cette capacité soit répandue chez les
mammifères marins. Les cétacés manifestent des réponses comportementales diverses
lorsqu’ils sont exposés au sonar militaire. Certaines similitudes entre les réponses
comportementales des cétacés au sonar militaire et au risque de prédation (simulé par la
diffusion de sons d’orques prédatrices) semblent indiquer que les sonars militaires sont
perçus comme une menace par les cétacés, mais pas aussi pressante que le risque de
prédation. Toutefois, les réponses au sonar militaire et au risque de prédation présentent
également des spécificités. Les conditions d’exposition contrastées entre les expositions
contrôlées au sonar militaires et les repasses de sons d’orques (caractéristiques du signal,
taille et déplacements de la source sonore, niveaux sonores) doivent être prises en
compte pour interpréter la signification biologique et le niveau de sévérité des réponses
comportementales observées. Des travaux supplémentaires sont nécessaires pour
comprendre dans leur ensemble les interactions acoustiques entre les espèces de cétacés
et le degré de perturbation des sources sonores anthropiques sur leur mode de vie.

21
TABLE OF CONTENTS
ACKNOWLEDGEMENTS ___________________________________________ 1
EXTENDED SUMMARY (IN FRENCH) __________________________________ 4
TABLE OF CONTENTS _____________________________________________ 21
LIST OF TABLES __________________________________________________ 25
LIST OF FIGURES _________________________________________________ 28
1: GENERAL INTRODUCTION _______________________________________ 35
1.1: External stimuli carry vital information about the environment _____________ 35
1.1.1: Communication signals _________________________________________________ 36
1.1.2: Intercepted signals _____________________________________________________ 37
1.1.3: Anthropogenic sources __________________________________________________ 38
1.1.4: The costs of misinterpreting environmental stimuli ____________________________ 39
1.2: The marine environment is a prime setting for the study of eavesdropping ___ 40
1.2.1: Sounds are a primary support of information in the marine environment __________ 40
1.2.2: Cetaceans _____________________________________________________________ 42
1.2.3: Methodological limitations in the marine environment _________________________ 44
1.3: Case study of hetero-specific signal eavesdropping: killer whale sounds _____ 45
1.3.1: Ecological relationships between killer whales and other cetacean species ___________ 45
1.3.2: Killer whale ecotypes ____________________________________________________ 47
1.3.5: Study species: the humpback whale (Megaptera novaeangliae) ___________________ 51
1.4: Case study of behavioural responses to anthropogenic signals: sonar signals _ 56
1.4.1: Naval sonar, a particular source of concern __________________________________ 56
1.4.2: Interpretation of behavioural responses to sonar ______________________________ 58
1.4.2: Study species: the long-finned pilot whales (Globicephala melas) _________________ 60
1.5: Research questions and thesis outline ____________________________________ 67
1.5.1: Chapter 1 – Behavioural responses to heterospecific sounds are influenced by trophic
relationships and ecological contexts ____________________________________________ 67
1.5.2: Chapter 2 – Unsupervised classification to study gradation in animal vocalisations based
on fuzzy clustering and Mel frequency cepstral coefficients __________________________ 68
1.5.3: Chapter 3 – Vocal responses of long-finned pilot whales to naval sonar exposures and
playbacks of killer whale sounds ________________________________________________ 69
2: GENERAL METHODS ____________________________________________ 71
2.1: Study species and locations _____________________________________________ 71

22
2.1.1: Humpback whales (Megaptera novaeangliae) _________________________________ 71
2.1.2: Long-finned pilot whales (Globicephala melas) _______________________________ 72
2.2: Experimental protocol __________________________________________________ 72
2.2.1: General procedure ______________________________________________________ 72
2.2.2: Data collection _________________________________________________________ 74
2.2.2.1: Multi-sensor tags ____________________________________________________ 75
2.2.2.2: Visual tracking ______________________________________________________ 78
2.2.3: Playback experiments ___________________________________________________ 81
2.2.3.1: Stimuli used ________________________________________________________ 81
2.2.3.2: Procedure __________________________________________________________ 83
2.2.4: Controlled exposure experiments __________________________________________ 84
2.2.4.1: Procedure __________________________________________________________ 84
3: CHAPTER 1 – BEHAVIOURAL RESPONSES TO THE SOUNDS OF
HETEROSPECIFICS ARE INFLUENCED BY TROPHIC RELATIONSHIPS AND
ECOLOGICAL CONTEXT ____________________________________________ 89
3.1: Abstract _______________________________________________________________ 89
3.2: Introduction ___________________________________________________________ 91
3.3: Material and methods __________________________________________________ 98
3.3.1: Study site and population ________________________________________________ 98
3.3.2: Data collection _________________________________________________________ 99
3.3.3: Playback procedure _____________________________________________________ 101
3.3.4: Data treatment and response variables ______________________________________ 104
3.3.5: Statistical analysis _____________________________________________________ 108
3.3.6: Ethical note ___________________________________________________________ 110
3.4: Results _______________________________________________________________ 110
3.5: Discussion ____________________________________________________________ 115
3.6: Acknowledgment ______________________________________________________ 124
3.7: Appendix _____________________________________________________________ 125
4: UNSUPERVISED CLASSIFICATION TO STUDY GRADATION IN ANIMAL
VOCALISATIONS BASED ON FUZZY CLUSTERING AND MEL FREQUENCY CEPSTRAL
COEFFICIENTS ___________________________________________________ 127
4.1: Abstract _______________________________________________________________ 127
4.2: Introduction ___________________________________________________________ 128

23
4.3: Material and methods __________________________________________________ 133
4.3.1: Test dataset ___________________________________________________________ 133
4.3.2: Acoustic parameter extraction ____________________________________________ 134
4.3.3: Classification procedure _________________________________________________ 136
4.3.4: Fuzzy clustering analyses ________________________________________________ 139
4.3.5: Comparison of the fuzzy clustering with the catalogue-based classification _________ 140
4.4: Results _______________________________________________________________ 141
4.4.1: Identification of stable clusters ____________________________________________ 141
4.4.2: Reconstruction of stereotypical calls ________________________________________ 143
4.4.3: Typicality analysis _____________________________________________________ 145
4.4.4: Gradation between fuzzy clusters __________________________________________ 147
4.4.5: Correspondence between catalogue call types and fuzzy clusters __________________ 149
4.5: Discussion ____________________________________________________________ 152
4.6: Conclusions ___________________________________________________________ 156
5: CHAPTER 3 – VOCAL RESPONSES OF LONG-FINNED PILOT WHALES
(GLOBICEPHALA MELAS) TO NAVAL SONARS AND PLAYBACKS OF KILLER WHALE
(ORCINUS ORCA) SOUNDS _________________________________________ 158
5.1: Abstract _______________________________________________________________ 158
5.2: Introduction ___________________________________________________________ 159
5.3: Material and methods __________________________________________________ 167
5.3.1: Study area and population _______________________________________________ 167
5.3.2: Data collection _________________________________________________________ 168
5.3.3: Stimuli used and procedures of sound exposition ______________________________ 169
5.3.3.1: General procedure ___________________________________________________ 169
5.3.3.2: Controlled exposure experiments to naval sonar _________________________ 172
5.3.3.3: Playback of killer whale sounds _______________________________________ 173
5.3.4: Vocal behaviour measures ________________________________________________ 175
5.3.4.1: Vocal activity _______________________________________________________ 175
5.3.4.2: Call types and typicality ______________________________________________ 177
5.3.5: Statistical analysis _____________________________________________________ 180
5.3.5.1: Vocal activity _______________________________________________________ 180
5.3.5.2: Call types and typicality ______________________________________________ 181
5.4: Results _______________________________________________________________ 182
5.4.1: Vocal activity __________________________________________________________ 182

24
5.4.2: Call types and typicality _________________________________________________ 193
5.4.3: Characterisation of call types used during sound exposure experiments ____________ 198
5.5: Discussion ____________________________________________________________ 201
5.6.1: Vocal responses of long-finned pilot whales to naval sonars, playbacks of killer whale
sounds, and control experiments ________________________________________________ 204
5.6.2: Integration of vocal responses into the set of behavioural responses _______________ 206
5.6.3: Comparison of vocal responses to naval sonar and killer whale sounds _____________ 208
5.6.4: Fuzzy-clustering-derived measures for the quantification of vocal behaviour. _______ 211
5.7: Aknowledgments ______________________________________________________ 213
6: GENERAL DISCUSSION __________________________________________ 214
6.1: Responses of cetaceans to heterospecific sounds __________________________ 214
6.2: Responses of cetaceans to anthropogenic sounds __________________________ 217
6.3: Comparison of responses to heterospecific and anthropogenic sounds _______ 220
6.4: Methodological considerations __________________________________________ 223
6.5: Conclusion ____________________________________________________________ 227
7: REFERENCES __________________________________________________ 229

25
LIST OF TABLES
Table 1: Overview of sound exposure experiments on humpback whales and long-finned pilot
whales. Each tagged individual is identified with an eight-symbol Dtag code: the initials
of the species scientific name (mn: humpback whales, gm: long-finned pilot whales), the
last two digits of the experiment year, the date in the Julian calendar, and the number of
the tag deployment for this day (from a to z). MEKW: playback of mammal-eating killer
whale sounds; HFKW: playback of herring-feeding KW sounds; CTRL-: playback of
broadband noise; CTRL+: playback of artificial frequency-modulated sounds; LFAS:
controlled exposure to low frequency active sonar; MFAS: controlled exposure to
medium frequency AS; LFASDS: controlled exposure to LFAS, down sweep pings;
SILENT: silent vessel approach; OOS SONAR: out-of-study sonar; OOS PB: out-of-study
playback. _________________________________________________________________ 87
Table 2: Overview of the collected data showing the focal subject (Individual ID), the study
location, the ecological context (Offshore summer or Inshore winter), and the
specifications of the sound stimulus used (killer whale ecotype and stimulus version).
Each focal individual was given an eight-symbol identifier, which takes the form
aaBB_CCCd: aa is the first initials of the species’ scientific name, BB is the last two digits
of the experiment year, CCC is the Julian date of the experiment, and d is the number of
the tag deployment within the day, from a to z. For two individuals (mn11_160a and
mn16_020a), the tag came off prematurely, and the post-exposure observation phase of
the second experiment was not completed. In one case (mn16_018a), we were not able to
retrieve the tag after the experiments, which restricted our data to the visual tracking
information for this individual. MEKW: unfamiliar mammal-eating killer whale; HFKW:
familiar herring-feeding killer whale. ________________________________________ 100
Table 3: Classification results for the first Random Forest, using all response variables. ____ 110
Table 4: Classification results for the second Random Forest, using the three most important
response variables (HRS15, MDdurpost-pre, and MDdepthpost-pre). ___________________ 113

26
Table 5: Numerical values of the response variables for all playback experiments. The
individual identifiers are the same as in Table 2. IHFKW: inshore (winter) herring-
feeding killer whale sounds, IMEKW: inshore (winter) mammal-eating killer whale
sounds, OMEKW: offshore (summer) mammal-eating killer whale sounds ________ 126
Table 6: Overview of sound exposure experiments conducted during each tag deployment. Each
tagged whale is identified by the 8-symbol dtag code: the initials of the scientific name of
the species, the two digits year of the tag deployment, an underscore, the date of the
deployment in the Julian calendar, and the number of the tag deployment within the day
from a to z. In 2008 and 2009, tagged whales were exposed to naval sonar transmissions
and control trials. In 2010, 2013, and 2014, whales were exposed to playback of killer
whale sounds and control broadcasts. On three occasions, noted in italic, two long-finned
pilot whales of the same group were equipped with tags at the same time. Only one of
these whales, identified with an *, was the focal individual. LFAS: low-frequency active
sonar (1-2 kHz). MFAS: medium frequency active sonar (6-7 kHz). LFASDS: exposure to
LFAS down sweeps (2-1 kHz). SILENT: silent vessel approach (negative control for sonar
exposures). MEKW: mammal-eating killer whale sounds. CTRL+: broadcast of LFAS
signals (positive control for killer whale playback). CTRL-: broadcast of broadband noise
(negative control for killer whale playbacks) __________________________________ 167
Table 7: Experiment timeline and overlaps between successive experiments. PRE and POST
periods should ideally last 40 minutes for sonar experiments and 15 minutes for
playback experiments. Nevertheless, there was some overlap between these time periods
for successive sound exposure experiments. We discarded overlapping periods, resulting
in effective start times of PRE and effective end times of POST different from the ideal
start and end times in experiment design. Such cases are marked in bold in the table. No
effective time is given when it was identical to the designed time. *: sound exposure
experiments overlapping a playback not presented in this study _________________ 171
Table 8: Fuzziness values over which solutions with two, three, and four clusters were stable for
each tag deployment. ______________________________________________________ 179

27
Table 9: Results of the generalised estimated equation models to explain the variation of the
change of average membership score between experiment phases by signal types. A
different model was built to analyse responses to controlled exposure experiments and to
playback experiments. Significant effects are indicated in bold. __________________ 194
Table 10: Results of the generalised estimated equation models to explain the variation of the
change of average typicality between experiment phases by signal type. A different
model was built to analyse responses to controlled exposure experiments and to
playback experiments. Significant effects are indicated in bold. __________________ 194
Table 11: Responses of marine mammals to heterospecific sounds (killer whale sounds) and
anthropogenic sounds (naval sonars). FEKW: fish-eating killer whale sounds; MEKW:
marine mammal-eating killer whale sounds. Results for this Ph.D. are shown in bold.
Sources: 1: Cummings and Thompson, 1971; 2: Fish and Vania, 1971; 3: Deecke et al.,
2002; 4: Miller et al., 2012; 5: Sivle et al., 2012; 6: Curé et al., 2013; 7: Alves et al., 2014; 8:
Antunes et al., 2014; 9: Curé et al., 2015; 10: Miller et al., 2015; 11: Sivle et al., 2015; 12:
Wensveen et al., 2015a; 13: Curé et al., 2016; 14: Southall et al., 2016; 15: Visser et al., 2016;
16: Isojunno et al., 2016; 17: Bowers et al., 2018; 18: Curé et al., 2019; 19: Wensveen et al.,
2019 _____________________________________________________________________ 226

28
LIST OF FIGURES
Figure 1: General protocol A) Experiment timeline. Once a whale was detected, we started
visual observation immediately, while a vessel approached it to deploy a tag on a whale
(“Tag on”). After a post-tagging period and a period of baseline behaviour collection of
the tagged whale, we performed sound exposure experiments. All experiments consisted
of three phases: the pre-exposure observation period (“PRE”), the exposure period
(“DUR”), and the post-exposure observation period (“POST”). In the typical timeline,
each period would last 40 minutes for sonar controlled exposure experiments and 15
minutes for playback experiments. Focal whales were exposed to two to six sound
exposure experiments. Tracking continued throughout the experiments until tag
detachment (“Tag off”) and tag recovery B) Playback disposition. An operator on the
tracking boat specified the position where the playback boat transmitted sounds during
playback experiments. We aimed to place the playback boat ahead of the focal whale, at
an angle of 45°: this geometry eased the detection of both approach and avoidance
responses C) Sonar controlled exposure experiment setup. The research vessel towing
the source started transmitting sonar pings 7-8 km away from the tagged whale, and
then continued transmission with one sonar ping every 20s while approaching the
tagged whale at 7-8 knots. The source level of sonar signals increased during the first 10
minutes of the experiment, and was then held at maximal power. The research vessel
adjusted its approach course towards the surfacing points of the focal whale
(communicated by the observation vessel). The course of the focal vessel was fixed once
it reached 1000 m from the focal whale. It continued transmitting sonar for five minutes
after crossing the focal whale’s path. _________________________________________ 76
Figure 2: Tag deployment A) Deployment of a dtag on a long-finned pilot whale using a hand-
held pole B) Deployment of a mixed-tag on a humpback whale using the ARTS
pneumatic launching system. Picture credits: 3S project _________________________ 80

29
Figure 3: The Socrates towed sonar source used during sonar exposure experiments. Picture
credits: 3S project __________________________________________________________ 85
Figure 4: Horizontal reaction score (HRS) calculation. The HRS measures the difference in the
distance between the whale and the sound source and the distance there would be
between the whale and the sound source if the whale kept the same behaviour as right
before the playback. We used the speed and heading of the whale during the pre-
exposure phase to extrapolate its movement trajectory. _________________________ 107
Figure 5: Behavioural responses of humpback whales to killer whale sounds (IHFKW in green,
IMEKW in light blue, and OMEKW in dark blue) A) Horizontal reaction scores (HRS) at
15 and 30 minutes. The black lines correspond to individual playback sessions B)
Approach Index (AI) C) Linearity Index (LI) D) Maximum dive duration (MDdur)
during each experimental phase for each experiment type E) Maximum dive depth
(MDdepth) during each experimental phase for each experiment type ____________ 111
Figure 6: Random Forest results A) The importance of each variable in the Random Forest is
computed as the mean decrease in classification accuracy resulting from the random
permutation of this variable. The three most important variables were HRS15, MDdurpost-
pre, and MDdepthpost-pre, with associated decreases in accuracy of 7.2 %, 6.2 % and 2.5 %,
respectively B) Visualisation of the responses to each stimulus in the space of the three
most important variables (IHFKW as green x crosses, IMEKW as light blue circles,
OMEKW as dark blue + crosses) _____________________________________________ 114
Figure 7: Spectrograms of the killer whale sounds stimuli used for the playback experiments A)
Herring-feeding killer whale sounds (HFKW). Note the presence of echolocation clicks
(vertical lines) B) Mammal-eating killer whale sounds (MEKW) containing much fewer
clicks than HFKW sounds __________________________________________________ 125
Figure 8: Example spectrograms of the eight catalogue call types present in the test dataset from
the most abundant one (top left) to the least represented one (bottom right). The label in
the top left of each spectrogram contains the custom name the call types are referred to

30
as. Call types 126, 126i, and 126ii are subtypes of the same call. The distribution of call
types and subtypes in the dataset is as follows: 129: n=76; 126i: n=46; 130: n=31; 126: n=24;
126ii: n= 24; 127: n=23; 131iii: n=16; 93ii: n=14; 128i: n=13; 133: n=12 _______________ 134
Figure 9: Successive steps for the calculation of Mel frequency cepstral coefficients-derived
acoustic parameters. _______________________________________________________ 136
Figure 10: Optimal number of clusters relative to fuzziness for all nine sets of features. Stable
four cluster solutions are highlighted by brown circles, five cluster solutions by purple
circles, and six cluster solutions by green circles. _______________________________ 142
Figure 11: Reconstructed stereotypical calls for two realizations of the 5-5 clustering solution (A
and B) and two solutions of the 10-10 clustering solution (C and D). The x-axis
corresponds to the 10 time slices used for MFCC summarization. The y-axis corresponds
to filters of the Mel filter bank A) 5-5 solution, µ = 1.23 B) 5-5 solution, µ = 1.27 C) 10-10
solution, µ = 1.17 D) 10-10 solution, µ =1.25 ___________________________________ 144
Figure 12: Typicality values coloured by main fuzzy cluster for two realizations of the 5-5
clustering solution and two realisations of the 10-10 clustering solution. The clustering
solutions presented in this figure are the same as in Figure 11. The bottom-up colour
order (blue, green, red, and orange) corresponds to the left-to-right order in Figure 4 A)
5-5 solution, µ = 1.23 B) 5-5 solution, µ = 1.27 C) 10-10 solution, µ = 1.17 D) 10-10 solution,
µ = 1.25 __________________________________________________________________ 146
Figure 13: Gradation between fuzzy clusters for example realisations of the 5-5 and 10-10
clustering solutions. Each point corresponds to an individual call. Points along the
diagonal of the plot correspond to calls that are graded exclusively between the two
clusters represented by the axes. Points in the middle of the graph represent calls that are
graded between multiple call types A) 5-5 solution, µ = 1.23. There was overlap between
all pairs of clusters with the exception of cluster 1 and 2 B) 10-10 solution, µ = 1.25. There
was clear gradation between cluster 0 and cluster 2, and between cluster 2 and cluster 3,
but not between cluster 0 and 3 ______________________________________________ 148

31
Figure 14: Comparison between fuzzy clusters and catalogue call types A and B)
Correspondence tables between fuzzy clusters and catalogue call types. The numbers in
the table corresponds to the number of times a call belonging to a given call type
(column) had a given fuzzy cluster (row) as its main cluster A) 5-5 solution, µ = 1.23
(top), µ = 1.27 (bottom) B) 10-10 solution: µ = 1.17, µ = 1.25 C) and D) Principal
component analyses for the visualization of the catalogue call type distribution in the
MFCC feature space. Calls are coloured by catalogue call types. Black + crosses represent
the position fuzzy cluster centroids C) 5-5 solution. The two components explained 40 %
of the dataset variance D) 10-10 solution. The 2 components explained 30 % of the
dataset variance ___________________________________________________________ 151
Figure 15: Vocal activity before, during, and after silent vessel approaches A and B) Number of
annotated calling events C and D) Cumulative duration of annotated calling events. Left
panels (A and C) were corrected for experiment phase duration. Right panels (B and D)
were corrected for both experiment phase duration and average group size. Data for
individual tag deployments is displayed as points and lines: + crosses – gm08_159a; x
crosses – gm09_138b; diamonds – gm09_156b _________________________________ 184
Figure 16: Vocal activity before, during, and after LFAS exposures A and B) Number of
annotated calling events C and D) Cumulative duration of annotated calling events. Left
panels (A and C) were corrected for experiment phase duration. Right panels (B and D)
were corrected for both experiment phase duration and average group size. Circles –
gm08_150c; triangles – gm08_154d; + crosses – gm08_159a; x crosses – gm09_138b;
diamonds – gm09_156b ____________________________________________________ 185
Figure 17: Vocal activity before, during, and after MFAS exposures A and B) Number of
annotated calling events C and D) Cumulative duration of annotated calling events. Left
panels (A and C) were corrected for experiment phase duration. Right panels (B and D)
were corrected for both experiment phase duration and average group size. Circles –
gm08_150c; triangles – gm08_154d; + crosses – gm08_159a; x crosses – gm09_138b;
diamonds – gm09_156b ____________________________________________________ 186

32
Figure 18: Vocal activity before, during, and after LFASDS exposures A and B) Number of
annotated calling events C and D) Cumulative duration of annotated calling events. Left
panels (A and C) were corrected for experiment phase duration. Right panels (B and D)
were corrected for both experiment phase duration and average group size. X crosses –
gm09_138b; diamonds – gm09_156b _________________________________________ 188
Figure 19: Vocal activity before, during, and after MEKW playbacks A and B) Number of
annotated calling events C and D) Cumulative duration of annotated calling events. Left
panels (A and C) were corrected for experiment phase duration. Right panels (B and D)
were corrected for both experiment phase duration and average group size. Stars –
gm13_137a; crossed diamonds – gm13_149a; + crossed circles – gm13_169a; double
triangles – gm13_169b; crossed squares – gm14_180a; x crossed circles – gm14_180b 189
Figure 20: Vocal activity before, during, and after CTRL+ playbacks A and B) Number of
annotated calling events C and D) Cumulative duration of annotated calling events. Left
panels (A and C) were corrected for experiment phase duration. Right panels (B and D)
were corrected for both experiment phase duration and average group size. Crossed
diamonds – gm13_149a; + crossed circles – gm13_169a; double triangles – gm13_169b;
crossed squares – gm14_180a; x crossed circles – gm14_180b ____________________ 191
Figure 21: Vocal activity before, during, and after CTRL- playbacks A and B) Number of
annotated calling events C and D) Cumulative duration of annotated calling events. Left
panels (A and C) show data corrected for experiment phase duration. Right panels (B
and D) show data corrected for both experiment phase duration and average group size.
Inverted triangles – gm10_157b; x crossed squares – gm10_158d; + crossed circles –
gm13_169a; double triangles – gm13_169b ____________________________________ 192
Figure 22: Examples of vocal responses of long-finned pilot whales to sonar signals. The left
panels show reconstruction of the fuzzy cluster centroids. The right panels represent the
membership scores of calls produced in PRE, DUR, and POST of the sound exposure
experiment. The width of the histograms corresponds to the duration of the experiment

33
phases. The left to right order of the left panels corresponds to the bottom to top order
(blue, green, red, and orange) of the right panels A) Response of gm08_150c to MFAS (4
fuzzy clusters, fuzziness = 1.14) B) Response of gm09_138b to LFASDS (3 fuzzy clusters,
fuzziness = 1.09) C) Response of gm09_138b to SILENT (3 fuzzy clusters, fuzziness = 1.09)
_________________________________________________________________________ 195
Figure 23: Examples of vocal responses of long-finned pilot whales to LFAS A) Strong response
for gm09_138b (3 fuzzy clusters, fuzziness = 1.06) B) Absence of response for gm09_156b
(3 fuzzy clusters, fuzziness 1.06) _____________________________________________ 196
Figure 24: Example of vocal responses of long-finned pilot whales to CTRL- playbacks
(gm13_169a, 3 fuzzy clusters, fuzziness = 1.12). The call type produced in DUR (left
cluster, in blue) was higher in frequency that the call types used in PRE (centre and right
cluster, in green and red) ___________________________________________________ 197
Figure 25: Example of vocal response of long-finned pilot whales to CTRL+ playbacks
(gm13_169b, 4 fuzzy clusters, fuzziness = 1.07). Long-finned pilot whales produced more
graded calls in DUR than in PRE and POST ___________________________________ 198
Figure 26: Examples of vocal responses of long-finned pilot whales to sonar signals. The left
panels show apparent stereotypes. The right panels show memberships scores to each
cluster. Left to right in left panels corresponds to bottom to top in right panels (blue,
green, red) A) Responses of gm08_150c to LFAS (top) and MFAS (bottom); 3 fuzzy
clusters, fuzziness = 1.17. The call type produced during exposure to LFAS (right cluster,
in red) differed from the call type used during exposure to MFAS (left cluster, in blue) B)
Responses of gm09_138b to LFAS (top), MFAS (middle), and LFADS (bottom); 3 fuzzy
clusters, fuzziness = 1.09. The call type used during exposure to LFAS (left cluster, in
blue) differed from the call type used during exposure to MFAS and LFASDS (centre
cluster, in green) __________________________________________________________ 200

34
Figure 27: Vocal responses of tag gm14_180a to MEKW (top) and CTRL+ (bottom) playbacks. 3
fuzzy clusters, fuzziness = 1.18. The same call type (left cluster, in blue) was recorded
during MEKW and CTRL+ playbacks ________________________________________ 201
Figure 28: Summary of long-finned pilot whale vocal responses to sonar exposures, playback of
killer whale sounds, and corresponding controls. Each cell can have three symbols: an
arrow going up, an arrow going down, and an equal sign, which represent respectively
an increase, a decrease, and the absence of directional change for the behavioural
measure. When one type of change is consistent across individuals, only the
corresponding symbol is represented. Therefore, the presence of several symbols means
that vocal responses were variable between individuals. When the difference in
magnitude between the vocal responses in DUR and in POST is consistent across
individuals, the largest change is indicated with a larger arrow, and the smallest one
with a smaller arrow _______________________________________________________ 203

35
1: GENERAL INTRODUCTION
1.1: External stimuli carry vital information about the environment
Adopting appropriate responses to environmental stimuli has a crucial influence on
animal fitness. Diverse stimuli that animals receive from various external sources may
carry information about the location, quantity, and quality of both resources and threats
in the surrounding area.
For instance, the risk of predation is one of the main threats faced by animals, and
effective responses to predation risk indicators will increase the fitness of individuals.
There are numerous strategies to respond to perceived predation risk: animals may fight
against predators, form groups or schools to reduce the individual risk of predation,
seek refuge, or try and avoid detection. These responses may be broadly categorised as
fight, flight, or stealth strategies (Ford and Reeves, 2008). They can be expressed at the
individual (individual escape manoeuvres: Ford et al., 2005; Whitford et al., 2017) or the
collective scale, in same-species groups (group silencing in beaked whales: Soto et al.,
2018) or mixed-species assemblages (Hurd, 1996; Dutour et al., 2017). According to their
timing within a predator attack, we distinguish primary and secondary responses:
‘primary responses’ occur before predators are able to detect their prey and aim to avoid
physical encounter with predators, and ‘secondary responses’ happen once predators

36
have launched their attack and focus on surviving the encounter (Ford and Reeves,
2008).
In some contexts, it may be adaptive to be aware of factors that influence predation risk
ahead of time or from a distance. There are multiple sources of information and several
kinds of signals in the environment which may carry such valuable information for
animals. Vigilance to cues and signals that precede or indicate potential increases in risk
would allow the triggering of primary anti-predator responses. Such primary responses
could be used to avoid fights against predators and subsequent injuries and would be a
mean to decrease the costs of predation.
1.1.1: Communication signals
Communication refers to the directed transmission of a signal from a signaller to a
receiver, which influences the behaviour of the receiver (Bradbury and Vehrencamp,
2011). Communication typically takes place within a species: con-specifics may
exchange signals to maintain social cohesion (individual vocal signatures in bottlenose
dolphins: King et al., 2018; group-specific calls of killer whales: Miller and Bain, 2000;
collective movements in primates: Schlenker et al., 2016), to signal the boundaries of
their territories to neighbours (vocal displays: Schmidt et al., 2007; olfactory marking:
Zub et al., 2003), or to signal the presence of an external threat to group members
(Collier et al., 2017).

37
However, communication is not limited by species boundaries: some signals are
directed towards members of other species. For instance, alarm and mobbing calls may
be directed towards hetero-specific animals to recruit them to a mobbing event (Suzuki,
2016; Dawson Pell et al., 2018), or towards predators to make detection known to them
and thereby deter their attack (Curio et al., 1978) or to confuse them (Corcoran and
Conner, 2017). Individuals may direct their signals toward prey species to manipulate
their behaviour (Ford et al., 2005; Simon, 2005) or towards competitors to reduce their
efficiency (Wollerman, 1999).
1.1.2: Intercepted signals
Animals may also intercept signals, i.e. detect signals that were not intended for them
and infer information from such cues. We can distinguish two kinds of signals that can
be intercepted.
First, individuals may perceive involuntary cues. These cues are not intentionally
broadcasted signals, but they can still be informative for eavesdroppers. For instance,
chemical and visual cues play a central role in the context of predation: predators make
use of involuntary prey cues to detect them (Koivula and Viitala, 1999; Bouchard et al.,
2019), whereas prey are likely to make appropriate defensive responses, such as fleeing,
upon detection of predator cues (Schoeppner and Relyea, 2009; Amo et al., 2008; Billings
et al., 2015).

38
The second kind of signal that animals can intercept is communication signals directed
to a third-party. We refer to such interception of communication signals as
eavesdropping (McGregor, 1993). Individuals can intercept communication signals
exchanged between con-specifics (satellite males in crickets: Cade and Cade, 1992; food
signalling in songbirds: Hillemann et al., 2019). Eavesdropping on hetero-specific
communication signals can be informative as well. Communication signals intercepted
from prey from prey may be used to increase foraging efficiency (Barrett-Lennard et al.,
1996; Corcoran and Conner, 2017), and signals intercepted from predators to avoid
predation (Billings et al., 2015). Signals from species sharing common predators could
signal predator presence (Mahr and Hoi, 2018; Dawson Pell et al., 2018) or absence (Lilly
et al., 2019). Vigilance to competitor signals may help locate resources (Jourdain and
Vongraven, 2017; Pollock et al., 2017) or avoid areas of high-intensity competition
(Evans et al., 2009). Cases of hetero-specific eavesdropping occur both within taxa
(Dawson Pell et al., 2018) and across taxa (Fuong et al., 2014; Lilly et al., 2019).
1.1.3: Anthropogenic sources
Human activities present a number of risks for animal populations. These risks include
physical and physiological damage: collisions with vehicles are responsible for an
average of 4 % of annual roe deer deaths in Europe (Bruinderink and Hazebroek, 1996);
pile-driving sounds can trigger hearing loss in harbour seals (Finneran, 2015; Kastelein

39
et al., 2018); urban environments result in elevated stress levels in birds (Slabbekoorn
and Ripmeester, 2008). Apart from damage risks, human activities can also alter the
behaviour of animals. Human-related light sources influences the migratory route of
birds (McLaren et al., 2018). Vessel traffic noise can mask biological sounds (Jensen et al.,
2009a) or displace populations from biologically important areas (Glockner-Ferrari and
Ferrari, 1990). Urban noise can alter inter-specific interactions: for instance, prey may
have reduced abilities to detect predators in noisy habitats (Francis et al., 2009).
Sounds associated with human activities, referred to as anthropogenic sounds, can play
a double role in this context. On the one hand, they can represent direct perturbation
sources themselves (masking of biological sounds, ear damage for intense sounds); on
the other hand, they could serve as hints indicating the presence of human activities and
their potential threats to the animals.
1.1.4: The costs of misinterpreting environmental stimuli
Environmental stimuli, including signals produced by hetero-specific animals and
anthropogenic sources, may carry valuable information about the environment. It is
essential to accurately recognise the ecological significance of such stimuli, or at least to
consistently associate them with appropriate behavioural responses to gain the fitness-
enhancing benefits of the response. False negatives, i.e. the failure to display an
appropriate response in the presence of a stimulus, incur a shortfall of resource

40
acquisition (if the stimulus is associated to the presence or location of a resource) or a
risk to be killer or injured (if the stimulus is related to the presence of a threat). False
positives, i.e. triggering a behavioural response to a stimulus in its absence, can also
reduce fitness. Uncalled for changes in behaviour imply excess energy expenditures and
the loss of the benefits related to the functional behavioural state that was disturbed
(Isojunno et al., 2016).
The importance of environmental stimuli for the gathering of information is heightened
in unpredictable environments such as the marine environment. The marine
environment is also a type of environment with limited access to information.
1.2: The marine environment is a prime setting for the study of eavesdropping
1.2.1: Sounds are a primary support of information in the marine environment
Environmental stimuli can be perceived through one or several sensory modalities such
as: touch (Thomas and Gruffydd, 1971), olfaction (Zub et al., 2003; Mahr and Hoi, 2018),
vision (Rauber and Manser, 2018), and audition (Billings et al., 2015). Each of these
modalities presents limitations, due to the nature of the signals, the transmission
properties of the environment, and the species ecology. For instance, tactile stimuli only
exist at very short-range. Visual information requires a minimum amount of light to be
detected, and they cannot be transmitted through opaque obstacles. Chemicals signals

41
remain for a long-term in the environment, but do not diffuse over large range: they are
not very suitable for highly mobile species.
In the marine environment, light is absorbed strongly by the seawater, so ambient light
quickly fades with depth and visual detection distances are limited. Moreover, the
turbidity of seawater further reduced the propagation of light. Visual signals are
typically most usable at close ranges when animals are close enough to the sea surface
for ambient light to be present. Most marine species, in particular marine mammals,
have large habitat ranges and could not rely on chemical signals for communication,
even though they may be used during foraging (Bouchard et al., 2019). By comparison,
the acoustic channel provides an efficient means for unimodal, adjustable, fast, long-
range information transfer in the marine environment. Indeed, sounds travel five times
faster underwater than in the air, and acoustic signals suffer little absorption in sea
water. Acoustic energy absorption levels are frequency-dependent and particularly low
for low frequency sounds (e.g. Munk et al., 1994). The content of acoustic signals can
vary in the frequency, the time, and the amplitude domains, providing wide degrees of
freedom to encode information in sounds.

42
1.2.2: Cetaceans
Most species of marine mammals and cetaceans in particular are highly mobile, which
may magnify the prominent benefit of using sounds to detect features in the marine
environment. Indeed, cetaceans rely on acoustic signals for multiple biological
functions: navigation and foraging (Miller et al., 2004), maintenance of social cohesion
(Nousek et al., 2006; King et al., 2018), and reproduction (Herman, 2017) for instance.
There are two sub-orders of cetaceans: the mysticetes, or baleen whales, and the
odontocetes, or toothed whales (Würsig et al.,2018). Mysticetes are larger whales which
share adaptations for filter feeding (large heads and mouths, laryngeal grooves for
expansion, and baleens for filtering: Cade et al., 2016). Most species migrate annually
between high-latitude, cold water feeding grounds and tropical, warmer waters
breeding grounds (e.g. humpback whales: Clapham and Mead, 1999; gray whales:
Cummings and Thompson, 1971). Mysticetes are adapted for the production and
reception of low-frequency sounds, but do not produce echolocation signals (Au et al.,
2006; Berchok et al., 2006; Parks et al., 2019).
Odontocetes vary in size: from small dolphin species, 1.5 m (e.g. Commerson dolphins:
Yoshida et al., 2014) to sperm whales, 15 m (Würsig et al., 2018). Though some, as adult
sperm whales, are thought to be solitary, many odontocetes live in social groups all year
long (e.g. Ottensmeyer and Whitehead, 2003; Fearnbach et al., 2014). All odontocetes
share the morphological adaptations for the use of echolocation (Racicot et al., 2019).

43
Toothed whales produce a variety of sounds: whistles, echolocation clicks, and pulsed
calls. Whistles are tonal, frequency modulated signals. They seem to be used for short-
range communication (Thomsen et al., 2001). Clicks are broadband pulses mostly used
in trains for echolocation (Miller et al., 2004). The length of the interval between
successive clicks is correlated with the range to the echolocation target. At close range,
individual clicks cannot be distinguished anymore: such rapid click trains with
increasing click rate are referred to as buzzes. Buzzes seem to be associated with prey
capture attempts. Not all click-based signals are used for echolocation: sperm whales
use group-specific click trains, called codas, during social interactions (Gero et al., 2016).
Buzz-like signals, referred to as bursts or rasps, show varying click rate evolution
patterns and are not associated with foraging (Yoshida et al., 2014; Sørensen et al., 2018).
Pulsed calls are fast pulse train which appear tonal to the human ear and form
horizontal bands on spectrograms. The apparent tonal frequency corresponds to the
pulse repetition rate (Watkins, 1966). Pulsed calls can make up a substantial proportion
of some species’ communication signals (Miller and Bain, 2000). The frequency ranges
used by toothed whales vary greatly from one species to another: species are sorted into
three groups according to the hearing and frequency ranges. High-frequency cetaceans
include sperm whales, beaked whales and large delphinid species such as killer whales
and pilot whales (Southall et al., 2019). Porpoises and some species of dolphins form the
group of very high-frequency cetaceans (Southall et al., 2019).

44
The hearing ranges of the different groups of cetaceans overlap to a large extent
(Southall et al., 2019). Given the fast and long-range propagation of sounds underwater,
cetaceans should be able to detect acoustic signals from a multitude of sources,
including other species of cetaceans and anthropogenic sources. They provide an ideal
setting to investigate how animals might be able to detect and use the signals present in
their environment.
1.2.3: Methodological limitations in the marine environment
Studying the behaviour of cetaceans is challenging. Mysticetes species are too large to be
held in captivity. Smaller species may develop abnormal behaviour in captivity. In
addition, not all aspects of behaviour can be observed from captive animals. Monitoring
the behaviour of free-ranging cetaceans is also difficult. Cetaceans spend most of their
time underwater and thus visual observations at the surface only provide a partial
record of their behaviour. The recent development of animal-borne sensors made
possible to study the underwater behaviour of wild cetaceans in detail. These tags can
be attached to the animal temporarily (with suction cups for instance: Johnson and
Tyack, 2003) or for extended periods of time (with barbs: Alves et al., 2010) and record
diverse aspects of cetaceans’ behaviour: their position at the surface, their depth, their
orientation and movement patterns, or their acoustic scene. In addition, the natural
range of some species is limited to remote areas (e.g. narwhals in arctic waters: Laidre et

45
al., 2006), which increases the material and logistical costs of field studies (boat, crew,
tracking material, tags).
1.3: Case study of hetero-specific signal eavesdropping: killer whale sounds
1.3.1: Ecological relationships between killer whales and other cetacean species
Killer whales are a cosmopolitan species, particularly common in high-latitude coastal
areas (Jefferson et al., 1991). They are apex predators known to prey on a large variety of
species including members of all marine mammal families they encounter in their
natural range. Most cases of killer whale predation on marine mammals involve
pinnipeds, but killer whales were also reported to hunt other toothed whales and baleen
whales (Jefferson et al., 1991). Killer whale attacks on pinnipeds and small whales
generally involve groups of six to ten individuals, which use collective herding
strategies to corral their prey. When attacking large whales, killer whales usually form
larger groups, in which small sub-groups (one to five individuals ) harass a single prey
at a time (Whitehead and Glass, 1985; Jefferson et al., 1991; Jourdain et al., 2017). The
predation pressure that killer whales exert on other marine mammal species is difficult
to estimate precisely (Trites et al., 2007), but is thought to be responsible for the lowest
incidence of whistling dolphins in temperate waters (Rankin et al., 2013) and the
evolution of migration in large whales (Steiger et al., 2008).

46
Marine mammals exhibit a diversity of responses toward killer whale attacks, which
encompasses fight, flight and stealth behavioural strategies (Ford and Reeves, 2008).
Sperm whales, with their large body size, and mysticetes with robust body shapes (such
as humpback whales, bowhead whales, or grey whales) can use fight strategies against
killer whales: they thrash their flukes and flippers towards their assailants. In some
species, groups form marguerites or spokes: individuals form a circle with their heads
towards the circle and flip their tails towards predators (Whitehead and Glass, 1985;
Jefferson et al., 1991; Ford and Reeves, 2008). Pilot whales, despite their smaller body
size, form larger, tighter groups in the presence of killer whales and were observed to
chase them away (Jefferson et al., 1991; De Stephanis et al., 2015). Baleen whales with
hydrodynamic body shapes (such as blue whales and fin whales) rely on flight
strategies: when attacked by killer whales, they engage high speed directional escapes.
However, if the killer whales catch up to them, they exhibit little or no defence: they
may roll belly up so as to get their appendages out of the attackers’ reach (Jefferson et al.,
1991; Ford et al., 2005; Ford and Reeves, 2008). Many species incorporate stealth in their
responses to killer whale attacks: silencing (Jefferson et al., 1991; Laidre et al., 2006; Soto
et al., 2018) or hiding in the shallows or in kelp beds, and behind ice clocks and boats
(Jefferson et al., 1991).
However, not all interactions between killer whales and other marine mammal species
are of a predatory nature. Some cases of killer whale attacks do not result in death, but

47
rather resemble harassment (Whitehead and Glass, 1985; Jefferson et al., 1991). Killer
whales are frequently observed in close proximity with other marine mammal species:
some dolphin species travel and rest with killer whales, porpoises sometimes ply
around killer whales (Jefferson et al., 1991). Killer whales can be observed feeding in the
same place as other species (Jefferson et al., 1991), sometimes on the same prey (e.g.
herring: Jourdain and Vongraven, 2017). There are also cases of marine mammals
avoiding killer whales in the absence of apparent attack intent (Jefferson et al., 1991),
and reports of marine mammals chasing killer whales away or harassing them (De
Stephanis et al., 2015; Pitman et al., 2017).
The variability in the nature of the interactions between killer whales and other marine
mammal species can be linked to the ecological variability of killer whales. Indeed, there
are several distinct populations of killer whales around the globe, and some of them
present evidence of the existence of sympatric ecotypes: that is, ensembles of individuals
or groups sharing ecological adaptations (morphology, behaviour) irrespective of their
genealogy (de Bruyn et al., 2013).
1.3.2: Killer whale ecotypes
The first killer whale ecotypes were described in the northeast Pacific. Researchers
identified two sympatric populations, referred to as resident killer whales and transient
killer whales, which do not mix socially (Morton, 1990; Baird et al., 1992) and show clear

48
dietary specialisations. Resident killer whales feed on fish (mostly salmon) and transient
killer whales hunt marine mammals (mainly pinnipeds and porpoises, but occasionally
larger cetaceans) (Morton, 1990).
Killer whale ecotypes are engaged in different trophic relationships with other cetacean
species. Some ecotypes prey on marine mammals, some compete with other cetacean
species for a common resource such as prey or habitat, and some display apparently
neutral relationships with other cetacean species. It would be adaptive for cetacean
species to discriminate between killer whale ecotypes in order to respond appropriately
to the type of killer whale they encounter. The dietary specialisation of resident and
transient killer whales is associated with differences in behaviour between these
ecotypes, including differences in social organisation and in vocal behaviour. Marine
mammals may eavesdrop on killer whale ecotype-specific vocal characteristics to adapt
their behaviour to the type of killer whale detected, as has been shown for harbour seals
(Deecke et al., 2002).
All killer whale ecotypes produce typical odontocete sounds: pulsed calls, clicks, and
whistles, with pulsed calls representing the majority of killer whale communication
signals (Miller and Bain, 2000). Overall, transient killer whales produce fewer clicks and
pulsed calls than resident killer whales (Ford, 1984; Barrett-Lennard et al., 1996).
Resident killer whales produce clicks and calls in almost all behavioural contexts
(Morton, 1990), while transient killer whales are only vocal during attacks, after a kill,

49
and when socialising at the surface (Deecke et al., 2005; Ford et al., 2005; Riesch and
Deecke, 2011). In particular, resident killer whales rely on echolocation clicks to find
their prey (Simon et al., 2007), while transient killer whale remain silent until the attack
when hunting (Barrett-Lennard et al., 1996; Deecke et al., 2005). Transient killer whales
show little, if any, differential usage of call types between contexts (Deecke et al., 2005),
whereas the usage of certain call types vary according to contexts in resident killer
whales (whistles preferentially used during rest and socialising, bi-phonated calls used
more during foraging and travel in spread out groups: Miller, 2006; Riesch and Deecke,
2011). Each pod of resident killer whales has a repertoire of 7 to 17 stereotyped pulsed
call types (Ford, 1991). Pod-specific call types, different usage rates of shared call types,
and variation in the structure of individual call types carry pod, matriline, and
individual markers (Miller and Bain, 2000; Nousek et al., 2006). Transient killer whales
present a smaller repertoire which is distinct from the vocal repertoire of resident killer
whales. Moreover, most call types are apparently shared by all members of the
population (Deecke et al., 2002; Riesch and Deecke, 2011). Lastly, the calls of resident
killer whales are usually louder, longer, and of higher frequency and wider bandwidth
than calls of transient killer whales (Deecke et al., 2005; Foote and Nystuen, 2008; Riesch
and Deecke, 2011; Filatova et al., 2015a).
The differentiation between these north Pacific killer whale ecotypes is clear and well-
defined. It has served as a template to study other killer whale populations around the

50
world. In some cases, similar differentiations were discovered (for instance, in the
Russian Far East: Filatova et al., 2015b). However, this model of sympatric
differentiation of ecotypes does not hold in every area (reviewed in de Bruyn et al.,
2013). For instance, in the north Atlantic, several morphotypes of killer whales have
been described, but their ecology appears more complex than in the north Pacific and
their ecotypic and dietary status remains unclear. There are three killer whale
populations in the north Atlantic, associated with the herring, mackerel, and bluefin
tuna stock (Foote et al., 2011, 2012). Two ecotypes have been proposed in the north
Atlantic: type 1, a generalist feeding mostly on fish; and type 2, a specialist hunting
baleen whales (de Bruyn et al., 2013). In the northeast Atlantic, killer whales appear to
belong to the type 1 ecotype but their diet remains unclear. Seal-hunting killer whales
near the Shetland Islands are socially related to herring-feeding killer whales in Iceland
(Beck et al., 2012). Killer whales identified as herring-feeding in Norway were observed
taking harbour seals, harbour porpoises, and minke whales (Vester and
Hammerschmidt, 2013). It remains unknown whether seal-eating killer whales in
Norway are full-time marine mammal hunters, show seasonal dietary specialisation, or
switch opportunistically between prey types (Jourdain et al., 2017). Isotopic analyses
revealed that at least some individuals may switch between fish and marine mammal
prey, and that the proportions of each type of prey in their diet vary over their lifetime
(Foote et al., 2012; Samarra et al., 2017).

51
Despite unclear ecological differentiation, consistent differences in behaviour, including
in vocal behaviour, still exist between killer whales feeding on different prey (Simon et
al., 2007; Samarra, 2015). Herring-feeding killer whales in Norway produce many
echolocation clicks, bi-phonated calls, and use tail slaps (which produce multi-pulsed
broadband sounds) to herd fish into tight balls near the surface (Simon, 2005; Shapiro,
2008). When hunting seals, north Atlantic killer whales move in small groups and
reduce their vocal output (Jourdain et al., 2017; Riesch et al., 2012). Marine mammal-
eating killer whales worldwide seem to adopt this silent hunting strategy (in the Pacific:
Deecke et al., 2005; in the Crozet archipelago: Guinet et al., 2000; in the north Atlantic:
Deecke et al., 2011). In addition, the calls of north Atlantic killer whales are higher in
frequency than the calls of transient killer whales (Foote and Nystuen, 2008; Filatova et
al., 2015a).
1.3.5: Study species: the humpback whale (Megaptera novaeangliae)
Humpback whales inhabit most of the world seas: there is a large population in the
southern hemisphere, and two populations in the north Atlantic and Pacific. They
favour coastal and shelf waters, but occasionally cross deep waters (Clapham and Mead,
1999; MacKay et al., 2016). Mature individuals measure an average of 13 meters for
males and 14 meters for females. Their large flippers amount to one third of the animal
length make them particularly manoeuvrable and can be used as a weapon to defend

52
against assailants (Clapham and Mead, 1999; Ford and Reeves, 2008). In the northern
hemisphere, humpback whales migrate annually between summer and fall feeding
grounds in high-latitude waters and winter breeding grounds in subtropical areas
(Payne and McVay, 1971; Clapham and Mead, 1999). They show high fidelity towards
feeding grounds, and whales from several feeding grounds converge to large breeding
areas (Clapham and Mead, 1999; Stevick et al., 2006). On breeding grounds, humpback
whales adopt a polygamous mating system in which associations between individuals
are transient (Baker and Herman, 1984; Andriolo et al., 2014). On feeding grounds, they
either form large, temporary aggregations spread over several square kilometres when
feeding on plankton, or small groups that are stable over the years when feeding on
schooling fish (Baker and Herman, 1984). In the northeast Atlantic, humpback whales
feed on plankton and capelin (Mallotus villosus) off Iceland, Bear Island, and Jan Mayen
(Nøttestad et al., 2014). During winter, part of the population stops in the Norwegian
waters to feed upon wintering herring (Clupea harengus) before their southward
migration (Jourdain and Vongraven, 2017). Humpback whales are the most vocal
mysticetes (Payne and McVay, 1971). They produce two kinds of sounds: the song, a
structured vocal display produced exclusively by males and mostly on the breeding
grounds (Payne and McVay, 1971; Herman, 2017), but occasionally during migration
and on the feeding grounds (Magnúsdóttir et al., 2014; Herman, 2017; Ryan et al., 2019;
pers. obs.); and social sounds which include vocalisation and surface impacts with
53
flippers and body, produced by all individuals, including females and calves, all year
round (Thompson et al., 1986; Dunlop et al., 2007; Stimpert et al., 2011; Rekdahl et al.,
2013; Kavanagh et al., 2017). The frequency range of songs and social sounds ranges
from 30 Hz to over 20 kHz (Thompson et al., 1986; Au et al., 2006; Dunlop et al., 2013).
Little is known about humpback whales’ hearing abilities. Humpback whales should be
able to detect killer whale sounds, as the frequency ranges of both species overlap
(under the assumption that an animal could hear the frequencies it produces). An
audiogram for humpback whales was modelled from anatomical observations on
stranded individuals and known frequency-position functions from cats and humans
(Houser et al., 2001). It concluded that humpback whales had a typical mammalian U-
shaped audiogram spanning from 30 Hz to 18,000 Hz, with best hearing between 700
and 10,000 Hz and maximum sensitivity between 2 and 8 kHz. Sound exposure
experiments confirmed that humpback whales could detect sounds in the 5-2,000 Hz
range (Dunlop et al., 2015; Sivle et al., 2015).
Humpback whales interact with killer whales all along their migratory cycle. These
interactions are frequent and variable in nature. Along their migratory cycle, humpback
whales are led to interact with various populations and ecotypes of killer whales. Killer
whale sounds may assume a wide range of ecological significances for humpback
whales.

54
Interactions between humpback whales and killer whales are often predatory. Reports
of killer whale attacks on humpback whales describe mostly non-lethal attacks
(Whitehead and Glass, 1985; Jefferson et al., 1991; Saulitis et al., 2015) and some lethal
attacks (Florez-Gonzalez et al., 1994; Naessig and Lanyon, 2004; Pitman et al., 2015).
Attacks target calves preferentially, and they are concentrated on the breeding grounds
and on the annual migration toward the feeding grounds (McCordic et al., 2014).
Attacks are rarely directly observed: lethal attacks do not usually leave traces (except
when carcasses are found: Saulitis et al., 2015), but non-lethal attacks do. The prevalence
of killer whale scarring is high in humpback whales (15-40 %: Whitehead and Glass,
1985; Naessig and Lanyon, 2004; Steiger et al., 2008; McCordic et al., 2014), and indicates
that attacks by killer whales may be more frequent than previously thought. The low
number of recent scars on adult humpback whales confirms that most attacks target
calves (Naessig and Lanyon, 2004). Humpback whales are more scarred on breeding
grounds than on feeding grounds (14 vs 6%: Steiger et al., 2008), which is consistent with
the annual repartition of attacks inferred from direct observations. Anatomical
observations seem to indicate that humpback whales are fight strategists (Ford and
Reeves, 2008). Their large flippers incrusted with barnacles could be used to strike
attackers. Humpback whales form tight groups in response to killer whale attacks. They
protect the calves, appendages, and soft ventral sides from attackers. They often thrash
fluke, flippers, or head towards killer whales (Whitehead and Glass, 1985; Jefferson et al.,

55
1991; Florez-Gonzalez et al., 1994; Pitman et al., 2015). However, humpback whales have
also been observed to go silent and to avoid killer whales (flight strategies: Jefferson et
al., 1991; Ford and Reeves, 2008; Curé et al., 2015).
As is the case for marine mammals in general, not all interactions between humpback
whales and killer whales involve predation: there are also cases of competition and
interference for instance. There are documented cases of humpback whales avoiding
killer whales which showed no apparent attack intent and observations of both species
in close proximity with no response from either one (Jefferson et al., 1991). Humpback
whales sometimes travel with identified fish-eating killer whales (Pitman et al., 2017).
Humpback whales feed on schooling fish in some areas (Clapham and Mead, 1999). As a
result, they may compete with killer whale for the exploitation of this common resource.
Concurrent feeding of both species is common (Jefferson et al., 1991), as in Norway
during winter where they both feed upon herring in mixed-species aggregations
(Jourdain and Vongraven, 2017). These aggregations are initiated most often by killer
whales, and humpback whales join once the herring has been herded near the surface
(Jourdain and Vongraven, 2017). Humpback whales were also observed interfering with
killer whale attacks on other marine mammals: they were reported to join other
humpback whales under attack by killer whales, or even other marine mammals
(reviewed in Pitman et al., 2017). Humpback whales harassed more than half of the
attacking killer whales regardless of the species of the prey although the interference

56
was less intense when preys were not humpback whales (Pitman et al., 2017). Some
humpback whales travelled several kilometres to reach the site of a killer whale attack,
which seems to indicate that killer whale or prey sounds were the cues attracting
humpback whales (Pitman et al., 2017). However, playback of marine mammal-eating
killer whale sounds to humpback whales off Norway revealed strong avoidance
responses (Curé et al., 2015). Interestingly, no observation of humpback whale
interference with killer whale attack was made in the northeast Atlantic (Pitman et al.,
2017).
By conducting playback experiments, we tested whether humpback whales could
discriminate between the sounds of killer whale ecotypes, which should be associated
with distinct ecological meanings.
1.4: Case study of behavioural responses to anthropogenic signals: sonar signals
1.4.1: Naval sonar, a particular source of concern
The marine environment is a place of particular concern about the impacts of human
activities on the ecosystem (reviewed in Williams et al., 2015). Increasing human
activities (vessel traffic, fishery, pile driving, seismic prospection, naval sonar) have
especially large areas of influence because of the fast and long-range propagation of
anthropogenic sounds (e.g. Fristrup et al., 2003). Moreover, cetacean species exhibit a
double vulnerability to human-related disturbances, because of the importance of

57
sounds in their ecology and because of the low population size of some species resulting
from industrial whaling (Rocha et al., 2015).
Sonar sources produce high intensity signals to probe into underwater environments.
Space and time correlations between naval sonar transmissions and mass stranding
events (Parsons, 2017) placed sonar under the scrutiny of research. Several international
research groups, such as the 3S consortium (sea mammal sonar safety) in which my
Ph.D. was conducted, coordinated their effort to study the negative impacts of naval
sonar on marine ecosystems. Studies have identified a variety of impacts of sonar on
marine mammals. First, researchers focused on physical injury and observed temporary
and permanent hearing loss in animals exposed to sonar transmission (Southall et al.,
2007). Tissue damages from gas bubble formation in stranded individuals hinted at
unusual dive cycles upon reception of sonar signals (Cox et al., 2006). The focus of
researchers shifted towards the identification of behavioural responses to sonar
(Southall et al., 2016). These responses are less obvious than physical damage, but they
can potentially translate to severe detrimental effects at the population scale. The most
common behavioural response to naval sonar is avoidance (Miller et al., 2012;
Goldbogen et al., 2013; Sivle et al., 2015), sometimes for prolonged periods (Miller et al.,
2015), and interruption of foraging which can also last longer than the exposure to sonar
(Miller et al., 2012; Sivle et al., 2015; Isojunno et al., 2016). A particularly severe observed
response was the separation of a mother-calf pair (Miller et al., 2012). Other responses
58
include cessation of resting (Curé et al., 2016), alteration of diving behaviour (Frankel
and Clark, 2000; Visser et al., 2016), and modifications of the vocal behaviour.
Delphinids in particular have been reported to mimic sonar signals by producing
vocalisations with similar frequency modulation patterns as sonar pings (DeRuiter et al.,
2013; Alves et al., 2014). In addition, sonar signals can potentially mask natural
communication signals. Cetaceans can display compensatory mechanisms for masking:
they produce more, louder, and longer calls in areas of higher background noise; they
shift the frequency of their vocalisations to avoid masked frequency bands (Rendell et
al., 1999; Parks et al., 2007, 2011); and they may switched to less masked means of
communication such as clicks and surface impacts (Kavanagh et al., 2017; Marrero Pérez
et al., 2017).
Behavioural responses to sonar show high inter-individual variability according to
species, sonar signal characteristics, or the behavioural state of individuals (Goldbogen
et al., 2013; Harris et al., 2015). There exists a need to better characterise the behavioural
responses of cetaceans to sonar.
1.4.2: Interpretation of behavioural responses to sonar
Anthropogenic sounds emerged recently in the environment (on the evolutionary time
scale) and do not correspond to natural situations. It is thus challenging to determine the
biological significance and relevance of the behavioural responses they elicit in animals.

59
One approach is to extrapolate the effects of the individual behavioural responses to the
population scale, based on the species biology. Prolonged avoidance and cessation of
foraging may result in a decline in body condition and reproductive success in
populations routinely exposed to sonar. Avoidance responses may also displace
populations from biologically crucial area, such as feeding hotspots or breeding grounds.
Prolonged masking from sonar signals may reduce the efficiency of information transfer
and provoke a reduction in social cohesion or an increase of the energy and time budget
for communication.
Another approach is to compare the behavioural responses to anthropogenic sounds
with behavioural responses to natural disturbing stimuli of known ecological meaning.
The risk of predation is a particularly strong ecological signal (Lima and Dill, 1990);
therefore, cues indicating a heightened risk of predation are generally used for
comparison. They usually trigger clear and strong biologically costly responses from
prey. The risk disturbance hypothesis predicts that the costs of responses to
anthropogenic sounds perceived as a threat should be shaped by the costs of responses
to natural threats (Frid and Dill, 2002). For cetacean species, killer whale sounds are an
appropriate template to interpret the biological significance of responses of other
cetacean species to sonar (see Curé et al., 2016 for an example). Killer whales prey on
most marine mammal species, and should therefore be perceived as a threat. Even in
species that are not under strong predation pressure from killer whales, such as pilot

60
whales, we observe strong reactions to the presence of killer whales: pilot whales
chasing killer whales (De Stephanis et al., 2015). Killer whales appear to be perceived as
a threat or competitor by other marine mammals.
However, not all populations of killer whales are threatening for marine mammals. The
sounds of different populations of killer whales may be perceived differently by marine
mammals. That’s why we tested the sounds of different killer whale populations to
define an optimal template for the interpretation of the responses of marine mammals to
sonar.
1.4.2: Study species: the long-finned pilot whales (Globicephala melas)
Long-finned pilot whales are the second largest species of delphinids after killer whales:
mature males measure 6.5 metres and mature females 5.5 metres (Augusto et al., 2013).
They occur in shelf-edge and deep waters in the southern hemisphere and in the north
Atlantic (Isojunno et al., 2017). Long-finned pilot whales are deep-diving whales that
rely on echolocation to feed upon deep sea cephalopods, and occasionally on
mesopelagic fish (Gygax, 2002). They migrate between inshore and offshore water to
follow the distribution of their prey (Vester, 2017). They spend most of their time neat
the surface, with occasional series of foraging deep dives to 300-1000 meters (Sivle et al.,
2012; Isojunno et al., 2017).

61
Long-finned pilot whales live in cohesive social groups all year long (Visser et al., 2014).
Both male and female offspring remain with their mother (Amos et al., 1993) and form
matrilines: groups of 11-14 individuals from several generations (Ottensmeyer and
Whitehead, 2003). Matrilines associate in a mix of long-term (months, years) and short-
term (hours, days) relationships: such groups are called pods (Ottensmeyer and
Whitehead, 2003). Matrilines form tight subgroups within pods (Visser et al., 2014).
Individuals within a pod synchronise their behaviour to a large extent (Senigaglia and
Whitehead, 2012; Visser et al., 2014). Synchronisation is thought to improve foraging
efficiency, to have hydrodynamic advantages, to play a role in social bonding, and to
reduce predation risks (Senigaglia and Whitehead, 2012; Senigaglia et al., 2012). Long-
finned pilot whales synchronise their foraging bouts to a large extent; however, when
foraging, groups break into smaller sets of individuals which do not perform foraging
dives in synchrony. This could be a strategy to reduce foraging interference at depth
(Senigaglia and Whitehead, 2012; Visser et al., 2014). On the contrary, synchronisation
becomes more precise in large groups, in the presence of calves, or when multiple boats
are present in the area: it may be a general response to stressful situations (Senigaglia et
al., 2012).
The responses of long-finned pilot whales to sonar experiments have been identified
through sound exposure experiments, such as the ones performed by the 3S consortium
(Sea mammal Sonar Safety). Even if long-finned pilot whale stranding events have been

62
associated with sonar activity (Parsons, 2017), they do not appear to be particularly
sensitive to sonar transmission compared to other species, such as killer whales or
beaked whales: they respond at higher received sound levels, and their responses are
usually shorter in duration, rarely extending after the sonar transmission (Miller et al.,
2012; Antunes et al., 2014). The observed behavioural responses of long-finned pilot
whales to sonar include short-duration avoidance, modifications of the dive cycle such
as the interruption of deep diving (thus a probable cessation of feeding) and surfacing in
synchrony with sonar pings, and increases in social group size and cohesion (Miller et
al., 2012; Sivle et al., 2015; Visser et al., 2016; Isojunno et al., 2017). As in other species,
long-finned pilot whales exhibit large inter-individual differences according to sonar
type (more responses to 1-2 kHz signals than to 6-7 kHz ones: Miller et al., 2012) and
behavioural state (response patterns differed between foraging and non-foraging
individuals: Harris et al., 2015). Changes in vocal activity in response to sonar exposure
were also reported; however, they report global vocal activity levels (e.g. call rate:
Rendell and Gordon, 1999; Visser et al., 2016), or focus on specific vocal patterns
(mimicry of sonar signals: Alves et al., 2014).
The vocal responses of long-finned pilot whales to naval sonar have not been reported
in detail because of the challenges of describing this species’ vocal behaviour. Long-
finned pilot whales display high-levels of vocal activity in all behavioural contexts
(Popov et al., 2017). Bouts of vocalisations are usually separated by short pauses, but

63
longer periods of silence are possible when pilot whales are resting in such close
proximity that vocal signals are not needed for communication (Visser et al., 2014, 2017).
Long-finned pilot whales produce typical odontocete sounds: echolocation clicks,
whistles, and pulsed calls (Vester et al., 2016). Echolocation clicks are mainly used for
echolocation and foraging (they are ideal signals for range estimation: Jiang et al., 2019),
but they may have an additional role in communication in conditions adverse to call
production (e.g. at depth: Jensen et al., 2011). Long-finned pilot whales produce rasps,
rapid series of clicks which, unlike buzzes, are not related to prey capture attempts
(Vester, 2017). In the closely related congener short-finned pilot whale species,
individuals may somewhat shift their communication towards click-based signals at
depth, even if they keep producing tonal calls up to 800 m (Jensen et al., 2011; Marrero
Pérez et al., 2017). Whistles and pulsed calls are mainly used for communication (these
signals are optimal for speed estimation and information transfer robust to the
differential speed of producer and receiver: Jiang et al., 2019). The frequency range of
long-finned pilot whale whistles cover the human audible range and extend to the
ultrasonic range, with most whistles between 20 and 40 kHz (Vester et al., 2017). Long-
finned pilot whales produce a variety of pulsed calls. However, they do not fall into
discrete categories but rather form a continuum of graded calls with intermediate forms
between pulsed and tonal signals (Visser et al., 2014; Vester et al., 2017), as has been

64
observed in other delphinid species (short-finned pilot whales: Sayigh et al., 2013;
beluga whales: Garland et al., 2015; false killer whales: Murray et al., 1998).
This level of variation causes the categorisation of long-finned pilot whales vocalisations
to be fundamentally challenging. Initial attempts at classification relied on the definition
of broad classes based on entire call frequency modulation patterns (Taruski, 1979). The
latest descriptions of the vocal repertoire of long-finned pilot whales described calls as
sequences of subunits with consistent frequency contours separated by silent gaps
(segments) of shifts in frequency (elements). They identified 129 call types and 25
subtypes (Vester et al., 2017). In addition, long-finned pilot whale calls can also be bi-
phonated, with two independently modulated frequency component (the low frequency
component or LFC and high frequency component or HFC: Vester et al., 2017). Most
calls have relative simple structure (around 10% of calls had several segments: Vester et
al., 2017) and contained a single frequency component – the LFC by convention (75%:
Nemiroff and Whitehead, 2009; Vester et al., 2017). The maximal number of elements
was eight for LFC calls and seven for bi-phonated calls (Vester et al., 2017). Each pod of
long-finned pilot whales produce between seven and 54 call types, some of which are
shared with other groups (15-81% of shared call types: Vester et al., 2016). Pods of pilot
whales which share a portion of their repertoire form a vocal clan (De Stephanis et al.,
2008). Long-finned pilot whales may use individual-specific whistles or calls in multi-
pod associations to maintain contact with matriline members (Weilgart and Whitehead,

65
1990). In short-finned pilot whales, individuals have a predominant, specific bi-
phonated call type which could be used to signal individual identity or group
membership (Quick et al., 2018).
Long-finned pilot whales display specific pattern of vocal behaviour. For instance, calls
with little frequency modulation are produced in all contexts, whereas highly
modulated ones tend to be more frequent around the start and the end of deep foraging
dives (Visser et al., 2017). Repeated call sequences, the repetition of similar calls with
regular spacing for up to several minutes, were among the first observation of the vocal
behaviour of long-finned pilot whales (Zwamborn and Whitehead, 2017a). They make
up a significant portion of the species’ vocal behaviour. As a result, some call types,
referred to as principal call types, represent most of pilot whale recordings (Nemiroff
and Whitehead, 2009; Sayigh et al., 2013; Vester et al., 2017). Within repeated call
sequences, repetition is not accurate: half of the transitions involve slight modifications,
either embellishments – discrete changes to part of the calls – or morphings – non-
discrete changes across the calls (Zwamborn and Whitehead, 2017b). It is unclear
whether repeated call sequences are produced by one or several individuals (Sayigh et
al., 2013). The possible functions of repeated call sequences are not known. The type of
calls repeated and the rate of repetition may convey information, as well as the
modifications of calls within the sequences (Zwamborn and Whitehead, 2017b, 2017a).
Repeated call sequences may also be a by-product of the fluid nature of long-finned

66
pilot whales’ vocal repertoire (Zwamborn and Whitehead, 2017b). Another pattern
worthy of attention is the overlapping of calls, frequent in this species (Alves et al., 2014).
Overlapping is usually an agonistic signal which reduces communication efficiency for
both overlapper and overlapped, but it may also be used to address specific individuals,
or a result of excitement (Todt and Naguib, 2000). Delphinids, among which long-finned
pilot whales, have a tendency to match signals produced by conspecifics and are known
to mimic anthropogenic sounds (DeRuiter et al., 2013; Alves et al., 2014). Call-matching
may be used to attract a caller’s attention and to retain it in noisy environments (Todt
and Naguib, 2000; Sewall, 2012). It is also a means to display group membership and
group size (Sewall, 2012).
I decided to focus on the vocal behaviour of long-finned pilot whales in response to
sonar exposure. A more in-depth analysis of pilot whale vocal behaviour is necessary to
explore the functional aspects of sound use in this species. I used an analysis of vocal
responses of long-finned pilot whales to playback of killer whale sounds as a tool to
interpret the biological significance of their responses to sonar. Other aspects of the
behavioural responses of long-finned pilot whales to these stimuli have already been
analysed by the 3S consortium (Miller et al., 2012; Curé et al., 2013; Sivle et al., 2015;
Visser et al., 2016; Isojunno et al., 2017; Curé et al., 2019), and provide strong supporting
information to augment a study of their vocal behaviour.

67
1.5: Research questions and thesis outline
My PhD is centred on two research questions:
How do cetaceans detect and process hetero-specific in relation with the ecological
relationships between the involved species?
How do cetaceans respond to anthropogenic sounds? How do these responses compare
to responses to biologically significant, natural signals?
The specific studies in my PhD are organised in three chapters.
1.5.1: Chapter 1 – Behavioural responses to heterospecific sounds are influenced by
trophic relationships and ecological contexts
I performed playbacks of killer whale sounds to humpback whales in northern Norway.
We used the sounds of unfamiliar, predatory killer whales (transient whales from
Alaska) and the sounds of familiar, competitor species (herring-feeding killer whales
from Norway). In addition, we performed playback experiments in the Norwegian
fjords during winter (both stimuli) and offshore during summer (unfamiliar, predatory
killer whales only). We combined visual observations and the deployment of multi-
sensor tags to monitor the behaviour of humpback whales before, during, and after the
playback.
I hypothesised that humpback whales would be able to discriminate between the
different killer whale stimuli and would respond differently to each. I expected fish-
68
eating killer whale sounds to have to signal the presence of food patches to humpback
whales, and thus trigger approach and exploration responses. I expected the sounds of
predatory killer whales to be perceived as a threat, and to trigger flight responses. The
different contexts of presentation represent two different positions along the starvation-
risk of predation trade-off, and also vary in bathymetry.
As expected, humpback whales approached the source of competitor killer whale
sounds, and dove deeper around it for the duration of the playback; whereas overall
they avoided the source of killer whale sounds. The avoidance responses to predatory
killer whale were stronger offshore than in the fjords. This could result from the lower
vulnerability of humpback whales to killer whale attacks in winter, or from a reduced
ability to recognise killer whale sounds as a threat because of the high number of fish-
eating killer whales in the fjords.
1.5.2: Chapter 2 – Unsupervised classification to study gradation in animal
vocalisations based on fuzzy clustering and Mel frequency cepstral coefficients
To address the challenge of how to classify the diverse repertoire of sounds produced by
long-finned pilot whales, I developed a procedure based on Mel frequency cepstral
coefficients (MFCC) and fuzzy clustering. The objectives were to take into account the
graded nature of pilot whales’ vocal repertoire and to provide objective classification
criterion, in order to propose an alternative to the time-consuming, human observer-
69
based classification schemes. I used long-finned pilot whales calls recorded in Norway
with hydrophone-equipped animal-borne tags. These calls had been classified using the
latest vocal repertoire as a template to evaluate the performance of the new method
(dataset courtesy of Heike Vester).
The developed method achieved a lower level of precision than the catalogue-based
classification: four categories were defined, versus eight (and three additional subtypes
within one of the call types) according to the catalogue. The fuzzy cluster-based
categories revealed consistent overlap patterns between the catalogue call types. In
addition, the new method provides tools for the quantification and the visualisation of
the gradation between call types.
1.5.3: Chapter 3 – Vocal responses of long-finned pilot whales to naval sonar
exposures and playbacks of killer whale sounds
I analysed the vocal behaviour of long-finned pilot whales before, during, and after
exposure to naval sonar or killer whale sounds. The behaviour of long-finned pilot
whales was monitored with visual observations at the surface and animal-borne, sound
recording tags. Movement patterns, activity budgets, and social aspects of the responses
have already been analysed elsewhere, and were used as supporting information to
study vocal responses. I used the method developed in chapter 2 to describe the vocal
behaviour of long-finned pilot whales.

70
I expected the overall number of calls to change in response to disturbance (either to
decrease to allow a better perception of the acoustic scene, or to increase because of the
higher information transfer required for coordinated responses). I looked for call types
only produced in response to disturbances (general alarm calls), or produced
specifically in response to a given stimuli. I also expected the typicality of the calls, i.e.
their position along the continuum from stereotyped calls to the absence of categories, to
vary: either to increase as a means to compress information and increase the efficiency
of communication or to decrease from the heightened information transfer required for
coordinated responses. I was also interested in the distribution and characteristics of
repeated call sequences and overlapping along the courses of the experiments.
I detected changes in call type usage in response to sonar exposures and playback of
killer whale sounds. I could not identify general alarm of recruitment call types, or
stimulus-specific call types across experiment replicates. There was no directional
change in the typicality of calls in response to naval sonar or killer whale sounds.

71
2: GENERAL METHODS
2.1: Study species and locations
2.1.1: Humpback whales (Megaptera novaeangliae)
We conducted playback experiment of killer whale sounds to humpback whales during
summer off Spitzbergen (between 73 and 79°N) and during winter in the fjords
surrounding Vengsøya (69°N). In the northeast Atlantic, humpback whales feed on
plankton and forage fish off Iceland, Bear Island, and Jan Mayen during summer and
autumn (Clapham and Mead, 1999; Nøttestad et al., 2014; Moore et al., 2019). During
winter, part of the humpback whale population stops in the Norwegian fjords to feed
upon wintering herring (Clupea harengus) before their southward migration (Jourdain
and Vongraven, 2017). Humpback whales were solitary or formed small groups (less
than five individuals) in the study areas, as observed in other foraging grounds (Baker
and Herman, 1984). Humpback whale songs are rarely heard on feeding grounds, but
may occur before the start of the migration (Magnúsdóttir et al., 2014; Ryan et al., 2019;
pers. obs.). Social sounds are routinely recorded from feeding grounds, including sound
types seemingly related to coordinated foraging (Thompson et al., 1986; Parks et al.,
2015).

72
2.1.2: Long-finned pilot whales (Globicephala melas)
We performed playback experiments of killer whale sounds and naval sonar controlled
exposure experiments to long-finned pilot whales off the coast of northern Norway
(between 66 and 70°N). Long-finned pilot whales exhibit fission-fusion dynamics
(Ottensmeyer and Whitehead, 2003), and group size varied within and between
experiments.
2.2: Experimental protocol
2.2.1: General procedure
The experiments presented in this manuscript have been executed as part of fieldwork
campaigns of the 3S (Sea mammal Sonar Safety) consortium from 2008 to 2018. I took
part in three campaigns: in January 2017, in June-July 2017, and in January 2018. The 3S
team organises two kinds of research expeditions: the main sonar trials, which aim at
exposing marine mammals to naval sonar transmissions; and the baseline trials, which
aim at testing the tags and collecting baseline data. Playback experiments were
conducted during baseline trials and were a secondary objective of main trials. During
baseline trials, the research team was usually based on land and went at sea every day.
During sonar trials, the research team spent several weeks at sea on a large research
vessel (HU Sverdrup II). The research team relied on a second vessel for observations
during the experiments for both kinds of trial.

73
Many interdisciplinary skills are needed on such fieldwork campaigns. My roles on the
field were tag technician (in charge of the preparation of the tags before the
deployments, the offloading and preliminary verifications of the collected data, and the
investigation of any technical issue related to the tags), marine mammal observer
(involving visual observation of marine mammals, identification of the tagged animal
by radio-telemetry, and collection of fluke and flipper photographs for identification),
and playback operator (testing the playback chain, installing the playback material on
the boat, and executing playbacks).
The sequence of a sound exposure experiment was the following (Figure 1A). First, we
searched for whales with visual or acoustic observations. Once a group of whales had
been detected, we began tracking them and sent a second boat (a dedicated boat during
baseline trials, and a small boat deployed from the research vessel during sonar trials) to
equip one or two whales with tags attached with suction cups. One tagged whale
became a focal whale which was followed until the tag detached to consistently track its
location. Then, after a post-tagging observation phase (to ensure that the tagged whale’s
behaviour had returned to normal after the tag deployment) and a baseline data
collection period, we exposed the focal whale (previously equipped with a tag) to a
sound stimulus. We broadcasted playback stimuli from a small boat (a dedicated one
during baseline trials, a small one deployed from the research vessel during sonar trials).
A sonar source towed by the research vessel Sverdrup II transmitted sonar signals. We

74
exposed focal whales to a maximum of six successive sound exposure experiments
(Table 1). In all cases, a second boat continued the visual tracking of the focal whale
throughout the experiments until tag detachment.
We compared the behaviour of humpback whales and long-finned pilot whales during a
pre-exposure period, right before exposure to the sound stimuli, the broadcast period,
and a post-exposure period immediately following the exposure. Comparison between
the pre-exposure and exposure period allow the identification of behavioural responses
to the stimulus. Comparison between the pre-exposure and the post-exposure periods
determined whether behavioural responses extended after the exposure period or not.
2.2.2: Data collection
We combined the multi-sensor animal-borne tags attached to the whales, and visual
observations at the surface from the deck of the observation vessel to record the
behaviour of humpback whales and long-finned pilot whales before, during, and after
the experiments. During each experiment, we equipped one or two whales with a tag,
and chose one tagged whale as a focal individual, based upon the tag position on the
body, and strength of the VHF radio signal received from the tag. The observation
vessel was confirmed that a whale at the surface was the focal tagged whale by visually
seeing the tag attached to the body, and/or by simultaneously hearing the VHF signal
(which is only received when the tag is out of the water). We tagged whales

75
opportunistically: we tried to tag an individual in the first whale group encountered in
most cases, but switched to another group if we could not approach close enough for
successful tagging.
2.2.2.1: Multi-sensor tags
We deployed either standard dtags (Johnson and Tyack, 2003) or custom-made mixed-
tags on humpback whales and long-finned pilot whales. Dtags contain two
hydrophones (sampling frequency: 96 kHz for humpback whales, 96 or 192 kHz for
long-finned pilot whales), a 3-axis accelerometer (sampling frequency: 50 Hz), a 3-axis
magnetometer (sampling frequency: 50 Hz), a pressure sensor (sampling frequency: 50
Hz), and a temperature sensor. Mixed-tags are custom-assembled tags which contain the
sensor suite of dtags and a GPS logger (FastLoc3®, SirTrack) within 3D-printed polymer
housings. Both dtags and mixed-tags were attached temporarily to the animals with
suction cups. We deployed the tags with either a long hand-held pole (Figure 2A) or a
pneumatic launching system (ARTS®, LKARTS: Figure 2B). All tags contained a VHF
beacon and a programmable release device which allowed us to recover them quickly
after the experiments. As detailed above, the VHF beacon was also used by the tracking
team to identify the focal whale at the surface.

76
Figure 1: General protocol A) Experiment timeline. Once a whale was detected, we started
visual observation immediately, while a vessel approached it to deploy a tag on a whale (“Tag
on”). After a post-tagging period and a period of baseline behaviour collection of the tagged
whale, we performed sound exposure experiments. All experiments consisted of three phases:
the pre-exposure observation period (“PRE”), the exposure period (“DUR”), and the post-
exposure observation period (“POST”). In the typical timeline, each period would last 40
minutes for sonar controlled exposure experiments and 15 minutes for playback experiments.

77
Focal whales were exposed to two to six sound exposure experiments. Tracking continued
throughout the experiments until tag detachment (“Tag off”) and tag recovery B) Playback
disposition. An operator on the tracking boat specified the position where the playback boat
transmitted sounds during playback experiments. We aimed to place the playback boat ahead of
the focal whale, at an angle of 45°: this geometry eased the detection of both approach and
avoidance responses C) Sonar controlled exposure experiment setup. The research vessel towing
the source started transmitting sonar pings 7-8 km away from the tagged whale, and then
continued transmission with one sonar ping every 20s while approaching the tagged whale at 7-
8 knots. The source level of sonar signals increased during the first 10 minutes of the experiment,
and was then held at maximal power. The research vessel adjusted its approach course towards
the surfacing points of the focal whale (communicated by the observation vessel). The course of
the focal vessel was fixed once it reached 1000 m from the focal whale. It continued transmitting
sonar for five minutes after crossing the focal whale’s path.

78
We constructed the dive profile of the tagged whale from the recording of the output of
the pressure sensor in the tag. We reconstructed the 3D orientation of the whale
underwater with the accelerometer and magnetometer data from the tag (Wensveen et
al., 2015). We used the dive profile, the orientation of the whale, and the flow noise
recorded by the hydrophones to interpolate the position of the whale between surfacing
events (recorded either with the GPS loggers or from visual observations). We
confirmed the reception of the sound stimuli on the tags recordings (we also set a
recording system to monitor the broadcasts near the source). Human observers checked
the tag recordings and noted the start and end times of vocalisations. For long-finned
pilot whales, they classified the signals as social sounds (pulsed calls and whistles) or
click signals (click sequences and buzzes) based on the presence or absence of horizontal
bands in the spectrograms.
2.2.2.2: Visual tracking
Immediately after tagging, an observation vessel started to track the focal whale visually,
using visual sighting of the tag or the radio signal from the VHF beacon to identify it.
For both species of whales, we recorded the position (based upon range and bearing
from the observation vessel) and heading of the focal whale when it surfaced, as well as
the size of the group it was in and the spacing between group members (if any).

79
We used a more detailed visual protocol for long-finned pilot whale groups, because
group size was larger and group composition was fluid (see Visser et al., 2014 for
details). We defined the focal area as a 200 m radius around the focal animal. The focal
group comprised all individuals interacting or showing a certain degree of synchrony
within 15 body length (around 100 m) from the focal individual. We took note of the size
of the focal group; the number of individuals in the focal area; the number of groups in
the focal area; the distance between the focal group and the nearest other group; the
spacing between individuals within the focal group; the level of synchrony and milling
within the focal group. The behavioural state of the focal group was estimated as
travelling (directed swimming), resting (logging, milling), socialising (increased contacts
and surface events), or foraging (long tail-out dives, presence of seabirds). We aimed at
making one observation every two or three minutes. We made all visual tracking
records in Logger 2010 (courtesy of the International Fund for Animal Welfare).

80
Figure 2: Tag deployment A) Deployment of a dtag on a long-finned pilot whale using a hand-
held pole B) Deployment of a mixed-tag on a humpback whale using the ARTS pneumatic
launching system. Picture credits: 3S project

81
2.2.3: Playback experiments
2.2.3.1: Stimuli used
We used the feeding sounds recorded from two killer whale populations for playback
experiments: transient killer whales from southeast Alaska, and herring-feeding killer
whales from Norway. We hypothesised that these stimuli would have different
ecological consequences for humpback whales and long-finned pilot whales. Transient
killer whales are specialised marine mammal eaters. The Norwegian study populations
of humpback whales and long-finned pilot whales are most likely unfamiliar with the
sounds produced by this Pacific population of killer whales. We assumed that their
sounds would be highly threatening, because marine mammal-eating killer whales
worldwide seem to adopt similar vocal behaviours, or because the novelty of the killer
whale sounds may be threatening by itself (other marine mammals habituate selectively
to local, non-predatory, killer whale populations: Deecke et al., 2002). In contrast, the
sounds produced by Norwegian herring-feeding killer whales should be familiar to
sympatric humpback whales and long-finned pilot whales. These killer whales exploit
the same food resource as humpback whales in Norway, sometimes in mixed-species
groups (Jourdain and Vongraven, 2017). We expected their sounds to signal the
presence of competitors or of a food patch to humpback whales. Long-finned pilot
whales and herring-feeding killer whales feed mainly on different prey, but occupy the

82
same foraging areas. Herring-feeding killer whale sounds may signal the presence of
another species in the area to long-finned pilot whales, or may indirectly signal the
presence of a food patch to pilot whales, as they sometimes feed on cod which itself
feeds on herring (Nøttestad et al., 2015).
All stimuli were recorded in natural behavioural contexts with dtags attached to whales
in the group. All recorded killer whale groups contained around five individuals.
Transient killer whales were recorded harassing and feeding on marine mammal prey
and herring-feeding killer whales were recorded during active foraging. We removed
sections of the recording containing sounds not produced by killer whales (for instance,
sections with high flow noise or sounds from the tag breaking the water surface) and
looped the resulting files so that all stimuli would last 15 minutes. We amplified the
stimuli to reach 140-155 dB re 1 µPa @ 1 m for the loudest calls (within the range of
natural source levels for killer whales sounds: Miller, 2006). The main difference
between the two kinds of sound stimuli is the presence of many clicks, buzzes, and tail
slaps in addition to calls in the herring-feeding killer whale stimuli, whereas the marine
mammal-eating killer whale stimuli contained almost exclusively calls.
We also used negative and positive controls during the playback experiments. We
selected sequences of recordings without killer whale sounds to use as negative controls.
These sequences were cleaned and looped in the same way as killer whale stimuli. We
amplified them to the same root-mean-square sound level as killer whale stimuli. We

83
used artificial signals as positive controls, to check if humpback whales and long-finned
pilot whales responded to any frequency-modulated signals. The positive control
sounds were 1 s, 1 to 2 kHz hyperbolic upsweeps repeated every 20 s. We broadcasted
them at the same root-mean-square sound pressure level as killer whale stimuli. We
constructed several versions of each stimulus, except the artificial positive control, to
reduce pseudoreplication.
2.2.3.2: Procedure
Each playback experiment was designed to last 45 minutes: 15 minutes of pre-exposure
observation, 15 minutes of broadcast, and 15 minutes of post-exposure observation
(Figure 1A). We performed generally two, up to four playback experiment per focal
whale (Table 1). This experiment timeline ensure that at least 30 minutes separated
successive exposures. We tried and observed an additional pause of 30 minutes so that
there would be one hour between successive broadcasts. In practice, this procedure was
not always respected and the time between successive broadcasts was sometimes
reduced by constraints such as bad weather (mostly in early experiments, between 2008
and 2010).
The tracking boat team determined the position where the playback boat should get in
position based on the distance and the direction between the surfacing positions of the
focal whale. We aimed to place the sound source roughly 800m ahead of the focal whale

84
but not directly in its path (Figure 1B). This geometry eases the detection of horizontal
approach and avoidance responses, and does not force reactions from the focal whale.
Once in position, the playback boat turned its engine off and lowered the loudspeaker
8m underwater (Figure 2). At the end of the playback experiment, the visual tracking
team determined the position of the playback boat for the next playback experiment.
The playback chain consisted of a player (M-Audio Micro Track II recorder or DR40-
Tascam recorder), a resistor, an amplifier (Cadence Z8000 or Sony XM-N502), and a
loudspeaker (Lubell LL9642T or LL9162T, frequency range 0.2-20 kHz). We monitored
the broadcasts with a calibrated hydrophone (Bruel and Kjaer 8105) placed one meter
above the loudspeaker, connected to an amplifier (Bruel and Kjaer 2635) and a recorder
(M-Audio Micro track II recorder or DR40-Tascam recorder).
2.2.4: Controlled exposure experiments
2.2.4.1: Procedure
We performed controlled exposure experiments of active sonar to long-finned pilot
whales in the northeast Atlantic. We used a towable sonar source (Socrates, TNO, the
Netherlands: Figure 3) which produced 1 s pings every 20 s (5% duty cycle). We used
three different ping characteristics: 1 to 2 kHz hyperbolic up sweeps (LFAS: low
frequency active sonar), 2 to 1 kHz hyperbolic down sweeps (LFASDS: LFAS down
sweeps), and 6 to 7 kHz hyperbolic upsweeps (MFAS: medium frequency active sonar).

85
Figure 3: The Socrates towed sonar source used during sonar exposure experiments. Picture
credits: 3S project
We used two boats during our experiments: the source boat which towed the sonar
source, and the tracking boat from which we visually tracked the focal whale. The
source boat positioned itself 7-8 km in front or to the side of the tagged whale. It started
transmitting sonar signals while approaching the focal whale at 7-8 knots (so that it
would reach it after 30 minutes of full power sonar transmission). The tracking team
communicated the focal whale’s positions to the source boat, so that it may adjust its
approach course. The source vessel fixed its heading once it reached 1000 meters from
the focal whale, and continued transmitting for five minutes after crossing its path
(Figure 1C). We transmitted no sounds for around one hour between successive

86
experiments to allow the whale to return to normal behaviour, and for the source boat to
get back into position. In addition to the approach by the source boat, we used a ramp
up procedure so that the received level of sonar signals would gradually increase for the
focal whale. The source level of sonar pings was regularly increased over 10 minutes.
Sonar transmissions lasted 40 minutes in our design (10 min ramp up and 30 minutes to
reach the focal whale), so the ideal timeline for sonar exposure experiments started with
40 minutes of pre-exposure period and ended with 40 minutes of post-exposure period
(Figure 1A). As for playback experiments, logistical constraints resulted in this timeline
not being always respected. We observed a mitigation procedure to shut down the sonar
source if animals moved too close to the source (100 m threshold, conservative
equivalent to a 200 dB re 1 µPa received sound pressure level), showed pathological
reactions, of approached the shore or confined areas. We used silent vessel approaches,
following the same course as sonar exposure trials, as negative controls. All
experimental procedures were permitted by the Norwegian Animal Research Authority,
with ethical approval form the Animal Welfare Ethics committee of the University of St
Andrews.

87
Individual ID Focal Exposure 1 Exposure 2 Exposure 3 Exposure 4 Exposure 5 Exposure 6
mn11_157a Yes OOS SONAR MEKW CTRL-
mn11_160a Yes OOS SONAR MEKW CTRL-
mn11_165e Yes OOS SONAR MEKW CTRL-
mn12_161a Yes OOS SONAR CTRL- MEKW
mn12_164b Yes OOS SONAR CTRL- MEKW
mn12_170a Yes OOS SONAR CTRL- MEKW
mn12_171a Yes OOS SONAR MEKW CTRL-
mn12_180a Yes OOS SONAR CTRL- MEKW
mn16_018a Yes HFKW CTRL-
mn16_020a Yes MEKW HFKW
mn16_023a Yes HFKW MEKW
mn16_024a Yes CTRL- HFKW
mn17_024a Yes MEKW HFKW
mn17_026a Yes HFKW MEKW
gm08_150c Yes MFAS LFAS
gm08_154d Yes LFAS MFAS
gm08_159a Yes SILENT LFAS MFAS HFKW HFKW
gm09_138a No LFAS MFAS SILENT LFASDS
gm09_138b Yes LFAS MFAS SILENT LFASDS HFKW HFKW
gm09_156b Yes SILENT LFAS MFAS LFASDS HFKW HFKW
gm10_157b Yes CTRL- CTRL-
gm10_158d Yes CTRL- HFKW CTRL- HFKW
gm13_137a Yes OOS PB MEKW
gm13_149a Yes CTRL+ MEKW
gm13_169a Yes MEKW CTRL+ CTRL-
gm13_169b No MEKW CTRL+ CTRL-
gm14_180a Yes CTRL+ MEKW
gm14_180b No CTRL+ MEKW Table 1: Overview of sound exposure experiments on humpback whales and long-finned pilot
whales. Each tagged individual is identified with an eight-symbol Dtag code: the initials of the
species scientific name (mn: humpback whales, gm: long-finned pilot whales), the last two digits
of the experiment year, the date in the Julian calendar, and the number of the tag deployment
for this day (from a to z). MEKW: playback of mammal-eating killer whale sounds; HFKW:
playback of herring-feeding KW sounds; CTRL-: playback of broadband noise; CTRL+: playback
of artificial frequency-modulated sounds; LFAS: controlled exposure to low frequency active
sonar; MFAS: controlled exposure to medium frequency AS; LFASDS: controlled exposure to

88
LFAS, down sweep pings; SILENT: silent vessel approach; OOS SONAR: out-of-study sonar;
OOS PB: out-of-study playback.

89
3: CHAPTER 1 – BEHAVIOURAL RESPONSES TO THE SOUNDS OF
HETEROSPECIFICS ARE INFLUENCED BY TROPHIC RELATIONSHIPS AND
ECOLOGICAL CONTEXT
(submitted to Animal Behaviour)
Benjamin Benti1,2,3,4, Patrick J.O. Miller2, Martin Biuw5, Charlotte Curé3
1: Doctoral School of Life and Health Sciences, University of Strasbourg, France
2: Sea Mammal Research Unit, University of Saint-Andrews, United-Kingdom
3: Cerema-Ifsttar, UMRAE, Laboratory of Strasbourg, Acoustics Group, France
4: Cognitive and Social Ethology team, UMR 7247-85, CNRS, INRA, IFCE, University of
Tours, France
5: Institute of Marine Research, Tromsø Department, Norway
3.1: Abstract
The reception of acoustic signals not intended for oneself, or eavesdropping, has many
ecological implications, such as the detection of predators, prey, or competitors, which
can be crucial fitness-enhancing information. The marine environment is a particularly
favourable medium for receiving information through acoustic cues. The cosmopolitan
killer whale Orcinus orca has diverged into several morphotypes and ecotypes, which
vary in both prey type and vocal behaviour, making acoustics a potentially reliable
sensory modality for eavesdroppers to discriminate between ecotypes and to respond

90
adaptively. We tested how humpback whales Megaptera novaeangliae in the northeast
Atlantic responded to the sounds of familiar herring-feeding killer whales (HFKW,
which mostly consume herring like humpback whales) during winter, inshore and of
unfamiliar mammal-eating killer whales (MEKW, potential predators) during winter,
inshore and summer, offshore. We used animal-borne tags and surface visual
observations to record responses before, during, and after playback experiments. As
expected, humpback whales clearly approached HFKW sound source, indicating a
dinner-bell effect. Random Forest analysis showed that this consistent response to
HFKW sounds differed from how humpbacks responded to MEKW sounds. MEKW
sounds elicited typical flight responses in most cases with stronger and more consistent
avoidance responses offshore compared to inshore. In summer offshore areas, the
humpback whales were in poorer body condition, in a more exposed environment, and
with less killer whale presence than during winter within the fjords – all factors that
may increase the likelihood of anti-predator responses. Our results indicated that
humpbacks are able to discriminate between killer whale ecotypes based upon their
acoustic characteristics. However, the consistency of their response to a given ecotype
sounds may depend upon the detailed context in which the sounds were heard.
Keywords: humpback whales (Megaptera novaeangliae), killer whales (Orcinus orca),
playback experiment, ecotypes, anti-predator response, dinner-bell effect, ecological
context.

91
3.2: Introduction
In the ocean, the ability to eavesdrop on acoustic cues or displays, that is the detection of
the sounds produced or exchanged between individuals of the same or another species
and not intended to oneself, can affect animals’ fitness (McGregor, 1993). Gathering
information through acoustic eavesdropping is likely to be particularly beneficial within
predator-prey, competition, and cooperation systems. Eavesdropping on species sharing
similar food type may be an indirect way to locate food patches (Noctilio spp. bats:
Übernickel et al., 2013; ant-following birds: Pollock et al., 2017), or to avoid areas of
high-intensity competition (drywood termites Cryptotermes secundus: Evans et al., 2009).
Individuals of prey species may thwart predation attempts if they are able to detect and
identify sounds informing them about predator presence and to adopt appropriate
behaviours to reduce the risk of predation, such as avoidance (gray whales Eschrichtius
robustus: Cummings and Thompson, 1971; passerines: Emmering and Schmidt, 2011),
stealth (tropical dolphins: Rankin et al., 2013), or mobbing (long-finned pilot whales
Globicephala melas: Curé et al., 2012). Individuals from predatory species may in turn
improve their foraging efficiency if they were to reduce sound emissions that could be
used by prey to detect them (killer whales Orcinus orca: Barrett-Lennard et al., 1996).
Another way to reduce predation risk can be the detection and use of alarm calls
released by other species within the prey community (white-bellied copper-striped

92
skinks Emoia cyanura: Fuong et al., 2014; superb fairy-wrens Malurus cyaneus: Magrath et
al., 2015).
In practice, the appropriate behaviour to adopt upon receiving a signal also integrates
contextual information, which encompasses receiver-, sender-, and environment-related
cues. Indeed, a decision may depend on the receiver’s body condition (dwarf
mongooses Helogale parvula: Kern et al., 2017), its prior experience (crayfish Faxonius
spp.: Beattie and Moore, 2018), or the behavioural activity it is engaged in (blue whales
Balaenoptera musculus: Goldbogen et al., 2013). Behavioural responses can also be
influenced by sender-related cues, such as the sender’s species (Canids: Kershenbaum et
al., 2016), size (hamadryas baboons Papio hamadryas: Pfefferle and Fischer, 2006), group
size and composition (elephants Loxodonta africana: Payne et al., 2003), reliability (dwarf
mongooses: Kern et al., 2017; African herbivores: Palmer and Gross, 2018), or current
behaviour (killer whales: Filatova et al., 2013). Moreover, cues related to the receiver’s
environment may also be important in shaping its responses, such as topography
(Gunnison's prairie dogs Cynomis gunnisoni: Perla and Slobodchikoff, 2002; dwarf
mongooses: Kern et al., 2017), or the size and composition of the receiver’s social group
(Tibetan macaques Macaca thibetana: Rowe et al., 2018).
Sound is the primary information medium in the marine environment; light quickly
fades with depth, whereas sounds travel about five times faster than in the air and with
little absorption. Marine mammals rely on sounds for foraging (killer whales: Barrett-

93
Lennard et al., 1996; sperm whales Physeter macrocephalus: Miller et al., 2004), breeding
(humpback whales: Smith et al., 2008; Herman, 2017), and social coordination (killer
whales: Nousek et al., 2006; short-finned pilot whales Globicephala macrorhynchus: Jensen
et al., 2011; sperm whales: Gero et al., 2016; bottlenose dolphins Tursiops truncatus: King
et al., 2018). Their hearing sensitivity allows them to hear outside of the frequency range
of the sounds produced by their own species, enabling them to hear in the frequency
ranges of many other species in their environment, such as potential prey, predators, or
competitor species. This makes marine mammals particularly suitable for the study of
interspecific acoustic eavesdropping. Yet, there have been far fewer studies on acoustic
communication and eavesdropping in marine than in terrestrial systems, likely because
of the intrinsic challenges in monitoring the behaviour of aquatic animals that spend
most of their time underwater. The recent development of animal-borne multi-sensor
tags, which enable the tracking of marine mammals and the recording of their behaviour
(for example, dtags: Johnson and Tyack, 2003), made it possible to conduct such acoustic
studies on wild marine mammals, for instance using playback experiments. Playback
experiments, i.e. broadcasting sound stimuli and monitoring the behavioural responses
of exposed animals, is a classic method to probe into the potential functions of animal
vocalisations or to investigate sound discrimination in particular contexts (reviewed in
Deecke, 2006).

94
Playback of killer whale sounds to wild marine mammals has demonstrated anti-
predator responses in numerous species: avoidance (beluga whales Delphinapterus leucas:
Fish and Vania, 1971; harbour seals Phoca vitulina: Deecke et al., 2002; sperm whales:
Curé et al., 2013; humpback whales: Curé et al., 2015; Risso's dolphins Grampus griseus:
Bowers et al., 2018), and apparent mobbing (pilot whales: Curé et al., 2012; Bowers et al.,
2018; Curé et al., 2019). Killer whales are cosmopolitan apex predators known to prey
upon members of most families of marine mammals (Jefferson et al., 1991). However,
there exist distinct ecotypes and morphotypes of killer whales, which have different
physical features and exhibit different behaviours, including distinct diets and vocal
productions (reviewed in de Bruyn et al., 2013). Thus, killer whale sounds can
potentially convey a wide range of ecological meanings to marine mammal
eavesdroppers.
The plurality of the ecological significance of killer whale sounds to unintended
recipients has been demonstrated in one species of pinnipeds (harbour seals: Deecke et
al., 2002) and one species of toothed whales (long-finned pilot whales: Curé et al., 2019).
Harbour seals avoided the source of transient killer whale sounds (local marine
mammal predators) and unfamiliar fish-eating killer whale sounds, but did not react to
resident killer whale sounds (local fish specialists that do not prey on seals). Long-
finned pilot whales showed more severe anti-predator responses to unfamiliar marine
mammal-eating killer whales sounds than to familiar fish-eating killer whale sounds.

95
Harbour seals and long-finned pilot whales seem to have selectively habituated to the
sounds of familiar, low predation risk killer whales, while maintaining anti-predator
responses to familiar predatory killer whales or unfamiliar killer whales.
Migratory cetaceans such as most baleen whale species cover much larger areas than
other non-migratory marine mammal species, and may therefore encounter more killer
whale ecotypes in a higher diversity of contexts. For instance, humpback whales in the
northern hemisphere spend winter on tropical or subtropical breeding grounds,
summer on high-latitude feeding grounds, and generally migrate annually between
these areas (Clapham and Mead, 1999). We hypothesised that killer whale sounds could
assume a particularly wide breadth of ecological significance for humpback whales, and
that they would show different types or degrees of responses in accordance with the
ecotype of killer whale involved and the overall context of the encounter (location,
season, behavioural activity, etc.).
Here, we report the behavioural responses of humpback whales to playbacks of killer
whale sounds conducted in Norway, with particular focus on whether and how these
responses varied according to the killer whale ecotype and the ecological context within
which the sounds were presented to the humpback whales. In the northeast Atlantic,
humpback whales feed from early summer to early winter around Spitzbergen, Bear
Island, and coastal Norway before migrating to lower latitude areas to breed. We
broadcasted the feeding sounds of two killer whale ecotypes: herring-feeding killer
96
whales from Norway, representing a familiar and low-risk population, and mammal-
eating killer whales from the northeast Pacific, simulating a potential predation threat.
We presented the sounds of mammal-eating killer whales to humpback whales in two
different contexts: inside the fjords in January (in Kaldfjord and Vestfjord) and offshore
in June (off Spitzbergen).
Killer whales in the northeast Atlantic have been shown to produce a wide range of
social and feeding sounds when they feed upon herring Clupea harengus (Simon et al.,
2007; Samarra and Miller, 2015). During winter, humpback whales and herring-feeding
killer whales both exploit the herring stock which overwinters in the Norwegian fjords.
Mixed-species feeding aggregations are commonplace and are most often initiated by
killer whales (Jourdain and Vongraven, 2017). We hypothesised that the feeding sounds
of herring-feeding killer whales could signal the presence of a food patch to
eavesdropping humpback whales. We expected that humpback whales would approach
the source of herring-feeding killer whale sounds and would explore the water layer
around the source through deeper dives and a more tortuous route.
Marine mammal-eating killer whales appear to exert a strong predation on humpback
whales around the world (reviewed in Jefferson et al., 1991; South Pacific: Florez-
Gonzalez et al., 1994; Australia: Naessig and Lanyon, 2004, Pitman et al., 2015; North
Atlantic: McCordic et al., 2014). Marine mammal-eating killer whales from the northeast
Pacific (de Bruyn et al., 2013) prey mostly upon pinnipeds, but occasionally take larger

97
cetaceans and are a known predator of humpback whales (Saulitis et al., 2015). Even if
Norwegian humpback whales are unlikely to be familiar with the northeast Pacific killer
whale population, we expected humpback whales to perceive these unfamiliar marine
mammal-eating killer whales as a threat (Deecke et al., 2002; Curé et al., 2019). We
hypothesised that humpback whales would respond to unfamiliar marine mammal-
eating killer whale sounds by adopting typical anti-predator behaviours. Due to their
large flippers and robust body size, humpback whales appear to be fight strategist (Ford
and Reeves, 2008), which is seemingly confirmed worldwide by observations of
humpback whales approaching and harassing marine mammal-eating killer whales
(reviewed in Pitman et al., 2017). However, no case of harassment of killer whales by
humpback whales has been reported in Norway (Pitman et al., 2017), and playback
experiments showed that humpback whales in Norway strongly avoided northeast
Pacific mammal-eating killer whale sounds (Curé et al., 2015). We thus expected
humpback whales to avoid – horizontally or vertically – the source of mammal-eating
killer whale sounds, or to exhibit stealth behaviours, either deep diving or staying in
shallow waters and reducing the strength of blows.
We predicted that the responses of humpback whales to mammal-eating killer whale
sounds would vary with the specific ecological context in which they were heard. Inside
the fjords during winter, humpback whales have been feeding for the entire season and
are on the verge of starting their southward migration. Within the fjords, humpback

98
whales also regularly hear killer whales of the herring-feeding ecotype in a non-
predatory context, presumably since the superabundance of herring constitutes a much
more profitable and easily accessible food source to killer whales. Offshore during early
summer, humpback whales are in much poorer body condition: they have not fed
during the breeding season and during the roundtrip migrations, and must therefore
replenish their resources. Moreover, the offshore environment may not provide any
cover or possible hiding place compared to the shallower, narrower fjords. During early
summer humpback whales are thus under stronger pressure to feed, but are also more
vulnerable to killer whale attacks. The two contexts of presentation correspond to
different balances along the trade-off between foraging and escaping predation risk, and
we predicted that these conditions could modulate how humpback whales respond to
unfamiliar mammal-eating killer whale sounds.
3.3: Material and methods
3.3.1: Study site and population
In summer 2011 and 2012, we performed N = 8 playback experiments with transient
killer whale sounds on summer feeding grounds off Spitzbergen and Bear Island,
Norway (Table 2). During the last decade, a substantial portion of the humpback whale
population has fed upon herring during winter in the Norwegian fjords, prior to
continuing their migration south. In winter 2016 and 2017, we conducted playback

99
experiments with herring-feeding (N = 6) and mammal-eating (N = 4) killer whale
sounds in the fjords around Vengsøya, Norway (Table 2). The 2011 and 2012 focal
whales were exposed to naval sonar prior to the killer whale playbacks as part of
another research project. The 2011 and 2012 focal whales, as well as mn16_018a and
mn16_024a, were also exposed to a broadband noise control playback (data not shown).
The 2011 and 2012 experiments were used in a previous work to describe the responses
of humpback whales to playback of mammal-eating killer whale sounds (Curé et al.,
2015).
3.3.2: Data collection
We combined data from tag deployments and visual observations of the tagged whale at
the surface to record the behaviour and movements of humpback whales before, during,
and after playbacks of killer whale sounds. During each experiment, one humpback
whale was tagged, then identified as the focal individual (Altmann, 1974). In 2011, 2012,
and 2016, we deployed Dtags (Johnson and Tyack, 2003). Dtags contain a suite of
sensors (250 Hz 3-axis accelerometer, 250 Hz 3-axis magnetometer, 50 Hz pressure
sensor) and two hydrophones (sampling frequency: 96 kHz, sampling width: 12 bits). In
2017, we used ‘mixed-tags’, custom-made tags combining all the sensors of Dtags with a
GPS logger (FastLoc™, SirTrack: Wildlife Tracking Solutions, Havelock North, New
Zealand).

100
Individual ID Study location Ecological context Sound stimulus type Version
mn11_157a Spitzbergen Offshore summer MEKW v1
mn11_160a Spitzbergen Offshore summer MEKW v2
mn11_165e Spitzbergen Offshore summer MEKW v3
mn12_161a Spitzbergen Offshore summer MEKW v1
mn12_164b Spitzbergen Offshore summer MEKW v2
mn12_170a Spitzbergen Offshore summer MEKW v3
mn12_171a Spitzbergen Offshore summer MEKW v1
mn12_180a Spitzbergen Offshore summer MEKW v2
mn16_018a Vengsøya Inshore winter HFKW v2
mn16_020a Vengsøya Inshore winter MEKW v1
Inshore winter HFKW v3
mn16_023a Vengsøya Inshore winter HFKW v3
Inshore winter MEKW v1
mn16_024a Vengsøya Inshore winter HFKW v1
mn17_024a Vengsøya Inshore winter MEKW v2
Inshore winter HFKW v2
mn17_026a Vengsøya Inshore winter HFKW v1
Inshore winter MEKW v3
Table 2: Overview of the collected data showing the focal subject (Individual ID), the study
location, the ecological context (Offshore summer or Inshore winter), and the specifications of
the sound stimulus used (killer whale ecotype and stimulus version). Each focal individual was
given an eight-symbol identifier, which takes the form aaBB_CCCd: aa is the first initials of the
species’ scientific name, BB is the last two digits of the experiment year, CCC is the Julian date of
the experiment, and d is the number of the tag deployment within the day, from a to z. For two
individuals (mn11_160a and mn16_020a), the tag came off prematurely, and the post-exposure
observation phase of the second experiment was not completed. In one case (mn16_018a), we
were not able to retrieve the tag after the experiments, which restricted our data to the visual
tracking information for this individual. MEKW: unfamiliar mammal-eating killer whale;
HFKW: familiar herring-feeding killer whale.

101
We attached all tags to the animals temporarily with suction cups. We deployed tags
with a long pole or a pneumatic launching system (ARTS™, LKARTS, Bodø, Norway).
Humpback whales only showed short-term reactions – flinches and submersions – to
tag deployments. All tags were equipped with a VHF beacon which allowed the visual
tracking of the focal whale and tag recovery after detachment from the whale.
We started the visual tracking of the focal whale immediately after tagging. We
recorded the position (based upon range and bearing from the observation vessel) and
heading of the focal whale when the focal whale was at the surface. We made an
average of one observation every 4.89 +/- 1.86 min (mean +/- standard-deviation; range
2.81 – 11.25 min). We made all visual tracking records in Logger 2010 (courtesy of the
International Fund for Animal Welfare, Yarmouth, Massachusetts, US).
3.3.3: Playback procedure
The stimuli we used for playback experiments were natural sound sequences of feeding
wild killer whales, recorded with Dtags in previous studies. We used two stimulus
types: herring-feeding killer whales (HFKW) recorded in Norway from killer whales
feeding on herring, and marine mammal-eating killer whales (MEKW) recorded in
South-East Alaska. Noisy sound sections, such as flow noise from the whale’s
movements, bubbling, and surfacing noise, were removed from the stimuli. The
resulting files were looped to 15 minutes and amplified to reach an average of 140-155

102
dB re 1 µPa @ 1 m for killer whale calls (similar to natural source levels: Miller, 2006).
We prepared three versions of each stimulus type from different recordings to reduce
pseudoreplication (Table 2). Example spectrograms for herring-feeding and mammal-
eating killer whale sounds are presented in appendix (Figure 7).
We presented mammal-eating killer whale sounds in two different contexts, offshore
during early summer (beginning of the feeding season), and inshore during winter (end
of the feeding season). Herring-feeding killer whale sounds were only presented inshore
during winter. We therefore had three combinations of stimulus type and context of
presentation: mammal-eating killer whale sounds presented offshore (OMEKW:
offshore MEKW) and inshore (IMEKW: inshore MEKW), and herring-feeding killer
whale sounds presented inshore (IHFKW: inshore HFKW). In 2016 and 2017, we
exposed four humpback whales to both herring-feeding and mammal-eating killer
whale sounds (Table 2).
Each playback experiment consisted in three 15-minute-long phases: the pre-exposure
observation period (PRE), the exposure period during which the stimulus was presented
(EXP), and the post-exposure observation period (POST). When we performed two
playbacks to a focal whale, the order was alternated (Table 2). The average duration
between successive experiments was 16 min 37 s, which means that the time between
the start of successive broadcasts was 46 min 37 s in average (range: 29 min 16 s –

103
1 h 6 min 29 s). On two occasions, the tag came off prematurely and the post-exposure
observation phase of the second experiment was incomplete (Table 2).
We used two boats during playback experiments: one was devoted to tracking and
observing the focal whale (the tracking boat), and the second boat was used for sound
playbacks (the playback boat). In 2016 and 2017, we waited on average 1 h 34 min 37 s
+/- 25 min 26 s (range 1 h 9 min 22 s – 2 h 27 min 3 s) from the tag deployment to the first
playback. In 2011 and 2012, the crew performed naval sonar exposure experiments
before the killer whale playbacks (details can be found in Kvadsheim et al., 2015). An
average recovery period of 2 h 3 min 12 s +/- 1 h 10 min 2 s (range 39 min – 3 h 39 min)
separated sonar exposures and playback experiments. The recovery period between the
tag deployment or sonar exposure and the killer whale playback aimed to ensure that
the whales’ behaviour had returned to normal before starting the playback experiment.
The tracking boat continued to track the focal whale consistently irrespective of the
playback experimental phase, and sightings locations of the tagged focal whale were
used to position the playback boat. We aimed to place the sound source ahead of the
whale, on the side of its path, so that either attraction or avoidance reactions could be
clearly identified. The average distance between the focal whale and the sound source at
the onset of the playbacks was 851 +/- 567 m (range 231 – 2915 m).
The playback chain consisted of a player (2011, 2012: M-Audio Micro Track II recorder;
2016, 2017: DR40-Tascam recorder), a resistor, an amplifier (2011, 2012: Cadence Z8000,

104
2016, 2017: Sony XM-N502), and a loudspeaker (2011, 2012: Lubell LL9642T, frequency
range 0.2-20 kHz; 2016, 2017: Lubell LL9162T, frequency range 0.2-20 kHz). The
playback boat got into position before the pre-exposure period ended, turned its engine
off, and lowered the loudspeaker 8 m underwater.
3.3.4: Data treatment and response variables
We computed the dive profile and the horizontal track of the focal whale during the
experiment. We calibrated the tags’ pressure sensor data to compute the dive profiles of
the focal whales. We followed the method described by Wensveen and colleagues (2015)
to construct a horizontal track of the focal whale, which consists of a dead-reckoning
track anchored to visual (and GPS, when available) positions. We had no tag data for
whale mn16_018a (Table 2), so we constructed the horizontal track of this whale with a
linear interpolation between visual surfacing positions and times. We measured nine
response variables to describe the responses of humpback whales to killer whale
sounds: for the horizontal component of the response, we calculated a horizontal
reaction score (HRS), an approach index (AI), and a linearity index (LI); for the vertical
component of the responses, we focused on the maximum dive depth (MDdepth) and
duration (MDdur) reached during each experimental phase. We used maxima for dive
depth and dive duration as they are efficient in detecting outlier response dives.

105
The 𝐻𝑅𝑆𝑡 = 𝐸𝑥𝑡𝑟𝑎𝑝𝑜𝑙𝑎𝑡𝑒𝑑 𝑑𝑖𝑠𝑡𝑎𝑛𝑐𝑒𝑡− 𝑅𝑒𝑎𝑙 𝑑𝑖𝑠𝑡𝑎𝑛𝑐𝑒𝑡
𝐼𝑛𝑖𝑡𝑖𝑎𝑙 𝑑𝑖𝑠𝑡𝑎𝑛𝑐𝑒 measures the difference, relative to the
sound source, between the actual position of each whale and its extrapolated position
based upon its movement patterns during the pre-exposure phase. Extrapolated distancet
is the distance between the extrapolated position of the whale and the sound source at
time t, Real distancet is the distance between the whale and the sound source at time i,
and Initial distance is distance between the whale and the sound source at the onset of
the playback.
To calculate the extrapolated distance, we first converted the latitude and longitude of
the whale to UTM coordinates and then made a linear regression between the whale’s
northing and easting during the pre-exposure phase to get the whale’s global heading.
Next, we projected the positions of the whale at the start and at the end of the pre-
exposure phase on the regression axis to obtain the global distance (and thus the global
speed) travelled along the regression axis during the pre-exposure phase. We used the
global heading and speed of the whale during the pre-exposure phase to extrapolate the
whale’s position if it had kept the same movement patterns as during the pre-exposure
phase. The Extrapolated distance is measured between the extrapolated position of the
whale and the position of the sound source. HRS are positive values if Real distance was
smaller than Extrapolated distance, which means that the whale approached the sound
source relative to its prior movement trajectory, and are negative values if the focal
whale avoided the sound source relative to its prior movement trajectory. We measured

106
HRS at 15 minutes (end of the broadcast) to measure the whale’s response during the
playback and at 30 minutes (end of the post-exposure phase) to quantify whether the
whale’s responses extended after the end of the playback (Figure 4).
The 𝐴𝐼 = 𝐶𝑙𝑜𝑠𝑒𝑠𝑡 𝑑𝑖𝑠𝑡𝑎𝑛𝑐𝑒 𝑡𝑜 𝑠𝑜𝑢𝑛𝑑 𝑠𝑜𝑢𝑟𝑐𝑒
𝐼𝑛𝑖𝑡𝑖𝑎𝑙 𝑑𝑖𝑠𝑡𝑎𝑛𝑐𝑒 𝑡𝑜 𝑠𝑜𝑢𝑛𝑑 𝑠𝑜𝑢𝑟𝑐𝑒 measures the closest approach of the whale to the
sound source during the exposure. AI values fall between 0 and 1, with 0 meaning the
whale came into contact with the source (strong approach) and 1 meaning the initial
distance to the source was also the smallest (immediate avoidance). The AI compliments
the HRS value, as it quantifies the maximum approach observed over the entire
exposure period.
The 𝐿𝐼 = 𝐷𝑖𝑠𝑡𝑎𝑛𝑐𝑒 𝑏𝑒𝑡𝑤𝑒𝑒𝑛 𝑠𝑡𝑎𝑟𝑡 𝑎𝑛𝑑 𝑒𝑛𝑑 𝑜𝑓 𝑒𝑥𝑝𝑒𝑟𝑖𝑚𝑒𝑛𝑡𝑎𝑙 𝑝ℎ𝑎𝑠𝑒
𝑇𝑜𝑡𝑎𝑙 𝑑𝑖𝑠𝑡𝑎𝑛𝑐𝑒 𝑡𝑟𝑎𝑣𝑒𝑙𝑙𝑒𝑑 measures the directedness of the
whale’s course (as in Jahoda et al., 2003; Scheidat et al., 2004; Williams et al., 2006). LI
values range from 1 if the whale travelled in a straight line to 0 if it turned in a circle.
We defined a dive as any duration spent deeper than 5 m (corresponding roughly to the
body height of humpback whales). We measured the dive depth and dive duration from
each dive profile, and used the maximum observed during the exposure period
(MDdepth: maximum dive depth; MDdur: maximum dive duration). We only took into
account dives performed entirely within an experimental phase, in order to avoid that
long and deep dives overlapping experimental phases would drive the values of the
variables.

107
We calculated differences in LI, MDdur, and MDdepth between experimental phases:
between the playback period and the pre-exposure phase to identify the responses of the
whale during the stimulus presentation (noted VARIABLEexp-pre); and between the
post- and pre-exposure phases to determine whether the responses extended after the
end of the broadcast (noted VARIABLEpost-pre).
Figure 4: Horizontal reaction score (HRS) calculation. The HRS measures the difference in the
distance between the whale and the sound source and the distance there would be between the
whale and the sound source if the whale kept the same behaviour as right before the playback.
We used the speed and heading of the whale during the pre-exposure phase to extrapolate its
movement trajectory.

108
3.3.5: Statistical analysis
In order to determine whether humpback whales exhibited ecotype- and context-
dependent reactions to the sounds of killer whales, we tested whether a classifier could
assign the correct experiment type – inshore herring-feeding killer whale sounds
(IHFKW), inshore mammal-eating killer whale sounds (IMEKW), or offshore mammal-
eating killer whale sounds (OMEKW) – to a playback solely from the response variable
data. We used the Random Forest procedure (Breiman, 2001), because it has been shown
to be particularly efficient on small or unbalanced datasets (Gündüz and Fokoué, 2015).
The Random Forest combines the output of multiple tree classifiers, each of which is
trained on roughly two thirds of the data and classifies the last third. Our data set
consisted of six IHFKW experiments, four IMEKW experiments, and eight OMEKW
experiments. We trained each tree on a random subset of four IHFKW, three IMEKW,
and five OMEKW playbacks, to ensure that all training sets contained approximately
two thirds of the playbacks of each type. We filled missing values with the variable
medians for the whale with missing tag data and incomplete experiments (Table 2). In
addition to classification, the Random Forest assesses the importance of each variable in
the decision process, by computing the reduction of classification accuracy resulting
from the random permutation of a given variable values. We centred and scaled all
variables before running the Random Forest in order to avoid size effects in the
classification or the calculation of variable importance (Strobl et al., 2008).

109
The accuracy of the fitted Random Forest depends on two parameters: the higher the
number of trees used (ntree) and the lower the number of variables selected to split each
node during training (mtry), the more accurate the classification. We chose an arbitrarily
large ntree (100,000) because our low sample size made computational costs negligible.
Our selection of mtry was guided by our total number of variables, but reduced
compared to standard formulas (eg: Latinne et al., 2001; Cutler et al., 2007) in order to
increase accuracy (as advised in Breiman, 2001). We ran a first Random Forest (ntree =
100,000; mtry = 3) with all response variables, and a second one (ntree = 100,000; mtry =
1) with only the three most important variables from the first Random Forest, referred to
as key variables. The second Random Forest allowed a graphical representation of the
results in three dimensions, and determined whether a reduced number of key variables
were sufficient for accurate classification.
We used Matlab (Matlab R2017a, the Mathworks Inc., Natick, Massachusetts, US) to
calibrate tag data, compute dive profiles and horizontal tracks, and draw the three
dimension plot. We used R (R Core Team, 2017) to run Random Forests with the
“randomForest” package (Liaw and Wiener, 2002).
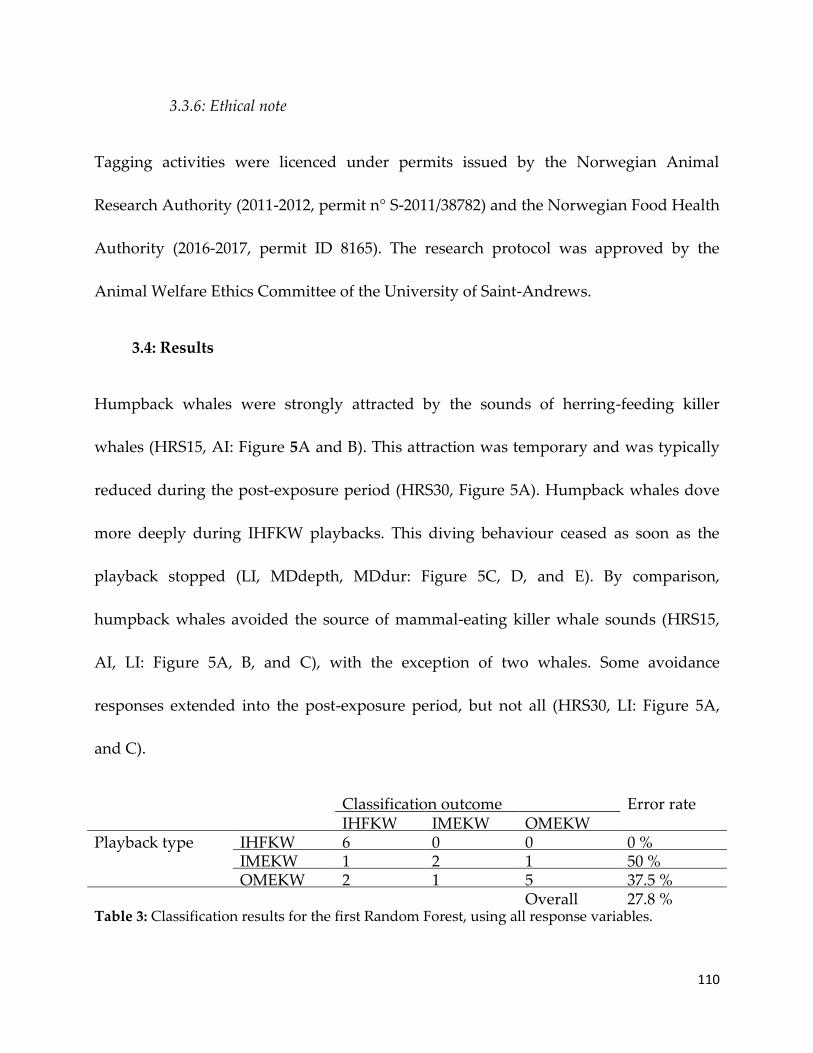
110
3.3.6: Ethical note
Tagging activities were licenced under permits issued by the Norwegian Animal
Research Authority (2011-2012, permit n° S-2011/38782) and the Norwegian Food Health
Authority (2016-2017, permit ID 8165). The research protocol was approved by the
Animal Welfare Ethics Committee of the University of Saint-Andrews.
3.4: Results
Humpback whales were strongly attracted by the sounds of herring-feeding killer
whales (HRS15, AI: Figure 5A and B). This attraction was temporary and was typically
reduced during the post-exposure period (HRS30, Figure 5A). Humpback whales dove
more deeply during IHFKW playbacks. This diving behaviour ceased as soon as the
playback stopped (LI, MDdepth, MDdur: Figure 5C, D, and E). By comparison,
humpback whales avoided the source of mammal-eating killer whale sounds (HRS15,
AI, LI: Figure 5A, B, and C), with the exception of two whales. Some avoidance
responses extended into the post-exposure period, but not all (HRS30, LI: Figure 5A,
and C).
Table 3: Classification results for the first Random Forest, using all response variables.
Classification outcome Error rate IHFKW IMEKW OMEKW Playback type IHFKW 6 0 0 0 %
IMEKW 1 2 1 50 % OMEKW 2 1 5 37.5 %
Overall 27.8 %

111
Figure 5: Behavioural responses of humpback whales to killer whale sounds (IHFKW in green,
IMEKW in light blue, and OMEKW in dark blue) A) Horizontal reaction scores (HRS) at 15 and
30 minutes. The black lines correspond to individual playback sessions B) Approach Index (AI)
C) Linearity Index (LI) D) Maximum dive duration (MDdur) during each experimental phase
for each experiment type E) Maximum dive depth (MDdepth) during each experimental phase
for each experiment type

112
Humpback whales showed strong, consistent avoidance away from the source of
mammal-eating killer whale sounds offshore. However, this avoidance response was
mixed in the inshore setting, with two strong avoidances and two mild approaches
(HRS, AI: Figure 5A and B). Humpback whales showed no change in directedness
during or after OMEKW playbacks, but followed less direct routes during and shortly
after IMEKW playbacks (LI, Figure 5C).
Humpback whales tended to make shallower dives during the OMEKW playbacks
(MDdepthexp-pre, Figure 5E) and to reduce dive duration when the playbacks ended
(MDdurpost-pre, Figure 5D). During IMEKW playbacks, humpback whales dove deeper
and for longer durations. This increase in dive depth and duration continued into the
post exposure period (MDdur, Figure 5D; MDepth, Figure 5E). Numeric values of
response variables for each playback experiment are listed in appendix (Table 5).
The Random Forest using all response variables correctly classified 72.2 % of
experiments overall: 100 % of inshore herring-feeding killer whale playbacks (IHFKW),
50 % of inshore mammal-eating killer whale playbacks (IMEKW), and 62.5 % of offshore
mammal-eating killer whale playbacks (OMEKW) (Table 3). The three most important
variables were (in decreasing order of importance): HRS15, MDdurpost-pre, and
MDdepthpost-pre (Figure 6A). Indeed, HRS15 covered different ranges for each experiment
type: mostly positive for IHFKW experiments, mostly negative for OMEKW
experiments, and variable for IMEKW experiments (Figure 5A). The other important
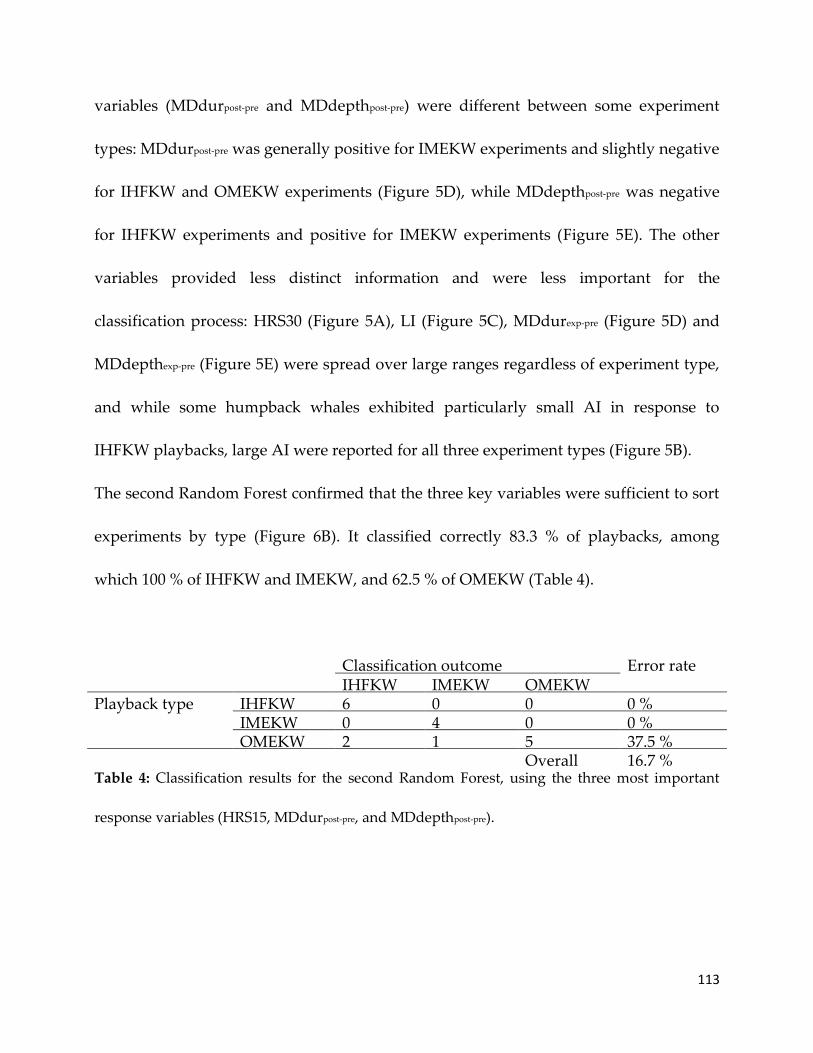
113
variables (MDdurpost-pre and MDdepthpost-pre) were different between some experiment
types: MDdurpost-pre was generally positive for IMEKW experiments and slightly negative
for IHFKW and OMEKW experiments (Figure 5D), while MDdepthpost-pre was negative
for IHFKW experiments and positive for IMEKW experiments (Figure 5E). The other
variables provided less distinct information and were less important for the
classification process: HRS30 (Figure 5A), LI (Figure 5C), MDdurexp-pre (Figure 5D) and
MDdepthexp-pre (Figure 5E) were spread over large ranges regardless of experiment type,
and while some humpback whales exhibited particularly small AI in response to
IHFKW playbacks, large AI were reported for all three experiment types (Figure 5B).
The second Random Forest confirmed that the three key variables were sufficient to sort
experiments by type (Figure 6B). It classified correctly 83.3 % of playbacks, among
which 100 % of IHFKW and IMEKW, and 62.5 % of OMEKW (Table 4).
Classification outcome Error rate IHFKW IMEKW OMEKW
Playback type IHFKW 6 0 0 0 % IMEKW 0 4 0 0 % OMEKW 2 1 5 37.5 %
Overall 16.7 % Table 4: Classification results for the second Random Forest, using the three most important
response variables (HRS15, MDdurpost-pre, and MDdepthpost-pre).

114
Figure 6: Random Forest results A) The importance of each variable in the Random Forest is
computed as the mean decrease in classification accuracy resulting from the random
permutation of this variable. The three most important variables were HRS15, MDdurpost-pre, and
MDdepthpost-pre, with associated decreases in accuracy of 7.2 %, 6.2 % and 2.5 %, respectively B)
Visualisation of the responses to each stimulus in the space of the three most important variables
(IHFKW as green x crosses, IMEKW as light blue circles, OMEKW as dark blue + crosses)

115
3.5: Discussion
Random Forest analyses demonstrated that humpback whales responded differently to
the sounds of two killer whale ecotypes, which means that they were able to
discriminate between these two stimuli. Specifically, humpback whales approached the
source broadcasting the sounds of familiar herring-feeding killer whales and dove
deeper around it, whereas they avoided the source of unfamiliar mammal-eating killer
whale sounds. Moreover, our results showed that the response of humpback whales to
mammal-eating killer whale sounds was influenced by the context of presentation:
humpback whales exhibited strong and consistent horizontal avoidance responses
offshore during summer at the beginning of feeding season whereas avoidance
responses were less clear inshore during winter at the end of the feeding season.
Previous studies showed that harbour seals, a pinniped species commonly preyed upon
by killer whales, and long-finned pilot whales, a toothed whale at a low risk of
predation by killer whales, react differently to the sounds of familiar fish-eating and
familiar and/or unfamiliar mammal-eating killer whales (Deecke et al., 2002; Curé et al.,
2019). Our results confirmed this ability to discriminate between the sounds of killer
whale ecotypes in a baleen whale species particularly vulnerable to predation by killer
whales, the humpback whale (McCordic et al. 2014). We exposed some of the focal
whales to a broadband noise as a control and they barely reacted to it (2011-2012 dataset,
N = 8: see Curé et al., 2015; 2016-2017 dataset, N = 2: data not shown), which indicates

116
that humpback whales responded to killer whale sounds and not to unspecific cues
produced by the playback system.
Humpback whales were consistently attracted towards the source broadcasting herring-
feeding killer whales sounds and initiated deeper diving, likely as exploration
behaviour, upon detecting them. These results are consistent with observations of
mixed-species groups between herring-feeding killer whales and humpback whales in
the study area, where both species feed on herring patches (Jourdain and Vongraven,
2017). We interpreted these responses to herring-feeding killer whale sounds as a
dinner-bell effect; the feeding sounds of a neighbouring species sharing the same food
source as humpback whales may signal the presence of a food patch to eavesdroppers.
In contrast, mammal-eating killer whale sounds generally repelled humpback whales.
Whereas some cetacean species exhibit fight strategies when confronted with a predator,
physically defending themselves or mobbing the attacker, other species adopt flight
responses to avoid detection by predators or to prevent predator encounters (Ford and
Reeves, 2008). Humpback whales clearly avoided the source of mammal-eating killer
whale sounds, which is in line with the typical anti-predator-like responses described in
several other marine mammal species while interacting with killer whales (reviewed in
Jefferson et al., 1991) or while exposed to the playback of mammal-eating killer whale
sounds (Deecke et al., 2002; Curé et al., 2013; Bowers et al., 2018). These results indicate

117
that humpback whales likely perceived mammal-eating killer whale sounds as a
predation threat.
While the responses to herring-feeding killer whale sounds only lasted throughout the
playback, the response to mammal-eating killer whale sounds continued beyond the
end of playback despite the cessation of the sounds.. The sounds produced by mammal-
eating killer whales while consuming a prey may signal the presence of a predator not
actively hunting, as mammal-eating killer whales are mostly silent when hunting until
the attack is launched (Guinet et al., 2000; Deecke et al., 2005; Jourdain et al., 2017). The
cessation of the mammal-eating killer whale sounds at the end of the playback period
could indicate to prey species that nearby predators have started an active hunt, thus
enticing humpback whales to pursue their anti-predator behaviour. Curé and colleagues
(2015) noted that five out of eight humpback whales off Spitzbergen (2011 and 2012
experiments in this dataset) increased their swimming speed during transient killer
whale playbacks, and further increased it when the playbacks ended.
The response of humpback whales to herring-feeding killer whale sounds was more
easily correctly classified (0/12 misclassifications) than the response to mammal-eating
killer whale sounds (8/24 misclassifications overall: 2/8 for IMEKW, 6/12 for OMEKW).
Indeed, the “approach and explore” response to herring-feeding killer whale sounds
was clearly identifiable: it consisted of approaching the sound source and increasing
dive depth and duration likely to explore the environment.

118
Anti-predator response strategies may vary according to various ecological factors:
avoidance may be vertical, horizontal, cryptic, or any combination of the
aforementioned strategies (Ford and Reeves, 2008). Here, we found that responses to
unfamiliar mammal-eating killer whale sounds simulating a potential predation risk
were influenced by the ecological context, which may explain why they were less easily
recognised by Random Forests than responses to herring-feeding killer whale sounds.
Specifically, humpback whales showed strong avoidance responses offshore (as
previously reported by Curé et al., 2015), while only half of the humpback whales
avoided mammal-eating killer whale sounds inshore. In addition, humpback whales
made deeper and longer dives during and after mammal-eating killer whale playbacks
inshore, whereas they made shallower dives during and shorter dives after these
playbacks offshore. The context of presentation not only varied in topography (inshore
and offshore settings), but also corresponded to different functional seasons for the
whales. We performed offshore experiments during early summer, at the beginning of
the feeding season when humpback whales need to replenish their resources after a
breeding season in tropical waters and a roundtrip migration without feeding. We
conducted the inshore experiments during winter, at the end of the feeding season when
the whales were presumably in optimal body condition and about to depart for the
southward migration. Humpback whales may be more vulnerable to killer whale
attacks during summer when they are in poorer condition and in the offshore settings

119
that does not provide any potential refuge to hide from killer whales. These ecological
constraints may explain that responses to mammal-eating killer whale sounds were
stronger and more consistent for the experiments carried out offshore during summer.
An additional possible explanation is that both OMEKW and IMEKW situations
correspond to different balances along the trade-off between foraging and escaping
predation risk which could explain why responses to mammal-eating killer whale
sounds depend on context. During summer, foraging is the main activity of humpback
whales. In this context, avoiding mammal-eating killer whale sounds means evading the
risk of injury or death but losing the benefits of the current behaviour (e.g. foraging),
while not avoiding them implies an increased predation risk but ensures the completion
of the current behaviour. The decision process depends on how vulnerable the
humpback whale is and how beneficial is the current behaviour. Similar trade-offs
between foraging and predation risk have been described in bats (Indiana bats Myotis
sodalis: Arndt et al., 2018) and lizards (broad-headed skinks Eumeces laticeps: Cooper,
2000). In winter, humpback whales reach the end of the feeding season: there is both less
pressure to forage and less risk associated with predator encounters.
Another possibility is that humpback whales could have failed to recognise the sounds
of unfamiliar mammal-eating killer whales as a threat in the inshore setting, due to the
abundance of cohabiting herring-feeding killer whales. Indeed, during winter both
humpback whales and herring-feeding killer whales move into the fjords to feed on

120
herring, resulting in large mixed-species feeding aggregations (Jourdain and Vongraven,
2017). In such conditions, it might be that humpback whales cohabiting with large
numbers of herring-feeding killer whales have a reduced ability to recognise the killer
whale sound playbacks as a threat in the midst of other non-threatening killer whale
sounds.
This work had some limitations. We selected the first whale we could tag as a focal
whale. As a result, the humpback whales we monitored during playback experiments
could have been a biased subset of the population, those more likely to approach the
experimental vessels and therefore easier to tag, or less adverse to perturbations. The
methods we applied in this study required the prolonged presence of the tracking boat.
Humpback whales generally avoid boats (Scheidat et al., 2004), but show variable
responses – no reaction (Frankel and Clark, 2000), approach (Stamation et al., 2009), and
even threaten (Au and Green, 2000) – according to the number of vessels, their speed,
distance, and orientation (Scheidat et al., 2004; Stamation et al., 2009). In this study, the
average distance between the tracking boat and the focal whale was 213.3 +/- 131.4 m
(range 25 – 800 m), which is mostly larger than the 100 m threshold mentioned in several
studies (Scheidat et al., 2004; Stamation et al., 2009): the tracking boat should not have
greatly disturbed the focal whales. In the case of the inshore whales, they may well have
been somewhat desensitized to vessel traffic by the time the study was conducted, at the
end of a long winter feeding period in the presence of large numbers of fishing vessels

121
and other boat traffic. Indeed, whales frequently seek out fishing vessels, presumably
because they associate the acoustic cues of fishing vessels with prey availability. Pods
with calves respond more to the presence of vessels (Stamation et al., 2009), and whales
actively engaged in foraging are less sensitive to them (Scheidat et al., 2004). However,
three focal whales were accompanied by calves and could possibly have been more
disturbed by the boat presence. To ensure the boat presence was not responsible for the
behavioural responses we observed, the tracking boat was present for the whole
duration of the experiment and there could be no additive effect of the boat presence
and the sound stimuli on the focal whale’s behaviour. Finally, the initial distance
between the sound source and the focal whale (851 +/- 567 m, range 231 – 2915 m) is
closer than the likely distance over which humpback whales could have detected killer
whale sounds. The sudden appearance of a nearby source might have influenced the
responses of humpback whales to killer whale sounds.
We describe here the ability of humpback whales to discriminate between the sounds of
unfamiliar killer whales representing potential predator and familiar killer whales
feeding upon the same food source. The behavioural responses exhibited by humpback
whales in response to KW sounds indicate that they are able to associate different
ecological situations to the detected presence of each population of killer whales.
In this study, humpback whales were familiar with herring-feeding killer whale sounds,
but likely unfamiliar with the mammal-eating killer whale sounds used. We cannot

122
establish whether humpback whales identified each ecotype or if they simply
distinguished unfamiliar from familiar killer whales sounds to which they habituated as
non-threatening. In a similar study, Deecke and colleagues concluded that harbour seals
habituated selectively to local, harmless-perceived killer whales (Deecke et al., 2002). We
need to conduct additional experiments using sounds of unfamiliar fish-eating killer
whales to reach such a definitive conclusion. In any case, our results indicate that the
sounds of familiar herring-feeding killer whales and the sounds of unfamiliar mammal-
eating killer whales were associated with different ecological significance for the
humpback whales: the former with the presence of a known sympatric species
consuming similar food which elicited an approach and exploratory response, and the
latter with a potential predation threat which triggered an avoidance response. The
ability to discriminate between familiar and unfamiliar heterospecifics has been
demonstrated in many terrestrial taxa, for instance birds (carrion crows Corvus corone:
Wascher et al., 2012) or primates (African forest monkeys: Candiotti et al., 2013).
Moreover, the ability to associate discrete heterospecific calling behaviours with distinct
ecological significance was also shown to be widespread in terrestrial animals (reptiles:
Fuong et al., 2014; birds: Dawson Pell et al., 2018). Our results on a species of baleen
whale, in association with results from Deecke and colleagues on a species of pinnipeds
(2002) and Curé and colleagues on a species of toothed whales (2019), indicate that the

123
abilities of fine-scale acoustic discrimination of heterospecific acoustic signals are also
widespread among marine mammal taxa.
Our study used full acoustic recording of natural sequences, and hence was not
designed to elucidate which sound features specifically enabled the humpback whales
to discriminate between the two sound types. The major acoustic difference between
herring-feeding and mammal-eating killer whales is that the former rely on echolocation
clicks for foraging and display tail slap sounds as part of the herring-foraging strategy
(Similä and Ugarte, 1993) whereas the latter produce much fewer clicks and no tail slaps.
The presence of tail slaps or multiple echolocation clicks could signal to humpback
whales if they are facing a group of herring-feeding or mammal-eating killer whales. It
might also be that some specific parameters in mammal-eating killer whale sounds
trigger anti-predator responses. Indeed, it was recently shown in other species exposed
to playback of mammal-eating killer whale sounds that the presence of call types
containing non-linear phenomena in the stimuli induced strong anti-predator responses
(Bowers et al., 2018). Moreover, herring-feeding and mammal-eating killer whales also
differ in the characteristics of their calls, such as complexity (number of inflection points:
Deecke et al., 2005) or frequency (Filatova et al., 2015). Some parameters of the calling
behaviour (e.g. call rate, overlapping calls) may be indicators of the size of the killer
whale group, or of the behaviour they are engaged in. Vocalising mammal-eating killer
whales, for instance, are likely to be feeding or socializing at the surface (Deecke et al.,

124
2005). Thus, the level of vocal activity of a killer whale group may be related to the level
of threat they represent to humpback whales (Lima and Dill, 1990). We could investigate
differences across various acoustic parameters between the vocal productions of
different killer whale ecotypes or of killer whales engaged in different activities, and to
test whether these parameters convey the information which might help eavesdroppers,
such as humpback whales, to decide on which behaviour to adopt. Further experiments
are therefore needed to explore the acoustic cues that humpback whales use to
discriminate between the sounds of different killer whale ecotypes, which carry
different ecological significance to eavesdroppers.
3.6: Acknowledgment
This research was funded by the 3S (Sea mammal Sonar Safety) consortium partners: the
United States Office of Naval Research, the Royal Norwegian Navy, the Norwegian
Ministry of Defence, the Defence Research and Development Department of the
Netherlands Ministry of Defence, and the French Ministry of Defence (DGA). We thank
all members of the fieldwork crew for their effort over the years. We are grateful to Dr.
Valerie Dufour for her critical reading of the manuscript.

125
3.7: Appendix
Figure 7: Spectrograms of the killer whale sounds stimuli used for the playback experiments A)
Herring-feeding killer whale sounds (HFKW). Note the presence of echolocation clicks (vertical
lines) B) Mammal-eating killer whale sounds (MEKW) containing much fewer clicks than
HFKW sounds

126
Response variables
Individual
ID
Stimulus
type HRS15 HRS30 AI LIpre LIexp LIpost MDdepthpre MDdepthexp MDdepthpost MDdurpre MDdurexp MDdurpost
mn16_018a IHFKW 1.6 17.1 0.92 0.70 0.71 0.93 N/A N/A N/A N/A N/A N/A
mn16_020a 67.9 N/A 0.14 0.92 0.81 N/A 14.6 26 N/A 95 219 N/A
mn16_023a 133 171 1 0.82 0.39 0.47 16.4 35.6 10.6 170 339 97
mn16_024a 90.6 56.4 0.51 0.83 0.66 0.97 14.6 53.4 8.6 148 170 112
mn17_024a -2.5 -27.6 0.82 0.46 0.36 0.44 8.4 10.4 5.2 35 82 14
mn17_026a 72.1 23.9 0.05 0.98 0.74 0.98 18.8 40 21.2 130 106 119
mn16_020a IMEKW 88.5 126.7 0.66 0.84 0.65 0.71 12.5 7.9 18 56 90 277
mn16_023a 15.1 41.5 1 0.75 0.37 0.55 21.3 86.9 26.5 32 223 262
mn17_024a -208.3 -266.5 1 0.81 0.77 0.81 0 6.6 11.2 0 14 71
mn17_026a -280.7 -461.6 0.95 0.94 0.91 0.96 16.8 31.7 117.1 129 175 222
mn11_157a OMEKW -40.5 -35.1 0.88 0.80 0.76 0.79 56.4 62.8 67 198 294 289
mn11_160a 354.4 550.9 1 0.87 0.14 0.74 114.3 110.5 10.7 547 187 115
mn11_165e -10.1 23.4 0.9 0.95 0.80 0.97 44.9 28.8 54 276 193 129
mn12_161a -218.4 N/A 0.98 0.39 0.93 N/A 16 17.9 N/A 84 295 N/A
mn12_164b -522.7 -1040.9 1 0.61 0.95 0.98 29.9 25 22.6 279 109 94
mn12_170a -101.5 -394.1 0.87 0.17 0.78 0.90 56.5 67 37.5 209 241 220
mn12_171a -88.4 -187.1 0.67 0.79 0.61 0.80 42 20.4 40.1 178 153 191
mn12_180a -132.7 -208.5 0.98 0.84 0.87 0.91 11.6 172.6 21.4 283 524 242
Table 5: Numerical values of the response variables for all playback experiments. The individual identifiers are the same as in Table 2.
IHFKW: inshore (winter) herring-feeding killer whale sounds, IMEKW: inshore (winter) mammal-eating killer whale sounds,
OMEKW: offshore (summer) mammal-eating killer whale sounds

127
4: UNSUPERVISED CLASSIFICATION TO STUDY GRADATION IN ANIMAL
VOCALISATIONS BASED ON FUZZY CLUSTERING AND MEL FREQUENCY
CEPSTRAL COEFFICIENTS
(in prep. for submission to the Journal of the Acoustical Society of America)
Benjamin Benti1,2,3, Patrick J.O. Miller3, Heike Vester4, Florencia Noriega5, and Charlotte
Curé2
1: Cognitive and Social Ethology team, CNRS, INRA, IFCE, Université de Tours,
Strasbourg, France
2: UMRAE Ifsttar-Cerema, Acoustics group, Laboratory of Strasbourg, France
3: Sea Mammal Research Unit, University of Saint Andrews, United-Kingdom
4: Ocean Sounds e.V., Marine Mammal Research and Conservation charity, Germany
5: CODE University of Applied Sciences, Germany
4.1: Abstract
This study presents an unsupervised procedure, based on Mel frequency cepstral
coefficients and fuzzy clustering, for the classification of graded animal vocalizations.
Cepstral coefficients compress information about the distribution of energy along the
frequency spectrum in a reduced number of variables. The Mel scale corresponds to the
perception of pitch by mammalian ears. Fuzzy clustering is a soft classification
approach that accounts for the graded nature of vocalizations. The performance of the

128
procedure is evaluated on a set of long-finned pilot whales (Globicephala melas) calls, and
compared with the results obtained with a catalogue previously defined by audio-
visual inspection of the calls by human experts. The procedure achieves lower
classification precision than the catalogue approach (four fuzzy clusters vs. eight call
types), but provides additional quantitative information about the graded nature of the
vocalizations. Further applications of the procedure are discussed, to broaden its scope
to other species and taxa, and to investigate the functions of call gradation.
Keywords: classification; unsupervised; Mel frequency cepstral coefficients; fuzzy
clustering
4.2: Introduction
The description of vocal repertoires allows the characterization of differences in call
types between species (cryptic species complexes: Braune et al., 2008), groups (regional
dialects: Van Cise et al., 2018), individuals (individual-specific call types: King et al.,
2018), and ecological contexts (functionally referential calls: Cunningham and Magrath,
2017). However, there is no consensus about the methods best suited for the
construction of vocal repertoires, be it the procedure used for classification or the
features used to categorize vocalizations.
Various classification schemes achieve a high degree of precision and accuracy when
species produce stereotyped vocalizations (such as resident killer whales: Ford, 1989).

129
However, the sounds of many species do not form discrete categories, but rather vary
along a continuum, rendering categorization challenging. Graded repertoires appear
particularly common in mammalian species (terrestrial mammals: Garcia et al., 2016;
non-human primates: Mandl et al., 2019; marine mammals: Murray et al., 1998), and are
also found in other taxa (e.g. birds: Suzuki, 2014). This article presents an unsupervised
classification algorithm, based on Mel frequency cepstral coefficients and fuzzy
clustering, specifically designed to deal with graded animal vocalizations.
Historical classification methods rely on the audio-visual inspection of vocalizations by
trained human operators and are still commonly used (e.g. Vester et al., 2017). They
define subjective boundaries between categories based on operator perception, which
makes them difficult to reproduce across studies. Moreover, the inspection process is
time-consuming and therefore not adapted to large datasets. Supervised classification
algorithms can speed up the classification: these algorithms (e.g. support vector
machines: Van Cise et al., 2018) are trained on sorted datasets, and then generalize the
classification rules to new vocalizations. They allow fast and reproducible classification
of animal vocalizations, but still rely on subjective categorization by human operators
and cannot recognize call types which are absent from their training data. Instead,
unsupervised algorithm (e.g. neural networks: Deecke and Janik, 2006) derive
classification rules from the data, which remove both the need for, and limitations from,

130
prior classification. The classification procedure described in this article relies on an
unsupervised algorithm.
The set of parameters used to describe the vocalizations can be another limiting factor
for classification. Some studies select a reduced number of parameters in the time and
frequency domains (e.g. Vergne et al., 2011). The selection targets parameters that are
expected to be important for categorization: they vary with the experimenter, the study
species, and the scope of the research project. The low number of parameters may limit
the detection of subtle or localized differences between vocalizations (Deecke et al.,
1999), which may be crucial in the study of animals’ perception of sounds. On the
contrary, other studies describe animal vocalizations with extensive sets of parameters,
such as fine-scale acoustic features (Brown and Miller, 2007) or image descriptors
(Shamir et al., 2014) extracted from spectrograms. Such large datasets incur high
computational costs, and may require data reduction procedures (such as principal
component analyses: Melendez et al., 2006). Some extensive sets of parameters even
include dimension augmentation steps (e.g. feature learning: Stowell and Plumbley,
2014). The high number of parameters and their eventual transformation obscure the
nature of the differences between classification categories and their perceptual
significance to the study animals. The procedure described in this article relies on Mel
frequency cepstral coefficients (MFCC) to describe vocalizations. MFCC represent an
efficient technique to compress the information about the distribution of energy along

131
the frequency spectrum. They have been widely used in speech segmentation and
recognition, and are increasingly popular to study animal vocalizations (mammals:
Clemins and Johnson, 2006; insects and anurans: Lee et al., 2006). MFCC can be defined
for both harmonic and unvoiced sounds. They tend to be uncorrelated, and therefore
suitable for classification algorithms. In addition, they integrate the logarithmic scale of
pitch perception by mammalian species. Categories defined on the basis of MFCC
differences should thus correspond to perceptual categories by mammalian study
animals.
Most classification procedures attempt ‘hard’ categorization, that is to assign each
vocalization to a single category (Wadewitz et al., 2015). The graded nature of
vocalizations, which translates into an overlap between apparent categories, is
problematic for ‘hard’ classification approaches. It increases the subjectivity and
reduced the reproducibility of audio-visual categorization by human operators.
Classification algorithms, which rely on geometrical rules to assign a call to a given call
type, are also sensitive to gradation. For instance, the classification rules of support
vector machines (see Van Cise et al., 2018) go through the computation of an
hyperplane in the feature space which minimizes the number of misclassifications and
maximizes the separation between categories. When the distribution of categories
overlap, a unique optimal hyperplane may not exist or its overly complicated shape
may not have any acoustical significance. Instead, the procedure presented in this

132
article adopts a ‘soft’ classification approach, using the fuzzy clustering algorithm (as
formulated in Wadewitz et al., 2015). The fuzzy clustering first defines the cluster
centres as apparent stereotypes from the distribution of vocalization features in the
dataset. Then, it quantifies the graded nature of the vocalisations as the positions of
individual vocalisations in between these apparent stereotypes. Each vocalization is
given a membership score to each fuzzy cluster. Membership scores correspond to the
probability that a vocalization belongs to a fuzzy cluster. This algorithm has already
been used successfully to classify primate calls (Wadewitz et al., 2015).
The performance of the fuzzy clustering- and MFCC-based classifier is evaluated on a
set of long-finned pilot whale (Globicephala melas) calls, classified according to the latest
vocal repertoire (based on audio-visual inspection: Vester et al., 2017) for comparison.
Long-finned pilot whales are a delphinid species which lives in cohesive social groups
all year long (Ottensmeyer and Whitehead, 2003) and present a high vocal activity in
almost all behavioural contexts (Popov et al., 2017; Visser et al., 2017). Pilot whales
produce a large variety of sounds: they produce of mix of tonal, broadband, and pulsed
sounds, as well as intermediate forms containing portions of different acoustic nature or
transitions from one sound type to another (Sayigh et al., 2013; Vester et al., 2017).
Long-finned pilot whale calls can also be bi-phonated i.e. contain two independently
modulated tonal components (Vester et al., 2017). A portion of their vocal repertoire
consists of stereotyped tonal and pulsed call types. Audio-visual inspection of

133
recordings described 173 call types in short-finned pilot whales (Sayigh et al., 2013) and
125 call types (with 29 further subtypes) in long-finned pilot whales (Vester et al., 2017).
However, some long-finned pilot whale calls have no tonal component, and there is
apparent gradation within and between call types(Nemiroff and Whitehead, 2009;
Zwamborn and Whitehead, 2017b), which renders classification challenging.
4.3: Material and methods
4.3.1: Test dataset
We tested the fuzzy clustering- and MFCC-based classifier on a sample of long-finned
pilot whale calls recorded from an hydrophone lowered from a small research vessel
(details in Vester et al., 2017). The sounds used in this study have been recorded in
northern Norway in summer 2003. The dataset contains 279 high quality calls, as
evaluated by the visual inspection of spectrograms by trained operators. The long-
finned pilot whale calls were sample at, or downsampled to, 48,000 kHz, and bandpass-
filtered between 1000 and 22,000 Hz (4th order Butterworth filter). The samples in the
dataset have already been classified according to an audio-visual inspection-based
catalogue (Vester et al., 2017). They correspond to a small portion of the long-finned
pilot whale vocal repertoire and were assigned to eight call types (and three subtypes)
with at least ten samples of each call type in the dataset (Figure 8).

134
Figure 8: Example spectrograms of the eight catalogue call types present in the test dataset from
the most abundant one (top left) to the least represented one (bottom right). The label in the top
left of each spectrogram contains the custom name the call types are referred to as. Call types
126, 126i, and 126ii are subtypes of the same call. The distribution of call types and subtypes in
the dataset is as follows: 129: n=76; 126i: n=46; 130: n=31; 126: n=24; 126ii: n= 24; 127: n=23; 131iii:
n=16; 93ii: n=14; 128i: n=13; 133: n=12
4.3.2: Acoustic parameter extraction
We calculated Mel frequency cepstral coefficients (MFCC) to describe the calls (Figure
9). We created a bank of overlapping Mel-scaled triangular filters. We constructed 42
points between 1000 and 22,000 Hz, linearly spaced on the Mel scale, by using the Hz to
Mel conversion equation: 𝑚𝑒𝑙 = 2595 𝑥 𝑙𝑜𝑔(1 + 𝑓
700⁄ ), where mel is the frequency in
Mels and f is the frequency in Hz. We designed 40 overlapping triangular filter which
135
lower bound, centre frequency, and upper bound a succession of three of the previously
constructed points. All filters shared the same maximum value at their centre frequency.
We separated the calls into 1024 point segments with 50% overlap. We performed a
Fourier transform on each of these segments to measure the distribution of energy
along the frequency spectrum within the segments, and calculated the log of this energy.
We summed the log energy of each call segment through the 40 Mel filters, and
performed a one-dimension discrete cosine transform on the 40 Mel filter log energies to
obtain 40 MFCC. We discarded the first MFCC, which corresponds to the average level
of the call, and high-order ones, as they correspond to rapid changes in the energy
distribution along the spectrum. To summarize the MFCC, we divided each call into
equal time slices, and measured the mean and variance of each MFCC over these slices.
We retained the average MFCC values for each slice, and calculated the square root of
the summed variance measures as a single variability measure. Animals do not appear
to be sensitive to slight variations of signal duration (Deecke and Janik, 2006); this
dataset describes variation of energy distribution along the course of a call, irrelative of
its total duration.
To investigate the trade-off between descriptive power and using a low number of
acoustic features, we built nine different sets of parameters by keeping five, seven, or
ten MFCC values summarized over five, seven, or ten time slices. This was motivated
by the sensitivity of fuzzy clustering to high dimensionality (Winkler et al., 2011).

136
Indeed, in high dimensional spaces, fuzzy clustering tends to assign all samples to a
single cluster, whose centre corresponds to the centre of gravity of the dataset.
We used the Python package “pylotwhale” (Vargas Noriega Romero, 2018) to extract
the MFCC from the long-finned pilot whale calls.
Figure 9: Successive steps for the calculation of Mel frequency cepstral coefficients-derived
acoustic parameters.
4.3.3: Classification procedure
The fuzzy clustering defines the centres of fuzzy clusters based on the distribution of
vocalizations features in the datasets. Then, it assigns each call a membership score
between 0 and 1 to each cluster. Membership score correspond to the probability that a
call belongs to a fuzzy cluster. The sum of all membership scores for a given call is

137
equal to one. Fuzzy clusters correspond to apparent stereotypes in the dataset, and
membership scores quantify the gradation of calls between these apparent stereotypes.
We used the fuzzy c-means algorithm (as presented in Wadewitz et al., 2015), which is
driven by two parameters: the fuzziness value µ and the number of initial clusters k.
The fuzziness quantifies to what extent clusters are allowed to overlap. A fuzziness of 1
corresponds to no overlap between clusters and is equivalent to ‘hard’ clustering. The
higher the fuzziness value, the more overlap there can be between clusters. For a given
(µ, k) pair, the fuzzy c-means algorithm uses the following steps:
i) Initialize k random cluster centroids. We drew the centroid coordinates from
uniform distributions over the feature ranges in the dataset.
ii) Iteratively calculate membership scores from the distance between data
points and cluster centroids in the feature space and fuzziness (1), and update
the positions of cluster centroid based on membership scores, data points,
and fuzziness (2) until the convergence of an objective function, namely the
sum of the squared distances between data points and cluster centroids
weighted by membership scores and fuzziness (3). This objective function is
also a measure of the compactness of the fuzzy clusters, and we used it as a
measure of the quality of the clustering.

138
iii) After convergence of the objective function, fuse together close centroids. The
threshold under which we fused centroids was the sum of 1% of the range of
each feature in the dataset.
1
𝑚𝑖,𝑎= ∑ (
𝑑𝑖,𝑎
𝑑𝑖,𝑐)
2µ−1⁄
𝑘𝑐=1 (1)
𝑐𝑎 =∑ (𝑚𝑖,𝑎)
µ𝑥 𝑓𝑖
𝑛 𝑐𝑎𝑙𝑙𝑠𝑖=1
∑ (𝑚𝑖,𝑎)µ𝑛 𝑐𝑎𝑙𝑙𝑠
𝑖=1
(2)
𝐹 = ∑ ∑ (𝑚𝑖,𝑐)µ
𝑥𝑑𝑖,𝑐2𝑘
𝑐=1𝑛 𝑐𝑎𝑙𝑙𝑠𝑖=1 (3)
With:
- mi,a the membership score of call i to cluster a
- k the number of clusters
- di,c the euclidian distance between call a and cluster centroid c
- µ the fuzziness value
- ca the coordinates of centroid a in the feature set space
- fi the coordinates of call i in the feature set space
- F the value of the objective function
Fuzzy c-means can be sensitive to local minima of the objective function. Therefore, we
performed 100 realizations of the algorithm and kept the one with the lowest final value
of the objective function.

139
The full classification procedure started with the selection of the maximal number of
clusters allowed kmax and the initial value of fuzziness µstart. kmax should be slightly
larger than the number of expected clusters in the dataset, so as not to be a limiting
factor for classification and not to incur additional computational costs. We chose 15, as
there were ten catalogue call categories (types and subtypes) in the dataset. µstart should
be so that the fuzzy c-means results in a single fuzzy cluster, but not too high. We set
µstart = 2 after initial tests. We then ran the fuzzy c-means algorithm for µ = µstart and k =
1, …, kmax and kept the best clustering solution (the one with the lowest objective
function). We then decremented µ and started again, until µ = 1.01. We used steps of
0.05 between µ = 2 and µ = 1.3, and steps of 0.01 between µ = 1.3 and µ = 1.01.
4.3.4: Fuzzy clustering analyses
The first step in the analysis of fuzzy clusters is the identification of stable clustering
solutions. For the highest values of fuzziness, the algorithm results in a single fuzzy
cluster. As the fuzziness decreases, clusters start to crystallize as the overlap allowed
between them diminishes. Stable clustering solutions, which are optimal over large
intervals of fuzziness, should represent prominent structures in the dataset. We plotted
the optimal number of clusters according to fuzziness (Figure 10) and visually
identified the stable clustering solutions, taking into account both the number of

140
fuzziness values for which a solution was optimal as well as the presence of successive
values of fuzziness for which the same solution was the best.
We then aimed to characterize the fuzzy clusters defined by the stable clustering
solutions. We reconstructed the ‘stereotypical call’ for each fuzzy cluster, i.e. the call
corresponding to each cluster centroid. We computed the Mel filter energies of the calls,
as during the first steps of the MFCC calculation procedure, and averaged them over
the same time slices as the MFCC (resulting in 10x40 matrices of Mel filter log energy
averages: MFLE matrices). The ‘stereotypical calls’ were built as the element-wise
average of the MFLE matrices, weighted by the membership scores to each cluster (a
similar reconstruction method can be found in Clemins and Johnson, 2006).
The reconstruction of stereotypical calls only characterizes the centroids of the fuzzy
clusters, but gives no indication as to where individual calls lie between these clusters.
We measured the typicality of calls to visualize the gradation between fuzzy clusters, in
order to develop a more complete view of the results. The typicality of a call is the
difference between its two highest membership scores.
4.3.5: Comparison of the fuzzy clustering with the catalogue-based classification
In order to compare the fuzzy clusters with the call types defined in the catalogue, we
constructed correspondence tables by sorting each call according to its catalogue call
type and main fuzzy cluster (cluster with the highest membership score). We only took

141
into account calls with a typicality higher than 2/3 (ensuring that they were at least
twice closer to their main cluster than to other ones).
Correspondence tables only consider the most likely cluster, and thus do not take into
account the gradation between fuzzy clusters. In order to visualize the distribution of
catalogue call types around fuzzy cluster centroids, we performed a principal
component analysis on the MFCC parameters. We then plotted, along the first two
principal components, the calls coloured by catalogue call type, and the centroids of the
fuzzy clusters.
We developed a Python package “fuzzyClustering” to run the fuzzy c-means and
analyse the clustering results. Module “fcmeansAlgo” runs the fuzzy c-means
classification and measures typicality, and module “visualTools” produces all the
figures. We used the modules “preprocessing” and “decomposition” of Python package
“sickit-learn” (Pedregosa et al., 2011) to scale the datasets and compute the principal
components analyses.
4.4: Results
4.4.1: Identification of stable clusters
Stable clustering solutions with up to four fuzzy clusters were present for all feature
sets, from the least descriptive one (five MFCC over five time slices) to the most precise
one (ten MFCC over ten time slices). A five cluster solution appeared for two feature

142
sets. For the three feature sets with the highest temporal resolution (ten time windows),
there was a six cluster solution (Figure 10).
Figure 10: Optimal number of clusters relative to fuzziness for all nine sets of features. Stable
four cluster solutions are highlighted by brown circles, five cluster solutions by purple circles,
and six cluster solutions by green circles.
We selected both extrema of the four cluster solutions: the solution obtained with five
MFCC over five time slices, to see how much we could extract from the smallest feature
set; and the ten MFCC over ten time slices solution, because it was particularly stable.
For ease of reading, we refer below to the four cluster solution obtained with the five

143
MFCC over five slices as the “5-5” solution, and to the four cluster solutions obtained
with the ten MFCC over ten slices the “10-10” one.
4.4.2: Reconstruction of stereotypical calls
The reconstructed stereotypical calls shared similar structures across the different
clustering solutions (Figure 11). We described stereotypical calls by the presence or
absence, and characteristics of three recurring motifs: the initial rise motif (IR), the
plateau-like motif (PL), and the high-frequency motif (HF). The IR corresponded to a
steep rise in frequency at the beginning of the call. It contained most energy between
the 15th and the 20th Mel filter (approximately the 5-7 kHz band), and usually covered
the third to fifth time slices of the stereotypical calls. IR were most visible for the third
cluster of the presented realisations of the 5-5 solution (Figure 11A and B), and the first
cluster of the presented realisations of the 10-10 solution (Figure 11C and D). The PL
was a long level or slightly U-shaped motif which covered the fourth to eight time slices
of the stereotypical calls. It contained most energy between the 20th and 25th Mel filter
(approximately the 7-9 kHz band). The second and fourth cluster of the 5-5 solution
examples contained marked PL (Figure 11A and B). The second cluster of the first 10-10
example consisted in a single PL (Figure 11C). The HF contained most energy right
below the 30th Mel filter (around 11 kHz), and extended from the 5th to the 8th time
slice of the stereotypical calls. The first cluster of the 10-10 solution examples contained

144
marked HF (Figure 11C and D). The 10-10 solutions sometimes provided less structured
stereotypical calls for one cluster (Figure 11D, second cluster).
Figure 11: Reconstructed stereotypical calls for two realizations of the 5-5 clustering solution (A
and B) and two solutions of the 10-10 clustering solution (C and D). The x-axis corresponds to
the 10 time slices used for MFCC summarization. The y-axis corresponds to filters of the Mel
filter bank A) 5-5 solution, µ = 1.23 B) 5-5 solution, µ = 1.27 C) 10-10 solution, µ = 1.17 D) 10-10
solution, µ =1.25

145
4.4.3: Typicality analysis
We recorded high values of typicality, indicating that some calls mostly fell into discrete
categories. The distribution of typicality values was skewed toward high values for the
5-5 solution (Figure 12A and B), whereas the 10th decile (0.9-1.0) contained most calls
for the 10-10 solution (Figure 12C and D). The skew towards high values of typicality
was more marked for lower values of fuzziness (compare Figure 12A and B with Figure
12C and D).
In the 5-5 solution, we observed two kinds of distribution patterns: the typicality of
some clusters was evenly distributed along the entire range (Figure 12A: blue and
orange clusters; Figure 12B: red cluster); while some clusters contained mostly calls
with a very high typicality (Figure 12A: green cluster; Figure 12B: blue cluster). For the
10-10 solution and some of the realisations of the 5-5 solution, clusters with high
typicality corresponded to clusters which contained all motifs: IR, PL, and HF (Figure
11A, B, and C and Figure 12A, B, and C). A third kind of distribution appeared in the
10-10 solution: clusters with a low number of associated calls (Figure 12D: green). These
low count clusters corresponded to the unstructured clusters of the 10-10 solution
(Figure 12D: green cluster corresponds to Figure 11D: second cluster).

146
Figure 12: Typicality values coloured by main fuzzy cluster for two realizations of the 5-5
clustering solution and two realisations of the 10-10 clustering solution. The clustering solutions
presented in this figure are the same as in Figure 11. The bottom-up colour order (blue, green,
red, and orange) corresponds to the left-to-right order in Figure 4 A) 5-5 solution, µ = 1.23 B) 5-5
solution, µ = 1.27 C) 10-10 solution, µ = 1.17 D) 10-10 solution, µ = 1.25

147
4.4.4: Gradation between fuzzy clusters
It appeared that some clusters overlapped, some did not, and others overlapped several
clusters which did not overlap each other. All pairs of clusters in the 5-5 solution
overlapped to some extent, with the exception of the clusters 1 and 2 (Figure 13A). The
gradation seemed to involve multiple clusters at once in most cases, as the points were
mostly placed in the middle of the graphs (Figure 13A). Gradation between cluster 0
and 1 is more representative of gradation within a pair of clusters. In the 10-10 solution,
cluster 0 overlapped cluster 2, and cluster 2 overlapped clusters 3, while there was no
overlap between clusters 0 and 3 (Figure 13B). The overlaps in the 10-10 solution were
almost exclusively within pairs of clusters, as many points were located along the
diagonal of the triangular plots (Figure 13B).
Comparing the gradation between clusters (Figure 13) with the reconstruction of cluster
stereotypical calls (Figure 11), it appeared that only clusters that shared structural
similarities overlapped each other. In the 5-5 solutions, only cluster 1 and 2 did not
overlap (Figure 13A): cluster 2 contained a PL and a HF, and cluster 2 contained an IF
and a HF (Figure 11A). In the 10-10 solution, cluster 2 overlapped clusters 0 and 3,
which did not overlap each other (Figure 13B). Cluster 0 was a complete call with IR, PL,
and HF (Figure 11C). It shared a PL and faint IR and HF with cluster 2, but only shared
a PL with cluster 3 (Figure 11C). Clusters 2 and 3 were both centred on a marked PL
(Figure 11C).

148
Figure 13: Gradation between fuzzy clusters for example realisations of the 5-5 and 10-10
clustering solutions. Each point corresponds to an individual call. Points along the diagonal of
the plot correspond to calls that are graded exclusively between the two clusters represented by
the axes. Points in the middle of the graph represent calls that are graded between multiple call
types A) 5-5 solution, µ = 1.23. There was overlap between all pairs of clusters with the
exception of cluster 1 and 2 B) 10-10 solution, µ = 1.25. There was clear gradation between
cluster 0 and cluster 2, and between cluster 2 and cluster 3, but not between cluster 0 and 3
There was much more overlap between cluster in the 5-5 solution than in the 10-10 one.
Moreover, the overlaps in the 5-5 solution mostly involved several clusters, while the
overlaps in the 10-10 solution were typical of exclusively pairwise overlaps.

149
4.4.5: Correspondence between catalogue call types and fuzzy clusters
We obtained four fuzzy clusters, compared to eight catalogue call types (ten including
subtypes). We did not replicate the results of the audio-visual inspection of recordings
by human operators. Indeed, fuzzy clusters did not correspond to catalogued call types
or sets thereof. Rather, calls from a given call type were mostly distributed over several
fuzzy clusters (Figure 14A and B). This was consistent with large overlaps between the
distribution of call types in the dataset (Figure 14C and D).
Some call types were associated within fuzzy clusters: their distribution across fuzzy
clusters was consistent. In the 5-5 solutions, there were three prominent call type
associations within clusters. Call types 126ii, 127, and 131iii; call types 126i, 130, and
133; and call types 128i, 129, 130, and 133 tended to be associated within fuzzy clusters
(Figure 14A). In the 10-10 solution, the main associations of call types within cluster
were call types 126, 127, 131iii, and 133; call types 093ii, 126i, 128i, 129, and 130; and call
types 126ii, 128i, and 129 (Figure 14B). When comparing these associations, it appeared
that call types 127 and 131iii, as well as call types 128i, 129, and 130, tended to be
clustered together in both fuzzy clustering solutions. The distribution of call types 127
and 131iii was highly similar (Figure 14C and D). Call types 129 and 130 had the largest
spreads in the dataset, and the distribution of call types 128i, 129, and 130 largely
overlapped (Figure 14C and D). It was worth noting that, despite a smaller number of

150
fuzzy clusters than catalogued call types, the three call subtypes (126, 126i, and 126ii)
were not clustered together (Figure 14A and B).
The centroids of the fuzzy clusters were not distributed around a discrete number of
positions (Figure 14C and D). Such modes in their distributions would have
corresponded to stereotyped call types, between which the calls would have been
graded. Instead, the positions of the fuzzy cluster centroids followed a curve from
position (-2,-2) to position (4,0) in the 5-5 solution (Figure 14C) and between positions
(-2.5,2.5) and (12.5,-2.5) in the 10-10 solution (Figure 14D). This distribution
corresponded to a gradation following a directed continuum, without stereotypes.
The spread of the call type distributions was larger in the 5-5 solution than in the 10-10
solution (Figure 14C and D), which was consistent with the precision of both sets of
acoustic features.

151
Figure 14: Comparison between fuzzy clusters and catalogue call types A and B)
Correspondence tables between fuzzy clusters and catalogue call types. The numbers in the
table corresponds to the number of times a call belonging to a given call type (column) had a
given fuzzy cluster (row) as its main cluster A) 5-5 solution, µ = 1.23 (top), µ = 1.27 (bottom) B)
10-10 solution: µ = 1.17, µ = 1.25 C and D) Principal component analyses for the visualization of

152
the catalogue call type distribution in the MFCC feature space. Calls are coloured by catalogue
call types. Black + crosses represent the position fuzzy cluster centroids C) 5-5 solution. The two
components explained 40 % of the dataset variance D) 10-10 solution. The 2 components
explained 30 % of the dataset variance
4.5: Discussion
We presented a method for the classification of graded animal vocalizations. The
unsupervised algorithm we proposed relies on Mel frequency cepstral coefficients for
call description and on fuzzy clustering for call categorization. The algorithm defined
four fuzzy clusters in a set of 279 high quality calls of long-finned pilot whales, and
provides tools for the quantification and the visualization of the gradation between
clusters.
On the same dataset, a human expert was able to recognize eight call types (and three
additional subtypes). Thus, our procedure did not achieve the same categorization
precision as a human agent, nor did it replicate the findings of audio-visual inspection-
based classification. However, some catalogue call types were associated within the
fuzzy clusters, which indicated that a certain underlying structure in the dataset was
consistently captured by both approaches. For instance, call types 127 and 131iii, which
had similar frequency-modulation patterns and bandwidth, but different duration,
were clustered together. Vester and colleagues (2017) defined five broad categories of
calls using a ‘hard’ clustering approach on a set of long-finned pilot whales twice as

153
large as the one used in the dataset (541 vs. 279 samples). Theirs categories
corresponded to two groups of low-pitched calls, two groups of high-pitched calls, and
one group of noisy calls. Our fuzzy clustering approach defined a similar number of
clusters. However, differences between clusters corresponded to the presence or
absence of three call-scale patterns of energy distribution (IR, PL, and HF). Therefore,
they differed from the broad categories defined by Vester and colleagues (Vester et al.,
2017). In the only other use of fuzzy clustering for animal vocalizations to our
knowledge (Wadewitz et al., 2015), the study defined five clusters for primate calls.
The algorithm described in this article was fully unsupervised and saved time
compared to manual classification schemes. The fuzzy clustering procedure runs in a
few days, while the audio-visual inspection of calls could take several months. The
dataset we used still involved human operators to extract the sounds from the
recordings. Another step to accelerate the processing of animal calls would be to use
automated call extraction algorithms (as in Leroy et al., 2018; Zhang et al., 2018).
Another limitation of our procedure was related to the objective function of the fuzzy c-
means algorithm: the current objective function is only a measure of cluster
compactness, i.e. how close individual calls are from cluster centroids, and does not
take into account cluster separation, i.e. the distance between fuzzy cluster centroids.
Rawadesh and Ralescu (2012) proposed an adaptation of the silhouette measure of
clustering validity to fuzzy clustering: the generalized intra-inter silhouette. While

154
having the advantage of measuring both cluster compactness and cluster separation in a
fuzzy framework, the generalized intra-inter silhouette is computationally highly
expensive, and we could not include it in our procedure.
The distribution of the fuzzy cluster centroids was skewed toward call type 129 – the
most represented and variable call type in the dataset – and away from call types 126,
although the region around call type 129 contained sparse calls whereas the area
around call 126 was much denser. As the fuzzy clustering algorithm attempted to
minimize the sum of the distances between individual calls and fuzzy cluster centroids,
it may be that particularly variable calls (here, call type 129 and 130) attracted fuzzy
cluster centroids. An update of the objective function of the algorithm to include cluster
separation may solve this issue. In any case, the framework we worked on was
designed to be fully unsupervised and intended to be used on raw datasets, with no
control on the contents of the datasets and no manual classification to guide it. Our
method managed to define stable and consistent clusters in an unbalanced dataset,
which made us confident in its ability to tackle raw datasets in the future. The fact that
the fuzzy clustering algorithm discovered similar clusters independently from the
feature set we used may be evidence that the revealed structure was prominent in the
dataset.
In this article, we used sets of parameters derived from Mel frequency cepstral
coefficients to sort long-finned pilot whale vocalizations. Cepstral coefficients represent

155
an efficient method to compress information on the distribution of energy along the
frequency spectrum. As such, they contain more information than sets of hand-picked
call-scale parameters (e.g. Vergne et al., 2011) or frequency contours of fundamental
frequency or pulse repetition rate (e.g. Deecke and Janik, 2006) commonly used in other
studies. In addition, the Mel scale corresponds to the perception of pitch by mammalian
ears. It was adapted to the study species, the long-finned pilot whales, which have a
typical mammalian audiogram (Pacini et al., 2010). Some studies used species-specific
frequency weighting functions (e.g. Clemins and Johnson, 2006). It could be possible to
use knowledge about a species audiogram to adapt the feature set for vocalization
description: varying the centre frequency and bandwidth of the filters to render the
perception of frequency by the species, and the maximal value of the filters to represent
its auditory sensitivity.
The procedure we developed aims specifically to describe the graded vocal repertoire of
certain species. It can still be used on stereotyped vocalizations, as they are but a
particular example of graded repertoires from a mathematical point of view. However,
the principal advantages of our procedures are the tools it provides to quantify and
visualise the gradation within and between vocalisation categories. Indeed, the
description of vocal repertoires permits the investigation of certain aspects of vocal
communication in animals. Beyond the definition of valid call types for graded vocal
production, the graded nature of vocalizations can be functional and informative in

156
itself. Graded variation within a call type may carry information about the context of
call production or the state of the signaller. For instance, juvenile black caimans use
graded variations of the same calls either to attract their mothers when under attack or
to reunite with their siblings when they get isolated (Vergne et al., 2011). Graded
vocalisations indicate the intensity of an aggressive display in great Himalayan spear-
nosed bats (Sun et al., 2018). The gradation quantification and visualisation methods we
presented can be used to investigate variations in the graded nature of vocalisations
between behavioural or ecological contexts.
4.6: Conclusions
This article presents an unsupervised procedure for the classification of graded animal
vocalizations. The procedure describes vocalisations with a set of MFCC-derived
parameters, and classifies them with an implementation of the fuzzy c-means algorithm.
We tested the performance of our method with a set of long-finned pilot whale calls and
compared our results with those obtained with a previously defined call catalogue
based on audio-visual inspection of recordings by trained operators. The algorithm
defined four clusters, compared to eight call types (ten, including subtypes) with the
catalogue approach. The time resolution of the call catalogue, sub-units with consistent
frequency-modulation patterns, was more precise than the time resolution of the fuzzy
clustering, equal time slices. Our approach defined apparent stereotypes based on the

157
presence or absence of call-scale motifs of energy distribution. The call types described
by the catalogue were based on associations of sub-units. It would be interesting to
adopt the fuzzy clustering approach at the sub-unit level and include it in the definition
of call types. Sub-units are more consistent in the time and frequency domains than
entire calls, but show slight variations of duration and frequency content (H. Vester,
pers. comm.). The manual classification of calls includes the subjective categorisation of
variable sub-units. The fuzzy clustering approach has the potential to quantify and
objectify this decision-making process.

158
5: CHAPTER 3 – VOCAL RESPONSES OF LONG-FINNED PILOT WHALES
(GLOBICEPHALA MELAS) TO NAVAL SONARS AND PLAYBACKS OF KILLER WHALE
(ORCINUS ORCA) SOUNDS
(in prep.)
Benjamin Benti1,2,3, Patrick J.O. Miller2, and Valérie Dufour1, and Charlotte Curé3
1: Cognitive and Social Ethology team, CNRS, INRA, IFCE, Université de Tours,
Strasbourg, France
2: Sea Mammal Research Unit, University of Saint Andrews, United-Kingdom
3: UMRAE Ifsttar-Cerema, Acoustics group, Laboratory of Strasbourg, France
5.1: Abstract
Naval sonar is one of the most intense anthropogenic sound sources in the marine
environment. Over the past decades, there has been growing concerns about its impacts
on marine ecosystems, and on cetaceans in particular. Cetaceans incur risks of direct
physical damage, of disturbance of activities, and of masking of acoustic
communication and echolocation signals associated with naval sonar use. In this study,
we combined animal-borne multi-sensor tags and visual observations from a research
vessel to monitor the vocal behaviour of free-ranging long-finned pilot whales during
controlled exposure experiments to naval sonar. We also performed playbacks of
marine mammal-eating killer whale sounds to pilot whales, in order to interpret the

159
biological significance of their responses to naval sonar according to the risk
disturbance hypothesis. Long-finned pilot whales have a large vocal repertoire which
contains a mix of tonal, pulsed, and broadband sounds, and which includes both
stereotyped and graded vocalisations. We used a previously developed procedure
designed to describe graded vocal repertoire in a quantitative way to identify vocal
responses of long-finned pilot whales to naval sonar and killer whale playbacks. We
analysed the vocal activity, call type usage, and call typicality (i.e. stereotyped or
graded nature) of long-finned pilot whales. We noted changes in vocal behaviour in
response to naval sonar exposures, killer whale playbacks, and control experiments. We
did not find call types used in response to general disturbance or to specific acoustic
stimuli across tag deployments. However, we noted differences in the vocal responses
of long-finned pilot whales to successive sound exposure experiments.
5.2: Introduction
The ongoing development of human activities amplifies their impacts on ecosystems.
Animals can incur a direct risk of injury or death related to human presence. For
instance, collisions with vehicles accounts for a non-negligible amount roe deer
(Capreolus capreolus) mortality in Europe (Bruinderink and Hazebroek, 1996). Beyond
being the cause of direct physical damage to animals, human activities can also disturb
their behaviour through the modification of habitat size and structure, the disruption of

160
physiological processes, and the production of visual, olfactory and auditory stimuli
(reviewed in Tuomainen and Candolin, 2011). Behavioural changes caused by
anthropogenic stimuli range from short-term, local effects to broad scale or long-term
effects. For instance, anthropogenic light can affect the migratory route and habitat use
of bird species (McLaren et al., 2018). Anthropogenic noise may have been responsible
for the long-term displacement of humpback whales (Megaptera novaeangliae) away
from the Hawaiian shores (Glockner-Ferrari and Ferrari, 1990).
In the marine environment, the impacts of anthropogenic noise on the ecosystem, and
particularly on marine mammals, are a primary source of concern (reviewed in
Williams et al., 2015). Human activities at sea, such as vessel traffic, seismic exploration,
pile driving, fisheries, or naval sonar operation, often emit substantial low frequency
sound energy (mostly below 1000 Hz: Richardson and Würsig, 1997). Sounds propagate
much faster and further in sea water than in the air. Low frequency sounds in particular
suffer little absorption in sea water: for illustration, Munk and colleagues were able to
detect 57 Hz signals broadcasted at an intense source level of 221 dB re 1 µPa @ 1 m
around 10,000 km away (Munk et al., 1994). Marine mammal species rely on acoustic
signals for multiple biological functions, such as communication within social groups
(bottlenose dolphins Tursiops truncatus: King et al., 2018) or in the context of
reproduction (humpback whales: Herman, 2017), navigation (bottlenose dolphins:
Jensen et al., 2009a), and foraging (sperm whales Physeter macrocephalus: Miller et al.,

161
2004; short-finned pilot whales Globicephala macrorhynchos: Soto et al., 2008), which
makes them particularly sensitive to acoustic disturbances. Therefore, in addition to
disturbing the behaviour of marine mammals (Richardson and Würsig, 1997),
anthropogenic noise can mask natural communication or echolocation signals (Parks et
al., 2007; Jensen et al., 2009a). Other effects include risk of hearing loss when sounds are
received at high intensities (reviewed in Finneran, 2015), and increased levels of stress
in marine mammals (Richardson and Würsig, 1997).
Among the different sources of underwater anthropogenic sounds, naval sonars have
received particular attention concerning their potential adverse effects on marine
mammals (Parsons, 2017). Indeed, naval sonar exercises have been spatially and
temporally correlated with the mass stranding of cetaceans species (especially beaked
whales: Cox et al., 2006). Naval sonar signals are one of the most powerful
anthropogenic sounds in the ocean, with source levels between 200 and 240 dB re 1 µPa
@ 1 m (root-mean-square sound pressure levels: Cox et al., 2006). The frequency range
of sonar signals extends higher than most other anthropogenic sounds and can overlap
with sounds produced by odontocetes or toothed whales (Richardson and Würsig,
1997).
The inherent challenges in monitoring the behaviour of cetaceans, the scarcity of
opportunistic observations, and the absence of control over the conditions of naval
sonar exercises have made it unrealistic to empirically evaluate the behavioural

162
responses of cetaceans to operational sonar use in actual conditions. Researchers instead
exposed free-ranging cetaceans to naval sonar in controlled conditions. These
experiments are referred to as behavioural responses studies (BRS; reviewed in Southall
et al., 2016) which allowed a quantitative characterisation of the behavioural responses
of cetaceans to naval sonar, albeit in conditions that differ in important ways from
operational sonar usage.
Therefore, some difficulties remain in the interpretation of the biological significance of
behavioural responses to sonar. Indeed, the controlled exposure conditions of
behavioural response studies differ from what cetaceans may actually face: behavioural
response studies use a single sonar source and sonar exposure is limited in duration to
short duration of hours during which an individual whale can be monitored using a
suction-cup attached tag (Southall et al., 2016), whereas actual naval sonar exercises
may last for days or weeks, or may occur repetitively in certain areas.
Moreover, since anthropogenic sounds made a recent and sudden emergence in the
environment (at the evolutionary scale), how they are perceived by animals remains
unclear. One possible approach to evaluate the potential biological significance of
behavioural responses to naval sonar it to is to compare them with behavioural
responses to natural high-level disturbance stimuli of known ecological significance for
the study species. Sounds from predators have been most commonly used. Indeed, the
risk of predation is a strong ecological signal: failure to respond adaptively to predation

163
risk may be fatal (Lima and Dill, 1990). The actual trade-offs between the costs and
benefits of behavioural responses to the risk of predation and to anthropogenic
disturbances may differ, but the theory does predict that the costs of response to
anthropogenic sounds perceived as a threat will be shaped by the costs of how they
respond to natural threats (risk disturbance hypothesis: Frid and Dill, 2002). For
cetacean species, an effective sound used to signal the risk of predation is killer whale
Orcinus orca sounds (e.g. Curé et al., 2016; Isojunno et al., 2016). Killer whales are known
to hunt members of most marine mammal families (Jefferson et al., 1991).
However, some killer whale populations may contain sympatric ecotypes which
display some extent of dietary specialisation: some killer whales specialise in hunting
marine mammals, while others feed mostly on fish (de Bruyn et al., 2013). Marine
mammals can discriminate between the sounds of different killer whale ecotypes
(pinnipeds: Deecke et al., 2002; odontocetes: Curé et al., 2019; mysticetes: see chapter 1).
Therefore, not all killer whale sounds may be perceived as threats, and therefore serve
as effective candidates to trigger an anti-predator response template to analyse the
significance of behavioural responses to sonar.
Behavioural responses of cetaceans to sonar have been found to be very variable
(Southall et al., 2016). Cetacean species display different response sensitivities to sonar:
killer whales responses to experimental sonar exposure were stronger and lasted longer
than responses of sperm whales and long-finned pilot whales (Miller et al., 2012).

164
Moreover, within cetaceans species, behavioural responses to sonar fluctuate with the
type of sonar signal and the behaviour in which individual are engaged at the onset of
sonar transmission (Goldbogen et al., 2013; Harris et al., 2015). Commonly observed
behavioural responses to naval sonar include avoidance and interruption of functional
activities such as foraging or resting (reviewed in Southall et al., 2016). The duration of
most behavioural responses do not exceed the duration of the exposure: for instance,
sperm whales and long-finned pilot whales which interrupted foraging activities in
response to sonar usually went back to foraging as soon as the transmission stops
(Miller et al., 2012; Sivle et al., 2012). However, some behavioural responses to sonar
continued after the transmission ended: northern bottlenose whales Hyperoodon
ampullatus exhibited interruptions of foraging and avoidance in response to sonar that
were prolonged for several hours after the exposure stopped (Miller et al., 2015;
Wensveen et al., 2019).
Modifications of social and vocal behaviour have also been observed in response to
naval sonar, and are particularly relevant to assess for highly social and vocal species
(such as many odontocete species). However, the difficulty to assess those changes
increases with the size and complexity of the species vocal repertoire. Here, we focused
on long-finned pilot whales Globicephala melas, a highly social and vocal odontocete
species. Long-finned pilot whales have been shown to reduce vocal activity in response
to sonar (Miller et al., 2012) and to match the frequency-modulation pattern of sonar

165
signals (Alves et al., 2014). The behavioural measures used to describe the vocal
responses of long-finned pilot whales to naval sonar either focused on overall vocal
activity (number of calls: Visser et al., 2016) or a specific detail of their vocal behaviour
(similarity between calls and sonar signals: Alves et al., 2014). No study was conducted
to quantify changes in call type usage in response to sonar in long-finned pilot whales
because of the inherent difficulty of measuring their vocal behaviour and classifying
their calls. Indeed, the vocal repertoire of long-finned pilot whales is large (125 call
types identified by human operators: Vester et al., 2017) and include a mix of harmonic,
pulsed, and broadband sounds (Vester et al., 2017). Some calls are stereotyped, but
there is a large amount of gradation between calls (Taruski, 1979; Nemiroff and
Whitehead, 2009).
In this study, we used a procedure specifically designed to quantify call gradation in
non-discrete vocal repertoires (Chapter 2) to characterise the vocal responses of long-
finned pilot whales to naval sonar, and to compare them to vocal responses to playback
of killer whales sounds. Between 2008 and 2014, 14 long-finned pilot whales have been
equipped with sound and movement recording tags (dtag: Johnson and Tyack, 2003)
and exposed to naval sonar and killer whale playbacks by the 3S (sea mammal sonar
safety) consortium. Other aspects of the behavioural responses of these long-finned
pilot whales have been analysed in previous publications, such as horizontal
movements, diving activity, or foraging (Miller et al., 2012; Sivle et al., 2012; Isojunno et
166
al., 2017; Curé et al., 2019). Here, we focus on the evolution of three key aspects of the
vocal behaviour of long-finned pilot whales in response to sonar exposures and killer
whale playback: overall vocal activity at the social group and individual levels, call
types, and call typicality (a quantitative measure of the stereotyped or graded nature of
calls).
Based on the high group cohesion observed in this species, we hypothesised that long-
finned pilot whales would display coordinated responses to threatening or disturbing
stimuli. Therefore, we expected overall vocal activity to increase in response to naval
sonar exposures and killer whale playbacks. We looked for call types produced
specifically in response to acoustic disturbances, which could represent recruitment or
general alarm calls. We assumed that long-finned pilot whales would produce more
stereotyped calls (increase in call typicality) during sonar exposures to compress
information and speed up information transfer between group members during
coordinated responses. Alternatively, long-finned pilot whales may produce more
graded calls (decrease in call typicality) during coordinated responses because they
require the transfer of more, or subtler, information.

167
5.3: Material and methods
5.3.1: Study area and population
We performed sound exposure experiment to free-ranging long-finned pilot whales off
northern Norway, between 66 and 70° north. In 2008 and 2009, pilot whales have been
exposed to naval sonar in controlled conditions. In 2013 and 2014, they were exposed to
playback of killer whale sounds (Table 6).
ID Sound exposure experiments Playback experiments
LFAS MFAS LFASDS SILENT MEKW CTRL+ CTRL-
gm08_150c 2 1
gm08_154d 1 2
gm08_159a 2 3 1
gm09_138a* 1 2 4 3
gm09_138b 1 2 4 3
gm09_156b 2 3 4 1
gm10_157b 1, 2
gm10_158d 1, 3
gm13_137a 1
gm13_149a 2 1
gm13_169a* 1 2 3
gm13_169b 1 2 3
gm14_180a* 2 1
gm14_180b 2 1
Table 6: Overview of sound exposure experiments conducted during each tag deployment.
Each tagged whale is identified by the 8-symbol dtag code: the initials of the scientific name of
the species, the two digits year of the tag deployment, an underscore, the date of the
deployment in the Julian calendar, and the number of the tag deployment within the day from a
to z. In 2008 and 2009, tagged whales were exposed to naval sonar transmissions and control
trials. In 2010, 2013, and 2014, whales were exposed to playback of killer whale sounds and

168
control broadcasts. On three occasions, noted in italic, two long-finned pilot whales of the same
group were equipped with tags at the same time. Only one of these whales, identified with an *,
was the focal individual. LFAS: low-frequency active sonar (1-2 kHz). MFAS: medium
frequency active sonar (6-7 kHz). LFASDS: exposure to LFAS down sweeps (2-1 kHz). SILENT:
silent vessel approach (negative control for sonar exposures). MEKW: mammal-eating killer
whale sounds. CTRL+: broadcast of LFAS signals (positive control for killer whale playback).
CTRL-: broadcast of broadband noise (negative control for killer whale playbacks)
5.3.2: Data collection
We used both multi-sensor animal-borne tags (dtags: Johnson and Tyack, 2003) and
visual observations from the observation vessel to monitor the behaviour of long-finned
pilot whales throughout the sound exposure experiments. We deployed dtags on one or
two individuals prior to the sound exposure experiments. The first tagged whale was
designated as the focal individual and serially exposed to several sound exposure
experiments. The number of successive experiments for a single focal individual ranged
from 1 to 6 (Table 6).
Dtags are attached temporarily to the animal with suction cups. We deployed dtags
using a hand-help long pole or a pneumatic launching system (ARTS, LKARTS). Dtags
contain a 50 Hz pressure sensor, a 250 Hz tri-axial accelerometer and magnetometer,
and two hydrophones. The hydrophones recorded sounds at 192 kHz with a sampling
width of 16 bits. Dtag recording have been annotated: through audio-visual inspection

169
of sounds and spectrograms, trained operators noted the start and end times of all long-
finned pilot whale signals and classified them as echolocation signals or social sounds, a
broad category covering both whistles and pulsed calls.
Dtags also contain a VHF beacon which allows the identification and visual tracking of
the focal whale at the surface. We defined the focal group based on the distances
between individual. Within a 200 m radius around the focal whale, referred to as the
focal area, the focal group was the set of individuals closer to each other and to the focal
whale than to their other neighbours (see Visser et al., 2014 for a detailed description of
the protocol). Visual observers noted the number of individuals in the focal group and
their inter-individual spacing, as well as the presence and size of other groups in the
focal area. All visual observations were recorded in Logger 2010 (IFAW).
5.3.3: Stimuli used and procedures of sound exposition
5.3.3.1: General procedure
All sound exposure experiments relied on two research vessels. One vessel followed the
focal whale and was the platform for conducting visual tracking and group
observations (observation vessel). The other vessel carried the sound source and was
devoted to the broadcast of sound stimuli (source vessel). Visual tracking started
immediately after tagging and continued throughout the experiments. The observation

170
vessel communicated the position of the focal whale to the source vessel to coordinate
sound exposure experiments.
Each sound exposure experiment consisted in three experimental phases: the pre-
exposure observation period (PRE) right before the presentation of the stimulus, the
stimulus presentation period (DUR), and the post-exposure observation period (POST)
starting right after the presentation of the stimulus. Comparisons of the vocal behaviour
of long-finned pilot whales between PRE and DUR allow the identification of the vocal
responses during the stimulus transmission. Comparisons between PRE and POST can
be used to determine whether vocal responses initiated during DUR continued after the
end of the exposure or whether vocal responses were initiated after the exposure. The
duration of PRE and POST was fixed as the designed duration of the exposure: 40
minutes for sonar experiments and 15 minutes for playback experiments (see below).
Due to the logistical constraints of fieldwork, the designed experimental timeline was
not always realised. This classification of the experimental phases of some successive
experiments resulted in minor overlapping periods (Table 7). We assigned all overlaps
between PRE and DUR and between DUR and POST to DUR, as the stimulus
presentation was present. We discarded all overlaps between PRE and POST from
further analyses. Using overlapping PRE as a reference to identify vocal responses to
stimuli may be a problem if there are any lingering effects of the previous exposure. In
addition, this avoided the repeated sampling of time intervals in successive experiments.

171
Focal
whale
Stimulus PRE DUR POST
Ideal
start
Effective
start
Start End Effective
end
Ideal
end
gm08_150c MFAS 15:32:00 16:12:00 16:50:21 17:25:00 17:30:21
LFAS 17:25:00 17:30:21 18:05:00 18:36:00 19:16:00
gm08_154d LFAS 00:35:00 01:15:00 02:35:21 02:55:00 03:15:21
MFAS 02:55:00 03:15:21 03:35:00 04:00:21 04:40:21
gm08_159a SILENT 22:27:00 23:07:00 23:37:41 23:53:00 00:17:41
LFAS 23:53:00 00:17:41 00:33:00 01:08:21 01:30:00 01:48:21
MFAS 01:30:00 01:48:21 02:10:00 02:46:21 03:26:21
gm09_138a LFAS 14:02:00 14:42:00 15:14:00 15:54:00
gm09_138b MFAS 16:00:00 16:40:00 17:15:00 17:55:00
SILENT 18:00:00 18:40:00 19:14:00 19:52:00 19:54:00
LFASDS 19:52:00 19:54:00 20:32:00 21:05:00 21:45:00
gm09_156b SILENT 22:50:00 23:30:00 00:02:00 00:42:00
LFAS 00:56:00 01:36:00 02:09:00 02:30:00 02:49:00
MFAS 02:30:00 02:49:00 03:10:00 03:37:00 04:15:00 04:17:00
LFASDS 04:15:00 04:17:00 04:55:00 05:25:00 06:05:00
gm10_157b CTRL- 14:33:00 14:48:00 15:02:40 15:02:40 15:17:40
CTRL- 14:58:00 15:13:00 15:13:00 15:28:00 15:43:00
gm10_158d CTRL-* 19:44:47 19:59:47 20:14:30 20:14:30 20:29:30
CTRL-* 20:28:30 20:43:30 20:43:30 20:58:20 20:58:20 21:13:20
gm13_137a MEKW 18:49:00 19:04:00 19:19:00 19:34:00
gm13_149a CTRL+ 11:25:40 11:40:40 11:55:40 12:10:40
MEKW 13:22:26 13:37:26 13:52:25 14:07:25
gm13_169a MEKW 11:08:40 11:23:40 11:39:00 11:54:00
gm13_169b CTRL+ 12:11:25 12:26:25 12:41:25 12:56:25
CTRL- 14:11:17 14:26:17 14:41:16 14:56:16
gm14_180a CTRL+ 13:12:58 13:27:58 13:44:00 13:59:00
gm14_180b MEKW 15:01:00 15:16:00 15:31:00 15:46:00
Table 7: Experiment timeline and overlaps between successive experiments. PRE and POST
periods should ideally last 40 minutes for sonar experiments and 15 minutes for playback
experiments. Nevertheless, there was some overlap between these time periods for successive
sound exposure experiments. We discarded overlapping periods, resulting in effective start
times of PRE and effective end times of POST different from the ideal start and end times in
experiment design. Such cases are marked in bold in the table. No effective time is given when

172
it was identical to the designed time. *: sound exposure experiments overlapping a playback not
presented in this study
5.3.3.2: Controlled exposure experiments to naval sonar
We used a towable sonar source (SOCRATES, TNO, the Netherlands) for controlled
exposure experiments. The source vessel approached the focal whale at constant speed
over the course of the experiment, with the aim of reaching it after 30 minutes of full
power exposure. Sonar transmission started when the source vessel was 6 to 8 km from
the focal whale. The source vessel first adjusted its course to the successive positions of
the focal individual, and then fixed its heading when it reached 1 km from the focal
whale. Sonar transmission continued for 5 minutes after the source vessel crossed the
path of the focal whale. The source level of sonar signals increased gradually over the
first 5 minutes of the exposure, which is referred to as the ramp up procedure. The
planned duration of a controlled exposure to sonar was therefore 40 minutes: 5 minutes
of ramp up, 30 minutes of full power transmission to reach the focal individual, and 5
minutes of transmission after crossing the path of the focal whale. In practice, exposure
duration was variable (Table 7). A mitigation procedure was set so that sonar
transmission would be interrupted if the whale approached within 100 m of the source,
showed pathological reactions, or approached confined and shallow areas.
The frequency band and modulation pattern of sonar signals is variable and depends on
the range and precision sought after. We tested three kinds of sonar signals: low

173
frequency active sonar (LFAS) – 1 to 2 kHz hyperbolic upsweeps; medium frequency
active sonar (MFAS) – 6 to 7 kHz hyperbolic upsweeps; and LFAS down sweeps
(LFASDS) – 2 to 1 kHz hyperbolic downs weeps. All signals followed the same
transmission scheme: 1 s pings followed by 19 s of silence. The source level of LFAS and
LFASDS signals increased from 152 to 214 dB re 1 µPa (root-mean-square), and the
source level of MFAS signals increased from 158 to 199 dB re 1 µPa (root-mean-square).
In addition to sonar exposure experiments, we also carried out silent approaches of the
source vessel towing the sonar source but without sonar transmissions, using the same
approach protocol as sonar exposure experiments. We refer to these no-sonar control
approaches as SILENT in the rest of the article.
5.3.3.3: Playback of killer whale sounds
We broadcasted playback stimuli from a loudspeaker lowered 8 m underwater (details
of the playback chain material can be found in Curé et al., 2019). The source vessel
positioned itself ahead of the focal whale, but not directly in its path. This disposition
does not force reactions by blocking the path of the focal whale and eases the detection
of approach and avoidance responses (Chapter 1). Once in position, the source vessel
switched off its engine and lowered the hydrophone before the start of the DUR. At the
end of the DUR period, the playback material was brought back on board, and the
source vessel transited to the next playback position.

174
We used the sounds of unfamiliar mammal-eating killer whale (MEKW), which should
represent maximal threat to long-finned pilot whales. Mammal-eating killer whale
sounds were recorded using dtags on groups of around five individuals harassing and
feeding on marine mammals off Southeast Alaska. We removed all sounds not
produced by killer whales from the recordings, such as bubble sounds or the sound of
the tag breaking the water surface. We looped the resulting files so that all stimuli
would last 15 minutes. Stimuli were amplified so that recorded calls would reach the
natural range of source levels for killer whales (140-155 dB re 1 µPa root-mean-square:
Miller, 2006). We used two additional signals. We selected portions of killer whale
recordings without killer whale sounds, prepared them in the same way as killer whale
stimuli and amplified them to reach the same average root-mean-square sound pressure
level as killer whale stimuli. We refer to the playback of background noise stimuli as
CTRL-. We also broadcasted artificial frequency-modulated signals (1-2 kHz hyperbolic
upsweeps, same as LFAS signals) at the same average root-mean-square sound pressure
levels as killer whale calls. We refer to these broadcasts of artificial signals as CTRL+.
For all stimuli, except for artificial signals, we prepared several stimulus exemplars to
reduce pseudoreplication.

175
5.3.4: Vocal behaviour measures
5.3.4.1: Vocal activity
We measured the root-mean-square sound pressure level signal to noise ratio of all
annotated calls, using the 0.2 seconds right before the call as reference. We selected all
annotated calls with signal to noise ratio higher than 3 dB to measure the vocal activity
of long-finned pilot whales.
We used two measures of vocal activity: the number of annotated calling events and the
cumulative duration of calling events. The number of calling events is a measure of the
total number of calls, except that overlapping calls and calls closer than 0.2 s apart were
annotated as single events. The cumulative duration of calling events is a measure of
time spent calling, except that overlapping calls were counted only once and gaps
smaller than 0.2 s between calling events were included.
We measured the number of calling events and their cumulative duration for all
experimental phases (PRE, DUR, and POST). Since the duration of experimental phase
was variable, we divided the two measures of vocal activity by the duration of each
experimental phase. We obtained the rate of calling events and the proportion of time
scored as calling during the PRE, DUR, and POST of each experiment.
Dtags do not only record the calls produced by the focal whale or the focal group, but
the calls produced by all conspecifics present in the surrounding area. The selection of

176
calls with signal over noise ratio higher than 3 dB presumably removed annotated calls
produced by very distant individuals from the dataset. However, the rate of calling
events and the proportion of time scored as calling are measures of focal group vocal
activity.
We divided these measures of group vocal activity by the size of the focal group to
obtain a proxy of individual vocal activity within the focal group. We estimated the
average group size during each experimental phase based on visual observations of the
focal group at the surface. Visual tracking of the focal whale was not consistent: long-
finned pilot whales may dive for various durations or may be lost from sight. To take
into account the irregularity of visual tracking, we assumed that group size remained
the same from one observation to the next one and included the duration between
observations as a weighting factor in the calculation of average group size AGS:
𝐴𝐺𝑆 = 1
𝑡𝑜𝑡𝑎𝑙 𝑑𝑢𝑟𝑎𝑡𝑖𝑜𝑛 𝑥 ∑ (𝑡𝑖+1 − 𝑡𝑖)𝑥 𝑔𝑟𝑜𝑢𝑝 𝑠𝑖𝑧𝑒𝑖
𝑛 𝑜𝑏𝑠
𝑖=0
With:
- n obs the number of observations of the focal group during the experimental
phase
- ti the time of i-th observation. t0 is the start time of the experimental phase, tn obs+1
is the end time of the experimental phase.

177
- group sizei is the focal group size estimation at i-th observation. group size0 is the
last observed focal group size before the start of the experimental phase.
This group size calculation method asymptotically corresponds to the mean of focal
group size estimations, but reduces the influence of observations clustered in time.
5.3.4.2: Call types and typicality
We selected annotated calls with signal to noise ratio higher than 6 dB. We then visually
inspected spectrograms (1024 pts, Hanning window, 50 % overlap) and discarded all
calls which were overlapped by other calls, loud echolocation clicks, and transient or
fluctuating background noise. We downsampled tag recordings to 48 kHz and
classified long-finned pilot whales using a Mel frequency cepstral coefficients- and
fuzzy clustering-based unsupervised classifier (see chapter 2 for method details). We
classified the calls from each tag deployment separately.
Fuzzy clustering detects apparent stereotypes in the dataset and quantifies the position
of individual calls between these stereotypes. Each call is given a membership score to
each fuzzy cluster, or apparent stereotype, which corresponds to the probability to
belong to that cluster. The classification algorithm depends on the fuzziness parameter
µ, which determines how much clusters can overlap, and the maximum number of
clusters allowed ncmax. Several stable clustering solutions may exist for a single dataset

178
(Table 8). Each stable clustering solution consists of several fuzzy clustering
classifications obtained with different values of fuzziness.
We divided each calls into 10 equal time slices and calculated 10 Mel frequency cepstral
coefficients for each slice. We set the maximal fuzziness value at µmax = 2, the maximum
number of clusters allowed as ncmax = number of calls/10 + 5, and decremented the
fuzziness parameter by steps of 0.01.
We derived two measures of vocal activity from fuzzy clustering results: the change in
average membership scores and the change in average typicality between experimental
phases.
Using calls selected for the fuzzy clustering analysis that were produced during sound
exposure experiments, we calculated the average membership score to each cluster
during the PRE, DUR, and POST of an experiment. Then, we computed the change in
average membership scores between PRE and DUR and between PRE and POST as:
𝑀𝑝,𝑞 = 1𝑛 𝑐𝑙𝑢𝑠𝑡𝑒𝑟⁄ 𝑥 ∑ (𝑚𝑏𝑝,𝑐 − 𝑚𝑏𝑞,𝑐)
2𝑛 𝑐𝑙𝑢𝑠𝑡𝑒𝑟
𝑐=1
with:
- Mp,q the change in average membership scores between experimental phases p
and q
- n cluster the number of clusters in the fuzzy clustering solution.
- mbp,c the average membership score to cluster c during experimental phase p

179
Tag ID Fuzziness values for solutions with:
two clusters three clusters four clusters
gm08_150c 1.62; 1.58; 1.38; 1.35; 1.33; 1.32; 1.31;
1.30; 1.29; 1.28; 1.27; 1.26; 1.24: 1.23;
1.22; 1.20; 1.19
1.25; 1.21; 1.18; 1.17;
1.16; 1.15; 1.13
1.14; 1.12; 1.11
gm08_154d 1.14; 1.09; 1.08; 1.07; 1.06
gm08_159a 1.22; 1.21; 1.18; 1.15; 1.14; 1.13; 1.12;
1.11; 1.10; 1.09; 1.08; 1.07
gm09_138a 1.10; 1.08; 1.07
gm09_138b 1.17; 1.15; 1.13; 1.12; 1.11; 1.10 1.08: 1.06; 1.09
gm09_156b 1.16; 1.14; 1.12; 1.11; 1.10; 1.09; 1.08 1.07; 1.06; 1.05
gm10_157b 1.20; 1.19; 1.18; 1.17; 1.16; 1.15; 1.14;
1.13; 1.12; 1.11; 1.10
1.08; 1.07; 1.06; 1.05
gm10_158d 1.20; 1.18; 1.16; 1.15; 1.14; 1.13; 1.12;
1.11; 1.10; 1.09
gm13_137a 1.46; 1.38; 1.35; 1.32; 1.29; 1.28; 1.27;
1.26; 1.25; 1.24; 1.23; 1.22; 1.21; 1.20;
1.19; 1.18; 1.17; 1.16; 1.15; 1.14; 1.13
1.12; 1.11; 1.10
gm13_149a 1.13; 1.12; 1.11; 1.08
gm13_169a 1.23; 1.20; 1.18; 1.17; 1.16; 1.15; 1.13 1.14; 1.12; 1.11 1.10; 1.09; 1.08
gm13_169b 1.37; 1.29; 1.28; 1.27; 1.26; 1.25; 1.24;
1.23; 1.22; 1.20; 1.21; 1.19; 1.18; 1.17;
1.16; 1.15; 1.14; 1.13; 1.12; 1.11; 1.10;
1.09
1.07; 1.06; 1.05; 1.04
gm14_180a 1.38; 1.36; 1.35; 1.33; 1.32; 1.31; 1.30;
1.29; 1.28; 1.27; 1.26; 1.25; 1.24; 1.23;
1.21; 1.20; 1.19; 1.16
1.18; 1.17; 1.15; 1.14
gm14_180b 1.39; 1.36; 1.35; 1.33; 1.31; 1.30; 1.28;
1.27; 1.26; 1.25; 1.24; 1.23; 1.22; 1.21;
1.20; 1.19; 1.18; 1.17
1.16; 1.15; 1.14; 1.13;
1.12; 1.11
Table 8: Fuzziness values over which solutions with two, three, and four clusters were stable
for each tag deployment.
M is a measure of changes in call type usage from one experiment phase to the other. M
is distributed between 0 and 1 irrespective of the number of clusters in the fuzzy
clustering solutions. However, as the sum of all membership scores for a given call

180
equals 1, the distribution of M may somewhat shift towards smaller values as the
number of clusters increases.
The typicality is the difference between the two highest membership scores of a call. It
is a measure of the stereotyped or graded nature of calls. Calls with high typicality are
much closer from one apparent stereotype than from the others (stereotyped calls).
Calls with low typicality lie in between stereotypes (graded calls). We measured the
average typicality of calls during the PRE, DUR, and POST of each experiment, and
compared the average typicality during the PRE with the average typicality during
either the DUR or the POST. We refer to the change in average typicality between
experimental phases p and q as Tp,q in the rest of the article.
We selected tag deployments with at least two calls in the PRE and DUR to measure
MPRE,DUR and TPRE,DUR, and tag deployments with at least two calls during PRE and POST
for MPRE,POST and TPRE,POST calculations. We then measured M and T for each stable fuzzy
clustering solution and for each fuzziness value.
5.3.5: Statistical analysis
5.3.5.1: Vocal activity
In order to work with independent samples, we pooled the vocal activity measures of
tags deployed the same day on individuals from the same group if both whales stayed
together during the sound exposure experiments (gm09_138a and gm09_138b, and

181
gm13_169a and gm13_169b). Else, we discarded the non-focal whale from the analysis
(gm14_180b). We kept gm09_138b instead of gm09_138a, as tag a malfunctioned and
both whales stayed together throughout the deployment.
5.3.5.2: Call types and typicality
We considered the different realisations of fuzzy clustering to be repeated measures of
the same vocal behaviour for each tag deployment. We used tag deployment days as
blocking units to pool pairs of whales tagged the same day, as they were exposed to the
same signals in the exact same conditions. We ran generalised estimated equations
(GEE) to determine the effect of signal type on the changes in average membership
scores and typicality between experiment duration. Changes in average membership
scores were modelled under a Gamma distribution and changes in average typicality
under a Gaussian distribution, both with an identity link function. We used the jack-
knife variance estimator. Since sonar exposure experiments and playback signals
targeted different subsets of individuals in the dataset, we built separate models for
each type of experiment. The sample size of certain exposure types (CTRL-, LFASDS)
and clustering solution size (four clusters) was too low to take into account clustering
solution size and order of presentation in the models. Therefore, we did not perform
any model selection procedure, and the GEE results must be taken as descriptive.

182
We compared the effect sizes of signal types within model to determine how the whales
reacted to different types of sonar signals or playback stimuli. We compared the effect
sizes of sonar signals across models to determine whether the nature of the response
towards naval sonar and killer whale sounds was identical.
We used the R software (R Core Team, 2017) and package ‘geepack’ (Halekoh et al.,
2006) to run the GEE models. The threshold for statistical significance was set at 0.05.
Since the populations exposed to naval sonars and killer whale playbacks were different,
there was no repeated testing and no correction of the threshold for statistical
significance was needed.
5.4: Results
5.4.1: Vocal activity
Vocal responses to silent vessel approaches were variable (Figure 15). Out of three
experiments, group vocal activity increased during the silent vessel approach in one
case, decreased in the second one, and remained stable in the last one (Figure 15A and
C). Individual vocal activity (group activity weighted by group size) was lower in POST
than in PRE and DUR in two out of three experiments (Figure 15B and D). Individual
vocal activity followed the same trend as group vocal activity except for gm09_156b:
group vocal activity remained at the same level during PRE and DUR, whereas

183
individual vocal activity largely decreased in DUR, which means that group size was
larger in DUR than in PRE.
Both group and individual vocal activity tended to increase in response to LFAS (Figure
16). In 4 out of 5 LFAS experiments, group (Figure 16A and C) and individual (Figure
16B and D) vocal activity were higher in PRE than in DUR, and higher in POST than in
DUR. Group and individual vocal activity followed similar trends for all experiments.
Vocal responses to MFAS experiments were variable (Figure 17). Group vocal activity
decreased in DUR compared to PRE in two cases, increased in two cases, and remained
at the same level in one case. Similarly, it was higher in POST than in PRE in three cases,
and lower in two cases (Figure 17A and C). Individual vocal activities followed the
same trends as group vocal activity during DUR. During POST, individual vocal
activity was lower than or equal to individual vocal activity in PRE (Figure 17B and D).
For tag gm09_156b, group vocal activity remained at a similar level in DUR and POST,
whereas individual vocal activity decreased in POST, which means that group size
increased in POST.

184
Figure 15: Vocal activity before, during, and after silent vessel approaches A and B) Number of
annotated calling events C and D) Cumulative duration of annotated calling events. Left panels
(A and C) were corrected for experiment phase duration. Right panels (B and D) were corrected
for both experiment phase duration and average group size. Data for individual tag
deployments is displayed as points and lines: + crosses – gm08_159a; x crosses – gm09_138b;
diamonds – gm09_156b

185
Figure 16: Vocal activity before, during, and after LFAS exposures A and B) Number of
annotated calling events C and D) Cumulative duration of annotated calling events. Left panels
(A and C) were corrected for experiment phase duration. Right panels (B and D) were corrected
for both experiment phase duration and average group size. Circles – gm08_150c; triangles –
gm08_154d; + crosses – gm08_159a; x crosses – gm09_138b; diamonds – gm09_156b

186
Figure 17: Vocal activity before, during, and after MFAS exposures A and B) Number of
annotated calling events C and D) Cumulative duration of annotated calling events. Left panels
(A and C) were corrected for experiment phase duration. Right panels (B and D) were corrected
for both experiment phase duration and average group size. Circles – gm08_150c; triangles –
gm08_154d; + crosses – gm08_159a; x crosses – gm09_138b; diamonds – gm09_156b

187
There were only two exposures to LFASDS, and the vocal responses recorded differed
(Figure 18). Group level vocal activity either increased or decreased in DUR and in
POST compared to PRE (Figure 18A and C). Individual vocal activity was lower in
POST than in PRE in both cases (Figure 18B and D). For gm09_138b, the duration scored
as calling increased whereas the number of calls decreased in DUR, which means that
long-finned pilot whales produced longer calls in DUR than in PRE.
Group vocal activity either increased (3 cases) or decreased (3 cases) in response to
MEKW experiments (Figure 19). When it increased, it was higher in POST than in PRE
in all cases. In one case, vocal activity was increased in POST but not in DUR (Figure
19A and C). At the individual level, we observed two increases in vocal activity in
response to MEKW, two decreases thereof, and an absence of modification in DUR
(Figure 19B and D). In four out of five cases, individual vocal activity in POST was
lower than or equal to individual vocal activity in PRE (Figure 19B and D). These results
were mostly related to changes in group size. For instance, individual vocal activity
remained the same throughout the MEKW playback for tag gm14_180a, but group
vocal activity decreased in DUR and further decreased in POST.
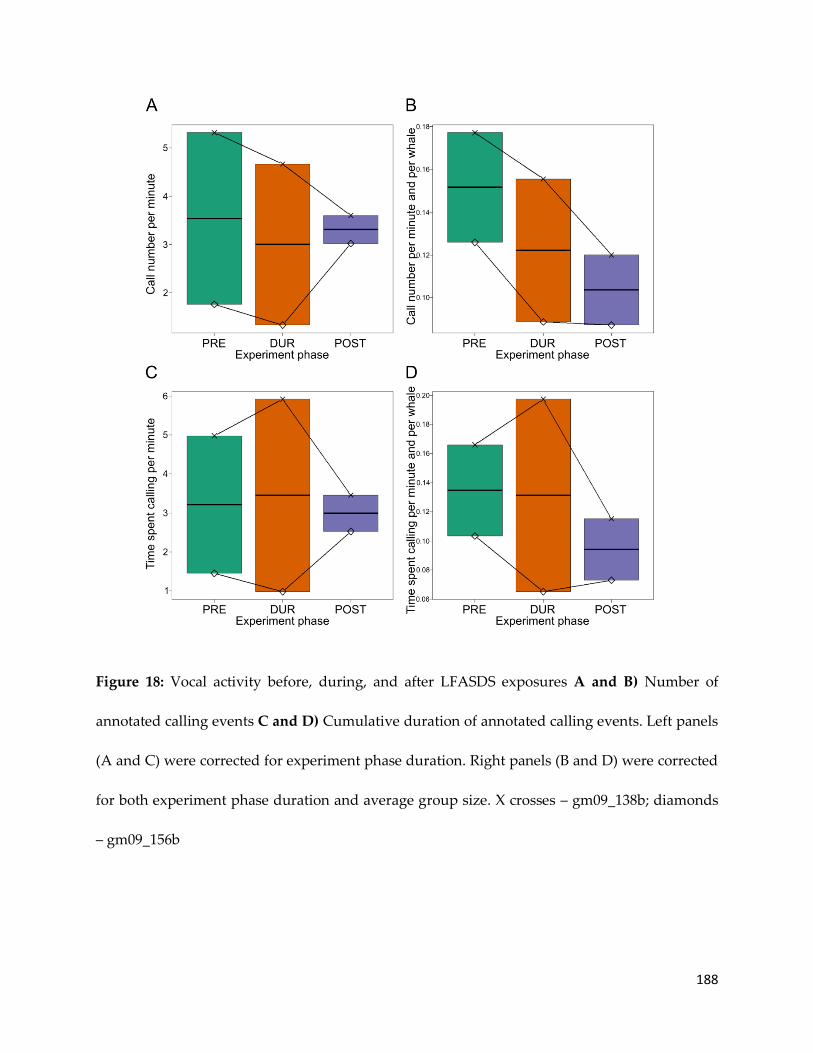
188
Figure 18: Vocal activity before, during, and after LFASDS exposures A and B) Number of
annotated calling events C and D) Cumulative duration of annotated calling events. Left panels
(A and C) were corrected for experiment phase duration. Right panels (B and D) were corrected
for both experiment phase duration and average group size. X crosses – gm09_138b; diamonds
– gm09_156b

189
Figure 19: Vocal activity before, during, and after MEKW playbacks A and B) Number of
annotated calling events C and D) Cumulative duration of annotated calling events. Left panels
(A and C) were corrected for experiment phase duration. Right panels (B and D) were corrected
for both experiment phase duration and average group size. Stars – gm13_137a; crossed
diamonds – gm13_149a; + crossed circles – gm13_169a; double triangles – gm13_169b; crossed
squares – gm14_180a; x crossed circles – gm14_180b

190
Group vocal activity increased during the DUR and POST of all five playbacks of
CTRL+ compared to PRE (Figure 20A and C). Individual vocal activity increased in
DUR, then decreased in POST to lower levels than in PRE for four out of five
experiments (Figure 20B and D). For tag gm14_180a, individual vocal activity remained
low throughout the experiment: the increase in group vocal activity observed in DUR
corresponds to an increase in group size. Similarly, group vocal activity for tag
gm13_149a remained at higher levels in POST than in PRE while individual vocal
activity was lower in POST than in PRE: there was a prolonged increase in group size in
response to CTRL+ playback.
Individual and group vocal activity followed the same trends for CTRL- playback
(Figure 21). Vocal activity remained at the same level (two cases) or decreased (two
cases) in DUR. In POST, group level vocal activity increase compared to DUR, and
either remained lower than in PRE or increased to higher levels than in PRE (Figure 21A
and C). Individual vocal activity in POST was higher than in PRE (Figure 21B and D).

191
Figure 20: Vocal activity before, during, and after CTRL+ playbacks A and B) Number of
annotated calling events C and D) Cumulative duration of annotated calling events. Left panels
(A and C) were corrected for experiment phase duration. Right panels (B and D) were corrected
for both experiment phase duration and average group size. Crossed diamonds – gm13_149a; +
crossed circles – gm13_169a; double triangles – gm13_169b; crossed squares – gm14_180a; x
crossed circles – gm14_180b

192
Figure 21: Vocal activity before, during, and after CTRL- playbacks A and B) Number of
annotated calling events C and D) Cumulative duration of annotated calling events. Left panels
(A and C) show data corrected for experiment phase duration. Right panels (B and D) show
data corrected for both experiment phase duration and average group size. Inverted triangles –
gm10_157b; x crossed squares – gm10_158d; + crossed circles – gm13_169a; double triangles –
gm13_169b
193
5.4.2: Call types and typicality
The changes in call type usage during LFAS exposures were variable (MPRE,DUR = 0.170
+/- 0.158: Table 9). Changes in call type usage were also variable between the PRE and
POST of LFAS experiments, but over a narrower range than differences between PRE
and DUR (MPRE,POST = 0.047 +/- 0.039: Table 9).
In comparison, long-finned pilot whales used different call types in the PRE and DUR
of exposures to MFAS (MPRE,DUR = 0.139 +/- 0.031: Table 9) and LFASDS (MPRE,DUR = 0.141
+/- 0.061: Table 9). These vocal responses to MFAS and LFAS stopped at the end of the
exposure (MPRE,POST = 0.027 +/- 0.011 and MPRE,POST = 0.039 +/- 0.015, respectively, similar
to responses observed between SILENT PRE and DUR: Table 9).
There was no change in call type usage between the PRE and DUR of silent vessel
approaches (MPRE,DUR = 0.021 +/- 0.009: Table 9). Interestingly, we observed a large
change in call type usage between the PRE and POST of SILENT exposures (MPRE,POST =
0.135 +/- 0.035, similar in magnitude to responses in DUR for MFAS and LFASDS: Table
9). There was no significant change in typicality during or after sonar exposures and
silent vessel approaches (Table 10).
Changes in call type usage with no change in average typicality corresponded either to
the long-finned pilot whales switching between stereotyped calls of one type to another
(Figure 22A and B), or from shifts in the position of graded calls between stereotypes
(Figure 22C). Some pilot whale barely responded to LFAS signals (Figure 23A), while

194
other ones strongly altered their vocal behaviour (Figure 23B), which resulted in the
large variation of responses observed.
Sound stimulus Comparison PRE-DUR Comparison PRE-POST
Mean Std Wald p-value Mean Std Wald p-value
Sonar SILENT 0.021 0.009 4.76 0.029 0.135 0.035 14.60 <0.001
LFAS 0.170 0.158 1.16 0.281 0.047 0.039 1.43 0.231
MFAS 0.139 0.031 20.83 <0.001 0.027 0.011 6.11 0.014
LFASDS 0.141 0.061 5.41 0.020 0.039 0.015 7.02 0.008
Playback CTRL- 0.341 0.016 443.99 <0.001
CTRL+ 0.060 0.005 156.80 <0.001 0.304 0.122 6.20 0.013
MEKW 0.095 0.030 9.88 0.002 0.056 0.025 5.13 0.024
Table 9: Results of the generalised estimated equation models to explain the variation of the
change of average membership score between experiment phases by signal types. A different
model was built to analyse responses to controlled exposure experiments and to playback
experiments. Significant effects are indicated in bold.
Sound stimulus Comparison PRE-DUR Comparison PRE-POST
Mean Std Wald p-value Mean Std Wald p-value
Sonar SILENT -0.033 0.059 0.32 0.57 -0.060 0.067 0.79 0.373
LFAS -0.073 0.180 0.16 0.69 -0.010 0.138 0.01 0.941
MFAS -0.007 0.028 0.06 0.80 -0.022 0.033 0.47 0.495
LFASDS -0.080 0.140 0.33 0.57 -0.022 0.012 3.11 0.078
Playback CTRL- -0.010 0.006 3.08 0.079
CTRL+ -0.157 0.057 7.46 0.006 -0.075 0.059 1.61 0.21
MEKW -0.018 0.04 0.19 0.664 0.018 0.067 0.07 0.79
Table 10: Results of the generalised estimated equation models to explain the variation of the
change of average typicality between experiment phases by signal type. A different model was
built to analyse responses to controlled exposure experiments and to playback experiments.
Significant effects are indicated in bold.

195
Figure 22: Examples of vocal responses of long-finned pilot whales to sonar signals. The left
panels show reconstruction of the fuzzy cluster centroids. The right panels represent the
membership scores of calls produced in PRE, DUR, and POST of the sound exposure
experiment. The width of the histograms corresponds to the duration of the experiment phases.
The left to right order of the left panels corresponds to the bottom to top order (blue, green, red,
and orange) of the right panels A) Response of gm08_150c to MFAS (4 fuzzy clusters, fuzziness

196
= 1.14) B) Response of gm09_138b to LFASDS (3 fuzzy clusters, fuzziness = 1.09) C) Response of
gm09_138b to SILENT (3 fuzzy clusters, fuzziness = 1.09)
Changes in call type usage were detected between the PRE and DUR of all three types
of playback: MEKW, CTRL+, and CTRL- (Table 9). CTRL- had the largest response in
call type usage (MPRE,DUR = 0.341 +/- 0.016: Table 9). Change in call type usage in response
to MEKW was slightly larger than in response to CTRL+, which elicited the smallest
change (MPRE,DUR = 0.090 +/- 0.030 vs. 0.065 +/- 0.005: Table 9).
Figure 23: Examples of vocal responses of long-finned pilot whales to LFAS A) Strong response
for gm09_138b (3 fuzzy clusters, fuzziness = 1.06) B) Absence of response for gm09_156b (3
fuzzy clusters, fuzziness 1.06)

197
Figure 24: Example of vocal responses of long-finned pilot whales to CTRL- playbacks
(gm13_169a, 3 fuzzy clusters, fuzziness = 1.12). The call type produced in DUR (left cluster, in
blue) was higher in frequency that the call types used in PRE (centre and right cluster, in green
and red)
We observed a large change in call type usage between the PRE and POST of CTRL+
experiments (MPRE,POST = 0.304 +/- 0.122, larger than the corresponding MPRE,DUR: Table 9).
Vocal behaviour did not return to PRE levels after the end of MEKW playbacks
(MPRE,POST = 0.056 +/- 0.025, smaller than the corresponding MPRE,DUR: Table 9).
We observed no change in typicality during or after MEKW playbacks (TPRE,DUR = -0.018
+/- 0.040, TPRE,POST = 0.018 +/-0.067: Table 10). Despite the large modification of call type
usage, no change of typicality was recorded between the PRE and DUR of CTRL-
experiments. Long-finned pilot whale switched between highly typical calls (Figure 24).
They produced high frequency calls in response to CTRL- playbacks (Figure 24). The
typicality of calls decreased in response to CTRL+ playback (TPRE,POST =-0.157 +/- 0.057:

198
Table 10). Long-finned pilot whale produced more graded calls during CTRL+
experiments (Figure 25).
Figure 25: Example of vocal response of long-finned pilot whales to CTRL+ playbacks
(gm13_169b, 4 fuzzy clusters, fuzziness = 1.07). Long-finned pilot whales produced more
graded calls in DUR than in PRE and POST
5.4.3: Characterisation of call types used during sound exposure experiments
The call types used during exposure to LFAS was different from the call types used
during exposure to MFAS (Figure 26A and B). In addition, for tag gm09_138b, the same
call type was produced during exposure to both MFAS and LFASDS, and it was
different from the call type produced during exposure to LFAS (Figure 26B).
The call types mainly used during MEKW and CTRL+ playbacks were the same for tag
gm14_180a (Figure 27).
The call type used in the DUR of CTRL- playback for tag gm13_169a was higher in
frequency than the other clusters of the deployment (Figure 24).

199

200
Figure 26: Examples of vocal responses of long-finned pilot whales to sonar signals. The left
panels show apparent stereotypes. The right panels show memberships scores to each cluster.
Left to right in left panels corresponds to bottom to top in right panels (blue, green, red) A)
Responses of gm08_150c to LFAS (top) and MFAS (bottom); 3 fuzzy clusters, fuzziness = 1.17.
The call type produced during exposure to LFAS (right cluster, in red) differed from the call
type used during exposure to MFAS (left cluster, in blue) B) Responses of gm09_138b to LFAS
(top), MFAS (middle), and LFADS (bottom); 3 fuzzy clusters, fuzziness = 1.09. The call type
used during exposure to LFAS (left cluster, in blue) differed from the call type used during
exposure to MFAS and LFASDS (centre cluster, in green)

201
Figure 27: Vocal responses of tag gm14_180a to MEKW (top) and CTRL+ (bottom) playbacks. 3
fuzzy clusters, fuzziness = 1.18. The same call type (left cluster, in blue) was recorded during
MEKW and CTRL+ playbacks
5.5: Discussion
By using an unsupervised classification procedure we developed in previous work
(chapter 2), we aimed to quantify the changes in vocal activity (number of calls and time
spent calling) at the group and the individual levels, as well as the changes in call type
usage and call gradation of free-ranging long-finned pilot whales in response to naval
sonar, playback of killer whale sounds, and respective control stimuli.

202
Overall, although responses were quite variable across individuals, our analyses
showed evidence of changes in vocal behaviour in response to all stimulus types.
Whales responded differently to sonar exposures, playback of killer whale sounds, and
respective control stimuli. Figure 28 summarises the main outcomes of our study.

203
Figure 28: Summary of long-finned pilot whale vocal responses to sonar exposures, playback of
killer whale sounds, and corresponding controls. Each cell can have three symbols: an arrow
going up, an arrow going down, and an equal sign, which represent respectively an increase, a
decrease, and the absence of directional change for the behavioural measure. When one type of
change is consistent across individuals, only the corresponding symbol is represented.
Therefore, the presence of several symbols means that vocal responses were variable between
individuals. When the difference in magnitude between the vocal responses in DUR and in
POST is consistent across individuals, the largest change is indicated with a larger arrow, and
the smallest one with a smaller arrow

204
5.6.1: Vocal responses of long-finned pilot whales to naval sonars, playbacks of killer
whale sounds, and control experiments
As predicted, long-finned pilot whales tended to increase their group and individual
(group activity weighted by group size) vocal activity in response to sonar exposures,
especially in response to LFAS exposures: in four out of five experiments, vocal activity
was higher in PRE than in DUR, and further higher in POST than in DUR. They also
increased vocal activity during CTRL+ playbacks and some replicates of MEKW
playbacks. By contrast, we observed a tendency to decrease individual vocal activity
during CTRL- playbacks and after silent vessel approaches (Figure 28).
Some call types were produced specifically during or after the exposure to acoustic
stimuli. These call types could be triggered by the stimuli directly, or potentially used to
coordinate the behavioural responses of group members in relation to the sound source.
No single call type, such as general alarm or recruitment calls, appeared to be produced
in response to acoustic disturbances across tag deployments. We did, however, observe
similarities and differences in the call types produced in response to different stimuli
within tag deployments. Long-finned pilot whales recorded by tag gm14_180a
produced the same call type during MEKW and CTRL+ playbacks. For tag deployment
gm08_150c, the call type produced during MFAS exposure was different from the call
types recorded during LFAS exposure. For gm09_138b, the same call type was
produced during exposure to MFAS and LFASDS, and another call type was produced

205
during the LFAS exposure. Some call types were only produced during or after the end
of sound exposures, and could underlie the behavioural responses of long-finned pilot
whales to acoustic stimuli.
We observed no directional changes in typicality during sonar exposures (LFAS, MFAS,
and LFASDS), silent vessel approaches, and MEKW playbacks (Figure 28). The only
significant changes in the typicality of calls occurred during CTRL+ playbacks, with
long-finned pilot whales producing more graded calls, and during the only POST of
CTRL- playback (Figure 28). Therefore, behavioural responses to threatening or
disturbing acoustic stimuli did not appear to include clear compression of information
or increase in signal complexity.
Interestingly, we observed large changes in vocal behaviour during experiments
designed as negative controls (SILENT for sonar exposures and CTRL- for playback
experiments: Figure 28). Both kinds of experiment generated similar acoustic
disturbances: continuous broadband noise with most energy below 10 kHz. Vocal
responses to CTRL- and SILENT experiments could be compensatory mechanisms for
masking. For instance, gm13_169a produced exclusively one call type during CTRL-
playback, which was higher in frequency (most energy between the 30th and 35th Mel
filters, which corresponds to 12-17 kHz) than both the other call types recorded by the
tag and the frequency range with most energy in the CTRL- stimulus (below 10 kHz).
An alternative explanation would be that CTRL- playbacks reduced the signal to noise

206
ratio of low frequency calls, which results in only higher frequency calls being selected
for the fuzzy clustering.
It seems that a passing vessel can elicit changes in vocal behaviour in long-finned pilot
whales. Vocal responses to SILENT experiments occurred mostly during the POST
phase. We did not observe similar changes in vocal behaviour in response to sonar
exposures. Rather, the vocal behaviour of long-finned pilot whales during the POST of
sonar exposures differed only slightly from their vocal behaviour during PRE. It could
be that the presence of an intense acoustic stimulus (the sonar signals) elicited responses
which overcame the responses to the passing vessel.
The low sample size of some experiment types makes our results likely to be driven by
responses of single experiments. The confident generalisation of our conclusions will
require additional experiments.
5.6.2: Integration of vocal responses into the set of behavioural responses
The most common behavioural responses of long-finned pilot whales to naval sonar
were horizontal and vertical avoidance (Antunes et al., 2014; Wensveen et al., 2015a),
and cessation of foraging (Miller et al., 2012; Sivle et al., 2012). More behavioural
responses, with a higher probability to impact vital rates, were observed in response to
LFAS than in response to MFAS (Miller et al., 2012). The results on vocal behaviour
presented here showed that responses to LFAS exposure were very variable and that

207
they can be larger than responses to MFAS and LFASDS. Vocal responses to MFAS and
LFASDS were more consistent across individual than responses to LFAS. Miller and
colleagues (2012) detected no behavioural response in horizontal movements, diving
behaviour, and vocal activity to SILENT experiments. Our analysis showed that a
change in vocal activity and the types of calls produced may occur in response to an
approaching vessel (Figure 28).
Long-finned pilot whales were shown to match the frequency modulation pattern of
sonar signals with their calls (Miller et al., 2012; Alves et al., 2014). Alves and colleagues
(2014) observed sonar matching during exposure to MFAS and LFASDS. The call type
produced by long-finned pilot whales during MFAS exposure in tag deployments
gm08_150c and gm09_138b had narrower bandwidth and were closer in frequency
range to MFAS signals than the other call types recorded by the tags (Figure 22A: call
type increasing from the 20th to the 25th Mel filter, which corresponds to the 7-9 kHz
band and Figure 22B: call type with most energy between the 15th and 20th Mel filter,
which correspond to the 5-7 kHz band). The call type produced in response to LFASDS
in tag gm09_138b matched the frequency-modulation pattern of LFASDS signals, but
was in a higher frequency band (Figure 22B: decrease from the 20th to the 15th Mel
filter, equivalent to a 7 to 5 kHz decrease).
Previous analyses revealed that long-finned pilot whales increased their group size,
reduced inter-individual spacing, and approached the source broadcasting MEKW and

208
CTRL+ sounds, but that they barely responded to CTRL- playbacks (Curé et al., 2012,
2019). Here, we observed an increase in vocal activity during CTRL+ playbacks, as well
as during some MEKW playbacks (although changes in vocal activity were more
variable). Moreover, we found substantial vocal responses to CTRL-, with a reduction
of vocal activity during the playbacks, and the production of higher frequency calls in
one case (gm13_169a). No changes in additional behavioural metrics were reported for
this individual (Curé et al., 2019).
5.6.3: Comparison of vocal responses to naval sonar and killer whale sounds
Overall, we reported larger changes in vocal behaviour in response to sonar signals
than to MEKW sounds. However, the vocal changes observed during CTRL+ playbacks,
for which acoustic signals had the same structure as LFAS signal (1-2 kHz hyperbolic
upsweeps 1 s every 19s) but which were broadcasted at lower source levels (140-155 dB
root-mean-square re 1 µPa for CTRL+, 152-214 dB root-mean-square re 1 µPa for LFAS),
were smaller than responses observed during MEKW playbacks. Other responses of
long-finned pilot whales differed between sonar exposures and killer whale playbacks:
for instance, they avoided the source of sonar signals (Antunes et al., 2014), whereas
they approached the source of MEKW and CTRL+ playbacks (Curé et al., 2019). It could
be that differences in exposure conditions between sonar controlled exposure

209
experiments and playback experiments influenced the behavioural responses of long-
finned pilot whales.
During sonar exposures, the sound source was a large vessel which broadcasted intense
sounds while approaching the focal whales from large distances. The source vessel
could be perceived as a high-level threat, but the large initial distance between the
source vessel and the focal whale would allow the use of evasive manoeuvres (Visser et
al., 2016). Indeed, long-finned pilot whales did avoid the source vessel during sonar
exposures (Antunes et al., 2014). During playback experiments, the source vessel is
much smaller and stationary. Therefore, it could be perceived as a lower-risk threat
than sonar source vessels (Visser et al., 2016). Moreover, the closer distance between the
sound source and the focal whale may prevent the use of avoidance strategies. As a
result, long-finned pilot whales may switch to close-range strategies toward threats
such as the mobbing-like behaviour observed in response to playback (Curé et al., 2012,
2019).
Variations of the behavioural responses to different acoustic stimuli within each of these
two contexts may reflect the level of threat perceived. For instance, MEKW sounds seem
to be perceived as higher level threat than CTRL+ signals. Long-finned pilot whales
stopped foraging and approached both the source of MEKW and CTRL+ broadcasts,
however they increase group cohesion only in response to MEKW playbacks (Curé et al.,
2019). Similarly, the changes in vocal behaviour we observed in during MEKW

210
playbacks were larger than responses to CTRL+. A striking example is tagged whale
gm14_180 which produced the same call type during MEKW and CTRL+ playback, but
for which calls were more graded in response to CTRL+ than to MEKW.
Across the different types of sonar signals, we reported different vocal responses to
LFAS than to MFAS and LFASDS. Vocal responses to LFAS were the largest, but also
the most variable of responses to sonar signals. The call types used during LFAS also
differed from the call types produced during MFAS and LFASDS. Miller and colleagues
(2012) also reported that the responses to LFAS were stronger than the responses to
MFAS. Therefore, LFAS seems therefore to be perceived as a particularly harmful
stimulus, at least in some cases, compared to sonar signals in another frequency band
(MFAS) or with a different frequency modulation pattern (LFASDS). It could be that
LFAS signals resemble more typical MEKW calls. For gm14_180a, the call type
produced during CTRL+ playback (playback of LFAS signals) was the same as the call
type produced in response to MEKW playback.
The responses to sonar signals and killer whale sounds occurred mostly during sound
exposures: during POST, vocal behaviour was mostly back to PRE levels (Figure 28).
Such vocal responses could possibly be triggered by the acoustic stimulus itself. By
contrast, responses to control experiments (SILENT, CTRL+, and CTRL-) induced vocal
behaviour during POST (Figure 28).

211
5.6.4: Fuzzy-clustering-derived measures for the quantification of vocal behaviour.
The fuzzy clustering approach provides an advantageous method to quantify the
variations of vocal behaviour across conditions within a graded framework compared
to empirical operator-dependent classification methods (catalogues). The number of
fuzzy clusters is lower than the number of call types that a human operator may define
(Chapter 2). However, fuzzy clustering classification is much faster and objective than
the audio-visual inspection of sounds by trained operators, and the quantitative
information it yields can extend its classification into broad categories.
In some cases, the reduced number of clusters may preclude the detection of changes in
vocal behaviour. For instance, the vast majority of the calls from gm13_169b were
typical of one fuzzy cluster, and few changes in vocal behaviour were detected for this
deployment.
The strict call selection procedure required to run the fuzzy clustering made it more
suitable to study vocal responses to controlled exposures experiment than to playback
experiments. Indeed, experiment phases were longer for controlled exposure
experiments than for playbacks (40 vs. 15 minutes), which increases the number of call
available to characterise vocal behaviour. In addition, sonar stimuli have a low duty
cycle (1 s signals every 19 s), preventing too much overlap between the sound exposure
and the emitted vocalisations by the exposed whales, whereas playback stimuli are
much more continuous. As a result, we discarded more calls because of overlap with
212
the experiment stimuli for playbacks than for controlled exposures, which further
reduced the number of calls available to describe vocal behaviour during playbacks.
New generations of active sonar generating continuous signals (continuous active sonar,
or CAS) are being developed to improve target detection. This raises further concerns
about how CAS might affect the behaviour of cetaceans. In addition to the experiments
presented in this study, we also exposed one group of long-finned pilot whales to
continuous active sonar (CAS). CAS signals were 19-second-long 1 to 2 kHz hyperbolic
upsweeps separated by 1 s silences. Due to its high duty cycle, CAS incurs a higher risk
to mask biological signals than pulsed sonar (such as LFAS, MFAS, and LFASDS) and it
would be particularly interesting to compare vocal responses to CAS and pulsed sonars.
Preliminary analyses of this single conducted CAS exposure experiment indicated an
increase in swimming speed and a possible switch of vocal production towards higher
frequency calls during exposure to CAS (pers. obs.). The inclusion of continuous sonar
in the fuzzy clustering framework will require some modifications of the procedure to
accommodate the continuous nature of CAS which therefore overlaps all of the calls.
Moreover, additional experiments would need to be conducted to be able to reach
conclusions.

213
5.7: Aknowledgments
This study is part of the 3S (Sea mammal Sonar Safety) research project which was
funded by: the United States Office of Naval Research, the Royal Norwegian Navy, the
Norwegian Ministry of Defence, the Defence Research and Development Department of
the Netherlands Ministry of Defence, and the French Ministry of Defence (DGA). We
are grateful for the 3S scientific crew for their continuous efforts on the field and outside
over the years. All experiments were conducted with permission from the Norwegian
Animal Research Authority, and ethical approval from the University of Saint Andrews
Animal Welfare and Ethics committee.

214
6: GENERAL DISCUSSION
My Ph.D. was centred on two research questions. First, how do cetaceans respond to
heterospecific sounds? Second, how do responses to heterospecific sounds compare to
how they respond to anthropogenic sounds?
With these questions in mind, I took part in an international effort within the 3S (Sea
mammal Sonar Safety) consortium to equip free-ranging cetaceans, including
humpback and long-finned pilot whales, in northern Norway with sound and
movement recording tags, and to expose them to playbacks of killer whale sounds and
to transmissions of naval sonar in controlled experimental conditions.
6.1: Responses of cetaceans to heterospecific sounds
To study the responses of cetaceans to heterospecific sounds, I focused on how
humpback and long-finned pilot whales responded to playback of killer whale sounds.
Killer whales are a cosmopolitan marine apex predator, which can prey upon a large
variety of prey including most cetacean species. However not all interactions between
killer whales and cetaceans are predatory (reviewed in Jefferson et al., 1991). Indeed,
distinct killer whale ecotypes that exist in some populations have dietary
specialisations: some prey upon marine mammals, while others feed on fish (reviewed
in de Bruyn et al., 2013). These different killer whale ecotypes also have differences in
production of sounds including vocal behaviour (Deecke et al., 2005; Foote and Nystuen,
215
2008; Deecke et al., 2011; Filatova et al., 2015a). Therefore, killer whale sounds may
indicate a wide range of ecological consequences for other cetacean species. In the first
part of my Ph.D., I investigated whether and how humpback whales discriminate
between the sounds of different killer whale ecotypes.
Most cetacean species are reported to react strongly to playback of killer whale sounds.
Behavioural responses include horizontal approach or avoidance, changes in diving
activity, interruption of foraging and resting, and modifications of social and vocal
behaviour (Table 11). The ability to discriminate acoustically between the sounds of
killer whale ecotypes has been demonstrated in species from both suborders of
cetaceans: the mysticetes, or baleen whales and the odontocetes, or toothed whales.
Indeed, humpback whales (chapter 1 of this thesis) and long-finned pilot whales (Curé
et al., 2019) showed different behavioural responses to playback of the sounds of
familiar killer whales from a non-predatory ecotype and of unfamiliar killer whales of a
potentially predatory ecotype. The same ability was demonstrated in harbour seals
(pinnipeds): individuals avoided the source of familiar mammal-eating killer whale and
unfamiliar fish-eating killer whale sounds, but not the source of familiar fish-eating
killer whales (Deecke et al., 2002). Although the ability to discriminate between the
sounds of killer whale ecotypes is present in widespread families of marine mammals,
some species respond to killer whale sounds in a generic manner. Belugas and grey
whales showed strong aversive responses to playback of unfamiliar fish-eating killer

216
whales (Table 11). Such findings support Deecke’s (2002) conclusion that non-familiar
killer whales are perceived as a threat by potential prey, but that prey can learn that the
specific sounds produced by non-threatening killer whales do not pose a threat.
In my Ph.D. work, I found that humpback whales responded differently to the sounds
of herring-feeding killer whales, a familiar food competitor, and the sounds of marine
mammal-eating killer whales, an unfamiliar potential predator, demonstrating that they
were able to discriminate between the two types of killer whale stimuli (chapter 1).
Humpback whales consistently approached the sound source and dove deeper during
playback of herring-feeding killer whale sounds, while they tended to avoid, often
strongly, the source of mammal-eating killer whale sounds. The responses of humpback
whales to mammal-eating killer whale sounds were further influenced by the context of
the playback presentation: avoidance responses were strongest during summer in an
offshore area, while they were mitigated during winter in the Norwegian fjords, and the
vertical diving aspect of the responses differed between these two contexts. I posited
two possible explanations for this difference in behavioural response to mammal-eating
killer whale sounds between presentation contexts. First, the lipid-store body condition
of humpback whales during summer, after one breeding season and two migrations
without foraging, is worse than during winter, at the end of the feeding season.
Therefore, humpback whales in summer are both more vulnerable to killer whale
attacks and under a stronger pressure to feed than in winter, which could affect their

217
decision-making process. Alternatively, the presence of herring-feeding killer whales in
large numbers during winter in the fjords may reduce the ability of humpback whales
to consistently recognise mammal-eating killer whales as a threat.
6.2: Responses of cetaceans to anthropogenic sounds
To study the behavioural responses of cetaceans to anthropogenic sounds, I focused in
the second part of my Ph.D. on how long-finned pilot whales responded to naval sonar
signals. Naval sonar signals have been of particularly concern because they are
generated at high source levels and have been associated with a wide range of
pathological and behavioural impacts on cetaceans(reviewed in Southall et al., 2016).
Cetaceans exhibit a wide range of behavioural responses to sonar. Avoidance and
interruption of activity appear to be the most common responses, but changes in social
and vocal behaviour are also frequent (Table 11). The type and severity of behavioural
responses to sonar vary between cetacean species. Some species, such as beaked whales,
are very sensitive to sonar and display severe behavioural responses even at moderate
received levels. Beaked whales avoid the source of naval sonar for tens of kilometres
and may not return to the ensonified areas for several days (Miller et al., 2015). They
stop foraging and vocalising in response to controlled sonar exposure experiments, and
this response continues for several hours after the end of sonar exposures (Southall et
al., 2016; Wensveen et al., 2019). Other species appear to be much less sensitive to sonar.

218
For instance, humpback whales and long-finned pilot whales exhibit shorter
behavioural responses which initiate at higher received levels (Miller et al., 2012; Sivle
et al., 2015).
Within species, the type and severity of behavioural responses to sonar vary according
to various factors including signal type, behavioural context, and exposure conditions
(Table 11). The influence of signal type on behavioural response differs between species
(Harris et al., 2015). For instance, sperm whales ceased foraging in response to 1-2 kHz
sonar but not during 6-7 kHz sonar transmissions (Miller et al., 2012). Behavioural
responses also vary according to the behavioural state of cetaceans. For instance, blue
whales were more responsive to 2.5-4 kHz sonar when foraging at depth than when
foraging at the surface or not foraging (Goldbogen et al., 2013). The specific conditions
of exposure to naval sonar also influence the behavioural responses of cetaceans.
Humpback whales were more responsive to the first sonar exposure than to subsequent
ones (Sivle et al., 2015), and humpback groups with calves were more likely to avoid
sonars (Wensveen et al., 2017). The most severe behavioural response to sonar was
observed in killer whales, the separation of a calf from its group, and it occurred during
an 6-7 kHz sonar exposure which started closer to the animals than usual and took
place in a particularly narrow fjord (Miller et al., 2012).
In my Ph.D. work, I identified and compared the vocal responses of long-finned pilot
whales to naval sonar exposures and playback of killer whale sounds. Long-finned pilot

219
whales are group-living cetaceans which are vocally active in almost all behavioural
contexts (Visser et al., 2017). They produce a large variety of tonal, pulsed, and noisy
sounds, as well as intermediate sounds between these categories, which are associated
within vocalisations. Their large vocal repertoire contains some stereotyped calls, but
most calls are of a graded nature which renders classification difficult. The first step of
the analysis of long-finned pilot whale vocal behaviour in this thesis was the
development of an unsupervised classification algorithm, based upon fuzzy clustering
of Mel frequency cepstral coefficients. Fuzzy clustering provides a mechanism to
account for the graded nature of long-finned pilot whale calls (chapter 2 of this thesis).
In chapter 3, this algorithm was then used to describe the vocal responses of long-
finned pilot whales to naval sonar exposures and playback of marine mammal-eating
killer whale sounds. I observed diverse changes in the vocal behaviour of long-finned
pilot whales in response to all sound stimuli (Figure 28). Vocal activity increased during
and after exposure to 1 to 2 kHz low frequency active sonar, and decreased after silent
vessel approaches. In addition, the vocal responses to 1 to 2 kHz naval sonar differed
from the responses to 2 to 1 and 6 to 7 kHz pulsed active sonars (5% duty cycle), and
were similar between playbacks of mammal-eating killer whale sounds and playbacks
of 1 to 2 kHz hyperbolic upsweep signals. I did not detect specific response signals such
as general alarm or recruitment calls, nor stimulus-specific call types, across experiment
replicates.

220
6.3: Comparison of responses to heterospecific and anthropogenic sounds
One hypothetical framework to analyse the biological relevance of behavioural
responses to sonar relies on the principle that costly behavioural responses to a risk-
related stimulus are adaptive if the long-term benefits of the response exceed its short-
term costs: the cost of the response itself and the loss of the fitness-enhancing benefits of
the interrupted behaviour (Lima and Dill, 1990). Thus, the intensity of behavioural
responses scales with the perceived risk associated to a given stimulus. For instance,
costly behavioural responses to stimuli which indicate a heightened risk of predation
have evolved because the long-term benefits of surviving overcome the costs of the
responses. Therefore, comparing the behavioural responses to anthropogenic sounds,
such as naval sonar, with the behavioural responses to natural threatening stimuli
which indicate a heightened risk of predation, such as killer whale sounds for cetaceans,
provides a framework to interpret the biological significance of animals’ behavioural
responses to anthropogenic sounds to animals (Frid and Dill, 2002).
Behavioural responses to naval sonar and killer whale sounds do have some similarities
(Table 11). Humpback whales showed horizontal avoidance responses and cessation of
foraging in response to both acoustic stimuli (chapter 1; Curé et al., 2015; Sivle et al.,
2015). The responses of sperm whales to 1-2 kHz naval sonar and killer whale sounds
were also similar: horizontal avoidance, cessation of foraging, and increase in the
production of social sounds (Curé et al., 2016; Isojunno et al., 2016). The consistency and

221
intensity of behavioural responses to killer whale sounds are generally higher than to
naval sonar. Humpback whales avoided the sound source in seven out of eight
playbacks of killer whale sounds, whereas they avoided the source of naval sonar in just
25-50 % of exposures (Curé et al., 2015; Sivle et al., 2015; Wensveen et al., 2017). In
sperm whales, only playback of killer whale sounds elicited social grouping responses
(Curé et al., 2016), and responses to killer whale sounds extended for longer after the
end of the stimulus presentation than responses to naval sonar (Isojunno et al., 2016).
The responses of long-finned pilot whales to playback of naval sonar signals were
intermediate between the response to familiar fish-eating killer whales, a potential
competitor for habitat use, and unfamiliar marine mammal-eating killer whales, a
potential predator (Curé et al., 2019). They included joining with other subgroups (as in
response to fish-eating killer whale sounds) and cessation of foraging (as in response to
marine mammal-eating killer whale sounds). From these results, it appears that naval
sonar is perceived as a threat by cetaceans, but that the level of threat perceived is less
acute than the heightened risk of predation associated with the reception of potentially
predatory killer whale sounds.
Some parts of the behavioural responses match between sonar exposure and predation
risk indicators; however, there is not a strict concordance. Both killer whale sounds and
naval sonar exposure provoke some specific behavioural responses. For instance, long-
finned pilot whales approached the source of killer whale sounds and playback of naval
222
sonar signals transmitted from a drifting boat, but avoided sonar sources transmitted
from a moving vessel during controlled exposure experiments (Miller et al., 2012; Curé
et al., 2019). Long-finned pilot whales gradually switched call types in response to both
naval sonar exposure and killer whale playback, but the magnitude of the change in call
type usage was greater in response to naval sonar than in response to playback of killer
whale sounds (chapter 3). Long-finned pilot whale increase group size and cohesion in
response to naval sonar exposure, tagging procedures, and killer whale playbacks;
however they had disturbance-specific social responses (Visser et al., 2016). They
increased vocal rate and approached the source of killer whale sounds; they increased
surface resting and avoided the source of naval sonar; and they reduced surface logging
and decrease vocal activity after tagging attempts (Visser et al., 2016). Playback stimuli
were broadcasted by a small drifting vessel at medium range (around 800 m), naval
sonar were transmitted by a large vessel which approached from large initial ranges,
and tagging attempts involved repeated close-range approaches by a small vessel
(Visser et al., 2016). The conditions of stimulus presentation, such as the source size and
movement patterns, or the source levels of the broadcast, are relevant in the decision-
making of responding individuals, and need to be included in the interpretation of the
biological significance of behavioural responses to anthropogenic stimuli.

223
6.4: Methodological considerations
Overall, I had to work with datasets containing limited sample sizes during my Ph.D.: 4,
6, and 8 playbacks of killer whale sounds in Chapter 1 and between 2 and 5 replicates of
each sound stimulus in Chapter 3. Gathering data is a global challenge in the study of
the behaviour of free-ranging marine mammals. Over the course of my Ph.D., I took
part in three fieldwork campaigns. The first one, in January 2017, was successful: over
two weeks, we deployed two tags on humpback whales and performed four sound
exposure experiments. In January 2018, the distribution of the study species had
changes and we had to relocate the fieldwork site: over two weeks, and though we
managed to deploy one tag on a humpback whale but could not perform any sound
exposure experiment. In summer 2017, over five weeks of fieldwork, we tagged a single
long-finned pilot whale and the tag came off before we could do any sound exposure
experiment (although we did tag sperm whales and exposed them to naval sonar). As a
result, I had to work on low sample sizes with partially dependent samples, due to
imperfect replication schemes, and finding adapted statistical approaches to support
my results has been a fundamental challenge in this thesis research.
However, marine mammal science is also an especially satisfying area of research.
Every successful experiment is the result of team hard work and cooperation in
successive steps: location of cetaceans, tag deployment, visual tracking, sound exposure
experiment, and tag recovery. The datasets combining the record of the multiple
224
sensors of the tags and visual observations from the deck of the research vessel swarm
with details to look at to get insight into how cetaceans perceive their environment and
interact with each other. Each fieldwork campaign builds on the successes and failures
of the previous ones, as well as on the rapid development of tags and data processing
and analysis methods (e.g. Wensveen et al., 2015a; von Benda-Beckmann et al., 2016;
Cade et al., 2018).

225
Species Responses to heterospecific sounds
(killer whale sounds)
Responses to anthropogenic sounds
(naval sonars)
Mysticetes Humpback whale
Megaptera novaeangliae
Approach (familiar FEKW)
Deeper dives (familiar FEKW)
Avoidance responses (unfamiliar MEKW)9
Responses influenced by context of presentation
Avoidance (1-2 and 6-7 kHz)11
Cessation of foraging(1-2 and 6-7 kHz)11
Lengthening of songs (150-320 Hz)14
Habituation over successive exposures11
Blue whale
Balaenoptera musculus
Directional movement away from source (2.5-4 kHz)14
Alteration of diving behaviour14
Responses influenced by behavioural state14
Grey whale
Eschrichtius robustus Avoidance (unfamiliar FEKW)1 Localised avoidance14
Odontocetes Beaked whales Prolonged avoidance10,14,19
(Approaches at low received levels)19
Prolonged cessation of foraging and vocal activity10,14,19
Long ascent phases10,14,19
Longest and deepest dive recorded for northern
bottlenose whales Hyperoodon ampullatus (1-2 kHz)10,14
Long-finned pilot whale
Globicephala melas Approach (all killer whale sounds)6,18
Join other groups (familiar FEKW)6,15,18
Cessation of foraging (unfamiliar MEKW)18
Increase in group cohesion (unfamiliar MEKW)15,18
Changes in call type usage (unfamiliar MEKW)
Avoidance (1-2 kHz, 6-7 kHz)4,8,12,14
Increase in group size and cohesion (1-2 kHz,
6-7 kHz)4,15
Variations of vocal activity (1-2 kHz, 6-7 kHz)4,8,15
Matching of sonar signals (1-2 kHz, 6-7 kHz)4,8
Changes in call type usage (1-2 kHz, 6-7 kHz)
Cessation of foraging (1-2 kHz)4,5,14
Return to normal behaviour after exposure4,8
Sperm whale
Physeter microcephalus Horizontal avoidance (unfamiliar MEKW)13
Cessation of foraging (unfamiliar MEKW)13,16
Cessation of resting (unfamiliar MEKW)13,16
Increase in social sound production (unfamiliar
MEKW)13
Horizontal avoidance (1-2, 6-7 kHz)13,14
Increase in social sound production (1-2, 6-7 kHz)13
Cessation of foraging (1-2 kHz)5,14,16
Cessation of resting (1-2 kHz)5,14,16

226
Grouping behaviour (unfamiliar MEKW)13
Responses prolonged after end of playback13
Short-finned pilot whales
Globicephala macrorhychos Approach (unfamiliar MEKW)17
Stronger responses to calls containing non-linear
phenomena17
Risso’s dophins
Grampus griseus Avoidance (unfamiliar MEKW)17
Stronger responses to calls containing non-linear
phenomena17
Killer whale
Orcinus orca No response (familiar FEKW conspecifics)5 Avoidance responses (1-2, 6-7 kHz)5,14
Increase in call rate (1-2, 6-7 kHz)5
Shift to high frequency whistles (1-2, 6-7 kHz)5
Increase in group cohesion (1-2, 6-7 kHz)5
Interruption of foraging (6-7 kHz)5,14
Separation of one calf from its group (6-7 kHz)5,14
Beluga whale
Delphinapterus leucas Avoidance (FEKW)2
Silencing (FEKW)2
Pinnipeds Harbour seal
Phoca vitulina Avoidance (unfamiliar MEKW)3
Avoidance (unfamiliar FEKW)3
No response (familiar FEKW)3
Table 11: Responses of marine mammals to heterospecific sounds (killer whale sounds) and anthropogenic sounds (naval sonars).
FEKW: fish-eating killer whale sounds; MEKW: marine mammal-eating killer whale sounds. Results for this Ph.D. are shown in bold.
Sources: 1: Cummings and Thompson, 1971; 2: Fish and Vania, 1971; 3: Deecke et al., 2002; 4: Miller et al., 2012; 5: Sivle et al., 2012; 6:
Curé et al., 2013; 7: Alves et al., 2014; 8: Antunes et al., 2014; 9: Curé et al., 2015; 10: Miller et al., 2015; 11: Sivle et al., 2015; 12:
Wensveen et al., 2015a; 13: Curé et al., 2016; 14: Southall et al., 2016; 15: Visser et al., 2016; 16: Isojunno et al., 2016; 17: Bowers et al.,
2018; 18: Curé et al., 2019; 19: Wensveen et al., 2019

227
6.5: Conclusion
Cetaceans are able to process the sounds produced by other species to infer information
about their ecological relationship with the vocalising individuals, and respond in
appropriate ways. The fineness of the information they obtain from heterospecific
sounds vary across species, but fine discrimination abilities exist in both mysticete and
odontocete cetaceans.
Among the many behavioural responses observed to anthropogenic sounds, some are
reminiscent of anti-predator behaviours and draw the picture of anthropogenic sounds
being perceived as a threat not as acute as predation risk. However, some aspects of
behavioural responses are specific to natural or anthropogenic stimuli.
More information is necessary to get a more detailed insight of interspecific acoustic
interactions in cetaceans and of the impacts of anthropogenic sounds on marine
environments.
Additional playbacks of killer whale sounds from different ecotypes would be
necessary to highlight which acoustic features underlie the discriminative abilities of
humpback whales and other species. We hypothesised that tail slaps and echolocation
clicks were key elements for the identification of herring-feeding killer whales by their
sounds. How would humpback whales react to chimera stimuli, such as mammal-
eating killer whale sounds associated with tail slaps and/or echolocation clicks, or
herring-feeding killer whale calls alone? Playback of the sounds of other species than

228
killer whales may be used to discover whether cetaceans respond to all unfamiliar
whale sounds in the same way, or if they can make some sort of inference from the
acoustic properties of the sounds, such as determining the size of the callers, or their
number.
More behavioural response studies are needed to untangle the behavioural response of
cetaceans to naval sonars. Varying the exposure conditions, such as the signal type
(frequency range, frequency modulation pattern, source level, duty cycle, etc.), the size
and movement pattern of the source vessel, and the ecological context of the exposure
(behavioural state, topography, breeding vs. feeding grounds, etc.) could provide
important insight into how cetaceans perceive and respond to naval sonar.

229
7: REFERENCES
Alves, A., Antunes, R., Bird, A., Tyack, P.L., Miller, P.J.O., Lam, F.-P.A., and Kvadsheim, P.H.
(2014). Vocal matching of naval sonar signals by long-finned pilot whales (Globicephala
melas). Marine Mammal Science 30, 1248–1257.
Alves, L.C.P. de S., Moreira, S., Simões-Lopes, P.C., and Andriolo, A. (2010). Behavioral
responses of humpback whales, Megaptera novaeangliae (Cetacea: Balaenopteridae), to
satellite transmitter deployment procedures. Zoologia 27, 1–6.
Amo, L., Galván, I., Tomás, G., and Sanz, J.J. (2008). Predator odour recognition and avoidance
in a songbird. Functional Ecology 22, 289–293.
Amos, B., Schlötterer, C., and Tautz, D. (1993). Social Structure of Pilot Whales Revealed by
Analytical DNA Profiling. Science 260, 670–672.
Andriolo, A., Zerbini, A.N., Moreira, S., Pizzorno, J.L., Danilewicz, D., Maia, Y.G., Mamede, N.,
de Castro, F.R., and Clapham, P. (2014). What do humpback whales Megaptera
novaeangliae (Cetartiodactyla: Balaenopteridae) pairs do after tagging? Zoologia 31, 105–
113.
Antunes, R., Kvadsheim, P.H., Lam, F.P.A., Tyack, P.L., Thomas, L., Wensveen, P.J., and Miller,
P.J.O. (2014). High thresholds for avoidance of sonar by free-ranging long-finned pilot
whales (Globicephala melas). Marine Pollution Bulletin 83, 165–180.
Au, W.W.L., Pack, A.A., Lammers, M.O., Herman, L.M., Deakos, M.H., and Andrews, K. (2006).
Acoustic properties of humpback whale songs. The Journal of the Acoustical Society of
America 120, 1103–1110.

230
Augusto, J.F., Frasier, T.R., and Whitehead, H. (2013). Using photography to determine sex in
pilot whales (Globicephala melas) is not possible: Males and females have similar dorsal
fins. Marine Mammal Science 29, 213–220.
Baird, R.W., Abrams, P.A., and Dill, L.M. (1992). Possible Indirect Interactions between
Transient and Resident Killer Whales: Implications for the Evolution of Foraging
Specializations in the Genus Orcinus. Oecologia 89, 125–132.
Baker, C.S., and Herman, L.M. (1984). Seasonal contrast in the social behaviour of the humpback
whale. Cetus 5, 14–16.
Barrett-Lennard, L.G., Ford, J.K.B., and Heise, K.A. (1996). The mixed blessing of echolocation:
differences in sonar use by fish-eating and mammal-eating killer whales. Animal
Behaviour 51, 553–565.
Beck, S., Kuningas, S., Esteban, R., and Foote, A.D. (2012). The influence of ecology on sociality
in the killer whale (Orcinus orca). Behavioral Ecology 23, 246–253.
von Benda-Beckmann, A.M., Wensveen, P.J., Samarra, F.I.P., Beerens, S.P., and Miller, P.J.O.
(2016). Separating underwater ambient noise from flow noise recorded on stereo
acoustic tags attached to marine mammals. The Journal of Experimental Biology 219,
2774–2774.
Berchok, C.L., Bradley, D.L., and Gabrielson, T.B. (2006). St. Lawrence blue whale vocalizations
revisited: Characterization of calls detected from 1998 to 2001. The Journal of the
Acoustical Society of America 120, 2340–2354.
Billings, A.C., Greene, E., and De La Lucia Jensen, S.M. (2015). Are chickadees good listeners?
Antipredator responses to raptor vocalizations. Animal Behaviour 110, 1–8.

231
Bouchard, B., Barnagaud, J.-Y., Poupard, M., Glotin, H., Gauffier, P., Torres Ortiz, S., Lisney,
T.J., Campagna, S., Rasmussen, M., and Célérier, A. (2019). Behavioural responses of
humpback whales to food-related chemical stimuli. PLoS ONE 14, e0212515.
Bowers, M.T., Friedlaender, A.S., Janik, V.M., Nowacek, D.P., Quick, N.J., Southall, B.L., and
Read, A.J. (2018). Selective reactions to different killer whale call categories in two
delphinid species. The Journal of Experimental Biology 221, jeb162479.
Bradbury, J.W., and Vehrencamp, S.L. (2011). Principles of animal communication (Sunderland,
Mass: Sinauer Associates).
Braune, P., Schmidt, S., and Zimmermann, E. (2008). Acoustic divergence in the communication
of cryptic species of nocturnal primates (Microcebus ssp.). BMC Biology 6, 19.
Brown, J.C., and Miller, P.J.O. (2007). Automatic classification of killer whale vocalizations
using dynamic time warping. The Journal of the Acoustical Society of America 122,
1201–1207.
Bruinderink, G.W.T.A.G., and Hazebroek, E. (1996). Ungulate Traffic Collisions in Europe.
Conservation Biology 10, 1059–1067.
de Bruyn, P.J.N., Tosh, C.A., and Terauds, A. (2013). Killer whale ecotypes: is there a global
model? Biological Reviews 88, 62–80.
Cade, W.H., and Cade, E.S. (1992). Male mating success, calling and searching behaviour at high
and low densities in the field cricket, Gryllus integer. Animal Behaviour 43, 49–56.
Cade, D.E., Friedlaender, A.S., Calambokidis, J., and Goldbogen, J.A. (2016). Kinematic
Diversity in Rorqual Whale Feeding Mechanisms. Current Biology 26, 2617–2624.

232
Cade, D.E., Barr, K.R., Calambokidis, J., Friedlaender, A.S., and Goldbogen, J.A. (2018).
Determining forward speed from accelerometer jiggle in aquatic environments. J. Exp.
Biol. 221, jeb170449.
Clapham, P.J., and Mead, J.G. (1999). Megaptera novaeangliae. Mammalian Species 604, 1–9.
Clemins, P.J., and Johnson, M.T. (2006). Generalized perceptual linear prediction features for
animal vocalization analysis. The Journal of the Acoustical Society of America 120, 527–
534.
Collier, K., Radford, A.N., Townsend, S.W., and Manser, M.B. (2017). Wild dwarf mongooses
produce general alert and predator-specific alarm calls. Behavioral Ecology 28, 1293–
1301.
Corcoran, A.J., and Conner, W.E. (2017). Predator counteradaptations: stealth echolocation
overcomes insect sonar-jamming and evasive-manoeuvring defences. Animal Behaviour
132, 291–301.
Cox, T.M., Ragen, T.J., Read, A.J., Vos, E., Baird, R.W., Balcomb, K., Barlow, J., Caldwell, J.,
Cranford, T., Crum, L., et al. (2006). Understanding the impacts of anthropogenic noise
on beaked whales. Journal of Cetacean Research and Management 7, 177–187.
Cummings, W.C., and Thompson, P.O. (1971). Gray whales, Eschrichtius robustus, avoid the
underwater sounds of killer whales, Orcinus orca. Fishery Bulletin 69, 525–530.
Cunningham, S., and Magrath, R.D. (2017). Functionally referential alarm calls in noisy miners
communicate about predator behaviour. Animal Behaviour 129, 171–179.

233
Curé, C., Antunes, R., Samarra, F., Alves, A.C., Visser, F., Kvadsheim, P.H., and Miller, P.J.O.
(2012). Pilot Whales Attracted to Killer Whale Sounds: Acoustically-Mediated
Interspecific Interactions in Cetaceans. PLoS ONE 7, e52201.
Curé, C., Antunes, R., Alves, A.C., Visser, F., Kvadsheim, P.H., and Miller, P.J.O. (2013).
Responses of male sperm whales (Physeter macrocephalus) to killer whale sounds:
implications for anti-predator strategies. Scientific Reports 3, 1579.
Curé, C., Sivle, L.D., Visser, F., Wensveen, P.J., Isojunno, S., Harris, C.M., Kvadsheim, P.H.,
Lam, F.-P.A., and Miller, P.J.O. (2015). Predator sound playbacks reveal strong
avoidance responses in a fight strategist baleen whale. Marine Ecology Progress Series
526, 267–282.
Curé, C., Isojunno, S., Visser, F., Wensveen, P.J., Sivle, L.D., Kvadsheim, P.H., Lam, F.P.A., and
Miller, P.J.O. (2016). Biological significance of sperm whale responses to sonar:
comparison with anti-predator responses. Endangered Species Research 31, 89–102.
Curé, C., Isojunno, S., Vester, H.I., Visser, F., Oudejans, M., Biassoni, N., Massenet, M., Barluet
de Beauchesne, L., Wensveen, P.J., Sivle, L.D., et al. (2019). Evidence for discrimination
between feeding sounds of familiar fish and unfamiliar mammal-eating killer whale
ecotypes by long-finned pilot whales. Anim Cogn 22, 863–882.
Curio, E., Ernst, U., and Vieth, W. (1978). Cultural Transmission of Enemy Recognition: One
Function of Mobbing. Science 202, 899–901.
Dawson Pell, F.S.E., Potvin, D.A., Ratnayake, C.P., Fernández-Juricic, E., Magrath, R.D., and
Radford, A.N. (2018). Birds orient their heads appropriately in response to functionally
referential alarm calls of heterospecifics. Animal Behaviour 140, 109–118.

234
De Stephanis, R., Verborgh, P., Pérez, S., Esteban, R., Minvielle-Sebastia, L., and Guinet, C.
(2008). Long-term social structure of long-finned pilot whales (Globicephala melas) in the
Strait of Gibraltar. Acta Ethologica 11, 81–94.
De Stephanis, R., Giménez, J., Esteban, R., Gauffier, P., García-Tiscar, S., Sinding, M.-H.S., and
Verborgh, P. (2015). Mobbing-like behavior by pilot whales towards killer whales: a
response to resource competition or perceived predation risk? Acta Ethologica 18, 69–78.
Deecke, V.B., and Janik, V.M. (2006). Automated categorization of bioacoustic signals: Avoiding
perceptual pitfalls. The Journal of the Acoustical Society of America 119, 645–653.
Deecke, V.B., Ford, J.K.B., and Spong, P. (1999). Quantifying complex patterns of bioacoustic
variation: Use of a neural network to compare killer whale (Orcinus orca) dialects. The
Journal of the Acoustical Society of America 105, 2499–2507.
Deecke, V.B., Slater, P.J.B., and Ford, J.K.B. (2002). Selective habituation shapes acoustic
predator recognition in harbour seals. Nature 420, 171–173.
Deecke, V.B., Ford, J.K.B., and Slater, P.J.B. (2005). The vocal behaviour of mammal-eating killer
whales: communicating with costly calls. Animal Behaviour 69, 395–405.
Deecke, V.B., Nykänen, M., Foote, A.D., and Janik, V.M. (2011). Vocal behaviour and feeding
ecology of killer whales Orcinus orca around Shetland, UK. Aquat. Biol. 13, 79–88.
DeRuiter, S.L., Boyd, I.L., Claridge, D.E., Clark, C.W., Gagnon, C., Southall, B.L., and Tyack, P.L.
(2013). Delphinid whistle production and call matching during playback of simulated
military sonar. Marine Mammal Science 29, E46–E59.

235
Dunlop, R.A., Noad, M.J., Cato, D.H., and Stokes, D. (2007). The social vocalization repertoire of
east Australian migrating humpback whales (Megaptera novaeangliae). The Journal of the
Acoustical Society of America 122, 2893–2905.
Dunlop, R.A., Cato, D.H., Noad, M.J., and Stokes, D.M. (2013). Source levels of social sounds in
migrating humpback whales (Megaptera novaeangliae). The Journal of the Acoustical
Society of America 134, 706–714.
Dunlop, R.A., Noad, M.J., McCauley, R.D., Kniest, E., Paton, D., and Cato, D.H. (2015). The
Behavioural Response of Humpback Whales (Megaptera novaeangliae) to a 20 Cubic Inch
Air Gun. Aquatic Mammals 41, 412–433.
Dutour, M., Léna, J.-P., and Lengagne, T. (2017). Mobbing calls: a signal transcending species
boundaries. Animal Behaviour 131, 3–11.
Evans, T.A., Inta, R.A., Lai, J.C.S., Prueger, S., Foo, N.W., Fu, E.W., and Lenz, M. (2009).
Termites eavesdrop to avoid competitors. Proceedings of the Royal Society B: Biological
Sciences 276, 4035–4041.
Fearnbach, H., Durban, J.W., Ellifrit, D.K., Waite, J.M., Matkin, C.O., Lunsford, C.R., Peterson,
M.J., Barlow, J., and Wade, P.R. (2014). Spatial and social connectivity of fish-eating
“Resident” killer whales (Orcinus orca) in the northern North Pacific. Marine Biology
161, 459–472.
Filatova, O.A., Miller, P.J.O., Yurk, H., Samarra, F.I.P., Hoyt, E., Ford, J.K.B., Matkin, C.O., and
Barrett-Lennard, L.G. (2015a). Killer whale call frequency is similar across the oceans,
but varies across sympatric ecotypes. The Journal of the Acoustical Society of America
138, 251–257.

236
Filatova, O.A., Borisova, E.A., Shpak, O.V., Meschersky, I.G., Tiunov, A.V., Goncharov, A.A.,
Fedutin, I.D., and Burdin, A.M. (2015b). Reproductively Isolated Ecotypes of Killer
Whales Orcinus orca in the Seas of the Russian Far East. Biology Bulletin 42, 674–681.
Finneran, J.J. (2015). Noise-induced hearing loss in marine mammals: A review of temporary
threshold shift studies from 1996 to 2015. The Journal of the Acoustical Society of
America 138, 1702–1726.
Fish, J.F., and Vania, J.S. (1971). Killer whale, Orcinus orca, sounds repel white whales,
Delphinapterus leucas. Fishery Bulletin 69, 531–536.
Florez-Gonzalez, L., Capella, J.J., and Rosenbaum., H.C. (1994). Attack of killer whales (Orcinus
orca) on humpback whales (Megaptera novaeangliae) on a South American Pacific
breeding ground. Marine Mammal Science 10, 218–222.
Foote, A.D., and Nystuen, J.A. (2008). Variation in call pitch among killer whale ecotypes. The
Journal of the Acoustical Society of America 123, 1747–1752.
Foote, A.D., Vilstrup, J.T., de Stephanis, R., Verborgh, P., Nielsen, S.C.A., Deaville, R., Kleivane,
L., Martín, V., Miller, P.J.O., Øien, N., et al. (2011). Genetic differentiation among North
Atlantic killer whale populations. Molecular Ecology 20, 629–641.
Foote, A.D., Vester, H., Víkingsson, G.A., and Newton, J. (2012). Dietary variation within and
between populations of northeast Atlantic killer whales, Orcinus orca, inferred from δ13C
and δ15N analyses. Marine Mammal Science 28, E472–E485.
Ford, J.K.B. (1984). Call traditions and dialects of killer whales (Orcinus orca) in British
Columbia. University of British Columbia.

237
Ford, J.K.B. (1989). Acoustic behaviour of resident killer whales (Orcinus orca) off Vancouver
Island, British Columbia. Can. J. Zool. 67, 727–745.
Ford, J.K.B. (1991). Vocal traditions among resident killer whales (Orcinus orca) in coastal waters
of British Columbia. Can. J. Zool. 69, 1454–1483.
Ford, J.K.B., and Reeves, R.R. (2008). Fight or flight: antipredator strategies of baleen whales.
Mammal Review 38, 50–86.
Ford, J.K.B., Ellis, G.M., Matkin, D.R., Balcomb, K.C., Briggs, D., and Morton, A.B. (2005). Killer
Whale Attacks on Minke Whales: Prey Capture and Antipredator Tactics. Marine
Mammal Science 21, 603–618.
Francis, C.D., Ortega, C.P., and Cruz, A. (2009). Noise Pollution Changes Avian Communities
and Species Interactions. Current Biology 19, 1415–1419.
Frankel, A.S., and Clark, C.W. (2000). Behavioral responses of humpback whales (Megaptera
novaeangliae) to full-scale ATOC signals. The Journal of the Acoustical Society of America
108, 1930–1937.
Frid, A., and Dill, L. (2002). Human-caused Disturbance Stimuli as a Form of Predation Risk.
Conservation Ecology 6, 11.
Fristrup, K.M., Hatch, L.T., and Clark, C.W. (2003). Variation in humpback whale (Megaptera
novaeangliae) song length in relation to low-frequency sound broadcasts. The Journal of
the Acoustical Society of America 113, 3411.
Fuong, H., Keeley, K.N., Bulut, Y., and Blumstein, D.T. (2014). Heterospecific alarm call
eavesdropping in nonvocal, white-bellied copper-striped skinks, Emoia cyanura. Animal
Behaviour 95, 129–135.

238
Garcia, M., Gingras, B., Bowling, D.L., Herbst, C.T., Boeckle, M., Locatelli, Y., and Fitch, W.T.
(2016). Structural Classification of Wild Boar (Sus scrofa) Vocalizations. Ethology 122,
329–342.
Garland, E.C., Castellote, M., and Berchok, C.L. (2015). Beluga whale (Delphinapterus leucas)
vocalizations and call classification from the eastern Beaufort Sea population. The
Journal of the Acoustical Society of America 137, 3054–3067.
Gero, S., Whitehead, H., and Rendell, L. (2016). Individual, unit and vocal clan level identity
cues in sperm whale codas. Royal Society Open Science 3, 150372.
Glockner-Ferrari, D.A., and Ferrari, M.J. (1990). Reproduction in the Humpback Whale
(Megaptera novaeangliae) in Hawaiian Waters, 1975-1988: the Life History, Reproductive
Rates and Behavior of Known Individuals Identified through Surface and Underwater
Photography. Report of the International Whaling Comission Special Issue 12, 161–169.
Goldbogen, J.A., Southall, B.L., DeRuiter, S.L., Calambokidis, J., Friedlaender, A.S., Hazen, E.L.,
Falcone, E.A., Schorr, G.S., Douglas, A., Moretti, D.J., et al. (2013). Blue whales respond
to simulated mid-frequency military sonar. Proceedings of the Royal Society B:
Biological Sciences 280, 20130657.
Guinet, C., Barrett-Lennard, L.G., and Loyer, B. (2000). Co-ordinated Attack Behavior and Prey
Sharing by Killer Whales at Crozet Archipelago: Strategies for Feeding on Negatively-
Buoyant Prey. Marine Mammal Science 16, 829–834.
Gygax, L. (2002). Evolution of group size in the dolphins and porpoises: interspecific
consistency of intraspecific patterns. Behavioral Ecology 13, 583–590.

239
Halekoh, U., Højsgaard, S., and Yan, J. (2006). The R Package geepack for Generalized
Estimating Equations. J. Stat. Soft. 15.
Harris, C.M., Sadykova, D., DeRuiter, S.L., Tyack, P.L., Miller, P.J.O., Kvadsheim, P.H., Lam,
F.P.A., and Thomas, L. (2015). Dose response severity functions for acoustic disturbance
in cetaceans using recurrent event survival analysis. Ecosphere 6, art236.
Herman, L.M. (2017). The multiple functions of male song within the humpback whale
(Megaptera novaeangliae) mating system: review, evaluation, and synthesis. Biological
Reviews 92, 1795–1818.
Hillemann, F., Cole, E.F., Keen, S.C., Sheldon, B.C., and Farine, D.R. (2019). Diurnal variation in
the production of vocal information about food supports a model of social adjustment in
wild songbirds. Proceedings of the Royal Society B: Biological Sciences 286, 20182740.
Houser, D.S., Helweg, D.A., and Moore, P.W.B. (2001). A Bandpass filter-bank model of
auditory sensitivity in the humpback whale. Aquatic Mammals 27, 82–91.
Hurd, C.R. (1996). Interspecific attraction to the mobbing calls of black-capped chickadees
(Parus atricapillus). Behavioral Ecology and Sociobiology 38, 287–292.
Isojunno, S., Curé, C., Kvadsheim, P.H., Lam, F.-P.A., Tyack, P.L., Wensveen, P.J., and Miller,
P.J.O. (2016). Sperm whales reduce foraging effort during exposure to 1-2 kHz sonar and
killer whale sounds. Ecological Applications 26, 77–93.
Isojunno, S., Sadykova, D., DeRuiter, S., Curé, C., Visser, F., Thomas, L., Miller, P.J.O., and
Harris, C.M. (2017). Individual, ecological, and anthropogenic influences on activity
budgets of long-finned pilot whales. Ecosphere 8, e02044.
240
Jefferson, T.A., Stacey, P.J., and Baird, R.W. (1991). A review of Killer Whale interactions with
other marine mammals: predation to co-existence. Mammal Review 21, 151–180.
Jensen, F.H., Bejder, L., Wahlberg, M., Aguilar Soto, N., Johnson, M., and Madsen, P.T. (2009a).
Vessel noise effects on delphinid communication. Marine Ecology Progress Series 395,
161–175.
Jensen, F.H., Bejder, L., Wahlberg, M., and Madsen, P.T. (2009b). Biosonar adjustments to target
range of echolocating bottlenose dolphins (Tursiops sp.) in the wild. Journal of
Experimental Biology 212, 1078–1086.
Jensen, F.H., Marrero Perez, J., Johnson, M., Aguilar Soto, N., and Madsen, P.T. (2011). Calling
under pressure: short-finned pilot whales make social calls during deep foraging dives.
Proceedings of the Royal Society B: Biological Sciences 278, 3017–3025.
Jiang, J., Wang, X., Duan, F., Liu, W., Bu, L., Li, F., Li, C., Sun, Z., Ma, S., and Deng, C. (2019).
Study of the relationship between pilot whale (Globicephala melas) behaviour and the
ambiguity function of its sounds. Applied Acoustics 146, 31–37.
Johnson, M.P., and Tyack, P.L. (2003). A digital acoustic recording tag for measuring the
response of wild marine mammals to sound. IEEE Journal of Oceanic Engineering 28, 3–
12.
Jourdain, E., and Vongraven, D. (2017). Humpback whale (Megaptera novaeangliae) and killer
whale (Orcinus orca) feeding aggregations for foraging on herring (Clupea harengus) in
Northern Norway. Mammalian Biology 86, 27–32.

241
Jourdain, E., Vongraven, D., Bisther, A., and Karoliussen, R. (2017). First longitudinal study of
seal-feeding killer whales (Orcinus orca) in Norwegian coastal waters. PLoS ONE 12,
e0180099.
Kastelein, R.A., Helder-Hoek, L., Kommeren, A., Covi, J., and Gransier, R. (2018). Effect of pile-
driving sounds on harbor seal (Phoca vitulina) hearing. The Journal of the Acoustical
Society of America 143, 3583–3594.
Kavanagh, A.S., Owen, K., Williamson, M.J., Blomberg, S.P., Noad, M.J., Goldizen, A.W., Kniest,
E., Cato, D.H., and Dunlop, R.A. (2017). Evidence for the functions of surface-active
behaviors in humpback whales (Megaptera novaeangliae). Marine Mammal Science 33,
313–334.
King, S.L., Friedman, W.R., Allen, S.J., Gerber, L., Jensen, F.H., Wittwer, S., Connor, R.C., and
Krützen, M. (2018). Bottlenose Dolphins Retain Individual Vocal Labels in Multi-level
Alliances. Current Biology 28, 1993-1999.e3.
Koivula, M., and Viitala, J. (1999). Rough-Legged Buzzards Use Vole Scent Marks to Assess
Hunting Areas. Journal of Avian Biology 30, 329–332.
Laidre, K.L., Heide-Jørgensen, M.P., and Orr, J.R. (2006). Reactions of Narwhals, Monodon
monoceros, to Killer Whale, Orcinus orca, Attacks in the Eastern Canadian Arctic. The
Canadian Field-Naturalist 120, 457.
Lee, C.-H., Chou, C.-H., Han, C.-C., and Huang, R.-Z. (2006). Automatic recognition of animal
vocalizations using averaged MFCC and linear discriminant analysis. Pattern
Recognition Letters 27, 93–101.

242
Leroy, E.C., Thomisch, K., Royer, J.-Y., Boebel, O., and Van Opzeeland, I. (2018). On the
reliability of acoustic annotations and automatic detections of Antarctic blue whale calls
under different acoustic conditions. The Journal of the Acoustical Society of America
144, 740–754.
Lilly, M.V., Lucore, E.C., and Tarvin, K.A. (2019). Eavesdropping grey squirrels infer safety
from bird chatter. PLoS ONE 14, e0221279.
Lima, S.L., and Dill, L.M. (1990). Behavioural decisions made under the risk of predation: a
review and prospectus. Canadian Journal of Zoology 68, 619–640.
MacKay, M.M., Würsig, B., Bacon, C.E., and Selwyn, J.D. (2016). North Atlantic humpback
whale (Megaptera novaeangliae) hotspots defined by bathymetric features off western
Puerto Rico. Canadian Journal of Zoology 94, 517–527.
Magnúsdóttir, E.E., Rasmussen, M.H., Lammers, M.O., and Svavarsson, J. (2014). Humpback
whale songs during winter in subarctic waters. Polar Biology 37, 427–433.
Mahr, K., and Hoi, H. (2018). Red-legged partridges perceive the scent of predators and alarm
scents of an avian heterospecific. Animal Behaviour 144, 109–114.
Mandl, I., Schwitzer, C., and Holderied, M. (2019). Sahamalaza Sportive Lemur, Lepilemur
sahamalaza, Vocal Communication: Call Use, Context and Gradation. Folia Primatol 90,
336–360.
Marrero Pérez, J., Jensen, F.H., Rojano-Doñate, L., and Aguilar de Soto, N. (2017). Different
modes of acoustic communication in deep-diving short-finned pilot whales (Globicephala
macrorhynchus). Marine Mammal Science 33, 59–79.

243
McCordic, J.A., Todd, S.K., and Stevick, P.T. (2014). Differential rates of killer whale attacks on
humpback whales in the North Atlantic as determined by scarification. Journal of the
Marine Biological Association of the United Kingdom 94, 1311–1315.
McGregor, P.K. (1993). Signalling in territorial systems: a context for individual identification,
ranging and eavesdropping. Philosophical Transactions of the Royal Society of London.
Series B: Biological Sciences 340, 237–244.
McLaren, J.D., Buler, J.J., Schreckengost, T., Smolinsky, J.A., Boone, M., Emiel van Loon, E.,
Dawson, D.K., and Walters, E.L. (2018). Artificial light at night confounds broad-scale
habitat use by migrating birds. Ecol Lett 21, 356–364.
Melendez, K.V., Jones, D.L., and Feng, A.S. (2006). Classification of communication signals of
the little brown bat. The Journal of the Acoustical Society of America 120, 1095–1102.
Miller, P.J.O. (2006). Diversity in sound pressure levels and estimated active space of resident
killer whale vocalizations. Journal of Comparative Physiology A 192, 449–459.
Miller, P.J.O., and Bain, D.E. (2000). Within-pod variation in the sound production of a pod of
killer whales, Orcinus orca. Animal Behaviour 60, 617–628.
Miller, P.J.O., Johnson, M.P., and Tyack, P.L. (2004). Sperm whale behaviour indicates the use of
echolocation click buzzes ‘creaks’ in prey capture. Proceedings of the Royal Society of
London. Series B: Biological Sciences 271, 2239–2247.
Miller, P.J.O., Kvadsheim, P.H., Lam, F.-P.A., Wensveen, P.J., Antunes, R., Alves, A.C., Visser,
F., Kleivane, L., Tyack, P.L., and Sivle, L.D. (2012). The Severity of Behavioral Changes
Observed During Experimental Exposures of Killer (Orcinus orca), Long-Finned Pilot

244
(Globicephala melas), and Sperm (Physeter macrocephalus) Whales to Naval Sonar. Aquatic
Mammals 38, 362–401.
Miller, P.J.O., Kvadsheim, P.H., Lam, F.P.A., Tyack, P.L., Curé, C., DeRuiter, S.L., Kleivane, L.,
Sivle, L.D., van IJsselmuide, S.P., Visser, F., et al. (2015). First indications that northern
bottlenose whales are sensitive to behavioural disturbance from anthropogenic noise.
Royal Society Open Science 2, 140484.
Moore, S.E., Haug, T., Víkingsson, G.A., and Stenson, G.B. (2019). Baleen whale ecology in arctic
and subarctic seas in an era of rapid habitat alteration. Progress in Oceanography 176,
102118.
Morton, A.B. (1990). A quantitative comparison of the behaviour of resident and transient forms
of the killer whale off the central British Columbia coast. Rep. Int. Whal. Commn. 245–
248.
Munk, W.H., Spindel, R.C., Baggeroer, A., and Birdsall, T.G. (1994). The Heard Island Feasibility
Test. The Journal of the Acoustical Society of America 96, 2330–2342.
Murray, S.O., Mercado, E., and Roitblat, H.L. (1998). Characterizing the graded structure of false
killer whale (Pseudorca crassidens) vocalizations. The Journal of the Acoustical Society of
America 104, 1679–1688.
Naessig, P.J., and Lanyon, J.M. (2004). Levels and probable origin of predatory scarring on
humpback whales (Megaptera novaeangliae) in east Australian waters. Wildlife Research
31, 163–170.
Nemiroff, L., and Whitehead, H. (2009). Structural Characteristics of Pulsed Calls of Long-
Finned Pilot Whales Globicephala Melas. Bioacoustics 19, 67–92.

245
Nøttestad, L., Sivle, L.D., Krafft, B.A., Langård, L., Anthonypillai, V., Bernasconi, M., Langøy,
H., and Axelsen, B.E. (2014). Ecological aspects of fin whale and humpback whale
distribution during summer in the Norwegian Sea. Marine Ecology 35, 221–232.
Nøttestad, L., Krafft, B.A., Anthonypillai, V., Bernasconi, M., Langård, L., Mørk, H.L., and
Fernö, A. (2015). Recent changes in distribution and relative abundance of cetaceans in
the Norwegian Sea and their relationship with potential prey. Frontiers in Ecology and
Evolution 2, 83.
Nousek, A.E., Slater, P.J.B., Wang, C., and Miller, P.J.O. (2006). The influence of social affiliation
on individual vocal signatures of northern resident killer whales (Orcinus orca). Biology
Letters 2, 481–484.
Ottensmeyer, A.C., and Whitehead, H. (2003). Behavioural evidence for social units in long-
finned pilot whales. Canadian Journal of Zoology 81, 1327–1338.
Pacini, A.F., Nachtigall, P.E., Kloepper, L.N., Linnenschmidt, M., Sogorb, A., and Matias, S.
(2010). Audiogram of a formerly stranded long-finned pilot whale (Globicephala melas)
measured using auditory evoked potentials. Journal of Experimental Biology 213, 3138–
3143.
Parks, S.E., Clark, C.W., and Tyack, P.L. (2007). Short- and long-term changes in right whale
calling behavior: The potential effects of noise on acoustic communication. The Journal
of the Acoustical Society of America 122, 3725–3731.
Parks, S.E., Johnson, M., Nowacek, D., and Tyack, P.L. (2011). Individual right whales call
louder in increased environmental noise. Biology Letters 7, 33–35.

246
Parks, S.E., Cusano, D.A., Stimpert, A.K., Weinrich, M.T., Friedlaender, A.S., and Wiley, D.N.
(2015). Evidence for acoustic communication among bottom foraging humpback whales.
Scientific Reports 4, 7508.
Parks, S.E., Cusano, D.A., Van Parijs, S.M., and Nowacek, D.P. (2019). North Atlantic right
whale (Eubalaena glacialis) acoustic behavior on the calving grounds. The Journal of the
Acoustical Society of America 146, EL15–EL21.
Parsons, E.C.M. (2017). Impacts of Navy Sonar on Whales and Dolphins: Now beyond a
Smoking Gun? Frontiers in Marine Science 4, 295.
Payne, R.S., and McVay, S. (1971). Songs of Humpback Whales. Science 173, 585–597.
Pedregosa, F., Varoquaux, G., Gramfort, A., Michel, V., Thirion, B., Grisel, O., Blondel, M.,
Prettenhofer, P., Weiss, R., Dubourg, V., et al. (2011). Scikit-learn: Machine Learning in
Python. Journal of Machine Learning Research 12, 2825–2830.
Pitman, R.L., Totterdell, J.A., Fearnbach, H., Ballance, L.T., Durban, J.W., and Kemps, H. (2015).
Whale killers: Prevalence and ecological implications of killer whale predation on
humpback whale calves off Western Australia. Marine Mammal Science 31, 629–657.
Pitman, R.L., Deecke, V.B., Gabriele, C.M., Srinivasan, M., Black, N., Denkinger, J., Durban, J.W.,
Mathews, E.A., Matkin, D.R., Neilson, J.L., et al. (2017). Humpback whales interfering
when mammal-eating killer whales attack other species: Mobbing behavior and
interspecific altruism? Marine Mammal Science 33, 7–58.
Pollock, H.S., Martínez, A.E., Kelley, J.P., Touchton, J.M., and Tarwater, C.E. (2017).
Heterospecific eavesdropping in ant-following birds of the Neotropics is a learned
behaviour. Proceedings of the Royal Society B: Biological Sciences 284, 20171785.

247
Popov, V., Langrock, R., DeRuiter, S.L., and Visser, F. (2017). An analysis of pilot whale
vocalization activity using hidden Markov models. The Journal of the Acoustical Society
of America 141, 159.
Quick, N., Callahan, H., and Read, A.J. (2018). Two-component calls in short-finned pilot
whales (Globicephala macrorhynchus). Marine Mammal Science 34, 155–168.
R Core Team (2017). R: a language and environment for statistical computing (Vienna, Austria:
R foundation for Statistical Computing).
Racicot, R.A., Boessenecker, R.W., Darroch, S.A.F., and Geisler, J.H. (2019). Evidence for
convergent evolution of ultrasonic hearing in toothed whales (Cetacea: Odontoceti).
Biol. Lett. 15, 20190083.
Rankin, S., Archer, F., and Barlow, J. (2013). Vocal activity of tropical dolphins is inhibited by
the presence of killer whales, Orcinus orca. Marine Mammal Science 29, 679–690.
Rauber, R., and Manser, M.B. (2018). Experience of the signaller explains the use of social versus
personal information in the context of sentinel behaviour in meerkats. Sci Rep 8, 11506.
Rawashdeh, M., and Ralescu, A. (2012). Crisp and fuzzy cluster validity: Generalized intra-inter
silhouette index. In Annual Meeting of the North American Fuzzy Information
Processing Society (NAFIPS), pp. 1–6.
Rekdahl, M.L., Dunlop, R.A., Noad, M.J., and Goldizen, A.W. (2013). Temporal stability and
change in the social call repertoire of migrating humpback whales. The Journal of the
Acoustical Society of America 133, 1785–1795.

248
Rendell, L.E., and Gordon, J.C.D. (1999). Vocal Response of Long-Finned Pilot Whales
(Globicephala melas) to Military Sonar in the Ligurian Sea. Marine Mammal Science 15,
198–204.
Rendell, L.E., Matthews, J.N., Gill, A., Gordon, J.C.D., and Macdonald, D.W. (1999).
Quantitative analysis of tonal calls from five odontocete species, examining interspecific
and intraspecific variation. Journal of Zoology 249, 403–410.
Richardson, W.J., and Würsig, B. (1997). Influences of man‐made noise and other human actions
on cetacean behaviour. Marine and Freshwater Behaviour and Physiology 29, 183–209.
Riesch, R., and Deecke, V.B. (2011). Whistle communication in mammal-eating killer whales
(Orcinus orca): further evidence for acoustic divergence between ecotypes. Behavioral
Ecology and Sociobiology 65, 1377–1387.
Riesch, R., Barrett-Lennard, L.G., Ellis, G.M., Ford, J.K.B., and Deecke, V.B. (2012). Cultural
traditions and the evolution of reproductive isolation: ecological speciation in killer
whales? Biological Journal of the Linnean Society 106, 1–17.
Rocha, R.C.Jr., Clapham, P.J., and Ivashchenko, Y. (2015). Emptying the Oceans: A Summary of
Industrial Whaling Catches in the 20th Century. Marine Fisheries Review 76, 37–48.
Ryan, J.P., Cline, D.E., Joseph, J.E., Margolina, T., Santora, J.A., Kudela, R.M., Chavez, F.P.,
Pennington, J.T., Wahl, C., Michisaki, R., et al. (2019). Humpback whale song occurrence
reflects ecosystem variability in feeding and migratory habitat of the northeast Pacific.
PLoS ONE 14, e0222456.
Samarra, F.I.P. (2015). Variations in killer whale food-associated calls produced during different
prey behavioural contexts. Behavioural Processes 116, 33–42.

249
Samarra, F.I.P., Vighi, M., Aguilar, A., and Víkingsson, G.A. (2017). Intra-population variation
in isotopic niche in herring-eating killer whales off Iceland. Mar. Ecol. Prog. Ser. 564,
199–210.
Saulitis, E., Holmes, L.A., Matkin, C., Wynne, K., Ellifrit, D., and St-Amand, C.Y. (2015). Short
Note: Biggs Killer Whale (Orcinus orca) Predation on Subadult Humpback Whales
(Megaptera novaeangliae) in Lower Cook Inlet and Kodiak, Alaska. Aquatic Mammals 41,
341–344.
Sayigh, L., Quick, N., Hastie, G., and Tyack, P. (2013). Repeated call types in short-finned pilot
whales, Globicephala macrorhynchus. Marine Mammal Science 29, 312–324.
Schlenker, P., Chemla, E., Arnold, K., and Zuberbühler, K. (2016). Pyow-hack revisited: Two
analyses of Putty-nosed monkey alarm calls. Lingua 171, 1–23.
Schmidt, R., Amrhein, V., Kunc, H.P., and Naguib, M. (2007). The day after: effects of vocal
interactions on territory defence in nightingales. Journal of Animal Ecology 76, 168–173.
Schoeppner, N.M., and Relyea, R.A. (2009). Interpreting the smells of predation: how alarm cues
and kairomones induce different prey defences: Unravelling the chemical cues of
predation. Functional Ecology 23, 1114–1121.
Senigaglia, V., and Whitehead, H. (2012). Synchronous breathing by pilot whales. Marine
Mammal Science 28, 213–219.
Senigaglia, V., de Stephanis, R., Verborgh, P., and Lusseau, D. (2012). The role of synchronized
swimming as affiliative and anti-predatory behavior in long-finned pilot whales.
Behavioural Processes 91, 8–14.
Sewall, K. (2012). Vocal Matching in Animals. American Scientist 100, 306.

250
Shamir, L., Yerby, C., Simpson, R., von Benda-Beckmann, A.M., Tyack, P., Samarra, F., Miller,
P., and Wallin, J. (2014). Classification of large acoustic datasets using machine learning
and crowdsourcing: Application to whale calls. The Journal of the Acoustical Society of
America 135, 953–962.
Shapiro, A.D. (2008). Orchestration: the movement and vocal behavior of free-ranging
Norwegian killer whales (Orcinus orca). Massachusetts Institute of Technology and
Woods Hole Oceanographic Institution.
Simon, M. (2005). Acoustic characteristics of underwater tail slaps used by Norwegian and
Icelandic killer whales (Orcinus orca) to debilitate herring (Clupea harengus). Journal of
Experimental Biology 208, 2459–2466.
Simon, M., McGregor, P.K., and Ugarte, F. (2007). The relationship between the acoustic
behaviour and surface activity of killer whales (Orcinus orca) that feed on herring (Clupea
harengus). Acta Ethologica 10, 47–53.
Sivle, L.D., Kvadsheim, P.H., Fahlman, A., Lam, F.P.A., Tyack, P.L., and Miller, P.J.O. (2012).
Changes in dive behavior during naval sonar exposure in killer whales, long-finned
pilot whales, and sperm whales. Frontiers in Physiology 3, 400.
Sivle, L.D., Kvadsheim, P.H., Curé, C., Isojunno, S., Wensveen, P.J., Lam, F.-P.A., Visser, F.,
Kleivane, L., Tyack, P.L., Harris, C.M., et al. (2015). Severity of Expert-Identified
Behavioural Responses of Humpback Whale, Minke Whale, and Northern Bottlenose
Whale to Naval Sonar. Aquatic Mammals 41, 469–502.
Slabbekoorn, H., and Ripmeester, E.A.P. (2008). Birdsong and anthropogenic noise: implications
and applications for conservation. Molecular Ecology 17, 72–83.

251
Sørensen, P.M., Wisniewska, D.M., Jensen, F.H., Johnson, M., Teilmann, J., and Madsen, P.T.
(2018). Click communication in wild harbour porpoises (Phocoena phocoena). Scientific
Reports 8.
Soto, N.A., Johnson, M.P., Madsen, P.T., Díaz, F., Domínguez, I., Brito, A., and Tyack, P. (2008).
Cheetahs of the deep sea: deep foraging sprints in short-finned pilot whales off Tenerife
(Canary Islands). Journal of Animal Ecology 77, 936–947.
Soto, N.A. de, Visser, F., Madsen, P., Tyack, P., Ruxton, G., Arranz, P., Alcazar, J., and Johnson,
M. (2018). Beaked and Killer Whales Show How Collective Prey Behaviour Foils
Acoustic Predators. BioRxiv 303743.
Southall, B.L., Bowles, A.E., Ellison, W.T., Finneran, J.J., Gentry, R.L., Greene, C.R., Kastak, D.,
Ketten, D.R., Miller, J.H., Nachtigall, P.E., et al. (2007). Marine mammals noise exposure
criteria: Initial scientific recommendations. Aquatic Mammals 33, 411–522.
Southall, B.L., Nowacek, D.P., Miller, P.J.O., and Tyack, P.L. (2016). Experimental field studies
to measure behavioral responses of cetaceans to sonar. Endang. Species. Res. 31, 293–
315.
Southall, B.L., Finneran, J.J., Reichmuth, C., Nachtigall, P.E., Ketten, D.R., Bowles, A.E., Ellison,
W.T., Nowacek, D.P., and Tyack, P.L. (2019). Marine Mammal Noise Exposure Criteria:
Updated Scientific Recommendations for Residual Hearing Effects. Aquatic Mammals
45, 125–232.
Steiger, G.H., Calambokidis, J., Straley, J.M., Herman, L.M., Cerchio, S., Salden, D.R., Urbán-R,
J., Jacobsen, J.K., von Ziegesar, O., Balcomb, K.C., et al. (2008). Geographic variation in

252
killer whale attacks on humpback whales in the North Pacific: implications for predation
pressure. Endangered Species Research 4, 247–256.
Stevick, P.T., Allen, J., Clapham, P.J., Katona, S.K., Larsen, F., Lien, J., Mattila, D.K., Palsbøll,
P.J., Sears, R., Sigurjónsson, J., et al. (2006). Population spatial structuring on the feeding
grounds in North Atlantic humpback whales (Megaptera novaeangliae). Journal of
Zoology 270, 244–255.
Stimpert, A.K., Au, W.W.L., Parks, S.E., Hurst, T., and Wiley, D.N. (2011). Common humpback
whale (Megaptera novaeangliae) sound types for passive acoustic monitoring. The Journal
of the Acoustical Society of America 129, 476–482.
Stowell, D., and Plumbley, M.D. (2014). Automatic large-scale classification of bird sounds is
strongly improved by unsupervised feature learning. PeerJ 2, e488.
Sun, C., Jiang, T., Kanwal, J.S., Guo, X., Luo, B., Lin, A., and Feng, J. (2018). Great Himalayan
leaf-nosed bats modify vocalizations to communicate threat escalation during agonistic
interactions. Behavioural Processes 157, 180–187.
Suzuki, T.N. (2014). Communication about predator type by a bird using discrete, graded and
combinatorial variation in alarm calls. Animal Behaviour 87, 59–65.
Suzuki, T.N. (2016). Referential calls coordinate multi-species mobbing in a forest bird
community. J Ethol 34, 79–84.
Taruski, A.G. (1979). The Whistle Repertoire of the North Atlantic Pilot Whale (Globicephala
melaena) and Its Relationship to Behavior and Environment. In Behavior of Marine
Animals: Current Perspectives in Research, H.E. Winn, and B.L. Olla, eds. (Boston, MA:
Springer US), pp. 345–368.

253
Thomas, G.E., and Gruffydd, Ll.D. (1971). The types of escape reactions elicited in the scallop
Pecten maximus by selected sea-star species. Mar. Biol. 10, 87–93.
Thompson, P.O., Cummings, W.C., and Ha, S.J. (1986). Sounds, source levels, and associated
behavior of humpback whales, Southeast Alaska. The Journal of the Acoustical Society
of America 80, 735–740.
Thomsen, F., Franck, D., and Ford, J.K.B. (2001). Characteristics of whistles from the acoustic
repertoire of resident killer whales (Orcinus orca) off Vancouver Island, British
Columbia. The Journal of the Acoustical Society of America 109, 1240–1246.
Todt, D., and Naguib, M. (2000). Vocal Interactions in Birds: The Use of Song as a Model in
Communication. Advances in the Study of Behavior 29, 247–296.
Trites, A.W., Deecke, V.B., Gregr, E.J., Ford, J.K.B., and Olesiuk, P.F. (2007). Killer whales,
whaling, and sequential magafaunal collapse in the North Pacific: a comparative
analysis of the dynamics of marine mammals in Alaska and British Columbia following
commercial whaling. Marine Mammal Science 23, 751–765.
Tuomainen, U., and Candolin, U. (2011). Behavioural responses to human-induced
environmental change. Biological Reviews 86, 640–657.
Van Cise, A.M., Mahaffy, S.D., Baird, R.W., Mooney, T.A., and Barlow, J. (2018). Song of my
people: dialect differences among sympatric social groups of short-finned pilot whales
in Hawai’i. Behavioral Ecology and Sociobiology 72.
Vargas Noriega Romero, F.M. (2018). Revealing structure in vocalisations of parrots and social
whales. Georg-August University of Göttingen.

254
Vergne, A.L., Aubin, T., Taylor, P., and Mathevon, N. (2011). Acoustic signals of baby black
caimans. Zoology 114, 313–320.
Vester, H.I. (2017). Vocal repertoires of two matrilineal social whale species - Long-finned Pilot
Whales (Globicephala melas) & Killer whales (Orcinus orca) in northern Norway. Georg-
August University of Göttingen.
Vester, H., and Hammerschmidt, K. (2013). First record of killer whales (Orcinus orca) feeding
on Atlantic salmon (Salmo salar) in northern Norway suggest a multi-prey feeding type.
Marine Biodiversity Records 6, e9.
Vester, H., Hammerschmidt, K., Timme, M., and Hallerberg, S. (2016). Quantifying group
specificity of animal vocalizations without specific sender information. Physical Review
E 93, 022138.
Vester, H., Hallerberg, S., Timme, M., and Hammerschmidt, K. (2017). Vocal repertoire of long-
finned pilot whales (Globicephala melas) in northern Norway. The Journal of the
Acoustical Society of America 141, 4289–4299.
Visser, F., Miller, P.J.O., Antunes, R.N., Oudejans, M.G., Mackenzie, M.L., Aoki, K., Lam, F.-
P.A., Kvadsheim, P.H., Huisman, J., and Tyack, P.L. (2014). The social context of
individual foraging behaviour in long-finned pilot whales (Globicephala melas).
Behaviour 151, 1453–1477.
Visser, F., Curé, C., Kvadsheim, P.H., Lam, F.-P.A., Tyack, P.L., and Miller, P.J.O. (2016).
Disturbance-specific social responses in long-finned pilot whales, Globicephala melas.
Scientific Reports 6, 28641.

255
Visser, F., Kok, A.C.M., Oudejans, M.G., Scott-Hayward, L.A.S., DeRuiter, S.L., Alves, A.C.,
Antunes, R.N., Isojunno, S., Pierce, G.J., Slabbekoorn, H., et al. (2017). Vocal foragers and
silent crowds: context-dependent vocal variation in Northeast Atlantic long-finned pilot
whales. Behavioral Ecology and Sociobiology 71, 170.
Wadewitz, P., Hammerschmidt, K., Battaglia, D., Witt, A., Wolf, F., and Fischer, J. (2015).
Characterizing Vocal Repertoires - Hard vs. Soft Classification Approaches. PLoS ONE
10, e0125785.
Watkins, W.A. (1966). The harmonic interval : fact or artifact in spectral analysis of pulse trains.
In Marine Bio-Acoustics, (Oxford and New York: Pergamon Press), pp. 15–43.
Weilgart, L.S., and Whitehead, H. (1990). Vocalizations of the North Atlantic Pilot Whale
(Globicephala melas) as Related to Behavioral Contexts. Behavioral Ecology and
Sociobiology 26, 399–402.
Wensveen, P.J., von Benda-Beckmann, A.M., Ainslie, M.A., Lam, F.-P.A., Kvadsheim, P.H.,
Tyack, P.L., and Miller, P.J.O. (2015a). How effectively do horizontal and vertical
response strategies of long-finned pilot whales reduce sound exposure from naval
sonar? Marine Environmental Research 106, 68–81.
Wensveen, P.J., Thomas, L., and Miller, P.J.O. (2015b). A path reconstruction method integrating
dead-reckoning and position fixes applied to humpback whales. Movement Ecology 3,
31.
Wensveen, P.J., Kvadsheim, P.H., Lam, F.-P.A., von Benda-Beckmann, A.M., Sivle, L.D., Visser,
F., Curé, C., Tyack, P.L., and Miller, P.J.O. (2017). Lack of behavioural responses of

256
humpback whales (Megaptera novaeangliae) indicate limited effectiveness of sonar
mitigation. J Exp Biol 220, 4150–4161.
Wensveen, P.J., Isojunno, S., Hansen, R.R., von Benda-Beckmann, A.M., Kleivane, L., van
IJsselmuide, S., Lam, F.-P.A., Kvadsheim, P.H., DeRuiter, S.L., Curé, C., et al. (2019).
Northern bottlenose whales in a pristine environment respond strongly to close and
distant navy sonar signals. Proceedings of the Royal Society B: Biological Sciences 286,
20182592.
Whitehead, H., and Glass, C. (1985). Orcas (Killer Whales) Attack Humpback Whales. Journal of
Mammalogy 66, 183–185.
Whitford, M.D., Freymiller, G.A., and Clark, R.W. (2017). Avoiding the serpent’s tooth:
predator–prey interactions between free-ranging sidewinder rattlesnakes and desert
kangaroo rats. Animal Behaviour 130, 73–78.
Williams, R., Wright, A.J., Ashe, E., Blight, L.K., Bruintjes, R., Canessa, R., Clark, C.W., Cullis-
Suzuki, S., Dakin, D.T., Erbe, C., et al. (2015). Impacts of anthropogenic noise on marine
life: Publication patterns, new discoveries, and future directions in research and
management. Ocean & Coastal Management 115, 17–24.
Winkler, R., Klawonn, F., and Kruse, R. (2011). Fuzzy C-Means in High Dimensional Spaces:
International Journal of Fuzzy System Applications 1, 1–16.
Wollerman, L. (1999). Acoustic interference limits call detection in a Neotropical frog Hyla
ebraccata. Animal Behaviour 57, 529–536.

257
Würsig, B.G., Thewissen, J.G.M., and Kovacs, K.M. (2018). Encyclopedia of marine mammals
(London, United Kingdom ; San Diego, CA, United States: Academic Press, an imprint of
Elsevier).
Yoshida, Y.M., Morisaka, T., Sakai, M., Iwasaki, M., Wakabayashi, I., Seko, A., Kasamatsu, M.,
Akamatsu, T., and Kohshima, S. (2014). Sound variation and function in captive
Commerson’s dolphins (Cephalorhynchus commersonii). Behavioural Processes 108, 11–19.
Zhang, Y.-J., Huang, J.-F., Gong, N., Ling, Z.-H., and Hu, Y. (2018). Automatic detection and
classification of marmoset vocalizations using deep and recurrent neural networks. The
Journal of the Acoustical Society of America 144, 478–487.
Zub, K., Theuerkauf, W., Jedrzejewkski, J., Jedrzejewska, B., Schmidt, K., and Kowalczyk, R.
(2003). Wolf Pack Territory Marking in the Bialowieza Primeval Forest (Poland). Behav
140, 635–648.
Zwamborn, E.M.J., and Whitehead, H. (2017a). Repeated call sequences and behavioural context
in long-finned pilot whales off Cape Breton, Nova Scotia, Canada. Bioacoustics 26, 169–
183.
Zwamborn, E.M.J., and Whitehead, H. (2017b). The baroque potheads: modification and
embellishment in repeated call sequences of long-finned pilot whales. Behaviour 154,
963–979.

258

Benjamin Benti5, rue Poret de Blosseville – 76100 Rouen – France
Æ +33 6 03 79 34 58 • Q [email protected]� https://ethologiecognitiveetsociale.wordpress.com/benjamin-benti/
Education/EmploymentDGA, French Ministry of Defence/UMRAE, Ifsttar-Cerema Rouen, FrancePost-doc incoming: February-July 2020Analysis of the collective responses of sperm whale to naval sonar transmissionUniversity of Strasbourg Strasbourg, FrancePh.D. in ecology-ethology in progress: September 2016-January 2020Behavioural responses of cetaceans to natural and anthropogenic soundsSupervised by Dr. Valérie Dufour (Univ. of Strasbourg, France)Co-supervised by:+ Dr. Charlotte Curé (UMRAE, Ifsttar-Cerema, Rouen, France)+ Dr. Patrick Miller (Univ. of Saint-Andrews, United-Kingdom)Ecole Normale Supérieure de Lyon (ENSL) Lyon, FranceMaster’s Degree, major in Life Sciences - Earth and Universe Sciences 2015-2016Preparation for the highest level national certification for the ability to teach biology and earth sciencesEligibleENSL Lyon, FranceMaster’s Degree, major in Biology, 13.80/20 2013-2015Subects included: Evolution, Ecology, Complex systems modelling, PaleobiologyENSL Lyon, FranceBachelor’s Degree, major in Biology, 12.98/20 2012-2013Subjects included: Statistics, Evolution, Informatics, Biological systems modelling, Population genetics,Development, Cellular and molecular biologyBel Air High School Saint-Suzanne, FranceHigh school diploma, highest distinctions June 2010
ExperienceResearch. . . . . . . . . . . . . . . . . . . . . . . . . . . . . . . . . . . . . . . . . . . . . . . . . . . . . . . . . . . . . . . . . . . . . . . . . . . . . . . . . . . . . . . . . . . . . . . . . . . . . . . . .
Sea Mammals Sonar Safety consortium (3S) Northern NorwayField campaigns during Ph.D. 2016-presentPlayback of killer whale sounds and controlled exposure to sonar transmission on free-ranging cetaceans.Tasks:+ Tag technician: calibration and setting of the tags before deployment, data processing and checking after
tag recovery, investigation of tag technical issues;+ Playback operator : installation of the playback material, testing of the material, execution of the broadcasts
during experiments;+ Marine mammal observer : visual detection and tracking of cetaceans, telemetry to identify tagged whales
and to retrieve tags after detachment:+ Photos for individual identification.

IPHC-DEPE Strasbourg, FranceVocal repertoire and individual vocal signature in the Rook January-June 201521-week-long internship under the supervision of Dr. Charlotte Curé and Dr. Valérie Dufour. Publishedarticle (first author).+ Bird feeding;+ Acoustic and behavioural data collection;+ Data analysis.University Claude Bernard Lyon, FranceGene expression evolution during six convergent habitat shifts September-December 201414-week-long innternship under the supervision of Dr. Tristan Lefébure and Dr. Marie Sémon.+ Individual collection in the field;+ Transciptomic data analysis;+ Development of data treatment techniques.University of York York, United-KingdomInfluence of the zoo environment of the stress level of captive chimpanzees February-June 201414-week-long internship under the supervision of Dr. Katie Slocombe. Co-author in a published article.+ Behavioural data collection;+ Data analysis.IPHC-DEPE Strasbourg, FranceVocal communication in the Rook July-August 20137-week-long internship under the supervision of Dr. Valérie Dufour.+ Bird feeding;+ Acoustical and behavioural data collection;+ Data analysis.
Teaching. . . . . . . . . . . . . . . . . . . . . . . . . . . . . . . . . . . . . . . . . . . . . . . . . . . . . . . . . . . . . . . . . . . . . . . . . . . . . . . . . . . . . . . . . . . . . . . . . . . . . . . . .
University of Strasbourg Strasbourg, FranceAnimal biodiversity undergraduate student monitoring mission September-December 2016Monitoring of practicals and tutorials, and participation in the elaboration and correction of written andpractical tests.Teaching in French, with support documents in English.
LanguagesFrench: Native speakerEnglish: C1-C2 CLES2 (french certification)German: A2Italian: A2
Computer skillsOffice: MicrosoftOffice, OpenOffice, LATEX Biliography: Zotero, MendeleyStatistics: R, python Programming: Matlab, python, perl
OtherVolleyball: Opposite hitter Driving licence and own car: yesMembership: SFECA (french society for the study of animal behaviour

Publications+ Benti B, Miller PJO, Biuw M, and Curé C (submitted to Animal Behaviour) Behavioural responsesto the sounds of heterospecifics are influenced by trophic relationships and ecological contexts
+ Benti B, Curé C, and Dufour V (2019) Individual signature in the most common and context-independent call of the Rook (Corvus frugilegus) The Wilson Journal of Ornithology 131(2):373-381. DOI: 10.1676/18-41
+ Lam FP, Fvadsheim PH, Isojunno S, van IJsselmuide S, Wensveen PJ, Hansen RR, SiemensmaM, Sivle LD, Kleivane L, López LMM, Benti B, Dekeling R., and Miller PJO (2018) Behaviouralresponse study on the effects of continuous sonar and the effects of source proximity on spermwhales in Norwegian waters: the 3S-2017-CAS cruise report TNO Report 2018 R10958. URL:https://repository.tudelft.nl/view/tno/uuid:5d9fdf72-ac5e-4cb1-81d5-659d62ff5d1a
+ Wallace EK, Altschul D, Körfer K, Benti B, Kaeser A, Lambeth S., Waller BM, and Slocombe K(2017) Is music enriching for group-housed captive chimpanzees (Pan troglodytes)? PLoS ONE12(3):e0172672. DOI: 10.1371/journal.pone.0172672
CommunicationsAnimal Linguistics Paris, FrancePoster June 2019Exploring an innovative classification method for characterizing the vocal repertoire of cetacean species, thelong-finned pilot whaleSFECA colloquium Lille, FrancePoster June 2019Fuzzy clustering for the classification of marine mammal calls - performance comparison with a catalogue-basedapproachESOMM The Hague, NetherlandsPoster (presented by Miller PJO) September 2018Humpback whales can discriminate between the sounds of different killer whale ecotypesBiologging symposium Constance, GermanyPoster September 2017Can humpback whales discriminate between the sounds of different killer whale ecotypes?SFECA colloquium Gif-sur-Yvette, FranceTalk, Best student talk award (Prix Castor) May 2017Discrimination of the sounds of different killer whale ecotypes by humpback whales


Benjamin BENTI
Responses of two cetacean species to natural and anthropogenic sounds
Résumé
Il est crucial pour les animaux de se servir des stimuli environnementaux pour localiser et évaluer la
qualité des ressources et menaces présentes dans les environs. Dans l’océan, les stimuli acoustiques sont
privilégiés. Les cétacés sont susceptibles de détecter les sons produits par une multitude de sources,
dont les autres espèces et les sources anthropiques. J’ai étudié les réponses comportementales de deux
espèces de cétacé, la baleine à bosse et le globicéphale noir, à des stimuli acoustiques d’origine naturelle
(sons d’orques) et anthropique (sonars militaires). J’ai montré que les baleines à bosse sont capables de
différencier les sons de différents écotypes d’orques. J’ai développé un algorithme de classification des
vocalisations animales qui prend en compte la nature graduelle de certains répertoires vocaux et ai
utilisé cet algorithme pour décrire les réponses vocales des globicéphales noirs aux sons d’orques et aux
sonars militaires.
Mots-clés : cétacés, acoustique, sons anthropogénique, interactions interspécifiques
Résumé en anglais
It is crucial for animals to use environmental stimuli to locate and evaluate the quality of resources and
threats present in their surroundings. In the ocean, acoustic stimuli are privileged. Cetaceans are
susceptible to detect acoustic stimuli produced by a multitude of sources, including other cetacean
species and anthropogenic sources. I studied the behavioural responses of two cetacean species, the
humpback whale and the long-finned pilot whale, to natural and anthropogenic acoustic stimuli
(respectively killer whale sounds and naval sonars). I found that humpback whales were able to
discriminate between the sounds of different killer whale ecotypes. I developed an unsupervised
classification algorithm which takes into account the graded nature of animal vocalisations, and used
this algorithm to describe the vocal responses of long-finned pilot whales to killer whale sounds and
naval sonars.
Keywords: cetaceans, acoustics, anthropogenic sounds, interspecific interactions