Assessing behavioural and physiological responses of three ...
228
Assessing behavioural and physiological responses of three aquatic invertebrates to atrazine and tributyltin in a multi-species, early-warning biomonitoring technology by Gillianne Claire Marshall Bachelor of Science (Honours), Queen’s University, 2007 A thesis presented to Ryerson University in partial fulfillment of the requirement for the degree of Masters of Applied Science in the Program of Environmental Applied Science and Management Toronto, Ontario, Canada, 2009 © Gillianne Claire Marshall, 2009
-
Upload
khangminh22 -
Category
Documents
-
view
4 -
download
0
Transcript of Assessing behavioural and physiological responses of three ...

Assessing behavioural and physiological responses of three aquatic
invertebrates to atrazine and tributyltin in a multi-species, early-warning
biomonitoring technology
by
Gillianne Claire Marshall
Bachelor of Science (Honours), Queen’s University, 2007
A thesis
presented to Ryerson University
in partial fulfillment of the
requirement for the degree of
Masters of Applied Science
in the Program of
Environmental Applied Science and Management
Toronto, Ontario, Canada, 2009
© Gillianne Claire Marshall, 2009

i
I hereby declare that I am sole author of this thesis.
I authorize Ryerson University to lend this thesis to other institutions or individuals for the
purpose of scholarly research.
Gillianne Marshall
I further Ryerson University to reproduce this thesis by photocopying or by other means, in total
or in part, at the request of other institutions or individuals for the purpose of scholarly research.
Gillianne Marshall

ii
Ryerson University requires the signature of all persons using or photocopying this thesis. Please
sign below, and give address and date.

iii
Abstract
Assessing behavioural and physiological responses of three aquatic invertebrates to atrazine and
tributyl tin in a multi-species, early-warning biomonitoring technology
Recent global events and anthropogenic changes to the natural environment have raised
concerns about the quality of drinking water consumed by the public throughout the world.
Traditional chemical testing is slow and is not performed for all possible contaminants,
necessitating the development of innovative new technology to detect and mitigate threats to
human health. The development of a multi-species, early-warning biomonitoring technology,
based on behavioural and physiological changes in aquatic organisms, greatly furthers this goal.
In this study, changes in movement behaviour and respiration rates were examined in three
aquatic species, Daphnia magna, Hyalella azteca, and Lumbriculus variegatus, exposed to
varying concentrations of TBT and atrazine, using digital video analysis and direct oxygen
measurement. Different parameters of movement were examined and evaluated for inclusion in a
multi-species, early-warning biomonitoring technology and the utility of incorporating these
parameters into a model to determine classes and concentrations of various contaminants is
discussed. An evaluation of whether or not direct measurement of oxygen consumption rates is
feasible and useful for inclusion in a multi-species, early-warning biomonitoring technology is
also discussed.
Gillianne C. Marshall
Master of Applied Science
Environmental Applied Science and Management
August 2009
Ryerson University

iv
Acknowledgements
First and foremost, I would like to thank Dr. Lynda McCarthy for the opportunity to be part of
this unique and important project. Her support and guidance is always encouraging and has
greatly contributed to the completion of this project. Her overall enthusiasm for my thesis has
helped me to see the important role of my research and has always been highly motivational.
I would also like to thank Dr. Andrew Laursen for his help with data analysis and other aspects
of this project. His willingness to take time to fully explain concepts was greatly appreciated. I
am also grateful to Dr. Vadim Bostan for his help with experimental design and willingness to
provide input into this project.
I would also like to extend my gratitude to a number of colleagues and fellow graduate students
for their support over the past two years. Karen Terry, our lab technician, was always an
invaluable source of technical knowledge and was always more than willing to help with
logistical concerns. Summer students, Jason Solnik and Tayseer Madhi, were also of great help
establishing organism cultures. Many fellow graduate students also provided their input and
expertise, and provided a much needed social outlet at Ryerson. I would like to specifically thank
Christopher Pearce, Veronica Barbisan, Melissa Torchia, Katrina Ahchong, Juliet Ajambo-
Doherty, Monisa Nandi, and Joseph Bautista for their friendship over the last two years.
Funding for this project was provided by the Natural Sciences and Engineering Research Council
of Canada (NSERC), the Ryerson Faculty of Engineering, Architecture and Science (FEAS) and
the Ryerson University School of Graduate Studies (SGS).
Finally, I owe a huge debt to my parents, Bernard and Judith Marshall, for their unending
encouragement throughout undergrad and while pursuing my Master`s. They have always been
understanding and have actively encouraged all projects which I have chosen to pursue over the
past 6 years, and for that I am truly thankful.

v
Contents Abstract .................................................................................................................................................. iii
Acknowledgements ................................................................................................................................ iv
List of Figures ...................................................................................................................................... viii
List of Abbreviations ............................................................................................................................. xii
1.0 Introduction ....................................................................................................................................... 1
1.1 Project Background........................................................................................................................ 1
1.2 Biological Early Warning Systems (BEWS) ............................................................................. 3
1.2.1 Background ............................................................................................................................. 3
1.2.2 Advantages and Disadvantages................................................................................................ 5
1.2.3 Potential Applications ............................................................................................................. 7
1.3 Relevance of Behavioural and Movement Quantification ............................................................... 8
1.4 Relevance of Respiration Quantification ........................................................................................ 9
1.5 Bioassay Organisms ............................................................................................................... 10
1.5.1 Daphnia magna..................................................................................................................... 10
1.5.2 Hyalella azteca ..................................................................................................................... 19
1.5.3 Lumbriculus variegatus ......................................................................................................... 23
1.6 Bioassay Contaminants .......................................................................................................... 28
1.6.1 Tributyltin ............................................................................................................................. 28
1.6.2 Atrazine ................................................................................................................................ 36
1.6.3 Dimethyl Sulfoxide (DMSO)................................................................................................. 41
1.7 Thesis Rationale and Objectives ............................................................................................. 42
2.0 Materials and Methods ..................................................................................................................... 44
2.1 Bioassay Organism Culturing....................................................................................................... 44
2.1.1 Daphnia magna..................................................................................................................... 44
2.1.2 Hyalella azteca ..................................................................................................................... 45
2.1.3 Lumbriculus variegatus ......................................................................................................... 46
2.2 Washing Procedures .................................................................................................................... 46
2.3 Dilutions ...................................................................................................................................... 47
2.4 Behaviour Bioassays .................................................................................................................... 48

vi
2.4.1 Daphnia magna Behaviour .................................................................................................... 48
2.4.2 Hyalella azteca Behaviour..................................................................................................... 50
2.4.3 Lumbriculus variegatus Behaviour ........................................................................................ 52
2.5 Respiration Bioassays .................................................................................................................. 57
2.5.1 Daphnia magna, Hyalella azteca and Lumbriculus variegatus Respiration in TBT ................ 57
2.5.2 Daphnia magna, Hyalella azteca and Lumbriculus variegatus Respiration in Atrazine ......... 58
3.0 RESULTS AND DISCUSSION ....................................................................................................... 61
3.1 Daphnia magna Behaviour .......................................................................................................... 61
3.1.1 Daphnia magna Motility ....................................................................................................... 61
3.1.2 Daphnia magna 72 Hour Mortality TBT ............................................................................... 79
3.2 Hyalella azteca Behaviour ........................................................................................................... 80
3.2.1 Hyalella azteca Motility ........................................................................................................ 80
3.3 Lumbriculus variegatus Behaviour ............................................................................................... 99
3.3.1 Lumbriculus variegatus Burrowing ....................................................................................... 99
3.3.2 Lumbriculus variegatus Grouping ....................................................................................... 101
3.3.3 Lumbriculus variegatus Motility ......................................................................................... 104
3.3.4 Lumbriculus variegatus 72 Hour Mortaliy TBT .................................................................. 120
3.4 Mode of Action for Toxicity of TBT .......................................................................................... 121
3.5 Mode of Action for Toxicity of Atrazine .................................................................................... 123
3.6 Daphnia magna Respiration ....................................................................................................... 125
3.7 Hyalella azteca Respiration........................................................................................................ 129
3.8 Lumbriculus variegatus Respiration ........................................................................................... 132
4.0 Summary and Future Directions ..................................................................................................... 135
4.1 Summary ................................................................................................................................... 135
4.2 Future Directions of Research .................................................................................................... 136
REFERENCES.................................................................................................................................... 141
APPENDICES .................................................................................................................................... 150
Appendix A Dilution Calculations .................................................................................................... 150
Appendix B Winkler Titration Procedure .......................................................................................... 154
Appendix C Unisense Oxygen Microelectrode Function ................................................................... 155
Appendix D Daphnia magna Swimming Bioassay TBT Data ........................................................... 156
Appendix E Daphnia magna Swimming Bioassay Atrazine Data ...................................................... 162
Appendix F Daphnia magna 72 Hour Mortality Bioassay TBT Data ................................................ 168

vii
Appendix G Hyalella azteca Motility Bioassay TBT Data ................................................................ 169
Appendix H Hyalella azteca Motility Bioassay Atrazine Data .......................................................... 178
Appendix I Lumbriculus variegatus Burrowing Behaviour TBT Data ............................................... 186
Appendix J Lumbriculus variegatus Burrowing Behaviour Atrazine Data ......................................... 188
Appendix K Lumbriculus variegatus Grouping Behaviour TBT Data ............................................... 189
Appendix L Lumbriculus variegatus Grouping Behaviour Atrazine Data .......................................... 190
Appendix M Lumbriculus variegatus Motility Bioassay TBT ........................................................... 191
Appendix N Lumbriculus variegatus Motility Bioassay Atrazine ...................................................... 197
Appendix O Lumbriculus variegatus 72 Hour Mortality (TBT) Data ................................................ 203
Appendix P Daphnia magna Respiration Data (TBT) ....................................................................... 204
Appendix Q Daphnia magna Respiration Data (Atrazine)................................................................. 205
Appendix R Hyalella azteca Respiration Data (TBT) ........................................................................ 206
Appendix S Hyalella azteca Respiration Data (Atrazine) .................................................................. 207
Appendix T Lumbriculus variegatus Respiration Data (TBT) ........................................................... 208
Appendix U Lumbriculus variegatus Respiration Data (Atrazine) ..................................................... 209
Appendix V Biomass of Test Organisms ........................................................................................... 210

viii
List of Figures
Figure 1: Image of Daphnia magna
Figure 2: Image of Hyalella azteca
Figure 3: Image of Lumbriculus variegatus
Figure 4: Chemical structure of TBT hydroxide
Figure 5: Chemical structure of atrazine
Figure 6: Chemical structure of dimethysulfoxide (DMSO)
Figure 7: Outline of behavioural bioassays performed
Figure 8: Outline of respiration bioassays performed
Figure 9: Average percentage of Daphnia magna displaying changes in swimming height in
three concentrations of TBT over a 24 hour experimental period
Figure 10: Average percentage of Daphnia magna displaying changes in swimming height in
three concentrations of atrazine over a 24 hour experimental period
Figure 11: Average percentage of Daphnia magna displaying spinning behaviour in three
treatments of TBT over a 24 hour experimental period
Figure 12: Average percentage of Daphnia magna displaying spinning behaviour in three
treatments of atrazine over a 24 hour experimental period
Figure 13: Average percentage of Daphnia magna displaying changes in body orientation in
response to three concentrations of TBT over a 24 hour period
Figure 14: Average percentage of Daphnia magna displaying changes in body orientation in
response to three concentrations of atrazine over a 24 hour period
Figure 15: Average percentage of immobilized Daphnia magna in three treatments of TBT over
a 24 hour period
Figure 16: Average percentage of immobilized Daphnia magna in three treatments of atrazine
over a 24 hour period
Figure 17: Average percentage of Daphnia magna displaying abnormal antennae use in three
concentrations of TBT over a 24 hour period
Figure 18: Average percentage of Daphnia magna displaying abnormal antennae use in three
concentrations of atrazine over a 24 hour period

ix
Figure 19: Average percentage of Daphnia magna displaying abnormal swimming style when
exposed to 3 concentrations of TBT over a 24 hour period
Figure 20: Average percentage of Daphnia magna displaying abnormal swimming style when
exposed to 3 concentrations of atrazine over a 24 hour period.
Figure 21: Average percent of Daphnia magna which died after 72 hours of exposure to varying
concentrations of TBT.
Figure 22: Average percentage of Hyalella azteca performing swimming events in three
concentrations of TBT over a 24 hour period.
Figure 23: Average percentage of Hyalella azteca performing swimming events in three
concentrations of TBT over a 24 hour period.
Figure 24: Average percentage of Hyalella azteca crawling on substrate in three concentrations
of TBT over a 24 hour period.
Figure 25: Average percentage of Hyalella azteca crawling on substrate in three concentrations
of atrazine over a 24 hour period.
Figure 26: Average percentage of immobilized Hyalella azteca in three concentrations of TBT
over a 24 hour period.
Figure 27: Average percentage of immobilized Hyalella azteca in three concentrations of
atrazine over a 24 hour period.
Figure 28: Average percentage of Hyalella azteca burrowed in three concentrations of TBT over
a 24 hour exposure period.
Figure 29: Average percentage of Hyalella azteca burrowed in three concentrations of atrazine
over a 24 hour exposure period.
Figure 30: Average percentage of Hyalella azteca found in groups in three concentrations of
TBT over a 24 hour period.
Figure 31: Average percentage of Hyalella azteca found in groups in three concentrations of
atrazine over a 24 hour period.
Figure 32: Average percentage of Hyalella azteca displaying shortened body lengths in three
concentrations of TBT over a 24 hour exposure period.
Figure 33: Average percentage of Hyalella azteca displaying shortened body lengths in three
concentrations of atrazine over a 24 hour exposure period.
Figure 34: Average percentage of Hyalella azteca displaying changes in body orientation in
three concentrations of TBT over a 24 hour exposure period.
Figure 35: Average percentage of Hyalella azteca displaying changes in body orientation in
three concentrations of atrazine over a 24 hour exposure period.

x
Figure 36: Average rate of Lumbriculus variegatus burrowing over time for the 4.5 hour
experimental period when exposed to 3 concentrations of TBT.
Figure 37 : Average rate of burrowing of Lumbriculus variegatus over a 6 hour experimental
time period when exposed to 3 concentrations of atrazine.
Figure 38: Average rate of the grouping of Lumbriculus variegatus over time for the 5
experimental treatments during the TBT bioassay.
Figure 39 : Average rate colony formation of Lumbriculus variegatus over a 6 hour
experimental time period when exposed to 5 different treatments in the atrazine colony formation
bioassay.
Figure 40: Average percentage of Lumbriculus variegatus positioned in the middle of the
bioassay vessel when exposed to three concentrations of TBT over a period of 24 hours.
Figure 41: Average percentage of Lumbriculus variegatus positioned in the middle of the
bioassay vessel when exposed to three concentrations of atrazine over a period of 24 hours.
Figure 42: Average percentage of Lumbriculus variegatus displaying changes in locomotion
style after exposure to three concentrations of TBT over a 24 hour period.
Figure 43: Average percentage of Lumbriculus variegatus displaying changes in locomotion
style after exposure to three concentrations of atrazine over a 24 hour period.
Figure 44: Average percentage of Lumbriculus variegatus immobilized in three concentrations
of TBT over a 24 hour exposure period.
Figure 45: Average percentage of Lumbriculus variegatus immobilized in three concentrations
of atrazine over a 24 hour exposure period.
Figure 46: Average percentage of Lumbriculus variegatus displaying shortened bodies after
exposure to three concentrations of TBT over a 24 hour test period.
Figure 47: Average percentage of Lumbriculus variegatus displaying shortened bodies after
exposure to three concentrations of atrazine over a 24 hour test period.
Figure 48: Average percentage of Lumbriculus variegatus showing changes in body orientation
after exposure to three concentrations of TBT over a 24 hour period.
Figure 49: Average percentage of Lumbriculus variegatus showing changes in body orientation
after exposure to three concentrations of atrazine over a 24 hour period.
Figure 50: Average percentage of Lumbriculus variegatus displaying movement within groups
after exposure to three concentrations of TBT over a 24 hour exposure period.
Figure 51: Average percentage of Lumbriculus variegatus displaying movement within groups
after exposure to three concentrations of atrazine over a 24 hour exposure period.
Figure 52: Average percent of Lumbriculus variegatus which died after 72 hours of exposure to
varying concentrations of TBT.

xi
Figure 53: Respiration rates of 8 adult Daphnia magna exposed to varying concentrations of
TBT expressed in relation to total average body weight of the organisms.
Figure 54: Respiration rates of 15 adult Daphnia magna exposed to varying concentrations of
atrazine expressed in relation to total average body weight of the organisms.
Figure 55: Respiration rates of 3 adult Hyalella azteca exposed to varying concentrations of
TBT expressed in relation to total average body weight of the organisms.
Figure 56: Respiration rates of 8 adult Hyalella azteca exposed to varying concentrations of
atrazine expressed in relation to total average body weight of the organisms.
Figure 57: Respiration rates of 10 adult Lumbriculus variegatus exposed to varying
concentrations of TBT expressed in relation to total average body weight of the organisms.
Figure 58: Respiration rates of 20 adult Lumbriculus variegatus exposed to varying
concentrations of atrazine expressed in relation to total average body weight of the organisms.
Figure 59: Outline of the steps involved in developing the multi-species, early-warning
biomonitoring system.

xii
List of Abbreviations AChE – Acetycholinesterase
BEWS – Biological Early Warning System
CTAB - Cetyltrimethylammonium bromide
DBT – Dibutyltin
DMSO – Dimethysulfoxide
DO – Dissolved Oxygen
EC – Effective Concentration
EU – European Union
FSH – Follicle Stimulating Hormone
IARC – International Agency for Research on Cancer
IC50 – the concentration of a contaminant which inhibits a given behaviour or other parameter in 50% of
organisms in a bioassay over a given period of time
IMO – International Maritime Organization
LC50 – the concentration of a contaminant which is lethal to 50% of organisms in a bioassay over a given
period of time
LH – Luteinizing Hormone
MBT – Monobutyltin
MFB – Multi-species Freshwater Biomonitor
NOEC – No Observable Effects Concentration
NSERC – Natural Sciences and Engineering Research Council
PCB – polychlorobiphenyl
PCP - pentachlorophenol
ppb – Parts Per Billion
ppm - Parts Per Million
ppt – Parts Per Trillion
ROS – Reactive Oxygen Species
TBT – Tributyltin

xiii
USEPA – United States Environmental Protection Agency
WHO – World Health Organization

xiv

1
1.0 Introduction
1.1 Project Background
Recent global events and anthropogenic changes to the natural environment have raised
concerns about the quality of drinking water consumed by the public throughout the world. The
monitoring of water quality is important in order to identify potentially toxic substances
introduced to the environment, both purposefully and accidentally, which may cause adverse
health effects in humans. The development of new ways in which to detect these compounds is
important in order to protect human health and ensure that drinking water is highly palatable
(Martins et al., 2007a). Past advancements in the field of water treatment have included the
development of organism-based systems which can help to detect contaminants in freshwater.
Such systems that monitor behavioural responses of organisms and changes in behaviour let
operators know a contaminant is present. These systems have become associated with the term
BEWS, Biological Early Warning Systems, and have been developed for use in Europe with the
hopes that they may someday be widespread at water treatment plants throughout the world.
Although the potential exists for these systems to be quite useful, they have several limitations
and their full utility has not been seen to date.
This thesis is part of a large-scale NSERC project aimed at developing a more holistic,
real-time multi-organism early-warning biomonitoring technology which will be fully
implemented at a water treatment facility in southern Ontario within the next five years. This
technology will build upon currently developed BEWS and provide a new, much more effective,
organism-based way for water treatment facility operators to detect specific contaminants which
may be entering public water supplies.
The technology we will be developing is unique in several ways, and expands past the
limitations of currently developed BEWS. This technology will be unique in that it will
encompass the responses of several phyla of organisms at the same time, something which has
not been seen in past BEWS, which have typically relied on the responses of only one organism
at a time. As different organisms have different tolerances to chemical contaminants it is possible
that the risks posed by these contaminants could be over- or underestimated based on responses
by only one organism (McCarthy, 2007). Using a suite of organisms will allow for greater

2
sensitivity of the technology and will help to ensure that even very low concentrations of a
contaminant are detected. In this thesis project, three test species are used which inhabit various
compartments of the aquatic environment. These include Daphnia magna, a free-swimming
crustacean which inhabits the water column, Hyalella azteca, an arthropod which lives at the
sediment-water interface, and Lumbriculus variegatus, a sediment-dwelling aquatic worm.
Simultaneously conducted thesis projects are also examining changes in plant species, protists
and bivalves. The use of many different classes of organisms will help to detect sub-lethal
concentrations of many types of contaminants due to the variation of sensitivity across a
spectrum of species.
Our technology will also incorporate a modelling component, something which has been
lacking in previous BEWS. In previously developed systems, the changes in behaviour of an
organism have been used to alert researchers and plant operators that a chemical contaminant is
present. These systems are not able to provide any information about the specific type of
contaminant or the concentration that may be present, merely that a chemical is present.
Extensive chemical testing is then required to determine the exact type of contaminant and
whether it is present at a concentration which may be of concern for human health. By
performing laboratory-based bioassays, such as those discussed in this thesis, specific responses
by an organism to a given concentration of contaminant can be determined. This information can
then be incorporated into a model which can be used by water treatment plant operators to
determine the exact type and concentration of contaminant, greatly reducing the need for more
testing and helping to determine if concentrations present are in fact of danger to human health.
This project is also important in that it is being developed in conjunction with a water treatment
facility and will eventually be implemented in a real-world setting. The use of past BEWS has
mostly taken place in a laboratory setting, with limited field application. Our technology will use
multiple species in the field and will help to improve operations efficiency at a functioning water
treatment plant.
Finally, our project is unique in that it will incorporate changes in both organism
behaviour and physiology. Past BEWS have focused mainly on changes in organism behaviour,
while for the most part ignoring changes in physiological parameters which can also be easily
and rapidly detected and are highly sensitive to contaminants in the environment. The technology

3
exists to rapidly detect changes in many physiological parameters, including organism
respiration. Changes in physiology may be more sensitive to certain chemicals than behavioural
changes, and therefore monitoring respiration is highly important to ensure that low levels of
contaminants are consistently detected. Changes in the respiration rate of organisms can also be
modelled to help discriminate the exact chemical and its concentration level. Simultaneous
evaluation of behaviour and physiology will allow for a more complete picture of the exact
impacts a contaminant may be having at an organismal level and will allow for better
discrimination between various classes of contaminants.
1.2 Biological Early Warning Systems (BEWS)
Research in the 1990s lead to the development of systems commonly referred to as
Biological Early Warning Systems (BEWS). The aim of this project is not to develop a BEWS,
but to create a much more holistic multi-organism based early-warning biomonitoring
technology capable of identifying specific classes and concentrations of contaminants. However,
it is important to understand the principles, importance, limitations, and applications of currently
existing systems in order to fully comprehend how the current project will move beyond these
systems and contribute to this exciting area of research.
1.2.1 Background
An emerging method of water quality control is the use of Biological Early Warning
Systems (BEWS), systems which employ living organisms to monitor the level of contaminants
in drinking water sources. The development of BEWS for monitoring of water quality supports
United Nations Agenda 21, which aims to protect and manage the world’s freshwater (Gerhardt
et al., 2006b). These systems are commonly used in Europe (Lechelt et al., 2000; Watson et al.,
2007) and the use of technologies based on their main principles would be greatly beneficial in
Canadian water treatment plants in order to detect potentially dangerous aquatic contaminants
before they enter the drinking water supply.
In BEWS, changes in behavioural and physiological parameters of living organisms are
used to detect sub-lethal concentrations of pollutants and to monitor overall water quality
(Michels et al., 1999; Kieu et al., 2001). By continuously monitoring certain behavioural and
physiological measures under normal conditions, it is possible to detect changes in these
parameters which may be induced by stressors such as low levels of chemical pollutants and

4
other changes in water quality (Michels et al., 1999; Watson et al., 2007). These changes can be
detected rapidly and are made in response to contaminant concentrations which are much lower
than those associated with mortality in the organisms (Kieu et al., 2001). Changes can be
induced in response to both organic and inorganic compounds and are therefore useful for
monitoring a variety of contaminants at one time (Mikol et al., 2007).
BEWS generally consist of three components including test organisms, an automated
detection system, and an alarm system (Gerhardt et al., 2006b). BEWS must be fully-automated,
easy to operate, provide reliable alarm generation, and be highly sensitive. Detection systems
typically consist of video-based biomonitoring or non-contact bioelectric systems which are
attached to computers which can rapidly interpret changes in organism behaviour (Gerhardt et
al., 2006b). These systems require organisms which have rapid, reproducible responses to
contaminants which can be easily monitored and evaluated (Van Hoof et al., 1994). Organisms
currently employed in BEWS include fish, crustaceans, mussels, benthic invertebrates, algae, and
bacteria (Lechelt et al, 2000; Bisthoven et al., 2004; Mikol et al., 2007). These systems typically
only monitor the behaviour of one type of organism at a given time. The potential for
development of multi-species, early-warning biomonitoring technologies using other
representatives of the aquatic environment, as well as multiple species simultaneously, is
possible, and is an exciting area study which this project aims to examine. A number of criteria
should be taken into consideration when selecting organisms to use in a multi-species, early-
warning biomonitoring technology. It is suggested that organisms should be economically
important (e.g. commercial or recreational species), representative of other species in the
ecosystem, or be a keystone species (Bunn, 1995). By using species such as these, it is possible
to simultaneously protect ecologically important species in a given area by determining if
changes in water quality are having an impact on native populations, as well as detecting changes
in incoming drinking water quality (Underwood and Petersen, 1988; Bunn, 1995). Ideally more
than one species will be used in a multi-species, early-warning biomonitoring technology, as
different organisms are sensitive to different levels and types of contaminants (Bunn, 1995).
Some BEWS are capable of monitoring the behaviour of multiple organisms (ie the Multispecies
Freshwater Biomonitor discussed below) (Gerhardt, 2007b). However, limited application with
multiple species has been performed in the past in field settings, an area which this project aims
to expand upon.

5
The Multispecies Freshwater Biomonitor (MFB)
The MFB is based on the use of quadropole impedance technology, where the test
organism is held in a flow-through chamber connected to two pairs of electrodes (Gerhardt et al.,
2006). One pair of electrodes creates a high frequency alternating current and the other pair
senses impedance changes in the frequency of the currents, which are generated by the
movement of the organism within the test chamber (Gerhardt et al., 2006b). Different behaviours
will generate different electrical patterns and from this a behavioural “fingerprint” for the
organism can be developed based on the percentage of time spent doing each type of behaviour
(Gerhardt et al., 2003). Activity frequencies are determined under control conditions, and if a
certain activity occurs at 10% higher or lower than expected frequency, an alarm will sound
(Gerhardt et al., 2003). An alarm will also sound if more than 50% of organisms are “inactive”
and not generating any behavioural signals (Gerhardt et al., 2003). The MFB is unique in that it
has a high number of individual chambers allowing for monitoring of many organisms at the
same time and can be used to monitor the behaviour of more than one species at a time, allowing
for increased sensitivity (Gerhardt et al., 2006b). Field applications of the MFB at water
treatment facilities using multiple species of organisms has been limited to date, an area of study
which this project aims to improve upon.
1.2.2 Advantages and Disadvantages
The use of BEWS has several advantages over traditional water quality monitoring
methods. Behavioural and physiological changes are often the first changes seen in aquatic
organisms and are much more rapidly induced endpoints than changes in reproduction and
morphology (Gerhardt and Bisthoven, 1995; Michels et al., 1999). The detection of changes in
behaviour and physiology is also much more rapid than traditional chemical testing, which
requires significant preparation time, skilled staff to perform tests, and is not possible to do in a
continuous online manner (Van Hoof et al., 1994; Green et al., 2003). In addition, traditional
chemical analyses are only performed for a limited number of chemicals which may be present
in incoming water to be treated (Van Hoof et al., 1994). The use of traditional BEWS allows for
the monitoring of many chemicals at one time but not for discrimination amongst different types
of contaminants. When some type of pollutant is detected using these systems, it is possible to
use further chemical and physical testing to identify the contaminant, which may or may not
normally be tested for (Van Hoof et al., 1994; Mikol et al., 2007). Because of their continuous

6
nature, BEWS can detect pollution “pulses”, sporadic events that may be missed by static
chemical tests (Bisthoven et al., 2004; Gerhardt et al., 2006b). Accidental spills from point and
non-point sources can therefore be rapidly detected and water-inflow to treatment plants can be
stopped before the contaminant enters the circulation system (Mikol et al., 2007). BEWS can
also be used together with traditional chemical testing to increase public confidence in drinking
water providers and to encourage potential polluters to prevent accidental discharges (Gerhardt et
al., 2006b; Mikol et al., 2007). A further advantage is that costs associated with BEWS are also
lower than traditional chemical testing and other forms of continuous water monitoring (Green et
al., 2003). Most BEWS are fully-automated, allowing for low operating, monitoring, and
maintenance costs (Bisthoven et al., 2004). BEWS are also useful in terms of ecosystem
monitoring in that they take into account the reactions of biota to environmental stress and give
an idea of the bioavailability and effects of compounds on organisms which are present in natural
environments outside of the water treatment facility (Martins et al., 2007a). BEWS have the
potential to be useful in field applications as they are small, portable, and cost less than a
permanent water quality testing station. This may allow for a larger number of stations to be
installed throughout a watershed to provide a more accurate picture of water quality in the
ecosystem (Gerhardt et al., 2006b).
As mentioned previously and re-emphasized here, despite the many benefits, traditional
BEWS have several limitations which could potentially be improved over the course of this
project. Most BEWS which have already been developed, with the exception of the Multispecies
Freshwater Biomonitor (discussed above), are based on the responses of only one organism to
contaminant stress (McCarthy, 2007). Differing species of organisms may be more or less
sensitive to different classes of contaminants, and thus the use of only a single species in a
traditional BEWS may over- or underestimate the risk posed by a given chemical in incoming
water supplies (McCarthy, 2007). By using multiple species representing different trophic levels
and phyla, this project aims to develop a more holistic, comprehensive early-warning detection
system using a modelling-based approach. The responses of a variety of organisms to several
classes of chemical and biological contaminants will be determined in order to determine more
detail about the specific nature of a threat to Canadian water supplies. By evaluating multiple
patterns of response and creating dose-response models, greater evidence will be available to
treatment plant managers as to the exact stressor present in incoming water, thus facilitating

7
decision making with regards to further treatment and/or temporary shut-down of facilities
(McCarthy, 2007). Traditional BEWS are often inadequate as single organisms are able to detect
that a stressor is present, but give no clue as to the exact nature of that contaminant. By using a
modelling-based approach with several organisms, behavioural response fingerprints may be
developed in order to figure out the exact type of chemical present in the water.
1.2.3 Potential Applications
BEWS have numerous potential applications. In additional to their use in monitoring
pollutant levels in drinking water supplies, they have been used in the past in anti-terrorism
applications in order to test for the addition of chemical warfare agents into drinking water
supplies (Butterworth et al., 2002; Green et al., 2003). The potential for early-warning systems
to detect biological agents such as anthrax, Clostridium perfringens, botulinum, aflatoxin, and
ricin has also been suggested; however, more research in this area is required (Foran and
Brosnan, 2000). A multi-species, early warning biomonitoring technology could also be used to
protect a number of freshwater environments, regardless of whether they are being used a source
of water for human consumption or not. It is possible to use a multi-species, early warning
biomonitoring technology for large-scale watershed protection, in testing of water quality in
nature conservation areas, and in water testing of areas where fisheries are located to ensure that
contaminants are not affecting fish which humans may consume (Mikol et al., 2007; Bisthoven
et al., 2004). A multi-species, early warning biomonitoring technology could also have industrial
applications for industries which discharge effluent into receiving bodies of water (Mikol et al.,
2007). Contaminant levels can be monitored using a multi-species, early warning biomonitoring
technology to ensure that they remain below regulated values and do not affect the aquatic life in
the bodies of water into which the effluent is being released. BEWS have also been used to
monitor discharge from contaminated sites where remediation is taking place, to ensure that
contaminants are no longer present in the aquatic environment (van der Schalie et al., 2001).
Several European nations have installed BEWS in rivers at national borders to help detect
chemical pulses and to determine if international permit violations are taking place (Gerhardt et
al., 2006b). In 1986, a BEWS known as the Dynamic Daphnia test detected low levels of
atrazine in the Rhine River after a chemical spill 500 km upstream just hours after the event had
taken place (Butterworth et al., 2002). The rapid detection of this event increased interest in

8
Europe in the development of these systems and subsequently many single-organism monitoring
systems have been installed along major waterways on the continent.
1.3 Relevance of Behavioural and Movement Quantification
Behaviour is “a series of overt, whole body observable activities which operate through
the nervous system and assist animals to survive grow and reproduce” (Beitinger, 1994).
Behaviour is highly adaptable and the type, intensity and time of occurrence of various
behaviours can be modified by organisms in response to external stimuli, such as chemical
contaminants (Gerhardt, 2007b). The study of changes in behaviour in response to chemical
contaminants in the environment is a rapidly expanding field known as behavioural
ecotoxicology (Beitinger, 1990; Doving, 1991; Scherer, 1991; Clotfelter et al., 2004; Scott and
Sloman, 2004; Zala and Penn, 2004; Mills et al., 2006; Cunha et al., 2008). Behaviour is a
response to contaminants that can be visually measured (Gerhardt et al., 2008). Observations of
changes in behaviour are non-lethal, so organisms can be used for biomonitoring for extended
periods of time (Gerhardt et al., 2006b). Behavioural responses are detected extremely rapidly
and are estimated to take one-tenth of the time needed to evaluate changes in life history traits or
mortality in response to low concentrations of contaminants (Dodson et al., 1995). Responses are
mediated by chemo- or visual reception of contaminants in the environment (Ren et al., 2009).
Behaviours are often the first obvious thing to change in response to pollutants and are
easy to observe due to their effects at the whole organism level (Gerhardt et al., 2006b). Mobility
is a type of behaviour which is highly important to aquatic organisms. Changes in movement can
often provide important information about the overall physiological condition and fitness of
organisms (Baillieul and Scheunders, 1998). Changes in movement behaviour in single
organisms are closely related to changes at the cellular, population and ecosystem level
(Wicklum et al., 1997; Bunn, 1995). Movement is an integration of responses of physiological,
nervous, sensorial and muscular systems and can therefore be indicative of changes at a sub-
organismal level (Untersteiner et al., 2003). Examining changes in movement behaviour can also
help to predict and prevent detrimental impacts at higher organization levels (Bunn, 1995).
Changes in movement can be linked to many ecologically-relevant functions such as
reproduction, foraging and predation (Doving, 1991). If reproduction and foraging success
decrease significantly due to changes in movement behaviour, populations could decline which

9
could seriously affect ecosystem functioning. Populations could also face a decline due to
increased predation caused by an inability to avoid predators.
1.4 Relevance of Respiration Quantification
Respiration is a necessary physiological process for all organisms and changes in
respiration brought on by exposure to contaminants could have an extremely detrimental impact
at organismal, population and ecosystem level (Martins et al., 2007a). Changes in respiration and
metabolism should be examined at the same time as other fitness parameters in order to
understand the full effect that a contaminant is having on an organism (Knops et al., 2001).
Changes in respiration can potentially be used as an early-warning biomonitoring characteristic
(Geiger and Buikema, 1981). Oxygen-level monitoring offers several major advantages; it is
very rapid, is non-invasive and does not induce stress in organisms, and can be used to detect
sub-lethal levels of contaminants (Martins et al., 2007a). Changes in respiration rates in response
to contaminants has been examined but limited applications of this type of monitoring have been
incorporated into past BEWS, especially when examined simultaneously with behavioural
parameters. This project aims to utilize the two measures at the same time to provide a more
holistic picture of organism-level changes induced in response to chemical contaminants.
Disturbances caused by contaminant exposure often result in energy-demanding
processes in order to compensate and adapt to stress (Knops et al., 2001). Under low levels of
stress, the metabolic rate and aerobic respiration rate of organisms which use oxygen should
increase (Knops et al., 2001), while increased and prolonged periods of stress may depress
metabolic function. Information about metabolic changes which occur under stress can therefore
be measured indirectly by examining changes in oxygen consumption (Knops et al.,2001). To
date, few BEWS have used respiration rates as a characteristic to be monitored. Several BEWS
have used measurements of the ventilation rate of fish and other organisms to make assumptions
about the respiration rate of organisms; however, the use of oxygen-level monitoring is much
less used (Martins et al., 2007a). A major focus of this project will be the automation of
respiration rate monitoring and its incorporation into a multi-species, early-warning
biomonitoring technology which will simultaneously monitor the movement behaviour of test
organisms.

10
1.5 Bioassay Organisms
1.5.1 Daphnia magna
Background
Daphnia magna (Figure 1) are small (0.5-5 mm in length) invertebrate crustaceans which
have been widely used in a variety of
ecotoxicology testing in the past (Ren et al.,
2007). Daphnia are considered to be highly
sensitive to a variety of chemicals at low
concentrations and are therefore used as
model organisms for predicting the impacts of
contaminants in the environment (Kieu et al.,
2001; Kiss et al., 2003; Schmidt et al.,2005;
Ren et al., 2009). This is because gill systems,
digestive tract, and overall body surface are
constantly exposed to contaminants which are
dissolved or suspended within the aquatic
environment (Green et al., 2003). D. magna
also tend to bioaccumulate toxic compounds
much more rapidly than larger organisms, and
are more likely to show changes in behaviour and physiology when exposed to extremely low
doses of a pollutant (Green et al., 2003). Daphnia are easy and inexpensive to culture in a
laboratory setting (Ren et al., 2009) and have a short life-cycle which allows them to breed and
mature quickly (Ren et al.,2007). Changes in life history, behaviour and morphology in response
to contaminants have been extensively studied in Daphnia (Barber et al., 1990; Goodrich and
Lech, 1990; Arner and Koivisto, 1993; Dodson et al., 1995; Paul et al., 1997; Wollenberger et
al., 2000; Villegas-Navarro et al., 2003; Flaherty and Dodson, 2005; Hoang et al., 2006).
Daphnia are common in freshwater systems such as lakes, rivers, ponds and other surface
waters throughout Canada and the United States, including the Great Lakes ecosystem (Dodson
and Hanazato, 1995; Ryan and Dodson, 1998). In their natural habitats, Daphnia are often the
dominant herbivores present and make a great contribution to water clarity as they consume large
Figure 1: Illustration of Daphnia magna (BIODIDAC,
1996)
5 mm

11
amounts of phytoplankton (Dodson et al., 1995; Fischer et al., 2006). Daphnids are also an
important component of the diets of many species of fish, amphibians, and larger zooplankton
due to their rapid reproductive rate and large size, and act as a critical link in the foodweb
between phytoplankton and large organisms (Dodson and Hanazato, 1995; Fischer et al., 2006;
Gerhardt et al., 2006a).
Behaviour and Past Behaviour Bioassays
Daphnia are permanently swimming organisms and thus changes in their movement due
to stress can have a detrimental impact on survival of the organisms (Schmidt et al., 2005).
Under normal conditions, daphnids move with powerful, smooth strokes of their secondary
antennae in straight directional movements. D. magna swim in a saltatory or jumping swimming
style and are often known as water fleas (Dodson and Hanazato, 1995). Their distinctive style of
swimming allows them to find and maintain their position in patches of algae distributed
throughout the height of the water column, as well as to group with other daphnids and to move
away from predators (Ryan and Dodson, 1998; Christensen et al., 2005). By swimming in
straight lines, the organisms are able to travel to food patches more quickly and move rapidly
away from predators (Ryan and Dodson, 1998). Daphnids also display escape responses in the
presence of predators which consists of a short, very rapid burst of swimming and some spinning
behaviour (Dodson et al., 1995). Changes in swimming behaviour and displaying a different
swimming style than other organisms may make individuals more visible to predators, thus
increasing the likelihood of being preyed upon. D. magna have a characteristic swimming speed
and style which can be rapidly altered by the presence of toxic compounds, and thus observing
this characteristic is a useful endpoint in ecotoxicological research (Baillieul and Scheunders,
1998). Changes in swimming behaviour can be caused by attempts to avoid the toxin or by
impairment of the ability to swim following exposure to toxic compounds (Green et al., 2003).
One method which has been used in past studies to examine changes in Daphnia
swimming is digital image analysis. Digital image analysis involves constant monitoring of D.
magna using a digital video camera and computer set-up. Water is allowed to enter a flow-
through chamber in which the D. magna are kept and onto which the camera is focused (Bailleul
and Scheunders, 1998). The camera is attached to a frame grabber which digitizes the images
and enters them into a computer program which is able to perform trajectory analyses for each

12
daphnid in the chamber (Bailleul and Scheunders, 1998). The computer traces the movement of
the center of each daphnid and provides a black and white vector image for each organism based
on a simple geometrical model which describes the displacement of objects, as well as a
graphical and tabular output (Bailleul and Scheunders, 1998; Lechelt et al., 2000). Up to 25
organisms can be analyzed at once and the computer is able to determine several parameters
associated with swimming (Bailleul and Scheunders, 1998). These parameters include average
velocity, fractal dimension (measure of turning and circling by daphnids) of the organisms, a V-
class index (places organisms into velocity ranges) comparing the various treatments, the
average height in the water column of each organism, the distance between each organism, and
the overall number of daphnids moving (Lechelt et al., 2000; Green et al., 2003). The computer
program is able to determine baseline values for these parameters under normal water conditions
and once a significant change in one or more of the characteristics is detected, an alarm is
sounded and further testing of water quality can be performed in order to determine the nature of
the problem (Lechelt et al., 2000; Green et al., 2003). Several digital imaging analysis systems
are available commercially, the most commonly used for D. magna biomonitoring being the
BBE Moldaenke Daphnia Toximeter (Lechelt et al., 2000; Watson et al., 2007). Several studies
have been conducted which show how chemical contaminants can be rapidly and effectively
detected using digital image analysis of daphnid swimming behaviour. Green and colleagues
(2003) found a significant change in the swimming velocity and other motion characteristics was
observed using the BBE Moldaenke Daphnia Toximeter in response to sub-lethal concentrations
of five different chemical nerve agents within two hours of initial exposure to the toxins (Green
et al., 2003). This has important applications to drinking water protection with respect to
terrorism prevention and demonstrates that since the detection time was so short, it would be
possible to shut down water delivery systems in the event of a terrorist attack or environmental
disaster (Green et al., 2003). Lechelt and fellow researchers (2000) demonstrated similar rapid
results for the detection of the insecticide trichlorofon by D. magna. After 2 hours exposure to
sub-lethal concentrations of trichlorofon, daphnids showed a stress reaction of increased
swimming velocity, lower swimming depth, closer groupings of the organisms, and extreme
speed classes (either very fast or very slow swimming) and an overall decrease in movement
(Lechelt et al., 2000). Although changes in swimming behaviour will vary depending on the type
and concentration of contaminant, this study clearly shows the rapid detection time available

13
using digital image analysis systems. Digital image analysis of daphnid movement can also be
used to detect taste- and odour-causing compounds which need to be treated for at water
purification facilities. Watson and colleagues (2007) found that following exposure to the taste
and odour compounds B-cyclocitral and 2(E),4(E),7(Z)-decantrienal, daphnid swimming
velocity increased, velocity class increased, height from the bottom of the chamber decreased
and fractal dimension decreased indicating a more directional movement pattern, likely away
from the offensive compounds, in less than one hour following exposure. In addition to being
able to monitor toxic chemicals entering water treatment plants, digital image analysis of
daphnid behaviour has the potential to detect other compounds which may need to be treated at
the plant, illustrating its many possible applications to water-quality monitoring. Digital image
analysis has excellent potential for use in multi-species, early-warning biomonitoring technology
due to its rapid detection rate and continuous automated online monitoring of water quality.
The locomotion of daphnids has many components, all of which are important to examine
in order to determine how a chemical is affecting behaviour overall. Individual characteristics of
swimming behaviour should be easily measured and sensitive to low levels of contaminants
(Dodson et al., 1995). Ren and colleagues (2009) have performed bioassays with a range of
contaminants evaluating changes in overall behavioural strength, defined as a “measure of
intensity of behavioural parameters representing motility”, including swimming velocity,
behavioural frequency, and movement extent (Ren et al., 2007; Ren et al., 2008). Using the
Multispecies Freshwater Biomonitor, in a laboratory setting, it was found that exposure to
various concentrations of the pesticides deltamethrin, chlorothalonil and nitrofen produced
significant decreases in the overall behavioural strength of adult daphnids after a 48-hour
exposure period (Ren et al., 2009). All treatments caused a decrease in overall swimming
activity and parameters associated with swimming. Responses were time- and concentration-
dependent with responses seen more quickly and having greater severity in higher concentrations
(Ren et al., 2009). A similar study found that three organophosphorous pesticides (dipterex,
malathion, and parathion) caused significant decreases in the behavioural strength of exposed
daphnids at concentrations of 0.045 µg/L, 0.38 µg/L and 0.125 µg/L respectively over 24 hours
(Ren et al., 2007). This decrease signifies a decrease in the activity level of the organisms
overall. Behavioural changes were again time- and concentration-dependent, with higher

14
concentrations causing a more marked change in behaviour over a shorter exposure time (Ren et
al., 2007).
The MFB can be used to evaluate the behaviour of a variety of organisms; however, the
D. magna is one of the most commonly used organisms during water quality testing with the
MFB. Typical movement behaviours which can be observed in D. magna using the MFB include
locomotion (big movements using antennae) and ventilation (small movements using the
phylopods within the carapace) (Gerhardt et al., 2003). In laboratory studies, a decrease in water
pH from 7.5 to 3.4 due to a pulse injection of acid resulted in a significant decrease in both
ventilation and locomotion observed by the MFB after 3 hours of exposure (Gerhardt et al.,
2003). Immediately following initiation of exposure to the acid, an increase in both activities was
detected, likely indicating a stress escape response (Gerhardt et al., 2003).
Dodson and colleagues (1995) also support the idea that multiple characteristics should
be studied when examining swimming behaviour. Using digital video analysis, changes in net
angle of swimming, average turning angle, sinuosity (the variance in change in direction between
video frames related to smoothness of swimming), upward and downward movement angles,
curvature co-efficient (calculation of variance from straight line swimming), vertical variance,
spinning, hopping and velocity of swimming were studied in response to the addition of the
pesticide carbaryl and predator kairomones into the water for 24 hours (Dodson et al., 1995).
Within 1 hour of exposure, significant decreases in velocity and turning angle were noted in the
highest concentrations of carbaryl. After 24 hours, changes were seen in multiple parameters in
all concentrations over 1 ppb (Dodson et al., 1995). This indicates that Daphnia are very
sensitive to low concentrations of contaminants and that evaluating changes in swimming
behaviour in the organisms is a useful mechanism for detecting these contaminants.
Changes in the general activity level and swimming speed of the organisms have also
been examined in response to environmental contaminants such as metals. Using digital video
analysis, the total amount of time the organisms were active and the swimming velocity at
several time periods over a 24 hour exposure to a range of copper (0-30 ppb) concentrations was
examined (Untersteiner et al., 2003). Daphnids displayed a significant decrease in the overall
time spent on active motion and in mean swimming velocity in 10, 20 and 30 ppb copper.
Responses were dependent on time and concentration, with higher concentrations causing a more

15
severe reaction in a shorter time span (Untersteiner et al., 2003). The use of secondary antennae
responsible for propulsion in Daphnia magna also showed a decreased beat frequency with
exposure to increasing copper concentrations (Untersteiner et al., 2003).
In addition to examining the effect of contaminants on the swimming behaviour of
daphnids, research has been conducted to examine how the organisms may change their
behaviour in the presence of chemicals given off by their predators. Using a digital video
analysis system called ExperVision, Szulkin and colleagues (2006) examined changes of
swimming behaviour in daphnids in the presence of kairomones produced by a predatory fish
and an insect. A decrease in swimming speed, hop rate, and sink rate and a shift to more
horizontal swimming was observed in both treatments (Szulkin et al., 2006).
Another movement based parameter which has been known to change in daphnids
following exposure to chemical contamination is phototactic response. Phototaxis is defined as
an oriented reaction to a light source (Gerhardt et al., 2006a). Phototaxis can be positive, with
directed movement toward a light source, or negative, with movement away from a light source
(Kieu et al., 2001; Gerhardt et al., 2006a; Martins et al., 2007a). Different strains of D. magna
will have different responses to light stimulation; however, the response of each strain is
considered to be a stable and repeatable behaviour under control conditions (Kieu et al., 2001).
Phototaxis is related to the diel vertical migration many daphnids undergo in natural conditions
and consists of active swimming in response to light changes (Cushing, 1951; Gerhardt et al.,
2006a). In natural settings, most daphnids respond to light with negative phototaxis during the
day, resulting in daphnids grouping near the bottom of the waterbody (Cushing, 1951; Gerhardt
et al., 2006a). This is explained by the idea that during the day daphnid predators such as fish
may be able to easily see the daphnids in the well lit upper portion of the water column (Cushing,
1951; Gerhardt et al., 2006a). Daphnids remain at the bottom of the water column during the day
and migrate to the top of the column at night to graze when the light source is no longer present
(Cushing, 1951; Gerhardt et al., 2006a). Higher rates of survival, resource exploitation, and
niche separation are seen in strains of daphnids which display these migration patterns (Goodrich
and Lech, 1990). Most ecotoxicological studies focus on positively phototactic strains of D.
magna which react to the presence of light by moving towards the top of the water column or
towards an artificial light source (Kieu et al., 2001). Phototactic response is a result of the

16
integration action of the nervous and muscular system in daphnids and can be altered by the
presence of toxic compounds (Kieu et al., 2001; Martins et al., 2007a). Several studies have
demonstrated that alteration of this behaviour is a relevant characteristic to be evaluated when
using BEWS (Gerhardt et al., 2006a). Most phototactic response studies involve creating an
artificial water column with a light source located at the top of the column. The tube is divided
into sections by height and the distribution of daphnids following exposure to the light source for
a given period of time is determined using a Phototactic Behaviour Index. Index values are found
by dividing the number of daphnids present in the upper section of the column by the total
number of daphnids in the column (Martins et al., 2007a). Values can range from 1, where all are
present in the upper section, to 0, where all are present in the lower sections (Martins et al.,
2007a). The Phototactic Behaviour Index value is a relative value in which values from daphnids
exposed to contaminants are compared to index values from control groups (Martins et al.,
2007a). If the experimental index value is lower than the control value, response to light stimuli
has been reduced due to the presence of the contaminant (Michels et al., 1999). If the difference
between index values is significant, the contaminant is considered to have an impact on the
phototactic behaviour of the daphnids. Phototactic behaviour can be monitored experimentally
by hand or automatically using digital image analyses similar to described above (Van Hoof et
al., 1994). Using digital image analysis, the number of D. magna moving in each section of the
column during light exposure periods is monitored. If this value differs significantly from the
control value an alarm is sounded (Van Hoof et al., 1994).
Several studies support the use of phototactic response in BEWS. Kieu and fellow
researchers (2001) found that there was a significant change in the phototactic response of
daphnids in the presence of both copper and PCP. At 33% of the LC50 of PCP and 37% of the
LC50 of copper, a significant decline in phototactic response was seen with less than 3 hours of
exposure (Kieu et al., 2001). Michels and colleagues (1999) found a similarly negative effect on
phototactic behaviour upon exposure to copper. At one-fifth of the LC50 value of copper, a
significant change in phototactic response was seen with less than 4 hours of exposure (Michels
et al., 1999). Martins and colleagues (2007a) found that eight common compounds found in
European waterways could be detected by changes in phototactic behaviour in daphnids at
concentrations 16-32 times lower than reported LC50 and EC50 values. This study showed rapid
changes in behaviour, as responses took place between 0.25-3.5 hrs of exposure (Martins et al.,

17
2007a). Changes in phototactic response were also measured in response to a variety of
compounds including heavy metals, pesticides, hydrocarbons, and other common environmental
pollutants, indicating that this method could be used in a multi-organism, early warning
biomonitoring technology where a variety of compounds could be found (Martins et al., 2007a).
Results from previous studies indicate that changes in phototactic behaviour in D. magna as a
response to chemical contaminants is a rapid and sensitive parameter and should potentially be
considered for use in multi-organism, early warning biomonitoring technology at water treatment
plants.
Respiration and Past Respiration Bioassays
In addition to examining changes in behaviour, several researchers have examined the
changes in Daphnia magna respiration rates in response to contaminant exposure and have
proposed using this parameter as part of a multi-organism, early warning biomonitoring
technology (Geiger and Buikema, 1981). One study examined the effects of long-term exposure
to varying concentrations of three different contaminants, CTAB (cetyltrimethylammonium
bromide – a commonly used surfactant), copper, and cadmium. Daphnids were exposed to the
contaminants for 8 days during their juvenile period and respiration was monitored continuously
using a Micro-Oxymax respirometer to determine the overall rate of oxygen consumption per
unit of organism biomass (Knops et al., 2001). Over the extended exposure period, no biomass
related changes in oxygen consumption were found for any of the treatments indicating that
overall metabolic rate of the organisms was not affected by chemical exposure (Knops et al.,
2001). Other studies have found similar results using shorter exposure periods. In a study
examining the effects of naphthalene, phenanthrene, fuel oil, and creosote on the respiration rates
of Daphnia pulex, Geiger and Buikema (1981) used modified Winkler titrations to monitor the
dissolved oxygen content of test vessels containing Daphnia exposed for 24 hours. No
significant differences in any of the chemical treatments were seen when compared to the control
respiration rate of 0.10 µL oxygen/Daphnia/day (Geiger and Buikema, 1981). Sigmon (1979)
also found that exposure to concentrations of 1 and 3 ppm of the pesticide 2,4 – D had no effect
on overall oxygen consumption, which was measured continuously by a respirometer over a 9
hour exposure period.

18
Other short-term studies examining Daphnia respiration have found contradictory results.
When exposed to 1 and 3 ppm of the pesticide 2,4,5 – T, Daphnia pulex showed a significant
decrease in oxygen consumption in the 1 ppm treatments and a significant increase in the 3 ppm
treatments (Sigmon, 1979). A study exploring the effects of UV radiation on oxygen
consumption in Daphnia catawba found that there was there was a significant increase (31.8%)
in oxygen consumption when test organisms were exposed to 2.08 kJ UVB radiation for 12 hours
(Fischer et al., 2006). However, when radiation was increased to 4.16 kJ UVB radiation, there
was a significant decrease (70.6%) in oxygen consumption during the same period. No change
was seen at intermediate levels of UVB exposure (Fischer et al., 2006). In this study, respiration
was stimulated at the lowest stress level but depressed at the highest stress level while no
significant differences were noted at intermediate exposures.
Rationale for Use of Daphnia magna as Bioassay Organisms
Daphnia magna have been shown to be highly sensitive to a variety of common
environmental contaminants. The organisms are of ecological significance in Canadian
waterways and further study of their responses to stressors will provide a better idea of impacts
from contaminants on populations in natural habitats. Daphnia demonstrate several defined and
quantifiable behavioural parameters which have been examined using digital video analysis and
their use in BEWS and sub-acute bioassays have already been established. Additional work
examining the effects of TBT and atrazine, the two contaminants examined extensively in this
thesis, will contribute to an existing body of knowledge about the impacts of contaminants on
daphnid behavioural patterns. An extensive literature review has revealed limited past research
on the impacts of these two contaminants on daphnid movement, suggesting that further research
should be conducted in order to help create a dose-response model in order to detect specific
concentrations of the contaminants. Daphnia have also been used in respiration bioassays;
however, varying results have been obtained suggesting that the organisms may not be suitable
to use for direct measurements of oxygen consumption. Further study in this project will aim to
determine if direct measure of the oxygen consumption of daphnids is a suitable measure of
stress and whether it should be incorporated into a multi-species, early-warning biomontoring
technology.

19
1.5.2 Hyalella azteca
Background
The second test organism used for laboratory bioassays in this project is Hyalella azteca
(Figure 2), a freshwater amphipod which is highly sensitive to aquatic contamination (Wang et
al., 2004). Hyalella are one of the most
commonly-used organisms in aquatic
toxicity testing and have been most
used in sediment toxicology testing due
to their close contact with sediments
(Collyard et al., 1994; Borgmann et al.,
1996; Hatch and Burton, 1999).
Hyalella are useful test organisms in a
laboratory setting as they are easily
cultured and mature quickly (Wang et
al., 2004). Hyalella can survive in
water with a wide range of dissolved oxygen content, alkalinity, sediment size, and organic
matter content, making them easy to care for in a controlled setting (Wang et al., 2004).
Organisms can grow to be up to 5 mm in length and a variety of ages and sizes have been used in
past toxicity testing (Collyard et al., 1994).
Hyalella are widespread throughout North and South America, and are present in the
Great Lakes region (Blockwell et al., 1998; Wang et al., 2004). They are the most common
freshwater amphipod in North America and play an important role in the ecosystems in which
they are present (Borgmann et al., 1996). In their natural habitat, these organisms are
omnivorous detritivores feeding on algae, leaf litter, freshly-killed animals, small isopods,
bacteria and aquatic plants, thus helping to recycle nutrients and maintain water clarity
(Blockwell et al.,1998; Wang et al., 2004). These organisms prefer a solid substrate and often
live in algae mats, rocky habitats or in the sediment (Wang et al., 2004). Hyalella are exposed to
contaminants from a variety of sources including the water column, sediments while foraging for
Figure 2: Image of Hyalella azteca (American Society of
Limnology and Oceanography, 2004)
5 mm

20
food, and from food particles which have bound contaminants (Wang et al., 2004). Hyalella also
are an important food source for higher organisms including fish, waterfowl, wading birds, and
larger macroinvertebrates (Borgmann et al., 1996; Blockwell et al.,1998).
Behaviour and Past Behaviour Bioassays
One behavioural parameter that has been studied in the past in Hyalella is burrowing. As
these organisms are closely associated with the sediment phase of the aquatic environment, it
seems logical that these organisms may burrow into sediment for a variety of reasons, including
predator avoidance and foraging for food. There is some question as to whether burrowing is a
normal behaviour and whether or not the amount of time spent burrowing by these organisms
varies under stress conditions (Wang et al., 2004). In nature, it has been noted that Hyalella are
generally found in the top 1-2 cm of sediment, with over 70% of the organisms in the top 0.5 cm
(Wang et al., 2004). These results were observed through sediment core sampling and may not
reflect an accurate picture of true burrowing behaviour due to the disruptive nature of the
sampling technique which may have caused Hyalella to burrow more deeply (Wang et al., 2004).
Wang and colleagues (2004) suggest that the organisms should be found at the interface between
water and sediment where oxygen levels are higher and algae are much more abundant than
within the sediment, and that there is no need for the organisms to continually burrow in order to
collect food. Under control conditions, it has been noted that Hyalella spend the majority of their
time at the sediment-water interface and moved along the sediment by crawling and through the
water column using a “sideswimming” movement (Wang et al., 2004). Burrowing only occurred
in response to water perturbation or when the organisms were frightened (Wang et al., 2004).
When burrowing did occur, the organisms did not remain permanently within the sediment and
were often seen to emerge after varying periods of time (Wang et al., 2004). It is believed that
burrowing behaviour in Hyalella azteca is a type of avoidance behaviour and that in the presence
of contaminants, the organisms are more likely to burrow in an attempt to escape hazardous
substances (Hatch and Burton, 1999). Hatch and Burton (1999) showed that adult Hyalella spent
significantly more time burrowed in sand and soil sediments when exposed to various
concentrations of the poly-aromatic hydrocarbon fluoranthene than organisms in clean water. As
concentrations of the contaminant increased from 6.25-25 µg/L, the amount of time and the
number of organisms which had formed burrows increased (Hatch and Burton, 1999). In the

21
same study, the grouping behaviour of Hyalella was also examined in the presence of
fluoranthene. Grouping occurred when two or more Hyalella aggregated together within the test
vessel and was considered to be a stress response in the organisms (Hatch and Burton, 1999). As
concentrations of the contaminant increased, a significant increase in the number of the
organisms grouping was seen compared to the control treatments (Hatch and Burton, 1999).
Several studies have shown that the majority of contaminant exposure in Hyalella comes
from food sources and from the water column, rather than from sediment exposure (Suedel and
Rodgers, 1996; Wang et al., 2004; Moore et al., 2006). When exposed to chronic, sub-lethal
concentrations of cadmium, an increase in accumulation in body tissues is seen with increased
levels of cadmium found in the water column but not when in the contaminant is present in
increased concentrations the sediment (Wang et al., 2004). This is likely because either water or
food particles in the water column are the major source of contaminant exposure, as opposed to
sediment (Wang et al., 2004). Moore and colleagues (2006) found that Hyalella growth rates
were significantly reduced in the presence of several pesticides when chronically exposed to the
contaminants in the water column. The contamination of sediments with the equivalent levels of
pesticides caused no change in the overall growth rates of the organisms (Moore et al., 2006).
Given that water is likely the major contaminant source for Hyalella, it follows that if the
organisms are able to detect changes in the water column, they may attempt to avoid
contaminants by burrowing into clean sediment in order to decrease their exposure to harmful
compounds (Hatch and Burton, 1999). Changes in burrowing behaviour, the amount of time
spent burrowing, and the numbers of the organisms in a population burrowing after a period of
exposure are therefore potential factors to be considered for use in a multi-species early-warning
biomonitoring system. Changes in other locomotory behaviour may also be induced in response
to stress, validating the study of changes in swimming and crawling behaviour in the presence of
increasing concentrations of contaminants (Wang et al., 2004). Finally, it has been seen that the
tendency of Hyalella azteca to form groups increases when the organisms are stressed (Hatch
and Burton, 1999), indicating that this may be an important parameter to examine and potentially
incorporate in our technology.
22
Respiration and Past Respiration Bioassays
It has been noted that in addition to changes in behaviour in response to contaminants,
many invertebrates also exhibit increased or decreased physiological and metabolic functioning,
which is evident through changes in their overall oxygen consumption. Not a great deal of work
has been published examining the effects of aquatic contaminants on the respiration of Hyalella
azteca. However, the effect of temperature stress on respiration has been studied in this
organism. Changes in oxygen consumption in response to temperature stress were examined by
Oberlin and Blinn (1997) using the closely related species, Hyalella montezuma. Oxygen
measurements were made using an oxygen electrode after adult Hyalella montezuma were
exposed for 30 minutes to treatments of 20, 25 and 30 degrees Celsius (Oberlin and Blinn, 1997).
As temperatures increased, a significant increase in oxygen consumption per unit mass was noted
as well as an increase in associated metabolic enzyme function (Oberlin and Blinn, 1997). This
increase in respiration and metabolism was attributed to an overall increase in organism
movement and activity in response to increased temperatures (Oberlin and Blinn, 1997). Results
of this study indicate oxygen consumption measurements are indeed possible using Hyalella and
should be adapted for use when examining different stressors in the environment and validate the
use of adult Hyalella for this type of bioassay.
Rationale for Use of Hyalella azteca as Bioassay Organisms
Hyalella azteca have been shown to be highly sensitive to a variety of common
environmental contaminants and their use has been long established in toxicity testing. The
organisms are ecologically significant in Canadian waterways and further study of their
responses to stressors will provide a better idea of impacts from contaminants on populations in
natural habitats. Hyalella demonstrate several defined and quantifiable behavioural parameters
and which have been monitored using digital video analysis and could potentially be evaluated in
a multi-organism, early-warning biomonitoring technology. To date, few studies have been
conducted examining changes in behaviour in a sub-acute time period and this project will help
to determine if this organism can be used for rapid detection of contaminants in less than 24
hours. Information about respiration rate changes in response to chemical contamination in
Hyalella is also lacking, especially at a sub-acute level. Experiments conducted as part of this
project will help to determine if Hyalella are suitable to use for this type of toxicity testing.

23
1.5.3 Lumbriculus variegatus
Background
Lumbriculus variegatus (Figure 3) (also known as the blackworm or mudworm) are a
species of freshwater oligichaete worm commonly used in aquatic toxicity testing (Drewes and
Cain, 1999; O’Gara et al., 2004; Gerhardt, 2007a; Gerhardt, 2009). Lumbriculus are easy to raise
in a laboratory setting, maintain and handle (Leppanen and
Kukkonen, 1998; Ding et al., 2001). Lumbriculus are commonly
used in bioaccumulation studies, in helping to determine the
trophic status of lakes, in sediment toxicity testing due to their
close contact with aquatic sediment, and in metabolic rate and
toxicokinetic studies (Leppanen and Kukkonen, 1998; O’Gara et
al., 2004; Gerhardt, 2007a; Gerhardt, 2009). These organisms
also have the potential to be used in toxicity tests determining
mortality, reproduction, metabolic changes and behavioural
changes in response to contaminants (Leppanen and
Kukkonen, 1998; Gerhardt, 2007a). Lumbriculus have also
been used in microcalorimetry tests where the heat given off by
the organisms was measured and used to determine if changes
in metabolism occurred in response to contaminants (Leppanen and Kukkonen, 1998).
Lumbriculus are more useful in aquatic toxicity testing compared to other worm species
(e.g. Tubifex tubifex) as these organisms live in the sediment and water column at the same time
(Drewes and Fourtner, 1989; Gerhardt, 2007a). This allows for exposure to contaminants in both
compartments of the aquatic environment. Lumbriculus are also more sensitive to low
concentrations of certain contaminants and have a defined set of behaviours which can easily be
monitored (Gerhardt, 2007a). Lumbriculus also demonstrate free swimming and crawling
behaviour which is not seen in Tubifex (Drewes and Cain, 1999; Drewes, 1999).
Lumbriculus variegatus are universally distributed in North America and Europe,
including the Great Lakes ecosystem (Ding et al., 2001; O’Gara et al., 2004; Gerhardt, 2007a).
They have also been introduced to Africa, Australia, and New Zealand (Ding et al., 2001;
Figure 3: Image of Lumbriculus
variegatus (University of Iowa,
2009).
3 cm

24
O’Gara et al., 2004). Lumbriculus are benthic and often are commonly found in the shallow
areas of freshwater ponds, lakes, slow flowing rivers, and marshes (Putzer et al., 1990; O’Gara et
al., 2004; Gerhardt, 2007a). The organisms are tolerant of a wide range of oxygen concentrations
in their environment as they are subject to such fluctuations with changes in seasons (Putzer et
al., 1990). The worms play an important role in aquatic communities as they aid in the
decomposition of organic matter in the sediment and act as a food source for animals higher in
the foodweb (O’Gara et al., 2004). Worms feed on decaying vegetation, micro-organisms, and
sediment (Gerhardt, 2007a).
In the laboratory, the worms reproduce primarily by asexual morphollaxis, where the
body fragments into two or more pieces from which new organisms are able to grow (Drewes
and Fourtner, 1989; Gerhardt, 2007a). Regeneration of new worms takes a few weeks following
complete separation (Drewes and Fourtner, 1989). In the wild, the organisms have also been
observed to reproduce sexually (Drewes and Fourtner, 1989).
Several types of behaviour under normal conditions have been determined and described
for Lumbriculus. In a natural habitat, when sediment material is present, worms will burrow their
anterior ends in the sediment and extend the tips of their tails into the water column to allow for
gas exchange via the dorsal blood vessel (Drewes and Fourtner, 1989; Ding et al., 2001; O’Gara
et al., 2004; Gerhardt, 2007a). Lumbriculus in this position will respond to tactile stimulation or
shadow by withdrawing their posteriors into the sediment (Drewes and Fourtner, 1989; Ding et
al., 2001). Worms have photosensors and chemoreceptors on their posterior segments which
allow them to detect changes in light and water quality and rapidly respond to avoid danger
(Drewes and Fourtner, 1989). On smoother surfaces, the organisms move along the substrate
using a crawling motion (Ding et al., 2001). Finally, in open spaces, the organisms respond to
head stimulation by performing a body reversal and to tail stimulation by swimming in a helical
pattern, described in greater detail below (Ding et al., 2001). These behaviours are well studied
and easy to monitor, making them an ideal organism to use in a multi-species, early-warning
biomonitoring technology based on organism movement and other behavioural patterns.

25
Behaviour and Past Behaviour Bioassays
Lumbriculus variegatus display a number of characteristic movement behaviours which
are easily monitored and are subject to change under stress conditions. In response to tactile or
other stimulation to its tail region worms display what is known as helical swimming (Drewes,
1999; Ding et al., 2001; O’Gara et al., 2004). This behaviour is characterized by rapid shortening
of the body and rhythmic waves of helical body bending which alternate between the left and
right sides of the organism’s body. Movement progresses forward from head to tail, rapidly
moving the worm forward (Drewe, 1999; Ding et al., 2001; O’Gara et al., 2004). The organisms
appear to “corkscrew” through the water to a safer location away from the stimulus and often
follows a helical swimming event with continued crawling (O’Gara et al., 2004). As
Lumbriculus live with their tails extended into the water column, leaving them vulnerable to
predation, this movement style has developed to allow for rapid escape when threatened (O’Gara
et al., 2004). Helical swimming events usually last less than 1 second following stimulation and
are often followed by crawling behaviour (Drewes, 1999). Swimming is advantageous in open
spaces where worms may have little traction to perform crawling and it allows the organisms to
move more quickly than normal crawling (Drewes and Cain, 1999).
Lumbriculus also display a characteristic locomotion response when stimulated in the
head region. When the anterior 1/3 of the worm is touched, it rapidly withdraws in what is
known as a reversal behaviour (Drewes, 1999). Reversal behaviour begins with a rapid
shortening of the body mediated by longitudinal muscles along the length of the body. The worm
will then bend the posterior part of its body into a “J” shape and flip the anterior end around so
that it is pointed away from the source of stimulation (Drewes, 1999). This type of behaviour
allows the worm to reposition its head away from the threat, as they are unable to swim
backwards (Drewes and Cain, 1999). When the worm has reversed its body, it is then able to
swim rapidly away from the threat. Worms often aggregate around a food source in nature and
when they are disturbed, they will reverse rapidly and swim away from the pack. This likely
confuses predators and improves the individual chances of survival for each worm (Drewes and
Cain, 1999; Drewes, 1999). Both swimming and body reversal provide the organisms with a
faster way to escape predators than typical crawling behaviour and allows for rapid relocation to
a safe habitat.

26
On smooth substrate, worms also possess a characteristic crawling behaviour which can
be easily observed. Crawling consists of a series of rhythmic peristaltic contractions beginning at
the anterior end of the worm and moving towards the tail (Ding et al., 2001). Crawling is
performed using contractions of circular and longitudinal muscles along the length of the worm’s
body and is assisted by chaetae located on each segment of the body (Drewes and Cain, 1999).
Movements are slower and do not display the helical bends seen in helical swimming.
Several studies have looked at the changes of behaviour which occur in the stereotyped
Lumbriculus movement described above in response to various chemical contaminants. Ding and
colleagues (2001) examined the effects that sub-lethal concentrations of the insecticide
ivermectin had on the swimming and reversal behaviour and crawling rate of the organisms after
0, 1, 3 and 8 hours of exposure using digital video analysis. The study found that exposure to the
insecticide resulted in changes to helical swimming and body reversal in a time- and
concentration-dependent manner (Ding et al., 2001). At the highest concentration of 300 nM,
worms were paralyzed after only 1 hour of exposure and displayed no swimming, reversal or
crawling behaviour (Ding et al., 2001). The effects of lower concentrations of the chemical were
similar, but less extreme and required longer exposure periods for complete reaction (Ding et al.,
2001). For example, changes in helical wave patterns were noted with waves beginning in the
middle of the body rather than the anterior end of the worm (Ding et al., 2001). IC50 values for 3
hours of exposure were calculated for helical swimming, reversal and crawling and were found
to be 1.1, 16 and 90 nM ivermectin respectively (Ding et al., 2001). Results of this study indicate
that changes in Lumbriculus behaviour are a very sensitive parameter and that responses are seen
at very low concentrations of contaminant indicating their suitability for use in a multi-species,
early-warning biomonitoring technology.
Further studies on the impacts of contaminants on the helical swimming and body
reversal of Lumbriculus were performed by O’Gara and colleagues (2004). The ability of the
organisms to respond to head and tail stimulus after 0,1,3, and 8 hours of exposure to copper
concentrations ranging from 12.5-102 µg/L was examined using digital video analysis (O’Gara
et al., 2004). Immediately following initial exposure, the organisms were observed to be
hyperactive with a great deal of writhing and coiling of bodies observed, but quickly became
lethargic and non-responsive to tactile stimulation (O’Gara et al., 2004). Shortening of body

27
length was also observed in all concentrations following 3 hours of exposure (O’Gara et al.,
2004). The time of immobilization was concentration-related, as were changes in swimming and
reversal behaviour (O’Gara et al., 2004). Over the 8-hour exposure period, all concentrations of
copper significantly affected the ability of worms to move in response to stimulation, indicating
the organisms ability to escape from predators would be impaired (O’Gara et al., 2004).
In addition to locomotory behaviour, avoidance behaviour has been studied in
Lumbriculus variegatus. Lumbriculus inhabit sediment and are able to burrow into sediment to
avoid predators and in theory to avoid chemical contaminants in the water column (Gerhardt,
2007a). Gerhardt (2007a) examined the spontaneous locomotory activity of Lumbriculus when
exposed to clean water/contaminated sediment and contaminated water/clean sediment, and
monitored the avoidance behaviour of the organisms by examining the amount of time spent
moving in total and between the two compartments. The study was conducted using the
Multispecies Freshwater Biomonitor (MFB) for a period of 24 hours with exposures to
concentrations of lead ranging from 0.1-10 mg/L (Gerhardt, 2007a). In all treatments of lead
with both contaminated water and sediment, a significant change in the amount of time
performing locomotion was noted. An increase in activity was seen after initial exposure
followed by a significant decrease or no movement near the end of the exposure period
(Gerhardt, 2007a). It was also observed that the test organisms were more active when exposed
to contaminated water than contaminated sediments, indicating that burrowing occurred in
response to the addition of contaminants in the water column (Gerhardt, 2007a). This indicates
that burrowing is a useful potential parameter to monitor and utilize in a multi-species, early-
warning biomonitoring technology.
Respiration and Past Respiration Bioassays
Some work has been conducted to examine the impact of contaminants on respiration and
overall metabolism of Lumbriculus variegatus; however, a great deal still needs to be done.
Penttinen and Kukkonen (2000) examined the effects of a range of concentrations of PCP (0.05-
1 nM) on the metabolism of Lumbriculus variegatus using microcalorimetry over a 72-hour
period. Microcalorimety measures changes in water temperature and associates these changes
with an increase or decrease in overall metabolism. An increase or decrease in metabolism can
then be associated with an increased or decreased oxygen demand (Penttinen and Kukkonen,

28
2000). Results showed that all concentrations of PCP raised the metabolic rate of the population
of worms, thus indicating increased aerobic respiration (Penttinen and Kukkonen, 2000).
However, it was found that worms needed to be exposed to the contaminant for at least 24 hours
to allow for accumulation of the toxicant in the tissues before any change in metabolism was
seen (Penttinen and Kukkonen, 2000).
Rationale for Use of Lumbriculus variegatus as Bioassay Organisms
Lumbriculus variegatus have been shown to be highly sensitive to a variety of common
organic and inorganic environmental contaminants and are commonly used in ecotoxicological
testing. The organisms are ecologically-significant in Canadian waterways and further study of
their responses to stressors will provide a better idea of impacts from contaminants on
populations in natural habitats. Lumbriculus demonstrate several defined and quantifiable
behavioural parameters which have been examined using digital video analysis and their sub-
acute bioassays have already been established. Studying the effects of TBT and atrazine on the
behaviour of these organisms will determine if they are suitable species for use in multi-species,
early-warning biomonitoring technology and whether they are able to detect and react to the two
environmental contaminants in exposure periods of less than 24 hours. Some research has used
Lumbriculus to indirectly examine changes in respiration; however, little work has been done
with respect to direct measurements of oxygen consumption and whether this is a suitable
parameter to use with these organisms in a multi-species, early-warning biomonitoring
technology. This study aims to determine if direct oxygen consumption measurements with
Lumbriculus are appropriate for incorporation into a multi-species, early-warning biomonitoring
technology.
1.6 Bioassay Contaminants
1.6.1 Tributyltin
Background
Tributyltin (TBT) (Figure 4) is a trisubstituted organotin which is highly persistent in the
aquatic environment and is toxic at the nanogram per litre level to many organisms (Alzieu,
1998; Horry et al., 2004). Tributyltin is hydrophobic and has an octonal-water partitioning co-
efficient which ranges from 3.21 to 3.85 depending on the species of the chemical and the

29
temperature and pH of the water (Alzieu, 1998). The compound comes in many forms including
oxides, chlorides, fluorides, and acetate, each
of which are slightly soluble in both freshwater
and seawater (Alzieu, 1998). Solubility values
range from 1-10 mg/L for tributyltin oxide,
depending on the composition of the water, and
under 20 mg/L for other types of the compound
(Alzieu, 1998).
The major source of TBT in the aquatic
environment is from leaching of anti-fouling
paints from boats and cargo ships (Fent and
Looser, 1995; Borgmann et al., 1996; Chau et
al., 1997; Alzieu, 1998; Konstantinou and Albanis, 2004). This represents over 70% of the usage
of TBT (Alzieu, 1998). TBT is applied as a paint additive to the submerged section of boats and
other floating structures such as oil rigs, buoys, and fish cages (Alzieu, 1998; Konstantinou and
Albanis, 2004). The compound acts as a biocide which prevents the growth of living organisms
on surfaces which may slow ships, increase fuel usage, cause corrosion, and increase the weight
of floating structures (Alzieu, 1998). Ship paints also often include solvents which aid in
application and make TBT compounds more soluble in water (Alzieu, 1998). It is estimated that
the daily leaching rate of TBT is between 1 and 10 µg/L TBT per cm2 of application area
(Alzieu, 1998). This results in the addition to the environment of between 0.2 and 2 grams of
TBT per day for a small sailboat and between 50 and 500 grams of TBT per day for a large
commercial vessel (Alzieu, 1998). TBT concentrations are highest in areas of high shipping and
boating traffic, but the compound has also been detected in freshwaters removed from harbours
and shipping areas (Borgmann et al., 1996). The use of TBT in shipping has been regulated in
Canada since 1990 (regulation history described below); however, the compound is still found in
measureable quantities in many ecosystems causing concern about the impacts it may have on
aquatic life (Borgmann et al., 1996; Konstantinou and Albanis, 2004). Pulse introductions of
TBT into the environment are also of concern as large ships move through waterways (Fent,
1996). Environment Canada has established interim water quality guidelines of 3.3 ng tin/L of
water in order to protect aquatic organisms (Chau et al., 1997). This value was derived by
Figure 4: Chemical structure of TBT hydroxide
(National Center for Biotechnology Information
PubChem (2009a)

30
determining the lowest reported chronic exposure effect in literature and applying a safety factor
of 10 (Chau et al., 1997). Health Canada has no drinking water quality guidelines for either TBT
or tin in general (Canadian Drinking Water Quality Guidelines, 2008).
Other significant sources of TBT include remobilization from contaminated sediments
and suspended particles in the water (Fent and Looser, 1995; Chau et al., 1997; Alzieu, 1998). It
is also used as a slimicide at nuclear power plants and as an industrial and agricultural pesticide,
resulting in runoff into aquatic environments (Borgmann et al.,1996; Chau et al., 1997). TBT can
also be used as a PVC stabilizer, resulting in leaching from PVC piping into waterways (Chau et
al.,1997; Borgmann et al., 1998). The compound is also used as a wood preservative and in some
factories as an industrial catalyst (Fent and Looser, 1995; Borgmann et al.,1996). Many common
industrial and urban uses result in a build-up of TBT in wastewater, which is eventually released
into the aquatic environment from wastewater treatment plants (Fent and Looser, 1995; Alzieu,
1998).
The current method for detecting TBT is using either gas chromatography/mass
spectrometry or inductively coupled plasma mass spectrometry, processes which are very
expensive and do not provide rapid results (Horry et al., 2004). A biosensor which uses
genetically-altered strains of E. coli which fluoresce in response to low levels of TBT and its
metabolite dibutyltin (DBT) have been developed (Horry et al., 2004). The sensor is able to
detect concentrations of TBT less than 26 µg/L and DBT under 0.03 µg/L (Horry et al., 2004).
The need for the development of alternative means of detecting the chemical is needed. The
development of a dose response model for TBT which could be incorporated in a multi-species,
early-warning biomonitoring system would therefore be highly beneficial in order to help water
treatment plant managers detect the presence and concentration of the organotin contaminant.
Tributyltin Ban
Due to its toxic nature, TBT has been banned for use as an anti-fouling agent on small
boats in Canada, the United States, Japan, and Western Europe (Fent and Looser, 1995). The use
of TBT as a paint additive began in the 1960s and in the early 1980s, several countries began to
restrict its use due to toxic effects observed in several aquatic species (Alzieu and Heral, 1984;
Alzieu et al., 1986; Fent, 1996; Chau et al., 1997). In 1982, France was the first country to

31
restrict the use of the compound in boats less than 25 metres in length and with a mean leaching
rate of more than 4 ug/cm2/day (Chau et al., 1997; Alzieu, 1998). Bans in the United Kingdom
(1987), the United States (1988), Australia (1989), the Netherlands, Hong Kong and Japan
(1992) soon followed (Chau et al., 1997). Canada first introduced restrictions in 1989 under the
Pest Control Products Act which restricted the use of TBT as an anti-fouling agent on boats
under 25 m in length (Borgmann et al.,1996; Chau et al., 1997; Alzieu, 1998). In 2001, the
European Council included TBT as a priority substance in its policy on water quality and all
countries within the European Union (EU) were required to restrict the use of the substance
(Alzieu, 1998; Horry et al., 2004). An international ban on the use of TBT was introduced in
2003 by the International Maritime Organization (IMO) and the Marine Environment Protection
Committee; however, many countries which export goods are not signatories to the convention
and large boats still may use the compound (Konstantinou and Albanis, 2004).
In general, reductions in concentrations of TBT in freshwater environments and the
recovery of populations of organisms affected by the contaminant have been seen since the bans
were enacted in Canada and throughout the world. In Canada, TBT, DBT and MBT are found in
freshwater much less frequently and in lower concentrations with lower mean ranges than prior
to the restrictions started in the 1980s (Chau et al.,1997). However, reductions are often not seen
in areas of high shipping traffic and with large ships not subject to the restrictions or in areas
where boats are present which may have been painted prior to 1989 (Fent, 1996; Chau et al.,
1997). In some areas, TBT concentrations still exceed the Environment Canada interim water
quality guidelines for the protection of aquatic life (Chau et al., 1997). Because of the persistence
of the contaminant, the introduction of more TBT from boats not restricted by international bans
and because of its potential to be resuspended in the water column, TBT remains an important
environmental contaminant whose effect on organism behaviour and physiology should be
examined for potential detection using a BEWS.
Human Health Concerns
Contact exposure to TBT can cause irritations in the skin and eyes, which may lead to
severe dermatitis (Alzieu, 1998). No cases of poisoning via ingestion have ever been reported in
humans (Alzieu, 1998).

32
Environmental Concerns
TBT is highly lypophillic due to its three alkyl groups and low solubility in water
(Maguire, 1987). This can lead to bioaccumulation of the contaminant in the fatty tissues of
living organisms and biomagnifications within the aquatic foodweb (Maguire, 1987). TBT exerts
its toxic properties at a cellular level by causing malformations of the mitochondrial membrane
(Alzieu, 1998). At extremely low concentrations in the body, TBT stimulates the production of
ATP and inhibits its conversion to ADP, leading to cellular malformations and decreased
metabolic output (Fent, 1996). TBT has also been linked to endocrine disruption in several
organisms at sub-lethal concentrations (Horry et al., 2004).
Concerns were first raised in the 1970s about the potential toxicity of TBT and its
metabolites. A decline in shellfish populations had been noted in the Archachon Bay region of
France, with abnormal reproduction, shell calcification problems and decreases in overall
population numbers being noted in primarily in the mollusc Crassostrea gigas (Alzieu and Heral,
1984; Alzieu et al., 1986; Maguire, 1987). The population changes were most commonly seen in
harbour areas, leading researchers to believe that TBT may be the cause (Alzieu and Heral, 1984;
Maguire, 1987). The decline in mollusc populations negatively affected the economically
important shellfish industry in the Atlantic region of France, and lead to that country’s TBT ban
introduced in 1982 (Alzieu and Heral, 1984; Fent, 1996). Molluscs have been shown to be
particularly sensitive to endocrine disruption caused by TBT, often with parts per trillion (ppt)
concentrations causing significant health effects (Alzieu, 1998). Concentrations under 1 ng/L
cause imposex (the appearance of male characteristics in female organisms) in many species of
gastropods (Alzieu, 1998). This can lead to sterility in organisms and a decline in overall success
of the population (Alzieu, 1998). Concentrations of 2 ng/L have caused increased shell
calcification in the oyster Crassostrea gigas, while concentrations around 20 ng/L have caused a
decline in reproduction in other bivalve molluscs (Alzieu, 1998).
Other organisms are less sensitive to the presence of TBT in their environment, but still
show a reaction in low concentrations of the compound. Concentrations between 1 and 10 µg/L
affect the reproduction of most species of fish studied, whereas concentrations between 1-1000
µg/L affects the swimming behaviour of several species of fish (Alzieu, 1998). Several species
of crustaceans have also demonstrated reduced reproduction, as well as reduced neonate and

33
juvenile growth rates when exposed to sub-lethal concentrations of TBT (Schmidt et al., 2005).
LC50 values for organisms are very low as well, with 10-day LC50 values in amphipods ranging
from 1.5-32 µg/L depending on species and 4-day LC50 values for rainbow trout and lake trout of
1.4 and 5.2 µg/L respectively (Borgmann et al., 1998).
Tributyltin in Aquatic Ecosystems
Although the use of TBT has been banned, it is still a contaminant of significant concern
in the aquatic environment in Canada and throughout the world. Worldwide chronic
concentrations exceeding 100 ng/L have been found in both fresh and marine environments
following the ban (Fent and Looser, 1995). Prior to the TBT ban in North America
concentrations in freshwater averaged between 50 and 500 ng/L, with a highest recorded chronic
value of 1 µg/L in several heavily-travelled harbours (Alzieu, 1998). In a 1994 study following
the introduction of the TBT ban in Canada, several freshwater areas still had concentrations of
TBT exceeding the interim limit to prevent damage to aquatic life (Chau et al., 1997). In this
study, 12 of 89 tested sites had detectable levels of TBT in freshwater, with concentrations up to
17.8 ng/L (Chau et al., 1997). Of these 12 sites, 9 had concentrations which exceeded the
guidelines to protect freshwater aquatic life (Chau et al., 1997). Within the sediment, 42 of 89
samples had detectable levels of TBT, with the maximum recorded concentration being 975 ng
tin/g sediment (Chau et al., 1997). Concentrations in industrial effluent have been recorded as
high as 61.8 µg/L in Germany, indicating that industrial emissions may be a significant source of
pulses of TBT into the environment (Schmidt et al., 2005). Although concentrations have
generally declined since the TBT ban, its presence is still seen in heavily-travelled shipping areas
and harbours in concentrations which could potentially affect aquatic organisms.
TBT is very persistent in the aquatic environment and its environmental chemistry and
fate in the environment are not completely understood (Fent and Looser, 1995; Fent, 1996;
Alzieu, 1998; Horry et al., 2004). The compound is present in all components of the aquatic
environment, including water, sediments, bound particles, and in living organisms (Alzieu,
1998). In the water column, the half-life of the compound will vary depending on temperature,
pH, turbidity and light conditions, but generally ranges from a few days to several weeks (Fent,
1996; Alzieu, 1998). TBT degrades much more slowly in sediment, with a half-life of several
years (Borgmann et al.,1996; Alzieu, 1998). TBT in sediments has the potential to be

34
resuspended in the water column and thus poses a continued threat to water quality (Fent, 1996;
Chau et al.,1997). Approximately 5% of TBT introduced to the aquatic ecosystem is found
adsorbed to suspended particles in the water column where they are available to filter-feeding
organisms (Alzieu, 1998). TBT is broken down by pH-dependent hydrolysis to the less toxic
metabolites dibutyltin (DBT) and monobutyltin (MBT) (Fent and Looser, 1995). The bond
between the tin and carbon molecules can also be fractured by UV photolysis and the action of
some micro-organisms, again breaking down to DBT and MBT (Alzieu, 1998).
Tributyltin and Past Bioassays with Study Organisms
Several bioassays have been performed in the past using study organisms explored in this
study. Fent and Looser (1995) examined the uptake and bioaccumulation of TBT in Daphnia
magna with respect to changes in pH in the water. It was found that Daphnia take up and
accumulate significantly more TBT, DBT and MBT in water with a pH of 8.0 than in water with
pH 6.0 after 72 hours of exposure to sub-lethal concentrations of the contaminant (Fent and
Looser, 1995). It is known that in higher pH conditions, TBT is present in the TBT-OH form,
rather than the TBT+ form found at lower pH (Fent and Looser, 1995). TBT-OH is more
lipophilic than the charged species and is more able to cross biological membranes (Fent and
Looser, 1995). This indicates that water conditions may impact the uptake and overall toxicity of
TBT to study organisms.
Bioassays examining the changes in swimming behaviour of Daphnia magna in response
to TBT have also been performed. Schmidt and colleagues (2005) used the BehavioQuant video
imaging system to monitor changes in swimming speed, swimming depth and secondary
antennae use after 21 days of exposure to 6.6 µg/L of TBT in adult organisms. A significant
decrease in mean velocity was noted after 19 days of exposure and a significant decrease in
swimming depth and antennae movement was observed after 10 days of exposure (Schmidt et
al., 2005). A 21-day LC50 value of 2.5 µg/L was determined for organisms used in this
experiment (Schmidt et al., 2005). Also noted was a 35% decrease in reproduction for organisms
over the 21-day experiment, with an NOEC concentration of 0.16 µg/L found for reproduction
over 21 days (Schmidt et al.,2005).

35
Mortality bioassays for Daphnia magna have determined a variety of 48-hour LC50
values. LC50 values vary based on the species of TBT examined and are generally between 2.3
and 70 µg/L (Schmidt et al., 2005). NOEC values for mortality have also been determined for
Daphnia, at 1.2 µg/L and 5.5 µg/L after 96 and 24 hours respectively (Schmidt et al., 1995).
Bioassays examining the effects of TBT on Hyalella azteca have also been conducted.
Borgmann et al. (1996) conducted short (1 week) and long (4 week) exposure bioassays to
determine LC50 values and to examine the relationship between body size and accumulation of
TBT within the tissues. TBT concentrations of 0.56, 1.0, 1.8, 3.2, 5.6 and 10 µg/L TBT were all
shown to cause bioaccumulation in the organisms and the concentrations in tissues increased
rapidly in the first 3-4 days of exposure before reaching a peak concentration after 1 week
(Borgmann et al., 1996). Rapid equilibration with TBT concentrations in water occurred in all
concentrations and final concentrations in tissue did not vary among treatments (Borgmann et
al., 1996). Accumulation was not dependent on body size, indicating adult or juvenile organisms
were suitable for bioassays (Borgmann et al., 1996). A one-week LC50 of 2.3 µg/L and a 4-week
LC50 value of 0.58 µg/L was found for Hyalella (Borgmann et al., 1996).
Several bioassays have been done examining the effects of TBT on proposed study
organisms; however, these studies were conducted with exposure periods ranging from 1-3
weeks. Little or no studies have been conducted using this particular contaminant to examine
impacts on a sub-acute (fewer than 24 hours) timescale. Observations of behavioural changes in
response to TBT are also lacking, making it an ideal contaminant to determine a behavioural
response pattern in the study organisms.
Rationale for Use
TBT is highly toxic and persistent at very low levels in the aquatic environment. It is an
environmentally-relevant toxicant in Canadian waterways and the potential exists for pulse
introductions of TBT to enter drinking water supplies. As it is not specifically tested for at
drinking water intakes due to the cost and time involved, the use of a BEWS to detect the
substance would be appropriate. To date, very few sub-acute (under 24 hour) bioassays
examining behaviour and respiration responses to the contaminant have been conducted using
the test organisms Daphnia magna, Hyalella azteca and Lumbriculus variegatus. Testing is
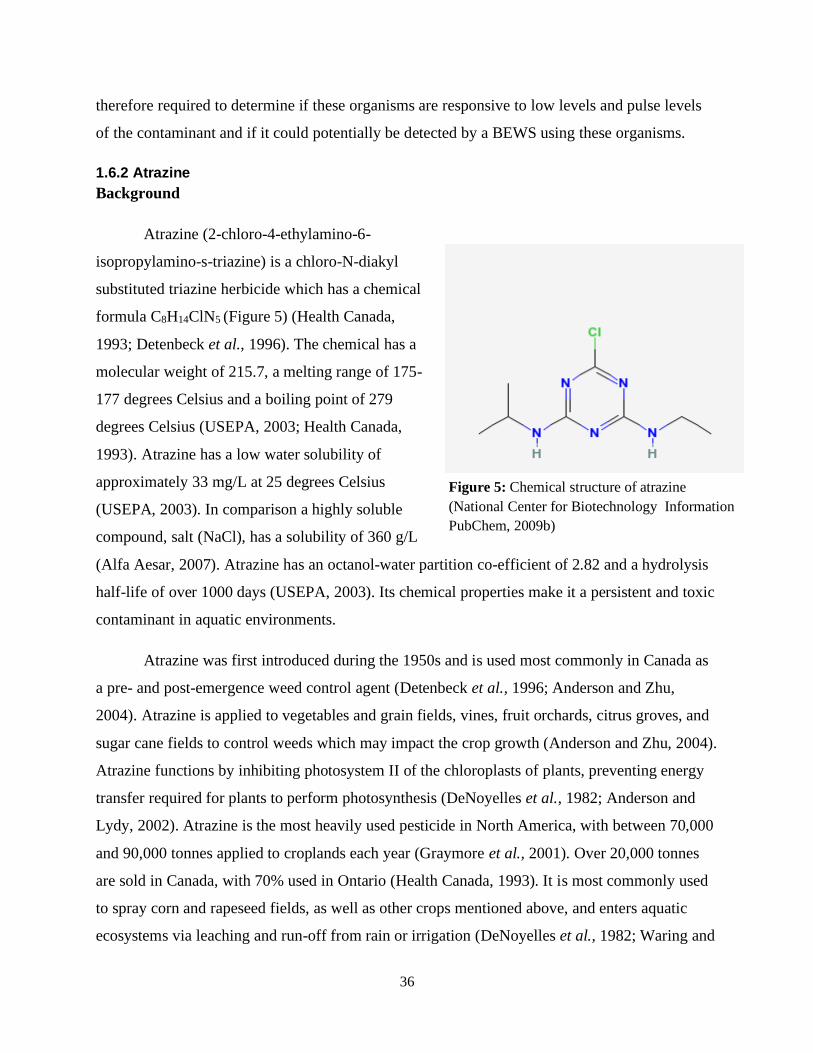
36
therefore required to determine if these organisms are responsive to low levels and pulse levels
of the contaminant and if it could potentially be detected by a BEWS using these organisms.
1.6.2 Atrazine
Background
Atrazine (2-chloro-4-ethylamino-6-
isopropylamino-s-triazine) is a chloro-N-diakyl
substituted triazine herbicide which has a chemical
formula C8H14ClN5 (Figure 5) (Health Canada,
1993; Detenbeck et al., 1996). The chemical has a
molecular weight of 215.7, a melting range of 175-
177 degrees Celsius and a boiling point of 279
degrees Celsius (USEPA, 2003; Health Canada,
1993). Atrazine has a low water solubility of
approximately 33 mg/L at 25 degrees Celsius
(USEPA, 2003). In comparison a highly soluble
compound, salt (NaCl), has a solubility of 360 g/L
(Alfa Aesar, 2007). Atrazine has an octanol-water partition co-efficient of 2.82 and a hydrolysis
half-life of over 1000 days (USEPA, 2003). Its chemical properties make it a persistent and toxic
contaminant in aquatic environments.
Atrazine was first introduced during the 1950s and is used most commonly in Canada as
a pre- and post-emergence weed control agent (Detenbeck et al., 1996; Anderson and Zhu,
2004). Atrazine is applied to vegetables and grain fields, vines, fruit orchards, citrus groves, and
sugar cane fields to control weeds which may impact the crop growth (Anderson and Zhu, 2004).
Atrazine functions by inhibiting photosystem II of the chloroplasts of plants, preventing energy
transfer required for plants to perform photosynthesis (DeNoyelles et al., 1982; Anderson and
Lydy, 2002). Atrazine is the most heavily used pesticide in North America, with between 70,000
and 90,000 tonnes applied to croplands each year (Graymore et al., 2001). Over 20,000 tonnes
are sold in Canada, with 70% used in Ontario (Health Canada, 1993). It is most commonly used
to spray corn and rapeseed fields, as well as other crops mentioned above, and enters aquatic
ecosystems via leaching and run-off from rain or irrigation (DeNoyelles et al., 1982; Waring and
Figure 5: Chemical structure of atrazine
(National Center for Biotechnology Information
PubChem, 2009b)

37
Moore, 2004). Atrazine can also adsorb to soil particles which are then eroded into running water
or can drift via air into water immediately following spraying (Health Canada, 1993). Because of
this, atrazine is the most frequently detected pesticide in surface and well water in Canada and
the United States (Health Canada, 1993). Well and surface water contamination by atrazine has
been reported in British Columbia, Nova Scotia, Quebec, Saskatchewan, Ontario, and Prince
Edward Island, with higher concentrations reported in spring due to increased run-off from fields
(Health Canada, 1993). Health Canada regulates the maximum acceptable concentration in
drinking water to be 5 µg/L, representing a total of pure atrazine and its metabolites (Health
Canada, 1993), whereas the USEPA recommends that concentrations in drinking water not
exceed 3 µg/L (USEPA, 2003). The Canadian Water Quality Guidelines stipulate that
concentrations of atrazine not be over 2 µg/L for the protection of aquatic life (Canadian Water
Quality Guidelines, 2008). However, studies have shown that concentrations in both drinking
water and surface water frequently exceed these recommended values. Concentrations in
drinking water have been reported up to 81 µg/L in Canada and surface water concentrations
have been known to reach as high as 108 µg/L in the United States following spring application
(Graymore et al., 2001; USEPA, 2003).
The detection of atrazine in water samples is performed using gas chromatography with
either flame ionization, electron capture, or mass spectrometry (Health Canada, 1993). These are
all costly and labour-intensive methods which do not provide rapid results. As it is possible to
remove up to 91% of atrazine from drinking water using granular activated carbon, powdered
activated carbon, ion exchange, ozone oxidation or, UV radiation, it is important to know when
the compound is present so that proper treatment of drinking water can occur (Jiang et al., 2006).
Therefore, determining a set of predictive behavioural patterns for several relevant study
organisms to detect atrazine in a multi-species, early warning biomonitoring system is very
important.
Human Health Concerns
Humans are most likely to be exposed to atrazine through consumption of contaminated
drinking water rather than through contact or inhalation (Health Canada, 1993). Contact through
air is highly unlikely due to the compound’s low volatility, except during or immediately after
application (Health Canada, 1993). It is also unlikely that consumption from food products
38
sprayed with the chemical will occur because residues on food are low or non-existent (IARC,
1999). When it enters the body through drinking water consumption, 93-100% of atrazine is
absorbed across the gastro-intestinal system and taken into cells where it is broken down into
metabolites by cytochrome P-450 (Health Canada, 1993).
Exposure via drinking water has been linked to a number of health issues in humans.
Immediately after consumption of contaminated water, patients often complain of nausea and
dizziness (Health Canada, 1993). The real risk occurs with chronic exposure to low
concentrations of atrazine. An increased risk of ovarian, uterine and breast malignancies, as well
as non-Hodgkin’s lymphoma have been associated with chronic atrazine exposure in workplace
and rural settings (Donna et al., 1984; Hoar et al., 1988; Health Canada, 1993). The increased
risk of reproductive system tumours is likely tied to the disruptive effect that atrazine has on
hormone regulatory systems. Atrazine has been demonstrated to act on the pituitary-gonadal
system which is responsible for the regulation of several hormones (Health Canada, 1993).
Exposure to atrazine has been shown to increase follicle stimulating hormone (FSH) and
luteinizing hormone (LH) and to cause abnormalities in the body’s ability to properly metabolize
testosterone (Health Canada, 1993). No conclusive findings about atrazine’s role as a carcinogen
have been determined and it is therefore classified as a Group 3 Carcinogen by Health Canada
(possibly carcinogenic to humans) (Health Canada, 1993). The International Agency for
Research on Cancer (IARC) also classifies atrazine as a possible human carcinogen (IARC,
1999). Both Health Canada and the World Health Organization (WHO) recommend that human
intake not exceed 0.5 mg atrazine per kilogram body weight per day in order to reduce the risks
associated with atrazine intake (Health Canada, 1993). As atrazine is a potential human
carcinogen, it is important to detect and subsequently remove it from drinking water. The
development of a system that monitors changes in behavioural parameters of organisms in the
presence of atrazine would greatly help in this goal.
Environmental Concerns
Many studies have also looked at the health effects of atrazine on aquatic organisms and
larger land mammals. Several studies have been conducted using rats as models for the effects of
atrazine in humans. In rat studies, dose-related increases in mammary gland and lymph system
tumours were reported (IARC, 1999), as well as increased embryonic and foetal deaths,

39
decreased foetal weights, and retarded skeletal development in young following two years of
chronic low level exposure to 20-40 mg/kg atrazine in food (Health Canada, 1993). In an
environmental context, this is an extremely high level of exposure, unlikely to ever be seen at an
equivalent level in an aquatic setting.
Studies of uptake in aquatic organisms exposed to the contaminant have also been
performed. When exposed to atrazine concentrations of 230 µg/L and higher, the aquatic insect
Chironomus tentans had reduced hatching success, abnormal larvae development, and a
reduction in the number of organisms which reached the pupae life stage (Dewey, 1986). Fish
and larval tadpoles are also common test species used during atrazine exposures. After exposure
to 120 µg/L atrazine, brook trout experienced a significant reduction in growth rate while both
zebrafish and rainbow trout experienced changes in swimming behaviour and motility when
exposed to concentrations of 6 and 80 µg/L respectively (Dewey, 1986; Steinberg et al.,1995).
Rana catesbiana tadpoles exposed to 20 µg/L of atrazine for 80 days showed a significant
decrease in biomass compared to controls, and have an LC50 of 410 µg/L (Detenbeck et
al.,1996). Abnormal gonadal development such as feminization, hermaphroditism, and reduced
laryngeal muscle size in Xenopus laevis tadpoles have been reported following prolonged
exposure to concentrations as low as 1 µg/L (USEPA, 2003). This is likely connected to
endocrine disruption caused by the compound (USEPA, 2003).
Atrazine in Aquatic Ecosystems
Atrazine is highly persistent and has a half-life of 12 weeks in acidic water conditions,
and up to 2 years or more in neutral or basic waters (Health Canada, 1993; Detenbeck et al.,
1996). Concentrations of up to 1000 µg/L have been reported in streams and rivers directly next
to fields where atrazine has been applied (Denoyelles et al., 1982). Many coastal and estuarine
areas have reported detectable levels of atrazine, but due to dilution concentrations are often
much lower than freshwater bodies located near farm areas (Graymore et al., 2001). As
mentioned before, concentrations of atrazine in freshwater varies depending on season, with
spring and summer months showing increased aquatic deposits due to sprayings during the
growing season and high runoff from summer storms (Graymore et al., 2001; Anderson and
Lydy, 2002; USEPA, 2003). Ambient concentrations in many lakes and rivers vary between 1
and 10 µg/L, depending on the time of year and the size of the water body (USEPA, 2003).

40
Aquatic environments are thus constantly exposed to chronic low levels of atrazine, as well as
short-term pulses of high concentrations of the pesticide (Detenbeck et al.,1996; USEPA, 2003).
The breakdown of atrazine in the water column is accomplished through a combination
of biological and chemical mechanisms (Winkelman and Klaine, 1990; Graymore et al., 2001;
USEPA, 2003). The compound is broken down into two main metabolites, 2- and 4-dihydroxy
derivatives (Hamilton et al., 1989; Winkelman and Klaine, 1990; Graymore et al.,2001).
Bacteria and fungi in the water column complete the first step of degradation by splitting the
ethyl groups from the triazine ring to use as an energy source. Chemical hydrolysis then removes
the chloride ions from the molecule. A series of dealkylation and hydroxylation reactions
follows, reducing the remaining molecule to the primary metabolites (Hamilton et al., 1989;
Winkelman and Klaine, 1990). Atrazine can also be broken down through photochemical
processes; however, this mechanism is less important and takes a much longer period of time to
occur than other mechanisms (Graymore et al.,2001).
As atrazine acts as a herbicide, the aquatic populations first affected are often algae and
aquatic macrophytes (Graymore et al., 2001; USEPA, 2003). Reduction in algal biomass and
abundance have been seen with exposure to atrazine concentrations as low as 20 µg/L
(Graymore et al., 2001). In concentrations less than 10 µg/L, a decrease in photosynthesis in
phytoplankton and periphyton communities has been seen (Graymore et al., 2001). At
concentrations over 500 µg/L, photosynthesis, carbon uptake and biomass are reduced by 95% in
under two days (Graymore et al.,2001). These results are particularly alarming as concentrations
such as these are often found in aquatic waterbodies located near sprayed fields and decreases in
aquatic plant life can affect the entire food web due to their use as food sources for animals
within the aquatic system (Denoyelles et al., 1982).
Atrazine and Past Bioassays with Study Organisms
Several bioassays have been conducted in the past examining the effects of atrazine on
the survival of Daphnia magna, Hyalella azteca, and Lumbriculus variegatus. LC50 values for
various periods of time have been reported for all three organisms. The USEPA (2003) reports
that Daphnia magna have a 48-hour LC50 value of 49 mg/L atrazine, that Hyalella azteca have
48-hour LC50 value of 14.7 mg/L and Lumbriculus variegatus have a 48-hour LC50 value of 37.1
41
mg/L. An 18-hour LC50 for Hyalella has also been determined to be 2 mg/L (USEPA, 2003) and
a 72-hour LC50 for Daphnia has been reported to be 72 mg/L (Wan et al., 2006). Reproductive
bioassays have also been conducted using Daphnia magna. At concentrations of 250 µg/L and
higher, a significant reduction in the number of offspring produced was observed (Dewey, 1986).
Several bioassays have been done examining the effects of atrazine on proposed study
organisms; however, these studies were conducted with exposure periods ranging days to weeks
with mortality as an endpoint. Few studies have been conducted using this particular contaminant
to examine impacts on a sub-acute (fewer than 24 hours) timescale. Observations of behavioural
changes in response to atrazine are also lacking, making it an ideal contaminant to determine a
behavioural response pattern for in the study organisms.
Rationale for Use of Atrazine
Atrazine is chronically toxic to many organisms at very low levels and very persistent in
the environment. The chemical is constantly found at low levels in the aquatic environment and
pulse inputs of very high concentrations have been noted after application and from agricultural
run-off. Current detection methods are expensive and time-consuming, and detection of the
contaminant is important due to human health risks and the potential for drinking water treatment
facilities to remove it during treatment. A multi-species, early-warning biomonitoring technology
may greatly contribute to the detection and removal efficiency of atrazine from drinking water.
To date, very few sub-acute (under 24 hour) bioassays examining behaviour and respiration
responses to the contaminant have been conducted using the test organisms Daphnia magna,
Hyalella azteca, and Lumbriculus variegatus. Testing is therefore required to determine if these
organisms are responsive to low levels and pulse levels of the contaminant and if it could
potentially be detected by a multi-species, early-warning biomonitoring technology using these
organisms.
1.6.3 Dimethyl Sulfoxide (DMSO)
Dimethysulfoxide (DMSO) is a commonly used organic solvent in toxicity testing. DMSO
(Figure 6) was used in the following study to make stock solutions of tributyltin and atrazine,
which have a low solubility in water. DMSO helps to solubilise the contaminant and makes sure
that it is distributed evenly throughout the water column (Bowman et al., 1981). Some concerns
have been raised about the toxicity of the compound and the idea that it may impact the test

42
organisms. At low concentrations on a per
volume basis, DMSO is less toxic than other
commonly used solvents such as methanol,
ethanol, acetone and acetonile (Bowman et al.,
1981). In this study, an overall concentration
of 0.1% v/v DMSO was used for all bioassays.
This concentration has been shown to be a
safe working concentration that has no impact
on behaviour or mortality in test organisms
(Ura et al., 2002; Hutchison et al., 2006;
Hallare et al., 2006; Martins et al., 2007b; Ren
et al., 2008; Ren et al., 2009).
1.7 Thesis Rationale and Objectives
The area of behavioural ecotoxicology is rapidly expanding, as more interest is taken in
rapidly detecting and mitigating environmental damage and protecting limited drinking water
resources. However, as many contaminants exist in aquatic environments, a great deal remains
unknown about the impacts of individual chemicals at an organismal level. The objectives of
this study are as follows:
- To perform laboratory behavioural bioassays, monitored using digital video analysis, in
order to determine if environmentally-relevant concentrations of tributyltin (TBT) and
atrazine have a significant impact on the several behaviour characteristics in the three
study organisms. Information gained from digital video analysis can be used in the future
in a video-based biomonitoring technology, or can be used to determine relevant
characteristics to monitor using an impedance-based technology, such as the MFB
- To determine effective concentration (EC) values for TBT and atrazine for various
behavioural parameters in the three study organisms
- To determine if Daphnia magna, Hyalella azteca, and Lumbriculus variegatus can be
reliably utilized in sub-acute bioassays and to determine what parameters of locomotory
behaviour in the three organisms are most useful for incorporation into a model to help
determine classes and exact concentrations of contaminants
Figure 6: Chemical structure of dimethylsulfoxide
(DMSO) (NCBI PubChem, 2009c)

43
- To determine if respiration measured via direct oxygen consumption is a suitable
bioassay parameter to be used in a multi-species, early-warning biomonitoring
technology and if changes in respiration rates are observed in response to
environmentally relevant concentrations of TBT and atrazine
This project will contribute to an existing body of knowledge regarding behavioural and
physiological ecotoxicology and will help to determine appropriate organisms and responses
to be monitored in situ using a fully automated multi-species, early-warning biomonitoring
technology.

44
2.0 Materials and Methods
2.1 Bioassay Organism Culturing
2.1.1 Daphnia magna
Culturing procedures were developed based on protocols from Environment Canada
(1996), the USEPA (2002) and the OECD (2004). Four cultures of Daphnia magna were
maintained in the laboratory for use in the evaluation of changes in cladoceran behaviour and
physiology in response to the addition of contaminants. Cultures were raised in four separate 9-L
glass aquaria. An overlay of 7 L of natural spring water (Selection brand, Hillsburgh, ON)
(OECD, 2004) was added to each tank to allow for an appropriate depth of water (approximately
15 cm) for the D. magna. This water was aerated for 2 days prior to initial usage to ensure at
least 80% oxygen saturation of the water (approximately 8.5 mg/L). Water temperature in the
aquaria was maintained at room temperature (18-20 degrees Celsius) throughout the culturing
and experimental period. Dissolved oxygen (DO) levels were maintained using an aquarium
bubbler. Aquaria were kept in a laminar-flow hood (Canadian Cabinets, model number H4-MW-
97- C-30) to prevent dust and other debris from entering the culture tanks and negatively
impacting the organisms. A 16hr : 8hr light: dark cycle was maintained using a timer and
fluorescent lights, with a light intensity of approximately 500 lux (Environment Canada, 1998),
under the laminar flow hood. The 16hr : 8hr light: dark cycle was used during all experiments
with D. magna, in order to prevent changes in behaviour associated with differing light
conditions.
D. magna were fed Mondays, Wednesdays, and Friday a mixture of Roti-Rich
Invertebrate Food (Ward’s Natural Science, 88V5910) and Selenastrum capricornutum algae.
Each tank was provided with 5 mL of the invertebrate food and 20 mL of the algae (1.5 × 10⁶
cells/mL) during each feeding period. Water clarity was monitored visually to determine if algae
was being consumed and feeding volumes were adjusted based on the amount of algae consumed
by the daphnids between feeding periods. Excess food and other debris were removed during
every feeding day using a sterile 1.5-mL transfer pipette. New spring water was also added to the
aquaria on Monday, Wednesday and Friday to replace any culture water which may have been
lost due to evaporation. A 4 L container of natural spring water was aerated continuously for the

45
purpose of replenishing culture tanks. As daphnid populations grew to more than 200
daphnids/aquaria, neonates were transferred to new tanks using sterile transfer pipettes to prevent
overcrowding and to reduce stress amongst the organisms. Water used in bioassays was the same
as in culture tanks in order to minimize disruptions in behaviour which could potentially be
caused by changes in water temperature.
2.1.2 Hyalella azteca
Culturing procedures were developed based on protocols established by Environment
Canada (1997) and the USEPA (2000). Three cultures of Hyalella azteca were maintained in the
laboratory for use in the evaluation of the amphipod swimming behaviour and respiratory rate
changes in response to the addition of contaminants. Cultures were raised in three separate 9-L
glass aquaria. An overlay of 7-L of natural spring water (Selection brand, Hillsburgh, ON)
(USEPA, 2000) was present in each tank to allow for an appropriate depth of water
(approximately 15 cm) for the H. azteca. This water was aerated for 2 days prior to initial usage
to ensure at least 80% oxygen saturation (approximately 8.5 mg/L). Water temperature in the
aquaria was maintained at room temperature (18-20 degrees Celsius) throughout the culturing
and experimental period. Dissolved oxygen levels were maintained using an aquarium bubbler.
Aquaria were located underneath a hood with laminar flow to prevent dust and other debris from
entering the culture tanks and negatively impacting the organisms. A 16hr : 8hr light: dark cycle
was maintained using a timer and fluorescent lights, with a light intensity of approximately 500
lux (USEPA, 2002), under the laminar flow hood. The 16hr : 8hr light: dark cycle was used
during all experiments with the Hyalella, in order to prevent changes in behaviour associated
with differing light conditions. Water used in bioassays was the same as in culture tanks in order
to minimize disruptions in behaviour which could potentially be caused by changes in water
temperature.
The organisms were fed Mondays, Wednesdays and Fridays when three to four crushed
flakes of TetraMin fish food were added to the aquaria. Excess food and other debris were
removed every feeding day using a sterile 1.5-mL transfer pipette. Hyalella were also provided
with sterile cotton gauze for use as a substrate. Gauze was soaked for 24 hours in a beaker of
natural spring water prior to introduction to the aquaria and was replaced when more than 50%
of the previously added material had been shredded by the organisms. Water was also added to

46
the aquaria on Mondays, Wednesdays and Fridays to replace any culture water which may have
been lost due to evaporation.
2.1.3 Lumbriculus variegatus
Culturing procedures were developed based on protocols established by the USEPA
(2000). Cultures were raised in two 9-L glass aquaria which were sealed at the corners with a
non-toxic silica sealant. A 7-L overlay of dechlorinated tap water was provided in each tank
(USEPA, 2000). Lumbriculus variegatus can be cultured in a variety of waters, including
reconstituted water, dechlorinated tap water, and spring water (USEPA, 2002). The type of water
used is therefore at the discretion of the researcher. Preliminary culturing experiments indicated
that our organisms were most successful in dechlorinated tap water. Water was aerated
vigorously for 48 hours and then filtered using an activated carbon aquarium filter prior to
addition to the tank to ensure at least 80% oxygen saturation (approximately 8.5 mg/L) and
dechlorination. Water temperature in the aquaria was maintained at room temperature (18-20
degrees Celsius) throughout the culturing and experimental period. Dissolved oxygen levels were
maintained using an aquarium bubbler. A 16hr : 8hr light: dark cycle was maintained using
fluorescent lights, with a light intensity of approximately 500 lux (USEPA, 1998), in the
laboratory. The 16hr : 8hr light: dark cycle, was used during all experiments with Lumbriculus
variegatus, in order to prevent changes in behaviour associated with differing light conditions.
Water used in bioassays was the same as in culture tanks in order to minimize disruptions in
behaviour which could potentially be caused by changes in water temperature.
Lumbriculus cultures were fed a diet of crushed TetraMin fish food three times a week. A
substrate of unbleached paper towel was also provided to the organisms. Paper towel was hand-
torn into 1-2 cm strips and a 1-2 cm layer of paper towel was allowed to accumulate at the
bottom of the aquaria before the addition of the organisms. Shredded paper towel was soaked for
a minimum of 24 hours prior to introduction to the tanks and was replaced as needed. Water in
the aquaria was also replaced on an as-needed basis using dechlorinated, filtered tap water.
2.2 Washing Procedures
Prior to use, all glassware, aquaria, and other reusable pieces of lab equipment were
washed thoroughly to ensure that any traces of chemicals from prior use were removed and did
47
not affect test organisms. Washing procedures were based on those described by Environment
Canada (1996).
Glassware was first washed using acetone three times, and then rinsed with tap water.
Glassware was then soaked in an Extran soap solution for 15 minutes, and scrubbed to remove
any residue. The soap was then rinsed off using tap water. Finally, glassware was washed in 10%
v/v hydrochloric acid, and rinsed three times using distilled water. Glassware was placed in an
inverted position to dry prior to being used.
2.3 Dilutions
All dilutions were made from stock solutions of 100 mg/L tributyltin (TBT) in DMSO
and 100 mg/L atrazine in DMSO. Dilution calculations are presented in Appendix A. Test
solutions all had a final concentration of 0.1% DMSO, a value which has been used in past
bioassays and is not considered to have an impact on aquatic organisms (Ura et al., 2002;
Hutchison et al., 2006; Hallare et al., 2006; Martins et al., 2007b; Ren et al., 2008; Ren et al.,
2009). In all bioassays, reference and 0.1% DMSO control treatments were performed at the
same time as the TBT and atrazine treatments to examine normal behaviour and to ensure that
the DMSO was not contributing any toxicity.

48
2.4 Behaviour Bioassays
Figure 7: Outline of behavioural bioassays performed.
2.4.1 Daphnia magna Behaviour
2.4.1.1 Daphnia magna Motility TBT (0 – 24 Hours Inclusive)
Swimming behaviour bioassays using Daphnia magna exposed to varying concentrations
of TBT were performed using digital video analysis. Square glass containers with a total volume
of 200 mL with 150 mL of each test solution were used as bioassay vessels in this experiment.
Three different concentrations of TBT were tested in this bioassay (10, 50 and 100 µg/L). Since
no prior research has been conducted examining changes in Daphnia movement in response to
TBT, initial experiments were performed prior to this bioassay, which showed concentrations of
TBT ≤ 10 µg/L had no effect on Daphnia magna movement behaviours. Concentrations were
therefore increased in this bioassay in order to determine if elevated concentrations would impact
the swimming behaviour of the organisms. A reference (aerated natural spring water) and a
solution with 0.1% DMSO were also evaluated in order to examine behaviour under normal
conditions and when exposed to the carrier alone. Vessels containing the five different treatments
were randomly arranged in order to control for variation caused by lighting, temperature, and

49
other abiotic conditions within the laboratory. Five daphnids were present in each test vessel.
Three replicates of the bioassay were performed.
Changes in swimming behaviour were evaluated using digital video and personal
observations made while the experiment was being conducted. Videos and personal observations
were made after 0, 1, 2, 3, 4, 5, 6, 12, and 24 hours of exposure to the test solutions. Video was
taken from above each test vessel using a Canon S515 digital camera. The camera was
positioned above each test vessel using a tripod and five minute segments of video were taken of
each treatment vessel for each replicate during each hour of exposure.
Behavioural patterns which were observed were based on past bioassays conducted by
Dodson et al. (1995); Untersteiner et al. (2003); Schmidt et al. (2005) and Szulkin et al. (2006)
and on personal observations made by the researcher during initial behavioural monitoring.
Characteristics which were observed included changes in the organisms’ swimming height in the
water column (Dodson et al., 1995; Schmidt et al., 2005), movement style and fluidity (Dodson
et al., 1995; Szulkin et al., 2006), the presence of looping or twirling behaviour (Dodson et al.,
1995), the overall activity level of the organisms (Untersteiner et al., 2003; Schmidt et al., 2005),
immobility of the organisms (personal observation), the use of secondary antennae (Untersteiner
et al., 2003; Schmidt et al., 2005), and the body position of the organisms (upright or on their
sides) (personal observation). Observations of behavioural patterns were made by the
experimenter during the bioassay and by viewing the videos following the experiment. Specific
evaluations were made of: i) swimming height in the water column, ii) spinning, iii) body
orientation, iv) immobilization, v) secondary antennae use, and vi) swimming style.
Changes in individual behaviours over time were evaluated by determining the percent of
the organisms which displayed altered behaviour in each replicate. Qualitative observations of
general trends of behavioural changes were noted and discussed for use in ranking of the
importance of the various parameters. A non-parametric Kruskal-Wallis test was then performed
to determine if the different treatments had an effect on the individual movement parameters
when compared to reference treatments over the 24-hour experimental period. Statistical
differences were not analyzed between concentrations or temporally since experiments were
conducted for ranking the importance of the various behaviour parameters, rather than

50
determining specific impact concentrations. Further statistical analyses and modelling, which is
beyond the scope of this project, is required to determine exact dose-response relationships.
Daphnids were examined for mortality after 72 hours of exposure to the TBT test
solutions. Any organisms not moving were gently prodded with a sterile transfer pipette to
induce movement or gently picked up with the transfer pipette to be more closely examined for
signs of movement and life. Organisms were considered dead if no movement occurred during
these examinations. The number of dead organisms for each concentration was determined and
the percentage of dead organisms per treatment was compared using a non-parametric Kruskal-
Wallis test to see if treatment had an impact on the number of mortalities over 72 hours.
Examining organisms for mortality was a secondary impact of the contaminant and was not
included in the study objectives; however, observations of TBT concentrations that caused death
were worth noting.
2.4.1.2 Daphnia magna Motility Atrazine (0 – 24 Hours Inclusive)
This bioassay was set-up in a similar manner to the set-up for the TBT bioassay described
above in Section 2.4.1.1 with the following modifications. Three different concentrations of
atrazine were used, 5, 50, and 100 µg/L. Three replicates of the bioassay were again performed.
The same changes in swimming behaviour were examined using digital video and personal
observations while the experiment was being conducted. Videos and personal observations were
made after 0, 1, 2, 3, 4, 5, 6, 10, and 24 hours of exposure to the test solutions. Evaluations of
changes in behaviour were made as described above.
2.4.2 Hyalella azteca Behaviour
2.4.2.1 Hyalella azteca Motility TBT (0-24 Hours Inclusive)
The effects of three different concentrations of TBT on the movement behaviour of the
amphipod was evaluated using digital video analysis. Bioassay vessels used in this experiment
were 200 mL square glass containers containing 150 mL of each test solution. Organisms were
also provided with an overlay of 0.5 cm of silica sand to use as a substrate. The silica sand
substrate was rinsed 3 times in deionized water in order to remove any dust or other debris which
may have been present and then autoclaved.
Three different concentrations of TBT were tested in this bioassay (10, 50, and 100
µg/L). Preliminary experiments using lower concentrations of the contaminant showed that

51
concentrations ≤ 10 µg/L TBT had no effect on the locomotion of the Hyalella, thus
necessitating increased concentrations in this bioassay to determine what, if any, concentration of
the contaminant would negatively affect the organisms. A reference (aerated spring water) and a
solution with 0.1% DMSO were also evaluated in order to examine behaviour under normal
conditions and when exposed to the carrier alone. Five organisms were present in each vessel.
Three replicates of the bioassay were performed. Vessels containing the five different treatments
were randomly arranged in order to control for variation caused by lighting, temperature, and
other abiotic conditions within the laboratory.
Changes in swimming and movement behaviour were evaluated using digital video and
personal observations while the experiment was being conducted. Videos and personal
observations were made after 0, 1, 2, 3, 4, 5, 6, 12, and 24 hours of exposure to the test solutions.
Video was taken from above each test vessel using a Canon S515 digital camera. The camera
was positioned above each test vessel using a tripod and five minute segments of video were
taken of each treatment vessel for each replicate during each hour of exposure.
Behavioural patterns which were observed were based on past bioassays conducted by
Hatch and Burton (1999) and Wang et al. (2004) and on personal observations made by the
researcher during initial behavioural monitoring. Characteristics which were observed included
general activity of the test organisms (personal observation), immobilization of organisms
(personal observation), the performance of swimming events (Wang et al., 2004), organisms
crawling on the substrate (Wang et al., 2004), burrowing and grouping by organisms (Hatch and
Burton, 1999; Wang et al., 2004), and body positioning including shortening of body length
(personal observation), and the ability of organisms to maintain an upright position on the
substrate (personal observation). Observations of behavioural patterns were made by the
experimenter during the bioassay and by viewing the videos following the experiment. Specific
evaluations were made of : i) swimming events, ii) substrate crawling, iii) immobilization, iv)
burrowing, v) grouping, vi) body length, and vii) body orientation.
Changes in individual behaviours over time were evaluated by determining the percent of
organisms which displayed altered behaviour in each replicate. Qualitative observations of
general trends of behavioural changes were noted and discussed for use in ranking of the
importance of the various parameters. A non-parametric Kruskal-Wallis test was then performed

52
to determine if the different treatments had an effect on the individual movement parameters
when compared to reference treatments. Statistical differences were not analyzed between
concentrations or temporally since experiments were conducted for ranking the importance of the
various behaviour parameters, rather than determining specific impact concentrations. Further
statistical analyses and modelling, which is beyond the scope of this project, is required to
determine exact dose-response relationships. After 72 hours, the Hyalella were examined for
mortality as described above for the Daphnia magna. No deaths were seen, and thus this
information is not presented in the Results and Discussion section.
2.4.2.2 Hyalella azteca Motility Atrazine (0-24 Hours Inclusive)
The effects of three different concentrations of the pesticide atrazine on the movement
behaviour of the amphipod Hyalella azteca was evaluated using digital video analysis. This
bioassay was set-up in a similar manner to the set-up for the TBT bioassay described above in
Section 2.4.2.1 with the following modifications. Three different concentrations of atrazine were
tested in this bioassay, 5, 50, and 100 µg/L. The same changes in swimming and movement
behaviour were examined using digital video and personal observations while the experiment
was being conducted. Videos and personal observations were made after 0, 1, 2, 3, 4, 5, 6, 10,
and 24 hours of exposure to the test solutions. Evaluations of behaviour were made as described
above in Section 2.4.2.1.
2.4.3 Lumbriculus variegatus Behaviour
2.4.3.1 Lumbriculus variegatus Burrowing TBT (0 – 4.5 Hours Inclusive)
The experiment was designed to test the effect of 3 different concentrations of tributyltin
(TBT) on the burrowing behaviour of Lumbriculus variegatus. This evaluation was performed
using digital time-lapse photography.
Bioassay vessels used in this experiment were 300 mL glass beakers. Five replicates of
the experiment were performed in a single day, using a reference, DMSO reference (0.5%
DMSO) and three different concentrations of TBT. The concentrations of TBT tested were 0.1,
1.0, and 10.0 µg/L TBT in water.
Five rows of five beakers were set-up on the white paper. Labels which identified the
concentration and replicate number were created and taped to the corresponding beaker, so that

53
they were visible when examining the pictures during the analysis phase of the experiment.
Beakers were placed in five by five rows in random order.
In each of the beakers, inert silica sand was used as a substrate for the Lumbriculus to
burrow. Approximately 1 cm of silica sand was added to the bottom of each beaker to provide
adequate depth for burrow formation. A 150-mL overlay of each treatment was added to each
beaker. Beakers were covered with cheese-cloth to prevent dust and other material from entering
and sand which was resuspended during the addition of water was allowed to settle for 1 hour.
Prior to setting up the experimental beakers, 250 adult Lumbriculus were separated from
the culture colonies. Ten adult worms were placed in each beaker and a photograph was taken as
described below marking time zero and the beginning of the experiment. After the Lumbriculus
were placed in the experimental vessels, their burrowing behaviour was monitored for 4.5 hours
using time-lapse photography. A Canon S515 digital camera was used in this experiment. One
photograph was taken of each beaker every 15 minutes. A timer was used and photographs of
each replicate were taken in the same order each time to ensure consistency of timing. The
camera was held 10-15 cm above each beaker and a photograph was taken looking down into the
vessel. The camera was allowed to auto-focus to ensure photo quality. Each round of 25 pictures
took approximately 1 minute to complete.
Images were uploaded to a PC laptop from the camera’s digital memory card. Images
were arranged in folders in order of the time they were taken and by replicate. Images of each
concentration and each replicate were examined and the number of organisms which were
burrowed below the surface of the silica sand was counted. An organism was considered to be
burrowed if no part of its body was extended to the surface of the silica sand. If any part of the
organism was visible, that organism was not considered to be burrowed. The number of
organisms burrowed at each time point for each replicate and concentration was recorded in table
format. The average number of organisms burrowed in each treatment at each time point was
determined and the average rate at which organisms burrowed was graphed. Trends in burrowing
in the reference, 0.1% DMSO, and three TBT treatments were qualitatively analyzed to see if the
contaminant had an overall effect on burrowing.

54
2.4.3.2 Lumbriculus variegatus Burrowing Atrazine (0 – 6 Hours Inclusive)
A bioassay examining the effects of three different concentrations of atrazine on the
burrowing behaviour of Lumbriculus variegatus was performed over a 6-hour test period.
Bioassay set-up was similar to the set-up for the TBT bioassay described in section 2.4.3.1, but
with the following modifications. Three different concentrations of atrazine were tested in this
bioassay, 5, 50, and 100 µg/L. After the Lumbriculus were placed in the experimental vessels,
their burrowing behaviour was monitored for 6 hours using time-lapse photography. One
photograph was then taken every 30 minutes for the 6-hour duration of the experiment.
Burrowing behaviour was evaluated as described above in Section 2.4.3.1.
2.4.3.3 Lumbriculus variegatus Grouping TBT (0 – 48 Hours Inclusive)
This experiment was designed to test the effect of three different concentrations of
tributyltin (TBT) on the grouping behaviour of Lumbriculus variegatus. This evaluation was
performed using digital time-lapse photography. The experimental set-up and digital image
analysis was performed as described above for the Lumbriculus variegatus burrowing bioassay
but with the following modifications. No substrate was provided to the organisms. White paper
was placed on the experimental set-up bench to provide good contrast of the organisms in the
digital photographs. Labels were placed underneath the beakers to identify the concentrations
and replicate number when examining the pictures during the analysis phase of the experiment.
TBT concentrations of 10 µg/L, 50 µg/L and 100 µg/L were tested to provide a range of
environmentally-relevant concentrations. Initial grouping behaviour evaluations indicated that no
response was seen to concentrations of TBT below 10 µg/L, necessitating modifications to
experimental procedures including increased contaminant concentrations and longer observation
periods. Four replicates of the experiment were performed. Photographs were then taken every
30 minutes for the first 6 hours of the experiment, as well as 9, 24, 30, 42 and 48 hours after the
introduction of the organisms to the test solutions.
During the image analysis, pictures from the experiment were examined and the number
of organisms involved in a colony group was counted. A colony was considered to be a group if
two or more organisms were tightly coiled together. The number of organisms involved in a
group at each time point for each replicate was found. The effect of the contaminant on grouping
behaviour was then evaluated qualitatively by examining the average rate at which organisms
moved in and out of colonies.

55
2.4.3.4 Lumbriculus variegatus Grouping Atrazine (0 – 6 Hours Inclusive)
The bioassay to examine Lumbriculus variegatus grouping behaviour after exposure to
atrazine was performed with a similar bioassay set-up as described above in Section 2.4.3.3, with
the following modifications. Concentrations of atrazine used were 5, 50, and 100 µg/L.
Photographs were taken every 30 minutes for the 6 hour duration of the experiment. Evaluations
of grouping behaviour were performed as described above.
2.4.3.5 Lumbriculus variegatus Motility TBT (0 – 24 Hours Inclusive)
Bioassays assessing the effect of three different concentrations of TBT on the movement
behaviour of Lumbriculus variegatus were performed over a 24-hour test period. Twenty 400-
mL glass beakers were used as bioassay vessels in this experiment. A 150-mL overlay of each
test solution was added to each beaker. Beakers were then randomly placed on white paper to
provide good contrast of the organisms in the digital photographs. Four rows of 5 beakers were
set-up on the white paper and were labelled as previously described. Three different
concentrations of TBT were tested in this bioassay, 10, 50, and 100 µg/L. A reference
(dechlorinated, filtered tap water) and a solution with 0.1% DMSO were also evaluated in order
to examine behaviour under normal conditions and when exposed to the carrier alone. Vessels
containing the five different treatments were randomly arranged in order to control for variation
caused by lighting, temperature and other abiotic conditions within the laboratory. In total 4
replicates of the bioassay were performed simultaneously. The behaviour of 10 organisms was
examined in each treatment beaker.
Movement behaviour was evaluated by using personal observations of the experimenter
conducted after 0, 1, 3, 5, and 24 hours of exposure to the various treatments. Observations were
based upon behavioural parameters of Lumbriculus noted by Drewes (1999), Drewes and Cain
(1999), Ding et al. (2001), and O’Gara et al. (2004), and on personal observations made by the
researcher during initial behavioural monitoring. Movement characteristics observed included
positioning within the test vessel (personal observation), locomotion style (Drewes, 1999;
Drewes and Cain, 1999; Ding et al., 2001; O’Gara et al., 2004), general activity level of
organisms (Drewes, 1999; Drewes and Cain, 1999; Ding et al., 2001; O’Gara et al., 2004),
immobility of organisms (O’Gara et al., 2004), body length (O’Gara et al., 2004), straightness of
organisms’ bodies (personal observation), and movement in, out and within groups of organisms
(personal observation).

56
Changes in individual behaviours over time were evaluated by determining the percent of
organisms which displayed altered behaviour in each replicate. Qualitative observations of
general trends of behavioural changes were noted and discussed for use in ranking of the
importance of the various parameters. A non-parametric Kruskal-Wallis test was then performed
to determine if the different treatments had an effect on the individual movement parameters
when compared to reference treatments. For parameters involving grouping, only organisms
involved in a group were considered. For parameters involving locomotion, only individual
organisms were considered. Statistical differences were not analyzed between concentrations or
temporally since experiments were conducted for ranking the importance of the various
behaviour parameters, rather than determining specific impact concentrations. Further statistical
analyses and modelling, which is beyond the scope of this project, is required to determine exact
dose-response relationships. Parameters specifically evaluated were: i) position in the bioassay
vessel, ii) locomotion style, iii) immobilization, iv) body length, v) body orientation, and vi)
group movement.
The organisms were examined for mortality after 72 hours of exposure to the test
solutions. Any worms not moving were gently prodded with a sterile transfer pipette to induce
movement or gently picked up with the transfer pipette to be more closely examined for signs of
movement and life. Worms were considered dead if no movement occurred during these
examinations. The number of dead Lumbriculus for each concentration was determined and the
percentage of dead organisms per treatment was compared using a non-parametric Kruskal-
Wallis test to see if treatment had an impact on mortality over 72 hours. Examining organisms
for mortality was a secondary impact of the contaminant and was not included in the study
objectives; however, observations of TBT concentrations that caused death were worth noting.
2.4.3.6 Lumbriculus variegatus Motility (0 – 24 Hours Inclusive)
Bioassays assessing the effect of three different concentrations of atrazine on the
movement behaviour of Lumbriculus variegatus were performed over a 24-hour test period.
Bioassay set-up was similar to that used in the TBT bioassay described above in Section 2.4.3.4,
but with the following modifications. Three different concentrations of atrazine were tested in
this bioassay, 5, 50 and 100 µg/L. Movement behaviour was evaluated by using personal
observations of the experimenter conducted after 1, 3, 6, 9, and 24 of exposure to the various

57
treatments. The same behavioural characteristics were examined and similar evaluations of
change were made as described above.
2.5 Respiration Bioassays
Figure 8: Outline of respiration bioassays performed.
2.5.1 Daphnia magna, Hyalella azteca and Lumbriculus variegatus Respiration in TBT
The effect of three different concentrations of TBT on the respiration rates of Daphnia
magna, Hyalella azteca, and Lumbriculus variegatus were tested in three separate bioassays.
Bioassay vessels used in these experiments were 25-mL scintillation vials with tight-fitting
conical lids which displaced water when closing (ensuring no headspace) and prevented gas
exchange with the surrounding environment. Lids were polypropylene and the rate at which
oxygen could diffuse through the lid was negligible relative to oxygen consumption rates by
respiration. Prior to beginning, the bioassay vials were half-filled with aerated natural spring
water (culture media for Daphnia magna and Hyalella azteca) or dechlorinated, filtered tap
water (Lumbriculus culture media). In the Daphnia bioassay, eight adult Daphnia magna were
randomly selected from the culture tank and placed into each vial using a sterile transfer pipette.
Daphnia were visually inspected prior to bioassay use to ensure they were not pregnant.
Similarly in the Hyalella bioassay, three organisms were randomly selected and placed in the
vials. Finally, in the Lumbriculus bioassay, ten organisms were randomly selected and placed in
the vessels. Vials were then filled to the top with water and the appropriate amount and

58
concentration of TBT in 0.1% DMSO (vol/vol, final concentration in test vessels) was added to
each vial using a micropipette.
TBT concentrations of 10 µg/L, 50 µg/L, and 100 µg/L were tested in each bioassay to
provide a range of values. A 0.1% DMSO reference was also used to examine the effects of the
carrier on respiration separate from the contaminant. A control of natural spring water or
dechlorinated, filtered tap water was also used to provide a baseline for normal respiration
behaviour. Bioassays were performed in triplicate for statistical significance.
Dissolved oxygen measurements were performed using a modified Winkler titration
method (Appendix B) (MIT, 2006). For the Daphnia magna and Lumbriculus variegatus,
respiration bioassay measurements were performed at the start of the bioassay (time zero) and at
the beginning of every hour for the next six hours, and after 12 and 24 hours of exposure to the
contaminant. For the Hyalella azteca, bioassay measurements were made at the start of the
experiment and after 2, 4, 6, 10, and 24 hours of exposure. After 24 hours, all samples were
titrated and respiration rates were determined based on replicated regression analysis of oxygen
concentration versus time (Systat, version 11). Rate calculation was restricted to the interval over
which oxygen consumption was linear. For cross-treatment comparisons, rates of respiration
normalized for biomass (described below) were compared using t-tests for comparison of slope.
Separately, five groups of eight daphnids, three Hyalella and ten Lumbriculus were
randomly taken from the culture tanks and wet weights were found using an analytical balance.
The average weight of the groups of organisms was found and used to determine respiration rates
per unit biomass (nanomole O2/mg body mass/hour). Weight values from individual groups and
average values are found in Appendix V.
2.5.2 Daphnia magna, Hyalella azteca and Lumbriculus variegatus Respiration in
Atrazine
The effects of three different concentrations of atrazine on the respiration rates of
populations of Daphnia magna, Hyalella azteca and Lumbriculus variegatus were observed
using a Clark-type oxygen microelectrode (Unisense, Denmark). This electrode has a membrane
diameter of 25 µm and can measure dissolved oxygen concentrations with high precision while
minimizing oxygen consumption by the electrode. The size of the membrane also makes this
probe very insensitive to stirring, and, hence, very stable. In a multi-species, early-warning
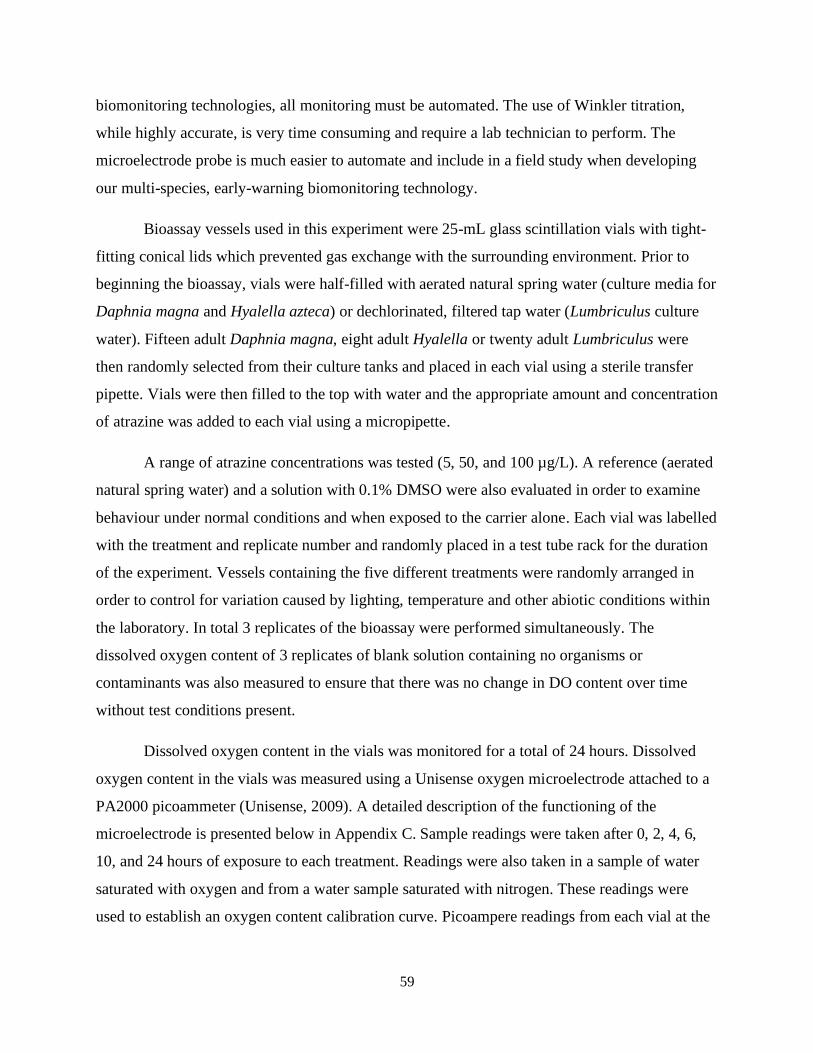
59
biomonitoring technologies, all monitoring must be automated. The use of Winkler titration,
while highly accurate, is very time consuming and require a lab technician to perform. The
microelectrode probe is much easier to automate and include in a field study when developing
our multi-species, early-warning biomonitoring technology.
Bioassay vessels used in this experiment were 25-mL glass scintillation vials with tight-
fitting conical lids which prevented gas exchange with the surrounding environment. Prior to
beginning the bioassay, vials were half-filled with aerated natural spring water (culture media for
Daphnia magna and Hyalella azteca) or dechlorinated, filtered tap water (Lumbriculus culture
water). Fifteen adult Daphnia magna, eight adult Hyalella or twenty adult Lumbriculus were
then randomly selected from their culture tanks and placed in each vial using a sterile transfer
pipette. Vials were then filled to the top with water and the appropriate amount and concentration
of atrazine was added to each vial using a micropipette.
A range of atrazine concentrations was tested (5, 50, and 100 µg/L). A reference (aerated
natural spring water) and a solution with 0.1% DMSO were also evaluated in order to examine
behaviour under normal conditions and when exposed to the carrier alone. Each vial was labelled
with the treatment and replicate number and randomly placed in a test tube rack for the duration
of the experiment. Vessels containing the five different treatments were randomly arranged in
order to control for variation caused by lighting, temperature and other abiotic conditions within
the laboratory. In total 3 replicates of the bioassay were performed simultaneously. The
dissolved oxygen content of 3 replicates of blank solution containing no organisms or
contaminants was also measured to ensure that there was no change in DO content over time
without test conditions present.
Dissolved oxygen content in the vials was monitored for a total of 24 hours. Dissolved
oxygen content in the vials was measured using a Unisense oxygen microelectrode attached to a
PA2000 picoammeter (Unisense, 2009). A detailed description of the functioning of the
microelectrode is presented below in Appendix C. Sample readings were taken after 0, 2, 4, 6,
10, and 24 hours of exposure to each treatment. Readings were also taken in a sample of water
saturated with oxygen and from a water sample saturated with nitrogen. These readings were
used to establish an oxygen content calibration curve. Picoampere readings from each vial at the

60
different time periods were then used to determine dissolved oxygen concentrations based on a
calibration curve.
The respiration rates for each replicate vial were found by determining the slope
produced when looking at the change in oxygen rate over time, and regression was restricted to
the interval when oxygen decrease was linear with time. Separately, 5 groups of 15 daphnids, 8
Hyalella, and 20 Lumbriculus were randomly taken from the culture tanks and weighed using an
analytical balance. The average mass of the groups of organisms was found and used to
determine respiration rates per amount of biomass. Masses from individual groups and average
values are found in Appendix V. The three individual respiration rates for each treatment were
compared to the three respiration rates for the reference samples using a One-Way ANOVA,
with post-hoc pairwise comparisons using a Tukey’s HSD test.

61
3.0 RESULTS AND DISCUSSION
3.1 Daphnia magna Behaviour
3.1.1 Daphnia magna Motility
Several aspects of Daphnia magna swimming behaviour were evaluated during these
bioassays and were found to change in the presence of varying concentrations of the
contaminants TBT and atrazine. Changes in response to the contaminants are summarized below
with a discussion of the ecological impacts of the change. Qualitative observations of general
trends of behavioural changes were made to aid in the ranking of the importance of the various
parameters. A discussion of the utility of the various parameters for evaluation in a multi-species,
early-warning biomonitoring technology is also included. The following characteristics of
Daphnia magna motility were examined: i) swimming height in the water column, ii) spinning,
iii) body orientation, iv) immobilization, v) secondary antennae use, and vi) swimming style.
i) Swimming Height in the Water Column
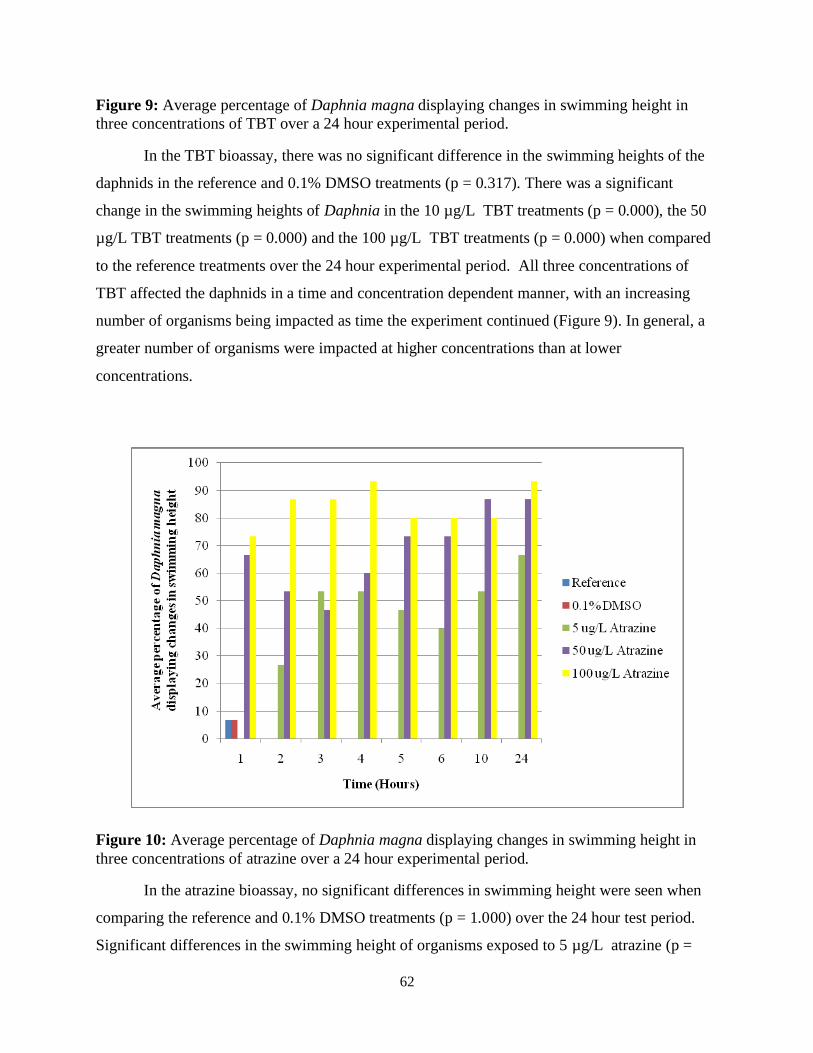
62
Figure 9: Average percentage of Daphnia magna displaying changes in swimming height in
three concentrations of TBT over a 24 hour experimental period.
In the TBT bioassay, there was no significant difference in the swimming heights of the
daphnids in the reference and 0.1% DMSO treatments (p = 0.317). There was a significant
change in the swimming heights of Daphnia in the 10 µg/L TBT treatments (p = 0.000), the 50
µg/L TBT treatments (p = 0.000) and the 100 µg/L TBT treatments (p = 0.000) when compared
to the reference treatments over the 24 hour experimental period. All three concentrations of
TBT affected the daphnids in a time and concentration dependent manner, with an increasing
number of organisms being impacted as time the experiment continued (Figure 9). In general, a
greater number of organisms were impacted at higher concentrations than at lower
concentrations.
Figure 10: Average percentage of Daphnia magna displaying changes in swimming height in
three concentrations of atrazine over a 24 hour experimental period.
In the atrazine bioassay, no significant differences in swimming height were seen when
comparing the reference and 0.1% DMSO treatments (p = 1.000) over the 24 hour test period.
Significant differences in the swimming height of organisms exposed to 5 µg/L atrazine (p =

63
0.000), 50 µg/L atrazine (p = 0.000), and 100 µg/L atrazine (p = 0.000) were seen when
compared to the reference treatments. The 5 µg/L , 50 µg/L, and 100 µg/L atrazine treatments
affected the swimming height of the organisms in a time and concentration dependent manner,
with an increasing number of organisms displaying changes in swimming height as time
progressed (Figure 10). In general, a greater percentage of the organisms displayed altered
swimming height at higher concentrations than in the lower concentrations of contaminant.
In both bioassays, the organisms in the reference and 0.1% DMSO treatments moved
throughout the height of the water column and did not spend extended periods of time at the
surface of the water or resting on the bottom of the bioassay vessel. Similar behavioural
responses were seen to the addition of both TBT and atrazine, with the majority of affected
organisms remaining at the bottom of the bioassay vessel, with a few stuck at the surface of the
water column seemingly unable to break through the surface tension. A decline in vertical
movement was noted in all affected organisms. This parameter appears to be a sensitive and
rapidly reached endpoint, and it is recommended that changes in swimming height of Daphnia
be monitored in a multi-organism, early-warning biomonitoring technology in order to detect
elevated levels of TBT and atrazine. Swimming height in the water column appears to be more
sensitive to lower levels of TBT than atrazine (Figures 9 and 10). This indicates that changes in
swimming height of daphnids may be useful for the detection of low levels of TBT and higher
levels of atrazine. However, further analyses beyond the scope of this thesis are necessary to
determine the exact time and concentration of exposure necessary to elicit the impacts seen, due
to similar changes in behaviour seen in response to both contaminants.
The ability to swim up and down through the water column is closely related to diel
vertical migration in daphnids. During the day under more intense light conditions, daphnids will
spend the majority of their time near the bottom of the water column where they are less visible
to visual predators. At night organisms will rise in the water column to forage and are less visible
to predators due to the dark conditions (Cushing, 1951). If organisms are unable to rise
throughout the water column or remain stuck at the surface of the water, they may be more
vulnerable to predation by visual hunters. Daphnids must be able to move up and down in the
water column in order to find food patches and to maintain their position in a patch of algae
(Ryan and Dodson, 1998). Decreased foraging success will be seen if organisms are unable to
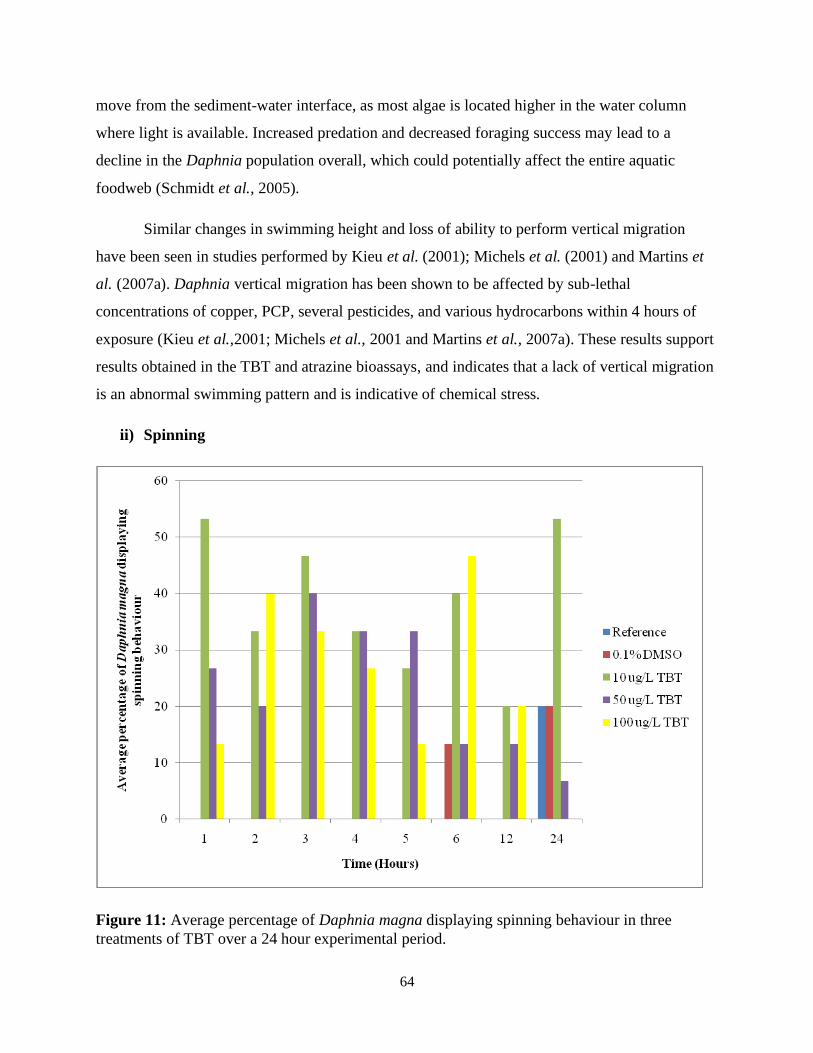
64
move from the sediment-water interface, as most algae is located higher in the water column
where light is available. Increased predation and decreased foraging success may lead to a
decline in the Daphnia population overall, which could potentially affect the entire aquatic
foodweb (Schmidt et al., 2005).
Similar changes in swimming height and loss of ability to perform vertical migration
have been seen in studies performed by Kieu et al. (2001); Michels et al. (2001) and Martins et
al. (2007a). Daphnia vertical migration has been shown to be affected by sub-lethal
concentrations of copper, PCP, several pesticides, and various hydrocarbons within 4 hours of
exposure (Kieu et al.,2001; Michels et al., 2001 and Martins et al., 2007a). These results support
results obtained in the TBT and atrazine bioassays, and indicates that a lack of vertical migration
is an abnormal swimming pattern and is indicative of chemical stress.
ii) Spinning
Figure 11: Average percentage of Daphnia magna displaying spinning behaviour in three
treatments of TBT over a 24 hour experimental period.

65
In the TBT bioassay, no significant differences in the occurrence of spinning behaviour
were seen when comparing the reference and 0.1% DMSO treatments (p = 0.409). A significant
increase in the performance of spinning was seen when comparing the reference to the 10 µg/L
TBT treatments (p = 0.000), the 50 µg/L TBT treatment (p = 0.000) and the 100 µg/L TBT
treatments (p = 0.000) over the 24 hour experimental period. An increase in spinning behaviour
was seen in all TBT treatments during the first 6 hours of the experiment. The average
percentage of organisms performing swimming events fluctuated between timepoints and no
consistent pattern of time or concentration dependence was seen with respect to the number
organisms affected (Figure 11). In the two highest TBT concentrations, the number of organisms
spinning decreased after 6 hours of exposure. This is related to the immobilization of organisms
discussed below. As exposure continued, more and more organisms in the TBT treatments
became immobilized and were thus unable to perform spinning behaviour. This indicates that
spinning behaviour may be a good indicator of high concentrations of TBT following short-term
exposure but not exposure periods over 6 hours, where immobilization may be a more sensitive
indicator of stress.
Figure 12: Average percentage of Daphnia magna displaying spinning behaviour in three
treatments of atrazine over a 24 hour experimental period.

66
In the atrazine bioassay, no significant differences in the occurrence of spinning
behaviour were seen when comparing the reference and 0.1% DMSO treatments (p = 1.000). A
significant increase in spinning behaviour was seen in the 5 µg/L atrazine treatments (p =
0.000), the 50 µg/L atrazine treatments (p = 0.000), and the 100 µg/L atrazine treatments (p =
0.000) when compared to the reference treatments over the 24 hour period. The organisms in all
three concentrations displayed spinning behaviour after 1 hour of exposure to the chemical. No
pattern of concentration or time dependency was seen was seen and the average number of
organisms performing swimming behaviour fluctuating at each time interval (Figure 12). The
majority of spinning behaviour was seen between 2 and 6 hours of exposure and generally
decreased after 10 hours of exposure to the chemical in all three treatments. This is closely
related to the immobilization of the organisms. As the experimental period continued, a greater
number of organisms became immobilized and were unable to perform spinning behaviour. This
indicates that spinning behaviour may be a good indicator of atrazine contaminantion following
short-term exposure, whereas immobilization may be a more sensitive indicator of stress after
longer periods.
Increases in spinning behaviour occurred rapidly in response to both contaminants when
compared to reference conditions. However, no time or concentration dependence was noted for
either substance, making discrimination between the two contaminants difficult. As no clear
pattern of response was noted in any concentration, it may also be difficult to create models able
to determine the exact concentration of contaminant present. Spinning behaviour is clearly a
rapidly induced stress response in Daphnia magna, and should be monitored in a multi-organism
early-warning biomonitoring technology. However, due to the lack of a consistent pattern of
response, changes in spinning behaviour should be considered less important than other
parameters when attempting to detect substances such as TBT and atrazine.
Spinning is characterized by large increases in velocity and rapid changes in direction
and occasional flips in the water. It is mostly performed at low levels in the water column and
not while moving up and down through the water column (Dodson et al., 1995). Spinning is
believed to be a type of escape behaviour and has often been seen in response to fish attacks and
rapid changes in light conditions (Dodson et al.,1995). It is therefore likely that increased
swimming behaviour in response to TBT and atrazine represents the daphnids attempts to escape
67
the chemical when first exposed. Spinning behaviour is estimated to use approximately 400
times as much energy as normal swimming behaviour (Dodson et al.,1995). Decreases in
spinning behaviour at the end of the experiment period suggest that the organism’s energy
resources have been depleted, likely due to contaminant exposure and use for escape behaviours.
Spinning during swimming may have many ecological consequences for daphnids. Predation risk
is likely to be increased. The behaviour is likely to attract the attention of visual predators due to
its erratic nature and to tactile predators due to the increased vibrations in the water column from
erratic movements (Dodson et al., 1995). In a study by Dodson and colleagues (1995), spinning
behaviour was induced in daphnids through exposure to high levels of carbaryl. It was found that
bluegill sunfish will preferentially eat spinning organisms, even when presented with a normally
swimming daphnid within closer proximity (Dodson et al., 1995). Increases in this type of
behaviour could therefore impact predation rates and cause an overall decrease in daphnid
populations.
iii) Body Orientation
Figure 13: Average percentage of Daphnia magna displaying changes in body orientation in
response to three concentrations of TBT over a 24 hour period.

68
In the TBT bioassay, there were no significant changes in the body orientation of the
organisms when comparing the reference and the 0.1% DMSO treatments (p = 1.000). A
significant increase in the number of organisms resting on their sides as opposed to swimming
upright was seen in the 10 µg/L TBT treatment (p = 0.000), the 50 µg/L treatment (p = 0.000),
and the 100 µg/L treatments (p = 0.000) when compared to the reference treatments over the 24
hour experimental period. No changes in body orientation were seen in the reference and DMSO
treatments (Figure 13).
Figure 14: Average percentage of Daphnia magna displaying changes in body orientation in
response to three concentrations of atrazine over a 24 hour period.
In the atrazine bioassay, there were no significant changes in the body orientation of the
organisms when comparing the reference and the 0.1% DMSO treatments (p = 1.000). A
significant increase in the number of organisms resting on their sides as opposed to swimming
upright was seen in the 5 µg/L atrazine treatments (p = 0.002), the 50 µg/L atrazine treatments
(p = 0.000), and the 100 µg/L atrazine treatments (p = 0.000) when compared to the reference
treatments over the 24 hour experimental period.
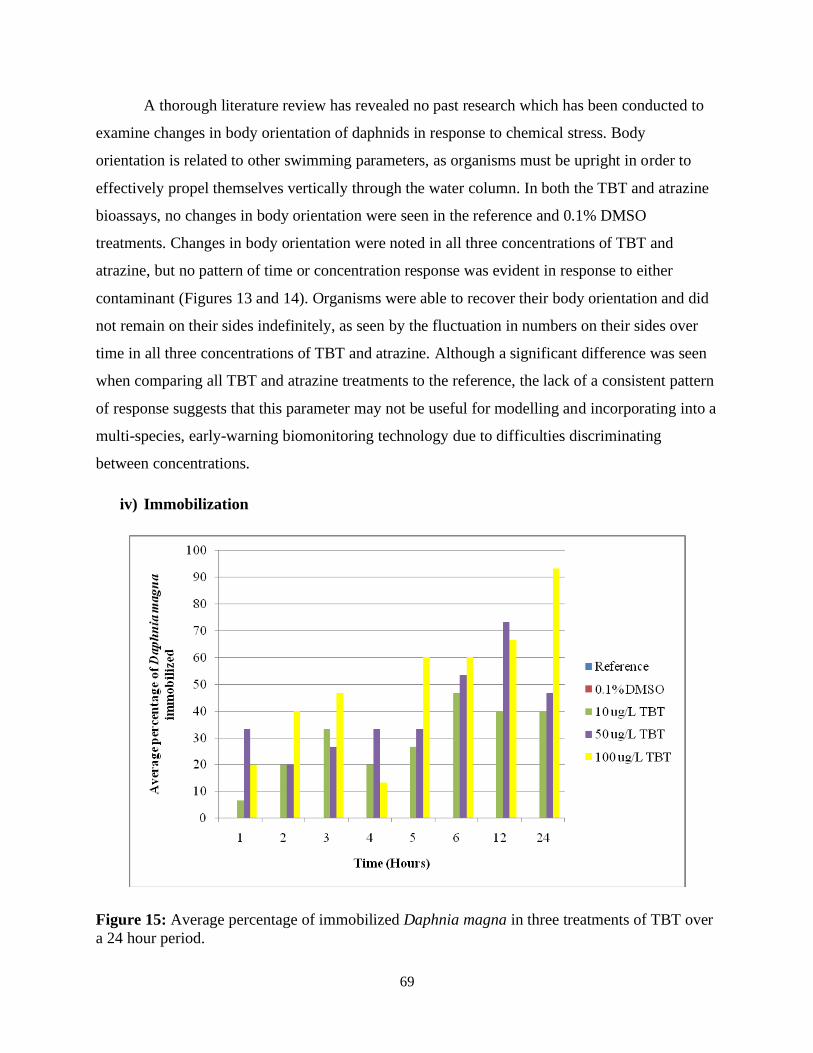
69
A thorough literature review has revealed no past research which has been conducted to
examine changes in body orientation of daphnids in response to chemical stress. Body
orientation is related to other swimming parameters, as organisms must be upright in order to
effectively propel themselves vertically through the water column. In both the TBT and atrazine
bioassays, no changes in body orientation were seen in the reference and 0.1% DMSO
treatments. Changes in body orientation were noted in all three concentrations of TBT and
atrazine, but no pattern of time or concentration response was evident in response to either
contaminant (Figures 13 and 14). Organisms were able to recover their body orientation and did
not remain on their sides indefinitely, as seen by the fluctuation in numbers on their sides over
time in all three concentrations of TBT and atrazine. Although a significant difference was seen
when comparing all TBT and atrazine treatments to the reference, the lack of a consistent pattern
of response suggests that this parameter may not be useful for modelling and incorporating into a
multi-species, early-warning biomonitoring technology due to difficulties discriminating
between concentrations.
iv) Immobilization
Figure 15: Average percentage of immobilized Daphnia magna in three treatments of TBT over
a 24 hour period.

70
In the TBT bioassay, no significant difference was seen when comparing the number of
organisms immobilized in the reference and 0.1% DMSO treatments (p = 1.000). A significant
increase in the number of organisms immobilized was seen when comparing the reference and
the 10 µg/L treatments (p = 0.000), the 50 µg/L treatments (p = 0.000), and the 100 µg/L
treatments (p = 0.000). No changes in activity level were noted in the reference or 0.1% DMSO
control organisms in the TBT bioassay (Figure 15). The organisms maintained a high activity
level and no immobilizations were noted. Changes in activity level and organism immobilization
were observed in response to exposure to all concentrations of TBT. Responses were
concentration and time dependent. Higher concentrations of TBT immobilized a greater average
number of organisms with shorter periods of exposure than lower concentrations.
Figure 16: Average percentage of immobilized Daphnia magna in three treatments of atrazine
over a 24 hour period.
In the atrazine bioassay, no significant difference in the number of organisms
immobilized was seen when comparing the reference and the 0.1% DMSO treatments over the
24 hour experimental period (p = 1.000). A significant difference in the number of organisms
immobilized was seen in the 5 µg/L atrazine treatment (p = 0.000), the 50 µg/L atrazine
treatments, and the 100 µg/L atrazine (p = 0.000) treatments when compared to the reference

71
treatments. No changes in activity level were noted in the reference or 0.1% DMSO control
organisms in the atrazine bioassay. Organisms maintained a high activity level and no
immobilizations were noted (Figure 16). Changes in activity level and organism immobilization
were observed in response to exposure to all concentrations of atrazine. Responses were
generally concentration and time dependent, with a greater number of organisms displaying
altered behaviour in higher concentrations and with shorter times to response.
Immobilization was seen in response to all three concentrations of TBT and atrazine.
Both contaminants affected the activity level of the daphnids in a time and concentration
dependent manner, indicating that this parameter may be highly appropriate for future modelling
designed to discriminate between different concentrations of the TBT and atrazine based on
behavioural responses of the daphnids. The average percentage of organisms immobilized at
each time point varied between the two chemicals (Figures 15 and 16) suggesting that this
parameter may be useful for distinguishing between the two contaminants, as well as
determining contamination levels. Immobilization will generally lead to death and subsequent
population level changes, as organisms are unable to move to find new sources of energy, to
avoid predators or to perform any other life functions. Because of the potential impacts of this
change in behaviour and the rapid and consistent onset in both TBT and atrazine, immobilization
should be evaluated in a multi-organism, early warning biomonitoring technology.
There are several potential causes of organism immobilization. Swimming is a highly
energetically demanding behaviour. Changes in the external environment of daphnids may
induce a stress situation which impacts the metabolism and other internal functions of the
organisms (Untersteiner et al., 2003). A finite amount of energy is available to organisms and
increasing energy use for one function may decrease the energy available for activities not
directly necessary for survival, such as swimming (Untersteiner et al., 2003; Schmidt et al.,
2005). Energy could also be rapidly depleted during escape attempts from an area of
contamination (Dodson et al., 1995). Organisms may thus try to conserve energy by falling to the
bottom of the bioassay vessel and resting there in response to contamination. A second reason
organisms may become immobilized is that the contaminant directly affects coordination,
spontaneous muscle activity and other necessary internal processes required for movement
(Untersteiner et al., 2003; Schmidt et al., 2005). Immobilization is often associated with
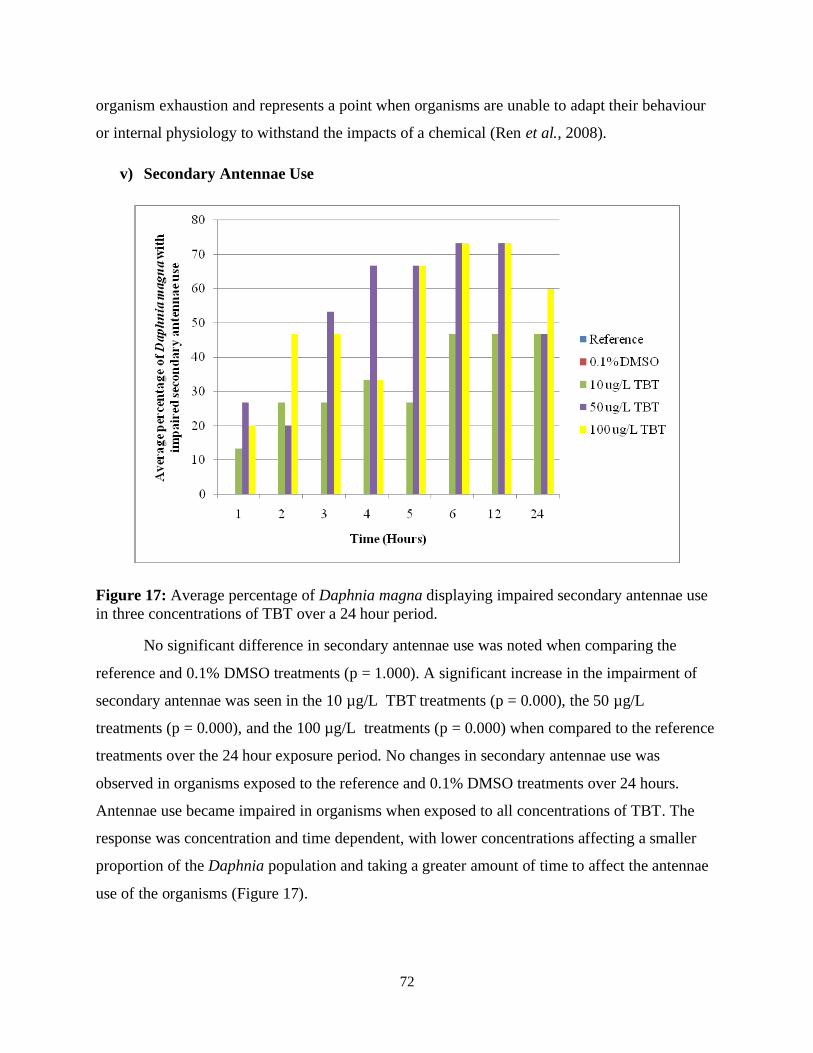
72
organism exhaustion and represents a point when organisms are unable to adapt their behaviour
or internal physiology to withstand the impacts of a chemical (Ren et al., 2008).
v) Secondary Antennae Use
Figure 17: Average percentage of Daphnia magna displaying impaired secondary antennae use
in three concentrations of TBT over a 24 hour period.
No significant difference in secondary antennae use was noted when comparing the
reference and 0.1% DMSO treatments (p = 1.000). A significant increase in the impairment of
secondary antennae was seen in the 10 µg/L TBT treatments (p = 0.000), the 50 µg/L
treatments (p = 0.000), and the 100 µg/L treatments (p = 0.000) when compared to the reference
treatments over the 24 hour exposure period. No changes in secondary antennae use was
observed in organisms exposed to the reference and 0.1% DMSO treatments over 24 hours.
Antennae use became impaired in organisms when exposed to all concentrations of TBT. The
response was concentration and time dependent, with lower concentrations affecting a smaller
proportion of the Daphnia population and taking a greater amount of time to affect the antennae
use of the organisms (Figure 17).

73
Figure 18: Average percentage of Daphnia magna displaying impaired secondary antennae use
in three concentrations of atrazine over a 24 hour period.
No significant difference in secondary antennae use was noted when comparing the
reference and 0.1% DMSO treatments (p = 1.000). A significant increase in the impairment of
secondary antennae was seen in the 5 µg/L atrazine treatments (p = 0.000), the 50 µg/L atrazine
treatments (p = 0.000), and the 100 µg/L atrazine treatments (p = 0.000) when compared to the
reference treatments. No changes in secondary antennae use was observed in organisms exposed
to the reference and 0.1% DMSO treatments over 24 hours. Antennae use became impaired in
organisms in all atrazine concentrations. However, no consistent pattern of time or concentration
dependence was seen (Figure 18), as the number of organisms displaying abnormal antennae use
varied at each time point.
Impairment of secondary antennae was seen in response to both TBT and atrazine. A
more consistent response with concentration and time dependency was seen when the organisms
were exposed to all three concentrations of TBT. This suggests that changes in secondary
antennae use may be a more sensitive parameter for detecting TBT and related organometallic
compounds than for detecting herbicides such as atrazine. Changes in secondary antennae likely
will be appropriate for developing a model to predict the exact concentration of TBT present in a

74
given water sample, due to the consistent response seen in the test daphnids. Changes in
secondary antennae usage may be appropriate for detecting the overall presence of atrazine, but
may be less useful for modelling purposes to determine specific concentrations, due to
inconsistent responses. Other changes in swimming behaviour, such as swimming style and
immobilization, are closely related to changes in secondary antennae use. Because of this and
because of the rapid decrease of use in response to TBT and atrazine, evaluation of the frequency
of use of secondary antennae should be incorporated into a multi-organism, early-warning
biomonitoring technology.
Similar results have been observed in past bioassays. Bailleul and Blust (1999) found that
secondary antennae beat frequency decreased significantly with increasing concentrations of
copper due to a suspected neurological failure brought on by the contaminant. Impaired
secondary antennae use was also observed with long-term exposure to both TBT and PCB,
causing organisms to have a decreased swimming velocity and spend more time at the bottom of
aquaria (Schmidt et al., 2003). Secondary antennae are moved by muscles which may be
negatively affected by a decrease in available energy reserves or which may be directly impacted
by the contaminant acting upon them (Schmidt et al., 2003; Untersteiner et al., 2003).

75
vi) Swimming Style
Figure 19: Average percentage of Daphnia magna displaying abnormal swimming style when
exposed to 3 concentrations of TBT over a 24 hour period.
No significant changes in swimming style were seen when comparing the reference and
0.1% DMSO treatments (p = 1.000) over the 24 hour bioassay. A significant increase in the
percentage of organisms displaying impaired swimming behaviour was seen in the 10 µg/L TBT
treatments (p = 0.000), the 50 µg/L TBT treatments (p = 0.000), and the 100 µg/L TBT
treatments (p = 0.000) when compared to the reference treatments. No changes in swimming
style were observed in the organisms in the reference or 0.1% DMSO control samples in the
TBT bioassay. All three concentrations of TBT affected the swimming style of Daphnia in a
time and concentration dependent manner (Figure 19). The two highest concentrations of TBT
affected the swimming style of organisms more rapidly and impacted a greater proportion of the
population than the 5 µg/L treatments.

76
Figure 20: Average percentage of Daphnia magna displaying abnormal swimming style when
exposed to 3 concentrations of atrazine over a 24 hour period.
No significant changes in movement style were seen when comparing the reference and
0.1% DMSO treatments (p = 1.000). Significant changes in movement style were seen in the 5
µg/L atrazine treatments (p = 0.000), the 50 µg/L atrazine treatments (p = 0.000), and the 100
µg/L atrazine treatments (p = 0.000) when compared to the reference over the 24 hour exposure
period. No changes in swimming style were observed in the organisms in the reference or 0.1%
DMSO control samples in the atrazine bioassay. All three concentrations of atrazine affected the
swimming style of Daphnia in a both time and concentration dependent manner, with nearly all
daphnids in the two highest concentrations displaying altered swimming behaviour after 3 hours
of exposure (Figure 20). Changes in behaviour in the 5 µg/L treatments were less consistent,
with fluctuation in the number of organisms displaying altered behaviour.
Similar movement abnormalities were seen in response to both TBT and atrazine. These
included swimming using jerky, short strokes, using the bottom of the vessel for propulsion and
immobilization of organisms. Responses to both contaminants were both concentration and time
dependent, suggesting a high level of suitability for future modelling. This suggests that it may
be possible discriminate between different concentrations of the TBT and atrazine based on the
77
overall proportion of daphnids displaying altered swimming behaviour. The average percentage
of organisms immobilized at each time point varied between the two chemicals (Figures 19 and
20), suggesting that this parameter may be useful for distinguishing between the two
contaminants, as well as determining contamination levels. Because of the rapid and consistent
onset of changes in swimming style in Daphnia magna in response to TBT and atrazine, this
parameter should be evaluated in a multi-organism early-warning biomonitoring technology.
Swimming style is very important to daphnids, as they are constantly swimming and
changes in this behaviour can affect prey susceptibility, ability to find food and to form groups
with other daphnids. By swimming normally in straight lines, organisms are able to travel to
food patches more quickly and move rapidly away from predators (Ryan and Dodson, 1998).
Daphnia with erratic swimming behaviour are more likely to attract the attention of visual
predators and predators which use mechanoreception to hunt (Dodson et al., 1995; Szulkin et al.,
2006). It has been shown that Daphnia with greater hop frequency and more erratic swimming
behaviour are more likely to be eaten by bluegill sunfish (Ryan and Dodson, 1998). Irregularities
in swimming behaviour are likely avoidance responses by the organisms in an attempt to move
to a less contaminated area (Ren et al., 2007). Normal escape responses to predators include a
short burst of swimming with multiple direction changes and several large hops or spins (Dodson
et al., 1995). This could potentially explain the increase in jerky swimming behaviour in
response to the two contaminants. Other studies have shown an increase in irregular swimming
prior a decline in activity in Daphnia exposed to a variety of organophosphorous pesticides (Ren
et al., 2008).
Summary of Daphnia magna Motility Bioassay
The results of the Daphnia magna motility bioassay revealed that some movement
behaviour parameters are more sensitive to chemical contaminants, specifically TBT and
atrazine, than others and should therefore be evaluated in a multi-organism, early-warning
biomonitoring technology. Since some parameters are more sensitive than others to the given
contaminants, changes in these parameters should be considered more important stress indicators
than other changes in behaviour and should be given higher priority when creating a model to
detect types and concentrations of contaminants.

78
The response which should be given highest consideration is changes in vertical
movement through the water column. Changes in this parameter were time and concentration
dependent in all of the TBT and atrazine treatments, affected a high number of the organisms,
and had a rapid response time for all treatments. The next most important response appeared to
be changes in swimming style. This parameter also displayed affected a larger proportion of
organisms, and was time and concentration dependent in both contaminants, but the onset of
changes seemed to be generally slower than changes in vertical movement. The third most
important parameter to be considered was immobilization, which also had a time and
concentration dependent change in response to TBT and atrazine. The parameter seems less
important than changes in vertical movement and swimming style due to a slower general onset
and lower proportion of organisms affected. The reaction is also the most severe, and it is
important to detect high levels of contaminant before such a reaction can occur. The parameter
which should be given priority next is changes in secondary antennae use. Changes in this
parameter occurred in all treatments of TBT and atrazine, but a time and concentration
dependence was seen in only the TBT, indicating that the parameter may not be useful for
atrazine detection. The changes in secondary antennae use also appeared to be less rapidly
induced and consistent than some of the other parameters discussed above. The next most
important parameter to be considered should be spinning behaviour. Spinning should be
considered less important than the above parameters due to a lack of time and concentration
dependence in both contaminants, an overall fluctuation in the number of organisms performing
the behaviour and because it is not independent of immobility. Finally, the least important
parameter, which should not be used in a multi-species, early-warning biomonitoring technology,
is body orientation. Due to a lack of consistent time and concentration dependent response, a low
percentage of organisms affected, the ability of organisms to recover their body positions, and a
lack of ecological relevance, this parameter should not be evaluated.
Overall, the ranking of importance of the six parameters is: swimming height >
swimming style > immobilization > secondary antennae use > spinning > body orientation. The
first 5 parameters should be included for evaluation in a multi-species, early-warning
biomonitoring technology, whereas body orientation should not.

79
3.1.2 Daphnia magna 72 Hour Mortality TBT
A 72 hour analysis of the average percentage of organism deaths which occurred with
exposure to the five treatments was performed at the same time as the Daphnia swimming
bioassay. The addition of the DMSO carrier had no effect on the mortality of Daphnia magna
after 72 hours of exposure (p = 0.317) (Figure 21). All three concentrations of TBT resulted in
100% mortality for the exposed Daphnia after 72 hours and therefore the contaminant had a
significant effect on the survival of Daphnia (p = 0.025).
Figure 21: Average percent of Daphnia magna which died after 72 hours of exposure to varying
concentrations of TBT. Treatments which have a significantly different (p ≤ 0.05) average
mortality than the reference are indicated with a *.
After 72 hours of exposure to all three concentrations of TBT, all organisms had died.
There was a significant difference between the number of deaths which occurred between the
reference and all three TBT treatments. This indicates that the concentrations which had sub-
lethal effects on behaviour after one day of exposure were lethal to daphnids after 3 days of
exposure.
* * *

80
3.2 Hyalella azteca Behaviour
3.2.1 Hyalella azteca Motility
Several aspects of Hyalella azteca motility behaviour were evaluated during these
bioassays and were found to change in the presence of varying concentrations of the
contaminants TBT and atrazine. Changes in response to the contaminants are summarized below
with a discussion of the ecological impacts of the change. Qualitative observations of general
trends of behavioural changes were made to aid in the ranking of the importance of the various
parameters. A discussion of the utility of the various parameters for evaluation in a multi-
organism early-warning biomonitoring system is also included. The movement characteristics
evaluated included: i) swimming events, ii) substrate crawling, iii) immobilization, iv)
burrowing, v) grouping, vi) body length, and vii) body orientation.
i) Swimming Events
In this bioassay, swimming events were monitored by observing whether or not
individual organisms performed swimming events at the given time periods. No evaluation of the
number of swimming events performed was made, only the occurrence of swimming events was
evaluated.
Figure 22: Average percentage of Hyalella azteca performing swimming events in three
concentrations of TBT over a 24 hour period.

81
When comparing the reference and 0.1% DMSO treatments, no significant change in the
number of the organisms performing swimming events is seen (p = 1.000) over the 24 hour
experimental period. A significant decrease in the number of organisms performing swimming
events is seen in the 10 µg/L TBT treatment (p = 0.000), the 50 µg/L TBT treatment (p = 0.000),
and the 100 µg/L treatment (p = 0.000) when compared to the reference. No changes in the
performance of swimming events were noted in the organisms in reference and 0.1% DMSO
treatments over the 24 hour experimental period in the TBT bioassay. All organisms performed
swimming events; however, the number of events seemed to decrease as the experiment went on.
Changes in the performance of swimming events were seen in all 3 concentrations of TBT. No
organisms in the two highest TBT concentrations performed swimming events after 4 hours of
exposure and swimming events ceased in the 10 µg/L treatments after 6 hours of exposure
(Figure 22). This indicates that the impacts of TBT on Hyalella swimming is concentration and
time dependent and that higher concentrations exert impacts more quickly and have a greater
overall impact.
Figure 23: Average percentage of Hyalella azteca performing swimming events in three
concentrations of atrazine over a 24 hour period.

82
When comparing the reference and 0.1% DMSO treatments, no significant change in the
number of organisms performing swimming events is seen (p = 0.982) over the 24 hour
experimental period. A significant decrease in the number of organisms performing swimming
events is seen in the 5 µg/L atrazine treatments (p = 0.000), the 50 µg/L atrazine treatments (p =
0.000), and the 100 µg/L atrazine treatment (p = 0.000) when compared to the reference.
Changes in the performance of swimming events also occurred in all three atrazine treatments,
with the response being time and concentration dependent (Figure 23). A decrease in swimming
events was seen in all three concentrations of atrazine after 1 hour of exposure.
Although a significant change in the performance of swimming events was observed in
all concentrations of TBT and atrazine, the monitoring of the occurrence of swimming events
may not be a useful parameter to evaluate using a multi-organism, early-warning biomonitoring
technology. This is because a decrease in the average number of organisms performing
swimming events was also seen in both the reference and DMSO control in the atrazine bioassay
after 10 and 24 hours. A decrease in overall swimming performance in the reference and DMSO
control were also seen in the TBT bioassay over time. This indicates that organisms may display
altered swimming patterns in a multi-organism, early-warning biomonitoring technology after
they are allowed to acclimate to the test chamber and could not be used reliably for an extended
period of time. The complete lack of swimming events in all three concentrations of TBT after 6
hours of exposure may also make it difficult to discriminate between the different concentrations
using a modelling approach.
Swimming behaviour allows for organisms to move more rapidly and over a greater
distance than typical crawling on the sediment surface. Inhibition of swimming events may make
Hyalella more vulnerable to predators as they cannot rapidly escape when threatened. Hyalella
feeding activity may also be impacted, as organisms cannot reach algae blooms, large
macrophytes, or other food sources which may be distributed above the sediment surface (Wang
et al., 2004). Organisms may also purposefully decrease their performance of swimming events.
As Hyalella are exposed to contaminants from the water column (Wang et al., 2004) remaining
close to the sediment surface may be a response to detected contaminants and an attempt to
reduce exposure to them.

83
ii) Substrate Crawling
Figure 24: Average percentage of Hyalella azteca crawling on the substrate in three
concentrations of TBT over a 24 hour period.
There was no significant difference in the number of organisms crawling on the substrate
in the reference and 0.1% DMSO treatments over the 24 hour test period (p = 1.000). A
significant decrease in the number of organisms crawling on the substrate was seen in the 10
µg/L TBT treatments (p = 0.000), the 50 µg/L treatments (p = 0.000), and the 100 µg/L TBT
treatments (p = 0.000) when compared to the reference treatments. No changes in substrate
crawling were observed in organisms exposed to reference and 0.1% DMSO treatments over the
24 hour experimental period. Significant decreases in substrate crawling were seen in all three
concentrations of TBT (Figure 24). Changes in substrate crawling were concentration and time
dependent, with higher concentrations exerting impacts more quickly and having a greater
overall impact. After 3 hours of exposure to the 100 µg/L treatment, no organisms were observed
crawling on the silica sand substrate, whereas there was still some movement on the substrate in
the two lower concentrations.

84
Figure 25: Average percentage of Hyalella azteca crawling on substrate in three concentrations
of atrazine over a 24 hour period.
There was no significant difference in the number of organisms crawling on the substrate
in the reference and 0.1% DMSO treatments over the 24 hour test period (p = 0.976). A
significant decrease in the number of organisms crawling on the substrate was seen in the 5 µg/L
atrazine treatments (p = 0.000), the 50 µg/L atrazine treatments (p = 0.000), and the 100 µg/L
atrazine treatments (p = 0.000) when compared to the reference treatments. Decreases in
crawling along the silica sand substrate were seen in all three concentrations of atrazine, but not
in the reference or 0.1% DMSO treatments (Figure 25). Decreases in the performance of
crawling by Hyalella were dependent on time but not concentration, as at several timepoints
lower concentrations of the contaminant impacted a greater percentage of the organisms.
Decreases in crawling movements were noted in all three concentrations of both TBT and
atrazine. Changes in crawling behaviour may be a more sensitive measure for the detection of
sub-lethal concentrations of TBT, as a time and concentration dependent decrease in crawling
movement was seen in all TBT treatments. This type of response can be easily incorporated into
a model to help determine the exact type and concentration of a contaminant. On the other hand,
changes in crawling behaviour may be a less useful parameter for detecting atrazine

85
contamination. Due to the variability between treatments and the lack of a concentration
dependent response, it may be difficult to use changes in this parameter in a model to predict the
precise concentration of atrazine in an incoming water sample. Crawling behaviour changes
could be used to detect the presence of atrazine but not a specific concentration of the substance.
Due to rapid changes in crawling behaviour on the sediment surface in response to two different
classes of contaminants, this parameter should be incorporated into a multi-species, early-
warning biomonitoring technology examining Hyalella movement, as crawling behaviour
appears to be very sensitive to changes in water quality.
Crawling on the sediment is important for Hyalella azteca while performing foraging.
Hyalella derive a great deal of their energy from algae growing at sediment-water interface and
from other organic matter that has fallen to this surface (Wang et al., 2004). Oxygen is also more
plentiful at this level than within the sediment, so organisms may selectively spend time crawling
on the sediment rather than burrowing in the hypoxic sediment (Wang et al., 2004). Changes in
crawling behaviour may therefore affect organism survival if maintained for an extended period
of time.
iii) Immobilization
Hyalella were considered to be immobilized if no movement of any body parts occurred.
This included not only locomotion associated with swimming events and substrate crawling, but
also any movement in place on the substrate, movement associated with burrowing, and
contractions of the body and movement of legs while the organisms were lying on their sides on
the sediment.

86
Figure 26: Average percentage of immobilized Hyalella azteca in three concentrations of TBT
over a 24 hour period.
When comparing the reference and 0.1% DMSO treatments, there was no significant
difference in the number of the organisms which were immobilized (p = 1.000) over the 24 hour
test period. A significant increase in the number of the organisms which were immobilized was
seen in the 10 µg/L TBT (p = 0.000), the 50 µg/L TBT (p = 0.000), and the 100 µg/L TBT (p =
0.000) treatments when compared to the reference. No immobilization of the organisms was
seen in the reference or 0.1% DMSO treatments in the TBT bioassay. All organisms remained
active throughout the bioassay. Increases in immobilization in the three atrazine treatments were
seen to be dependent on concentration and time, with responses seen earlier and having more
impact at higher concentrations (Figure 26). In the 100 µg/L treatments, no movement by any
organisms was observed after 3 hours of exposure to the contaminant. Responses to the
contaminant were seen in all three treatments after 2 hours of exposure.

87
Figure 27: Average percentage of immobilized Hyalella azteca in three concentrations of
atrazine over a 24 hour period.
When comparing the reference and 0.1% DMSO treatments, there was no significant
difference in the number of organisms which were immobilized (p = 0.976) over the 24 hour test
period. A significant increase in the number of organisms which were immobilized was seen in
the 5 µg/L atrazine treatments (p = 0.000), the 50 µg/L atrazine treatments (p = 0.000), and the
100 µg/L atrazine treatments (p = 0.000) when compared to the reference. In general, a time and
concentration dependent increase in Hyalella immobilization was seen in the three atrazine
treatments (Figure 27), with responses seen in all three treatments after 1 hour of exposure to the
contaminant.
All concentrations of TBT and atrazine produced a time and concentration dependent
increase in Hyalella immobilization when compared to reference treatments. Changes in this
type of behaviour were rapid in both contaminants, indicating that changes in overall mobility
are highly sensitive to the two different classes of contaminant. The time and concentration
dependent response patterns to both chemicals indicates that modelling based on changes in this
parameter is viable for both contaminants, and it is likely that such a model could be used to

88
precisely predict individual contaminant concentrations based on changes in organism
immobilization. Because of differences in timing of immobilization of organisms it is also likely
possible that the model will be able to distinguish between the two classes of contaminants, in
addition to providing information to water treatment facility managers about the overall
concentration of the contaminant. Severe decreases in mobility are seen in all concentrations of
atrazine and TBT with less than 2 hours of exposure, while no changes were seen in the
reference and DMSO treatments. This indicates that immobilization is highly sensitive to
changes in water quality caused by TBT and atrazine and that it should be included for
evaluation in a multi-organism, early-warning biomonitoring technology to detect contaminants
in drinking water.
Mobility is highly important for all biological functions in organisms including foraging,
predator avoidance, mating and conspecific recognition. Immobilization in Hyalella likely occurs
for similar reasons as in populations of daphnids discussed above, mainly the organisms suffer
from a depletion of energy reserves trying to avoid or adapt to contaminants, or the organisms’
internal functioning is directly altered by the contaminant leading to the inability to move.
iv) Burrowing
Figure 28: Average percentage of Hyalella azteca burrowed in three concentrations of TBT over
a 24 hour exposure period.

89
There was no significant difference when comparing the number of the organisms
burrowing in the reference and 0.1% DMSO treatments (p = 1.000). A significant difference was
seen when comparing the 10 µg/L TBT treatments (p = 0.000), the 50 µg/L treatments (p =
0.002), and the 100 µg/L treatments (p = 0.000) to the reference treatments over 24 hours. No
clear pattern was seen with respect to burrowing and TBT concentration as the organisms moved
in and out of burrows throughout the experiment (Figure 28). No time or concentration
dependence was seen in the bioassay.
Figure 29: Average percentage of Hyalella azteca burrowed in three concentrations of atrazine
over a 24 hour exposure period.
There was no significant difference when comparing the number of organisms burrowing
in the reference and 0.1% DMSO treatments (p = 0.966). A significant difference was seen when
comparing the 5 µg/L atrazine treatments (p = 0.000), the 50 µg/L atrazine treatments (p =
0.000), and the 100 µg/L atrazine treatments (p = 0.000) to the reference over the 24 hour
experimental period. Burrowing was seen in all atrazine treatments with no concentration or time
dependency (Figure 29). In all atrazine treatments, the number of the organisms burrowing
fluctuated between the different observation periods.

90
Significant increases in organism burrowing were seen in all treatments of TBT and
atrazine when compared to the reference treatments. Little or no burrowing was seen in the
reference and DMSO treatments. Burrowing can therefore be considered to be a general indicator
of stress caused by TBT and atrazine contamination, and changes in burrowing by the organisms
should be evaluated in a multi-species, early-warning biomonitoring technology in order to
detect the presence of these contaminants. However, as no clear pattern of response was seen
when organisms were exposed to either contaminant, it is unlikely that this parameter would be
useful for inclusion in a model designed to predict precise concentrations of the substances.
Burrowing in Hyalella is considered to be a type of avoidance behaviour (Hatch and
Burton, 1999). Generally Hyalella burrow in response to predators, when frightened, or in
response to other disturbances in their environments (Wang et al., 2004). It follows that if the
organisms are able to detect contaminants in the water column, they may burrow into
uncontaminated sediment to avoid contact with chemicals. This may help to lessen the
physiological effect of the contaminant on the organism (Oberlin and Blinn, 1997). Past long-
term bioassays have shown that Hyalella exposed to increasing concentrations of fluoranthene
will spend significantly more time burrowed than organisms in uncontaminated water (Hatch and
Burton, 1999).

91
v) Grouping
Figure 30: Average percentage of Hyalella azteca found in groups in three concentrations of
TBT over a 24 hour period.
There was no significant difference in the grouping behaviour of the organisms in the
reference and 0.1% DMSO (p = 1.000). When compared to the reference, a significant difference
in the grouping behaviour of the Hyalella was seen after exposure to 10 µg/L TBT treatments (p
= 0.01), 50 µg/L TBT treatments (p = 0.005), and 100 µg/L TBT treatments (p = 0.000) over
the 24 hour test period. No grouping was observed in the reference and 0.1% DMSO treatments
(Figure 30). Increased grouping was seen in all concentrations of TBT was seen; however, there
was no clear concentration or time dependence until after 6 hours of exposure. At earlier
timepoints, groups were either not formed or the organisms constantly moved into and out of
groups.

92
Figure 31: Average percentage of Hyalella azteca found in groups in three concentrations of
atrazine over a 24 hour period.
There was no significant difference in the grouping behaviour of the organisms in the
reference and 0.1% DMSO (p = 0.317). When compared to the reference, a significant difference
in the burrowing behaviour of the Hyalella was seen after exposure to 5 µg/L atrazine
treatments (p = 0.000), 50 µg/L atrazine treatments (p = 0.000), and 100 µg/L atrazine
treatments (p = 0.000) over the 24 hour test period. Little or no grouping was seen in the
reference and 0.1% DMSO treatments (Figure 31). Increased grouping was seen in all
concentrations of atrazine, but no pattern of time or concentration dependency was seen, as lower
concentrations of atrazine often affected a greater proportion of the organisms than higher
concentrations at multiple timepoints.
Significant increases in Hyalella grouping was seen in all treatments of TBT and atrazine
when compared to the reference treatments. Little or no grouping was seen in the reference and
DMSO treatments. Grouping can therefore be considered to be a general indicator of stress
caused by TBT and atrazine contamination, and changes in grouping by the organisms should be
evaluated in a multi-species, early-warning biomonitoring technology in order to detect overall
the presence of these contaminants. However, as no clear pattern of response was seen when

93
organisms were exposed to either contaminant, it is unlikely that this parameter would be useful
for inclusion in a model designed to predict precise concentrations of the substances.
Increases in organism grouping in response to chemical contaminants have been seen in
past long-term bioassays (Hatch and Burton, 1999). It is believed that grouping in Hyalella
occurs in response to stress, but is not a behavioural adaptation to reduce impacts of
contaminants (Hatch and Burton, 1999). It is not clear why increased group formation is seen
when organisms are exposed to contaminants; however, it seems that using grouping as a
parameter in a multi-species, early-warning biomonitoring would be appropriate based on
responses seen in the TBT and atrazine bioassays.
vi) Body Length
Figure 32: Average percentage of Hyalella azteca displaying shortened body lengths in three
concentrations of TBT over a 24 hour exposure period.
There was no significant difference Hyalella body length when comparing the reference
and 0.1% DMSO treatments (p = 1.000). A significant change in body length was seen in the 10
µg/L TBT treatments (p = 0.000), the 50 µg/L TBT treatments (p = 0.000), and the 100 µg/L

94
treatments (p = 0.000) compared to the reference over the 24 hour trial period. In the reference
and 0.1% DMSO treatments, no organisms displayed shortened bodies (Figure 32). An increased
number of the organisms displayed shortened bodies in all three concentrations of TBT.
Increases in body shortening were time and concentration dependent, with higher concentrations
of the contaminant causing body shortening in a greater proportion of the organisms, more
rapidly than in lower concentrations.
Figure 33: Average percentage of Hyalella azteca displaying shortened body lengths in three
concentrations of atrazine over a 24 hour exposure period.
There was no significant difference in organism body length when comparing the
reference and 0.1% DMSO treatments (p = 0.976). A significant change in body length was seen
in the 5 µg/L atrazine treatments (p = 0.000), the 50 µg/L atrazine treatments (p = 0.000), and
the 100 µg/L atrazine treatments (p = 0.000) compared to the reference over the 24 hour trial
period. In the reference and 0.1% DMSO treatments, no organisms displayed shortened bodies
(Figure 33). An increased number of the organisms displayed shortened bodies in all three
concentrations of atrazine. No pattern of time or concentration dependence was seen in the three
concentrations, as fluctuations in the average proportion of the organisms with shortened bodies

95
were seen at the various time points. Multiple observations of lower concentrations impacting
greater proportions of the organisms than higher concentrations were also seen.
Significant changes in body length were seen in rapid response to all concentrations of
TBT and atrazine, indicating that this is a sensitive parameter which can be changed in response
to the overall presence of contaminants. Evaluations of changes in Hyalella body length should
therefore be incorporated in a multi-organism, early-warning biomonitoring technology. A
consistent time and concentration dependent response was seen in TBT treatments, indicating
that changes in this parameter could potentially be included in a model which will help water
treatment plant operators determine exact concentrations of the contaminant present. Atrazine,
on the other hand, did not produce a consistent pattern of response. This suggests that elevated
levels of atrazine could potentially be detected by examining changes in Hyalella body length
but use of this parameter would not be helpful if incorporated into a model to help determinate
precise concentrations of the contaminant.
vii) Body Orientation
Figure 34: Average percentage of Hyalella azteca displaying changes in body orientation in
three concentrations of TBT over a 24 hour exposure period.

96
There were no significant changes in body orientation when comparing the reference and
0.1% DMSO treatments (p = 1.000). Significant changes in body orientation were seen in the 10
µg/L TBT treatments (p = 0.000), the 50 µg/L TBT treatments (p = 0.001) and the 100 µg/L
TBT treatments (p = 0.000) over the 24 hour experimental period. No changes in body
orientation (organisms lying on sides instead of upright) were seen in the reference and 0.1%
DMSO treatments (Figure 34). Compared to the reference treatments, an increase in abnormal
body orientation was seen in all three TBT treatments. No concentration or time dependence was
seen in the three TBT treatments, and a fluctuation of the organisms displaying altered body
orientation was seen in all treatments over time. It appeared that organisms were able to recover
to their normal upright body positions and that altered body positions were not maintained for
the duration of the experiment.
Figure 35: Average percentage of Hyalella azteca displaying changes in body orientation in
three concentrations of atrazine over a 24 hour exposure period.
There was no significant change in body orientation of the organisms when comparing
the reference treatments to the 0.1% DMSO treatments (p = 1.000), the 5 µg/L atrazine
treatments (p = 0.317) and the 50 µg/L atrazine treatments (p = 0.077) over the 24 hour
experimental period. A significant change in Hyalella body orientation was seen in the 100 µg/L

97
atrazine treatments compared to the reference (p = 0.010) during the 24 hour trial. A significant
increase in abnormal body orientation was seen in the 100 µg/L treatments when compared to
the reference treatments. No time dependence for changes in body orientation was noted at this
concentration (Figure 35).
Significant changes in body orientation of the Hyalella were seen in all three
concentrations of TBT. As responses were not concentration or time dependent, changes in this
parameter may only be used to determine the presence of TBT and would not be useful in any
type of model to inform treatment plant operators about the specific concentration of the
contaminant present. Significant changes in body orientation were only seen in the highest
concentration of atrazine, indicating that this may not be a sensitive parameter for detecting low
concentrations of the contaminant. An extensive literature review found no previous bioassays
which have been conducted examining changes in body orientation in Hyalella azteca in
response to chemical contaminants in the environment. It seems that this parameter is not
appropriate use for the detection of TBT and atrazine in a multi-species, early-warning
biomonitoring technology, due to a lack of response by organisms and the ability of organisms to
recover their upright positions.
Summary of Hyalella azteca Motility Bioassay
The results of the Hyalella azteca motility bioassay revealed that some movement
behaviour parameters are more sensitive to chemical contaminants, specifically TBT and
atrazine, than others and should therefore be evaluated in a multi-organism, early-warning
biomonitoring technology. Since some parameters are more sensitive than others to the given
contaminants, changes in these parameters should be considered more important stress indicators
than other changes in behaviour and should be given higher priority when creating a model to
detect types and concentrations of contaminants.
The most important parameter for evaluation in a multi-species, early-warning
biomonitoring system appeared to be immobilization. This parameter displayed a time and
concentration dependent response in both the TBT and atrazine, appeared rapidly in all
concentrations of both contaminants and should allow for modelling based discrimination
between concentrations and treatments. The second most important parameter to be evaluated

98
appeared to be substrate crawling. A concentration and time dependent response to TBT but not
atrazine was seen, allowing for discrimination between the two compounds and the potential for
modelling to determine exact TBT concentrations. A rapid onset with a high percentage of
organisms showing altered behaviour was seen in all concentrations of both contaminants. The
next most important parameter to be evaluated in our technology should be organism body
length. A similar concentration and time dependent response to TBT but not atrazine was seen,
allowing for discrimination between the two compounds and the potential for modelling to
determine exact TBT concentrations. All concentrations of both contaminants affected body
length and onset was again rapid. However, it appeared that overall a lesser number of organisms
displayed changes in body length than in other parameters discussed above, indicating it might
be a less sensitive characteristic of movement behaviour. The next most important parameter
appeared to be burrowing, which had no time or concentration dependent response to either
contaminant, a great deal of fluctuation in response, and could therefore be only used as a
general indicator of the contaminants, not for discrimination between different concentrations.
The parameter of grouping behaviour showed a similar response, but since it has less ecological
relevance, it should be ranked as less important that burrowing behaviour. The final two
parameters (swimming events and body orientation) should not be included for monitoring in a
multi-species, early-warning biomonitoring technology. Swimming events declined in the
reference and 0.1% DMSO treatments, indicating that acclimation may have taken place and that
over a long period of time this parameter may not be viable for evaluation. Changes in body
orientation occurred in all concentrations but with no pattern of time and concentration
dependence. Organisms were able to recover their body positions and the parameter seemed to
not be sensitive to low concentrations of atrazine.
Overall, the ranking of importance of the 7 parameters is: immobilization > substrate
crawling > body length > burrowing > grouping > body orientation = swimming events. The first
five parameters should be included for evaluation in a multi-species, early-warning
biomonitoring technology, whereas body orientation and swimming events should not.

99
3.3 Lumbriculus variegatus Behaviour
3.3.1 Lumbriculus variegatus Burrowing
Figure 36: Average rate of Lumbriculus burrowing (N = 10 organisms total) over time for the
five experimental treatments in the TBT bioassay.
Line graphs were utilized in the interpretation of Lumbriculus variegatus burrowing and
grouping behaviours, rather than bar graphs, in order to aid in interpretation of rates at which the
organisms burrowed and formed groups and to better present data overall. Qualitative
observations of changes in the rate of Lumbriculus variegatus burrowing suggest that the
organisms in the reference, DMSO and 0.1 µg/L treatments display a similar rate of burrowing
(Figure 36). Similar numbers of the organisms were buried at the different time points and a
similar endpoint was seen for the total average number of organisms in burrows. When
compared to the reference treatment, the organisms exposed to 1.0 and 10 µg/L of TBT seem to
have a lower rate of burrowing with fewer organisms burrowed overall, especially during the
first 2 hours of the trial (Figure 36). The organisms appear to burrow more slowly during initial
exposure, and have a lower endpoint for the total number of the organisms burrowed. This
suggests that concentrations of TBT as low as 1.0 µg/L may affect the burrowing rate of

100
Lumbriculus variegatus and that increasing concentrations of TBT may have a greater impact as
there is a greater difference in the change of rate as concentrations increase from 1.0 µg/L to
10.0 µg/L compared to the reference treatments.
Figure 37: Average rate of burrowing of Lumbriculus variegatus (N = 10 organisms total) over
a 6 hour experimental time period when exposed to five different treatments.
Qualitative observations of changes in the rate of Lumbriculus variegatus burrowing in
atrazine suggests that the average rate of burrowing in the DMSO treatment is slightly higher
than the reference, with a greater number of organisms buried in total at the end of the bioassay
(Figure 37). The three atrazine treatments seem to have a lower average rate of burrowing than
the reference. The impairment of burrowing behaviour in atrazine does not appear to be
concentration dependent, as the organisms in the 5 µg/L displayed a lower rate of burrowing than
the 50 and 100 µg/L, with less worms burrowed at all time points. The increase in burrowing rate
in the DMSO and the decrease in burrowing in the atrazine treatments indicate that the two
chemicals may affect the organisms in different manners. As the organisms in the DMSO
treatment burrowed more quickly than in the reference and atrazine treatments, it seems that the

101
worms were able to detect and attempt to avoid the DMSO in the water and that movement
behaviour was not impaired. This is unusual, as 0.1% DMSO did not affect the burrowing rate of
the organisms in the TBT bioassay or any of the other behaviours examined in this project.
Further modelling analyses beyond the scope of this thesis are necessary in order to determine if
the presence of the solvent affects the rate of burrowing of the organisms. In the atrazine
treatments, lower rates of burrowing were observed compared to the reference, which suggests
that the ability of the organisms to move away from the atrazine contamination is impaired.
Burrowing in sediment is a normal behaviour in Lumbriculus variegatus, which will bury
their head in the sediment and extend the tail for gas exchange (O’Gara et al., 2004). However,
organisms are also able to crawl on the surface of sediment in order to move from one area to
another (Drewes, 1999). Burrowing can be seen as an avoidance response in organisms which
are able to detect chemicals in their environment. Burrowing may allow organisms to avoid the
contaminant by escaping to clean sediment, thus reducing the impacts of the contaminant
(Wicklum et al.,1997). Varying results have been seen with regards to burrowing in the presence
of contaminants. Gerhardt (2007) found that Lumbriculus showed increased burrowing activity
in the presence of varying concentrations of lead. On the other hand, other studies have
demonstrated that burrowing in the organisms will decrease in the presence of pollutants due to
narcotic impacts of the contaminants (Landrum et al., 2002). This indicates that different classes
of contaminants may impact the rate of Lumbriculus burrowing in different ways.
An examination of Lumbriculus burrowing should be included in a multi-species, early-
warning biomonitoring technology. It appears that both TBT and atrazine at concentrations of
over 1.0 µg/L and 5 µg/L, respectively, will cause a decrease in the burrowing rate of the
organisms, indicating that this parameter is highly sensitive to low concentrations of these two
contaminants. As burrowing rates are decreased, it is likely that the contaminants are impacting
the organism’s ability to move and burrow, as discussed in greater detail below.
3.3.2 Lumbriculus variegatus Grouping
Initial grouping behaviour evaluations indicated that no response was seen to
concentrations of TBT below 10 µg/L , necessitating modifications to experimental procedures
including increased contaminant concentrations and longer observation periods.

102
Figure 38: Average rate of the grouping of Lumbriculus variegatus (N = 10 organisms total)
over time for the five experimental treatments during the TBT bioassay.
During the TBT colony formation bioassay, it appeared that the DMSO treatments and
concentrations of TBT ≤ 50 µg/L had no impact on the grouping rate of the organisms when
compared to the reference treatments (Figure 38). Worms in the 100 µg/L treatments appeared to
have a lower rate of colony formation than the reference organisms. Large amounts of
fluctuation in the number of the organisms involved in groups made qualitative observations
difficult, necessitating further modelling beyond the scale of this thesis to determine if an impact
was in fact seen.

103
Figure 39: Average rate colony formation of Lumbriculus variegatus (N = 10 organisms total)
over a 6 hour experimental time period when exposed to five different treatments in the atrazine
colony formation bioassay.
During the atrazine colony formation bioassay, it appeared that all treatments had similar
colony formation rates to the reference treatments due to fluctuation in the average number of the
organisms involved in a colony in all treatments (Figure 39). Movement of the organisms in and
out of colonies made qualitative observations of trends difficult, necessitating further modelling
beyond the scale of this thesis to determine if an impact was in fact seen.
The rate of colony formation and changes in colony behaviour has not been widely
studied in response to changes in water quality. It is known that in natural settings the organisms
will group together to increase body heat by being near other organisms or will gather around a
food source (Drewes, 1999). Although the organisms reproduced via asexual fragmentation
when cultured in a laboratory, Lumbriculus have also been known to sexually mate in the wild
(Drewes, 1997) and group formation may help to facilitate this process. The related species
Tubifex tubifex has been used in past bioassays with the MFB examining the effects of nickel,
copper, cadmium, and the pesticides imidacloprid and ivermectin on group movement and
ventilation. Over time, decreased group locomotion and ventilation in the aggregation were
found, with higher concentrations of the substances having a greater impact on the organisms

104
(Gerhardt, 2009). This indicates that monitoring of grouping behaviour is possible but that the
determination of rate models may not be the best way to monitor the parameter.
None of the treatments of TBT or atrazine appeared to have had an effect on the intrinsic
grouping rates of the organisms, indicating this parameter is not appropriate for detecting sub-
lethal concentrations of the two contaminants. The organisms are constantly moving in and out
of groups and group numbers can fluctuate greatly within short periods of time (Figures 38 and
39). The behaviour does not seem to have a measurable endpoint in any of the environmentally
relevant contaminant treatments, including the reference. Because of these factors, and the
potential difficulty of automating a system which could count worms in a colony, it is
recommended that grouping behaviour not be considered as a parameter in a rapid automated
biomonitoring system.
3.3.3 Lumbriculus variegatus Motility
Several aspects of Lumbriculus motility behaviour were evaluated during these bioassays
and were found to change in the presence of varying concentrations of the contaminants TBT
and atrazine. Changes in response to the contaminants are summarized below with a discussion
of the ecological impacts of the change. Qualitative observations of general trends of behavioural
changes were made to aid in the ranking of the importance of the various parameters. A
discussion of the utility of the various parameters for evaluation in a multi-organism early-
warning biomonitoring system is also included. The specific parameters evaluated included: i)
position in bioassay vessel, ii) locomotion style, iii) immobilization, iv) body length, v) body
orientation, and vi) group movement.

105
i) Position in Bioassay Vessel
Figure 40: Average percentage of Lumbriculus variegatus positioned in the middle of the
bioassay vessel when exposed to three concentrations of TBT over a period of 24 hours.
No significant differences in organism location within the bioassay vessel were seen
when comparing the reference to the 0.1% DMSO treatments (p = 0.676), the 10 µg/L TBT
treatments (p = 0.978), the 50 µg/L TBT treatments (p = 0.602), and the 100 µg/L TBT
treatments (p = 0.426) over the 24 hour experiment period. Some positioning within the centre of
the vessel was noted in all treatments after 1 hour of exposure; however, the organisms remained
at the edges of the bioassay vessels for the majority of the bioassay (Figure 40) Overall, none of
the TBT treatments had any effect on the location of the worms within the bioassay vessel.

106
Figure 41: Average percentage of Lumbriculus variegatus positioned in the middle of the
bioassay vessel when exposed to three concentrations of atrazine over a period of 24 hours.
No significant differences in organism positioning in the bioassay vessels was noted
when comparing the reference to the 0.1% DMSO treatments (p = 0.059), the 5 µg/L atrazine
treatments (p = 0.077), and the 50 µg/L atrazine treatments (p = 0.077). A significant change in
body positioning in the bioassay vessel was noted in the 100 µg/L atrazine treatments (p =
0.020) when compared to the reference over the 24 hour experimental period. Overall, a greater
number of the organisms were located in the middle of the bioassay vessel in the 100 µg/L
atrazine treatments than in the reference where all the organisms remained at the edge of the
vessel (Figure 41). A pattern of concentration dependence but not time dependence was seen in
this bioassay, as the organisms in the 100 µg/L bioassays appeared to alternate in position
between the edge and the middle of the vessel over the course of the experiment.
No changes in organism positioning within the bioassay vessel were seen in the three
treatments of TBT and in the two lowest concentrations of atrazine. The organisms spent the
majority of time moving along the edge of the glass beaker and were able to use the edge of the
vessel to aid in locomotion. A significant increase in the number of the organisms found in the
middle of the bioassay vessel was seen in the 100 µg/L atrazine treatments; however, the highest

107
average number of the organisms in the middle of the vessel was only 10%. This suggests that
although there is a significant difference from the reference treatments, not that many worms are
affected overall. Changes in position in the bioassay chamber have not been evaluated in
response to contaminants in a multi-species, early-warning biomonitoring technology. The
parameter has no real ecological significance as this type of restrictive space would not be found
in the natural habitat of the Lumbriculus. Results of the TBT and atrazine bioassays indicate that
this parameter should not be considered as part of a multi-species, early-warning biomonitoring
technology due to low levels of response, inconsistencies in results, the ability of organisms to
recover and move from one area to another, and potential problems monitoring with online
biomonitoring chambers.
ii) Locomotion Style
Figure 42: Average percentage of Lumbriculus variegatus displaying changes in locomotion
style after exposure to three concentrations of TBT over a 24 hour period.
No significant differences in locomotion style were seen when comparing the reference
and 0.1% DMSO treatments (p = 0.283) over the 24 hour experimental period. A significant
difference in the number of the organisms displaying abnormal movement was seen in the 10
µg/L TBT treatments (p = 0.000), the 50 µg/L TBT treatments (p = 0.000), and the 100 µg/L

108
TBT treatments (p = 0.000) when compared to the reference treatments. All three concentrations
of TBT affected the locomotion style of the worms in a time and concentration dependent
manner, with responses seen after 3 hours of exposure (Figure 42). After 5 hours of exposure, all
the organisms in the 50 µg/L and 100 µg/L TBT treatments displayed altered locomotion
patterns (Figure 42). After 24 hours, all of the organisms in all concentrations displayed
movement abnormalities.
Figure 43: Average percentage of Lumbriculus variegatus displaying changes in locomotion
style after exposure to three concentrations of atrazine over a 24 hour period.
No significant differences in locomotion style were seen when comparing the reference
and 0.1% DMSO treatments (p = 0.317). A significant increase in abnormal movement
behaviour was seen in the 5 µg/L atrazine treatments (p = 0.002), the 50 µg/L atrazine
treatments (p = 0.000), and the 100 µg/L atrazine treatments (p = 0.000) when compared to the
reference over the 24 hour experimental period. All three concentrations of atrazine affected the
locomotion style of the Lumbriculus in a time and concentration dependent manner, with a
greater number of the organisms displaying altered behaviour in the higher concentrations after
shorter periods of exposure (Figure 43). After 24 hours of exposure, almost all of the organisms
in the three treatments displayed movement style abnormalities.

109
A time and concentration dependent change in locomotion style of the worms was seen in
response to all three concentrations of both TBT and atrazine. Nearly all worms in all
contaminant treatments displayed altered movement patterns at the end of the bioassay period.
This indicates that change in movement style is a highly sensitive parameter which should be
investigated in a multi-species, early-warning biomonitoring technology. As a time and
concentration dependent response was seen to both contaminants, it should be possible to
incorporate these responses into a model to determine specific concentrations of each
contaminant when present in in-coming water supplies. As response patterns differed between
the two chemicals, it should also be possible to discriminate between the two classes of
contaminants using a modelling based approach. Due to its high sensitivity and ecological
importance, it is recommended that changes in movement style be measured when designing a
multi-species, early-warning biomonitoring technology using Lumbriculus variegatus.
Changes in movement style have been noted in numerous past bioassays in response to a
variety of contaminants. When exposed to varying concentrations of the pesticide ivermectin,
Lumbriculus showed similar behavioural changes to those seen in the TBT and atrazine,
bioassays including jerky movements and movements originating throughout the body rather
than the head region (Ding et al., 2001). Writhing and thrashing have also been observed in
response to copper contamination (O’Gara et al., 2004). Changes in movement behaviour could
have many detrimental effects on the organisms. The ability to move rapidly is important for the
organisms while trying to escape predators or other stimuli that organisms perceive to be
dangerous (Drewes, 1999; Drewes and Cain, 1999). Changes in speed or movement efficiency
may increase the vulnerability of organisms to predators. Thrashing behaviour may also attract
the attention of predators, again increasing the likelihood of predation. Movement style changes
may also affect the ability of organisms to find food sources and move away from areas of
contamination.

110
iii) Immobilization
Figure 44: Average percentage of Lumbriculus variegatus immobilized in three concentrations
of TBT over a 24 hour exposure period.
No significant differences in the number of individual organisms immobilized was seen
when comparing the reference and 0.1% DMSO treatments (p = 0.317). A significant increase in
the number of individual organisms immobilized was seen in the 10 µg/L TBT treatments (p =
0.002), the 50 µg/L treatments (p = 0.002), and the 100 µg/L TBT treatments (p = 0.000) when
compared to the reference treatments over the 24 hour experimental period. An overall increase
in the number of immobilized worms was seen in response to all three concentrations of TBT
(Figure 44). However, it appeared that there was no pattern of time or concentration dependence,
as at two of the observation points the average number of the organisms immobilized in the 5
µg/L treatment was higher than in the 50 µg/L treatments. A fluctuation in the number of the
organisms immobilized was seen over time.

111
Figure 45: Average percentage of Lumbriculus variegatus immobilized in three concentrations
of atrazine over a 24 hour exposure period.
No significant difference in the number of immobilized organisms was seen when
comparing the reference and the 0.1% DMSO treatments (p = 0.918). A significant increase in
organism immobilization was seen in the 5 µg/L atrazine treatments (p = 0.011), the 50 µg/L
atrazine treatments (p = 0.000), and the 100 µg/L atrazine treatments (p = 0.000) when
compared to the reference treatments over the 24 hour trial period. All three concentrations of
atrazine produced a time and concentration dependent increase in immobilization (Figure 45),
with a greater number of the organisms immobilized in a shorter period of time in higher
concentrations than in lower concentrations.
A significant increase in worm immobilization was seen in all three concentrations of
both TBT and atrazine. The concentration and time dependent response seen in the atrazine
treatments indicates that immobilization could be incorporated into a model to help predict the
exact concentration of the contaminant present in a sample. As no concentration or time
dependence was noted for immobilization in response to TBT, it is likely that this parameter
would be less likely to be useful in a model to determine the precise concentration of TBT in a
water sample. However, increases immobilization could be used as a general indicator of the

112
presence of TBT. The two distinct responses to the different classes of contaminants indicates
that discrimination between the two contaminants in a multi-species, early-warning
biomonitoring technology should be possible. Decreases in movement were seen in response to
all concentrations of the two contaminants, indicating that this parameter is highly sensitive to
chemical stress and should be evaluated as part of a multi-species, early-warning technology.
Mobility is highly important for all biological functions in organisms including foraging,
predator avoidance, mating and conspecific recognition. Immobilization in Lumbriculus likely
occurs for similar reasons as in populations of daphnids and Hyalella discussed above, mainly
organisms suffer from a depletion of energy reserves trying to avoid or adapt to contaminants or
the organisms’ internal functioning is directly altered by the contaminant leading to the inability
to move. The benefits of lowering activity levels would have to outweigh the costs of immobility
and are likely to allow for energy to be budgeted for other activities more necessary for the
organism to survive (Wicklum et al., 1997). Similar increases in immobility have been seen in
Lumbriculus exposed to varying concentrations of copper (O’Gara et al., 2004).
iv) Body Length
Figure 46: Average percentage of Lumbriculus variegatus displaying shortened bodies after
exposure to three concentrations of TBT over a 24 hour test period.

113
No significant changes in body length were seen when comparing the reference and 0.1%
DMSO treatments (p = 0.563) and the reference and 10 µg/L TBT treatments (p = 0.108). A
significant difference was seen when comparing the 50 µg/L TBT treatments (p = 0.039) and the
100 µg/L TBT treatments (p = 0.001) to the reference over the 24 hour observation period. The
DMSO treatments and concentrations of TBT ≤ 10 µg/L caused no significant changes in
organism body length, with the majority of worms maintaining an elongated body length for the
duration of the experiment (Figure 46). In the two highest concentrations a significant increase in
the organisms showing shortened bodies was seen, but the pattern of response was independent
of time. A concentration dependent response was seen when comparing the 50 µg/L and the 100
µg/L treatments, with a greater number of organisms in the 100 µg/L treatments displaying
shortened bodies than in the 50 µg/L treatments.
Figure 47: Average percentage of organisms displaying shortened bodies after exposure to three
concentrations of atrazine over a 24 hour test period.
No significant changes in body length were seen when comparing the reference and 0.1%
DMSO treatments (p = 0.124) and the 5 µg/L atrazine treatments (p = 0.201). A significant
114
increase in the number of the organisms with shortened bodies was seen in the 50 µg/L atrazine
treatments (p = 0.004), and the 100 µg/L atrazine treatments (p = 0.001) when compared to the
reference treatments over the 24 hour trial period. The DMSO treatments and concentrations of
atrazine ≤ 5 µg/L caused no significant changes in organism body length, with the majority of
worms maintaining an elongated body length for the duration of the experiment (Figure 47). A
concentration dependent response, independent of time, was seen when comparing the 50 µg/L
and 100 µg/L atrazine treatments.
A significant increase in the average number of the organisms displaying shortened
bodies was seen in the 50 µg/L and 100 µg/L atrazine and TBT treatments. This suggests that
this parameter may be useful for detecting high levels of both contaminants but not low levels.
The lack of a consistent time and concentration dependent response to both contaminants
indicates that this parameter may not be appropriate to incorporate into a model which can
determine accurate concentrations of the contaminants. However, the evaluation of changes in
body length should still be included in a multi-species, early-warning biomonitoring technology
in order to help detect high contaminant concentrations, such as those which may be seen
following a pulse introduction of chemical into the environment.
Body shortening has never been specifically examined for use in a multi-species, early-
warning biomonitoring system. Body shortening has been generally observed when the
organisms are exposed to sub-lethal concentrations of copper (O’Gara et al., 2004), but the
parameter has never been studied specifically. Body shortening in Lumbriculus is likely due to a
loss of function in the muscles which contract and expand the body during locomotion (Drewes,
1999). The ability to extend the body is closely related to locomotion and organisms with
permanently shortened bodies may not be able to move as efficiently as those with extended
bodies. Shortening of the body may also help to reduce exposure to contaminated water, as less
surface area is exposed for absorption of the contaminant.

115
v) Body Orientation
Figure 48: Average percentage of Lumbriculus variegatus showing changes in body orientation
after exposure to three concentrations of TBT over a 24 hour period.
No significant changes in body orientation were noted in the organisms exposed to 0.1%
DMSO treatments (p = 0.536) or 10 µg/L TBT treatments (p = 0.057) when compared to the
reference. Significant changes in body orientation were seen in the 50 µg/L TBT treatments (p =
0.021) and the 100 µg/L TBT (p = 0.002) treatments when compared to the reference over the
24 hour trial. The 0.1% DMSO and 10 µg/L TBT treatments had no effect on the body
orientation of the Lumbriculus. A significant increase in the number of the organisms displaying
changes in body orientation (bends or kinks in the body, or body coiling) was seen in the 50 µg/L
and 100 µg/L TBT treatments (Figure 48). The response pattern was dependent on
concentration, as the organisms in the higher treatment displayed a higher average number of
affected organisms. No pattern of time dependence was seen.

116
Figure 49: Average percentage of Lumbriculus showing changes in body orientation after
exposure to three concentrations of atrazine over a 24 hour period.
No significant changes in body orientation were seen when comparing the reference
treatments to the 0.1% DMSO treatments (p = 0.944), the 5 µg/L atrazine treatments (p = 0.940)
and the 50 µg/L atrazine treatments (p = 0.237). A significant difference in body orientation was
seen when comparing the reference and 100 µg/L atrazine treatments (p = 0.048) over the 24
hour experimental period. The DMSO treatments and concentrations of TBT ≤ 50 µg/L had no
effect on the body orientation of the organisms. A significant increase in the number of the
organisms displaying altered body orientation was seen when the organisms were exposed to the
100 µg/L treatments (Figure 49). No pattern of time or concentration dependence was seen.
In the TBT treatments only the two highest concentrations displayed alterations in body
orientation, while the only the highest concentration of atrazine showed an effect. This indicates
that this parameter might only be useful for detecting higher concentrations of the contaminant,
and not lower levels. No pattern of time or concentration dependent change was seen for either
contaminant, indicating that as this parameter may not be useful to incorporate into a model
designed to determine precise concentrations of the toxins. The parameter may be useful for
discriminating between the two chemicals and detecting if they are generally present, but not for

117
figuring out exact contaminant levels. Measurements of body orientation should therefore be
incorporated into a multi-species, early-warning biomonitoring technology, but the importance of
the parameter should be considered less than other more consistent responses.
Changes in body orientation have not been evaluated specifically for use in a multi-
species, early-warning biomonitoring technology in past studies. Changes in body orientation
and body coiling have been observed in response to increased copper concentrations (O’Gara et
al., 2004), but no studies have been performed to determine if this is an appropriate measure to
examine in sub-acute studies. Changes in body orientation would likely have an impact on an
organism’s ability to perform locomotion and may result in increased likelihood of predation.
vi) Group Movement
Figure 50: Average percentage of Lumbriculus variegatus displaying movement within groups
after exposure to three concentrations of TBT over a 24 hour exposure period.
No significant differences in group movement were noted when comparing the reference
and 0.1% DMSO treatments (p = 0.884), the reference and the 10 µg/L treatments (p = 0.075)
and the reference, and the 50 µg/L treatments (p = 0.058). Significant differences in group
movement were seen in when comparing the reference and 100 µg/L treatments (p = 0.005). No

118
significant changes in group movement were seen in concentrations of TBT ≤ 50 µg/L , while
the organisms in the 100 µg/L TBT treatments showed a time dependent decrease in group
movement (Figure 50).
Figure 51: Average percentage of Lumbriculus variegatus displaying movement within groups
after exposure to three concentrations of atrazine over a 24 hour exposure period.
No significant differences in group movement were noted when comparing the reference
and the 0.1% DMSO treatments (p = 1.000) over the 24 hour trial period. Significant differences
in group movement were seen in the 5 µg/L atrazine treatments (p = 0.025), the 50 µg/L
treatments (p = 0.006), and the 100 µg/L treatments (p = 0.003) when compared to the reference
treatments. All three treatments of atrazine affected the group movement of the Lumbriculus in a
generally time and concentration dependent manner (Figure 51). Overall, a decrease in group
movement was seen in all three treatments of the contaminant.
All three treatments of the atrazine affected group movement in the Lumbriculus;
however, only the highest concentration of TBT had a significant effect on the parameter. This
suggests that the parameter of group movement is more sensitive to atrazine contamination and

119
that it is a good parameter to use in a model to help discriminate between the two classes of
contaminants. As a time and concentration dependent response was seen to the contaminants,
this parameter should be useful for incorporation into a model to predict accurate concentrations
of atrazine and TBT in a water sample. The parameter of group movement should therefore be
evaluated in a multi-species, early-warning biomonitoring system.
Movement within colonies is of significance for a variety of reasons. Movement in, out
and within the colony is indicative of the motility of the organisms overall and indicates that the
organisms have not been immobilized and made unable to perform normal biological functions.
Secondly, movement within the colony is related to respiration in the organisms. Worms extend
their tail ends from the colony and allow them to sway back and forth and absorb oxygen from
the water column (Gerhardt, 2009). Decreases in movement within the colony could therefore be
indicative of decreased respiratory activity. Decreases in colony movement have been observed
in the related worm Tubifex tubifex when exposed to various heavy metals and pesticides
(Gerhardt, 2009).
Summary of Lumbriculus variegatus Motility Bioassay
The results of the Lumbriculus variegatus motility bioassay revealed that some
movement behaviour parameters are more sensitive to chemical contaminants, specifically TBT
and atrazine, than others and should therefore be evaluated in a multi-organism, early-warning
biomonitoring technology. Since some parameters are more sensitive than others to the given
contaminants, changes in these parameters should be considered more important stress indicators
than other changes in behaviour and should be given higher priority when creating a model to
detect types and concentrations of contaminants.
The most useful parameter for incorporation into a model to detect specific
concentrations of contaminants appeared to be locomotion style. Changes in movement style
were time and concentration dependent, had a rapid rate of onset, and affected a large proportion
of the organisms in both contaminants. The second most important parameter appeared to be
immobilization of organisms. All concentrations of the two contaminants increased organism
immobilization. A time and concentration dependent increase in immobilization was seen in the
TBT, but not the atrazine and discrimination between the two chemicals would likely be

120
possible. Increases in immobilization were less rapid than changes in locomotion style and
affected fewer organisms in general. The third parameter which should be considered is group
movement. All concentrations of atrazine and the highest concentration of TBT produced
significant changes in group movement that were time and concentration dependent. The
parameter appeared to be more sensitive to atrazine, allowing for discrimination between the two
compounds but making the parameter less useful for detecting low concentrations of TBT. The
next most important parameter appeared to be body length, which had no concentration or time
dependent patterns of response and showed no changes to the lowest concentrations of the two
contaminants. The parameter could only be used to judge if higher concentrations of TBT or
atrazine were present, not an exact concentrations. The parameter appeared to be slightly more
sensitive than body orientation. Body orientation would be the next most important parameter to
evaluate, as again no concentration or time dependent patterns of response were seen. In the TBT
treatments, the lowest concentration had no effect on body orientation and in the atrazine
treatments, only the highest concentration had an effect, indicating that the parameter is not
highly sensitive to either contaminant. Evaluation of this characteristic would only tell plant
operators if a contaminant was present, not what concentration was in the water sample. The
final characteristic studied, changes in vessel position, should not be included in a multi-species,
early-warning biomonitoring technology. TBT had no effect on this parameter, and only the
highest concentration of atrazine affected where organisms were located in the vessel, indicating
the parameter is not sensitive. Overall, very few of the organisms were affected and the
parameter has no real ecological significance, and therefore should not be evaluated.
Overall, the ranking of importance of the 6 parameters is: locomotion style >
immobilization > group movement > body length > body orientation > position in vessel. The
first 5 parameters should be included for evaluation in a multi-species, early-warning
biomonitoring technology, whereas vessel position should not.
3.3.4 Lumbriculus variegatus 72 Hour Mortaliy TBT
There were no significant differences from the reference in the 0.1% DMSO (p = 1.000)
or 10 µg/L TBT (p = 0.371) in terms of the number of Lumbriculus deaths which took place
over 72 hours. Compared to the reference individual Kruskal-Wallis analysis showed that there

121
was a significant increase in the number of deaths which occurred in the 50 µg/L TBT
treatments (p = 0.011) and the 100 µg/L TBT treatments (p = 0.014).
Figure 52: Average percent of Lumbriculus variegatus which died after 72 hours of exposure to
varying concentrations of TBT. Error bars indicate standard deviation and any treatments which
have a significantly different average mortality than the reference (p < 0.05) are indicated with a
*.
3.4 Mode of Action for Toxicity of TBT
Research has been conducted on the long-term impacts of TBT on invertebrate movement
in the past. Results of past bioassays with daphnids revealed that TBT exposure caused a slow
shut-down of many biological functions in the organisms rather than disrupting a single organ
system and that multiple cell types take up the contaminant, leading to a decline in biological
function and making it difficult to determine a primary mode of toxicity (Schmidt et al., 2005).
Decreases in movement parameters in all three study organisms are likely related to the way in
which TBT impairs muscle function. TBT impairs cellular metabolism by preventing the
breakdown of ATP to ADP, thus causing muscles to be deficient in energy to perform
locomotory activities (Alzieu, 1998). TBT has also been shown to increase intracellular calcium,
decrease ATP synthesis and breakdown by ATPase and decrease phenoloxidase activity, leading
to a lack of available energy for muscle activity and a decrease in muscle contraction ability
(Schmidt et al., 2005).
*
*

122
In daphnids, since muscle contraction is responsible for the movement of the secondary
antennae, the use of these may be impaired by TBT. Impairment of secondary antennae is linked
to changes in swimming style, swimming height, and immobilization. It is likely that spinning is
an escape response early in exposure or to exposure to low concentrations of TBT, and that
inhibition of secondary antennae use due to effects at the cellular level and the associated
changes in swimming height, swimming style and immobilization will occur with extended
exposure or with exposure to higher concentrations, as seen in the above results.
TBT likely affects Hyalella azteca by a similar impairment of muscle function, which
likely explains why a decrease in swimming events and substrate crawling and an increase in
organism immobilization was seen with exposure to TBT. The increased severity of reactions
seen in higher concentrations of TBT is likely related to the fact that increasing concentrations of
metal contaminants in the water column, such as cadmium and tin, results in higher internal
accumulation within tissues, and thus a greater impact on organisms exposed to the higher
environmental concentrations (Borgmann et al., 1996). Burrowing was likely a behavioural
response which helped to reduce exposure to TBT. As Hyalella accumulate most contaminants
from the water column (Wang et al., 2004) it is likely that escape to clean sediments was an
attempt to reduce the impacts of the contaminant.
TBT likely also impairs Lumbriculus muscle function in a similar manner and leads to an
overall decrease in movement parameters. Lumbriculus move through successive contractions of
longitudinal and circular muscles which travel down the length of the body of the worm and
propel it forward in the characteristic crawling motion (O’Gara et al., 2004). If longitudinal and
circular muscles were impaired by TBT, changes in movement would likely occur, as seen the
TBT motility bioassay. Changes in movement style and the ability to perform locomotion are
also closely related to colony movement and immobilization in organisms, and as TBT impairs
muscle function it is likely these parameters would also be affected, as seen in the bioassay.
Finally, if muscles are unable to extend and contract, this may explain why organisms exposed to
TBT display shortened body lengths.

123
3.5 Mode of Action for Toxicity of Atrazine
No conclusive determination of the cause of sub-lethal behavioural changes in response
to atrazine in non-target invertebrates has been reached (Wan et al., 2006). However, several
physiological changes which could potentially be related to changes in movement behaviour
have been seen in a number of aquatic organisms.
Several studies have suggested a link between atrazine exposure and depression of the
enzyme acetylcholinesterase (AChE) (Saglio and Trijasse, 1998; Key et al., 2003; Forget et al.,
2003). AChE is an important enzyme found in a wide range of species which functions as a
neurotransmitter, especially at neuromuscular junctions (Donkin et al., 1997; Forget et al., 2003).
AChE is responsible for the breakdown of acetylcholine at neuromuscular junctions and the
inhibition of the enzyme will result in a build-up of acetylcholine and a stimulation of nerve and
muscle fibres (Forget et al., 2003). If this stimulation is allowed to continue eventually muscle
tetany and paralysis will occur, followed by the death of the organism affected (Forget et al.,
2003). The ACh/AChE regulatory system is essential for normal muscle function and
impairment of this system may result in abnormal movement behaviour and immobility. Key and
colleagues (2003) noted a decrease in AChE activity in grass shrimp found in Florida canals
where the dominant contaminant was atrazine found in concentrations of between 15.4 and 29.4
ng/L. Another field study examining the relationship between atrazine contamination and AChE
function found that AChE levels of the copepod Tigriopus brevicornis were depressed by 70-
80% following the spring runoff in agricultural areas of France compared to uncontaminated
reference areas (Forget et al., 2003). The study concluded that there was a significant linear
relationship between decreased presence of AChE and increased atrazine concentrations (7-148
ng/L) in water (Forget et al., 2003). Both studies emphasized that it is not clear if atrazine alone
affects AChE activity or if it acts synergistically with other contaminants which may be present
in the water and that more research is needed in this area (Forget et al., 2003; Key et al., 2003).
If AChE activity is indeed depressed by atrazine, this would explain the movement abnormalities
and eventual immobilization of Daphnia magna, Hyalella azteca, and Lumbriculus variegatus in
the atrazine bioassays.
Several other cellular level changes have also been seen in aquatic organisms in response
to atrazine contamination. A major mode of toxicity at a cellular level appears to be oxidative

124
stress, wherein an increase in harmful reactive oxygen species (ROS) is seen after exposure to
atrazine (Liu et al., 2006; Sanchez et al., 2008; Song et al., 2009). The accumulation of ROS can
cause damage proteins and lipids (Song et al., 2009) making them unavailable for use as an
energy source. Long-term accumulation of ROS in animal tissue can result in DNA damage
including strand breaks, DNA lesions, removal of nucleotides and modification of nucleotide
bases (Song et al., 2009). It is likely that this type of damage to DNA is the mechanism by
which atrazine increases the risk of tumours and cancer in a number of organisms (Song et al.,
2009). Atrazine has also been linked to mitochondrial dysfunction and may contribute to reduced
availability of ATP for cellular function (Liu et al., 2005; Sanchez et al., 2009). The herbicide
has also been shown to affect ion regulation in several species of fish (Waring and Moore, 2004).
At concentrations of atrazine exceeding 6.5 µg/L increased plasma cortisol, increased plasma
osmolalities, and elevated concentrations of sodium, potassium, and chloride were seen in
Atlantic salmon (Salma salar) after 7 days of exposure (Waring and Moore, 2004). Stress
brought on by increased internal ROS, mitochondrial dysfunction, and ion regulation
abnormalities may have indirectly contributed to the overall depression of movement behaviour
seen in all three test organisms during the atrazine bioassays.

125
3.6 Daphnia magna Respiration
Figure 53: Respiration rates of 8 adult Daphnia magna exposed to varying concentrations of
TBT over a 24-hour period, expressed in relation to total average body weight of the organisms.
Significant differences (p ≤ 0.05) in treatments from the reference are denoted by *.
No significant differences were observed between the reference and the 0.1% DMSO (t =
1.22, p = 0.05), the 10 µg/L (t = 3.64, p = 0.05), the 50 µg/L (t = 1.11, p = 0.05) or the 100 µg/L
(t = .695, p = 0.05) TBT treatments (Figure 53). This indicates that (1) concentrations of TBT ≤
100 µg/L do not elicit a change in respiration rate in Daphnia or that (2) 8 organisms do not
consume enough oxygen to produce a noticeable change using Winkler titrations. For future
experiments, modifications of increasing the concentration of TBT or increasing the number of
organisms used should be made.

126
Figure 54: Respiration rates of 15 adult Daphnia magna exposed to varying concentrations of
atrazine over a 2-hour period, expressed in relation to total average body weight of the
organisms. Significant differences (p ≤ 0.05) in treatments from the reference are denoted by *.
No significant changes in respiration rates were seen between the reference and the 0.1%
DMSO treatment (p = 0.999), the reference and the 5 µg/L atrazine treatment (p = 0.998), and
the 50 µg/L atrazine treatment (p = 0.630) (Figure 54). A significant increase in respiration was
seen in the 100 µg/L treatment when compared to the reference (p = 0.039). This indicates that
concentrations of atrazine ≤ 50 µg/L will not affect the respiration rates of a population of
daphnids, but that at concentrations over 100 µg/L respiration rates will increase.
In theory, under low to moderate toxic stress the metabolic rate and demand for oxygen
should be increased. Under stress, energy demanding cellular repair mechanisms will be
activated causing an increase in oxygen consumption needed to perform these functions (Knops
et al., 2001). This response was seen in the Daphnia magna when exposed to atrazine at
concentrations ≥ 100 µg/L , where respiration rates significantly increased following 2 hours of
exposure to the contaminant. This suggests that changes in respiration of Daphnia magna are a
*

127
sensitive parameter for detecting higher concentrations of atrazine, with responses which are
rapidly seen at environmentally relevant concentrations. Similar increases in respiration rates of
daphnids have been seen in response to other chemical contaminants commonly found in aquatic
systems. Sigmon (1979) noted a significant increase in oxygen consumption in daphnids exposed
to 1 and 3 ppm of the pesticides 2,4-D and 2,4,5-T over a period of 9 hours exposure. A
significant increase in respiration in Daphnia magna has also been seen in response to
concentrations of cadmium greater than 5 ppb and concentrations of 3,4-dichloroaniline (DCA)
greater than 50 ppb after 48 hours of exposure (Barber et al., 1990). Other species of aquatic
organisms have also displayed an increase in overall respiration in response to contamination by
atrazine. Fathead minnow (Pimephales promelas) larvae exposed to 150 µg/L atrazine for 24
hours experienced a significant increase in oxygen consumption compared to control conditions
(Sanchez et al., 2008). This further supports the idea that changes in respiration of aquatic
organisms may be a sensitive parameter to use to detect atrazine contamination in drinking water
supplies.
No change in the respiration rates of Daphnia magna were seen in response to the
addition of varying concentrations of TBT. Changes in behavioural parameters of the Daphnia
were noted, including an increase in spinning behaviour and a decrease in movement up and
down through the water column. It is likely that decreases in certain behaviours compensate for
increases in other behaviours, therefore causing overall energy usage to remain the same. Similar
responses to various contaminants have been seen in past studies using various species of
Daphnia. No change in oxygen consumption was seen in Daphnia pulex exposed to naphthalene,
phenanthrene, fuel oil extract, and coal-tar creosote for 24 hours at concentrations representing
48 hour LC20 and LC30 values for the substances (Geiger and Buikema, 1981). Another study
found that concentrations of 17-52 µg/L CTAB, 4.1-12 µg/L copper and 0.74-8.4 µg/L cadmium
have no effect on the respiration of Daphnia magna over a 3 day period of exposure (Knops et
al., 2001).
Several possible reasons have been proposed for the lack of change seen in respiration
rates when organisms are exposed to contaminants. Firstly, the metabolic costs of increased
repair processes are masked by other effects of the contaminant. For example, decreased energy
spent on movement, food acquisition and growth in response to toxicants allows for more energy

128
to be spent on repair and adaptation processes (Knops et al., 2001). Overall, there is no change in
energy use, so no change in oxygen consumption would be seen. A second reason for respiration
rates to remain the same could be that cellular repair and adaptation energy demands are very
low compared to total metabolic demands of the organisms, and that they would not require an
increase in oxygen consumption in order to occur (Knops et al., 2001). A final reason that
respiration rates did not change could be that there was no additional metabolic costs associated
with chemical stress, and therefore no need for oxygen consumption to be increased (Knops et
al., 2001).
It is difficult to determine a single cause for a lack of change in oxygen consumption. In
the TBT bioassay, it seems most likely that changes in respiration rates may be masked by
decreases in other activities which require energy. TBT caused a severe decrease in a number of
parameters associated with locomotion, as seen when examining the results of the Daphnia
swimming behaviour bioassay. As less locomotory activities are performed, less energy will be
allocated to these and more will be allocated to repair processes. The TBT treatments will
therefore appear to have a similar rate of oxygen consumption as the reference and DMSO
treatments where organisms are performing normal swimming.
Both the TBT and atrazine bioassays demonstrated that it is possible to monitor the
oxygen consumption of daphnids over time, indicating that this could potentially be monitored in
a multi-species, early-warning biomonitoring technology. Results of the respiration bioassays
suggest that changes in oxygen consumption occur in Daphnia magna in response to elevated
concentrations of atrazine, but not TBT. Therefore, the use of this parameter would be more
suitable for detecting atrazine and similar halogenated pesticides than TBT and related organotin
compounds.

129
3.7 Hyalella azteca Respiration
Figure 55: Respiration rates of 3 adult Hyalella azteca exposed to varying concentrations of
TBT over a 10-hour period, expressed in relation to total average body weight of the organisms.
Significant differences (p ≤ 0.05) in treatments from the reference are denoted by *.
No significant differences were observed between the reference and the 0.1% DMSO (t =
0.68, p = 0.05), the 10 µg/L (t = 1.71, p = 0.05), or the 50 µg/L (t = 1.40, p = 0.05) TBT
treatments (Figure 55). A significant difference in the respiration rate of the reference and 100
µg/L organisms was found (t = 5.006, p = 0.05). A significant increase in respiration is seen in
organisms exposed to 100 µg/L TBT. Concentrations ≤ 50 µg/L TBT do not produce a
significant increase or decrease in the respiration rate of Hyalella azteca.
*

130
Figure 56: Respiration rates of 8 adult Hyalella azteca exposed to varying concentrations of
atrazine over a 4-hour period, expressed in relation to total average body weight of the
organisms. Significant differences (p ≤ 0.05) in treatments from the reference are denoted by *.
No significant changes in respiration rates were seen between the reference and the 0.1%
DMSO treatment (p = 0.723) and the reference and the 5 µg/L atrazine treatment (p = 0.578)
(Figure 56). A significant increase in respiration rate was seen in both the 50 µg/L atrazine
treatment (p = 0.007) and the 100 µg/L atrazine treatment (p = 0.001) when compared to the
reference treatment. This indicates that concentrations of atrazine ≥ 50 µg/L will cause a
significant increase in the respiration rate of a population of Hyalella azteca following 4 hours of
exposure to the contaminant.
Results for both the TBT and atrazine respiration bioassays were consistent with results
seen in experiments conducted by Oberlin and Bunn (1997), who found that Hyalella montezuma
increase their respiration and metabolic rates in response to stress from increased habitat
temperatures. This indicates that concentrations of TBT ≥100 µg/L (up to a point) and
concentrations of atrazine ≥ 50 µg/L (to an upper limit) may increase cellular repair processes
within the organism, and thus increase the oxygen demand and consumption by the Hyalella. In
*

131
the 10 and 50 µg/L treatments of TBT and the 5 µg/L treatment of atrazine the effects of the
contaminants on respiration may again be hidden by decreases in energy demands for
locomotion behaviour, causing the TBT treatments to appear to have similar respiration rates as
the reference treatments. In the 100 µg/L TBT treatment and the 50 and 100 µg/L atrazine
treatments it is likely that metabolic demands for cellular repair exceeded the savings in energy
from reduced locomotion activity, thus requiring increased oxygen uptake.
Evaluating changes in respiration rates may be a useful parameter for detecting TBT
concentrations higher than 100 µg/L and atrazine concentrations greater than 50 µg/L, which
could potentially be seen after a pulse introduction of the contaminant into the environment.
Responses were seen to lower concentrations of atrazine in a shorter period of time, indicating
that changes in oxygen consumption in Hyalella may be more sensitive to atrazine and
herbicides of similar structure than to TBT and related compounds. Further bioassays with other
classes of contaminants are required, but results found in this set of experiments indicate that
Hyalella respiration is a good characteristic to monitor in a multi-species, early-warning
biomonitoring technology due to the rapid response seen to high concentrations of TBT and
atrazine.

132
3.8 Lumbriculus variegatus Respiration
Figure 57: Respiration rates of 10 adult Lumbriculus variegatus exposed to varying
concentrations of TBT over a 24-hour period, expressed in relation to total average body weight
of the organisms. Significant differences (p ≤ 0.05) in treatments from the reference are denoted
by *.
No significant differences were observed between the reference and the 0.1% DMSO (t
value = 0.22, p = 0.05), the 10 µg/L (t value = 0.009, p = 0.05), the 50 µg/L (t value = 0.21, p =
0.05) or the 100 µg/L (t value = 0.96, p = 0.05) treatments (Figure 57). This indicates either (1)
concentrations ≤ 100 µg/L TBT do not produce a significant increase or decrease in the
respiration rate of Lumbriculus variegatus or (2) more organisms need to be used in bioassays in
order to detect greater change in DO content over time using Winkler titrations. For future
bioassays higher concentrations and more organisms should be used in order to determine if TBT
has an effect on the respiration of Lumbriculus variegatus.

133
Figure 58: Respiration rates of 20 adult Lumbriculus variegatus exposed to varying
concentrations of atrazine over a 2-hour period, expressed in relation to total average body
weight of the organisms. Significant differences (p ≤ 0.05) in treatments from the reference are
denoted by *.
No significant changes in respiration rates were seen between the reference and the 0.1%
DMSO treatment (p = 0.509) and the reference and the 5 µg/L atrazine treatment (p = 0.167)
(Figure 58). A significant increase in respiration rate was seen in both the 50 µg/L atrazine
treatment (p = 0.020) and the 100 µg/L atrazine treatment (p = 0.000) when compared to the
reference treatment. This indicates that concentrations of atrazine ≥ 50 µg/L will cause a
significant increase in the respiration rate of a population of Lumbriculus variegatus following 2
hours of exposure to the contaminant.
No changes in oxygen consumption were seen in the three TBT treatments. Similar to the
daphnids discussed above, it is likely that (1) effects of the contaminant on respiration were
masked by a decrease in energy demands for other processes, (2) repair mechanisms represent a
negligible demand of the total metabolic expenses of the organism or (3) there are no metabolic
costs associated with the contaminants (Knops et al., 2001). As a significant reduction in several
parameters associated with motility were seen when Lumbriculus were exposed to the
* *

134
experimental concentrations, it seems likely that a reduction in energy demand by these
parameters may have masked any increases in respiration in the atrazine treatments which may
have occurred.
A significant increase in oxygen consumption was seen in the two highest concentrations
of atrazine. Results obtained in the atrazine bioassay are consistent with observations made by
Pentinnen and Kukkonen (2000) who found that exposure to sub-lethal concentrations of PCP
increased the respiration rates of Lumbriculus variegatus. Results indicate that concentrations of
atrazine ≥ 50 µg/L (up to a point) will increase cellular repair processes within the organism and
thus increase the oxygen demand and consumption by the Lumbriculus. In the 10 µg/L
treatments the effects of TBT on respiration may again be hidden by decreases in energy
demands for locomotion behaviour, causing the TBT and atrazine treatments to appear to have
similar respiration rates as the reference treatments. In the 50 µg/L and 100 µg/L treatments it is
likely that metabolic demands for cellular repair exceeded the savings in energy from reduced
locomotion activity, thus requiring increased oxygen uptake. Pentinnen and Kukkoken (2000)
also examined internal tissue concentrations of Lumbriculus exposed to PCP simultaneously to
examining respiration rates. They found that a threshold tissue concentration of PCP was
required before a change in respiration occurred (Pentinnen and Kukkoken, 2000). It is likely
that a similar threshold exists for TBT and atrazine and that exposure to low concentrations of
the two contaminants for 24 hours does not result in an internal concentration high enough to
effect respiration.
Measurement of changes in oxygen consumption appears to be a rapid and sensitive
parameter to use to evaluate stress in Lumbriculus variegatus induced by the presence of
atrazine. However, examining changes in respiration does not appear to be a valid way to
determine if TBT is present in the aquatic environment as no change in the respiration rate of
Lumbriculus was seen over 24 hours of exposure to environmentally relevant concentrations.
Changes in respiration rates should therefore be incorporated into a rapid automated
biomonitoring system in order to help detect atrazine and similar compounds, but should not be
relied upon in order to detect TBT and related chemicals.

135
4.0 Summary and Future Directions
4.1 Summary
Various parameters of movement behaviour in Daphnia magna were observed to rapidly
and consistently change in response to all concentrations of TBT and atrazine, supporting past
research which indicates that these organisms are highly sensitive to contamination and are very
useful for biomonitoring using a real-time detection system. Results of this study showed that
swimming height, swimming style, immobilization, secondary antennae use, and spinning should
be evaluated in a multi-organism, early-warning biomonitoring technology. When considering
parameters to incorporate in a model to predict the exact concentrations of a given substance, the
parameters should be ranked as listed above, with swimming height being the best indicator of
potential stressors and spinning being the least reliable. Body orientation should not be
monitored. Results of the respiration bioassay showed that direct oxygen measurements of
respiration rates using daphnids is possible; however, not all contaminants may affect oxygen
consumption rates as TBT had no significant effect on the oxygen used by the organisms.
Respiration rate measurements of daphnids should be included in a multi-organism, early-
warning biomonitoring technology, but should be used in conjunction with behavioural
monitoring to ensure that all potential contaminants are detected.
Changes in several movement-based parameters were also noted in Hyalella azteca
exposed to TBT and atrazine, suggesting that these organisms should be included in a multi-
species, early-warning biomonitoring system. Changes in immobilization, substrate crawling,
body length, burrowing, and grouping should be monitored in a multi-species, early-warning
biomonitoring technology, and immobilization considered to be the most important parameter
and grouping the least important parameter for incorporation into future modelling. Body
orientation and swimming events should not be evaluated in a multi-species, early-warning
biomonitoring system. Changes in respiration rates were seen in response to both contaminants,
indicating that evaluation of oxygen consumption by Hyalella should be evaluated in a multi-
species, early-warning biomonitoring technology. However, changes in respiration should again
be evaluated at the same time as behaviour, as the behavioural changes seem to have been seen
more rapidly and at lower concentrations than the respiration rate changes.

136
Finally, changes in several locomotory parameters of Lumbriculus variegatus were also
seen in rapid response to both TBT and atrazine, suggesting that these organisms should be
included in a multi-species, early-warning biomonitoring system evaluating behaviour.
Locomotion style, immobilization, group movement, body length and body orientation should be
monitored for changes in response to chemical contaminants, with importance placed in on
parameters in this order when performing modelling to predict classes and concentrations of
contaminants. Position in the bioassay vessel or monitoring chamber should not be evaluated as
part of a multi-species, early-warning biomonitoring technology. Changes in burrowing
behaviour of the Lumbriculus should also be evaluated, whereas changes in grouping behaviour
should not be included for monitoring in a multi-species, early-warning biomonitoring
technology. Results of the respiration bioassay showed that direct oxygen measurements of
respiration rates using Lumbriculus variegatus is possible; however, not all contaminants may
affect oxygen consumption rates, as TBT had no significant effect on the oxygen used by the
worms. Changes in respiration must therefore be evaluated simultaneously with behavioural
monitoring, to make sure that all concentrations and types of contaminants are detected.
Results of the aforementioned bioassays showed that all three study organisms should be
utilized in a multi-species, early-warning biomonitoring technology. Both behaviour and
respiration rates should be evaluated in all three organisms; however, it appears that overall
behavioural changes are more sensitive to contaminants than respiration changes. All
concentrations of TBT and atrazine cause changes in behaviour in the three organisms, whereas
mixed results were seen for respiratory responses. Changes in behaviour were also seen more
rapidly in general than changes in respiration, indicating that behavioural parameters may be
more sensitive and thus more useful for rapid detection of chemicals.
4.2 Future Directions of Research
This thesis research is a small part of a large-scale NSERC-funded project aimed at
developing a holistic multi-species, early-warning biomonitoring technology over the next five
years. An outline of the project as a whole is provided below (Figure 59), with the work of this
thesis highlighted in yellow and presented in relation to the entire project.

137
Initial Bioassays with D.
magna, H. azteca, and L.
variegatus
- Gillianne Marshall
- Dr. Lynda McCarthy
Initial Bioassays with aquatic
plants, protists, and bivalves
- Christopher Pearce
- Dr. Lynda McCarthy,
Dr. Merhab Merhvar
Development of Microarray-
Based Test for Detection of
Pathogens
- Shawn Clark
- Dr. Kim Gilbride
Further bioassays with greater
varieties of chemical and
biological contaminants,
mixtures of contaminants
- TBD
- Dr. Lynda McCarthy
Development of Dose-
Response Relationships and
Modelling of Organism
Responses Using MATLAB
- Aryo Maradona
- Dr. Merhab Merhvar,
Dr. Andrew Laursen
Automation of Organism
Monitoring in flow-through
technology
- Vivian Fleet, Isabelle
Netto, TBD
- Dr. Lynda McCarthy,
Dr. Andrew Laursen,
Dr. Vadim Bostan
In situ field study of multi-species, early-warning biomonitoring technology
at the DeCew Water Treatment Plant in Thorold, Ontario.
- TBD
- Dr. Lynda McCarthy, Dr. Andrew Laursen, Dr. Vadim Bostan, Dr.
Merhab Merhvar, Dr. Kim Gilbride, Dr. Ron Puschak
Figure 59: Outline of the steps involved in developing our multi-species, early-warning biomonitoring system. Graduate
students involved in the project are highlighted in blue, while primary investigators are highlighted in red. Work performed
as part of this thesis is highlighted in yellow.

138
The behavioural data collected in the bioassays discussed above are currently being
processed and used to create a MATLAB-based model which will predict the type and
concentration of contaminant present in a water sample based on a combined assessment of the
behavioural changes of the three organisms. This model will be part of a “library” of response
patterns to various types of contaminants and will be used as part of a multi-organism, early-
warning biomonitoring technology.
However, bioassays conducted for this thesis only examined two potential contaminants
in the aquatic environment. Further laboratory-based bioassays are required for heavy metals,
poly-aromatic hydrocarbons (PAHs), pathogens, and a wide array of other classes of pollutants
in order to add to the “library” of responses and to strengthen existing modelling. Laboratory
bioassays also must be performed examining the effects of biological pathogens on the behaviour
and physiology of the test organisms, in order to determine if the potential exists for this system
to detect agents introduced to water supplies through acts of bioterrorism. The effects of
mixtures of various contaminants, as would be seen in a natural freshwater setting, must also be
evaluated. This thesis will help to greatly streamline future laboratory bioassays, as it has
developed procedures for bioassays and determined the relevant characteristics which should be
examined by future graduate students when performing laboratory bioassays. The next step will
be to automate the recording and evaluation of the various behavioural and physiological
parameters discussed above by modifying previously developed softwares and biomonitoring
systems or by creating new technologies capable of automation of such monitoring. Integration
of the MATLAB models based on laboratory bioassays will also need to occur in order to make
the technology complete and unique from past BEWS.
The field application of our multi-species, early-warning biomonitoring technology will
then take place at the DeCew Water Treatment Plant in Thorold, Ontario. At this facility, water
is taken from the Welland Canal and is treated and distributed to citizens in the Niagara Region.
Water enters from the canal through a channel and sits in a holding reservoir for 3-4 days before
treatment and distribution. Our multi-species, early-warning biomonitoring technology will be
established at the inflow to this reservoir. In the event of an adverse response to a chemical or
biological contaminant, intake into the water treatment facility can be stopped and water can be

139
held in the reservoir until the nature of the problem can be established and treated appropriately
by plant operators. The multi-species, early-warning biomonitoring technology will be
established in a small shed constructed on the site. The shed will house a number of pieces of
equipment capable of automatically and remotely monitoring the behaviours of the organisms
discussed in this study, as well as the behaviours of photosynthetic organisms, protists, and
bivalves which have been studied in a thesis project conducted simultaneously to this research
(Figure ?). The large number of organisms being used will allow for greater sensitivity of the
technology and will help in predicting the type and concentration of a given contaminant. Water
inflow into the shed will be temperature controlled, as changes in this abiotic condition could
potentially affect the behaviour of the organisms used in the technology. Overall, the technology
will not replace more traditional chemical and physical means of detecting water contaminant;
rather, it will be used in conjunction with these methods to help detect potentially dangerous
contaminants in our water, especially pulses of contaminants which may be not be detected with
periodic chemical analysis. The continuous nature of our biomonitoring technology, as well as
it’s time and cost efficiency make it an appealing technology for use in areas where access to
chemical analysis facilities may be limited.
The field testing of our technology at the DeCew Water Treatment Plant will help to
determine if the use of multiple species in a biomonitoring system is possible in a field setting, if
the behaviour of bioassay organisms is consistent in the field, and if changes in these parameters
can be used with the incorporated models to detect various types and concentrations of
environmental contaminants in an incoming drinking water supply. If in situ use of our multi-
species, early-warning biomonitoring technology is successful at the DeCew Water Treatment
Plant, the next logical step would be for increased use of the technology throughout the country,
particularly in marginalized areas such as First Nations reserves, and for policy-based changes to
occur which would mandate that all drinking water facilities in Ontario and Canada utilize
biomonitoring technology, in addition to traditional chemical and physical testing. Future
employment of our system at water treatment facilities throughout the country would help to
greatly increase the safety of Canada’s freshwater drinking supply and help to prevent
detrimental impacts on human health caused by polluted drinking water. Finally, the use of such
a sensitive, reliable, and relatively inexpensive early-warning biomonitoring technology could be
used in developing countries where clean drinking water is at a premium.

140

141
REFERENCES
Alfa Aesar (2007) MSDS for Sodium chloride.
Alzieu, C., Sanjuan, J., Deltreil, J.P. and Borel, M. (1986) Tin contamination in Archaron Bay:
effects on oyster shell anomalies. Marine Pollution Bulletin 17: 494-498.
Alzieu, C. and Heral, M. (1984) Ecotoxicological effects of tributyltin compounds on oyster
culture. Ecotoxicological Testing for the Marine Environment 2: 187-197.
Alzieu, C. (1998) Tributyltin: case study of a chronic contaminant in the coastal environment.
Ocean and Coastal Management 40: 23-36.
American Society of Limnology and Oceanography (ASLO) (2004) Image of Hyalella azteca.
Retrieved from http://www.aslo.org/photopost/showphoto.php/photo/398
Anderson, T.D. and Lydy, M.J. (2002) Increased toxicity to invertebrates associated with a
mixture of atrazine and organophosphate insecticides. Environmental Toxicology and Chemistry
21: 1507-1514.
Anderson, T.D. and Zhu, K.Y. (2004) Synergistic and antagonistic effects of atrazine on the
toxicity of organophosporodithioate and organophosphorotioate insecticides to Chironomus
tentans (Diptera: Chironomidae). Pesticide Biochemistry and Physiology 80: 54-64.
Arner, M. and Koivisto, S. (1993) Effects of salinity on metabolism and life history
characteristics of Daphnia magna. Hydrobiologia 259: 69-77.
Baillieul, M. and Blust, R. (1999) Analysis of the swimming velocity of cadmium-stressed
Daphnia magna. Aquatic Toxicology 44: 245-254.
Baillieul, M. and Scheunders, P. (1998) Online determination of the velocity of simultaneously
moving organisms by image analysis for the detection of sublethal toxicity. Water Research 32:
1027-1034.
Barber, I., Baird, D.J. and Calow, P. (1990) Clonal variation in general responses of Daphnia
magna Straus to Toxic stress. II. Physiological Effects. Functional Ecology 4: 409-414.
Beitinger, T. (1990) Behavioural reactions for the assessment of stress in fish. Journal of Great
Lakes Research 16: 495-528.
Blockwell, S.J., Maund, S.J. and Pascoe, D. (1998) The Acute Toxicity of Lindane to Hyalella
Azteca and the Development of a Sublethal Bioassay Based on Precopulatory Guarding
Behaviour. Archives of Environmental Contamination and Toxicology 35: 432-440.
Borgmann, U., Chau, Y.K., Wong, P.T.S., Brown, M. and Yaromich, J. (1996) The relationship
between tributyltin (TBT) accumulation and toxicity to Hyalella azteca for use in identifying
TBT toxicity in the field. Journal of Aquatic Ecosystem Health 5: 199-206.
Bunn, S.E. (1995) Biological monitoring of water quality in Australia: Workshop summary and
future directions. Australian Journal of Ecology 20: 220-227.

142
Butterworth, F. M., Gunatilaka, A. and Diehl, P. (2002) The Rhine/Danube Monitoring
Paradigm: Broader Applications of Sensor Technologies. Proceedings: International IWA
Conference on Automation of Water Quality Monitoring. pp. 299-305. Retrieved from
http://www.poyry.at/linked/en/general/rhine_danube_paradigm.pdf
Canadian Drinking Water Quality Guidelines (2008) Retrieved from http://www.hc-
sc.gc.ca/ewh-semt/water-eau/drink-potab/index-eng.php
Chau, Y.K., Maguire, R.J., Brown, M., Yang, F. and Batchelor, S.P. (1997) Occurrence of
organotin compounds in the Canadian aquatic environment five years after the regulation of
antifouling uses of Tributyltin. Water Quality Research Journal of Canada 32: 453-521.
Christensen, B.T., Lauridsen, T.L., Ravn, H.W. and Bayley, M. (2005) A comparison of feeding
efficiency and swimming ability of Daphnia magna exposed to cypermethrin. Aquatic
Toxicology 73: 210-220.
Clotfelter, E.D., Bell, A.M. and Leverin, K.R. (2004) The role of animal behaviour in the study
of endocrine-disrupting chemicals. Animal Behaviour 68: 665-676.
Collyard, S.A., Ankley, G.T., Hoke, R.A. and Goldenstein, T. (1994) Influence of age on the
relative sensitivity of Hyalella azteca to diazinon, alkylphenol ethoxylates, copper, cadmium and
zinc. Archives of Environmental Contamination and Toxicology 26: 110-113.
Cunha, S.R., Goncalves, R., Silva, S.R., and Correira, A.D. (2008) An automated marine
biomonitoring system for assessing water quality in real-time. Ecotoxicology 17: 558-564.
Cushing, D.H. (1951) The vertical migration of planktonic crustacean. Biological Reviews 26:
158-192.
Denoyelles, F., Kettle, W.D. and Sinn, D.E. (1982) The responses of plankton communities in
experimental ponds to atrazine, the most heavily used pesticide in the United States. Ecology 63:
1285-1293.
Detenbeck, N.E., Hermanutz, R., Allen, K. and Swift, M. (1996) Fate and effects of the herbicide
atrazine in flow-through wetland mesocosms. Environmental Toxicology and Chemistry 14:
937-946.
Dewey, S. (1986) Effects of the herbicide atrazine on aquatic insect community structure and
emergence. Ecology 67: 148-162.
Ding, J., Drewes, C.D. and Hsu, W.H. (2001) Behavioural effects of ivermectin in a freshwater
Oligichaete, Lumbriculus variegates. Environmental Toxicology and Chemistry 20: 1584-1590.
Dodson, S.I. and Hanazato, T. (1995) Commentary on Effects of Anthropogenic and Natural
Organic Chemicals on Development, Swimming Behavior, and Reproduction of Daphnia, a Key
Member of Aquatic Ecosystems. Environmental Health Perspectives 103: 7-11.
Dodson, S.I., Hanazato, T. and Gorski, P.R. (1995) Behavioural responses of Daphnia pulex
exposed to Carbaryl and Chaoborus Kairomone. Environmental Toxicology and Chemistry 14:
43-50.
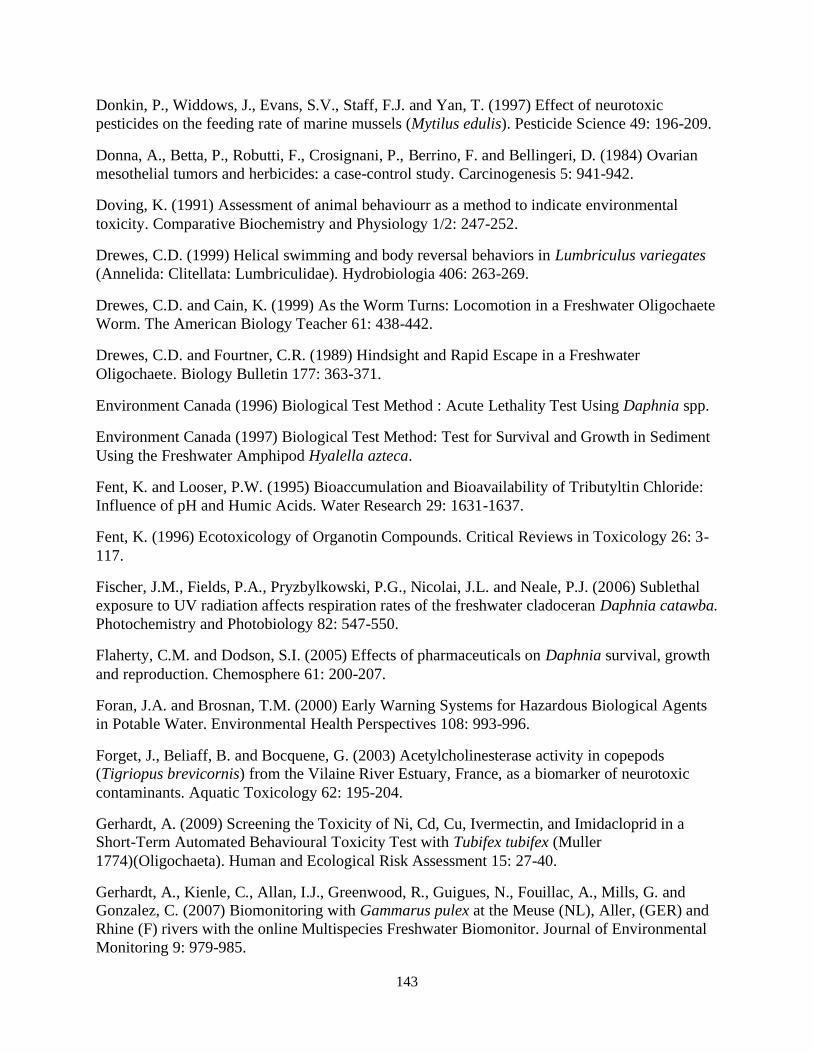
143
Donkin, P., Widdows, J., Evans, S.V., Staff, F.J. and Yan, T. (1997) Effect of neurotoxic
pesticides on the feeding rate of marine mussels (Mytilus edulis). Pesticide Science 49: 196-209.
Donna, A., Betta, P., Robutti, F., Crosignani, P., Berrino, F. and Bellingeri, D. (1984) Ovarian
mesothelial tumors and herbicides: a case-control study. Carcinogenesis 5: 941-942.
Doving, K. (1991) Assessment of animal behaviourr as a method to indicate environmental
toxicity. Comparative Biochemistry and Physiology 1/2: 247-252.
Drewes, C.D. (1999) Helical swimming and body reversal behaviors in Lumbriculus variegates
(Annelida: Clitellata: Lumbriculidae). Hydrobiologia 406: 263-269.
Drewes, C.D. and Cain, K. (1999) As the Worm Turns: Locomotion in a Freshwater Oligochaete
Worm. The American Biology Teacher 61: 438-442.
Drewes, C.D. and Fourtner, C.R. (1989) Hindsight and Rapid Escape in a Freshwater
Oligochaete. Biology Bulletin 177: 363-371.
Environment Canada (1996) Biological Test Method : Acute Lethality Test Using Daphnia spp.
Environment Canada (1997) Biological Test Method: Test for Survival and Growth in Sediment
Using the Freshwater Amphipod Hyalella azteca.
Fent, K. and Looser, P.W. (1995) Bioaccumulation and Bioavailability of Tributyltin Chloride:
Influence of pH and Humic Acids. Water Research 29: 1631-1637.
Fent, K. (1996) Ecotoxicology of Organotin Compounds. Critical Reviews in Toxicology 26: 3-
117.
Fischer, J.M., Fields, P.A., Pryzbylkowski, P.G., Nicolai, J.L. and Neale, P.J. (2006) Sublethal
exposure to UV radiation affects respiration rates of the freshwater cladoceran Daphnia catawba.
Photochemistry and Photobiology 82: 547-550.
Flaherty, C.M. and Dodson, S.I. (2005) Effects of pharmaceuticals on Daphnia survival, growth
and reproduction. Chemosphere 61: 200-207.
Foran, J.A. and Brosnan, T.M. (2000) Early Warning Systems for Hazardous Biological Agents
in Potable Water. Environmental Health Perspectives 108: 993-996.
Forget, J., Beliaff, B. and Bocquene, G. (2003) Acetylcholinesterase activity in copepods
(Tigriopus brevicornis) from the Vilaine River Estuary, France, as a biomarker of neurotoxic
contaminants. Aquatic Toxicology 62: 195-204.
Gerhardt, A. (2009) Screening the Toxicity of Ni, Cd, Cu, Ivermectin, and Imidacloprid in a
Short-Term Automated Behavioural Toxicity Test with Tubifex tubifex (Muller
1774)(Oligochaeta). Human and Ecological Risk Assessment 15: 27-40.
Gerhardt, A., Kienle, C., Allan, I.J., Greenwood, R., Guigues, N., Fouillac, A., Mills, G. and
Gonzalez, C. (2007) Biomonitoring with Gammarus pulex at the Meuse (NL), Aller, (GER) and
Rhine (F) rivers with the online Multispecies Freshwater Biomonitor. Journal of Environmental
Monitoring 9: 979-985.

144
Gerhardt, A. (2007a) Importance of Exposure Route for Behavioural Responses in Lumbriculus
variegates Muller (Oligichaeta: Lumbriculida) in Short-Term Exposures to Pb. Environmental
Science and Pollution Research 14: 430-434.
Gerhardt, A. (2007b) Aquatic Behavioral Ecotoxicology – Prospects and Limitations. Human
and Ecological Risk Assessment 13: 481-491.
Gerhardt, A., Bisthoven, L.J. and Schmidt, S. (2006a) Automated recording of vertical negative
phototactic behaviour in Daphnia magna Straus (Crustacea). Hydrobiologia 559: 433-441.
Gerhardt, A., Ingram, M.K., Kang, I.J. and Ulitzur, S. (2006b) In situ on-line toxicity
biomonitoring in water: recent developments. Environmental Toxicology and Chemistry 25:
2263-2271.
Gerhardt, A., Bisthoven, L.J. and Penders, E. (2003) Quality control of drinking water from the
River Rhine with the Multispecies Freshwater Biomonitor. Aquatic Ecosystem Health and
Management 6: 159-166.
Gerhardt, A. and Bistoven, L.J. (1995) Behavioural, developmental and morphological responses
of Chironomus gr. Thumni larvae (Diptera, Nematocera) to aquatic pollution. Journal of Aquatic
Ecosystem Health 4: 205-214.
Geiger, J.G. and Buikema, A.L. (1981) Oxygen consumption and filtering rate of Daphnia pulex
after exposure to water-soluble fractions of naphthalene, phenathrene, No. 2 Fuel Oil and coal-tar
creosote. Bulletin of Environmental Contamination and Toxicology 27: 783-789.
Goodrich, M.S. and Lech, J.J. (1990) A Behavioral Screening Assay for Daphnia magna: A
Method to Assess the Effects of Xenobiotics on Spacial Orientation. Environmental Toxicology
and Chemistry 9: 21-30.
Graymore, M., Stagnitti, F. and Allinson, G. (2001) Impacts of atrazine in aquatic ecosystems.
Environment International 26: 483-495.
Green, U., Kremer, J.H., Zillmer, M. and Moldaenke, C. (2003) Detection of Chemical Threat
Agents in Drinking Water by an Early Warning Real-Time Biomonitor. Environmental
Toxicology 18: 368-374.
Hamilton, P.B., Lean, D.R.S., Jackson, G.S., Kaushik, N.K. and Solomon, K.R. (1989) The
effect of two applications of atrazine on the water quality of freshwater enclosures.
Environmental Pollution 60: 291-304.
Hatch, A.C. and Burton, G.A. (1999) Photo-induced toxicity of PAHs to Hyalella azteca and
Chironomus tentans: effects of mixtures and behavior. Environmental Pollution 106: 157-167.
Health Canada (1993) Atrazine. Retrieved from: http://www.hc-sc.gc.ca/ewh-semt/pubs/water-
eau/atrazine/index-eng.php.

145
Hoang, T.C., Gallagher, J.S. and Klaine, S.J. (2006) Responses of Daphnia magna to pulsed
exposures of arsenic. Environmental Toxicology 22: 308-317.
Hoar, Z., Blair, A., Holmes, F.F., Boysen, C., Robel, R.J., Hoover, R. and Fraumeni, J.F. (1988)
A case-control study of non-Hodgkin’s lymphoma and agricultural factors in eastern Nebraska.
American Journal of Epidemiology 128: 901-910.
Horry, H., Durand, M.J., Picart, P., Bendriaa, L., Daniel, P. and Thouand, G. (2004)
Development of a biosensor for the detection of Tributyltin. Environmental Toxicology 19: 342-
345.
IARC (1999) Atrazine. Retrieved from
http://monographs.iarc.fr/ENG/Monographs/vol73/mono73-8.pdf
Jiang, H., Adams, C., Graziano, N., Robertson, A., McGuire, M., and Khiari, D. (2006)
Occurrence and Removal of chloro-s-triazines in water treatment plants. Environmental Science
and Technology 40: 3609-3616.
Key, P.B., Fulton, M.H., Harman-Fetcho, J.A. and McConnell, L.L. (2003) Acetylcholinesterase
activity in grass shrimp and aqueous pesticide levels from south Florida drainage canals.
Archives of Environmental Contamination and Toxicology 45: 371-377.
Kieu, N.D., Michels, E. and De Meester, L. (2001) Phototactic Behavior of Daphnia and the
continuous monitoring of water quality: interference of fish kairomones and food quality.
Environmental Toxicology and Chemistry 20: 1098-1103.
Kiss, I., Kovats, N. and Szalay, T. (2003) Evaluation of some alternative guidelines for risk
assessment of various habitats. Toxicology Letters 140: 411-417.
Konstantinou, I.K. and Albanis, T.A. (2004) Worldwide occurrence and effects of antifouling
paint booster biocides in the aquatic environment: a review. Environment International 30: 235-
248.
Knops, M., Altenburger, R. and Segner, H. (2001) Alterations of physiological energetic, growth
and reproduction of Daphnia magna under toxicant stress. Aquatic Toxicology 53: 79-90.
Landrum, P.F., Gedeon, M.L., Burton, G.A., Greenberg, M.S. and Rowland, C.D. (2002)
Biological responses of Lumbriculus variegates exposed to fluoranthene-spiked sediment.
Environmental Contamination and Toxicology 42: 292-302.
Lechelt, M., Blohm, W., Kirschneit, B., Pfeiffer, M., Gresens, E., Liley, J., Holz, R., Luring, C.
and Moldaenke, C. (2000) Monitoring of Surface Water by Ultrasensitive Daphnia toximeter.
Environmental Toxicology 15: 390-400.
Leppanen, M.T. and Kukkoken, J.V.K. (1998) Relationship between reproduction, sediment type
and feeding activity of Lumbriculus variegates (Muller): Implications for sediment toxicity
testing. Environmental Toxicology and Chemistry 17: 2196-2202.

146
Liu, X., Shao, J., Xiang, L. and Chen, X. (2006) Cytotoxic effects and apoptosis induction of
atrazine in a grass carp (Ctenopharyngodon idellus) cell line. Environmental Toxicology 10: 80-
89.
Maguire, R.J. (1987) Environmental aspects of tributyltin. Applied Organometallic Chemistry 1:
475-498.
Martins, J., Soares, M.L., Saker, M.L., Oliva-Teles, L. and Vasconelos, V.M. (2007a)
Phototactic behavior in Daphnia magna Straus as an indicator of toxicants in the aquatic
environment. Ecotoxicology and Environmental Safety 67: 417-422.
Martins, J.C., Saker, M.L., Teles, L.F.O. and Vasconcelos, V.M. (2007b) Oxygen consumption
by Daphnia magna Straus as a marker of chemical stress in the aquatic environment.
Environmental Toxicology and Chemistry 26: 1987-1991.
McCarthy, L.H. (2007) NSERC Strategic Grant Proposal.
Michels, E., Semsari, S., Bin, C. and De Meester, L. (2000) Effect of Sublethal Doses of
Cadmium on the Phototactic Behavior of Daphnia magna. Ecotoxicology and Environmental
Safety 47: 261-265.
Mikol, Y.B., Richardson, W.R., van der Schalie, W.H., Shedd, T.R. and Widder, M.W. (2007)
An online real-time biomonitor for contaminant surveillance in water supplies. Journal of the
American Water Works Association 99: 107-116.
Mills, C.L., Shukla, D.H. and Compton, G.J. (2006) Development of a new low cost high
sensitivity system for behavioural ecotoxicity testing. Aquatic Toxicology 77: 197-201.
MIT (2006) Environmental Chemistry of Boston Harbor. Retrieved from
http://ocw.mit.edu/NR/rdonlyres/Earth--Atmospheric--and-Planetary-Sciences/12-097January--
IAP--2006/35FAFFC3-135B-4266-93B4-2144F7487004/0/dissolved_oxygen.pdf
Moore, M.T., Lizotte, R.T., Knight, S.S., Smith, S. and Cooper, C.M. (2006) Assessment of
pesticide contamination in three Mississippi Delta oxbow lakes using Hyalella azteca.
Chemosphere 67: 2184-2191.
National Center for Biotechnology Information PubChem (2009a) Tributyltin Hydroxide.
Retrieved from
http://pubchem.ncbi.nlm.nih.gov/summary/summary.cgi?cid=6327813&loc=ec_rcs
National Center for Biotechnology Information PubChem (2009b) Atrazine. Retrieved from
http://pubchem.ncbi.nlm.nih.gov/summary/summary.cgi?cid=2256&loc=ec_rcs
National Center for Biotechnology Information PubChem (2009c) Dimethyl Sulfoxide.
Retrieved from http://pubchem.ncbi.nlm.nih.gov/summary/summary.cgi?cid=679&loc=ec_rcs
Oberlin, G.E. and Blinn, D.W. (1997) The affect of temperature on the metabolism and
behaviour of an endemic amphipod, Hyalella montezuma, from Montezuma Well, Arizona,
U.S.A. Freshwater Biology 37: 55-59.

147
OECD (2004) OECD Guideline for testing of chemicals: Daphnia sp., Acute Immobilization
Test.
O’Gara, B.A., Bohannon, V.K., Teagure, M.W. and Smeaton, M.B. (2004) Copper-induced
changes in locomotor behaviours and neuronal physiology of the freshwater oligocaete,
Lumbriculus variegates. Aquatic Toxicology 69: 51-66.
Paul, R.J., Colmorgen, M., Huller, S., Tyroller, F. and Zinkler, D. (1997) Circulation and
respiratory control in millimeter-sized animals (Daphnia magna, Folsomia candida) studied by
optical methods. Journal of Comparative Physiology 167:399-408.
Penttinen, O.P. and Kukkoken, J.V.K. (2000) Metabolic Response of Lumbriculus variegatus to
Respiratory Uncoupler in Cold and Anoxic Water. Environmental Toxicology and Chemistry 19:
2073-2075.
Putzer, V.M., de Zwaan, A. and Wieser, W. (1990) Anaerobic energy metabolism in the
oligochaete Lumbriculus variegates Muller. Journal of Comparative Physiology 159: 707-715.
Ren, Z., Li, Z., Ma, M., Wang, Z. and Fu, R. (2009) Behavioural responses of Daphnia magna to
Stresses of Chemicals with Different Toxic Characteristics. Bulletin of Environmental
Contamination and Toxicology 82: 310-316.
Ren, Z.M., Li, Z.L., Zha, J.M., Rao, K.F., Ma, M., Wang, Z. and Fu, R.S. (2008) The Avoidance
Responses of Daphnia magna to the Exposure of Organophosphorus Pesticides in an On-Line
Biomonitoring System. Environmental Modelling and Assessment 14: 405-410.
Ren, Z., Zha, J., Ma, M., Wang, Z. and Gerhardt, A. (2007) The early warning of aquatic
organophosphorus pesticide contamination by on-line monitoring behavioural changes of
Daphnia magna. Environmental Monitoring and Assessment 134: 373-383.
Revsbech, N.P. (1989) An Oxygen Microsensor with a guard cathode. Limnology and
Oceanography 34: 474-478.
Ryan, S.M. and Dodson, S.I. (1998) Seasonal analysis of Daphnia pulicaria swimming behavior.
Hydrobiologia 384: 11-118.
Saglio, P. and Trijasse, S. (1998) Behavioural responses to atrazine and diuron in goldfish.
Archives of Environmental Contamination and Toxicology 35: 484-491.
Sanchez, B.C., Ochoa-Acuna, H., Porterfield, D.M. and Sepulveda, M.S. (2008) Oxygen flux as
an indicator of physiological stress in fathead minnow embryos: a real-time biomonitoring
system of water quality. Environmental Science and Technology 42: 7010-7017.
Scherer, E. (1992) Behavioural responses as indicators of environmental alterations: approaches,
results and developments. Journal of Applied Ichthyology 8: 122-131.

148
Schmidt, K., Steinberg, C.E.W., Staaks, G.B.O. and Pflugmacher, S. (2005) Influence of
Xenobiotic Mixture (PCB and TBT) Compared to Single Substances on Swimming Behaviour or
Reproduction of Daphnia magna. Acta Hydrochimistria and Hydrobiologia 33: 287-300.
Scott, G.R. and Sloman, K.A. (2004) The effects of environmental pollutants on complex fish
behaviour: integrating behavioural and physiological indicators of toxicity. Aquatic Toxicology
68: 369-392.
Sigmon, C. (1979) Oxygen consumption in Daphnia pulex Exposed to 2,4-D or 2,4,5-T. Bulletin
of Environmental Contamination and Toxicology 21: 822-825.
Song, Y., Zhu, L.S., Wang, J., Wang, J.H., Liu, W. and Xie, H. (2009) DNA damage and effects
on antioxidative enzymes in earthworm (Eisenia foetida) induced by atrazine. Soil Biology and
Chemistry 41: 905-909.
Steinbeck, C.E.W., Lorenz, R. and Spieser, O.H. (1995) Effects of atrazine on swimming
behaviour of zebrafish, Brachydanio rerio. Water Research 29: 981-985.
Suedel, B.C. and Rodgers, J.H. (1996) Toxicity of Fluoranthene to Daphnia magna, Hyalella
azteca, Chironomus tentans, and Stylaria lacustris in water-only and whole sediment exposures.
Bulletin of Environmental Contamination and Toxicology 57: 132-138.
Szulkin, M., Dawidowicz, P. and Dodson, S.I. (2006) Behavioural uniformity as a response to
cues of predation risk. Animal Behaviour 71: 1013-1019.
Underwood, A.J. and Peterson, C.H. (1988) Towards an ecological framework for investigating
pollution. Marine Ecology Progress Series 46: 227-234.
Unisense (2009) Oxygen sensor. Retrieved from
http://www.unisense.com/Default.aspx?ID=443.
University of Iowa (2009) Image of Lumbriculus variegatus. Retrieved from
http://www.eeob.iastate.edu/faculty/DrewesC/htdocs/Lv-KSNr.jpg
Untersteiner, H., Kahapka, J. and Kaiser, H. (2003) Behavioural response of the cladoceran
Daphnia magna STRAUS to sublethal Copper stress – validation by image analysis. Aquatic
Toxicology 65: 435-442.
USEPA (2000) Methods for measuring the toxicity and bioaccumulation of sediment-associated
contaminants in freshwater invertebrates.
USEPA (2002) Methods for measuring acute toxicity of effluents and receiving waters to
freshwater and marine organisms.
USEPA (2003) Interim Reregistration Eligibility Decision for Atrazine. Retrieved from
http://www.epa.gov/oppsrrd1/reregistration/REDs/atrazine_ired.pdf
Van der Schalie, W.H., Shedd, T.R., Knechtges, P.L. and Widder, M.W. (2001) Using higher
organisms in biological early warning systems for real-time toxicity detection. Biosensors and
Bioelectronics 16: 457-465.

149
Van Hoof, F., Sluyts, H., Paulussen, J., Berckmans, D. and Bloemen, H. (1994) Evaluation of a
biomonitor based on the phototactic behaviour of Daphnia magna using infrared detection and
digital image processing. Water Science and Technology 10; 79-86.
Villegas-Navarro, A., Esperanze, R.L. and Reyes, J.L. (2003) The heart of Daphnia magna:
effects of four cardiovascular drugs. Comparative Biochemistry and Physiology. 136: 127-134.
Wan, M.T., Buday, C., Schroeder, G., Kuo, J. and Pasternak, J. (2006) Toxicity to Daphnia
magna, Oncorhynchus mykiss, Onchorynchus tshawytscha and Rana catesbeiana of Atrazine,
Metolachlor, Simazine, and their formulated products. Bulletin of Environmental Contamination
and Toxicology 76: 52-58.
Wang, F., Goulet, R.R. and Chapman, P.M. (2004) Testing sediment biological effects with the
freshwater amphipod Hyalella azteca: the gap between laboratory and nature. Chemosphere 57:
1713-1724.
Waring, C.P. and Moore, A. (2004) The effect of atrazine on Atlantic salmon (Salmo salar)
smolts in fresh water and after sea water transfer. Aquatic Toxicology 66: 93-104.
Watson, S.B., Juttner, F. and Koster, O. (2007) Daphnia behavioural responses to taste and
odour compounds: ecological significance and application as an inline treatment plant
monitoring tool. Water Science and Technology 55: 23-31.
Wicklum, D., Smith, D.E.C. and Davies, R.W. (1997) Motality, Preference, Avoidance and
Activity of a Predatory Leech Exposed to Cadmium. Archives of Environmental Contamination
and Toxicology 32: 178-183.
Winkelmann, D.A. and Klaine, S.J. (1991) Degradation and bound residue formation of four
atrazine metabolites, deethylatrazine, deisopropylatrazine, dealkylatrazine and hydroxyatrazine,
in a western Tennessee soil. Environmental Toxicology and Chemistry 10: 347-354.
Wollenberger, L., Halling-Sorensen, B. and Kusk, K.O. (2000) Acute and chronic toxicity of
veterinary antibiotics to Daphnia magna. Chemosphere 40: 723-730.
Zala, S.M. and Penn, D.J. (2004) Abnormal behaviours induced by chemical pollution: a review
of the evidence and new challenges. Animal Behaviour 68: 649-664.

150
APPENDICES
Appendix A Dilution Calculations
Preparation of 100 mg/L (TBT in DMSO) Substock
A 100 mL volume of 100 mg/L TBT in DMSO stock solution was made for utilization in
bioassays.
Preparation of 50 mg/L (TBT in DMSO) Substock
A 100 mL substock of 50 mg/L TBT in DMSO was also made for use in bioassays.
C1V1 = C2V2
100 mg/L (V1) = 50 mg/L (0.1 L)
V1 = 0.05 L = 50 mL
The substock was made by adding 50 mL of the 100 mg/L substock to 50 mL of DMSO.
Preparation of 10 mg/L (TBT in DMSO) Substock
A 100 mL substock of 10 mg/L TBT in DMSO was also made for use in bioassays.
C1V1 = C2V2
100 mg/L (V1) = 10 mg/L (0.1 L)
V1 = 0.01 L = 10 mL

151
The substock was made by adding 10 mL of the 100 mg/L substock to 90 mL of DMSO.
Preparation of 100 mg/L (Atrazine in DMSO) Substock
A 100 mL volume of 100 mg/L TBT in DMSO stock solution was made for utilization in
bioassays.
Preparation of 50 mg/L (Atrazine in DMSO) Substock
A 100 mL substock of 50 mg/L Atrazine in DMSO was also made for use in bioassays.
C1V1 = C2V2
100 mg/L (V1) = 50 mg/L (0.1 L)
V1 = 0.05 L = 50 mL
The substock was then made by adding 50 mL of the 100 mg/L substock to 50 mL of DMSO.
Preparation of 10 mg/L (Atrazine in DMSO) Substock
A 100 mL substock of 5 mg/L atrazine in DMSO was also made for use in bioassays.
C1V1 = C2V2
100 mg/L (V1) = 5 mg/L (0.1 L)
V1 = 0.005 L = 5 mL
The substock was made then by adding 5 mL of the 100 mg/L substock to 95 mL of DMSO.

152
Dilution calculations for Daphnia magna, Hyalella azteca and Lumbriculus variegatus motility
bioassays and Lumbriculus variegatus grouping behaviour bioassays in TBT.
Test Concentration Total Volume TBT Substock Used Volume Substock Added
0.1% DMSO 150 mL DMSO 150 uL
10 µg/L 150 mL 10 mg/L 150 uL
50 µg/L 150 mL 50 mg/L 150 uL
100 µg/L 150 mL 100 mg/L 150 uL
Dilution calculations for Daphnia magna, Hyalella azteca and Lumbriculus variegatus motility
bioassays and Lumbriculus variegatus burrowing and grouping behaviour bioassays in atrazine.
Test Concentration Total Volume Atrazine Substock Used
Volume Substock Added
0.1% DMSO 150 mL DMSO 150 uL
5 µg/L 150 mL 5 mg/L 150 uL
50 µg/L 150 mL 50 mg/L 150 uL
100 µg/L 150 mL 100 mg/L 150 uL
Dilution calculations for Daphnia magna, Hyalella azteca and Lumbriculus variegatus
respiration bioassays in TBT.
Test Concentration Total Volume Atrazine Substock Used
Volume Substock Added
0.1% DMSO 25 mL DMSO 25 uL
10 µg/L 25 mL 10 mg/L 25 uL
50 µg/L 25 mL 50 mg/L 25 uL
100 µg/L 25 mL 100 mg/L 25 uL
Dilution calculations for Daphnia magna, Hyalella azteca and Lumbriculus variegatus
respiration bioassays in TBT.
Test Concentration Total Volume Atrazine Substock Used
Volume Substock Added

153
0.1% DMSO 25 mL DMSO 25 uL
5 µg/L 25 mL 5 mg/L 25 uL
50 µg/L 25 mL 50 mg/L 25 uL
100 µg/L 25 mL 100 mg/L 25 uL

154
Appendix B Winkler Titration Procedure
The Winkler titration procedure used in the TBT respiration bioassays was based on (MIT,
2006). At each time period in the bioassays, the following steps of the titration were performed:
1. 50 µL of MnCl solution was added to each scintillation vial, followed immediately by the
addition of 50 µL of NaI solution.
2. Each vial was then closed, shaken vigorously for 30 seconds and left to sit for 10 minutes
in order to allow for the formation and settling of floc.
3. Each vial was then shaken vigorously again for 30 seconds and allowed to sit for an
additional 30 minutes.
4. Sulfuric acid (50 µL) was then added to each vial, which was then shaken again. Samples
were then stored in the dark until titration took place (maximum of 24 hours later).
5. Samples were titrated in a 300-mL beaker using an Eppendorf multi-pipetter. Samples
were poured into the beaker, where a stirring rod was in place to ensure mixing of the
titrant and the sample.
6. One millilitre of starch indicator solution was added to each sample in the beaker, turning
the colour of the solution to a dark blue.
7. The sample was titrated with sodium thiosulfate solution using the multi-pipetter. Titrant
was added in 10 µL increments until the straw-colour of the sample returned. The amount
of titrant used was then recorded and used to determine the concentration of oxygen in
the sample.

155
Appendix C Unisense Oxygen Microelectrode Function
A Clark-type oxygen microelectrode (Unisense, Denmark) was used in the atrazine
bioassays for all three test organisms. The probe functions as follows. Oxygen from the sample
diffuses across a silicone membrane to an oxygen reducing cathode, which is polarized against
an Ag/AgCl anode (Figure 1) (Unisense, 2009). An internal guard cathode is also present to
remove all oxygen which diffuses toward the tip from the internal electrolyte reservoir, allowing
for greater stability and sensitivity of the probe (Revsbech, 1989). The flow of electrons from
anode to cathode reflects the partial pressure of oxygen at the tip of the probe and is measured in
picoamperes by a highly sensitive picoammeter attached to the probe (Unisense, 2009). Exact
concentrations of oxygen in a given sample can then be determined by creating a calibration
curve based on samples saturated with oxygen and saturated with nitrogen (no oxygen present).
Figure 1: Schematic diagram of Unisense Clark-type
oxygen microelectrode (Unisense, 2009)

156
Appendix D Daphnia magna Swimming Bioassay TBT Data
Swimming Height
Percentage of Daphnia magna Showing Changes in Swimming Height in the Water Column
Time (Hours)
Reference 0.1% DMSO 10 µg/L TBT 50 µg/L TBT 100 µg/L TBT
Replicate 1 0 0 0 0 0 0
Replicate 2 0 0 0 0 0 0
Replicate 3 0 0 0 0 0 0
Replicate 1 1 0 0 60 80 80
Replicate 2 1 0 0 60 80 80
Replicate 3 1 0 0 100 100 100
Replicate 1 2 0 40 40 80 100
Replicate 2 2 0 0 60 100 80
Replicate 3 2 0 0 80 100 100
Replicate 1 3 0 0 100 100 100
Replicate 2 3 0 0 80 80 80
Replicate 3 3 0 0 80 80 100
Replicate 1 4 0 0 100 100 100
Replicate 2 4 0 0 80 80 80
Replicate 3 4 0 0 80 100 100
Replicate 1 5 0 0 60 100 100
Replicate 2 5 0 0 60 100 80
Replicate 3 5 0 0 100 100 100
Replicate 1 6 0 0 80 100 100
Replicate 2 6 0 0 80 100 100
Replicate 3 6 0 0 100 100 100
Replicate 1 12 0 0 100 100 80
Replicate 2 12 0 0 40 100 100
Replicate 3 12 0 0 100 100 100
Replicate 1 24 0 0 100 100 100
Replicate 2 24 0 0 80 100 80
Replicate 3 24 0 0 100 80 100

157
Spinning
Percentage of Daphnia magna displaying spinning behaviour
Time Reference 0.1% DMSO 10 µg/L TBT 50 µg/L TBT 100 µg/L TBT
Replicate 1 0 0 0 0 0 0
Replicate 2 0 0 0 0 0 0
Replicate 3 0 0 0 0 0 0
Replicate 1 1 0 0 40 20 20
Replicate 2 1 0 0 60 20 20
Replicate 3 1 0 0 60 40 0
Replicate 1 2 0 0 40 40 40
Replicate 2 2 0 0 0 0 80
Replicate 3 2 0 0 60 20 0
Replicate 1 3 0 0 40 20 40
Replicate 2 3 0 0 80 60 60
Replicate 3 3 0 0 20 40 0
Replicate 1 4 0 0 40 20 40
Replicate 2 4 0 0 40 40 40
Replicate 3 4 0 0 20 40 0
Replicate 1 5 0 0 0 20 20
Replicate 2 5 0 0 60 40 0
Replicate 3 5 0 0 20 40 20
Replicate 1 6 0 20 60 0 100
Replicate 2 6 0 20 40 40 40
Replicate 3 6 0 0 20 0 0
Replicate 1 12 0 0 20 0 20
Replicate 2 12 0 0 40 40 20
Replicate 3 12 0 0 0 0 20
Replicate 1 24 40 40 40 0 0
Replicate 2 24 20 20 40 0 0
Replicate 3 24 0 0 80 20 0
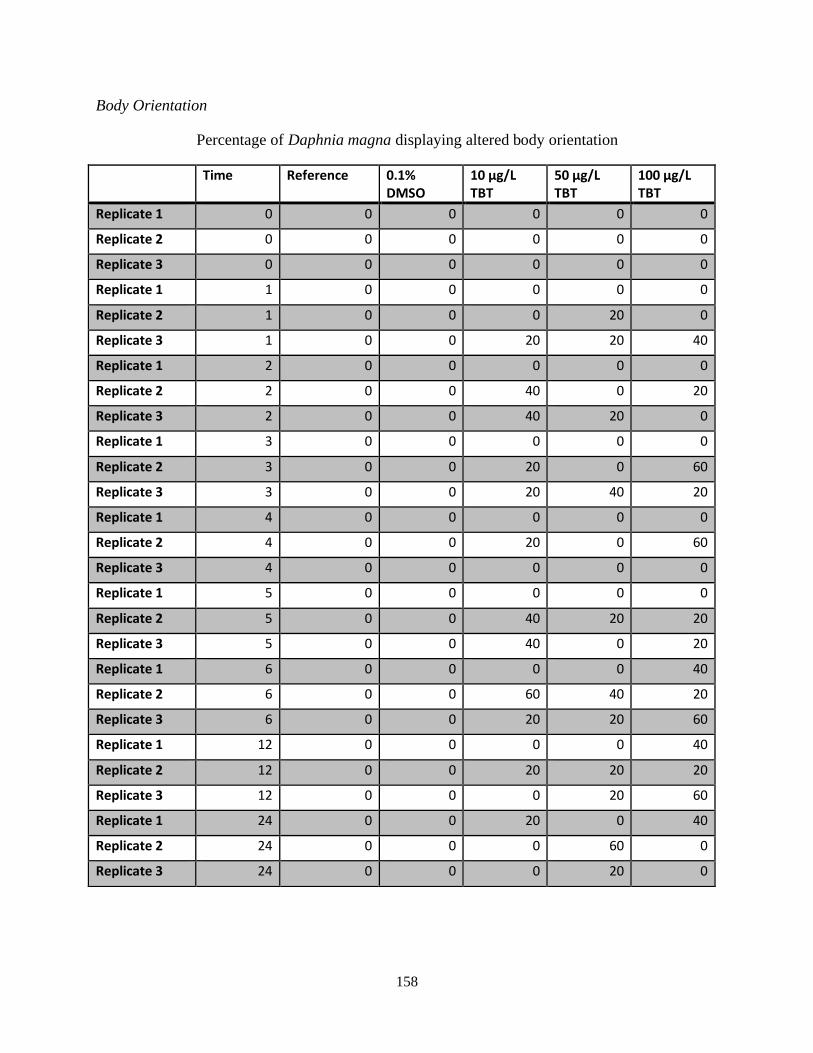
158
Body Orientation
Percentage of Daphnia magna displaying altered body orientation
Time Reference 0.1% DMSO
10 µg/L TBT
50 µg/L TBT
100 µg/L TBT
Replicate 1 0 0 0 0 0 0
Replicate 2 0 0 0 0 0 0
Replicate 3 0 0 0 0 0 0
Replicate 1 1 0 0 0 0 0
Replicate 2 1 0 0 0 20 0
Replicate 3 1 0 0 20 20 40
Replicate 1 2 0 0 0 0 0
Replicate 2 2 0 0 40 0 20
Replicate 3 2 0 0 40 20 0
Replicate 1 3 0 0 0 0 0
Replicate 2 3 0 0 20 0 60
Replicate 3 3 0 0 20 40 20
Replicate 1 4 0 0 0 0 0
Replicate 2 4 0 0 20 0 60
Replicate 3 4 0 0 0 0 0
Replicate 1 5 0 0 0 0 0
Replicate 2 5 0 0 40 20 20
Replicate 3 5 0 0 40 0 20
Replicate 1 6 0 0 0 0 40
Replicate 2 6 0 0 60 40 20
Replicate 3 6 0 0 20 20 60
Replicate 1 12 0 0 0 0 40
Replicate 2 12 0 0 20 20 20
Replicate 3 12 0 0 0 20 60
Replicate 1 24 0 0 20 0 40
Replicate 2 24 0 0 0 60 0
Replicate 3 24 0 0 0 20 0

159
Immobilization
Percentage of Daphnia magna immobilized
Time Reference 0.1% DMSO 10 µg/L TBT 50 µg/L TBT 100 µg/L TBT
Replicate 1 0 0 0 0 0 0
Replicate 2 0 0 0 0 0 0
Replicate 3 0 0 0 0 0 0
Replicate 1 1 0 0 0 0 0
Replicate 2 1 0 0 0 40 20
Replicate 3 1 0 0 20 60 40
Replicate 1 2 0 0 20 20 40
Replicate 2 2 0 0 40 0 40
Replicate 3 2 0 0 0 40 40
Replicate 1 3 0 0 20 40 40
Replicate 2 3 0 0 40 0 40
Replicate 3 3 0 0 40 40 60
Replicate 1 4 0 0 20 40 0
Replicate 2 4 0 0 0 20 0
Replicate 3 4 0 0 40 40 40
Replicate 1 5 0 0 0 40 60
Replicate 2 5 0 0 40 0 60
Replicate 3 5 0 0 40 60 60
Replicate 1 6 0 0 40 40 60
Replicate 2 6 0 0 60 60 60
Replicate 3 6 0 0 40 60 60
Replicate 1 12 0 0 60 40 60
Replicate 2 12 0 0 20 100 80
Replicate 3 12 0 0 40 80 60
Replicate 1 24 0 0 60 40 100
Replicate 2 24 0 0 20 40 80
Replicate 3 24 0 0 40 60 100

160
Secondary Antennae Use
Percentage of Daphnia magna displaying abnormal secondary antennae use
Time Reference 0.1% DMSO 10 µg/L TBT
50 µg/L TBT
100 µg/L TBT
Replicate 1 0 0 0 0 0 0
Replicate 2 0 0 0 0 0 0
Replicate 3 0 0 0 0 0 0
Replicate 1 1 0 0 0 0 0
Replicate 2 1 0 0 0 20 20
Replicate 3 1 0 0 40 60 40
Replicate 1 2 0 0 0 0 40
Replicate 2 2 0 0 40 20 60
Replicate 3 2 0 0 40 40 40
Replicate 1 3 0 0 20 40 40
Replicate 2 3 0 0 20 40 40
Replicate 3 3 0 0 40 80 60
Replicate 1 4 0 0 20 80 0
Replicate 2 4 0 0 40 40 40
Replicate 3 4 0 0 40 80 60
Replicate 1 5 0 0 0 60 80
Replicate 2 5 0 0 40 60 60
Replicate 3 5 0 0 40 80 60
Replicate 1 6 0 0 40 80 80
Replicate 2 6 0 0 60 60 80
Replicate 3 6 0 0 40 80 60
Replicate 1 12 0 0 60 60 60
Replicate 2 12 0 0 20 80 80
Replicate 3 12 0 0 60 80 80
Replicate 1 24 0 0 60 40 60
Replicate 2 24 0 0 20 40 80
Replicate 3 24 0 0 60 60 40

161
Swimming Style
Percentage of Daphnia magna Showing Altered Swimming Style
Time (Hours) Reference 0.1% DMSO 10 µg/L TBT 50 µg/L TBT 100 µg/L TBT
Replicate 1 0 0 0 0 0 0
Replicate 2 0 0 0 0 0 0
Replicate 3 0 0 0 0 0 0
Replicate 1 1 0 0 0 60 0
Replicate 2 1 0 0 20 80 60
Replicate 3 1 0 0 20 60 60
Replicate 1 2 0 0 0 80 80
Replicate 2 2 0 0 60 60 80
Replicate 3 2 0 0 60 60 60
Replicate 1 3 0 0 20 80 80
Replicate 2 3 0 0 40 60 80
Replicate 3 3 0 0 60 100 60
Replicate 1 4 0 0 20 100 60
Replicate 2 4 0 0 40 60 80
Replicate 3 4 0 0 60 100 60
Replicate 1 5 0 0 0 60 80
Replicate 2 5 0 0 60 60 80
Replicate 3 5 0 0 80 100 80
Replicate 1 6 0 0 40 60 60
Replicate 2 6 0 0 80 100 100
Replicate 3 6 0 0 60 80 80
Replicate 1 12 0 0 60 60 80
Replicate 2 12 0 0 80 80 80
Replicate 3 12 0 0 80 100 80
Replicate 1 24 0 0 60 40 80
Replicate 2 24 0 0 60 80 100
Replicate 3 24 0 0 60 80 100

162
Appendix E Daphnia magna Swimming Bioassay Atrazine Data
Swimming Height
Percentage of Daphnia magna displaying changes in swimming height
Time Reference 0.1% DMSO 5 µg/L Atrazine
50 µg/L Atrazine
100 µg/L Atrazine
Replicate 1 1 20 20 0 100 60
Replicate 2 1 0 0 0 100 80
Replicate 3 1 0 0 0 0 80
Replicate 1 2 0 0 80 60 100
Replicate 2 2 0 0 80 80 80
Replicate 3 2 0 0 0 40 100
Replicate 1 3 0 0 60 100 60
Replicate 2 3 0 0 60 80 80
Replicate 3 3 0 0 40 80 100
Replicate 1 4 0 0 100 100 100
Replicate 2 4 0 0 80 80 100
Replicate 3 4 0 0 60 80 80
Replicate 1 5 0 0 80 100 80
Replicate 2 5 0 0 80 100 100
Replicate 3 5 0 0 60 100 100
Replicate 1 6 0 0 100 80 100
Replicate 2 6 0 0 100 100 100
Replicate 3 6 0 0 60 80 100
Replicate 1 10 0 0 100 100 100
Replicate 2 10 0 0 100 100 100
Replicate 3 10 0 0 60 60 100
Replicate 1 24 0 0 100 100 100
Replicate 2 24 0 0 100 100 100
Replicate 3 24 0 0 100 100 100

163
Spinning
Percentage of Daphnia magna displaying spinning behaviour
Time Reference 0.1% DMSO 5 µg/L Atrazine
50 µg/L Atrazine
100 µg/L Atrazine
Replicate 1 1 0 0 0 20 20
Replicate 2 1 0 0 40 0 0
Replicate 3 1 0 0 40 100 40
Replicate 1 2 0 0 0 40 60
Replicate 2 2 0 0 20 20 0
Replicate 3 2 0 0 40 60 40
Replicate 1 3 0 0 0 40 60
Replicate 2 3 0 0 40 20 0
Replicate 3 3 0 0 60 40 20
Replicate 1 4 0 0 40 40 60
Replicate 2 4 0 0 40 40 0
Replicate 3 4 0 0 60 60 40
Replicate 1 5 0 0 40 20 0
Replicate 2 5 0 0 20 20 60
Replicate 3 5 0 0 0 0 60
Replicate 1 6 0 0 40 60 0
Replicate 2 6 0 0 40 20 0
Replicate 3 6 0 0 0 20 40
Replicate 1 10 0 0 0 20 20
Replicate 2 10 0 0 80 0 40
Replicate 3 10 0 0 40 20 20
Replicate 1 24 0 0 40 0 0
Replicate 2 24 0 0 60 20 0
Replicate 3 24 0 0 0 40 0

164
Body Orientation
Percentage of Daphnia magna displaying abnormal body orientation
Time Reference 0.1% DMSO
5 µg/L Atrazine
50 µg/L Atrazine
100 µg/L Atrazine
Replicate 1 1 0 0 0 40 0
Replicate 2 1 0 0 0 20 40
Replicate 3 1 0 0 0 0 0
Replicate 1 2 0 0 0 20 40
Replicate 2 2 0 0 0 20 40
Replicate 3 2 0 0 0 20 0
Replicate 1 3 0 0 20 60 40
Replicate 2 3 0 0 20 60 60
Replicate 3 3 0 0 0 40 20
Replicate 1 4 0 0 20 40 40
Replicate 2 4 0 0 0 20 60
Replicate 3 4 0 0 0 20 0
Replicate 1 5 0 0 0 60 40
Replicate 2 5 0 0 0 40 40
Replicate 3 5 0 0 40 40 40
Replicate 1 6 0 0 0 40 80
Replicate 2 6 0 0 40 60 80
Replicate 3 6 0 0 60 60 60
Replicate 1 10 0 0 0 0 80
Replicate 2 10 0 0 40 0 100
Replicate 3 10 0 0 0 20 40
Replicate 1 24 0 0 0 0 40
Replicate 2 24 0 0 0 40 40
Replicate 3 24 0 0 20 40 60

165
Immobilization
Percentage of Daphnia magna immobilized
Time Reference 0.1% DMSO 5 µg/L Atrazine
50 µg/L Atrazine
100 µg/L Atrazine
Replicate 1 1 0 0 0 0 0
Replicate 2 1 0 0 0 0 40
Replicate 3 1 0 0 0 0 60
Replicate 1 2 0 0 0 40 0
Replicate 2 2 0 0 20 60 40
Replicate 3 2 0 0 0 40 60
Replicate 1 3 0 0 0 60 40
Replicate 2 3 0 0 20 80 60
Replicate 3 3 0 0 40 40 80
Replicate 1 4 0 0 0 80 40
Replicate 2 4 0 0 0 20 40
Replicate 3 4 0 0 40 40 40
Replicate 1 5 0 0 0 60 0
Replicate 2 5 0 0 40 80 40
Replicate 3 5 0 0 60 80 40
Replicate 1 6 0 0 0 80 100
Replicate 2 6 0 0 0 60 80
Replicate 3 6 0 0 60 80 60
Replicate 1 10 0 0 80 60 80
Replicate 2 10 0 0 0 100 60
Replicate 3 10 0 0 40 40 60
Replicate 1 24 0 0 0 80 60
Replicate 2 24 0 0 0 60 100
Replicate 3 24 0 0 60 60 100
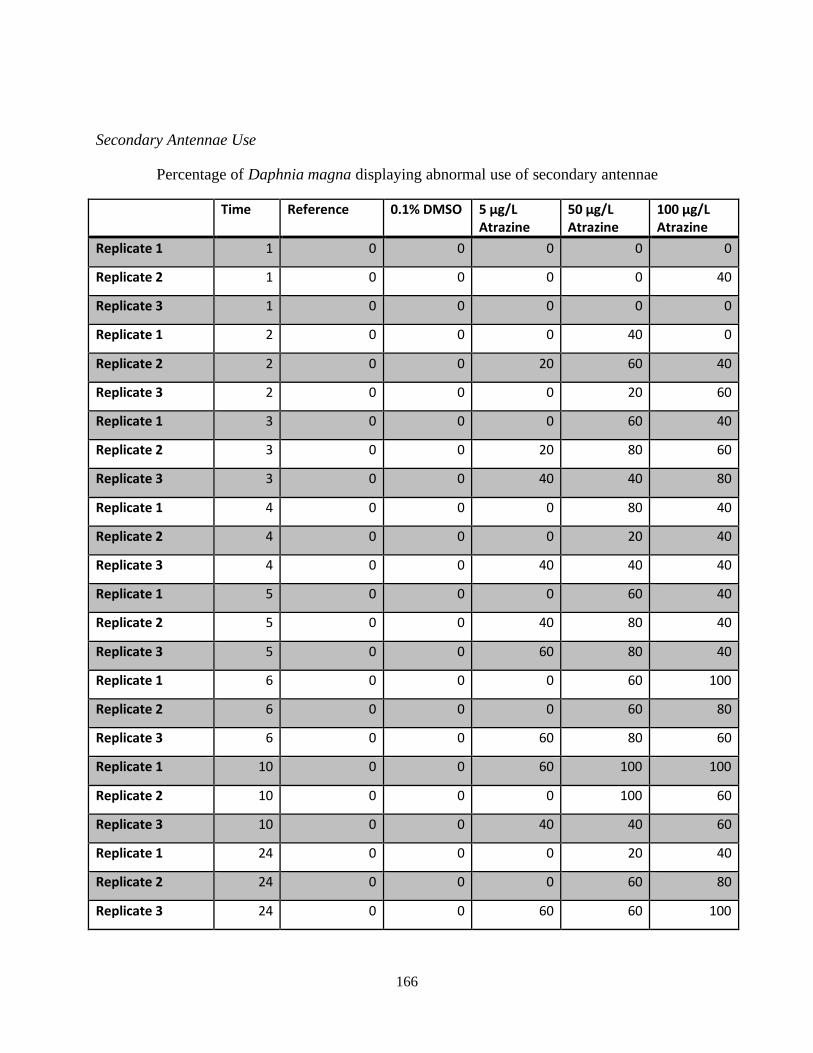
166
Secondary Antennae Use
Percentage of Daphnia magna displaying abnormal use of secondary antennae
Time Reference 0.1% DMSO 5 µg/L Atrazine
50 µg/L Atrazine
100 µg/L Atrazine
Replicate 1 1 0 0 0 0 0
Replicate 2 1 0 0 0 0 40
Replicate 3 1 0 0 0 0 0
Replicate 1 2 0 0 0 40 0
Replicate 2 2 0 0 20 60 40
Replicate 3 2 0 0 0 20 60
Replicate 1 3 0 0 0 60 40
Replicate 2 3 0 0 20 80 60
Replicate 3 3 0 0 40 40 80
Replicate 1 4 0 0 0 80 40
Replicate 2 4 0 0 0 20 40
Replicate 3 4 0 0 40 40 40
Replicate 1 5 0 0 0 60 40
Replicate 2 5 0 0 40 80 40
Replicate 3 5 0 0 60 80 40
Replicate 1 6 0 0 0 60 100
Replicate 2 6 0 0 0 60 80
Replicate 3 6 0 0 60 80 60
Replicate 1 10 0 0 60 100 100
Replicate 2 10 0 0 0 100 60
Replicate 3 10 0 0 40 40 60
Replicate 1 24 0 0 0 20 40
Replicate 2 24 0 0 0 60 80
Replicate 3 24 0 0 60 60 100

167
Swimming Style
Percentage of Daphnia magna displaying abnormal swimming style
Time Reference 0.1% DMSO 5 µg/L Atrazine
50 µg/L Atrazine
100 µg/L Atrazine
Replicate 1 1 0 0 20 60 80
Replicate 2 1 0 0 0 20 60
Replicate 3 1 0 0 0 0 60
Replicate 1 2 0 0 0 60 80
Replicate 2 2 0 0 80 80 80
Replicate 3 2 0 0 0 60 80
Replicate 1 3 0 0 20 100 100
Replicate 2 3 0 0 20 100 100
Replicate 3 3 0 0 40 80 100
Replicate 1 4 0 0 100 100 100
Replicate 2 4 0 0 100 100 100
Replicate 3 4 0 0 40 100 100
Replicate 1 5 0 0 60 100 100
Replicate 2 5 0 0 40 100 100
Replicate 3 5 0 0 60 80 100
Replicate 1 6 0 0 60 100 100
Replicate 2 6 0 0 60 100 100
Replicate 3 6 0 0 60 100 100
Replicate 1 10 0 0 100 100 100
Replicate 2 10 0 0 100 100 100
Replicate 3 10 0 0 60 100 100
Replicate 1 24 0 0 40 100 100
Replicate 2 24 0 0 60 100 100
Replicate 3 24 0 0 100 100 100

168
Appendix F Daphnia magna 72 Hour Mortality Bioassay TBT Data
Percentage of dead Daphnia magna after 72 hour exposure
Reference 0.1% DMSO 10 µg/L TBT 50 µg/L 100 µg/L
Replicate 1 40 60 100 100 100
Replicate 2 40 40 100 100 100
Replicate 3 40 40 100 100 100

169
Appendix G Hyalella azteca Motility Bioassay TBT Data
Swimming Events
Percentage of Hyalella azteca performing swimming events
Time Reference 0.1% DMSO 10 µg/L TBT 50 µg/L TBT 100 µg/L TBT
Replicate 1 0 100 100 100 100 100
Replicate 2 0 100 100 100 100 100
Replicate 3 0 100 100 100 100 100
Replicate 1 1 100 100 40 0 0
Replicate 2 1 100 100 80 0 40
Replicate 3 1 100 100 60 0 0
Replicate 1 2 100 100 0 20 0
Replicate 2 2 100 100 0 20 0
Replicate 3 2 100 100 0 20 0
Replicate 1 3 100 100 0 40 0
Replicate 2 3 100 100 0 0 0
Replicate 3 3 100 100 0 0 0
Replicate 1 4 100 100 40 20 0
Replicate 2 4 100 100 0 0 0
Replicate 3 4 100 100 0 0 0
Replicate 1 5 100 100 20 0 0
Replicate 2 5 100 100 0 0 0
Replicate 3 5 100 100 0 0 0
Replicate 1 6 100 100 20 0 0
Replicate 2 6 100 100 0 0 0
Replicate 3 6 100 100 0 0 0
Replicate 1 12 100 100 0 0 0
Replicate 2 12 100 100 0 0 0
Replicate 3 12 100 100 0 0 0
Replicate 1 24 100 100 0 0 0
Replicate 2 24 100 100 0 0 0
Replicate 3 24 100 100 0 0 0

170

171
Substrate Crawling
Percentage of Hyalella azteca performing crawling behaviour on substrate
Time Reference 0.1% DMSO 10 µg/L TBT 50 µg/L TBT 100 µg/L TBT
Replicate 1 0 100 100 100 100 100
Replicate 2 0 100 100 100 100 100
Replicate 3 0 100 100 100 100 100
Replicate 1 1 100 100 80 0 40
Replicate 2 1 100 100 100 60 40
Replicate 3 1 100 100 80 0 60
Replicate 1 2 100 100 20 40 20
Replicate 2 2 100 100 40 20 20
Replicate 3 2 100 100 0 80 0
Replicate 1 3 100 100 0 40 0
Replicate 2 3 100 100 60 0 0
Replicate 3 3 100 100 60 60 0
Replicate 1 4 100 100 40 100 0
Replicate 2 4 100 100 40 0 0
Replicate 3 4 100 100 40 40 0
Replicate 1 5 100 100 20 20 0
Replicate 2 5 100 100 0 0 0
Replicate 3 5 100 100 40 0 0
Replicate 1 6 100 100 40 20 0
Replicate 2 6 100 100 0 20 0
Replicate 3 6 100 100 40 20 0
Replicate 1 12 100 100 20 0 0
Replicate 2 12 100 100 0 20 0
Replicate 3 12 100 100 0 0 0
Replicate 1 24 100 100 0 0 0
Replicate 2 24 100 100 40 20 0
Replicate 3 24 100 100 0 0 0

172
Immobilization
Percentage of immobilized Hyalella azteca
Time Reference 0.1% DMSO 10 µg/L TBT
50 µg/L TBT
100 µg/L TBT
Replicate 1 0 0 0 0 0 0
Replicate 2 0 0 0 0 0 0
Replicate 3 0 0 0 0 0 0
Replicate 1 1 0 0 0 100 60
Replicate 2 1 0 0 0 40 40
Replicate 3 1 0 0 0 0 40
Replicate 1 2 0 0 80 40 60
Replicate 2 2 0 0 60 60 100
Replicate 3 2 0 0 0 20 40
Replicate 1 3 0 0 100 0 100
Replicate 2 3 0 0 40 100 100
Replicate 3 3 0 0 40 40 100
Replicate 1 4 0 0 60 0 100
Replicate 2 4 0 0 60 100 100
Replicate 3 4 0 0 60 60 100
Replicate 1 5 0 0 80 80 100
Replicate 2 5 0 0 100 100 100
Replicate 3 5 0 0 60 100 100
Replicate 1 6 0 0 60 80 100
Replicate 2 6 0 0 100 80 100
Replicate 3 6 0 0 60 80 100
Replicate 1 12 0 0 80 100 100
Replicate 2 12 0 0 100 80 100
Replicate 3 12 0 0 100 100 100
Replicate 1 24 0 0 100 100 100
Replicate 2 24 0 0 60 80 100
Replicate 3 24 0 0 100 100 100

173
Burrowing
Percentage of Hyalella azteca burrowed
Time Reference 0.1% DMSO 10 µg/L TBT 50 µg/L TBT 100 µg/L TBT
Replicate 1 0 0 0 0 0 0
Replicate 2 0 0 0 0 0 0
Replicate 3 0 0 0 0 0 0
Replicate 1 1 0 0 0 0 20
Replicate 2 1 0 0 20 40 20
Replicate 3 1 0 0 20 20 20
Replicate 1 2 0 0 0 0 40
Replicate 2 2 0 0 0 20 60
Replicate 3 2 0 0 0 20 20
Replicate 1 3 0 0 0 0 0
Replicate 2 3 0 0 0 0 20
Replicate 3 3 0 0 0 0 20
Replicate 1 4 0 0 20 0 40
Replicate 2 4 0 0 0 0 40
Replicate 3 4 0 0 0 0 40
Replicate 1 5 0 0 0 0 40
Replicate 2 5 0 0 60 0 0
Replicate 3 5 0 0 40 0 40
Replicate 1 6 0 0 0 0 40
Replicate 2 6 0 0 40 0 100
Replicate 3 6 0 0 40 0 60
Replicate 1 12 0 0 0 20 20
Replicate 2 12 0 0 40 0 80
Replicate 3 12 0 0 40 40 60
Replicate 1 24 0 0 0 0 0
Replicate 2 24 0 0 20 80 80

174
Replicate 3 24 0 0 40 40 80
Grouping
Percentage of Hyalella azteca grouping
Time Reference 0.1% DMSO 10 µg/L TBT 50 µg/L TBT 100 µg/L TBT
Replicate 1 0 0 0 0 0 0
Replicate 2 0 0 0 0 0 0
Replicate 3 0 0 0 0 0 0
Replicate 1 1 0 0 0 60 0
Replicate 2 1 0 0 0 0 0
Replicate 3 1 0 0 0 0 0
Replicate 1 2 0 0 0 0 0
Replicate 2 2 0 0 0 0 0
Replicate 3 2 0 0 0 0 0
Replicate 1 3 0 0 0 0 0
Replicate 2 3 0 0 60 0 60
Replicate 3 3 0 0 0 0 0
Replicate 1 4 0 0 0 0 80
Replicate 2 4 0 0 60 0 60
Replicate 3 4 0 0 0 0 60
Replicate 1 5 0 0 0 0 0
Replicate 2 5 0 0 60 0 100
Replicate 3 5 0 0 0 0 60
Replicate 1 6 0 0 0 0 40
Replicate 2 6 0 0 40 60 80
Replicate 3 6 0 0 0 40 60
Replicate 1 12 0 0 0 0 80
Replicate 2 12 0 0 60 80 60
Replicate 3 12 0 0 0 60 60
Replicate 1 24 0 0 0 0 60
Replicate 2 24 0 0 0 100 60
Replicate 3 24 0 0 60 60 60

175

176
Body Length
Percentage of Hyalella azteca displaying shortened body length
Time Reference 0.1% DMSO 10 µg/L TBT 50 µg/L TBT 100 µg/L TBT
Replicate 1 0 0 0 0 0 0
Replicate 2 0 0 0 0 0 0
Replicate 3 0 0 0 0 0 0
Replicate 1 1 0 0 40 80 0
Replicate 2 1 0 0 0 0 0
Replicate 3 1 0 0 20 40 80
Replicate 1 2 0 0 40 40 60
Replicate 2 2 0 0 0 40 100
Replicate 3 2 0 0 20 40 60
Replicate 1 3 0 0 40 40 100
Replicate 2 3 0 0 20 100 100
Replicate 3 3 0 0 20 60 60
Replicate 1 4 0 0 60 80 100
Replicate 2 4 0 0 40 100 100
Replicate 3 4 0 0 40 80 60
Replicate 1 5 0 0 60 80 100
Replicate 2 5 0 0 80 100 100
Replicate 3 5 0 0 60 80 100
Replicate 1 6 0 0 80 60 100
Replicate 2 6 0 0 40 80 100
Replicate 3 6 0 0 60 80 100
Replicate 1 12 0 0 80 80 100
Replicate 2 12 0 0 60 100 100
Replicate 3 12 0 0 60 80 100
Replicate 1 24 0 0 60 100 100
Replicate 2 24 0 0 60 80 100
Replicate 3 24 0 0 60 80 100

177
Body Orientation
Percentage of Hyalella azteca displaying abnormal body orientation
Time Reference 0.1% DMSO 10 µg/L TBT
50 µg/L TBT
100 µg/L TBT
Replicate 1 0 0 0 0 0 0
Replicate 2 0 0 0 0 0 0
Replicate 3 0 0 0 0 0 0
Replicate 1 1 0 0 0 0 0
Replicate 2 1 0 0 0 0 0
Replicate 3 1 0 0 0 0 0
Replicate 1 2 0 0 0 20 40
Replicate 2 2 0 0 0 0 0
Replicate 3 2 0 0 0 20 0
Replicate 1 3 0 0 20 20 40
Replicate 2 3 0 0 0 0 0
Replicate 3 3 0 0 20 20 20
Replicate 1 4 0 0 0 0 60
Replicate 2 4 0 0 20 0 0
Replicate 3 4 0 0 20 40 40
Replicate 1 5 0 0 20 0 20
Replicate 2 5 0 0 0 0 0
Replicate 3 5 0 0 20 40 40
Replicate 1 6 0 0 20 0 20
Replicate 2 6 0 0 20 0 0
Replicate 3 6 0 0 20 40 40
Replicate 1 12 0 0 20 0 20
Replicate 2 12 0 0 20 0 0
Replicate 3 12 0 0 20 40 40
Replicate 1 24 0 0 0 40 40
Replicate 2 24 0 0 0 0 0
Replicate 3 24 0 0 20 40 40
178
Appendix H Hyalella azteca Motility Bioassay Atrazine Data
Swimming Events
Percentage of Hyalella azteca performing swimming events
Time Reference 0.1% DMSO 5 µg/L Atrazine
50 µg/L Atrazine
100 µg/L Atrazine
Replicate 1 1 100 100 40 40 40
Replicate 2 1 100 100 100 20 40
Replicate 3 1 100 100 0 60 40
Replicate 1 2 100 100 0 0 0
Replicate 2 2 100 100 40 20 20
Replicate 3 2 100 100 0 20 20
Replicate 1 3 100 100 20 0 0
Replicate 2 3 80 60 20 20 0
Replicate 3 3 100 100 100 40 40
Replicate 1 4 60 80 20 20 0
Replicate 2 4 100 100 0 20 0
Replicate 3 4 80 60 0 0 0
Replicate 1 5 100 100 20 0 0
Replicate 2 5 100 100 0 0 20
Replicate 3 5 100 100 0 0 20
Replicate 1 6 100 100 20 0 0
Replicate 2 6 100 100 0 0 0
Replicate 3 6 80 80 0 20 0
Replicate 1 10 60 60 0 0 0
Replicate 2 10 0 20 0 0 0
Replicate 3 10 0 20 0 0 0
Replicate 1 24 0 20 0 0 0
Replicate 2 24 60 60 20 0 0
Replicate 3 24 60 40 0 0 20

179
Substrate Crawling
Percentage of Hyalella azteca crawling on substrate
Time Reference 0.1% DMSO 5 µg/L Atrazine
50 µg/L Atrazine
100 µg/L Atrazine
Replicate 1 1 100 100 20 60 80
Replicate 2 1 100 100 100 20 100
Replicate 3 1 100 100 0 60 80
Replicate 1 2 100 100 0 0 0
Replicate 2 2 100 100 100 80 40
Replicate 3 2 100 100 0 40 40
Replicate 1 3 100 100 20 0 0
Replicate 2 3 100 100 40 20 0
Replicate 3 3 100 100 0 60 40
Replicate 1 4 100 100 20 0 0
Replicate 2 4 100 100 40 20 0
Replicate 3 4 100 100 0 20 20
Replicate 1 5 100 100 20 0 0
Replicate 2 5 100 100 20 20 20
Replicate 3 5 100 100 20 0 20
Replicate 1 6 100 100 20 0 0
Replicate 2 6 100 100 0 0 0
Replicate 3 6 100 100 0 20 0
Replicate 1 10 100 100 0 0 0
Replicate 2 10 100 100 20 0 0
Replicate 3 10 100 100 20 0 0
Replicate 1 24 40 0 0 0 0
Replicate 2 24 100 100 40 0 0
Replicate 3 24 100 100 0 0 20

180
Immobilization
Percentage of immobilized Hyalella azteca
Time Reference 0.1% DMSO 5 µg/L Atrazine
50 µg/L Atrazine
100 µg/L Atrazine
Replicate 1 1 0 0 60 40 60
Replicate 2 1 0 0 0 80 60
Replicate 3 1 0 0 100 60 60
Replicate 1 2 0 0 100 100 100
Replicate 2 2 0 0 0 60 60
Replicate 3 2 0 0 100 60 60
Replicate 1 3 0 0 80 100 100
Replicate 2 3 0 0 60 80 100
Replicate 3 3 0 0 100 40 60
Replicate 1 4 0 0 80 100 100
Replicate 2 4 0 0 60 80 100
Replicate 3 4 0 0 100 80 80
Replicate 1 5 0 0 80 100 100
Replicate 2 5 0 0 80 80 80
Replicate 3 5 0 0 80 100 80
Replicate 1 6 0 0 80 100 100
Replicate 2 6 0 0 100 100 100
Replicate 3 6 0 0 100 80 100
Replicate 1 10 0 0 100 100 100
Replicate 2 10 0 0 100 100 100
Replicate 3 10 0 0 80 100 100
Replicate 1 24 100 80 100 100 100
Replicate 2 24 0 0 60 100 100
Replicate 3 24 0 0 100 100 80

181
Burrowing
Percentage of Hyalella azteca burrowed
Time Reference 0.1% DMSO
5 µg/L Atrazine
50 µg/L Atrazine
100 µg/L Atrazine
Replicate 1 1 0 0 60 40 40
Replicate 2 1 0 0 0 20 0
Replicate 3 1 0 0 100 0 0
Replicate 1 2 0 0 80 100 60
Replicate 2 2 0 0 0 40 20
Replicate 3 2 0 0 100 0 0
Replicate 1 3 0 0 80 80 80
Replicate 2 3 0 0 40 60 80
Replicate 3 3 0 0 100 0 20
Replicate 1 4 0 0 80 80 80
Replicate 2 4 0 0 40 60 40
Replicate 3 4 0 0 80 80 40
Replicate 1 5 0 0 80 80 60
Replicate 2 5 0 0 20 40 40
Replicate 3 5 0 0 80 100 40
Replicate 1 6 0 0 80 100 100
Replicate 2 6 0 0 40 60 80
Replicate 3 6 0 0 60 40 60
Replicate 1 10 0 0 100 100 60
Replicate 2 10 0 0 80 100 80
Replicate 3 10 0 0 60 60 60
Replicate 1 24 60 20 60 60 20
Replicate 2 24 0 0 60 80 60
Replicate 3 24 20 20 20 60 40

182
Grouping
Percentage of Hyalella azteca grouping
Time Reference 0.1% DMSO 5 µg/L Atrazine
50 µg/L Atrazine
100 µg/L Atrazine
Replicate 1 1 0 0 60 0 0
Replicate 2 1 0 0 0 0 0
Replicate 3 1 0 0 80 0 0
Replicate 1 2 0 0 100 100 100
Replicate 2 2 0 0 0 0 60
Replicate 3 2 0 0 100 0 60
Replicate 1 3 0 0 80 100 100
Replicate 2 3 0 0 80 80 80
Replicate 3 3 0 0 100 0 0
Replicate 1 4 0 0 80 100 100
Replicate 2 4 0 0 60 100 100
Replicate 3 4 0 0 100 60 80
Replicate 1 5 0 0 80 100 100
Replicate 2 5 0 0 80 0 60
Replicate 3 5 0 0 80 100 0
Replicate 1 6 0 0 80 100 100
Replicate 2 6 0 0 100 80 100
Replicate 3 6 0 0 80 60 80
Replicate 1 10 0 0 100 100 80
Replicate 2 10 0 0 100 100 100
Replicate 3 10 0 0 60 100 80
Replicate 1 24 0 100 80 100 60
Replicate 2 24 0 0 60 80 100
Replicate 3 24 0 0 60 100 80

183
Body Length
Percentage of Hyalella azteca displaying shortened body length
Time Reference 0.1% DMSO 5 µg/L Atrazine
50 µg/L Atrazine
100 µg/L Atrazine
Replicate 1 1 0 0 60 20 20
Replicate 2 1 0 0 0 40 40
Replicate 3 1 0 0 100 40 40
Replicate 1 2 0 0 100 100 100
Replicate 2 2 0 0 20 80 80
Replicate 3 2 0 0 100 80 60
Replicate 1 3 0 0 80 100 60
Replicate 2 3 0 0 80 80 100
Replicate 3 3 0 0 100 60 80
Replicate 1 4 0 0 80 80 80
Replicate 2 4 0 0 40 100 100
Replicate 3 4 0 0 100 100 100
Replicate 1 5 0 0 80 80 100
Replicate 2 5 0 0 100 100 80
Replicate 3 5 0 0 100 100 80
Replicate 1 6 0 0 80 100 100
Replicate 2 6 0 0 100 100 100
Replicate 3 6 0 0 100 100 80
Replicate 1 10 0 0 100 100 80
Replicate 2 10 0 0 80 100 100
Replicate 3 10 0 0 100 100 100
Replicate 1 24 60 40 80 100 40
Replicate 2 24 0 0 60 100 100
Replicate 3 24 0 0 60 100 80

184

185
Body Orientation
Percentage of Hyalella azteca displaying abnormal body orientation
Time Reference 0.1% DMSO 5 µg/L Atrazine
50 µg/L Atrazine
100 µg/L Atrazine
Replicate 1 1 0 0 0 0 0
Replicate 2 1 0 0 0 0 0
Replicate 3 1 0 0 0 0 0
Replicate 1 2 0 0 0 0 0
Replicate 2 2 0 0 0 0 0
Replicate 3 2 0 0 0 0 0
Replicate 1 3 0 0 0 0 0
Replicate 2 3 0 0 0 0 0
Replicate 3 3 0 0 0 0 0
Replicate 1 4 0 0 0 0 0
Replicate 2 4 0 0 0 0 40
Replicate 3 4 0 0 0 0 40
Replicate 1 5 0 0 0 0 0
Replicate 2 5 0 0 40 0 20
Replicate 3 5 0 0 0 0 0
Replicate 1 6 0 0 0 0 0
Replicate 2 6 0 0 0 0 0
Replicate 3 6 0 0 0 20 40
Replicate 1 10 0 0 0 0 0
Replicate 2 10 0 0 0 0 0
Replicate 3 10 0 0 0 40 60
Replicate 1 24 0 0 0 0 0
Replicate 2 24 0 0 0 0 0
Replicate 3 24 0 0 0 20 20

186
Appendix I Lumbriculus variegatus Burrowing Behaviour TBT Data
Time (Hours)
0 0.25 0.5 0.75 1 1.25 1.5 1.75 2 2.25 2.5 2.75 3 3.25 3.5 3.75 4 4.25 4.5
Number of Lumbriculus variegatus Burrowed (/10)
Reference
Replicate 1
0 10 10 10 10 10 10 10 10 10 10 10 10 10 10 10 10 10 10
Replicate 2
0 10 10 10 10 10 10 10 10 10 10 10 10 10 10 10 10 10 10
Replicate 3
0 7 8 7 8 8 7 8 7 7 8 8 9 8 7 6 9 10 10
Replicate 4
0 10 10 10 10 10 10 10 10 10 10 10 10 10 10 10 10 10 10
Replicate 5
0 6 5 6 7 6 7 7 8 8 8 8 9 8 10 10 10 10 10
Average 0 8.6 8.6 8.6 9 8.8 8.8 9 9 9 9.2 9.2 10 9.2 9.4 9.2 10 10 10
0.1% DMSO
Replicate 1
0 5 4 4 6 6 5 7 9 6 7 8 8 9 9 8 8 9 9
Replicate 2
0 7 6 5 5 6 6 7 7 7 7 7 7 7 8 7 7 7 8
Replicate 3
0 10 10 10 10 10 10 10 10 10 10 10 10 10 10 10 10 10 10
Replicate 4
0 10 10 10 10 10 10 10 10 10 10 10 10 10 10 10 10 10 10
Replicate 5
0 9 10 10 10 10 10 9 9 10 10 10 10 10 9 9 9 9 9
Average 0 8.2 8 7.8 8.2 8.4 8.2 8.6 9 8.6 8.8 9 9 9.2 9.2 8.8 9 9 9.2
0.1 µg/L TBT
Replicate 1
0 9 10 10 10 9 9 10 9 10 10 10 10 10 10 10 10 10 10
Replicate 2
0 7 9 9 10 10 10 10 10 9 9 9 10 10 10 10 10 10 10
Replicate 3
0 8 9 9 9 8 7 8 8 8 7 7 7 7 7 7 8 9 9
Replicate 4
0 9 10 10 10 9 8 8 9 10 10 10 10 10 10 10 10 10 10
Replicate 5
0 8 7 8 8 7 8 7 7 7 7 7 8 8 8 8 8 8 8
Average 0 8.2 9 9.2 9.4 8.6 8.4 8.6 9 8.8 8.6 8.6 9 9 9 9 9 9.4 9.4
Time (Hours)
0 0.25 0.5 0.75 1 1.25 1.5 1.75 2 2.25 2.5 2.75 3 3.25 3.5 3.75 4 4.25 4.5

187
1.0 µg/L TBT
Replicate 1
0 8 8 8 8 9 9 8 8 8 8 8 9 9 8 9 9 9 9
Replicate 2
0 10 10 10 10 9 9 9 8 8 10 10 10 10 10 10 10 10 10
Replicate 3
0 3 8 8 8 10 10 8 7 8 8 8 8 8 8 7 8 8 8
Replicate 4
0 6 7 9 8 9 8 7 7 10 10 10 10 10 10 10 10 10 10
Replicate 5
0 7 6 7 8 7 9 8 9 9 8 9 9 7 9 10 10 10 10
Average 0 6.8 7.8 8.4 8.4 8.8 9 8 8 8.6 8.8 9 9 8.8 9 9.2 9 9.4 9.4
10 µg/L TBT
Replicate 1
0 4 5 6 8 8 8 9 8 8 8 8 9 10 9 10 10 10 10
Replicate 2
0 4 7 9 8 8 9 9 8 7 7 8 10 10 10 10 10 10 10
Replicate 3
0 3 5 7 7 6 6 8 8 9 9 10 9 8 7 8 8 8 8
Replicate 4
0 8 9 10 8 9 10 9 10 10 9 10 9 8 9 10 10 10 10
Replicate 5
0 2 1 2 7 4 5 4 9 8 8 9 9 10 9 10 9 9 10
Average 0 4.2 5.4 6.8 7.6 7 7.6 7.8 9 8.4 8.2 9 9 9.2 8.8 9.6 9 9.4 9.6

188
Appendix J Lumbriculus variegatus Burrowing Behaviour Atrazine Data
Time (Hours)
0 0.5 1 1.5 2 2.5 3 3.5 4 4.5 5 5.5 6
Number of Lumbriculus variegatus Burrowed (0/10)
Reference
Replicate 1 0 4 4 4 5 5 9 5 4 4 6 8 8
Replicate 2 0 4 5 7 7 8 9 9 9 10 10 9 9
Replicate 3 0 7 9 8 8 9 9 9 9 9 10 10 9
Replicate 4 0 4 7 5 10 10 5 5 7 7 7 7 7
Replicate 5 0 1 6 4 5 6 6 6 7 7 7 7 9
Average 0 4 6.2 5.6 7 7.6 7.6 6.8 7.2 7.4 8 8.2 8.4
0.1% DMSO
Replicate 1 0 9 7 8 8 9 9 9 9 9 9 9 8
Replicate 2 0 4 4 4 6 7 8 8 8 7 9 6 6
Replicate 3 0 4 4 5 4 5 5 7 6 6 6 6 6
Replicate 4 0 4 5 4 5 7 7 7 7 8 8 8 8
Replicate 5 0 7 8 8 8 9 6 8 7 8 8 6 7
Average 0 5.6 5.6 5.8 6 7.4 7 7.8 7.4 7.6 8 7 7
5 µg/L Atrazine
Replicate 1 0 1 1 1 4 4 4 4 7 7 8 8 7
Replicate 2 0 4 4 7 4 4 4 4 4 4 8 8 6
Replicate 3 0 2 3 3 4 4 4 4 4 4 4 6 3
Replicate 4 0 4 5 3 7 7 7 7 3 5 3 3 4
Replicate 5 0 4 5 5 5 5 5 5 7 4 8 9 10
Average 0 3 3.6 3.8 5 4.8 4.8 4.8 5 4.8 6.2 6.8 6
50 µg/L Atrazine
Replicate 1 0 6 6 6 6 9 10 10 9 9 10 10 10
Replicate 2 0 3 5 5 6 6 6 6 9 8 8 7 7
Replicate 3 0 2 0 3 3 4 5 4 2 5 4 6 6
Replicate 4 0 4 6 5 2 5 5 5 6 6 9 5 6
Replicate 5 0 4 4 2 5 7 7 7 7 7 7 7 7
Average 0 3.8 4.2 4.2 4 6.2 6.6 6.4 6.6 7 7.6 7 7.2
100 µg/L Atrazine
Replicate 1 0 3 3 2 4 6 6 8 6 6 6 6 6
Replicate 2 0 3 7 6 7 7 8 8 8 6 7 8 8
Replicate 3 0 5 7 7 7 7 7 9 8 8 8 8 10
Replicate 4 0 4 4 4 4 4 6 6 5 4 5 6 6
Replicate 5 0 1 1 5 5 5 5 5 8 8 7 9 7

189
Average 0 3.2 4.4 4.8 5 5.8 6.4 7.2 7 6.4 6.6 7.4 7.4
Appendix K Lumbriculus variegatus Grouping Behaviour TBT Data
Number of Lumbriculus variegatus Grouping (/10)
Time (Hours)
0 0.5 1 1.5 2 2.5 3 3.5 4 4.5 5 5.5 6 9 24 30 42 48
Reference
Replicate 1 0 0 0 2 0 6 10 8 7 9 7 8 8 9 9 5 8 9
Replicate 2 0 0 2 0 3 8 9 8 7 7 7 8 0 8 4 7 7 9
Replicate 3 0 0 0 3 3 3 9 10 9 10 4 8 8 7 4 8 6 9
Replicate 4 0 0 0 2 2 0 5 7 6 9 6 8 10 6 10 6 9 7
Average 0 0 0.5 1.75 2 4.25 8.25 8.25 7.25 8.75 6 8 6.5 7.5 6.75 6.5 7.5 8.5
0.1% DMSO
Replicate 1 0 0 2 0 2 7 8 5 7 7 4 8 4 4 5 3 10 6
Replicate 2 0 0 0 0 0 4 8 7 7 6 4 9 9 7 9 10 9 7
Replicate 3 0 0 0 2 2 4 0 0 5 8 8 9 6 4 10 7 6 7
Replicate 4 0 0 0 0 2 7 10 10 10 2 0 9 10 5 5 6 9 7
Average 0 0 0.5 0.5 1.5 5.5 6.5 5.5 7.25 5.75 4 8.75 7.25 5 7.25 6.5 8.5 6.75
10 µg/L TBT
Replicate 1 0 0 2 0 2 7 5 6 7 6 3 8 8 3 7 9 4 10
Replicate 2 0 0 0 0 3 2 6 6 9 7 0 3 0 5 8 7 8 0
Replicate 3 0 0 0 2 7 9 8 0 6 10 10 10 0 7 9 7 8 5
Replicate 4 0 0 0 3 0 0 6 8 9 7 2 5 8 2 9 0 5 10
Average 0 0 0.5 1.25 3 4.5 6.25 5 7.75 7.5 3.75 6.5 4 4.25 8.25 5.75 6.25 6.25
50 µg/L TBT
Replicate 1 0 0 3 0 0 9 4 7 0 2 4 0 0 0 2 7 0 10
Replicate 2 0 0 0 0 6 3 8 8 10 8 2 4 3 9 2 7 6 10
Replicate 3 0 0 0 0 4 7 3 0 10 9 5 8 9 3 10 0 6 10
Replicate 4 0 0 0 0 4 3 5 9 10 7 8 9 5 9 4 8 4 10
Average 0 0 0.8 0 3.5 5.5 5 6 7.5 6.5 4.75 5.25 4.25 5.25 4.5 5.5 4 10
100 µg/L TBT
Replicate 1 0 0 0 0 4 7 2 3 7 8 5 7 7 6 9 0 7 5
Replicate 2 0 2 2 2 2 3 2 5 6 8 5 4 4 4 9 5 4 10
Replicate 3 0 0 0 3 2 0 0 4 2 4 5 5 7 2 4 4 8 3

190
Replicate 4 0 0 0 3 3 0 4 2 0 3 8 8 3 4 4 5 5 8
Average 0 0.5 0.5 2 2.8 2.5 2 3.5 3.75 5.75 5.75 6 5.25 4 6.5 3.5 6 6.5
Appendix L Lumbriculus variegatus Grouping Behaviour Atrazine Data
Number of Lumbriculus variegatus Grouping (/10)
Time (Hours) 0 0.5 1 1.5 2 2.5 3 3.5 4 4.5 5 5.5 6
Reference
Replicate 1 0 0 0 0 2 2 4 8 10 10 7 10 10
Replicate 2 0 5 7 7 6 8 8 5 9 10 2 0 0
Replicate 3 0 0 4 5 5 4 7 10 9 0 6 10 8
Replicate 4 0 7 10 7 6 8 8 9 8 10 10 7 0
Average 0 3 5.25 4.75 4.75 5.5 6.75 8 9 7.5 6.25 6.75 4.5
0.1% DMSO
Replicate 1 0 0 0 0 0 0 0 0 9 9 8 0 0
Replicate 2 0 5 7 7 8 7 9 9 7 9 10 10 10
Replicate 3 0 9 7 8 9 6 9 10 10 8 7 10 10
Replicate 4 0 0 0 0 0 0 0 0 0 4 0 4 0
Average 0 3.5 3.5 3.75 4.25 3.25 4.5 4.75 6.5 7.5 6.25 6 5
10 µg/L TBT
Replicate 1 0 0 0 0 0 0 0 0 0 9 5 0 5
Replicate 2 0 0 9 9 10 10 10 9 10 9 9 9 9
Replicate 3 0 0 0 0 5 8 10 10 10 10 10 9 8
Replicate 4 0 2 9 6 7 8 6 9 5 9 10 10 9
Average 0 0.5 4.5 3.75 5.5 6.5 6.5 7 6.25 9.25 8.5 7 7.75
50 µg/L TBT
Replicate 1 0 3 6 6 8 9 10 9 10 10 7 5 7
Replicate 2 0 0 0 0 6 7 8 5 7 8 9 5 0
Replicate 3 0 8 5 5 5 6 6 7 7 8 7 9 8
Replicate 4 0 2 3 3 3 5 5 8 8 9 10 10 10
Average 0 3.25 3.5 3.5 5.5 6.75 7.25 7.25 8 8.75 8.25 7.25 6.25
100 µg/L TBT
Replicate 1 0 8 6 6 6 7 8 10 8 9 10 10 9
Replicate 2 0 4 8 5 7 6 5 6 8 10 9 3 0
Replicate 3 0 8 7 7 6 7 7 6 9 8 7 8 5

191
Replicate 4 0 9 9 8 6 6 4 10 9 10 10 10 0
Average 0 7.25 7.5 6.5 6.25 6.5 6 8 8.5 9.25 9 7.75 3.5
Appendix M Lumbriculus variegatus Motility Bioassay TBT
Vessel Position
Percentage of Lumbriculus variegatus in middle of bioassay vessel
Time Reference 0.1% DMSO
10 µg/L TBT
50 µg/L TBT
100 µg/L TBT
Replicate 1 1 10 0 0 10 10
Replicate 2 1 0 20 10 0 10
Replicate 3 1 10 0 0 0 10
Replicate 4 1 30 0 20 10 30
Replicate 1 3 0 0 10 0 0
Replicate 2 3 0 0 0 0 0
Replicate 3 3 0 20 0 0 0
Replicate 4 3 0 0 0 0 20
Replicate 1 5 0 0 0 50 0
Replicate 2 5 0 0 0 50 0
Replicate 3 5 0 0 0 0 0
Replicate 4 5 0 0 0 0 0
Replicate 1 24 0 0 0 0 0
Replicate 2 24 0 0 0 0 0
Replicate 3 24 0 0 0 0 0
Replicate 4 24 0 0 0 0 0

192
Locomotion Style
Percentage of organisms displaying abnormal movement style
Time Reference 0.1% DMSO 10 µg/L TBT 50 µg/L TBT 100 µg/L TBT
Replicate 1 1 0 0 0 0 0
Replicate 2 1 0 0 0 0 0
Replicate 3 1 0 0 0 0 0
Replicate 4 1 0 0 0 0 0
Replicate 1 3 0 0 40 50 100
Replicate 2 3 0 0 20 0 67
Replicate 3 3 N/A - all in groups
0 0 100 100
Replicate 4 3 0 N/A - all in groups
25 50 100
Replicate 1 5 0 0 33 100 100
Replicate 2 5 0 0 100 100 100
Replicate 3 5 0 0 N/A - all in groups
100 100
Replicate 4 5 0 0 100 100 100
Replicate 1 24 0 0 100 100 N/A - all in groups
Replicate 2 24 0 N/A - all in groups
100 100 100
Replicate 3 24 0 N/A - all in groups
100 N/A - all in groups
100
Replicate 4 24 0 10 100 N/A - all in groups
N/A - all in groups

193
Immobilization
Percentage of organisms immobilized
Time Reference 0.1% DMSO
10 µg/L TBT
50 µg/L TBT 100 µg/L TBT
Replicate 1 1 0 0 0 0 0
Replicate 2 1 0 0 0 0 0
Replicate 3 1 0 0 0 0 0
Replicate 4 1 0 0 0 0 0
Replicate 1 3 0 0 40 0 100
Replicate 2 3 0 0 20 0 67
Replicate 3 3 0 0 20 0 80
Replicate 4 3 0 0 25 50 80
Replicate 1 5 0 0 33 40 33
Replicate 2 5 0 0 0 20 60
Replicate 3 5 0 0 0 25 60
Replicate 4 5 0 0 10 100 80
Replicate 1 24 0 0 0 10 100
Replicate 2 24 0 0 0 80 100
Replicate 3 24 0 0 100 N/A - all grouping 50
Replicate 4 24 0 10 100 N/A - all grouping 80

194
Body Length
Percentage of organisms displaying shortened body length
Time Reference 0.1% DMSO 10 µg/L TBT
50 µg/L TBT 100 µg/L TBT
Replicate 1 1 0 0 0 0 0
Replicate 2 1 0 0 0 10 0
Replicate 3 1 0 0 0 0 0
Replicate 4 1 0 0 0 0 0
Replicate 1 3 0 0 0 0 100
Replicate 2 3 0 0 0 0 67
Replicate 3 3 N/A - all in group
0 0 0 80
Replicate 4 3 0 0 25 0 80
Replicate 1 5 0 0 17 40 100
Replicate 2 5 0 0 0 40 75
Replicate 3 5 0 0 0 25 75
Replicate 4 5 0 0 0 100 100
Replicate 1 24 0 20 40 30 N/A - all in groups
Replicate 2 24 0 N/A - all in groups
0 0 100
Replicate 3 24 0 N/A - all in groups
100 N/A - all in groups
100
Replicate 4 24 100 10 100 N/A - all in groups
N/A - all in groups

195
Body Orientation
Percentage of organisms displaying abnormal body orientation
Time Reference 0.1% DMSO 10 µg/L TBT
50 µg/L TBT 100 µg/L TBT
Replicate 1 1 0 0 0 0 0
Replicate 2 1 0 0 0 0 0
Replicate 3 1 0 0 0 0 0
Replicate 4 1 0 0 0 0 0
Replicate 1 3 0 0 20 0 100
Replicate 2 3 0 0 20 0 67
Replicate 3 3 N/A - all in groups
0 0 100 80
Replicate 4 3 0 0 25 50 80
Replicate 1 5 0 0 17 40 33
Replicate 2 5 0 0 0 40 25
Replicate 3 5 0 0 0 25 25
Replicate 4 5 0 0 20 100 0
Replicate 1 24 0 0 0 10 N/A - all in groups
Replicate 2 24 20 N/A - all in groups
0 0 100
Replicate 3 24 20 N/A - all in groups
100 N/A - all in groups
50
Replicate 4 24 0 10 100 N/A - all in groups
N/A - all in groups

196
Group Movement
Percentage of organisms displaying movement in, out and within groups
Time Reference 0.1% DMSO 10 µg/L TBT 50 µg/L TBT 100 µg/L TBT
Replicate 1 1 N/A - no grouping
N/A - no grouping
100 N/A - no grouping
100
Replicate 2 1 N/A - no grouping
N/A - no grouping
100 100 100
Replicate 3 1 100 N/A - no grouping
N/A - no grouping
100 100
Replicate 4 1 N/A - no grouping
100 100 N/A - no grouping
N/A - no grouping
Replicate 1 3 100 100 0 100 80
Replicate 2 3 100 100 100 100 100
Replicate 3 3 100 100 100 100 N/A - no grouping
Replicate 4 3 N/A - no grouping
100 100 60 N/A - no grouping
Replicate 1 5 100 100 75 100 0
Replicate 2 5 100 100 N/A - no grouping
100 17
Replicate 3 5 N/A - no grouping
100 20 67 17
Replicate 4 5 N/A - no grouping
100 100 0 0
Replicate 1 24 100 N/A - no grouping
100 N/A - no grouping
0
Replicate 2 24 100 80 15 0 0
Replicate 3 24 N/A - no grouping
100 0 50 0
Replicate 4 24 80 N/A - no grouping
0 50 20

197
Appendix N Lumbriculus variegatus Motility Bioassay Atrazine
Vessel Position
Percentage of organisms in middle of bioassay vessel
Time Reference 0.1% DMSO 5 µg/L Atrazine
50 µg/L Atrazine
100 µg/L Atrazine
Replicate 1 1 0 0 0 0 20
Replicate 2 1 0 0 0 0 0
Replicate 3 1 0 0 0 0 0
Replicate 4 1 0 10 0 0 0
Replicate 1 3 0 0 0 0 0
Replicate 2 3 0 0 0 0 0
Replicate 3 3 0 0 0 0 0
Replicate 4 3 0 0 0 0 0
Replicate 1 6 0 20 20 0 40
Replicate 2 6 0 0 0 0 0
Replicate 3 6 0 0 0 0 0
Replicate 4 6 0 0 0 20 0
Replicate 1 9 0 0 0 0 0
Replicate 2 9 0 0 0 0 0
Replicate 3 9 0 0 0 0 0
Replicate 4 9 0 0 0 0 0
Replicate 1 24 0 0 0 0 10
Replicate 2 24 0 0 0 0 0
Replicate 3 24 0 0 0 0 0
Replicate 4 24 0 0 0 0 0

198
Locomotion Style
Percentage of organisms displaying abnormal movement style
Time Reference 0.1% DMSO 5 µg/L Atrazine
50 µg/L Atrazine
100 µg/L Atrazine
Replicate 1 1 0 0 0 0 40
Replicate 2 1 0 0 0 0 40
Replicate 3 1 0 0 0 20 20
Replicate 4 1 0 0 0 20 n/a - all in group
Replicate 1 3 0 0 0 n/a - all in group
100
Replicate 2 3 0 0 n/a - all in group
100 100
Replicate 3 3 0 0 10 100 100
Replicate 4 3 n/a - all in group
0 n/a - all in group
100 n/a - all in group
Replicate 1 6 n/a - all in group
0 50 50 100
Replicate 2 6 0 n/a - all in group
n/a 100 100
Replicate 3 6 0 n/a - all in group
n/a 100 100
Replicate 4 6 0 0 100 100 50
Replicate 1 9 0 0 100 n/a - all in group
100
Replicate 2 9 0 0 100 100 100
Replicate 3 9 0 0 0 100 100
Replicate 4 9 n/a - all in group
0 n/a - all in group
80 100
Replicate 1 24 0 n/a - all in group
n/a - all in group
80 100
Replicate 2 24 0 n/a - all in group
100 100 100
Replicate 3 24 n/a - all in group
0 100 100 100
Replicate 4 24 10 0 100 100 100

199
Immobilization
Percentage of immobilized organisms
Time Reference 0.1% DMSO
5 µg/L Atrazine
50 µg/L Atrazine
100 µg/L Atrazine
Replicate 1 1 0 0 0 0 0
Replicate 2 1 0 0 0 0 10
Replicate 3 1 0 0 0 0 0
Replicate 4 1 0 0 0 0 0
Replicate 1 3 0 0 0 0 2
Replicate 2 3 0 0 0 0 0
Replicate 3 3 0 0 10 10 20
Replicate 4 3 0 0 0 20 70
Replicate 1 6 0 0 20 10 0
Replicate 2 6 0 0 0 10 10
Replicate 3 6 0 0 0 0 20
Replicate 4 6 0 0 10 10 30
Replicate 1 9 0 0 0 0 40
Replicate 2 9 0 0 0 30 40
Replicate 3 9 0 0 0 30 20
Replicate 4 9 0 0 0 20 30
Replicate 1 24 10 0 20 30 60
Replicate 2 24 0 0 20 10 50
Replicate 3 24 0 20 30 20 20
Replicate 4 24 0 0 10 40 40

200
Body Length
Percentage of organisms displaying shortened body length
Time Reference 0.1% DMSO 5 µg/L Atrazine
50 µg/L Atrazine
100 µg/L Atrazine
Replicate 1 1 10 0 0 20 20
Replicate 2 1 0 0 0 0 10
Replicate 3 1 0 0 0 0 0
Replicate 4 1 0 0 0 0 0
Replicate 1 3 n/a - all in group
0 0 n/a - all in group
100
Replicate 2 3 n/a - all in group
0 n/a - all in group
0 0
Replicate 3 3 0 0 0 25 100
Replicate 4 3 n/a - all in group
0 n/a - all in group
n/a - all in group
n/a - all in group
Replicate 1 6 n/a - all in group
0 10 10 100
Replicate 2 6 0 n/a - all in group
n/a - all in group
20 0
Replicate 3 6 0 n/a - all in group
n/a - all in group
33 100
Replicate 4 6 0 0 30 100 60
Replicate 1 9 0 0 40 n/a - all in group
100
Replicate 2 9 10 0 30 30 100
Replicate 3 9 0 0 0 25 80
Replicate 4 9 n/a - all in group
0 0 30 43
Replicate 1 24 10 n/a - all in group
n/a - all in group
40 100
Replicate 2 24 0 n/a - all in group
40 10 50
Replicate 3 24 n/a - all in group
20 30 20 100
Replicate 4 24 50 0 100 70 40

201
Body Orientation
Percentage of organisms displaying abnormal body orientation
Time Reference 0.1% DMSO 5 µg/L Atrazine
50 µg/L Atrazine
100 µg/L Atrazine
Replicate 1 1 10 0 0 0 20
Replicate 2 1 0 0 0 0 10
Replicate 3 1 0 0 0 0 0
Replicate 4 1 0 0 0 0 0
Replicate 1 3 n/a - all in group
0 0 n/a - all in group
30
Replicate 2 3 n/a - all in group
0 n/a - all in group
0 0
Replicate 3 3 0 0 0 0 0
Replicate 4 3 n/a - all in group
0 n/a - all in group
n/a - all in group
n/a - all in group
Replicate 1 6 n/a - all in group
10 0 0 0
Replicate 2 6 0 n/a - all in group
n/a - all in group
0 0
Replicate 3 6 0 n/a - all in group
n/a - all in group
0 0
Replicate 4 6 0 0 0 0 0
Replicate 1 9 0 0 0 n/a - all in group
0
Replicate 2 9 0 0 0 20 33
Replicate 3 9 0 0 n/a - all in group
n/a - all in group
20
Replicate 4 9 n/a - all in group
0 0 20 20
Replicate 1 24 10 n/a - all in group
n/a - all in group
0 67
Replicate 2 24 0 n/a - all in group
10 10 0
Replicate 3 24 n/a - all in group
20 0 10 0
Replicate 4 24 0 0 100 10 20

202
Group Movement
Percentage of organisms moving in, out and within groups
Time Reference 0.1% DMSO 5 µg/L Atrazine
50 µg/L Atrazine
100 µg/L Atrazine
Replicate 1 1 100 100 100 100 100
Replicate 2 1 100 100 100 100 100
Replicate 3 1 100 100 100 100 100
Replicate 4 1 100 n/a - no groups
100 100 50
Replicate 1 3 100 100 100 100 100
Replicate 2 3 100 100 100 100 100
Replicate 3 3 100 100 100 90 70
Replicate 4 3 n/a - no grouping
100 100 80 30
Replicate 1 6 100 100 80 90 100
Replicate 2 6 100 100 70 90 90
Replicate 3 6 100 100 70 90 80
Replicate 4 6 n/a - no grouping
n/a - no groups
n/a - no grouping
100 100
Replicate 1 9 n/a - no grouping
n/a - no groups
100 100 60
Replicate 2 9 n/a - no grouping
n/a - no groups
n/a - no grouping
90 90
Replicate 3 9 n/a - no grouping
100 100 90 n/a - no grouping
Replicate 4 9 100 n/a - no groups
100 n/a - no grouping
100
Replicate 1 24 n/a - no grouping
100 80 n/a - no grouping
0
Replicate 2 24 100 100 n/a - no grouping
n/a - no grouping
0
Replicate 3 24 100 n/a - no groups
n/a - no grouping
100 100
Replicate 4 24 100 100 0 n/a - no grouping
n/a - no grouping
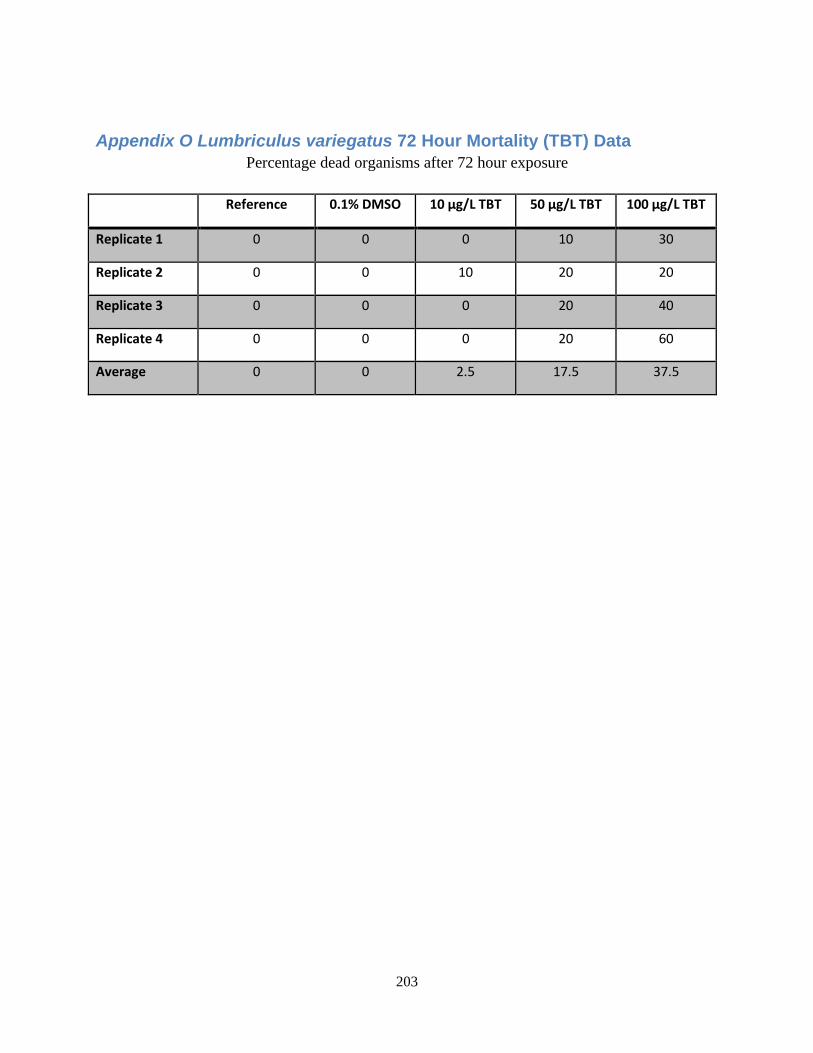
203
Appendix O Lumbriculus variegatus 72 Hour Mortality (TBT) Data
Percentage dead organisms after 72 hour exposure
Reference 0.1% DMSO 10 µg/L TBT 50 µg/L TBT 100 µg/L TBT
Replicate 1 0 0 0 10 30
Replicate 2 0 0 10 20 20
Replicate 3 0 0 0 20 40
Replicate 4 0 0 0 20 60
Average 0 0 2.5 17.5 37.5

204
Appendix P Daphnia magna Respiration Data (TBT)
Time Dissolved oxygen content (umol/L water)
Reference DMSO 10 µg/L 50 µg/L 100 µg/L
0 173.733697 183.04086 176.8360848 175.28489 179.938472
0 181.489666 175.28489 179.9384722 181.48967 169.080116
0 186.143247 178.38728 183.0408597 178.38728 178.387278
1 186.143247 178.38728 175.284891 152.01699 167.528922
1 183.04086 175.28489 175.284891 186.14325 165.977729
1 179.938472 172.1825 170.6313098 173.7337 164.426535
2 175.284891 175.28489 169.0801161 165.97773 165.977729
2 169.080116 172.1825 173.7336973 161.32415 161.324147
2 170.63131 181.48967 158.22176 167.52892 150.465791
3 167.528922 172.1825 169.0801161 176.83608 183.04086
3 170.63131 179.93847 170.6313098 181.48967 184.592053
3 161.324147 176.83608 164.4265349 178.38728 152.016985
4 172.182504 167.52892 173.7336973 170.63131 167.528922
4 170.63131 164.42653 173.7336973 176.83608 183.04086
4 162.875341 156.67057 167.5289224 169.08012 162.875341
5 178.387278 183.04086 187.6944408 186.14325 179.938472
5 139.607435 147.3634 152.0169851 155.11937 173.733697
5 162.875341 156.67057 181.4896659 165.97773 152.016985
6 159.772954 167.52892 173.7336973 145.81221 161.324147
6 162.875341 169.08012 176.8360848 176.83608 183.04086
6 156.670566 164.42653 167.5289224 156.67057 148.914598
12 150.465791 145.81221 173.7336973 181.48967 139.607435
12 147.363404 150.46579 162.8753412 167.52892 155.119373
12 142.709823 139.60744 170.6313098 145.81221 136.505048
24 111.685948 122.5443 116.3395294 89.969236 94.6228173
24 108.583561 113.23714 141.1586291 77.559686 105.481173
24 105.481173 116.33953 131.8514667 94.622817 85.3156549

205
Appendix Q Daphnia magna Respiration Data (Atrazine)
Dissolved oxygen content (umol/L water)
Time Reference 0.1% DMSO 5 µg/L Atrazine 50 µg/L Atrazine
100 µg/L Atrazine
0 258.0811 263.2119 255.5156 263.2119 256.0287
0 261.6727 262.6988 263.2119 256.5418 260.6465
0 257.568 257.568 261.1596 262.1857 258.5942
2 205.2335 214.469 196.511 195.4849 188.8148
2 207.2858 203.6942 210.3643 189.3279 189.8409
2 202.155 206.7727 214.982 211.9035 179.0662
4 187.7886 189.8409 161.1083 160.5952 147.255
4 184.197 174.4484 178.5531 158.5428 158.0298
4 180.0924 180.6054 191.8933 195.4849 132.8887
6 164.6998 169.3176 129.8102 133.4017 111.8522
6 161.6213 152.8989 153.412 126.2186 106.7214
6 157.5167 158.0298 172.3961 142.6372 83.11955
10 104.156 109.7999 73.37096 68.75321 45.15136
10 109.2868 99.53822 102.6167 54.38687 56.4392
10 101.5906 99.02514 135.4541 95.43356 24.11493
24 11.80092 13.34017 7.696254 3.078502 1.539251
24 12.82709 8.722422 22.0626 1.539251 9.235505
24 9.748589 12.31401 9.235505 16.93176 1.026167

206
Appendix R Hyalella azteca Respiration Data (TBT)
Time Dissolved Oxygen Content (umol/L)
Reference DMSO 10 µg/L TBT 50 µg/L TBT 100 µg/L TBT
0 181.4897 179.9385 184.5921 176.8361 189.2456
0 179.9385 181.4897 189.2456 186.1432 184.5921
0 187.6944 186.1432 183.0409 189.2456 189.2456
2 173.7337 178.3873 172.1825 162.8753 165.9777
2 173.7337 179.9385 175.2849 170.6313 178.3873
2 186.1432 170.6313 159.773 170.6313 155.1194
4 159.773 147.3634 145.8122 142.7098 159.773
4 162.8753 165.9777 161.3241 153.5682 155.1194
4 164.4265 162.8753 158.2218 148.9146 147.3634
6 152.017 147.3634 158.2218 145.8122 142.7098
6 147.3634 144.261 162.8753 147.3634 139.6074
6 152.017 159.773 164.4265 142.7098 136.505
10 139.6074 147.3634 152.017 133.4027 105.4812
10 155.1194 148.9146 159.773 128.7491 116.3395
10 144.261 156.6706 156.6706 134.9539 110.1348
24 93.07162 103.93 127.1979 74.4573 43.43342
24 116.3395 110.1348 134.9539 85.31565 55.84297
24 100.8276 111.6859 139.6074 100.8276 71.35491

207
Appendix S Hyalella azteca Respiration Data (Atrazine)
Dissolved Oxygen Content (umol/L)
Time Reference 0.1% DMSO 5 µg/L Atrazine
50 µg/L Atrazine
100 µg/L Atrazine
0 249.4493 248.8987 249.4493 250 243.9427
0 247.2467 248.348 250 248.8987 247.2467
0 249.4493 252.7533 248.348 249.4493 249.4493
2 227.9736 216.9604 219.7137 198.2379 193.2819
2 213.1057 222.467 221.3656 203.1938 202.0925
2 216.4097 224.6696 218.6123 205.3965 213.6564
4 192.1806 192.7313 191.63 164.6476 146.4758
4 185.022 192.1806 194.3833 166.2996 162.9956
4 183.9207 196.0352 196.0352 174.0088 169.6035
6 170.1542 160.2423 165.1982 127.7533 116.7401
6 153.0837 171.2555 181.1674 142.6211 129.9559
6 155.837 166.8502 179.5154 150.3304 136.5639
10 129.9559 115.6388 128.8546 75.44053 61.67401
10 117.2907 133.8106 147.5771 96.36564 77.64317
10 107.9295 142.0705 148.6784 117.8414 101.3216
24 24.77974 6.057269 18.17181 9.911894 2.753304
24 16.51982 20.92511 84.2511 8.259912 1.101322
24 20.37445 38.54626 45.15419 5.506608 1.101322

208
Appendix T Lumbriculus variegatus Respiration Data (TBT)
Dissolved Oxygen Content (umol/L)
Time Reference 0.1% DMSO 10 µg/L TBT 50 µg/L TBT 100 µg/L TBT
0 206.3088 204.7576 201.6552 209.4112 193.8992
0 209.4112 203.2064 209.4112 221.8207 214.0647
0 220.2695 218.7183 220.2695 198.5528 200.104
1 201.6552 198.5528 193.8992 201.6552 192.348
1 206.3088 214.0647 200.104 212.5135 201.6552
1 209.4112 212.5135 212.5135 215.6159 206.3088
2 201.6552 197.0016 206.3088 207.86 190.7968
2 207.86 197.0016 212.5135 210.9623 189.2456
2 212.5135 198.5528 204.7576 186.1432 197.0016
3 186.1432 183.0409 195.4504 206.3088 189.2456
3 189.2456 190.7968 187.6944 187.6944 189.2456
3 183.0409 189.2456 200.104 193.8992 181.4897
4 169.0801 200.104 193.8992 181.4897 214.0647
4 190.7968 206.3088 183.0409 173.7337 212.5135
4 206.3088 201.6552 175.2849 178.3873 189.2456
5 189.2456 197.0016 200.104 165.9777 203.2064
5 214.0647 204.7576 189.2456 214.0647 187.6944
5 190.7968 198.5528 206.3088 179.9385 206.3088
6 221.8207 198.5528 210.9623 228.0255 214.0647
6 204.7576 203.2064 189.2456 175.2849 223.3719
6 198.5528 198.5528 198.5528 200.104 212.5135
12 190.7968 189.2456 209.4112 212.5135 206.3088
12 195.4504 190.7968 193.8992 206.3088 212.5135
12 198.5528 204.7576 207.86 209.4112 203.2064
24 176.8361 173.7337 169.0801 161.3241 181.4897
24 175.2849 179.9385 172.1825 181.4897 173.7337
24 179.9385 183.0409 179.9385 179.9385 179.9385

209
Appendix U Lumbriculus variegatus Respiration Data (Atrazine)
Dissolved Oxygen Content (umol/L)
Time Reference 0.1% DMSO 5 µg/L 50 µg/L 100 µg/L
0 254.9651 261.4063 254.9651 257.649 256.5754
0 253.8916 256.0386 254.4283 255.5019 257.1122
0 256.5754 256.5754 257.649 259.796 260.3328
2 223.8325 224.9061 213.6339 214.7075 198.0676
2 221.6855 222.759 212.5604 197.5309 200.2147
2 228.6634 214.7075 218.4648 221.1487 202.3618
4 207.7295 192.6999 174.4498 177.1337 172.3027
4 193.7735 191.6264 186.2587 174.4498 166.9351
4 206.6559 184.6484 180.3543 178.744 183.5749
6 184.1116 169.6189 147.6114 155.1261 140.6334
6 154.0526 168.0086 157.81 127.7509 138.4863
6 180.3543 148.6849 155.6629 150.2952 163.7144
10 142.2437 130.4348 92.86098 127.2142 92.86098
10 113.795 128.8245 104.1331 71.39023 92.32421
10 156.7364 92.86098 105.7434 135.2657 119.1626
24 34.88996 30.59581 23.61782 27.3752 8.05153
24 25.22813 27.91197 18.7869 17.71337 11.80891
24 39.18411 27.3752 27.3752 23.08105 12.34568

210
Appendix V Biomass of Test Organisms
Daphnia magna
Weight (mg) 8 Daphnia Weight (mg) 15 Daphnia
Replicate 1 21.92 51.375
Replicate 2 24.88 58.3125
Replicate 3 20.08 47.0625
Replicate 4 20 46.875
Replicate 5 19.76 46.3125
Replicate 6 22.96 53.8125
Replicate 7 21.28 49.875
Average 21.55428571 50.51785714
Hyalella azteca
Weight (mg) 3 Hyalella azteca Weight (mg) 8 Hyalella azteca
Replicate 1 23.475 62.6
Replicate 2 27.45 73.2
Replicate 3 25.8 68.8
Replicate 4 23.925 63.8
Replicate 5 24.525 65.4
Average 25.035 66.76
Lumbriculus variegatus
Weight (mg) 10 worms Weight (mg) 20 worms
Replicate 1 84.9 178.29
Replicate 2 90.6 167.61
Replicate 3 89.95 188.895
Replicate 4 79.5 178.875
Replicate 5 93 176.7
Average 87.59 178.074

211

212
.

213