Sub-National Revenue Mobilization in Latin America and Caribbean Countries: The Case of Venezuela
74
econstor www.econstor.eu Der Open-Access-Publikationsserver der ZBW – Leibniz-Informationszentrum Wirtschaft The Open Access Publication Server of the ZBW – Leibniz Information Centre for Economics Standard-Nutzungsbedingungen: Die Dokumente auf EconStor dürfen zu eigenen wissenschaftlichen Zwecken und zum Privatgebrauch gespeichert und kopiert werden. Sie dürfen die Dokumente nicht für öffentliche oder kommerzielle Zwecke vervielfältigen, öffentlich ausstellen, öffentlich zugänglich machen, vertreiben oder anderweitig nutzen. Sofern die Verfasser die Dokumente unter Open-Content-Lizenzen (insbesondere CC-Lizenzen) zur Verfügung gestellt haben sollten, gelten abweichend von diesen Nutzungsbedingungen die in der dort genannten Lizenz gewährten Nutzungsrechte. Terms of use: Documents in EconStor may be saved and copied for your personal and scholarly purposes. You are not to copy documents for public or commercial purposes, to exhibit the documents publicly, to make them publicly available on the internet, or to distribute or otherwise use the documents in public. If the documents have been made available under an Open Content Licence (especially Creative Commons Licences), you may exercise further usage rights as specified in the indicated licence. zbw Leibniz-Informationszentrum Wirtschaft Leibniz Information Centre for Economics Rios, German; Ortega, Federico; Scrofina, J. Sebastian Working Paper Sub-national Revenue Mobilization in Latin America and Caribbean Countries: The Case of Venezuela IDB Working Paper Series, No. IDB-WP-300 Provided in Cooperation with: Inter-American Development Bank, Washington, DC Suggested Citation: Rios, German; Ortega, Federico; Scrofina, J. Sebastian (2012) : Sub- national Revenue Mobilization in Latin America and Caribbean Countries: The Case of Venezuela, IDB Working Paper Series, No. IDB-WP-300 This Version is available at: http://hdl.handle.net/10419/89021
-
Upload
independent -
Category
Documents
-
view
4 -
download
0
Transcript of Sub-National Revenue Mobilization in Latin America and Caribbean Countries: The Case of Venezuela

econstor www.econstor.eu
Der Open-Access-Publikationsserver der ZBW – Leibniz-Informationszentrum WirtschaftThe Open Access Publication Server of the ZBW – Leibniz Information Centre for Economics
Standard-Nutzungsbedingungen:
Die Dokumente auf EconStor dürfen zu eigenen wissenschaftlichenZwecken und zum Privatgebrauch gespeichert und kopiert werden.
Sie dürfen die Dokumente nicht für öffentliche oder kommerzielleZwecke vervielfältigen, öffentlich ausstellen, öffentlich zugänglichmachen, vertreiben oder anderweitig nutzen.
Sofern die Verfasser die Dokumente unter Open-Content-Lizenzen(insbesondere CC-Lizenzen) zur Verfügung gestellt haben sollten,gelten abweichend von diesen Nutzungsbedingungen die in der dortgenannten Lizenz gewährten Nutzungsrechte.
Terms of use:
Documents in EconStor may be saved and copied for yourpersonal and scholarly purposes.
You are not to copy documents for public or commercialpurposes, to exhibit the documents publicly, to make thempublicly available on the internet, or to distribute or otherwiseuse the documents in public.
If the documents have been made available under an OpenContent Licence (especially Creative Commons Licences), youmay exercise further usage rights as specified in the indicatedlicence.
zbw Leibniz-Informationszentrum WirtschaftLeibniz Information Centre for Economics
Rios, German; Ortega, Federico; Scrofina, J. Sebastian
Working Paper
Sub-national Revenue Mobilization in Latin Americaand Caribbean Countries: The Case of Venezuela
IDB Working Paper Series, No. IDB-WP-300
Provided in Cooperation with:Inter-American Development Bank, Washington, DC
Suggested Citation: Rios, German; Ortega, Federico; Scrofina, J. Sebastian (2012) : Sub-national Revenue Mobilization in Latin America and Caribbean Countries: The Case ofVenezuela, IDB Working Paper Series, No. IDB-WP-300
This Version is available at:http://hdl.handle.net/10419/89021

Sub-national Revenue Mobilization in Latin America and Caribbean Countries:
The Case of Venezuela
Germán Ríos Federico Ortega J. Sebastián Scrofina
Department of Research and Chief Economist
IDB-WP-300IDB WORKING PAPER SERIES No.
Inter-American Development Bank
August 2012

Sub-national Revenue Mobilization in Latin America and Caribbean
Countries:
The Case of Venezuela
Germán Ríos* Federico Ortega**
J. Sebastián Scrofina***
* Universidad Católica Andrés Bello (UCAB) ** Sucre Municipality
*** Instituto de Estudios Superiores de Administración (IESA)
2012
Inter-American Development Bank

http://www.iadb.org Documents published in the IDB working paper series are of the highest academic and editorial quality. All have been peer reviewed by recognized experts in their field and professionally edited. The information and opinions presented in these publications are entirely those of the author(s), and no endorsement by the Inter-American Development Bank, its Board of Executive Directors, or the countries they represent is expressed or implied. This paper may be reproduced with prior written consent of the author.
Corresponding author: Germán Ríos (email: [email protected])
Cataloging-in-Publication data provided by the Inter-American Development Bank Felipe Herrera Library Ríos, Germán. Sub-national revenue mobilization in Latin America and Caribbean countries : The case of Venezuela / Germán Ríos, Federico Ortega, J. Sebastián Scrofina. p. cm. (IDB working paper series ; 300) Includes bibliographical references. 1. Local taxation—Venezuela—Case studies. 2. Revenue—Venezuela—Case studies. 2. Finance, Public—Venezuela—Case studies. I. Ortega, Federico. II. Scrofina, J. Sebastián. III. Inter-American Development Bank. Research Dept. IV. Title. V. Series. IDB-WP-300

Abstract1
This paper analyzes the high fiscal dependence of Venezuelan states and municipalities on the central government and the political economy process embedded in the interaction between the central government and sub-national entities. Also explored is whether there is scope to increase sub-national governments’ revenues, improve the current intergovernmental transfer system, and reduce horizontal imbalances; of particular importance is analyzing the impact of current transfer mechanisms on sub-national governments’ revenues volatility. Following a presentation of Venezuela’s economic background, public sector and fiscal variables, the paper describes the process of decentralization, inter-governmental transfer mechanisms and revenue volatility, and local governments’ own revenues. Subsequently presented are sub-national governments’ fiscal dependence and its determinants, followed by options for revenue mobilization and improving the transfer mechanism. The paper concludes with a summary and policy recommendations. JEL classifications: H70, H72, H77 Keywords: Sub-national revenues, Intergovernmental transfers, Decentralization, Fiscal dependence, Revenue mobilization
1 The authors gratefully acknowledge comments on previous drafts from Teresa Ter-Minassian, Eduardo Lora, Ernesto Stein, Rafael de la Cruz, Rolando Ossowski, Giorgio Brosio and participants in IDB seminars. We would like to acknowledge excellent research assistance provided by Ricardo Suárez, Amanda Beaujon and Anderson Gómez. This paper was undertaken as part of the Latin American and Caribbean Research Network project “The Future of Taxation in Latin America and the Caribbean.”

2
1. Introduction
The recent increase in oil prices to historical levels and their subsequent drop as a result of the
international financial crises have once more demonstrated the need for fiscal and
macroeconomic policies to reduce the volatility in hydrocarbon exporting countries. As in the
1970s when oil prices quadrupled, the external shock was perceived to be permanent by many oil
economies, which did not implement any measures to mitigate the risk of a further negative
external shock. Venezuela did not escape this pattern.
In fact, volatility has been the main feature in Venezuela’s main macroeconomic
variables, mainly due to the country’s high reliance on oil. From having a high growth rate and a
low inflation during the 1950s and the 1960s, Venezuela turned into a country with a relatively
low growth rate and moderate inflation levels starting in the 1970s. However, what attracts
particular attention is the variability in the macroeconomic performance of the country, as well
as how oil price volatility has affected the rest of the economy.
The volatility of fiscal revenues clearly affects sub-national finances. Given that around
70 percent of sub-national revenues come from transfers from the central government, local
authorities face problems that are similar to those of their central policymaker counterparts. As a
matter of fact, one of the main sources of financing for governors and mayors is the Situado
Constitutional, which is a transfer of 20 percent of ordinary fiscal revenues from the central
government, and is closely linked to highly volatile oil fiscal revenues. For this reason, it is
important in the case of Venezuela to study the fiscal dependence of local governments, which is
defined as the proportion of revenues that is received from the central government. In addition,
since several states and municipalities have spending responsibilities, mainly in education and
health services, that were transferred from the central government with no clear funding
mechanisms, the volatility of revenues makes it very difficult to provide reliable and efficient
public services. To work on improving current taxes and fees, and implementing new ones, could
mitigate this situation by providing local governments with a higher degree of fiscal
independence.
One important characteristic of the Venezuelan economy is the low level of non-oil
taxation. In 2009 non-oil taxes reached 14 percent of GDP, while the average for Latin America
is around 17 percent, and some countries such as Brazil and Argentina have tax burdens above
30 percent of GDP. This could be viewed as an opportunity because there is room to increase

3
sub-national governments’ resources through taxation. This will contribute to reducing revenue
volatility for states and municipalities brought about by their dependence on transfers from the
central government, which in turn show large fluctuations due to their reliance on oil revenues.
This could also help to improve accountability, because citizens will pay more taxes at the sub-
national level and require better public services from local authorities. As a result, these efforts
could increase the overall non-oil tax ratio and reduce dependence on oil revenues and its
impacts on the economy.
The process of decentralization in Venezuela can be viewed as a political response to the
loss of legitimacy of the political system. The weakening of an economic system based almost
exclusively on the distribution of the oil revenues, and the lack of representativeness of
traditional political parties paved the way for an increased role by local governments. Although
unintended, the activation of the federal system in Venezuela with the direct election of
governors and the creation of mayors in 1989 was instrumental in the reshaping of political
institutions, principally political parties, in Venezuela. Even after the 1999 Constitution was
approved, which in many ways increased the central government’s powers, the main political
features of the decentralization process remained basically unchanged.
Indeed, the increased political competition brought about by the possibilities of re-
election of local authorities, the changes of electoral rules for electing national legislators, and
the decentralization process that followed, all played an important role in the collapse of the
traditional party system. Before the decentralization, the party system was very centralized, and
parties controlled almost all levels of government and key posts in the public administration.
Once the oil rent distribution system collapsed in the mid-1980s, it was increasingly difficult for
parties to maintain their grip on the main political institutions, and civil society pressures brought
about several political reforms, which included the above-mentioned direct election of governors
and the creation of mayors. This allowed several regional leaders to emerge, undermining and
eventually weakening the bipartisan system, which by that time had lost legitimacy.
However, a process of fiscal decentralization has not accompanied the political
decentralization. As mentioned before, the bulk of local governments’ resources comes from
central government mandatory legal transfers. As a matter of fact, most of the fiscal and
administrative responsibilities of states and municipalities have been rather limited. For the
period 1998-2007 only an average of 4 percent of states’ revenues came from their own sources,

4
while for municipalities almost 51 percent came from their own sources. However, there are
enormous differences among municipalities; while some can generate up to 98 percent of their
revenues, primarily those in cities with important industrial and commercial activities, rural
municipalities’ revenues depend almost exclusively on central government transfers.
Another key problem is the fiscal sustainability of public services transferred from the
central government to local administrations. Although the central government has transferred
resources previously included in the national budget, there are no operational criteria to
determine whether those resources are enough to maintain levels of efficient services. In recent
years there is evidence of a marked deterioration in public services transferred to the regions due
to lack of funding, mainly in the areas of health and education.
There are also restrictions on the way sub-national governments obtain their funds. By
law states cannot levy taxes and have no borrowing authority, therefore their budgets depend
almost entirely on transfers from the central government budget. The 1999 Constitution
establishes that states’ revenues can come from their assets and the administration of their goods,
proceeds for the use of their goods and services, fines and penalties, transfer from the Central
Government (Situado Constitucional), receipts from the sale of fiscal stamps, and resources
allocated by the FCI. 2 In the case of municipalities, the 1999 Constitution states that their
revenues can come from the same sources as those of states, but they have some limited tax
authority on urban property and industrial and commercial activities. There are, however, legal
and institutional difficulties to collecting some of these taxes, such as inadequate local
ordinances and outdated cadastres, as well as very important differences in municipalities’ ability
to collect them. These differences have also contributed to increase disparities in the scope and
quality of goods and services offered by municipalities.
More recently, a recentralization trend has emerged. The central government has retaken
the operations of ports and airports, which were previously decentralized, changed laws to
redirect smaller transfer funds like FIDES and LAEE3 to politically influenced authorities, and
diminished the role of the local police. Moreover, recently approved legislation was approved to 2 Fondo de Compensación Interterritorial (FCI): a fund administered by the Consejo Federal de Gobierno (Federal Government Council), used mainly to finance investment initiatives executed by sub-national governments (SNGs). 3 Fondo Intergubernamental para la Descentralización (FIDES) is funded by 15 percent of VAT revenues. It is distributed as follow: 42 percent to states, 28 percent to municipalities and 30 percent to communal councils. Sub-national governments must apply to obtain funding by presenting investment projects. The Ley de Asignaciones Económicas Especiales (LAEE) is funded by 25 percent of tax revenues, after deduction of the amount of Situado Constitucional. It is distributed in the same way as the FIDES.
5
create communes that could undermine the autonomy and authority of states and municipalities.
In addition, due to the reduction of oil prices, increasing off-budget expenditures, and
underestimation of fiscal revenues, central government transfers to the regions have declined,
making the delivery of public services at the local level more difficult.
The main mechanism to underestimate fiscal revenues is to forecast an oil prices well
below market expectations. In this way, ordinary fiscal revenues are underestimated and
therefore mandatory transfers are below of what they should be otherwise. If oil prices are above
what is forecast in the budget, which is the case most of the time, the government transfers most
of the excess revenues to several off-budget funds, bypassing the transfer mechanisms.
Moreover, there is no timeframe to transfer the remaining additional resources, which introduces
even more uncertainty into sub-national finances.
This paper analyzes the large fiscal dependence of states and municipalities in Venezuela
caused by the manner they receive their funding, and the political economy process embedded in
the interaction between the central government and sub-national entities. It also explores whether
there is scope for sub-national governments to increase revenues, improve the current inter-
governmental transfer system and reduce horizontal imbalances. Of particular importance is
analyzing the impact of sub-national governments’ revenues volatility due to the current transfer
mechanisms (Situado Constitucional).
The paper is organized as follows. Section 2 provides the economic background of
Venezuela and describes the public sector and the fiscal variables. Section 3 describes the
process of decentralization in Venezuela, and Section 4 presents intergovernmental transfer
mechanisms and revenue volatility. Section 5 describes local governments’ own revenues, while
Section 6 presents the fiscal dependence of sub-national revenues and its determinants. Section 7
explores options for revenue mobilization and for improving the transfer mechanism, and
Section 8 offers conclusions and recommendations.
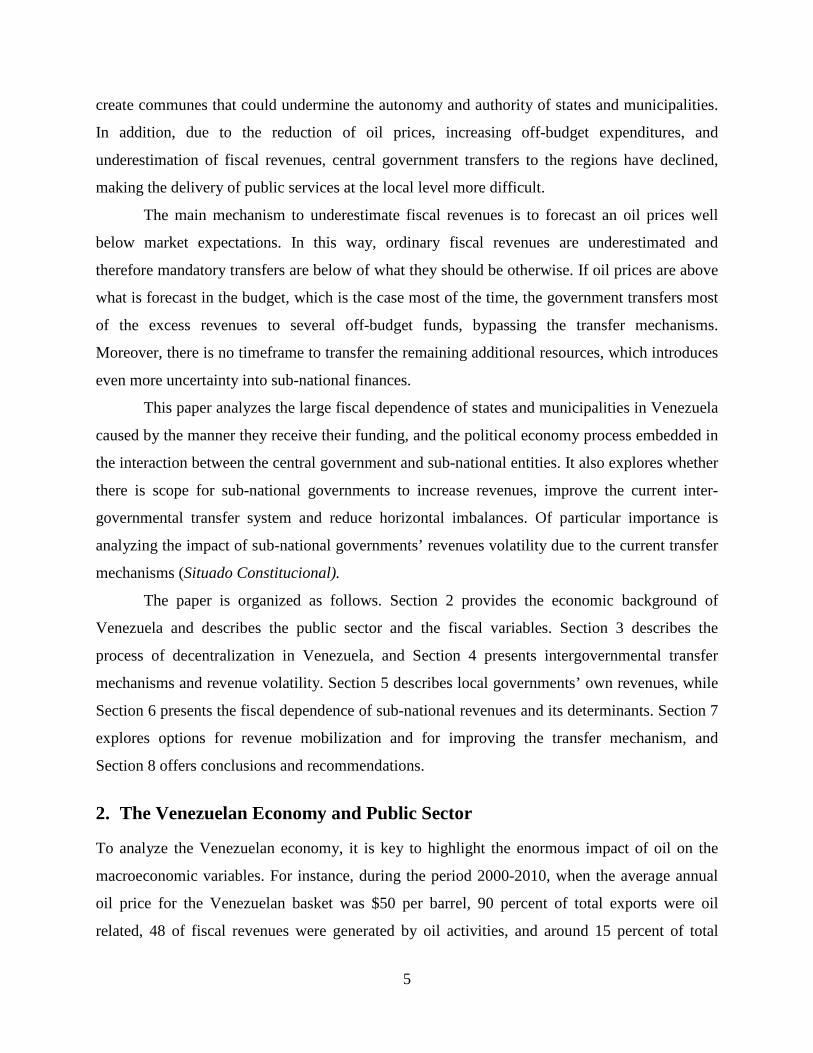
2. The Venezuelan Economy and Public Sector To analyze the Venezuelan economy, it is key to highlight the enormous impact of oil on the
macroeconomic variables. For instance, during the period 2000-2010, when the average annual
oil price for the Venezuelan basket was $50 per barrel, 90 percent of total exports were oil
related, 48 of fiscal revenues were generated by oil activities, and around 15 percent of total

6
GDP came from the production of oil and related products. Table 1 shows the impact of oil
exploitation on the fiscal, external and real sectors for several periods of Venezuela’s economic
history.
Table 1. Impact of Oil Indicator (average) 1970-1979 1980-1989 1990-1999 2000-2010
Oil fiscal revenues / GDP* 15.1 13.2 11.4 11.6
Oil fiscal revenues/ total fiscal revenues* 70.1 60.7 59.0 47.6
Oil exports/ total exports 87.4 82.2 71.1 90.0
Oil exports / GDP 23.0 21.2 20.5 25.9
Oil GDP/ GDP 30.0 14.9 17.1 15.1 Sources: Central Bank of Venezuela and Ministry of Economy and Finance. * Available until 2009.
The volatility of oil prices has had significant negative effects on the Venezuelan
economy, making the work of policymakers extremely difficult. In addition, the country has not
made sufficient efforts to implement effective stabilization mechanisms. Therefore, when the oil
price is above its historical mean, in general, economic growth accelerates, the fiscal balance is
positive, and the current account has a surplus. The contrary often happens when the oil price is
below its historical average. These boom and bust cycles cause major distortions in the economy
and make public and private planning a daunting task. To address this problem, in 1998 a
macroeconomic stabilization fund was created; however, the rules of the fund were changed
several times to try to solve short-term fiscal problems, undermining the credibility and
effectiveness of the mechanism.
Table 2 shows that the negative economic impacts of oil in the economy started in the
1980s. From the 1950s to the 1970s Venezuela was characterized by fast economic growth, low
inflation and sound fiscal and external accounts. Nevertheless, after the oil boom of the 1970s
economic growth begun to slow down and became very volatile, inflation rose to double digits,
and both the fiscal and external balances deteriorated. Moreover, unemployment and the
exchange rate started to show instability never seen before. The main reasons for these radical
changes were the oil shocks experienced by Venezuela during the 1970s (positive) and 1980s

7
(negative). Policymakers were not well equipped to deal with volatility, and the economic
policies that worked well during the years of stability were clearly inadequate for more turbulent
times. In 1989, an ambitious stabilization and structural economic program was implemented,
but it faced strong opposition and was abandoned shortly after implementation.
Table 2. Main Macroeconomic Indicators
Indicator (average) 1951 1960
1961 1970
1971 1980
1981 1990
1991 2000
2001 2010
Real GDP Growth (%) 7.9 6.0 4.2 0.7 2.1 3.9
Consumer Price Index (%) 1.9 1.0 8.5 25.0 44.8 23.0 Current Account Balance (as a percentage of GDP) -0.7 2.6 2.0 1.9 2.9 9.8
Fiscal Balance of the Central Government (as a percentage of GDP)*
n.a. 0.2 1.2 -1.3 -1.7 4.8
Venezuelan Oil basket Price (USD) 13.3 9.4 28.1 21.5 16.8 50.0
Oil Exports (per capita (USD of 1995) 1,425 1,006 1,482 983 674 1,301
Sources: Central Bank of Venezuela, Ministry of Economy and Finance. * Available until 2009.
On the other hand, and notwithstanding the important efforts made by the tax
administration (SENIAT) in recent years, non-oil revenue as a percentage of GDP is lower
compared with international standards, and when oil prices are below their historical average,
financing needs by the public sector generally increase, leading to higher internal and external
indebtedness levels. Moreover, in times of fiscal stress, the devaluation of the exchange rate has
been often used as a policy measure to generate additional revenues, causing strong inflationary
pressures.
2.1 The Public Sector Although Venezuela is a federation, because oil revenues are administrated directly by the
central government, the fiscal dependence of sub-national governments is rather substantial.
Table 3 shows the structure of budgeted expenditures by type of government and highlights the
importance of transfers. In 2009, while the central government represented 94 percent of total

8
budgeted expenses, states and municipalities accounted for 1 percent and 5 percent, respectively.
However, when transfers from the central government to sub-national governments are taken
into account, the central government represents 71 percent of the total, and local governments
increase their share to 29 percent.
Table 3. General Government Expenditures Structure (USD Billion)4 1999 % Total % GDP 2009 % Total % GDP
Public Sector 19.1 100% 20% 74.9 100% 23%
Central Government 17.7 92% 18% 70.5 94% 22%
States 0.4 2% 1% 1.0 1% 0%
Municipalities 1.1 6% 1% 3.4 5% 1% After Transfers
Central Government 12.4 65% 13% 52.9 71% 16%
States 4.7 25% 5% 15.4 21% 5%
Municipalities 2.0 10% 2% 6.6 9% 2% Source: ONAPRE.
2.1.1 Central Government
Table 4 shows the composition of the central government’s revenues. Oil revenues are comprised
of income tax paid by the state oil company PDVSA, royalties, and dividends paid by PDVSA;
those revenues were equivalent to 21.6 percent of GDP in 2009. Non-oil revenues consist of
taxes and non-tax revenues. Tax revenues are divided between indirect taxes (mainly VAT and
trade taxes) and direct taxes (personal and corporate income tax). As mentioned above, a salient
characteristic of the Venezuelan economy is the very low level of non-oil taxation.
4 Public enterprises are not included.
9
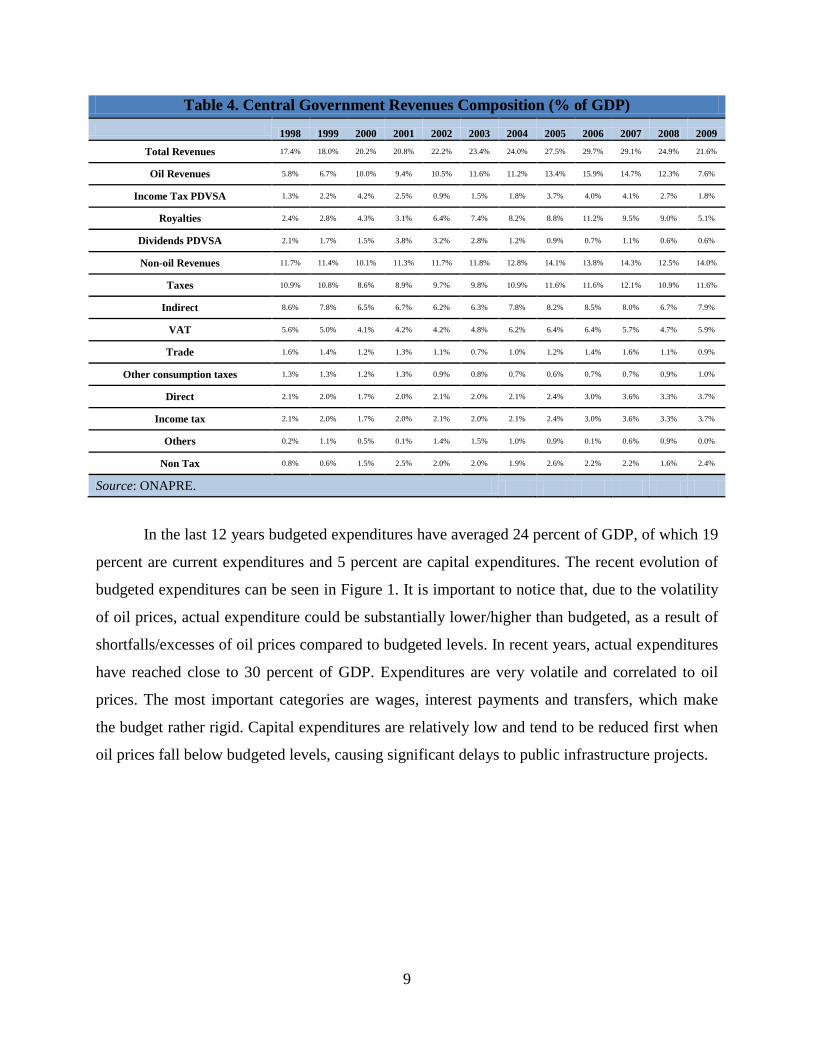
Table 4. Central Government Revenues Composition (% of GDP) 1998 1999 2000 2001 2002 2003 2004 2005 2006 2007 2008 2009
Total Revenues 17.4% 18.0% 20.2% 20.8% 22.2% 23.4% 24.0% 27.5% 29.7% 29.1% 24.9% 21.6%
Oil Revenues 5.8% 6.7% 10.0% 9.4% 10.5% 11.6% 11.2% 13.4% 15.9% 14.7% 12.3% 7.6%
Income Tax PDVSA 1.3% 2.2% 4.2% 2.5% 0.9% 1.5% 1.8% 3.7% 4.0% 4.1% 2.7% 1.8%
Royalties 2.4% 2.8% 4.3% 3.1% 6.4% 7.4% 8.2% 8.8% 11.2% 9.5% 9.0% 5.1%
Dividends PDVSA 2.1% 1.7% 1.5% 3.8% 3.2% 2.8% 1.2% 0.9% 0.7% 1.1% 0.6% 0.6%
Non-oil Revenues 11.7% 11.4% 10.1% 11.3% 11.7% 11.8% 12.8% 14.1% 13.8% 14.3% 12.5% 14.0%
Taxes 10.9% 10.8% 8.6% 8.9% 9.7% 9.8% 10.9% 11.6% 11.6% 12.1% 10.9% 11.6%
Indirect 8.6% 7.8% 6.5% 6.7% 6.2% 6.3% 7.8% 8.2% 8.5% 8.0% 6.7% 7.9%
VAT 5.6% 5.0% 4.1% 4.2% 4.2% 4.8% 6.2% 6.4% 6.4% 5.7% 4.7% 5.9%
Trade 1.6% 1.4% 1.2% 1.3% 1.1% 0.7% 1.0% 1.2% 1.4% 1.6% 1.1% 0.9%
Other consumption taxes 1.3% 1.3% 1.2% 1.3% 0.9% 0.8% 0.7% 0.6% 0.7% 0.7% 0.9% 1.0%
Direct 2.1% 2.0% 1.7% 2.0% 2.1% 2.0% 2.1% 2.4% 3.0% 3.6% 3.3% 3.7%
Income tax 2.1% 2.0% 1.7% 2.0% 2.1% 2.0% 2.1% 2.4% 3.0% 3.6% 3.3% 3.7%
Others 0.2% 1.1% 0.5% 0.1% 1.4% 1.5% 1.0% 0.9% 0.1% 0.6% 0.9% 0.0%
Non Tax 0.8% 0.6% 1.5% 2.5% 2.0% 2.0% 1.9% 2.6% 2.2% 2.2% 1.6% 2.4%
Source: ONAPRE.
In the last 12 years budgeted expenditures have averaged 24 percent of GDP, of which 19
percent are current expenditures and 5 percent are capital expenditures. The recent evolution of
budgeted expenditures can be seen in Figure 1. It is important to notice that, due to the volatility
of oil prices, actual expenditure could be substantially lower/higher than budgeted, as a result of
shortfalls/excesses of oil prices compared to budgeted levels. In recent years, actual expenditures
have reached close to 30 percent of GDP. Expenditures are very volatile and correlated to oil
prices. The most important categories are wages, interest payments and transfers, which make
the budget rather rigid. Capital expenditures are relatively low and tend to be reduced first when
oil prices fall below budgeted levels, causing significant delays to public infrastructure projects.

10
Despite the recent increase in oil prices, Venezuela has registered significant fiscal
deficits, which have caused an increase in the public debt/GDP ratio. This indicator declined in
the period 2003-2008, but increased in the period 2008-2010 (see Figure 2). Most of the increase
(80 percent) is due to the national oil company PDVSA. This reflects recent changes in public
finance in Venezuela in which the government allocates a higher proportion of oil income to off-
budget funds (FONDEN, China fund, etc.), reducing the availability of funds by PDVSA, and in
turn increasing its financial needs. In addition, PDVSA has been undertaken several quasi-fiscal
activities such as social policies, which have reduced its financial room for maneuver. However,
overall debt service is less than 10 percent of total exports (5 percent for the Central
Government), and its maturity profile appears manageable in the near future. In addition,
prospects for oil prices and low international interest rates could contribute to fiscal
sustainability, in the absence of strong external shocks.
0%
5%
10%
15%
20%
25%
30%
35%
1998 1999 2000 2001 2002 2003 2004 2005 2006 2007 2008 2009
% G
DP
Source: ONAPRE.
Figure 1. Central Government Expenditures (% GDP) Current Expenditures Capital Expenditures

11
2.1.2 Sub-national Governments
By law, the states cannot levy taxes and have no borrowing authority, therefore their budgets
depend almost entirely on transfers from the central government budget. Table 5 shows that
transfers represented 91 percent of total revenues in 2010, while own revenues amounted to 9
percent (see Section 4 below for further details).
Table 5. Composition of States’ Revenues 2008-2010
2008 2009 2010 MM USD % Total MM USD % Total MM USD % Total
Total Transfers 13,276 95% 14,376 93% 6,078 91% Situado 8,801 63% 11,546 75% 4,617 69% LAEE 826 6% 963 6% 427 6% FIDES 813 6% 1,020 7% 618 9% Special Transfers 2,835 20% 847 6% 416 6% Own Revenues 638 5% 1,002 7% 623 9% Total 13,913 100% 15,378 100% 6,702 100% Source: ONAPRE.
0%
10%
20%
30%
40%
50%
60%
2003 2004 2005 2006 2007 2008 2009 2010
%GD
P
Source: MF, BCV, PDVSA and own calculations
Figure 2. Stock of Government Debt (% GDP)
Internal External

12
Municipalities can receive revenues from the same sources as states, but they have more
autonomy because they can tax industrial and commercial activities, as well as urban properties
and other assets. However, there are important disparities in tax bases and capacity to tax, mainly
between urban and rural municipalities. Table 6 shows that in 2010, transfers accounted for 36
percent of total revenues, while own revenues reached 61 percent (see Section 5 below for a
fuller description of these revenues).
Table 6. Composition of Municipalities’ Revenues 2008-2010
2008 2009 2010 MM
USD %
Total MM USD
% Total
MM USD
% Total
Ordinary Revenues 4,714 94% 6,467 98% 4,129 97% Transfers 2,392 48% 3,185 48% 1,550 36% Situado Municipal 1,601 32% 2,147 32% 976 23% LAEE 398 8% 507 8% 238 6% FIDES 380 8% 498 8% 314 7% Other Transfers 144 0% 33 0% 22 1% Own Revenues 2,323 46% 3,282 50% 2,579 61% Indirect Taxes 2,047 41% 2,720 41% 2,133 50% Non-tax Revenues 82 2% 181 3% 131 3% Sales of Goods and Services 3 0% 25 0% 4 0% Property Revenues 30 1% 42 1% 42 1% Other Ordinary Revenues 160 3% 314 5% 269 6% Extraordinary Revenues 558 6% 150 2% 131 3% Sales of Assets 29 1% 16 0% 15 0% Other Extraordinary Revenues 529 5% 134 2% 115 3% Total 5,273 100% 6,617 100% 4,260 100% Source: ONAPRE.
States’ expenditures are concentrated on health, education, social security, defense, urban
development and housing, and administration. In 2010, their total expenses reached 2.4 percent
of GDP (see Table 7).

13
Table 7. Composition of States’ Expenditures 2008-2010 2008 2009 2010
Millions USD
% Total
Millions USD
% Total
Millions USD
% Total
Total Expenses 13,913 100% 15,378 100% 11,239 100% Upper Management 2,505 18% 2,635 17% 893 8% Defense 1,351 10% 1,564 10% 564 5% Agriculture 99 1% 114 1% 42 0% Oil, Mines and Energy 10 0% 6 0% 0 0% Commerce and Industry 144 1% 121 1% 30 0% Tourism 67 0% 72 0% 21 0% Communications and Transport 355 3% 382 2% 139 1% Education 2,155 15% 2,453 16% 933 8% Culture 157 1% 163 1% 52 0% Science and Technology 18 0% 21 0% 4 0% Urban Development, Housing and 899 6% 1,356 9% 488 4% Health 1,792 13% 1,510 10% 610 5% Social Development 735 5% 843 5% 282 3% Social Security 1,541 11% 2,051 13% 891 8% Non-Classified Expenditures 2,084 15% 2,088 14% 669 6% Source: ONAPRE.
Social security, education, defense, social development, communications and transport,
urban development and housing, and administration are the most important municipal
expenditures. In 2010, total expenses reached 1.8 percent of GDP (see Table 8).

14
Table 8. Composition of Municipalities’ Expenditures 2008-2010 2008 2009 2010
Millions USD
% Total
Millions USD
% Total
Millions USD
% Total
Total Expenses 5,003 100% 6,617 100% 4,262 100% Upper Management 1,105 22% 1,514 23% 1,009 24% Defense 143 3% 222 3% 250 6% Agriculture 8 0% 8 0% 3 0% Oil, Mines and Energy 9 0% 12 0% 7 0% Commerce and Industry 15 0% 5 0% 2 0% Tourism 33 1% 34 1% 26 1% Communications and Transport 114 2% 103 2% 67 2%
Education 84 2% 115 2% 79 2% Culture 41 1% 49 1% 46 1% Science and Technology 2 0% 5 0% 2 0% Urban Development, Housing 1,730 35% 2,128 32% 1,231 29%
Health 74 1% 131 2% 81 2% Social Development 290 6% 287 4% 206 5% Social Security 489 10% 941 14% 475 11% Non-Classified Expenditures 864 17% 1,063 16% 778 18%
Source: ONAPRE.
3. The Decentralization Process in Venezuela
Beginning with its first constitution in 1811, Venezuela adopted a federal system of government
inspired by the United States’ Constitution. However, during most of the nineteenth century the
country was characterized by constant conflicts among regional leaders (caudillos), which
eventually resulted in a process of centralization in order to consolidate a national state. For most
of the first part of the twentieth century, several autocratic regimes, supported by the exploitation
of newly discovered oil, ruled the country. It was only in the second part of the 20th century that
democracy and its institutions started to develop, principally after the adoption of the 1961
constitution (Brewer-Carías, 2004).
The eventual exhaustion of the oil-revenues distribution model that had worked well
since the end of the last military dictatorship in 1958, under the political pact known as The

15
Punto Fijo Pact (El Pacto de Punto Fijo),5 made it vulnerable. The Pact experienced structural
change on February 18, 1983, 6 when a massive devaluation brought about by declining oil
revenues ended a long history of economic and political stability. Being unable to continue with
the traditional mechanisms of oil-revenues distribution, the political institutions that functioned
well under the Punto Fijo Pact collapsed, and mounting social pressures led to a revision of the
structure of the state.
In 1985 a commission to reform the State was created (Comisión para la Reforma del
Estado, known commonly as COPRE) including members of the major political parties and civil
society institutions (unions, business and professional associations and NGOs). One of the
principal conclusions of COPRE was that the legitimacy of democratic institutions was seriously
impaired by the obsolescence of the oil-revenues distribution model, and that it was paramount
to bridge the gap between citizens and the State by increasing the representativeness of
democracy. To this end, COPRE proposed several measures: i) the direct election of state
governors, who at the time were appointed by the President; ii) the creation of mayors as the
highest authority at the municipal level; iii) separation between the legislative and executive
branches of government at municipal councils; and iv) changing the electoral system to allow the
direct election of congressional and council representatives.
These revolutionary proposals were enacted into law between 1989 and 1993 with
considerable popular support and despite fierce opposition by the political establishment (De la
Cruz, 2004). It is important to highlight that the initial strategy for decentralization was
conceived in three gradual steps in the following order: political, administrative and fiscal
(Lalander, 2006).
In 1989, the Decentralization Law and Transfer of Responsibilities (known as Ley
Orgánica de Descentralización or LOD)7and the Municipal Law (known as Ley Orgánica de
Régimen Municipal) were approved. They covered the main provisions for the distribution of
responsibilities for public services delivery among the central government, the states and the
municipalities. In general, these laws assigned to the central government those responsibilities
5 “El Pacto de Punto Fijo” was a political pact between representatives of Venezuela’s three main political parties in 1958: AD, COPEI and URD, for the acceptance of the 1958 presidential elections, and the preservation of democracy. 6 This date is known in Venezuela’s history as Black Friday. 7 This law was formally known as Ley Orgánica De Descentralización, Delimitación Y Transferencia De Competencias Del Poder Público.

16
that were considered to have externalities (or considered “strategic” by the government), while
states and municipalities were given the responsibility of delivering basic local services.
According to the LOD, to request that a concurrent service8 such as education or health
be transferred to a state, the governor first had to obtain the state’s legislative approval, then the
central government would transfer the service following approval by the senate. This process
guaranteed that the transfers were thoroughly negotiated among key political actors. In fiscal
terms, the LOD stipulated that, with each concurrent or exclusive service transferred to the states
by the central government, the resources allocated in the national budget for that service would
also be transferred to the states. However, there were no operational provisions for the
calculations of these transfers, and they were very volatile because they depended on variable
fiscal revenues.
The LOD also stated that the central government could propose, with prior approval of
the senate, transfers of concurrent public service to the states. In the case of exclusive
responsibilities, states could request them, with previous authorization by the states’ legislative
assemblies. One problem of these laws was that they did not specify clearly which parts of the
services the different government levels should deliver. This led to confusion, asymmetries, and
the need for constant negotiations among the central government, the states and the
municipalities. However, the decentralization process took off. During the 1989-1993 period, the
first term for newly elected governors and mayors, 12 services came under concurrent
competency while states governments were granted eighteen exclusive competencies. By the end
of 1992, negotiations were taking place to transfer from the central government 83 concurrent
and thirty-two exclusive competencies (De la Cruz, 2004).
In 1993, in response to the shortcomings of the above-mentioned laws, several
coordination mechanisms were created to facilitate the decentralization process. To coordinate
public policies, the Territorial Council of Governments (Consejo Territorial de Gobierno) and
the Council of Governments of Caracas (Consejo de Gobierno del Area Metropolitana de
Caracas) were created. Also, an intergovernmental decentralization fund (FIDES) was formed
with the participation of all levels of government to finance projects of mutual interest. This fund
was mainly financed by a VAT co-sharing mechanism.
8 Concurrent services are those that are provided by more than one level of government (i.e., central and municipal). Typical examples are health and education. In contrast, exclusive services are provided by only one level of government.

17
After 1994 the decentralization process experienced a slowdown. Rafael Caldera was
elected president, supported by a myriad of small political parties. Caldera’s government did not
have a majority in Congress and little local representation, which resulted in the refusal of most
requests for transfer of responsibilities from the central government to states and municipalities.
In addition, transfers to the FIDES were reduced. During the presidency of Hugo Chávez,
decentralization suffered further setbacks with a new Constitution, drafted by a national
assembly and approved by popular vote in 1999. Although it maintained the notion of a
federation made up of the republic (federal government), 23 states, a capital district, and 335
municipalities, contains several articles that curtailed the autonomy of states and municipalities.
The Constitution of 1999 abolished the Senate, suppressing the equal representation of
the states in the legislature. In addition, the central government has the power to regulate public
services provided by states and municipalities. Another important change was the power of the
executive to shape local institutions such as legislative assemblies. Furthermore, several services
that were previously decentralized such as the administration of ports, airports and highways,
were recentralized. There are also pressures to recentralize services in the areas of health,
education and security. These policies seem to give preference to a process of de-concentration
directed from the central government, undermining the power of governors and mayors, and
giving more responsibilities to other civil society organizations such as communal councils.
(Delgado, 2008).
4. Transfers to Sub-national Governments Transfers from the central government are the main source of financing of local governments in
Venezuela. In 2010, budgeted 9 central government transfers totaled USD 7.550 million,
equivalent to 20.3 percent of the official budget10 and to 4.2 percent of GDP. Transfers are more
important for states than for municipalities. States receive 81 percent of total transfers, while
municipalities receive 19 percent, as shown in Table 9. While municipalities are the more
9 Throughout this paper we use state and municipal income data from the National Budget Office (ONAPRE). This data refers to budgeted income accumulated by ONAPRE yearly from all states and municipalities. Actual income could differ from budgeted income for a given local government in a given year, but changes are usually small. 10 We use the term “official budget” to refer to government expenditures included in the central government budget and additional credits, but excluding expenditures made through extra-budgetary investment funds. The amount of money and the investments made by these funds are not publicly available.

18
important legal entity in the Constitution,11 states receive much greater contributions from the
central government. However, as will be analyzed later, this is partly compensated by the fact
that municipalities have the autonomy to collect taxes.12
Table 9. Transfers to Local Governments 2010 Local Government States Municipalities Total Millions Bs.F. 26,256 6,208 32,464 Millions USD (official) 6,106 1,444 7,550 % Total Transfers 81% 19% 100% % Official Budget 16.5% 3.9% 20.4% % GDP 3.4% 0.8% 4.2% Source: ONAPRE, Finance Ministry, Central Bank.
A significant amount of transfers to sub-national governments can be expected in a
country where half of the government revenues are generated by oil, and there are strong
pressures to distribute those resources. However, the instability of oil prices, which makes
central government revenues very volatile, also transmits a high degree of volatility to local
governments’ revenues. This section aims to describe transfers, as they are defined in
Venezuelan legislation, and explores some of the implications of the transfer mechanisms,
including the impact of volatility.
4.1 Fixed Transfers
Fixed transfers are established in amount and percentage in the Constitution and other pieces of
legislation. There are basically two sources in Venezuela, the Situado Constitucional and the
FCI.
4.1.1 Situado Constitucional
The Situado Constitucional is defined13 as a maximum of 20 percent of ordinary revenues 14
included in the central government budget to be allocated to sub-national governments (SNGs).
11 Article 17 of the Constitution guarantees municipal autonomy, while Article 16 defines states only as political divisions of the territory. 12 Additionally to transfers to states and municipalities, in recent years the central government has transferred resources to communal councils to invest in community projects. However, there is no official data to allow us to measure the size of these contributions. 13 Article 167 of the Constitution.

19
Of the total, 80 percent is assigned to states, while municipalities receive 20 percent. The Situado
Constitucional is distributed among states and municipalities considering two criteria: equality
and population. Of the 80 percent destined for states, 30 percent is divided equally among all 23
states, while the remaining 70 percent is divided according to states’ population. Similarly, of the
20 percent destined for municipalities, 30 percent is divided in equal parts among all 335
municipalities, while the remaining 70 percent is divided on the basis of municipalities’
population.15
In practice, there are almost no restrictions to how the Situado Constitucional is spent by
SNGs. The Constitution stipulates that at least 50 percent of funds from the Situado
Constitucional have to be spent on capital investment, but this is not enforced. The Situado
Constitucional mainly finances current expenditures, mostly payroll, and is the most important
source of financing for all states and for most municipalities. Since 1989 it has represented an
average of 70 percent of state’s revenues. Table 10 shows the average distribution of state and
municipal transfers in 2010.
Table 10. Sub-National Government Transfers 2010
Transfer Concept % of State Transfers
% of State Revenues
% of Municipal Transfers
% of Municipal Revenues
Situado Constitucional 70.8 64.6 63.0 22.9 LAEE16 6.6 6.0 15.3 5.6 FIDES17 9.5 8.7 20.3 7.4 Special Transfers 7.3 6.7 1.4 0.5 Health Decentralization Transfers 3.4 3.1 - - Grants and Other Transfers 2.5 2.3 - - Source: ONAPRE.
The Situado Constitucional is also a source of political frictions between the central and
sub-national governments. Since it is calculated considering ordinary revenues in the national
budget, the size of the budget is a very important determinant of the amount of resources to be
14 Ordinary income excludes debt financing. 15 Article 167 of the Constitution. 16 Now part of the FCI. 17 Now part of the FCI.

20
transferred. Since the Constitution does not specify clearly what to do with windfall revenues,
the central government has consistently underestimated revenues in the budget, opening the
window for the discretionary use of the extra resources. As can be expected, governments
holding a parliamentary majority tend to have more leeway in this regard.
The main mechanism to underestimate fiscal revenues is to forecast oil prices well below
market expectations. In this way, ordinary fiscal revenues are underestimated and therefore
mandatory transfers are below what they would be otherwise. If oil prices are above what is
forecast in the budget, which is the case most of the time, the central government receives a
windfall. The extra resources have historically been used through additional credits that are
incorporated into the budget. However, in recent years some revenues have not even been added
to the budget, but gone straight to off-budget funds that are administered independently by the
central government.18 Most recently a law was approved stating that up to 95 percent of the
extraordinary resources are to be transferred to the National Development Fund (FONDEN), the
largest of these funds.19
4.1.2. Fondo de Compensación Interterritorial (Inter-territorial Compensation Fund The FCI, a fund administered by the Federal Government Council (CFG),20 is mainly intended to
finance investment initiatives executed by SNGs. Although envisaged in the 1999 Constitution,
this fund was only established in 2010 with the approval of a new Law of the Federal
Government Council. The FCI was officially formed in 2011.
The fund is financed from two sources. First and foremost is the FIDES,21 which receives
20 percent of the revenues generated by the Value Added Tax (IVA). Second is the LAEE,
which distributes 5 percent of revenues generated from oil taxes among the few oil-producing
states and municipalities (50 percent) and the many non-oil producing states and municipalities
(50 percent).
18 Rangel (2007) and Rachadel (2006) describe the creation of several such funds including the Social and Economic Development Fund (FONDESPA), the National Development Fund (FONDEN) and the PDVSA Social Fund. 19 The Extraordinary Oil Price Contribution Law was promulgated in May 2011. 20 Consejo Federal de Gobierno (CFG): a regional council chaired by the country’s Vice-president that includes all Governors and some representatives of Mayors. It was created in the 1999 Constitution to plan and coordinate regional policies. 21 FIDES was created in 1993 to secure political support for the creation of a Value Added Tax (IVA). All of its resources were to be spent on capital investment.

21
In 2011, the CFG decided to distribute the FCI funds in the following manner: 35 percent
for communal councils (consejos comunales), 37 percent for states and 28 percent for
municipalities. The 65 percent for states and municipalities is distributed considering population
and a relative development index (IDR) that takes into account poverty, human development,
and income per capita. Historically, FIDES and LAEE have represented close to 15 percent of
total revenues for states (see Table 10); however, as the FCI started distributing 35 percent of its
revenues to communal councils, this share is expected to decrease.
In order to receive resources from these funds, states, municipalities and communal
councils are required to present projects for approval to the CFG. Through this mechanism, the
CFG aims to guarantee that all projects are aligned with the national plan of the central
government, and that they have clear and measurable objectives. Complying with these
requirements is generally difficult for smaller municipalities and communal councils with weak
institutional capacity.
4.2. Discretionary Transfers Discretionary transfers are assigned by the central government to SNGs without a specific legal
mandate. Rather, these transfers come from agreements between ministries and SNGs to create
or expand national public policies with the support of SNGs.
Because of their nature, these transfers are evidently influenced by political dynamics.
Anecdotally, it is known that the government favors elected officials from its own party, working
with them to execute national programs and invest in marquee national projects in their
territories. However, the fact that most of these transfers are not planned in advance for them to
be included into SNGs budgets (but are later included as additional credits), make it difficult to
prove this statistically. 4.2.1. Transfers to Support National Plans These are transfers for national programs sometimes administered through local governments.
For example, in recent years some local governments have directly administered social programs
such as Misión Barrio Adentro.22 These transfers are usually recurrent for the duration of the
program.
22 Misión Barrio Adentro is a national primary health program that built small dispensaries in the heart of the poorest communities.

22
4.2.2. Transfers to Support Decentralized Concurrent Services These are transfers to help support services decentralized by the central government to states and
municipalities. The most common examples are transfers from the health and education
ministries to help funding hospitals and schools that were previously decentralized to states.
These are commonly recurrent.
4.2.3. Transfers to Help Finance Projects of National Interest These are transfers to partially or completely finance local projects that are considered by the
central government to have regional or national importance. These are typically large
infrastructure projects such as highways, local roads, hospitals, and aqueducts. Transfers for
these projects are not recurrent.
The size of these transfers have varied through the years depending on different strategies
and programs that the central government has adopted and implemented, but on average they
have represented up to 10 percent of total budgeted revenues of states.
4.3. Volatility of Transfers As mentioned before, one of the defining characteristics of the Venezuelan central government’s
fiscal management is its volatility, a consequence of its dependence on oil production and prices.
In this sub-section we explore how this volatility is transferred to SNGs.
Analysing the volatility of SNGs is important because, as in the central government case,
it affects both the type and the quality of the provision of local public goods and services. The
uncertainty and volatility of revenues usually lead to lower levels of capital investment and fewer
long-term sustainable projects.
The volatility of the central government`s revenue can be seen in Figure 3. Budgeted
revenues have increased substantially in the period of study, with great variability (they have a
coefficient of variation of 35 percent). However, what really affects the volatility of national
expenditures are Créditos Adicionales, essentially additional expenditures approved during the
year by the national assembly due to higher-than-expected oil prices. The Créditos Adicionales
increase the coefficient of variation of total expenditures to 0.39.

23
Moreover, transfers to local governments are positively correlated with the national
budget (0.77 correlation coefficient), therefore the volatility is transferred to local governments.
Figure 4 shows state and municipal real revenues since 1989. As can be seen, states’ real
revenues has varied considerably in the period, initially decreasing by 53 percent from 1990 to
1999, briefly increasing by 73 percent during 2000 and 2001, and declining again in 2010 to less
than half the 1989 values.
-
20
40
60
80
100
120
140
-
50
100
150
200
250
300
350
Addi
tion
al C
redi
ts -
Tota
l Tra
nsfe
rs
(Bill
ions
of 2
010
BsF)
Budg
eted
Rev
enue
s (B
illio
ns o
f 201
0 Bs
F)
Source: ONAPRE.
Figure 3. Transfers to Local Governments and National Budgeted Revenues (Billions of 2010 BsF)
Budgeted Revenues Additional Credits Total Transfers

24
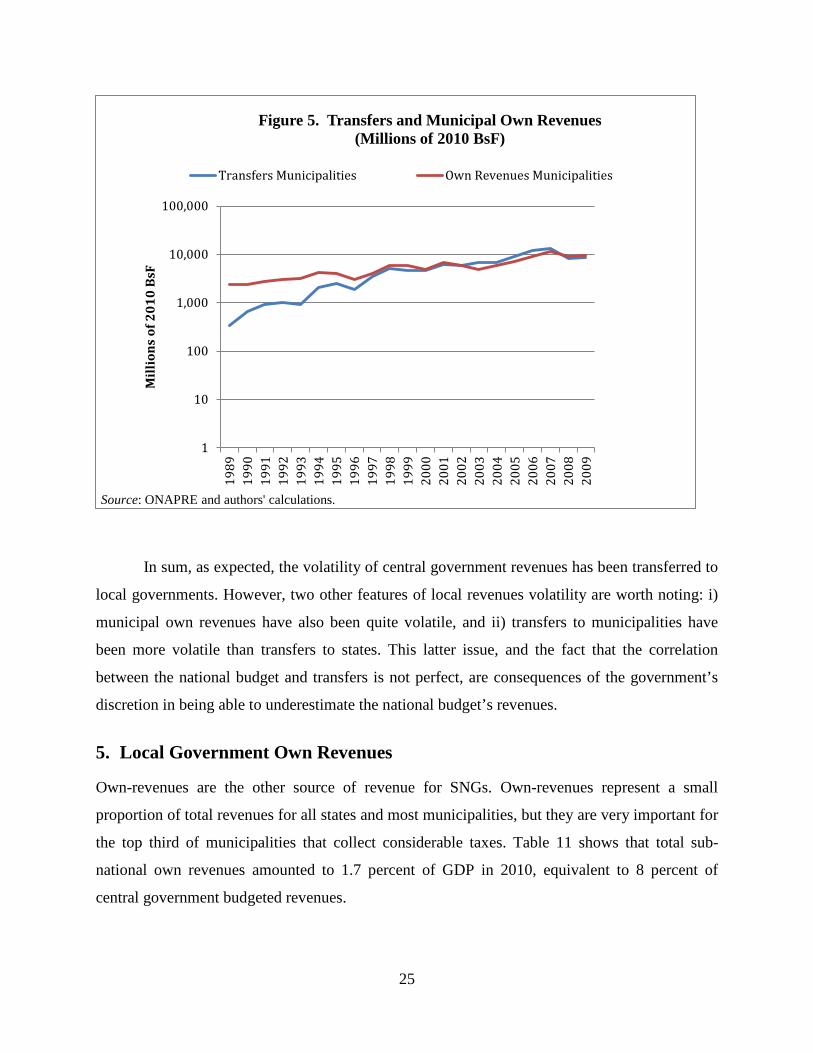
Figure 4 shows that municipalities’ revenues are more volatile than states’ revenues.
From 1989 to 2008 there was a sustained increase in revenues, until it fell quickly back to 2005
levels in the period 2009-2010. Transfers from the central government and own revenues caused
variability in municipalities’ revenues. As can be seen in Figure 5, which presents transfers and
municipal own-revenues on a logarithmic scale, the greatest source of volatility are transfers
(coefficient of variation of 76 percent), although own income is also quite volatile (coefficient of
variation of 47 percent). They are both much more volatile than transfers to states.
This could be explained by an analysis of the transfers’ two components: mandatory and
non-mandatory transfers. The mandatory or “legal” transfers, until recently, were first transferred
to the states and then redirected to municipalities. This additional administrative process caused
lags and inefficiencies, making “legal” transfers to municipalities much more volatile than those
to states. Furthermore, municipalities do not receive as many discretionary transfers as states do,
such as support for decentralized concurrent services. Therefore non-mandatory transfers are also
much more volatile.
0
5
10
15
20
25
30
0
10
20
30
40
50
6019
8919
9019
9119
9219
9319
9419
9519
9619
9719
9819
9920
0020
0120
0220
0320
0420
0520
0620
0720
0820
09
Mun
icip
alit
ies
(Bill
ions
of 2
010
BsF)
Stat
es
(Bill
ions
of 2
010
BsF)
Source: ONAPRE.
Figure 4. States and Municipalities' Revenues 1989-2010 (Billions of 2010 BsF)
States Municipalities
25
In sum, as expected, the volatility of central government revenues has been transferred to
local governments. However, two other features of local revenues volatility are worth noting: i)
municipal own revenues have also been quite volatile, and ii) transfers to municipalities have
been more volatile than transfers to states. This latter issue, and the fact that the correlation
between the national budget and transfers is not perfect, are consequences of the government’s
discretion in being able to underestimate the national budget’s revenues.
5. Local Government Own Revenues
Own-revenues are the other source of revenue for SNGs. Own-revenues represent a small
proportion of total revenues for all states and most municipalities, but they are very important for
the top third of municipalities that collect considerable taxes. Table 11 shows that total sub-
national own revenues amounted to 1.7 percent of GDP in 2010, equivalent to 8 percent of
central government budgeted revenues.
1
10
100
1,000
10,000
100,000
1989
1990
1991
1992
1993
1994
1995
1996
1997
1998
1999
2000
2001
2002
2003
2004
2005
2006
2007
2008
2009
Mill
ions
of 2
010
BsF
Source: ONAPRE and authors' calculations.
Figure 5. Transfers and Municipal Own Revenues (Millions of 2010 BsF)
Transfers Municipalities Own Revenues Municipalities

26
Table 11. Own Revenues by Local Government Entity 2010
Local Government States Municipalities Total MM Bs.F. 1,188 11,621 12,809 MM USD (official) 276 2,702 2,978 % Own Revenue 9.0% 91.0% 100% % Official Budget 0.8% 7.3% 8.0% % GDP 0.2% 1.5% 1.7% Source: ONAPRE, Finance Ministry, Central Bank.
Own revenues in Venezuela come mainly from three sources: service fees, taxes on land,
property and economic activities, and return on investments. These concepts are defined in
general terms in the Constitution23 but further developed and detailed in national laws or local
ordinances.
As shown in Table 12, in general, the most important of these own revenues are taxes,
followed by fees. In the case of municipalities, taxes represent 51.5 percent of revenues, a
significant amount, as they are able to tax economic activities and property. For states, fees
remain the most important type (excluding treasury reserves) of their negligible own revenues.
Table 12. Importance of Own Revenue by Type 2010
Own-Revenues Concept
% of State Own-Revenues
% of State Revenues
% of Municipal Own-Revenues
% of Municipal Revenues
Taxes 6.0% 0.3% 78.9% 51.5% Fees 29.6% 1.3% 4.8% 3.2% Sale of Goods and Services 3.3% 0.1% 0.7% 0.5% Property Income 12.7% 0.6% 1.6% 1.0% Others 48.4% 2.1% 9.9% 6.5% Source: ONAPRE.
In this section we will describe each of these categories, analyze them in light of the
literature, and examine the efficiency with which they are collected and their potential for
improvement.
23 Articles 167 and 179.

27
5.1. Taxes The 1999 Constitution reserves for the central government all taxes on incomes, leaving for
SNGs taxes on assets and economic activities. Municipalities have the authority to collect several
types of taxes, the most important of which are taxes on economic activities, land and property.
On the other hand, states have constitutionally broader possibilities to collect taxes, but this
depends on the approval of individual national laws to collect each specific tax. However, for
more than 20 years no national laws have been passed to allow states to tax additional activities,
and the only law that currently exists allows states to tax mines of non-metallic non-precious
minerals.24 Therefore, states collect very little tax.
Table 13 presents the importance of different taxes for Miranda state and Sucre
municipality.25 As can be seen, municipal taxes on economic activities by far surpass all others,
with taxes on land and property coming in a distant second.
Table 13. Tax Concepts for Miranda State and Sucre Municipality 2010
Own Revenue Concept
% of Miranda State Taxes
% of Miranda State Revenues
% of Sucre Municipal
Taxes
% of Sucre Municipal Revenues
Economic activities - - 96.2% 60.1%
Vehicles - - 0.2% 0.1%
Public Entertainment - - 0.5% 0.3%
Lawful Betting and Gaming - - 0.0% 0.0%
Commercial advertising - - 0.8% 0.5%
Increased property values generated by changes in use or intensity of exploitation
- - - -
Land and property - - 2.3% 1.4%
Exploitation of non-metallic minerals 100% 0.7% - -
Source: Miranda state 2010 budget, Sucre municipality 2010 budget.
24 These include marble, sand, slate, clay and limestone. 25 We present Sucre and Miranda as examples because data from ONAPRE that cover all states and municipalities are not detailed enough. Taxes are mostly homogenous between states, making Miranda a good representation. However, tax collection is heterogeneous across municipalities. Sucre represents municipalities in the upper echelon of tax collection.

28
Current legal conditions make the political economy associated with increasing tax
revenues different for states and municipalities. States need specific national laws to assign them
new tax bases. Thus, they first need to get support at the national level from the central
government and the national assembly, which requires broader alliances of governors and their
parties. Then, they must negotiate rates and other details within their respective regional
legislative councils. On the other hand, municipalities have ample and captive tax bases, and
they can increase tax revenues both by boosting their collection efficiency and by increasing tax
rates and other features. Only the latter need to be negotiated with local councils.
Finally, it is important to note that these taxes have advantages and disadvantages, on the
basis of their characteristics (Table 14). In general, the most important taxes collected by SNGs
fall into the category of Turnover Taxes (TT). Taxes of this type of taxes have good revenue
potential but tend to be very unevenly distributed and sensitive to the economic cycle.
Table 14. Characteristics of Sub-National Taxes
Revenue Potential
Mobility of Tax Base
Potential Efficiency
Costs
Sensitivity to Cycle
Even Distribution of Tax Base
Costs of Administration
Compliance Costs
CIT M H H H L H M/H Excises M M M/H M L M L Property Taxes M L L L L/M H M Royalties H L L H L M/H M Turnover Tax H M M/H M L M M User Fees M L/M L L M M M H: High M: Medium L: Low Source: Authors’ compilation based on IDB (2011).
5.1.1. Municipal Taxes Economic Activities in Industry, Commerce, Services, or Similar (Turnover Tax). These are
taxes on production of goods and services by private firms located in a given municipality. They
are calculated on the basis of the total revenues a firm receives from selling goods or services
produced in the municipality. Different products usually have different rates, which are specified
in the municipal ordinance. It is important to notice that these taxes are levied on both final and
intermediate goods, which causes cascading effects that reduce efficiency.
This is the most important tax collected by municipalities because it has a large tax base,
particularly in urban areas, and it is relatively simple to collect. Enforcement is reasonably

29
effective because: i) businesses are fairly easy to locate; ii) they could be closed down for failing
to comply (with their consequent economic losses); and iii) there are comparatively fewer
taxpayers to tax (than property owners, for example). Additionally, larger firms have high
mobility costs, particularly in industry, which tends to make the tax base less volatile.
A disadvantage of the tax on economic activities for municipalities is its positive
correlation with, and relatively high sensitivity to, the economic cycle. A further major
disadvantage is the very uneven distribution of its base. Also, the relative impact that one large
company can have on municipal revenues can lead municipalities to compete for lower taxes,
particularly in cities that have several municipalities, such as Caracas and Valencia.
Land and Property (Property Tax). These are taxes on land and property ownership
located in the municipality, calculated on the basis of size, location and land and property use.
Municipalities have exclusive responsibility for the cadastre, the basic source of this information.
Unlike in most advanced countries, in the case of Venezuela—as in other developing
countries—this tax is not a very important source of revenues for municipalities. This is due to
several factors: i) high administration costs, ii) limited enforcement mechanisms, and iii) lack of
tax payment culture. The number of taxpayers is significantly larger than for taxes on economic
activities, and each one pays relatively small amounts. Moreover, it is not legally possible to
evict taxpayers from their homes if they do not comply with their tax obligations. All this
combines to create a challenging environment in which to collect, and a tradition of paying only
when selling the property.
The greatest advantage of this tax is its low sensitivity to the economic cycle and the low
mobility of its tax base. Also, because of the size of its tax base and the enormous prevailing
evasion, 26 this tax probably has the greatest potential for increasing revenues for the
municipalities. However, large investments are needed to improve the cadastre and to keep it up
to date. Moreover, this tax, being very visible to taxpayers and collected once a year, is more
unpopular than the one on industrial and commercial activities
Vehicles (Property Tax). Taxes on vehicles are defined as annual levies on the
ownership of a car. This tax is generally related to the type of car and its age, according to local
26 Chacao municipality, probably the country’s most institutionally advanced, estimates the extent of land and property tax evasion at greater than 80 percent.

30
ordinances. Municipalities have exclusive control over this tax base, assigned to them by the
Constitution.
This is another greatly underexploited tax for Venezuelan municipalities, with rampant
evasion. Reasons for this include the same as land and property tax (high administration costs,
limited enforcement mechanisms and lack of a tax culture) plus a vague legal framework for
establishing exactly which municipality is responsible for the collection. For example, in a city
such as Caracas, with five municipalities, taxpayers could choose to pay taxes where they live,
where they bought the car, where they work, or where they spend most of their time. Once again,
there is a culture of paying only when cars are sold.
While these taxes have comparatively a much lower revenue potential than land and
property, they are not negligible.
Lawful Betting and Gaming (Excise Taxes). These are taxes on gambling. Tax rates are
typically very high, and dependent on the size of the gaming parlor. The advantages of these
taxes are low administration costs, and high compliance rates. Legal gaming parlors are usually
highly visible and public. However, the taxable base has remained relatively low because lawful
betting has been allowed and prohibited on and off through recent years, and the sector is
underdeveloped. Currently, several forms of lawful gaming, such as casinos, are prohibited by a
national decree. Another advantage is the relatively low political cost of implementation and the
possibility of using them to tackle gambling as a public health issue.
One disadvantage is that taxes on lawful betting and gaming are unevenly distributed
between municipalities. The greatest potential lies in municipalities in touristic areas (principally
free ports) where there is an established industry.
Commercial Advertising (Excise Taxes). These are taxes on permanent or temporary
advertising in the municipality. They are generally related to the size and the time the
advertisement is shown.
The greatest advantage of this tax is that by definition advertisement should be easy to
locate and tax, particularly permanent advertisement. However, administration costs are high,
especially for non-permanent advertisement. This tax does not have a sizable tax base, and it
tends to be more important in urban centers.

31
Increased Property Values Generated by Changes in Use or Intensity of
Exploitation (Betterment Levies). These are taxes paid by owners whose property value has
increased as a result of public investments in nearby areas. These taxes are rarely collected
because the process of proving the increase in property value is difficult and cumbersome. They
have a somewhat small base, but considering the legal restriction on issuing public debt, they
represent an alternative for financing urban investment projects.
Public Entertainment. These are taxes on entertainment events occurring in the
municipality. They are calculated on a per-attendee basis. They do not represent a substantial tax
base. As in advertisement, their greatest advantage is that events are usually well publicized and
easy to identify. These taxes are important in municipalities with large sporting arenas and
conference centers, generally in larger cities or touristic destinations.
5.1.2. State Taxes The only notable taxes under state control are royalties on the mining of non-metallic and non-
precious minerals such as marble, sand, slate, clay and limestone. They do not represent a large
tax base, but it is the only one states are legally assigned. The biggest advantage of this tax is the
very low mobility of the tax base. Disadvantages include high sensitivity to the economic cycle
and a very uneven distribution of the tax base among states.
5.2. Fees Fees are collected for services delivered by SNGs. The types of fees collected will depend on the
particular characteristics of SNGs and the services they deliver. Amounts for fees will vary
among SNGs and depend on local legislation.
Table 15 contains the most important fees collected by SNGs, and their relative
importance. They are shown for a sample of one state (Carabobo) and one municipality
(Chacao). It shows that municipalities can collect fees on several more bases than states, given
their broader set of competencies. For instance, municipalities have the responsibility of
providing several public services such as waste collection and water management, allowing them
to receive fees for these activities. A relatively important source of fee revenues for
municipalities is the issuing of construction permits for urban development. On the other hand,
states depend mostly on stamped paper, as tolls and port and airport fees have been restricted in
recent years.

32
Table 15. Main Fees Collected by Carabobo State and Chacao Municipality
Own-Revenue Concept % of
Carabobo Fees, 2010
% of Carabobo Revenues,
2010
% of Chacao
Fees, 2009
% of Chacao Revenue,
2009
Parking Fees - - 2.8% - Document Copies - - 10.2% - Municipal Permits for Construction - - 41.6% - Certifications and Clearances - - 14.8% - Trash Collection - - 11.3% - Municipal Market - - 16.5% - Other Fees 50.6% 0.8% 2.9% - Port and Airport Fees 9.4% 0.1% - - Tolls 0.0% 0.0% - - Stamped Paper and Stamps 40.0% 0.6% - - Fines and Surcharges 0.0% 0.0% - - Fines and Penalties 0.0% 0.0% - - Source: ONAPRE and Informe de Gestión Anual, Municipio Chacao.
5.2.1. Copies and Certifications Fees are collected for registering official documents, issuing copies of them, and selling stamped
paper and stamps. For municipalities this is not a negligible source of revenues because they
have responsibilities over the official cadastre, engineering, municipal tax collection and the civil
registrar. States issue stamps and stamped paper.
5.2.2. Traffic Fees These include road tolls and parking fees. Parking fees are uncommon, and not a large source of
revenues since the government imposed price controls on public parking. Tolls, on the other
hand, were common and significant for states until 2008 when a decree prohibited charging tolls
altogether.
5.2.3. Ports and Airport Fees These are fees for the use of ports and airports. They were very important for several states,
mainly in the north of the country. However, a 2008 decree centralized the management of

33
public ports and airports, transferring their administration and revenues to the Ministry of
Infrastructure.
5.2.4. Public Services Fees These are fees for public services provided by SNGs. Few public services are actually provided
by municipalities, and them by states (aside from education, health and police). The most
important municipal service provided is waste collection and disposal. This service was
delivered through private concessions in the 1990s, but has come to be increasingly provided
directly by municipalities as the price for the service was frozen by decree in 2002. Very few
municipalities also deliver water to parts of their territories and collect user fees. Most water,
natural gas and electricity services are provided directly by the central government.
5.2.5. Construction and Development Fees
This is an important source of revenues for municipalities. These are fees paid by private real
estate companies to construct on land suitable for development. Usually they depend on the
value of the land being developed, and are significant in urban centres.
5.2.6. Fines and Penalties These include charges for violations of tax responsibilities or local regulations on traffic,
construction, and public services among others. They are more common for municipalities than
for states.
5.2.7. Other Fees Other fees include but are not necessarily restricted to those on the use of public spaces (squares,
parks, or streets).
5.3. Sale of Goods and Services Sales of goods and services are uncommon, but significant when they occur. In general, they are
related to the sale of local government owned lands and/or buildings for private development.
Sometimes they are “egidos” or empty municipal lots that must be allocated to municipalities
when new areas are developed. They could also consist of buildings that go unused. All sales of
this type need approval from the legislature. Sales of services are rare.

34
5.4. Property Revenues These are revenues that results from owning assets. The two most common cases are interest
payments on bank deposits, and rent on municipal property.
5.5. Other Sources One common resource is the use of treasury reserves. They are essentially resources that were
not spent in previous fiscal years that can be incorporated into the new budget. Reserves can be
significant, and they depend on a local government’s ability to successfully implement a given
budget. With regards to debt, while constitutionally legal, it is practically not allowed for SNGs,
as any private or public, foreign or domestic debt issuance needs approval by the central
government and the national assembly. However, local governments do borrow from suppliers
(floating debt) and even sometimes from employees (by withholding the payment of benefits).
5.6. Own-Revenue Efficiency As mentioned before, municipal revenues present a very significant horizontal imbalance: there
are municipalities that collect almost 90 percent of their total revenues, whereas others do not
collect own revenues at all. In order to better understand the reasons for such large disparities,
we used a stochastic frontier model adapting the stochastic frontier production function proposed
by Battese and Coelli (1992).
Due to the lack of data at the municipal level it is not possible to estimate a panel model;
instead cross-section regressions for 2001 were used. The year 2001 is chosen because the last
Venezuelan census was carried out that year, and there are household income data available at
the municipal level.
We follow a macroeconomic approach methodology to assess the revenue collection
ability of municipal governments as described in Yilmaz (2009), where only one aggregate
variable is used as a proxy for the tax base, in this case household income data from the 2001
census. We estimated a stochastic frontier production function for 2001 using municipalities
own revenues in nominal terms as the dependent variable; and the sum of all households’ income
of each municipality and a dummy variable for oil-producing municipalities as the independent
variables:
𝑌𝑖 = 𝛽0 + 𝑋𝑖𝛽1 + 𝐷𝑖𝛽2 + (𝑉𝑖 − 𝑈𝑖)

35
where: Yi = Own revenue collection in year t for municipality I; Xi = Total household income in
municipality i; Di = Oil producer dummy variable; Vi= random variables assumed to be iid N(0,
σv2), and independent; and Ui are non-negative random variables which are assumed to account
for technical inefficiency in production to be iid as truncations at zero of the N(µ,σU2)
distribution. We utilize the parameterization of Battese and Corra (1977) who replace σV2 and
σU2 with σ2=σV
2+σU2 and γ=σU
2/(σV2+σU
2). This is done with the calculation of the maximum
likelihood estimates in mind.
We followed a three-step procedure for estimating the maximum likelihood estimates of
the parameters of the stochastic frontier for revenue collection. The three steps were the
following:
1. Ordinary Least Squares (OLS) estimates of the function were obtained. All
estimators, with the exception of the intercept, are unbiased.
2. A two-phase grid search of γ was conducted, with the β parameters (with the
exception of β0) set to the OLS values and the β0 and σ2 parameters adjusted
according to the corrected ordinary least squares formula presented in Coelli
(1995).
3. The values selected in the grid search were used as starting values in an
iterative procedure (using the Davidon-Fletcher-Powell Quasi-Newton
method) to obtain the final maximum likelihood estimates. For more
information refer to Himmelblau (1972).
Results of the estimations are presented in Tables 16, 17 and 18.
Table 16. OLS Estimates Coefficient Standard-error t-ratio
Constant -8.3 1.7 -5.0 Household income 1.4 0.2 7.7 Oil dummy 0.4 0.3 1.2 Sigma-squared 4.2 Source: Authors’ calculations.

36
Table 17. Grid Search Estimates Coefficient
Constant -5.8 Household income 1.4
Oil dummy 0.4 Sigma-squared 10.6
Gamma 0.95 Source: Authors’ calculations.
Table 18. Final MLE Estimates Coefficient Standard-error t-ratio
Constant -3.1 0.8 -3.7 Household income 1.0 0.1 11.8 Oil dummy 0.4 0.2 2.3 Sigma-squared 7.8 0.6 12.3 Gamma 0.99 0.0 272.0 Source: Authors’ calculations.
After the revenue collection frontier was calculated for each municipality we compared
the observed value with the frontier value and expressed in percentage the efficiency achieved,
where 100 percent efficiency occurs when the observed and frontier value are equal.
The oil dummy coefficient found by the regressions is positive which means that being an
oil-producing municipality increases actual and potential revenues. We also found a very weak
positive correlation of 0.16 between the tax bases and the efficiency calculated for their
respective municipalities. This suggests that municipalities where there exists a large tax base are
generally more efficient. To analyze the results, we classified municipalities by total revenues,
from high to low, in quintiles. We considered two ways to measure the effects that improvements
in efficiency could bring about. The first is the effect on total revenues. Clearly, achieving 100
percent efficiency in small municipalities would not have a large impact on total revenues
because it would increase total revenues of the fifth quintile by only 16 percent, while the
estimated impact of a similar achievement in the first quintile would be over 47 percent.
However, if we analyze the impact on own revenue sources we estimate an increase of 240
percent for the fifth quintile and 73 percent for the first. These results are presented in Figure 6.

37
An analysis of the per-capita sources of revenues reveals that transfers reduce revenue
disparities across municipalities by reducing the coefficient of variation from 2.41 to 1.05 in
2001. However, there is room for improvement. For example if municipalities could achieve 100
percent efficiency in own revenue collection, the coefficient of variation could instead decline to
0.93.
Finally, the efficient frontier can give us some insight regarding the transfers made by the
central government. We found that there is a negative relationship between own revenues per
capita and transfers per capita, and that the relation is even stronger if we use the revenue
collection at 100 percent efficiency; the value of the correlation, however, is relatively small (see
Table 19).
0%
10%
20%
30%
40%
50%
60%
70%
80%
90%
100%
1st Quintile 2nd Quintile 3rd Quintile 4th Quintile 5th Quintile
Figure 6. Municipalities' Revenue Composition (High to Low) Own Revenues Transfers Efficiency Gap
Source: INE, ONAPRE, authors' calculations.
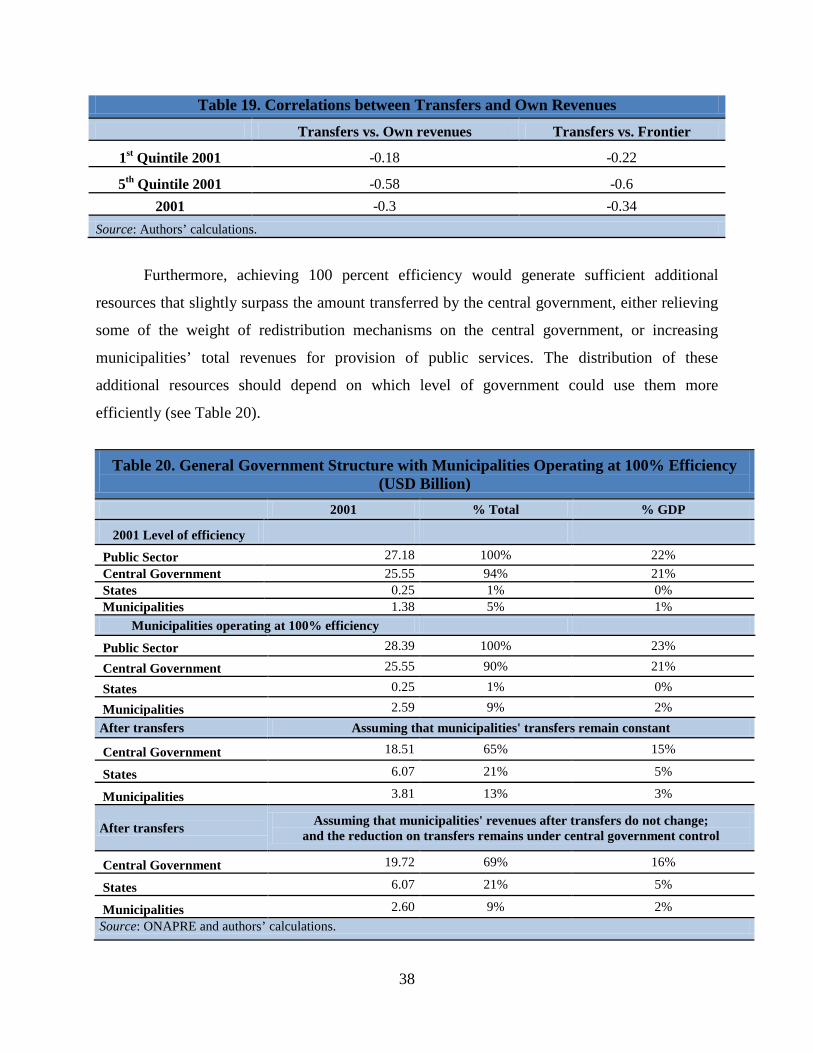
38
Table 19. Correlations between Transfers and Own Revenues Transfers vs. Own revenues Transfers vs. Frontier
1st Quintile 2001 -0.18 -0.22
5th Quintile 2001 -0.58 -0.6 2001 -0.3 -0.34
Source: Authors’ calculations.
Furthermore, achieving 100 percent efficiency would generate sufficient additional
resources that slightly surpass the amount transferred by the central government, either relieving
some of the weight of redistribution mechanisms on the central government, or increasing
municipalities’ total revenues for provision of public services. The distribution of these
additional resources should depend on which level of government could use them more
efficiently (see Table 20).
Table 20. General Government Structure with Municipalities Operating at 100% Efficiency
(USD Billion) 2001 % Total % GDP
2001 Level of efficiency
Public Sector 27.18 100% 22% Central Government 25.55 94% 21% States 0.25 1% 0% Municipalities 1.38 5% 1%
Municipalities operating at 100% efficiency
Public Sector 28.39 100% 23%
Central Government 25.55 90% 21%
States 0.25 1% 0%
Municipalities 2.59 9% 2% After transfers Assuming that municipalities' transfers remain constant
Central Government 18.51 65% 15%
States 6.07 21% 5%
Municipalities 3.81 13% 3%
After transfers Assuming that municipalities' revenues after transfers do not change; and the reduction on transfers remains under central government control
Central Government 19.72 69% 16%
States 6.07 21% 5%
Municipalities 2.60 9% 2% Source: ONAPRE and authors’ calculations.

39
In summary, the estimated stochastic frontier of revenue collection and its comparison
with the observed values strongly suggests that there is room for improvement without
introducing new revenue sources, judging by the approximately 40 percent average efficiency in
revenue collection. If municipalities were able to increase their efficiency in revenue collection,
the horizontal imbalance and fiscal dependence across municipalities could greatly improve.
6. Fiscal Dependence of Local Governments The previous two sections explained the different sources of revenue that Venezuelan local
governments receive, including those transferred from the central government and those
collected as own-revenues. Raising own revenues is important for local governments because it
gives them a degree of budgetary independence. Those revenues are also important for the
central government because they reduce the pressure to transfer their scarce resources to local
governments. However, from a political economy standpoint the central government may have
incentives to use the transfer mechanisms as a political leverage tool to control sub-national
governments. This section quantifies the important difference between transfers and own
revenues, using the concept of Fiscal Dependence (FD), and attempts to determine the variables
that explain a local government’s FD.
We define FD as the share of revenues received by a local government from the central
government (transfers) to its total revenues. In this sense, FD has to be a number between 1 and
0, where the higher the number, the greater the dependence of the local government on transfers.
A government with a FD of 1 will receive all its revenues through transfers, while a FD of 0
means the local government raises them all. In order to determine the FD, we obtained data on
revenues by type for the period 1989-2010 from the central government’s budget office
(ONAPRE), which depends from the Ministry of Finance. These data are collected yearly by
ONAPRE from the official budgets approved by every state and municipality and published in
statistical yearbooks.27
27 Using data from budgets has the problem of not necessarily being exactly what happened at the end of the fiscal year, but it is what is available. The closing numbers have to be published by local governments in final reports (Informes de Gestion Annual), but they are not required to be sent to ONAPRE. However, differences are not expected to over or underestimate any concept consistently, and they probably even out over time. Another potential problem is the presence of autonomous institutes and foundations ascribed to states and municipalities that collect fees on their own but are not added to these figures. They were created to serve specific purposes and to have more autonomy to manage the money they collect.

40
Revenue data in Venezuela (as well as expenditure data) are easily aggregated because
there is a standardized budget classifier authored by ONAPRE that defines a code, standard
name and full description for every source of revenues contained in Venezuelan budget laws. It
is required by law to follow this classification, or face sanctions. These data for states and
municipalities are detailed by type of tax, source, name and other characteristics. However, since
FD only requires two groups, own revenues and transfers, we classify all concepts into these two
groups. Table 21 shows all the types of revenue that fall into each group for both levels of
government.
Table 21. Types of Income and Classification, States and Municipalities
Local Government Transfers Own Revenues
States Situado Constitucional Sale of stamped paper and stamps LAEE
FIDES Property Tax Concessions of Goods and Services
Capital Subsidy Interest from financial assets Special Regime Subsidy Other revenues Transfers to States for Service
Transfers
Transfers for Health Decentralization Transfers for Education
Decentralization
Municipalities Situado Constitucional Indirect Taxes LAEE Non-tax revenues
Diverse revenues FIDES Sale of goods and services Special Transfers Revenues on property Sale of Assets Others Source: Authors’ classification based on ONAPRE data.
The basic results of the calculation of the FD are that 1) it is very large for the average
local government in Venezuela, and 2) it differs greatly among states and municipalities
(especially within municipalities). The rest of this section will discuss this in more detail.

41
6.1. States’ Fiscal Dependence As was described above, the largest sources of revenue for states is the Situado Constitucional
and the Fondo de Compensacion Interterritorial, both transfers, which leads to large average FD.
The average FD for a Venezuelan state for the whole period of study (1989-2010) is 0.98. This
fact is as true now as it has been since the beginning of decentralization. As can be seen in Figure
7, the average FD has not varied much during the entire period, always being close to 1. The
largest FD registered was 0.99 in 1990, while the lowest FD was 0.91 in 2010.
States’ limited capacity to tax also reduces the dispersion of the FD between them. Since
most of their revenues are defined by transfer rules based on population, there are few ways for
governments in economically active states to take advantage of their large potential tax bases and
separate themselves from the rest. All states have an average FD between 0.99 (Amazonas) and
0.89 (Carabobo) for the whole period, and no state in any year has a lower FD than 0.85. Figure
8 shows states ordered by their average FD for the period 1989-2010.
0.0
0.1
0.2
0.3
0.4
0.5
0.6
0.7
0.8
0.9
1.0
Fisc
al D
epen
denc
e
Source: ONAPRE and authors' calculations.
Figure 7. Unweighted Average FD for Venezuelan States (1989-2010)

42
6.2. Municipalities’ Fiscal Dependence In addition to transfers, municipalities have several other important sources of revenues,
including municipal taxes and service fees. This difference explains why municipalities have a
lower FD than states, for the study period. The average FD for a municipality is 0.76, 0.22 points
lower than states. What is interesting though is the much greater variance that this measure has
shown both in time and across municipalities. First, the average municipal FD changed from 0.5
in 1990, up to 0.8 in 2006, and down again to 0.69 in 2010. As explained before, this has to do
both with volatility in transfers and the revenues buffer represented by own-revenues generation.
Average municipal FD for the whole period can be observed in Figure 9.
0.82 0.84 0.86 0.88 0.9 0.92 0.94 0.96 0.98 1
DISTRITO DEL ALTO APUREAMAZONAS
APUREBARINAS
TRUJILLOANZOÁTEGUI
GUÁRICOMÉRIDA
SUCRETÁCHIRACOJEDES
YARACUYDELTA AMACURO
PORTUGUESAFALCÓN
MONAGASLARA
ARAGUANUEVA ESPARTA
ZULIAMIRANDA
VARGASBOLÍVAR
DISTRITO METROPOLITANO DE CARACASCARABOBO
Fiscal Dependence
Stat
es
Figure 8. States' Average Fiscal Dependence (1989-2010)
Source: ONAPRE and authors' calculations.

43
It is interesting to note that average, median and system28 FD differ greatly, indicating
large differences among municipalities. From 1994 on, the FD of municipalities in the 50th
percentile is consistently close to 0.1 points higher than the average municipality, reaching more
than 0.9 in several years. On the other hand, the FD for the whole system averages 0.41 and is
consistently significantly lower than the average. The explanation for this is that there are
municipalities that collect large amounts of own revenues, with very low FD. This drives the
system down, but the great majority of municipalities have a very large FD that drives the
median up. In what follows these differences are explained.
6.2.1. Explaining Municipal Revenues Independence The differences in municipal FD described above are very important to understand the role of
transfers and own-revenue generation in the financing of local governments in Venezuela. While
a few municipalities are very successful in raising own revenue and reducing their dependence
28 The FD of the system is defined as the ratio of the sum of all transfers and the sum of all revenues of the 335 municipalities.
0
0.1
0.2
0.3
0.4
0.5
0.6
0.7
0.8
0.9
1
Fisc
al D
epen
denc
e
Source: ONAPRE and authors' calculations.
Figure 9. Municipalities' Average, Median and System FD (1989-2010)
System Average Median

44
on the central government, most municipalities are still highly dependent on central government
transfers. This section tries to look for the variables or conditions that help explain these
differences by running both a cross-section regression and a panel data regression.
In order to explain the degrees of revenue dependence across municipalities we used the
average FD for the whole period and a series of time-invariant characteristics inherent to each
municipality as explanatory variables. The first explanatory variable is a dummy for oil
production presence. We ran this regression considering two aspects: the importance of oil in the
Venezuelan economy, and the existence of LAEE to compensate oil-producing local
governments. We obtain this variable from the Ministry of Energy Statistics Yearbook (PODE).
The second explanatory variable we included is population density, as a proxy for urban
municipalities. It was constructed using the National Statistics Institute (INE)’s municipal
population and area of territory. The expectation is that more urban areas will tend to have larger
tax bases. The final explanatory variable used is a household income index that compares the
average household income of each municipality with the average Venezuelan household income.
However, this variable is only available for 2001, which is the year when the last census was
carried out.
The regression we ran is least squares with consistent coefficients in order to control for
heteroskedasticity across municipalities. Regression results were in line with what was expected.
First, a municipality where oil is produced is associated with a 12 percent lower average FD.
This is explained by higher own revenues that more than compensate larger than average LAEE
transfers. This is interesting because it means that the effect of raising taxes from oil production
is larger than the effect of the designed institutional compensation scheme.
Second, higher average household income significantly decreases a municipality’s FD; an
income twice the national average is associated with a 42 percent reduction in FD. Essentially,
higher income is linked to a greater presence of large companies, larger and richer residents, and
more capacity to pay higher taxes and service fees. This is by far the most important variable
explaining FD, and it highlights the importance of tax collections for total revenues of
municipalities.
Finally, higher population density is also linked with lower FD; the results indicate that
1,000 more people per square kilometer is associated with a 5 percent decrease in FD. Population

45
density is associated with urban regions and to some extent to income. However, as the results
show, this is not the most important variable.
When analyzing municipal FD, it is important to group municipalities into well-defined
groups with different levels of dependence on transfers from the central government.
Aggregating municipalities into these groups has the advantage of allowing exploring in greater
detail the way different variables influence their FD. The average municipal FD defines groups
for the whole period. Municipalities with more than ⅔ of FD make up Group 1, those between ⅓
and ⅔ make up Group 2, while municipalities with less than ⅓ of FD compose group 3. Table
22, presents the number of municipalities in each group, as well as the distribution of their
sources of revenues.
Table 22. Municipal Group Characteristics
# of Municipalities Average FD Own Revenues 2010 (USD Millions)
Transfers 2010 (USD Millions)
Group 1 243 0.88 1.2 3.9 Group 2 72 0.51 16.1 8.8 Group 3 20 0.25 1,600.3 287.1 Source: ONAPRE and authors’ calculations.
Group 1 contains the largest number of municipalities, with a very large FD, and very
little own-revenues. Group 2 is medium sized, with medium FD and medium revenues. Finally,
Group 3 contains less than 10 percent of municipalities, very low dependency on transfers, and a
very high generation of own revenues (more than 90 percent). Using these groups we ran a series
of panel regressions correcting for autocorrelation and heteroskedasticity when present. The
regressions use the real growth of total revenues as the dependent variable, and the real growth
of GDP, one year lagged GDP, and total expenditures in the national budget as explanatory
variables. We control for population density, FD, and average growth of each municipality.
Table 23 summarizes the results of these panel regressions. These results suggest that the
lower the FD in a municipality, the more closely its total revenue correlated is with GDP, while
the correlation with expenditures in the national budget diminishes.

46
Table 23. Panel Data Results for Real Growth of Revenues Controlling for Heteroskedasticity
Panel Group 1 Group 2 Group 3 GDP 0.47 0.37 0.39 0.61 National Budget 0.17 0.30 0.25 0.11 Lagged GDP 0.97 0.97 1.01 1.00 Source: Authors’ calculations. * All coefficients are statistically significant at 1%.
These results suggest that municipalities should strive to reduce their FD so they depend
more on GDP, which in Venezuela is much more stable than expenditures in the national budget.
This reduction in volatility should improve the quality of the public goods provided by
municipalities, and should also allow for better planning for municipal investment projects.
7. Potential Taxes In previous sections we have described the fiscal revenues of Venezuelan local governments. In
general we characterized them as: i) having high fiscal dependence; ii) facing high volatility,
similar to the central government; iii) collecting taxes that are sensitive to the economic cycle;
and iv) inefficient, given that the taxes they do have are not collected up to their potential.
In particular, states are very homogenous in having the least autonomy, as they all receive
almost all their revenues from transfers. They can do very little to collect more resources and
therefore receive all the volatility from the central government transfers. Municipalities, on the
other hand, display great heterogeneity, some being very autonomous and collecting large own-
revenues, and others very dependent on transfers. They have problems collecting up to their
potential, but at least they have tax bases assigned.
In this context, proposed policies to increase SNGs’ resource mobilization must try to
reduce dependence on transfers, decrease volatility and sensitivity to the economic cycle, and
expand the tax base. In this section we propose new taxes and public policies to try achieving
these goals, and discuss their potential impact, advantages and disadvantages. Table 24
summarizes these problems and presents some possible solutions.

47
Table 24. Problems Identified and Proposed Solutions Problem States Municipalities Proposed Solution
Fiscal Dependence on CG Transfers
Yes Partially States: gasoline tax, electricity tax, piggy-backing on national income tax
Municipalities: increase tax collection efficiency
Revenue Volatility Yes Yes States: gasoline tax, electricity tax, new transfer mechanisms
Municipalities: new transfer mechanisms, increase tax collection efficiency
Sensitivity to the Economic Cycle
Yes Yes States: gasoline tax, electricity tax, new transfer mechanisms
Municipalities: new transfer mechanisms, increase tax collection efficiency
Tax Evasion No (but potentially)
Yes States and municipalities: increase tax collection efficiency
Heterogeneity No (but potentially)
Yes States and municipalities: new transfer mechanisms
Source: Authors’ compilation. 7.1. Tax on Gasoline Consumption The first proposal we explore is a state tax on gasoline consumption. This is a tax that already
exists at the national level, but it is negligible. It is a very common tax throughout the world,
commonly used as part of government’s environmental policies. We perform an exercise to
determine the potential revenues that could have been raised through a tax on consumption of
gasoline during the period 1989-2006.29
We use two variables from the Petróleo y Otros Datos Estadísticos (PODE),30 average
price of gasoline per liter, and the number of liters sold per state per year. The final consumer
price of gasoline per liter sold at the pump is divided into three concepts: the supply source price,
the marketing margin, and central government taxes (see Table 25). Our proposal would only tax
the first two components.
29 With the exception of the period from 1999 to 2002, for which data are not available. 30 Published on an annual basis by the Ministry of Energy and Oil.

48
Table 25. Taxes and Prices of Refined Products in the Domestic Market in USD ¢ per liter
Supply Price Central Government Tax Marketing Margin Final Consumer Price 91 octane unleaded gasoline
1.03 0.97 1.24 3.25
95 octane unleaded gasoline
1.91 1.35 1.24 4.51
Source: PODE 2006.
We simulate establishing a tax on gasoline consumption in 2006, the most recent year for
which we have data. We test three different tax rates per liter defined in Unidades Tributarias:
0.05 percent UT, 0.1 percent UT and 0.2 percent UT.31 Tax rates were chosen discretionarily,
considering local and international prices. We assume that demand is not affected by the
imposition of the tax. Considering how extremely low prices are currently set, we believe this is
not an extreme assumption.
These results indicate that a tax on gasoline consumption has great potential to generate
significant revenues for Venezuelan states. Establishing the tax in 2006 at a 0.05 percent UT tax
rate would have generated US$280 MM or 6.6 percent of their total revenues. Table 26 presents
the results.
Table 26. Revenues Collected through a Potential Tax on Gasoline Consumption 2006 Tax Collected 0.05% UT 0.1% UT 0.2% UT
MM Bs.F. 301 603 1,205 MM USD 70 140 280 % GDP 0.1% 0.2% 0.3% % Transfers to states 1.8% 3.5% 7.0% % Total revenues 1.7% 3.3% 6.6%
Source: Authors’ calculations.
31 Initially we thought of establishing the tax in percentage terms, but had the problem of what would happen when the price of gasoline, which is exorbitantly low, eventually began to rise. While a 100 percent tax rate on gasoline would still be negligible at these prices, it would be unsustainably high at market prices. Another option was to establish a fixed nominal value for the tax. This had the opposite problem of becoming insignificantly low as gasoline (and general) prices increased. Thus we decided to establish it in unidades tributarias, a referential price that is adjusted annually considering inflation, thus keeping its value over time.

49
The results also indicate that a tax on gasoline consumption could be relatively stable, as
demand does not seem to be greatly affected by the economic cycle. Table 27 presents the
comparison of the tax for 2004, 2005 and 2006. The differences come from the Unidad
Tributaria not completely accounting for inflation, but slightly less.
Table 27. Revenues Collected through Potential 0.2% UT Tax on Gasoline Consumption
2004-2006 Tax Collected 2004 2005 2006
MM Bs.F. 692 992 1,205 MM USD 161 231 280 % GDP 0.34% 0.3% 0.3% % Transfers to states 9.3% 8.3% 7.06% % Total revenues 8.9% 8.0% 6.65%
Source: Authors’ calculations.
Finally, the results also indicate that the tax is relatively homogenous, with states
collecting taxes in relation to their population. Tachira is an outlier in the sample because of
large contraband of gasoline to Colombia due to price differentials. Figure 10 presents the per
capita revenues potentially collected and concludes the figure is fairly similar for all states.

50
From this exercise we take that a tax on gasoline consumption has multiple advantages
that tackle several of the problems identified: i) high revenue potential; ii) stability; and iii)
homogeneity. Also, it is very convenient because of low administration costs. Gasoline is sold at
easily identified establishments by a limited number of companies, and sales can be monitored
without too many complications.
However, there are also a number of disadvantages of establishing this tax, some of them
inherent to the Venezuelan context: i) it is a very obvious tax for consumers to identify; ii) there
is a history of political sensitivity to raising the price of fuels; and iii) this tax is legally difficult
0 5 10 15 20 25 30 35
AMAZONASANZOÁTEGUI
APUREARAGUA
BARINASBOLÍVAR
CARABOBOCOJEDES
DELTA AMACURODISTRITO CAPITAL
FALCÓNGUÁRICO
LARAMÉRIDA
MIRANDAMONAGAS
NUEVA ESPARTAPORTUGUESA
SUCRETÁCHIRATRUJILLO
VARGASYARACUY
ZULIA
Per Capita USD
Stat
es
Figure 10. Tax Collected Per Capita with a 0.2% UT Tax by State 2006
Source: Authors' calculations.

51
to implement. The political sensitivity comes mainly from a 1989 episode in which a rise in the
price of gasoline triggered riots in Caracas. Although prices have been raised once since, it still
remains a critical issue. The legal implementation is also difficult because the Constitution
reserves the taxing of oil production and consumption to the central government. Thus a
constitutional change would be required.
7.2. Tax on Electric Consumption
The second proposal we explore is a state tax on electricity consumption. Like the gasoline tax, it
is also a very common tax around the world, as it can complement other environmental policies.
The exercise that we propose is to calculate how much could be collected through a tax on the
consumption of electricity. Because of data availability, the chosen year for the simulation is
2007. For this exercise we used data from the 2007 Statistical Yearbook of the Venezuelan
Chamber of Energy Companies (Cámara Venezolana de la Industria Eléctrica), and also from
the quarterly reports of the Caracas Electricity Company (EDC), which were published until
2009. Variables include: average price, and electric consumption per-service and per-state.
Due to the wide range of prices and electricity tariffs (industrial, commercial, rural,
urban, among others), for all the states we chose the average price charged by EDC until the
third quarter of 2009 (latest quarterly report available), as shown in Table 28. This allows
standardizing fees and projecting how much could be collected with the tax.
Table 28. Average Price of Electric Service 2007 (USD ¢ / KWh)
Type of service Price
Residential 5.51
Commercial 5.48
Industrial 4.12
Others 5.66
Source: EDC.

52
We simulate establishing a tax on electrical consumption in 2007 per kilowatt consumed
to residential consumers, commercial establishments, and industrial firms. We simulated with
three different tax rates—30, 50 and 100 percent32—on the total price per-KWh. We assume that
demand is not affected by the imposition of the tax. In this case we believe that prices could be
high enough to matter and affect demand for electricity, however, as there is not enough
available data to estimate price elasticities, we do the exercise as described, acknowledging that
our results could be overestimated. It would also be desirable to allow for exemptions and
reduced rates for low levels of energy consumption, but the aggregated data do not allow us to
make these calculations.
The results indicate that tax collection could be significant, even larger than with the
gasoline tax. Setting the tax in 2007 at 30 percent would have generated USD 605 million or
11.1 percent of states’ total revenues. Table 29 presents the results.
Table 29. Revenues Collected through Potential Tax on Electrical Consumption 2007
Tax collected 30% Tax Rate 50% Tax Rate 100% Tax Rate
MM Bs.F. 2,600 4,333 8,665
MM USD 605 1,008 2,015
% GDP 0.5% 0.9% 1.8%
% Transfers to States 11.6% 19.3% 38.7%
% Total Revenues 11.1% 18.5% 36.9%
Source: Authors’ calculations.
There is not enough data to assess stability, but international evidence shows that this tax
could be a stable source of revenues, which is one of its advantages. Finally, the results also
indicate that the tax is not as homogenous as the gasoline tax, with some states collecting
significantly more revenues in relation to their population. This is because they have industries
32 While these high tax rates may seem unrealistic, the price of electricity has been fixed for more than five years, with average yearly inflation of more than 25 percent. Therefore, even with a 100 percent tax, real prices would still be significantly lower than they were five years earlier. If this proposal were to be implemented it would be logical to increase electricity prices and establish a lower tax rate. However, high tax rates are more illustrative of potential state revenues from establishing these taxes.

53
that are intensive in electricity consumption, such as the steel industry in Bolivar state. Figure 11
shows the per capita revenues that could be potentially collected.
From this exercise we conclude that a tax on electrical consumption could have multiple
advantages that tackle some of the problems identified, particularly i) large revenue potential and
ii) stability. Also, like the gasoline tax, this tax is very convenient because of its low
administrative costs. Few companies sell electricity, and they do so with a straightforward way
of setting prices. Regarding disadvantages, while it may be obvious rather visible tax, historically
- 20 40 60 80 100 120 140 160 180 200
AMAZONASANZOÁTEGUI
APUREARAGUA
BARINASBOLÍVAR
CARABOBOCOJEDES
DISTRITO CAPITALFALCÓN
GUÁRICOLARA
MÉRIDAMIRANDA
MONAGAS-DELTA AMACURONUEVA ESPARTA
PORTUGUESASUCRE
TÁCHIRATRUJILLO
VARGASYARACUY
ZULIA
Per Capita USD
Stat
es
Figure 11. Revenues Collected Per Capita with 30 percent Tax Rate by State, 2007
Source: Authors' calculations.

54
it has not been as politically sensitive as the gasoline tax, and it does not require a change in the
Constitution to be approved.
7.3 Personal Income Tax Surcharge A personal income tax surcharge (PIT) could diminish fiscal dependence of small municipalities
with serious problems of efficiency to collect taxes. We propose an income tax surcharge, which
is set by each municipality in order to exploit the benefits of direct competition among them.
Municipalities could help enforce the collection of the PIT by sharing information with the
central government. Furthermore, citizens could benefit from the PIT surcharge because
competition between municipalities could improve the quality of the public services they provide
To calculate the effects of the PIT we used 2001 household income census data. Using
the income data of each municipality we estimated the tax base of the personal income tax as the
sum of all incomes above 1,000 inflation-adjusted units (Unidades Tributarias) per year, to
which the lowest tax bracket applies. As a result, the potential revenues of the proposed
mechanism were 1 percent of the estimated tax base. It is important to note that, even though the
rate would be equal for all tax brackets, the PIT as a whole would still be progressive.
Our estimations show that a 1 percent surcharge would have represented about USD 106
million in 2001, which would be equivalent to 4 percent of total revenues for all municipalities
and 8 percent of own revenues. This measure could also have the potential of diminishing the
fiscal dependence of low-revenues municipalities. In fact, for the fifth quintile the surcharge
revenues could have accounted for 60 percent of own-revenues and 2 percent of total revenues.
However, for the first quintile it could have represented 9 percent of own revenues and 4 percent
of total revenues. It is important to note that the PIT surcharge would greatly benefit the higher-
revenue municipalities. According to our estimations, the first quintile would have received
around USD 91 million, which represents 88 percent of total PIT surcharge estimated collection
(see Figure 12).
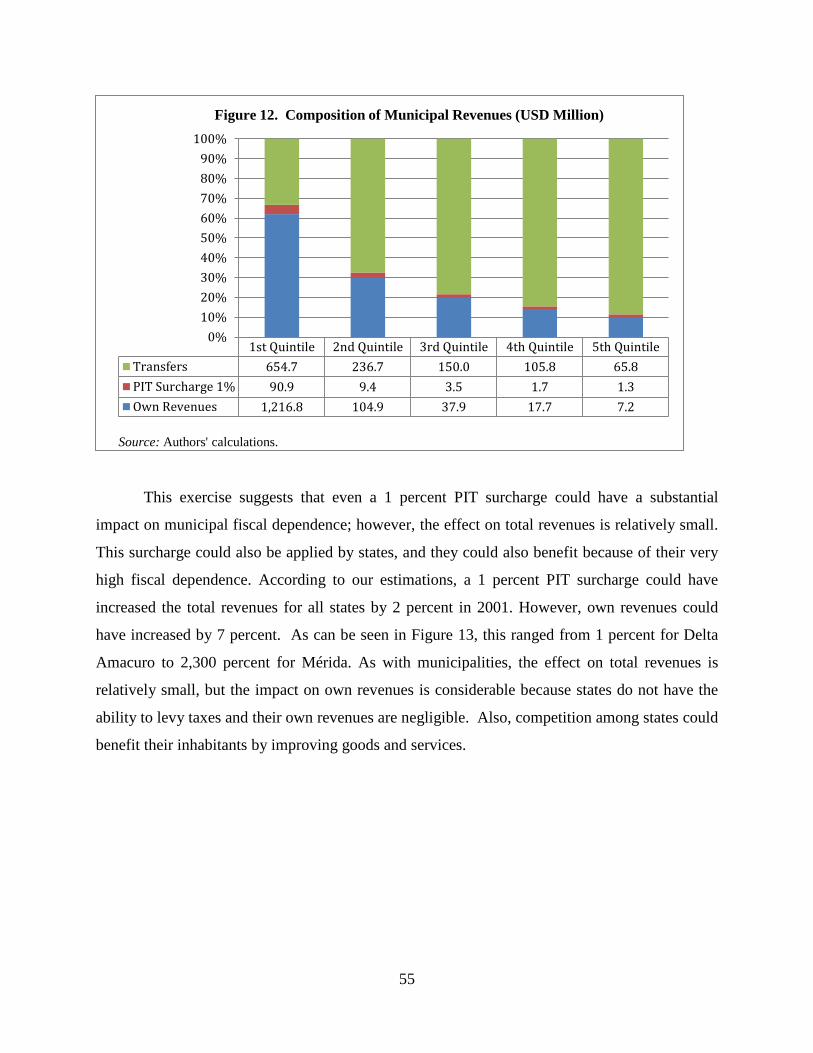
55
This exercise suggests that even a 1 percent PIT surcharge could have a substantial
impact on municipal fiscal dependence; however, the effect on total revenues is relatively small.
This surcharge could also be applied by states, and they could also benefit because of their very
high fiscal dependence. According to our estimations, a 1 percent PIT surcharge could have
increased the total revenues for all states by 2 percent in 2001. However, own revenues could
have increased by 7 percent. As can be seen in Figure 13, this ranged from 1 percent for Delta
Amacuro to 2,300 percent for Mérida. As with municipalities, the effect on total revenues is
relatively small, but the impact on own revenues is considerable because states do not have the
ability to levy taxes and their own revenues are negligible. Also, competition among states could
benefit their inhabitants by improving goods and services.
1st Quintile 2nd Quintile 3rd Quintile 4th Quintile 5th QuintileTransfers 654.7 236.7 150.0 105.8 65.8PIT Surcharge 1% 90.9 9.4 3.5 1.7 1.3Own Revenues 1,216.8 104.9 37.9 17.7 7.2
0%10%20%30%40%50%60%70%80%90%
100%
Source: Authors' calculations.
Figure 12. Composition of Municipal Revenues (USD Million)

56
7.4. VAT Surcharge In this section we propose a regional surcharge on the Value Added Tax (VAT) collected by the
federal government. This tax could have the advantage of improving fiscal autonomy and
reducing revenue volatility, while being relatively easy to implement. It could also have the
added advantage of improving information sharing between federal and local tax agencies, thus
contributing to improving the collection of other taxes.
Regional VAT surcharges have often been dismissed because they are hard to implement,
but the experience of Canada and Russia shows that they are not only manageable, but even
desirable compared to other taxes (Bahl and Bird, 2008). In particular, Canada has had a long
successful experience with the implementation of the Goods and Services Tax (GST) where
provinces set different tax rates, and even in some cases use different tax bases (Bird and
Gendron 2000).33
The value added tax in Venezuela (Impuesto al Valor Agregado, or IVA by its Spanish
acronym), is collected by SENIAT. This tax was originally created in the mid-1990s as a way to 33 There are concerns with the implementation of such a system in developing countries with weaker tax institutions, especially in light of the Brazil and Argentina experiences. For a more detailed discussion see Bird and Gendron (2000).
0%10%20%30%40%50%60%70%80%90%
100%DE
LTA
AMAC
URO
NUE
VA E
SPAR
TAYA
RACU
YCA
RABO
BOSU
CRE
PORT
UGUE
SADI
STRI
TO…
ARAG
UAM
IRAN
DAFA
LCÓN
ZULI
ALA
RATR
UJIL
LOCO
JEDE
SVA
RGAS
BARI
NAS
ANZO
ÁTEG
UIBO
LÍVA
RM
ONAG
ASTÁ
CHIR
AGU
ÁRIC
OM
ÉRID
AAM
AZON
ASAP
URE
Figure 13. Own Revenues Composition
Own Revenues 1% surcharge
Source: Authors' calculations.
57
increase government revenues after a failed structural-adjustment in Venezuela. While it is
strictly a federal tax, it had a regional aspect from its inception; in order to secure enough
political support for its approval, 30 percent of IVA revenues were destined to funding regional
investment projects,34 as established in the 1999 Constitution.
Tax rates have varied over time. Starting at 10 percent in 1993, they have gone up and
down in subsequent administrations. As of 2011, the IVA rate is 12 percent, among the lowest in
Latin America. Given low non-oil taxation in Venezuela, there could be room to increase this tax
through a surcharge destined to regional governments. Collection of IVA reached 6.4 percent of
GDP in 2006 but had declined to 5.6 percent of GDP by 2010.
We believe that a VAT surcharge in Venezuela should have the following characteristics: 1. It should be set at the state level and not at the municipal level: the
administrative complexities of handling 335 different tax rates for each
municipality are substantial. In addition, states are the most dependent on
transfers.
2. Every state should determine the rate: the taxing power (and autonomy)
resides more on who determines the tax rate than on who collects the tax,
(Bird, 2002). Experiences like the case of Canada have shown that a
destination-based tax with different rates could be manageable.
3. SENIAT should collect the tax. It is most efficient and it already has the
institutional infrastructure, making it quicker to implement. It is highly
desirable to transfer both money and information to regional governments.
Using these characteristics we simulate the establishment of a 1 percent VAT surcharge
for every state and analyze the potential effects on revenues, transfer dependence and
heterogeneity for all states. To calculate the effects of the VAT surcharge we use 2010 collection
data by states and municipalities obtained from SENIAT.
Our estimations show that a 1 percent VAT surcharge would have represented about
USD 884 million in 2010, a significant increase of 13 percent of state revenues.35 However, this
34 Originally through FIDES, now FCI, see Section 4.1.2 above. 35 To simplify, we assumed an elasticity of zero to a 1 percent increase in IVA. This would not be a plausible assumption with increases larger than 1 percent.

58
increase would be largely unequal, significantly favoring states with large urban populations
over rural states. Table 30 presents these results.
Table 30. Potential Revenues from a VAT 1% Surcharge (USD Million)
State Transfers Own Revenues
Total Revenues
Revenues from 1%
VAT surcharge
Surcharge % Increase in
Own Revenues
Surcharge % Increase in
Total Revenues
AMAZONAS 111 - 111 0.5 INF 0% ANZOÁTEGUI 324 7.7 332 22.4 289% 7% APURE 186 - 186 1.1 INF 1% ARAGUA 290 11.9 302 25.6 216% 8% BARINAS 180 1.4 181 5.9 423% 3% BOLÍVAR 296 67.0 363 39.7 59% 11% CARABOBO 452 220.7 673 97.4 44% 14% COJEDES 117 0.1 117 0.5 374% 0% DELTA AMACURO 105 0.3 105 0.3 115% 0% DISTRITO CAPITAL 373 44.2 417 316.6 716% 76% FALCÓN 207 5.0 212 6.7 133% 3% GUÁRICO 178 4.0 182 3.9 97% 2% LARA 379 31.1 410 41.7 134% 10% MÉRIDA 185 1.8 187 9.7 526% 5% MIRANDA 454 136.3 591 217.2 159% 37% MONAGAS 325 16.0 341 8.3 52% 2% NUEVA ESPARTA 130 11.6 142 1.6 14% 1% PORTUGUESA 190 1.9 192 4.0 209% 2% SUCRE 195 1.8 197 4.6 254% 2% TÁCHIRA 285 22.7 308 22.4 99% 7% TRUJILLO 172 0.6 172 4.2 647% 2% VARGAS 133 0.0 133 1.5 12096% 1% YARACUY 190 7.4 197 0.7 10% 0% ZULIA 621 2.3 623 48.0 2064% 8% Total 6,078 595.9 6,674 884.1 148% 13%
Source: SENIAT, ONAPRE and authors’ calculations.
Revenues would have increased by 76 percent in Distrito Capital and 37 percent in
Miranda, but only minimally in scarcely populated states such as Amazonas and Delta Amacuro.
The median total revenue increase would have been of 3 percent, hardly a significant amount.
These results mirror the unequal consumption patterns in Venezuelan states. Regarding fiscal
dependence, the impact would also be significant but unequal.

59
Finally, we analyze the stability of the IVA and conclude that it would be a relatively
stable source of revenues for states. The collection of this tax has fluctuated between 4.5 percent
and 6.5 percent of GDP for the past 10 years, with changes responding mainly to rate variations.
We could not evaluate changes in IVA collection among states because of lack of data, but we
expect them to be very small.
A VAT surcharge thus presents great advantages but also important challenges. On one
hand, it provides great revenue potential. A 1 percent surcharge would have raised states’ 2010
revenues by 13 percent and decreased fiscal dependence by the same rate. With VAT rates on the
lower end of the regional scale, even higher rate increases are not out of the question. It also
presents the advantage of being relatively stable. On the other hand, these increased revenues
would mostly come from states with large urban populations, particularly Distrito Capital and
Miranda, where Caracas is located. Rural states would hardly benefit; this could be addressed,
however, by using compensation mechanisms.
7.5. Improving Collection of Own Tax Revenues An important cause for high dependence on central government transfers is that local agencies
are inefficient collecting taxes, leading to high rates of tax evasion. Unofficial data from the
Sucre municipality, one of the largest in the country, estimates the tax evasion rate at more than
45 percent. Anecdotal evidence suggests much larger rates in smaller and less institutionally
developed municipalities. We believe that there are several improvements that can be achieved at
the central government level, and even at the local government level, to improve this situation.
In general terms we have already discussed one potential reason for this problem, which
is the great importance of central government transfers in municipal revenues. Several studies
have documented this relationship in other contexts and have found that, holding everything else
constant, increasing transfers discourage tax collection (Reeb and Tomson, 1985). While in most
recent years transfers to municipalities have decreased, the historical trend has been for them to
increase over time; thus without any effort, local governments have traditionally increased their
revenue. While this lack of effort certainly explains part of the problem, in this section we will
focus on other specific problems and possible solutions to improve local government tax
collection.

60
While the problems are numerous, they can be grouped into three categories: i)
estimation and payment obstacles; ii) inadequate coercive policies iii) low tax morale and
culture.
7.5.1 Estimation and Payment Obstacles The most essential tasks of tax agencies are calculating the tax bill and collecting it. Both are
problems for Venezuelan local governments.
The first problem is that of estimation. For example, calculating the correct tax is
particularly difficult in the case of land and property taxes, where cadastres are generally
outdated. Keeping an up-to-date cadastre requires significant investments that most
municipalities cannot afford. Cadastres in Venezuela are generally outdated, paper-based, and
not automatically adjusted for inflation. Even in some of the largest municipalities, such as
Maracaibo and Sucre, local authorities do not count with reliable information to calculate land
taxes. 36 This makes it difficult to update land prices regularly, and therefore leads to
underestimation of tax bills.
Also, while taxes on economic activities are fairly easier to calculate and keep updated,
taxes on other concepts such as advertising and vehicles many times also require complex
calculations that are not straightforward.
The second problem is related to the difficulties taxpayers face in paying taxes. In most
municipalities payment is only received at tax offices, and in some at banks. Very few allow tax
payments to be made over the Internet. 37 Research by Dev Sood (2001) and Ramachandriah
(2003) have highlighted the importance of the use of Internet to increase tax collection in
developing countries.
One of the reasons for all of these difficulties in determining and collecting taxes are
found in local legislations. To have 335 municipalities and the same number of tax agencies and
local legislative councils drafting local ordinances that determine details for tax collection can
36 Between 2009 and 2011 CAF financed the Regional Program for the Update and Improvement of Local Management (PRAMEG) for selected Venezuelan municipalities. Among the six municipalities analyzed (San Cristobal, Naguanagua, Lechería, Piar, Cedeño and Sucre), the most common recommendation was the improvement of local cadastres and geographic information systems. Shared problems included outdated information, inadequate information-sharing within municipal offices, and very basic tax-collection information systems. 37 A web survey by the authors found that only four of more than 60 municipalities from large and small cities offer the option of online payment.

61
lead to complex and non-operative legislation. Many of these agencies and councils lack the
knowledge and support systems to avoid inadequate ordinances that are not strategic, make it
difficult to collect and sometimes have significant loopholes.
7.5.2 Inadequate Coercive Policies A second problem is insufficient local tax pressure. Tax agencies should be able to identify and
sanction violators effectively to discourage evasion. It is complicated to discourage evasion on
taxes on economic activities, advertisement and other taxes where sanctions exist, when in
Venezuela local tax agencies generally underinvest in the number and the training of tax agents
and auditors. Even those who do have enough personnel rarely use data and geo-location tools to
efficiently identify violators. The institution of performance-based financial incentives for tax
collectors, such as those recommended in Kahn, Silva and Ziliak (2001), is seldom used.
Also, sanctions are low. For property taxes, there does not exist the possibility of
foreclosure or freezing other assets belonging to violators. For taxes on economic activities,
businesses can be temporarily shut down for violations, but it is not possible for tax agencies to
impound their assets. In general, financial penalties are also low.
Moreover, there are serious problems of corruption. Reasons for this include underfunded
and politically controllable Audit Offices (Contralorías) as well as lack of public financing of
political parties. Taxes are many times informally pardoned in exchange for political or personal
donations.
7.5.3 Low Tax Morale and Culture Several studies, such as Davis, Hecht and Perkins (2003), Trivedi, Shehata and Lynn (2003) and
Snavely (1991), point to the importance of these variables in determining tax evasion.
As an oil-exporting country, Venezuela has traditionally lacked tax culture. As Karl
(1977) argues, oil dependence leads to the idea that resources from hydrocarbon exports are
enough to finance public services. While SENIAT has improved tax culture in recent years, as it
has increased tax pressure, it is still rather poor. Also, the political polarization of recent years
has not helped matters.
Areas for improvements include highlighting the relationship between taxes and public
services, and using campaigns to improve the ethics and morality of citizens regarding tax

62
compliance. Some authors have emphasized the importance of enhancing and communicating the
fairness of the tax system.
In light of these problems, we identify several options for improvements of tax
institutions in order to raise local revenues. 1. Investing in Local Cadastres. The central government should get involved in
this for several reasons:
a. Cadastres require significant investments that are harder to finance
by municipalities;
b. It is an investment that has economies of scale;
c. These are investments that can pay for themselves in a few years;
d. There are advantages in having multiple cadastres use the same
technology and have the same format; and
e. Updated cadastres are important for local planning.
This investment could be a direct subsidy, a partial financing or a loan. It
could also be a system where a municipality could pay a fee for access to a
centralized database and an information system.
2. Creating a Local Tax Support Office. This office could help in several ways:
a. Create standardized tax ordinances that tax offices and legislatives
can use, and give support to those who require help. This would
help harmonize tax rates and procedures.
b. Advise on using intelligence and data
c. Provide training to tax collectors
d. Share success stories
e. Establish secure channels to share information between SENIAT
and all municipalities.
3. Allow for heavier sanctions. Freeze assets and foreclosure homes.

63
In order to implement some of these measures it will be necessary to provide resources
and training to municipalities. This could be done with the collaboration of the central
government though the design and implementation of municipal interventions that could
strengthen the institutional capacity of local entities. In this regard, multilateral development
banks could play a role in supporting governments (central and local) with loans and technical
cooperation.
7.6. Changes to the Intergovernmental Transfer System As it has been discussed extensively in this paper, fiscal volatility is an important problem that
sub-national governments face in Venezuela. The main source of volatility is central government
transfers to sub-national governments. The most important and volatile transfer mechanism is the
Situado Constitucional, which is calculated as a fixed percentage of ordinary revenues.
Meanwhile the FCI, a smaller transfer mechanism funded mainly by VAT revenues, provides a
somewhat more stable source of revenues.
In addition, local governments are not well prepared to deal with the volatility of
transfers as well as of own-revenue fluctuations correlated to the business cycle. Clearly, this has
negative effects on public service provision at the local level, and it makes the design and
implementation of local development plans more difficult.
The volatility of central government revenues mainly comes from Venezuela’s
dependency on oil exports. Therefore, the most obvious way to reduce volatility would be to
increase the importance of non-oil taxes as a proportion of total government revenues. In fact,
notwithstanding the important efforts made by the tax administration (SENIAT) in recent years,
non-oil revenue as a percentage of GDP is lower compared with international standards and one
of the lowest in Latin America (Ríos, 2004).
This problem is aggravated because the central government does not have efficient and
credible stabilization mechanisms at the macroeconomic level. The traditional literature on fiscal
federalism gives the central government the task of macroeconomic stabilization (Oates, 1972).
This is the case mainly because the central government has access to monetary policy, and in
developing countries it usually has access to cheaper and more stable sources of financing as
compared with sub-national governments. Also, it is harder for sub-national governments to have

64
stabilization mechanisms because of coordination problems, as well as borrowing and
institutional constrains.
A first approach to reduce the volatility of transfers to sub-national governments would
be to stabilize central government revenues. A common and proven solution is the use of a
macroeconomic stabilization fund. However, since 1998 the rules for the existing
macroeconomic stabilization fund have been changed several times to accommodate short-term
fiscal difficulties. These changes have made the mechanism inoperative and non-credible. We
believe the challenge is not to create a new mechanism, but to make the existing one work in a
credible and transparent manner.
A second approach for the central government would be to design and implement transfer
stabilization mechanisms. In this regard, there are some Latin American experiences worth
discussing. (For example, see González et al., 2002). One clear alternative is to change the way
in which transfers are calculated. Instead of using a formula that establishes a fixed proportion of
ordinary revenues, which are very volatile, the central government could use a scheme in which
transfers are fixed in real terms and based in the expenditure needs of sub-national governments.
Transfers can also be calculated using moving averages. In the case of Venezuela, where
transfers represent an important proportion of sub-national governments revenues it would be
advisable that the central government and sub-national entities share the risks of a decrease in
total revenues within certain limits. Establishing a floor for transfers could allow for this.
These rules could act as a buffer, preventing sub-national governments from increasing
inflexible expenditures during boom times and giving the central government the responsibility
of securing funding during downturns. Since the current transfer system is set forth in the
Constitution of 1999, any changes would require enormous political will and the construction of
consensus. However, new complementary rules could be easier to adopt.
Alternatively, a form of stabilization would be to allow sub-national governments to
borrow. The easiest way would be to simply allow them to obtain funds from domestic banks
and capital markets. However, this should be implemented carefully because some sub-national
experiences have been disastrous. A limited degree of borrowing by sub-national governments
subject to clear and strictly enforced rules should not create serious fiscal risks. Moreover, if the
borrowing limits are set in relation to own revenues generation, it could also provide incentives
to own revenue mobilization. Another alternative would be to create or use an existing regional

65
investment bank that could lend to sub-national governments if they comply with certain
requirements such as a sound fiscal policy and well-designed and attainable investment plans.
At the sub-national level it could be costly and difficult to implement stabilization
mechanisms, given institutional weaknesses; however some simple rules may help. Evidently,
efforts to increase own revenues such as the options that have been described in previous
sections of this paper could help to mitigate the dependency on transfers. Another alternative is
to make expenditures more flexible, for example, by designing investment plans that can be
adjusted over time, and not letting current expenditures such as salaries dominate sub-national
budgets. Such flexibility could be implemented as expenditure rules at the sub-national level.
Sub-national governments could also establish saving funds, which could be used to save
during boom times and to spend during downturns. There have been experiences of this kind in
some Mexican and US states (González et al., 2002).
Finally, a strategy could be to treat the consequences of revenue volatility rather than
volatility itself. One option would be to increase the share of transfers that go to the FCI relative
to the Situado Constitucional. Some of the revenues generated by the proposals in previous
sections could go directly to this more stable fund. Another option could be to make the public
sector labor market more flexible, allowing local governments to more easily reduce their wages
and salaries expenditures in times of revenue downturns.
All these measures taken individually may not be enough to mitigate the volatility
brought about by the intergovernmental transfer system, but all together could help to improve
the fiscal performance of both central and sub-national governments. An important prerequisite
of any proposal at the local level to reduce volatility is to establish simple and clear rules, which
minimize discretionary policymaking.
8. Conclusions and Recommendations In Venezuela around 90 percent of total exports are oil products, and close to 50 percent of fiscal
revenues are generated by hydrocarbon activities. This has resulted in high volatility in the main
macroeconomic variables because of the variability of oil prices and the lack of stabilization
mechanisms. The volatility of fiscal revenues is transmitted to sub-national finances, since
around 70 percent of sub-national revenues come from transfers from the central government,
and local authorities, as their central policymaker counterparts, do not have instruments to deal

66
with large variations in their revenues. As a matter of fact, one of the main sources of financing
for governors and mayors is the Situado Constitutional, a transfer of 20 percent of ordinary fiscal
revenues from the central government that is closely linked to highly volatile oil fiscal revenues.
An important characteristic of the Venezuelan economy is the very low level of non-oil
taxation. In 2009 non-oil taxes reached 14 percent of GDP, while the average for Latin America
is around 17 percent. This could be viewed as an opportunity because there is space to increase
sub-national governments’ resources through taxation. This could contribute to reducing revenue
volatility for states and municipalities caused by their dependence on transfers from the central
government, which in turn experience large fluctuations due to their dependence on oil revenues.
This could also help to improve accountability because citizens will be willing to pay more taxes
at the sub-national level, requesting better public services to local authorities.
The process of decentralization in Venezuela started as a political response to the loss of
legitimacy of the political system brought about by the exhaustion of an economic model based
on the distribution of oil revenues. Although from a political point of view the decentralization
process advanced rather fast, beginning with direct election of governors and mayors in 1989, a
similar process of fiscal decentralization did not accompany the political decentralization. This
resulted in major challenges for local authorities given that several states and municipalities have
spending responsibilities, mainly in education and health services, which were transferred by the
central government with no clear funding mechanisms. Despite the fact that the central
government has transferred resources previously included in the national budget to fund these
responsibilities, there are not operative criteria to determine if those resources are enough to
maintain levels of efficient services. In recent years there is evidence of a marked deterioration in
the public services transferred to the states, due to lack of funding.
At the same time, sub-national governments face significant legal and institutional
restrictions to obtaining fiscal revenues. By law, states cannot levy taxes independently and have
no borrowing authority; therefore their budgets depend 90 percent on transfers from the central
government budget. Municipalities, on the other hand, have some limited tax authority on urban
property and industrial and commercial activities; therefore their dependency on transfers from
the central government is less than 50 percent of their total budget. There nonetheless exists great
heterogeneity among municipalities in this regard. Using the methodology of a stochastic frontier
model we concluded that there are serious efficiency problems in the collection of existing

67
municipal taxes, which contribute to increasing disparities in the scope and quality of goods and
services offered by municipalities. This suggests that there is room for improvement in the
collection of existing taxes through the strengthening of institutional and administrative
capacities of municipal governments.
For the states, we have proposed to give them tax authority, and we have suggested
several resources-generating mechanisms. In particular we explored the impact of a tax on
gasoline consumption and a state tax on electricity consumption. We also suggested a VAT
piggy-backing mechanism. For municipalities, we suggested the introduction of a personal
income tax surcharge that could also be implemented at the state level. There is also room to
improve efficiency in the collection of existing taxes, and several measures in this regard have
been suggested here. We concluded that these proposals could generate important resources for
both states and municipalities, and contribute to decrease fiscal dependence from the central
government, reduce the volatility of sub-national revenues and mitigate the negative impacts of
the economic cycle. However, the disparities that could result from these changes should be
addressed by making the transfer system more redistributive. It is also necessary to introduce
changes to the transfer mechanism to reduce the volatility that sub-national governments face,
and provide local authorities with tools that allow them to provide local services in an efficient
manner that is not subject to the volatility of oil revenues.

68
Bibliography Bahl, R., and R. Bird. 2008. “Subnational Taxes in Developing Countries: The Way Forward.”
Public Budgeting & Finance. 28: 1–25.
Barrios, A. 1998. “Las Finanzas Públicas de los Estados en Venezuela.” In: Descentralización en
Perspectiva. Caracas, Venezuela: Ediciones IESA.
----. 2000. “El Financiamiento de la Descentralización en Venezuela.” Cuadernos del Cendes
17(45): 51–66.
Battese, G.E., and T.J. Coelli. 1992. “Frontier Production Functions, Technical Efficiency and
Panel Data: With Application to Paddy Farmers in India.” Journal of Productivity
Analysis 3: 153-169.
Battese, G.E., and G.S. Corra. 1977. “Estimation of a Production Frontier Model: With
Application to the Pastoral Zone of Eastern Australia.” Australian Journal of Agricultural
Economics 21: 169-179.
Bird, R. 2002. “Fiscal Federalism in Russia A Canadian Perspective.” International Tax Program
Paper 409. Toronto, Canada: University of Toronto: Rotman School of Management.
Bird, R., and P. Gendron. 2000. “VATs in Federal States: International Experience and
Emerging Possibilities.” Toronto, Canada: University of Toronto: Rotman School of
Management. Mimeographed document.
Brewer-Carías, A. 2004. “Centralized Federalism in Venezuela.” Paper presented at the seminar
“Federalism in the Americas and Beyond,” Pittsburgh, United States, Duquesne
University.
Coelli, T.J. 1995. “Estimators and Hypothesis Tests for a Stochastic: A Monte Carlo Analysis”.
Journal of Productivity Analysis 6: 247-268.
Davis, J., G. Hecht and J. Perkins. 2003. “Social Behaviors, Enforcement, and Tax Compliance
Dynamics.” Accounting Review 78(1): 39-69.
De la Cruz, R. 2004. “Decentralization: Key to Understanding a Changing Nation.” In: J.L.
McCoy and D.J. Myers, editors. The Unraveling of Representative Democracy in
Venezuela. Baltimore, United States: Johns Hopkins University Press.
----. 1992. “La Estrategia de la Descentralización en Venezuela.” In: R. de la Cruz, coordinator.
Descentralización, Gobernabilidad y Democracia. Caracas, Venezuela: Editorial Nueva
Sociedad.

69
----. 1994. “Tocando a la Puerta del Federalismo Fiscal.” In: R. de la Cruz and A. Barrios,
editors. Federalismo Fiscal: El Costo de la Descentralización en Venezuela. Caracas,
Venezuela: Editorial Nueva Sociedad.
De la Cruz, R., and A. Barrios. 1998. “Venezuela: Realidades y Perspectivas: Un Pacto para la
Descentralización.” In: R. de la Cruz, coordinator. Descentralización en Perspectiva:
Federación y Finanzas Públicas. Caracas, Venezuela: Ediciones IESA.
Delgado, J.G. 2008. “Reflexiones sobre la Descentralización en Venezuela: Ideas para su
Profundización.” Serie Diálogo Político. Caracas, Venezuela: Instituto Latinoamericano
de Investigaciones Sociales.
Dev Sood, A. 2001. “How to Wire Rural India: Problems and Possibilities of Digital
Development.” In: Economic and Political Weekly 36(43): 4134-4141.
García, G. 1997. La Sostenibilidad de la Política Fiscal en Venezuela. Research Network
Working Paper R-317. Washington, DC, United States: Inter-American Development
Bank.
González, C., D. Rosenblatt and S. Webb. 2002. “Stabilizing Intergovernmental Transfers in
Latin America: A Complement to National/Subnational Fiscal Rules?” Policy Research
Working Paper 2869. Washington, DC, United States: World Bank.
Himmelblau, D.M. 1972. Applied Non-Linear Programming. New York, United States:
McGraw-Hill.
Kahn, C.M. et al. 2001. “Performance-based Wages in Tax Collection: The Brazilian Tax
Collection Reform and its Effects.” Economic Journal 111: 188–205.
Karl, T.L. 1997. The Paradox of Plenty: Oil Booms and Petro-States. Berkeley, United States:
University of California Press.
Knoop, J. 1994. Descentralización Fiscal en Venezuela. Serie Política Fiscal 60. Santiago, Chile:
CEPAL.
Lalander, R.O. 2006. “Has Venezuelan Decentralization Survived Chavismo?” Stockholm
Review of Latin American Studies 1: 29-41.
Oates, W. 1972. Fiscal Federalism. New York, United States: Harcourt Brace Jovanovich.
Penfold, M. 2004. Federalism and Institutional Change in Venezuela in Federalism and
Democracy in Latin America. The Johns Hopkins University Press.

70
Puente, J.M. et al. 2009. “Oil Wealth, the Changing Political Structure, and the Budget Process:
The Case of Venezuela.” In: M. Hallerberg, C. Scartascini and E.H. Stein, editors. Who
Decides the Budget? A Political Economy Analysis of the Budget Process in Latin
America. Washington, DC and Cambridge, United States: Inter-American Development
Bank and Harvard University, David Rockefeller Center for Latin American Studies.
Rachadell, M. 2008. “Liberalismo y Federalismo.” Politeia 31(41): 1-29.
Ramachandraiah, C. 2003. “Information Technology and Social Development.” Economic and
Political Weekly 38(12/13): 1192-1197.
Rangel, C. 2007. “El Debilitamiento de las Finanzas Municipales en Venezuela y sus
Consecuencias.” Reflexión Política 9(18): 155-169.
Reeb, D., and L. Tomson. 1985. “Challenges to the Ideal Property Tax: Proposals of
Administrative Measures for Property Tax Reform.” American Journal of Economics and
Sociology 44(4): 463-478.
Ríos, G. 2003. “Sostenibilidad Fiscal en un Contexto de Alta Volatilidad.” In: F. Jaramillo, M.
Castilla and O. Manzano, editors. Sostenibilidad Fiscal en la Región Andina: Políticas e
Instituciones. Caracas, Venezuela: Corporación Andina de Fomento.
Snavely, K. 1991. “Marketing in the Government Sector: A Public Policy Model.” American
Review of Public Administration 21: 311-326.
Tiebout, C. 1956. “A Pure Theory of Local Expenditures.” Journal of Political Economy 64(5):
416-424.
Trivedi, V.U., M. Shehata and B. Lynn, B. 2003. “Impact of Personal and Situational Factors on
Taxpayer Compliance: An Experimental Analysis.” In: Journal of Business Ethics 47(3):
175-197.
Weingast, B. 2009. “Second Generation Fiscal Federalism: The Implications of Fiscal
Incentives.” Journal of Urban Economics 65(3): 279-293.
Yilmaz, S. 200). “Equalization Across Subnational Governments: Fiscal Capacity.” World Bank
Institute (Online Course).
http://www.worldbank.org/wbi/publicfinance/Fiscal_capacity.