
Sub-canopy Soil Moisture Modeling in n-Dimensional Spectral Feature Space
8
Abstract This paper attempts to quantify soil moisture in various canopy cover conditions using n-dimensional spectral signatures, including land surface temperature, vegetation index, albedo, and others. First, the feature vector between the pixels and various moisture contents was indentified. Normalization of the varying distance from a user-defined initial state to any pixel location, and coefficients related with n-dimensional spectral feature space were calculated, assigning weights to each parameter. Then, a soil moisture index was developed using a linear combination of the first order polynomials. The Extended Fourier Amplitude Sensi- tivity Test (eFAST) was used to calculate the relative variance contribution of model input parameters to the variance of soil moisture predictions. Results derived from satellite data including Enhanced Thematic Mapper Plus (ETM) and the Moderate Resolution Imaging Spectroradiometer (MODIS) imagery demonstrated significant correlations between the index and soil moisture obtained for different ecosystems and vegetation cover. The best agreement, the coefficient of determination (R 2 ), between the index and soil moisture were 0.58 and 0.65 for ETM and MODIS data, respectively. eFAST sensitivity analysis indicates that land surface temper- ature might be the most determinant factor in soil moisture estimation, then albedo, followed by NDVI. Introduction Estimating deep and sub-canopy soil moisture is of particu- lar interest to understand regional and global water and energy cycles. Quantitative remote sensing provides accurate and up-to-date information on spatio-temporal dynamics of soil moisture. It is challenging to acquire reliable informa- tion of soil moisture by using a single wavelength in visible, near infrared (NIR), thermal, or microwave domains alone, particularly over complicated surface conditions such as agricultural fields. PHOTOGRAMMETRIC ENGINEERING & REMOTE SENSING February 2011 149 Abduwasit Ghulam is with the Department of Earth & Atmospheric Sciences and the Center for Environmental Sciences, Saint Louis University, Saint Louis, MO 63103 ([email protected]). Timothy M. Kusky is with Three Gorges Research Center for Geohazards, State Key Lab for Geological Processes and Mineral Resources, China University of Geosciences, Wuhan, Hubei 430074, China. Tashpolat Teyip is with the The Ministry of Education Key Laboratory of Oasis Ecology at Xinjiang University, Urumqi 830046, Xinjiang, China. Qiming Qin is with the Institute of Remote Sensing and GIS, Peking University, Beijing 100871, China. Photogrammetric Engineering & Remote Sensing Vol. 77, No. 2, February 2011, pp. 149–156. 0099-1112/11/7702–0149/$3.00/0 © 2011 American Society for Photogrammetry and Remote Sensing Sub-canopy Soil Moisture Modeling in n-Dimensional Spectral Feature Space Abduwasit Ghulam, Timothy M. Kusky, Tashpolat Teyip, and Qiming Qin There have been several reports that advanced soil moisture modeling based on spectral indices of visible and near infrared reflectance data (e.g., Zhan et al., 2007). However, the impact of surface roughness and canopy structure on the reflectance of visible and near infrared data have been a main limitation of optical remote sensing of soil moisture. An alternative approach to the spectral moisture indices in optical domains is the thermal inertia method (England, 1992; Kahle, 1977; Price, 1977 and 1985; Zhang, 1992) based on the relationship between surface emissivity, temperature, and soil moisture. The thermal inertia method is quite effective for bare soil moisture estimation, but demonstrates poor correlation for highly vegetated surfaces. Microwave remote sensing data from Synthetic Aperture Radar (SAR) have been widely investigated in the past due to the ability of SAR beams to penetrate through clouds and vegetation canopies, therefore providing sub-canopy meas- urements in almost any meteorological condition and both during day-time and night-time. Microwave remote sensing of soil moisture is mainly dependent on the dielectric characteristics of the target subject to soil moisture and surface roughness. The relationships between the soil moisture content and radar echo are developed using either empirical methods based on experimental measurements or physical modeling approaches. However, problems in estimating soil moisture considerably increase in the presence of vegetation, because canopies have their own moisture, and can both scatter and attenuate the electromag- netic radiation (Pierdicca et al., 2010). There have been several reports on the application of radar remote sensing for the estimation of sub-canopy soil moisture mostly using low frequency radar data (Moghaddam et al., 2000) or the synergy of radar and optical remote sensing images (Wang et al., 2004). Root zone profile soil moisture content was also estimated using assimilation of remotely sensed soil mois- ture into computational modeling (Das et al., 2008). More recently, a method to estimate soil moisture content over vegetated areas using multisource (AirSAR and Landsat) and multitemporal remote sensing has been developed based on the incremental correction of the vegetation effects and on the integration of multitemporal radar data within an inversion scheme employing the Bayesian maximum posterior probability estimator (Pierdicca et al., 2010). This method uses a reference image acquired over bare soils before the vegetation growing season to quantify, and eventually remove the vegetation effect from the radar echo.
Transcript of Sub-canopy Soil Moisture Modeling in n-Dimensional Spectral Feature Space
AbstractThis paper attempts to quantify soil moisture in variouscanopy cover conditions using n-dimensional spectralsignatures, including land surface temperature, vegetationindex, albedo, and others. First, the feature vector betweenthe pixels and various moisture contents was indentified.Normalization of the varying distance from a user-definedinitial state to any pixel location, and coefficients relatedwith n-dimensional spectral feature space were calculated,assigning weights to each parameter. Then, a soil moistureindex was developed using a linear combination of the firstorder polynomials. The Extended Fourier Amplitude Sensi-tivity Test (eFAST) was used to calculate the relative variancecontribution of model input parameters to the variance ofsoil moisture predictions. Results derived from satellite dataincluding Enhanced Thematic Mapper Plus (ETM�) and theModerate Resolution Imaging Spectroradiometer (MODIS)imagery demonstrated significant correlations between theindex and soil moisture obtained for different ecosystemsand vegetation cover. The best agreement, the coefficient ofdetermination (R2), between the index and soil moisturewere 0.58 and 0.65 for ETM� and MODIS data, respectively.eFAST sensitivity analysis indicates that land surface temper-ature might be the most determinant factor in soil moistureestimation, then albedo, followed by NDVI.
IntroductionEstimating deep and sub-canopy soil moisture is of particu-lar interest to understand regional and global water andenergy cycles. Quantitative remote sensing provides accurateand up-to-date information on spatio-temporal dynamics ofsoil moisture. It is challenging to acquire reliable informa-tion of soil moisture by using a single wavelength in visible,near infrared (NIR), thermal, or microwave domains alone,particularly over complicated surface conditions such asagricultural fields.
PHOTOGRAMMETRIC ENGINEER ING & REMOTE SENS ING Feb r ua r y 2011 149
Abduwasit Ghulam is with the Department of Earth &Atmospheric Sciences and the Center for EnvironmentalSciences, Saint Louis University, Saint Louis, MO 63103([email protected]).
Timothy M. Kusky is with Three Gorges Research Center forGeohazards, State Key Lab for Geological Processes andMineral Resources, China University of Geosciences, Wuhan,Hubei 430074, China.
Tashpolat Teyip is with the The Ministry of Education KeyLaboratory of Oasis Ecology at Xinjiang University, Urumqi830046, Xinjiang, China.
Qiming Qin is with the Institute of Remote Sensing and GIS,Peking University, Beijing 100871, China.
Photogrammetric Engineering & Remote Sensing Vol. 77, No. 2, February 2011, pp. 149–156.
0099-1112/11/7702–0149/$3.00/0© 2011 American Society for Photogrammetry
and Remote Sensing
Sub-canopy Soil Moisture Modeling in n-Dimensional Spectral Feature Space
Abduwasit Ghulam, Timothy M. Kusky, Tashpolat Teyip, and Qiming Qin
There have been several reports that advanced soilmoisture modeling based on spectral indices of visible andnear infrared reflectance data (e.g., Zhan et al., 2007).However, the impact of surface roughness and canopystructure on the reflectance of visible and near infrared datahave been a main limitation of optical remote sensing of soilmoisture. An alternative approach to the spectral moistureindices in optical domains is the thermal inertia method(England, 1992; Kahle, 1977; Price, 1977 and 1985; Zhang,1992) based on the relationship between surface emissivity,temperature, and soil moisture. The thermal inertia methodis quite effective for bare soil moisture estimation, butdemonstrates poor correlation for highly vegetated surfaces.Microwave remote sensing data from Synthetic ApertureRadar (SAR) have been widely investigated in the past due tothe ability of SAR beams to penetrate through clouds andvegetation canopies, therefore providing sub-canopy meas-urements in almost any meteorological condition and bothduring day-time and night-time. Microwave remote sensingof soil moisture is mainly dependent on the dielectriccharacteristics of the target subject to soil moisture andsurface roughness. The relationships between the soilmoisture content and radar echo are developed using eitherempirical methods based on experimental measurements orphysical modeling approaches. However, problems inestimating soil moisture considerably increase in thepresence of vegetation, because canopies have their ownmoisture, and can both scatter and attenuate the electromag-netic radiation (Pierdicca et al., 2010). There have beenseveral reports on the application of radar remote sensingfor the estimation of sub-canopy soil moisture mostly usinglow frequency radar data (Moghaddam et al., 2000) or thesynergy of radar and optical remote sensing images (Wang etal., 2004). Root zone profile soil moisture content was alsoestimated using assimilation of remotely sensed soil mois-ture into computational modeling (Das et al., 2008). Morerecently, a method to estimate soil moisture content overvegetated areas using multisource (AirSAR and Landsat) andmultitemporal remote sensing has been developed based onthe incremental correction of the vegetation effects and onthe integration of multitemporal radar data within aninversion scheme employing the Bayesian maximumposterior probability estimator (Pierdicca et al., 2010). Thismethod uses a reference image acquired over bare soilsbefore the vegetation growing season to quantify, andeventually remove the vegetation effect from the radar echo.
150 Feb r ua r y 2011 PHOTOGRAMMETRIC ENGINEER ING & REMOTE SENS ING
The method provided new ideas to tackle the problemsassociated with vegetation growth in estimating soil mois-ture, and holds great promise for the near future with theincreasing number of radar missions and sensors planned tobe launched. However, pitfalls such as limited availability ofradar coverage, and difficulties in practical applications ofthe complicated retrieval algorithms may be a challengingpoint to widely apply the approach. Land surface tempera-ture (LST), vegetation index, and albedo are all usefulindicators of soil moisture and can be used to quantifysurface dryness in multi-dimensional feature space. Studiesbased on the LST versus the normalized difference vegetationindex (NDVI) scatter plot show promise for soil moistureestimation (Goward and Hope, 1989; Moran et al., 1994;Price, 1990; Sandholt et al., 2002; Wan et al., 2004). How-ever, most studies have not found the slope between LSTand NDVI to be practical for soil moisture estimation. Sincethe location of a pixel in LST-NDVI space is influenced bymany factors, surface types may have different LST/NDVIslope and intercept for equal atmospheric and surfacemoisture conditions.
Water supply is the major motivation of modeling theevapotranspiration process, therefore, the relationshipbetween soil moisture content and the evapotranspirationrate is significant. Attempts have been made to developregression models for sub-canopy soil moisture prediction(Tian et al., 1992) by linking soil moisture with the cropwater stress index (CWSI) proposed by Jackson and Idso(1981). CWSI, an index based on the synergy of visible andnear infrared data, and thermal temperature, has clear aphysical definition, but one needs local meteorological datato invert soil moisture from the CWSI. The use of meteoro-logical data obtained from discrete weather stations usuallyresults in greater uncertainties, especially for large scalesoil moisture estimation. Classic limitations including time-lag effects, being too complex to calculate and excessivelydependent on meteorological observations or field measure-ments, have been the major challenge facing practicalapplication of such methods. Therefore, development ofsimple, effective and operational methods for the satelliteestimation of sub-canopy soil moisture is of great interestfor both researchers in the remote sensing community andfor policy makers for the sustainable development of eco-environments.
The combination of visible-near infrared, thermal, andmicrowave wavelengths may provide a promising tool forsub-canopy soil moisture estimation. The objective of thisstudy is to explore further the potential of thermal andoptical data synergy in n-dimensional spectral featurespace to quantify soil moisture under various vegetationcanopies.
MethodsThe n-Dimensional Dryness Index (NDDI)Jackson (1983) proposed the concept of n-space indicesand the basis for forming physically significant indices in n-space using linear combinations of n-spectral bands (e.g.,n-dimensional greenness index). Early developed spectralvegetation indices such as the perpendicular vegetation index(PVI) (Richardson and Wiegand, 1977) and the Tasseled Captransform of Kauth and Thomas (1976) are examples of 2Dand 4D spectral spaces, respectively, and special cases of n-space indices. The method outlined here is a furtherextension of the n-space concept. Unlike Jackson (1983)’s n-space, the number of dimensions (n) here is the numberof spectral indices including LST, NDVI, and albedo, whichis formed using two or more spectral bands in n-space.
The key issue in quantifying the soil moisture variationin n-dimensional spectral feature space is the feature vectorbetween the pixels with various moisture contents. At leasttwo pixels are required to initiate the index:
(1)
where Xd and Xw stand for dry and wet pixels reflectancesin the spectral space, and i � albedo, LST, NDVI, etc. Featurevectors of Dalbedo, DLST, DNDVI can be normalized using thefollowing equation:
(2)
Next, coefficients related with n-dimensional space(weights for each variable were used) are calculated using
. Then, we can express the n-dimensional surfacedryness index as:
(3)
where Xalbedo, XLST, XNDVI, and Xn represent pixel values ofalbedo, LST, NDVI, and any bio/geophysical variable thatcan be an indicator of soil moisture, respectively. It is notdifficult to see that Ai represents the weight of an inputvariable. If the variance of an input variable is more signifi-cant than that of the other input variables, the weight iscorrespondingly larger. That is to say, the larger the normal-ized distance between two pixels of a temperature image incontrast to the distance between the same two pixels of theNDVI image means the surface temperature is more sensitiveto soil moisture and is therefore assigned a larger weight,or vice-versa. The sum of Ai equals 1.
Generally speaking, an increase in available soilmoisture leads to an increase in surface evapotranspira-tion. Consequently, surface albedo and surface/canopytemperature decrease due to the fact that the availableenergy is used for the evapotranspiration process. Incontrast, with decreasing soil moisture, soil surfaceevaporation and/or transpiration over vegetated surfacesdecrease due to the reduced leaf and/or soil moisturecontent. Up a certain point, it is true that both tempera-ture and surface reflectance/albedo increase. However,there are extreme cases that contradict this general trend.For example, surface temperature is more or less constantover open water or irrigated lands, where albedo is verylow (Roerink et al., 2002). When soil moisture hasdecreased to an extent that no further evapotranspirationcan take place, the temperature decreases while the albedoincreases, since most of the incident energy is reflectedright back out, and very little radiation is absorbed intothe surface. This is particularly true for permanent iceand snow covered regions (e.g., Antarctica), and extremedry areas, such as the Sahara desert. For sub-canopy soilmoisture modeling, the major objective of this contribu-tion, we are dealing with a multidimensional spectralfeature space which is built on a wide variety of soilhydrologic conditions and vegetation growth. The featurevector in Equation 1 is calculated from Xd, Xw whichstands for the reflectances of dry and wet pixels in thespectral space. However, they do not necessarily representthe extreme dry and wet ends of the spectral feature space. Theoretically, this feature vector is the distancebetween any two pixels values of temperature, albedo,or NDVI.
� ANDVI 11 � XNDVI2� Á � AnXn
NDDI � AalbedoXalbedo � ALSTXLST
Ai � Di/B
B � aa
n
iDi
2b
1/2
.
Di � (Xd � Xw)i
PHOTOGRAMMETRIC ENGINEER ING & REMOTE SENS ING Feb r ua r y 2011 151
NDVI, an indicator of vegetation health and growth,increases with increasing soil moisture content. Therefore,NDVI may be subtracted by one to normalize its impact onNDDI in phase with other variables. Thus, the response of all input variables is kept consistent. Since all of the inputvariables are normalized between 0 to 1, the NDDI valueranges between 0 and 1.
However, only the first three variables are discussed inthis contribution; the last term in Equation 3 implies thatthe index may be extended to have n number of inputvariables including leaf area index (LAI), regional precipita-tion, and leaf water content. That means NDDI has greatpotential for crop water stress and drought estimation that is subject to many biophysical variables such as LST, NDVI,albedo, soil moisture, groundwater, and evapotranspiration.
Quantifying the Sources of Variation in NDDIA model sensitivity analysis may be used to quantify thecontribution of each variable on the index, and indentify theirrelative importance. The Extended Fourier Amplitude Test(eFAST) (Saltelli et al., 1978) is used to calculate the relativevariance contribution of model input parameters to thevariance of NDDI predictions. Assuming a non-uniform distribu-tion that can be used to represent the input parameters, effectsof each input parameter on the final output are quantified.
eFAST is an extension of Fourier Amplitude SensitivityTest (FAST) developed by Cukier et al. (1973 and 1978).eFAST uses a probability distribution function of modelinput variables as input data, and quantifies the effect ofeach model input in accounting for output variance (first-order index), and the overall effect of input variables inaccounting for output variance (total-order index). The first-order index represents the percentage of the output variancewhich is accounted for by variation in one model parame-ter, whereas the total-order index represents the percentageof the output variance which is accounted for by variationin a single variable and interactive co-variation betweeneach input variable (Bowyer and Danson, 2004).
Considering the model with three input parameters (as inour case), the total variance V of the model output is calcu-lated as (Ceccato et al., 2002; Bowyer and Danson, 2004):
(4)
where Vx1, Vx2, and Vx3 are the variances of the modelinputs 1, 2, and 3, respectively, Vx12 is the variance ofinteractions between model inputs 1 and 2, Vx23 is thevariance of interactions between model inputs 2 and 3, andVx123 is the variance of interactions between input variables1, 2, and 3. The first-order and the total-order sensitivityindex for the first input variable are then calculated accord-ing to the following relationships:
(5)
The total-order sensitivity index:(6)
The percentage variance accounted for by the interactions:
(7)
Input variable space is scanned simultaneously betweenthe ranges of possible values according to a given probabil-ity density function. Values that have a greater probabilityare selected more than those of low probability. Each inputvariable is assigned a different frequency. Coefficients that
I � 1 � a
3
i�1SXI
.
ST � 1Vx1 � Vx12 � Vx13 � Vx1232/V;
The first-order sensitivity index: Sx1 � Vx1/V;
V � Vx1 � Vx2 � Vx3 � Vx12 � Vx13 � Vx23 � Vx123
characterize the uncertainty due to the variability of theinput data are calculated in terms of the mean and thevariance.
Results and DiscussionField DataEvaluation of the performance of the developed index in ecosystems at different agro-climatic scenarios is ofparamount importance. The NDDI is validated here usingvolumetric soil moisture measured over two test sitesrepresenting different ecosystems including the Shunyidistrict of Beijing and Ningxia Huizu Autonomous Regionof China. A detailed description of the test sites and theexperimental design can be found in Ghulam et al. (2008)and Liu et al. (2002). A number of surface bio/geophysicalvariables in addition to soil moisture were collected duringthe experiment. In the following sections, however, we willfocus on the collection of soil moisture data used in ourstudy.
Sunyi Test Site in BeijingThe Shunyi remote sensing experiment field (E 116°26� to117°00�; N 40°00�to 40°21�) is located in the northeasternsuburbs of Beijing, and geographically belongs to thenorthern China plain, one of the most important agriculturalareas in China. Winter wheat and a summer crop (i.e., corn)are two main crops at the site. The topography of the area isa flat plain with an average elevation of 50 m above the sealevel. More than 70 percent of the total precipitation falls inJuly and August. With its yearly mean air temperature of11.58°C, potential evapotranspiration of 2,050 mm, andprecipitation of 622 mm, the area often suffers severedroughts between late Spring and early Summer, a keygrowth period of winter wheat. The agricultural fields aresufficiently large and regularly edged, making it a perfectspot for remote sensing experiments.
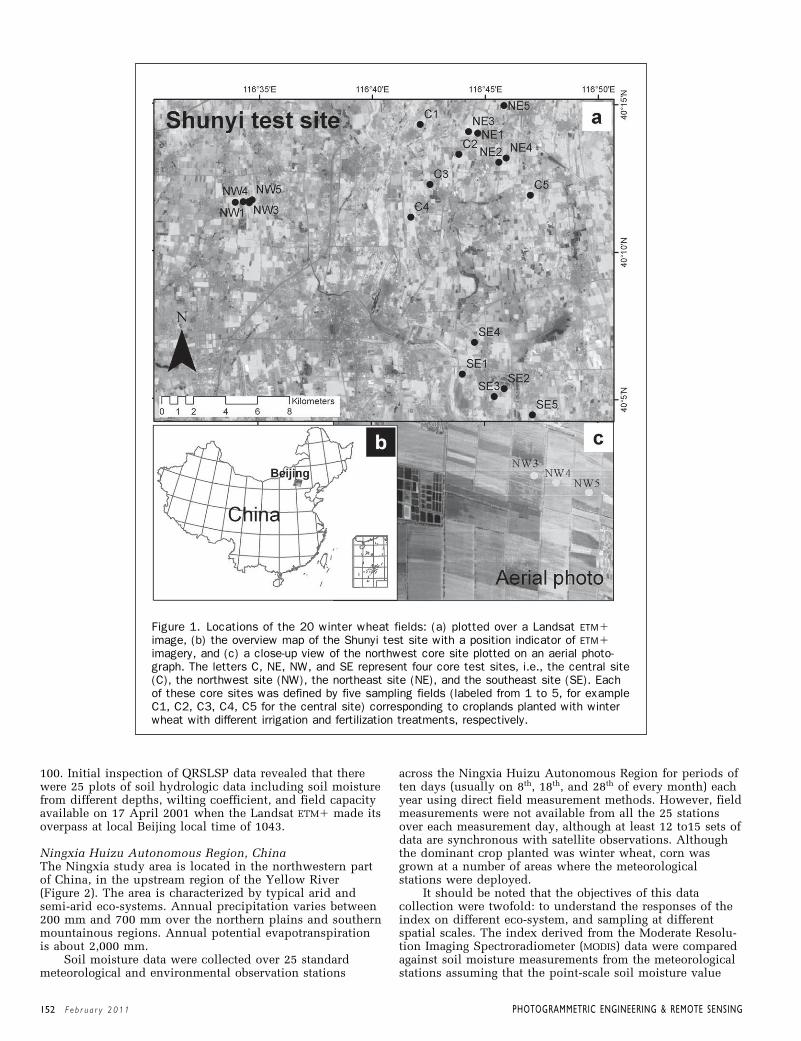
Soil moisture data were collected during the fieldcampaign of Quantitative Remote Sensing theory andapplication of Land Surface Parameters (QRSLSP) in 2001.There was a total of 20 winter wheat fields with differentirrigation and fertilization control selected for modelvalidation. The Huairou Reservoir and several bare soilpatches were also covered for calibration purposes. Figure 1shows the locations of these 20 fields grouped as four coretest sites, i.e., the central site (C), the northwest site (NW),the northeast site (NE), and the southeast site (SE). Each ofthese core sites was defined by five sampling fields (labeledfrom 1 to 5, for example C1, C2, C3, C4, C5 for the centralsite) corresponding to croplands planted with winter wheatwith different irrigation and fertilization treatments, respec-tively. Each field corresponding to bare soil and croplandswith different drought and fertilization conditions wasfurther divided into six sections each at 30 m � 30 m. Thisallowed us to evaluate the model performance usingmedium scale satellite data such as Landsat EnhancedThematic Mapper Plus (ETM�) imagery without concernsabout scale-related uncertainties. Following a stratifiedrandom sampling scheme, soil moisture data from differentsoil depths of 5, 10, 20, 40, 60, and 100 cm were collectedby both the CNC-503DR (the intelligent water neutron meterproduced by Beijing Hean Nucleus Co. Ltd.) and direct fieldmeasurement methods. The CNC-503DR was placed at everymeasuring plot to a 1.1 m soil depth after plot specificradiometric registration. In the direct field measurementmethod, soil moisture content (percentage) was calculatedby dividing the water content of a 1,000 gram sample ofearth by its dried earth counterpart, and then multiplying by
152 Feb r ua r y 2011 PHOTOGRAMMETRIC ENGINEER ING & REMOTE SENS ING
Figure 1. Locations of the 20 winter wheat fields: (a) plotted over a Landsat ETM�image, (b) the overview map of the Shunyi test site with a position indicator of ETM�imagery, and (c) a close-up view of the northwest core site plotted on an aerial photo-graph. The letters C, NE, NW, and SE represent four core test sites, i.e., the central site(C), the northwest site (NW), the northeast site (NE), and the southeast site (SE). Eachof these core sites was defined by five sampling fields (labeled from 1 to 5, for exampleC1, C2, C3, C4, C5 for the central site) corresponding to croplands planted with winterwheat with different irrigation and fertilization treatments, respectively.
100. Initial inspection of QRSLSP data revealed that therewere 25 plots of soil hydrologic data including soil moisturefrom different depths, wilting coefficient, and field capacityavailable on 17 April 2001 when the Landsat ETM� made itsoverpass at local Beijing local time of 1043.
Ningxia Huizu Autonomous Region, ChinaThe Ningxia study area is located in the northwestern partof China, in the upstream region of the Yellow River(Figure 2). The area is characterized by typical arid andsemi-arid eco-systems. Annual precipitation varies between200 mm and 700 mm over the northern plains and southernmountainous regions. Annual potential evapotranspirationis about 2,000 mm.
Soil moisture data were collected over 25 standardmeteorological and environmental observation stations
across the Ningxia Huizu Autonomous Region for periods often days (usually on 8th, 18th, and 28th of every month) eachyear using direct field measurement methods. However, fieldmeasurements were not available from all the 25 stationsover each measurement day, although at least 12 to15 sets ofdata are synchronous with satellite observations. Althoughthe dominant crop planted was winter wheat, corn wasgrown at a number of areas where the meteorologicalstations were deployed.
It should be noted that the objectives of this datacollection were twofold: to understand the responses of theindex on different eco-system, and sampling at differentspatial scales. The index derived from the Moderate Resolu-tion Imaging Spectroradiometer (MODIS) data were comparedagainst soil moisture measurements from the meteorologicalstations assuming that the point-scale soil moisture value
PHOTOGRAMMETRIC ENGINEER ING & REMOTE SENS ING Feb r ua r y 2011 153
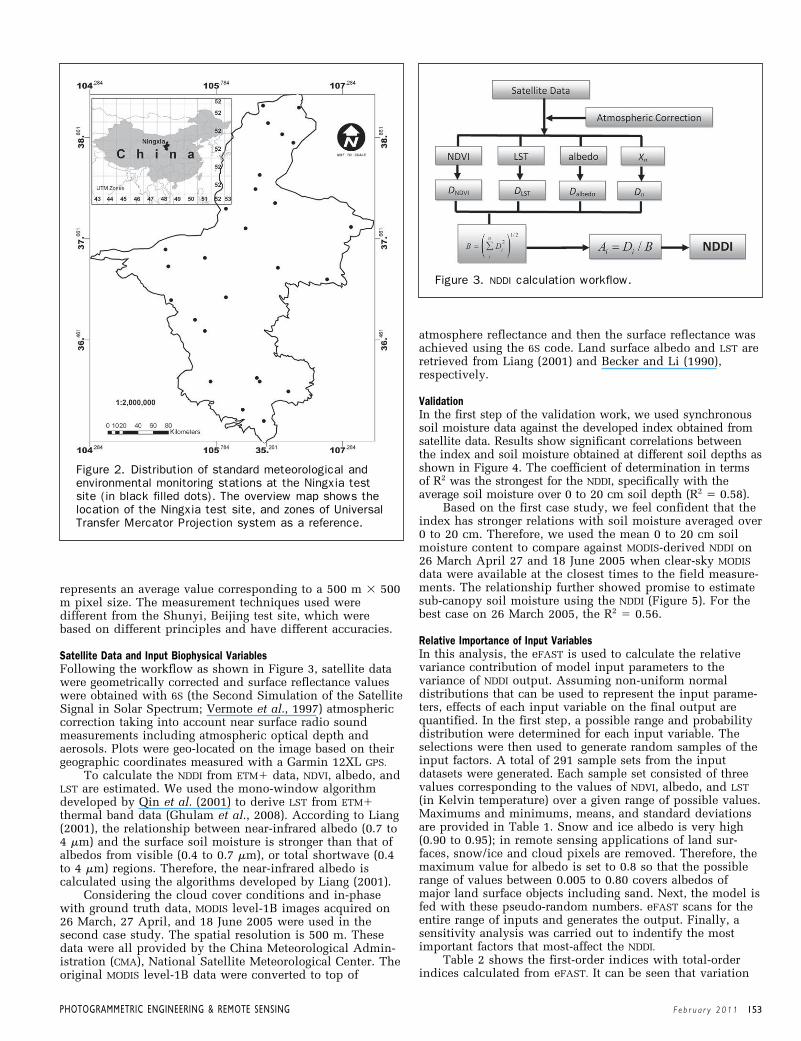
Figure 2. Distribution of standard meteorological andenvironmental monitoring stations at the Ningxia testsite (in black filled dots). The overview map shows thelocation of the Ningxia test site, and zones of UniversalTransfer Mercator Projection system as a reference.
represents an average value corresponding to a 500 m � 500m pixel size. The measurement techniques used weredifferent from the Shunyi, Beijing test site, which werebased on different principles and have different accuracies.
Satellite Data and Input Biophysical VariablesFollowing the workflow as shown in Figure 3, satellite datawere geometrically corrected and surface reflectance valueswere obtained with 6S (the Second Simulation of the SatelliteSignal in Solar Spectrum; Vermote et al., 1997) atmosphericcorrection taking into account near surface radio soundmeasurements including atmospheric optical depth andaerosols. Plots were geo-located on the image based on theirgeographic coordinates measured with a Garmin 12XL GPS.
To calculate the NDDI from ETM� data, NDVI, albedo, andLST are estimated. We used the mono-window algorithmdeveloped by Qin et al. (2001) to derive LST from ETM�thermal band data (Ghulam et al., 2008). According to Liang(2001), the relationship between near-infrared albedo (0.7 to4 mm) and the surface soil moisture is stronger than that ofalbedos from visible (0.4 to 0.7 mm), or total shortwave (0.4to 4 mm) regions. Therefore, the near-infrared albedo iscalculated using the algorithms developed by Liang (2001).
Considering the cloud cover conditions and in-phasewith ground truth data, MODIS level-1B images acquired on26 March, 27 April, and 18 June 2005 were used in thesecond case study. The spatial resolution is 500 m. Thesedata were all provided by the China Meteorological Admin-istration (CMA), National Satellite Meteorological Center. Theoriginal MODIS level-1B data were converted to top of
atmosphere reflectance and then the surface reflectance wasachieved using the 6S code. Land surface albedo and LST areretrieved from Liang (2001) and Becker and Li (1990),respectively.
ValidationIn the first step of the validation work, we used synchronoussoil moisture data against the developed index obtained fromsatellite data. Results show significant correlations betweenthe index and soil moisture obtained at different soil depths asshown in Figure 4. The coefficient of determination in termsof R2 was the strongest for the NDDI, specifically with theaverage soil moisture over 0 to 20 cm soil depth (R2 � 0.58).
Based on the first case study, we feel confident that theindex has stronger relations with soil moisture averaged over0 to 20 cm. Therefore, we used the mean 0 to 20 cm soilmoisture content to compare against MODIS-derived NDDI on26 March April 27 and 18 June 2005 when clear-sky MODISdata were available at the closest times to the field measure-ments. The relationship further showed promise to estimatesub-canopy soil moisture using the NDDI (Figure 5). For thebest case on 26 March 2005, the R2 � 0.56.
Relative Importance of Input VariablesIn this analysis, the eFAST is used to calculate the relativevariance contribution of model input parameters to thevariance of NDDI output. Assuming non-uniform normaldistributions that can be used to represent the input parame-ters, effects of each input variable on the final output arequantified. In the first step, a possible range and probabilitydistribution were determined for each input variable. Theselections were then used to generate random samples of theinput factors. A total of 291 sample sets from the inputdatasets were generated. Each sample set consisted of threevalues corresponding to the values of NDVI, albedo, and LST(in Kelvin temperature) over a given range of possible values.Maximums and minimums, means, and standard deviationsare provided in Table 1. Snow and ice albedo is very high(0.90 to 0.95); in remote sensing applications of land sur-faces, snow/ice and cloud pixels are removed. Therefore, themaximum value for albedo is set to 0.8 so that the possiblerange of values between 0.005 to 0.80 covers albedos ofmajor land surface objects including sand. Next, the model isfed with these pseudo-random numbers. eFAST scans for theentire range of inputs and generates the output. Finally, asensitivity analysis was carried out to indentify the mostimportant factors that most-affect the NDDI.
Table 2 shows the first-order indices with total-orderindices calculated from eFAST. It can be seen that variation
Figure 3. NDDI calculation workflow.
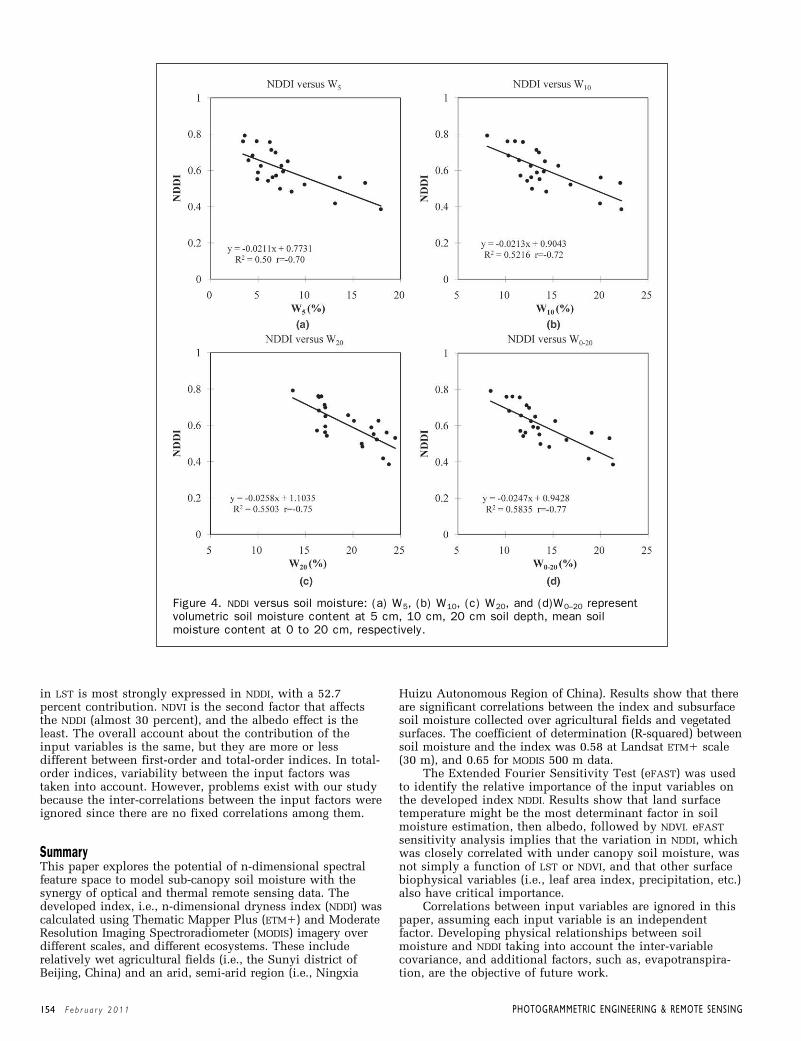
Figure 4. NDDI versus soil moisture: (a) W5, (b) W10, (c) W20, and (d)W0–20 representvolumetric soil moisture content at 5 cm, 10 cm, 20 cm soil depth, mean soilmoisture content at 0 to 20 cm, respectively.
154 Feb r ua r y 2011 PHOTOGRAMMETRIC ENGINEER ING & REMOTE SENS ING
in LST is most strongly expressed in NDDI, with a 52.7percent contribution. NDVI is the second factor that affectsthe NDDI (almost 30 percent), and the albedo effect is theleast. The overall account about the contribution of theinput variables is the same, but they are more or lessdifferent between first-order and total-order indices. In total-order indices, variability between the input factors wastaken into account. However, problems exist with our studybecause the inter-correlations between the input factors wereignored since there are no fixed correlations among them.
SummaryThis paper explores the potential of n-dimensional spectralfeature space to model sub-canopy soil moisture with thesynergy of optical and thermal remote sensing data. Thedeveloped index, i.e., n-dimensional dryness index (NDDI) wascalculated using Thematic Mapper Plus (ETM�) and ModerateResolution Imaging Spectroradiometer (MODIS) imagery overdifferent scales, and different ecosystems. These includerelatively wet agricultural fields (i.e., the Sunyi district ofBeijing, China) and an arid, semi-arid region (i.e., Ningxia
Huizu Autonomous Region of China). Results show that thereare significant correlations between the index and subsurfacesoil moisture collected over agricultural fields and vegetatedsurfaces. The coefficient of determination (R-squared) betweensoil moisture and the index was 0.58 at Landsat ETM� scale(30 m), and 0.65 for MODIS 500 m data.
The Extended Fourier Sensitivity Test (eFAST) was usedto identify the relative importance of the input variables onthe developed index NDDI. Results show that land surfacetemperature might be the most determinant factor in soilmoisture estimation, then albedo, followed by NDVI. eFASTsensitivity analysis implies that the variation in NDDI, whichwas closely correlated with under canopy soil moisture, wasnot simply a function of LST or NDVI, and that other surfacebiophysical variables (i.e., leaf area index, precipitation, etc.)also have critical importance.
Correlations between input variables are ignored in thispaper, assuming each input variable is an independentfactor. Developing physical relationships between soilmoisture and NDDI taking into account the inter-variablecovariance, and additional factors, such as, evapotranspira-tion, are the objective of future work.
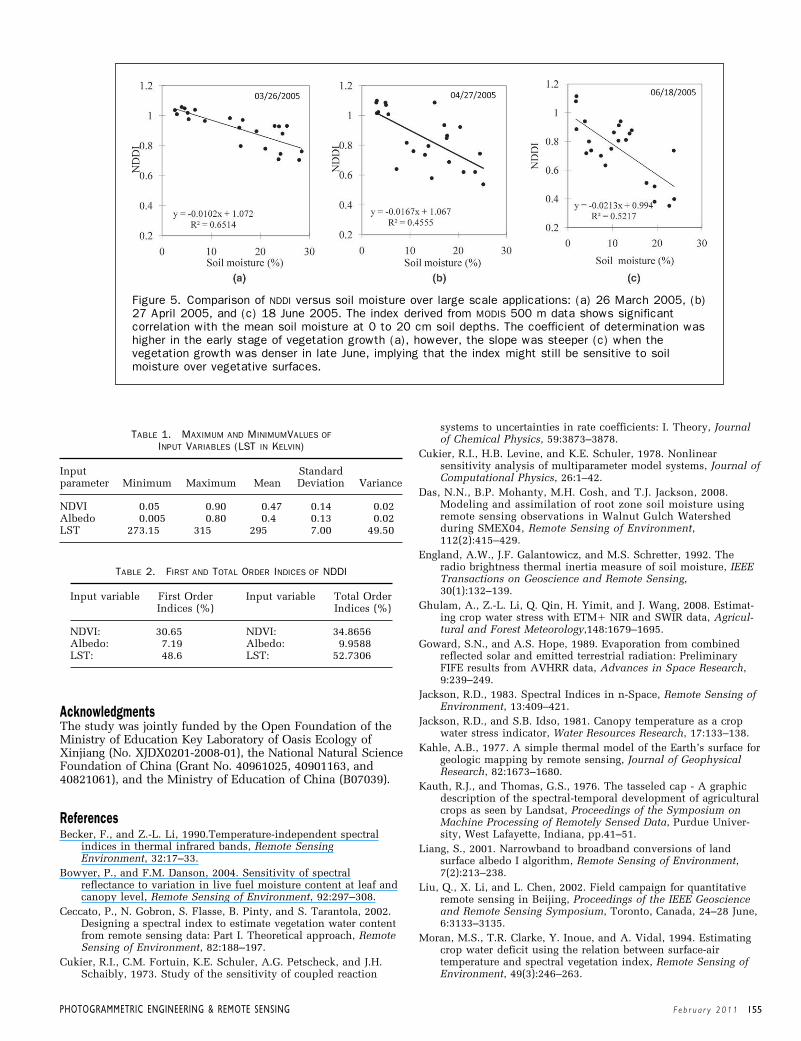
TABLE 2. FIRST AND TOTAL ORDER INDICES OF NDDI
Input variable First Order Input variable Total OrderIndices (%) Indices (%)
NDVI: 30.65 NDVI: 34.8656Albedo: 7.19 Albedo: 9.9588LST: 48.6 LST: 52.7306
Figure 5. Comparison of NDDI versus soil moisture over large scale applications: (a) 26 March 2005, (b)27 April 2005, and (c) 18 June 2005. The index derived from MODIS 500 m data shows significantcorrelation with the mean soil moisture at 0 to 20 cm soil depths. The coefficient of determination washigher in the early stage of vegetation growth (a), however, the slope was steeper (c) when thevegetation growth was denser in late June, implying that the index might still be sensitive to soilmoisture over vegetative surfaces.
AcknowledgmentsThe study was jointly funded by the Open Foundation of theMinistry of Education Key Laboratory of Oasis Ecology ofXinjiang (No. XJDX0201-2008-01), the National Natural ScienceFoundation of China (Grant No. 40961025, 40901163, and40821061), and the Ministry of Education of China (B07039).
ReferencesBecker, F., and Z.-L. Li, 1990.Temperature-independent spectral
indices in thermal infrared bands, Remote SensingEnvironment, 32:17–33.
Bowyer, P., and F.M. Danson, 2004. Sensitivity of spectralreflectance to variation in live fuel moisture content at leaf andcanopy level, Remote Sensing of Environment, 92:297–308.
Ceccato, P., N. Gobron, S. Flasse, B. Pinty, and S. Tarantola, 2002.Designing a spectral index to estimate vegetation water contentfrom remote sensing data: Part I. Theoretical approach, RemoteSensing of Environment, 82:188–197.
Cukier, R.I., C.M. Fortuin, K.E. Schuler, A.G. Petscheck, and J.H.Schaibly, 1973. Study of the sensitivity of coupled reaction
PHOTOGRAMMETRIC ENGINEER ING & REMOTE SENS ING Feb r ua r y 2011 155
systems to uncertainties in rate coefficients: I. Theory, Journalof Chemical Physics, 59:3873–3878.
Cukier, R.I., H.B. Levine, and K.E. Schuler, 1978. Nonlinearsensitivity analysis of multiparameter model systems, Journal ofComputational Physics, 26:1–42.
Das, N.N., B.P. Mohanty, M.H. Cosh, and T.J. Jackson, 2008.Modeling and assimilation of root zone soil moisture usingremote sensing observations in Walnut Gulch Watershedduring SMEX04, Remote Sensing of Environment,112(2):415–429.
England, A.W., J.F. Galantowicz, and M.S. Schretter, 1992. Theradio brightness thermal inertia measure of soil moisture, IEEETransactions on Geoscience and Remote Sensing,30(1):132–139.
Ghulam, A., Z.-L. Li, Q. Qin, H. Yimit, and J. Wang, 2008. Estimat-ing crop water stress with ETM� NIR and SWIR data, Agricul-tural and Forest Meteorology,148:1679–1695.
Goward, S.N., and A.S. Hope, 1989. Evaporation from combinedreflected solar and emitted terrestrial radiation: PreliminaryFIFE results from AVHRR data, Advances in Space Research,9:239–249.
Jackson, R.D., 1983. Spectral Indices in n-Space, Remote Sensing ofEnvironment, 13:409–421.
Jackson, R.D., and S.B. Idso, 1981. Canopy temperature as a cropwater stress indicator, Water Resources Research, 17:133–138.
Kahle, A.B., 1977. A simple thermal model of the Earth’s surface forgeologic mapping by remote sensing, Journal of GeophysicalResearch, 82:1673–1680.
Kauth, R.J., and Thomas, G.S., 1976. The tasseled cap - A graphicdescription of the spectral-temporal development of agriculturalcrops as seen by Landsat, Proceedings of the Symposium onMachine Processing of Remotely Sensed Data, Purdue Univer-sity, West Lafayette, Indiana, pp.41–51.
Liang, S., 2001. Narrowband to broadband conversions of landsurface albedo I algorithm, Remote Sensing of Environment,7(2):213–238.
Liu, Q., X. Li, and L. Chen, 2002. Field campaign for quantitativeremote sensing in Beijing, Proceedings of the IEEE Geoscienceand Remote Sensing Symposium, Toronto, Canada, 24–28 June,6:3133–3135.
Moran, M.S., T.R. Clarke, Y. Inoue, and A. Vidal, 1994. Estimatingcrop water deficit using the relation between surface-airtemperature and spectral vegetation index, Remote Sensing ofEnvironment, 49(3):246–263.
TABLE 1. MAXIMUM AND MINIMUMVALUES OFINPUT VARIABLES (LST IN KELVIN)
Input Standardparameter Minimum Maximum Mean Deviation Variance
NDVI 0.05 0.90 0.47 0.14 0.02Albedo 0.005 0.80 0.4 0.13 0.02LST 273.15 315 295 7.00 49.50

156 F eb r ua r y 2011 PHOTOGRAMMETRIC ENGINEER ING & REMOTE SENS ING
Moghaddam, M., S. Saatchi, and R.H. Cuenca, 2000. Estimatingsubcanopy soil moisture with radar, Journal of GeophysicalResearch, 105(11):14899–14911.
Pierdicca, N., L. Pulvirenti, and C. Bignami, 2010. Soil moistureestimation over vegetated terrains using multitemporal remotesensing data, Remote Sensing of Environment, 114:440–448.
Price, J.C., 1977. Thermal inertia mapping: A new view of the Earth,Journal of Geophysical Research, 82:2582–2590.
Price, J.C., 1985. On the analysis of thermal infrared imagery: Thelimited utility of apparent thermal inertia, Remote Sensing ofEnvironment, 18:59–93.
Price, J.C., 1990. Using spatial context in satellite data to inferregional scale evaportranspiration, IEEE Transactions inGeoscience and Remote Sensing, 28(5):940–948.
Qin, Z., A. Karnieli, and P. Berliner, 2001. A mono-windowalgorithm for retrieving land surface temperature from TM dataand its application to the Israel-Egypt border region, Interna-tional Journal of Remote Sensing, 22(18):3719–3746.
Richardson, A.J., and C.L. Wiegand, 1977. Distinguishing vegetationfrom soil background information, Photogrammetric Engineering& Remote Sensing, 43(12):1541–1552.
Roerink, G.J., Z. Su, and M. Menenti, 2000. S-SEBI: A simple remotesensing algorithm to estimate the surface energy balance,Physics and Chemistry of the Earth, 25(2):147–157.
Saltelli, A., S. Tarantola, and K.P.S. Chan, 1978. A quantitativemodel independent method for global sensitivity analysis ofmodel output, Technometrics, 41(1):39–56.
Sandholt, I., K. Rasmussen, and J. Andersen, 2002. A simpleinterpretation of the surface temperature/vegetation index spacefor assessment of surface moisture status, Remote Sensing ofEnvironment, 79:213–224.
Tian, G., X. Yang, and K. Zheng, 1992. Remote sensing model forwheat drought monitoring, Remote Sensing Environment China,7(2):83–89 (in Chinese).
Wan, Z., P. Wang, and X. Li, 2004. Using MODIS land surfacetemperature and normalized difference vegetation indexproducts for monitoring drought in the southern GreatPlains, USA, International Journal of Remote Sensing,25(1):61–72.
Vermote, E.F., D. Tanre, J.L. Deuze, M. Herman, and J.-J. Morcrette,1997. Second simulation of satellite signal in solar spectrum,IEEE Transactions on Geoscience and Remote Sensing,35(3):675–686.
Wang, C, J. Qi, S. Moran, and R. Marsett, 2004. Soil moistureestimation in a semiarid rangeland using ERS-2 and TMimagery, Remote Sensing of Environment, 90:178–189.
Zhan, Z., Q. Qin, A. Ghulam, and D. Wang, 2007. NIR-red spectralspace based new method for soil moisture monitoring, Sciencein China, Series D: Earth Science, 50(2):283–289.
Zhang, R., 1992. A remote sensing thermal inertia model for soilmoisture and its application, Chinese Science Bulletin,37:306–311.
(Received 22 January 2010; accepted 08 July 2010; final version 02September 2010)
Give us yourfeedback!
As you read PE&RS each month if you have comments or questions about the articles and papers that you read we want to hear from you. Please include your name and contact information with each Letter to the Editor. Your name will be printed with your letter but the contact
information will not be published. Please send your letters to [email protected].