
Residential System Design, Part I: Heat Pump Sizing - IGSHPA
Upload
khangminh22Category
view
1download
0
Study Report
SR414 [2018]
Heat pump performance
Andrew Pollard and Brian Berg

1222 Moonshine Rd, RD1, Porirua 5381 Private Bag 50 908, Porirua 5240 New Zealand branz.nz
© BRANZ 2018 ISSN: 1179-6197

Study Report SR414 Heat pump performance
i
Preface This report follows on from an earlier BRANZ heat pumps study (Burrough, Saville-Smith & Pollard, 2015) and considers how heat pump performance can be better understood.
Heat pump performance and building performance are strongly driven by environmental conditions and how occupants choose to operate their heat pump and their home.
Building energy simulation is a key research methodology that will allow the impacts of heat pump use within the New Zealand building stock to be better understood.

Study Report SR414 Heat pump performance
ii
Heat pump performance BRANZ Study Report SR414
Author Andrew Pollard and Brian Berg
Reference Pollard, A. & Berg, B. (2018). Heat pump performance. BRANZ Study Report SR414. Judgeford, New Zealand: BRANZ Ltd.
Abstract Heat pumps started to become popular in the mid-2000s, and around 38% of homes had a heat pump by 2015.
Heat pump technology has been promoted as being highly energy efficient, but there is often conflicting advice on how best to operate a heat pump and variable information on how much electricity it will use. Heat pump performance is not a fixed factor and depends on:
• the indoor and outdoor temperatures when it is operating • what additional energy use is involved, such as use of the defrost system • system loading – performance will be reduced if the heat pump only operates in
demanding conditions, such as being used to heat cold rooms on cold mornings.
A household from the earlier heat pumps study (Burrough et al., 2015) was examined. This household changed how they used their heat pump half-way through winter, going from intermittent use (turning on for an hour in the morning and evening) to leaving the heat pump on continuously. The amount of time the room was cooler than 16°C fell from 38% of the time to less than 4% and required no additional electricity to run the heat pump.
Whether it is favourable in general to leave a heat pump on continuously is not well understood. There is a trade-off between improved operating efficiency from continuously operating a heat pump and the additional heat losses from having a warm room for a greater proportion of the time. This type of trade-off is well suited to being examined using simulation tools that allow for many variations of climate, household insulation level and heat pump scheduling to best understand how to operate a heat pump efficiently. Simulation tools promise to be an important technique to examine heat pump performance, and further work in this area would be beneficial.
Keywords Heating, heat pumps, building performance, climate, energy performance.

Study Report SR414 Heat pump performance
iii
Contents 1. INTRODUCTION ..................................................................................... 1 2. HEAT PUMP PERFORMANCE ................................................................... 2 3. EXAMINATION OF ONE HEAT PUMP ....................................................... 6
Summary ............................................................................................ 11 4. MEASURED DATA ................................................................................. 12
Building characteristics ........................................................................ 13 Measurement options .......................................................................... 15 Measurement summary ....................................................................... 16
5. SIMULATION ........................................................................................ 18 Summary of simulation issues .............................................................. 19
6. COLLECTIVE IMPACT ............................................................................ 20 7. CONCLUSION ....................................................................................... 22 REFERENCES ................................................................................................ 23
Figures Figure 1. Variation of COP with outdoor temperature for one particular heat pump. .... 3 Figure 2. Mean hourly July temperatures in Auckland, Christchurch and Alexandra. ..... 4 Figure 3. Carpet plot of the indoor temperature in the example house. ....................... 6 Figure 4. Carpet plot of the electricity use of the heat pump in the example house. ..... 7 Figure 5. Carpet plot of the indoor temperature in the example house 5 weeks before
and after the behaviour change (red line). ..................................................... 7 Figure 6. Carpet plot of the electricity use of the heat pump in the example house 5
weeks before and after the behaviour change (red line). ................................. 8 Figure 7. Box and whisker plots of the 6 am temperatures from a nearby
meteorological station 5 weeks before and after the behaviour change. ............ 8 Figure 8. Histograms of 10-minute indoor temperatures 5 weeks before (left) and after
(right) the behaviour change. ........................................................................ 9 Figure 9. Electricity use of the heat pump 5 weeks before and after the behaviour
change with a 5-minute data resolution. ........................................................ 9 Figure 10. Electricity use of the heat pump 5 weeks before and after the behaviour
change with a 5-minute data resolution overlaid with the daily average (blue). 10 Figure 11. Histograms of 5-minute electricity use before (left) and after (right) the
behaviour change. ..................................................................................... 10 Figure 12. Proportion of the time the heat pump is not in a low energy state (40 W). 12 Figure 13 Proportion of time each heat pump is on over winter (June, July, August)
(n=136). ................................................................................................... 13 Figure 14. Change in energy costs since acquiring heat pump. ................................. 13 Figure 15. Detail of the tail (5-minute electricity use over 1000 W) for the heat pump
electricity use before (left) and after (right) the behaviour change. ................ 14 Figure 16. Sales-weighted COP and EER performance for heat pumps sold in New
Zealand. .................................................................................................... 20 Figure 17. Residential electricity consumption per ICP (which approximates the number
of households). .......................................................................................... 21

Study Report SR414 Heat pump performance
1
1. Introduction In the mid-2000s, there was a large increase in the use of residential heat pumps in New Zealand. This led to concerns about how the widespread use of heat pumps may impact on residential electricity use (Buckett, 2007).
In 2009, BRANZ commenced a large study of heat pumps to better understand this emerging technology (Burrough et al., 2015). This study looked at how heat pumps were being installed, what the occupants thought of them, how much electricity they used and the resulting temperatures within the rooms in which they operated. This study report largely reflects on this 2015 report and what outstanding issues remain to be examined.
Heat pumps are now ubiquitous and routinely installed in new and existing homes. The 2015 House Condition Survey (White & Jones, 2017) found that 38% of homes had a heat pump. The 2018 Census also changed the wording of the heating fuels question to specifically ask about ownership of heating types including heat pumps (Statistics New Zealand, 2017).
The types of heat pumps found in New Zealand are predominantly air-to-air single-split (mini-split) heat pumps. While this type of heat pump is growing worldwide, other types of heat pumps dominate the heat pump stock in other countries. For example, in the UK, air-to-water heat pump water heaters are popular as they can be integrated into central heating systems, which are common in that market (Roy, Caird & Potter, 2010). While air-to-air single-split heat pumps are capable of both heating and cooling, most residential heat pumps in New Zealand are seldom used in summer (Burrough et al., 2015). Consequently, this report will only consider the heating performance of heat pumps.
An individual looking to heat their home will consider many aspects of heat pumps, but the primary advantage is their high level of energy efficiency.
This report is structured as follows:
• Section 2 reviews the factors affecting a heat pump’s energy requirements to examine the differences between an experimentally determined labelled value and expected performance of a heat pump installed within a typical New Zealand home.
• Section 3 considers a set of measured data from one home in which there was a change of behaviour in the use of the heat pump half-way through winter from intermittent use to continuous use, allowing the two types of operation to be examined for this particular household.
• Improvements to the physical measurement of heat pump performance in actual households is considered in section 4. This section also discusses the impacts of building performance on the operation of the heat pump.
• Connecting building performance and heat pump performance is best done using building energy simulation, which is outlined in section 5.
• Finally, the advantages of the collective impact of improved heat pump performance on New Zealand’s heating electricity usage are suggested in section 6.

Study Report SR414 Heat pump performance
2
2. Heat pump performance The operation of a heat pump involves heat transfer between the outdoor air and the refrigerant, transformation of the refrigerant and then a second heat transfer between the refrigerant and the indoor air (BRANZ, 2016). As heat is not generated but transferred via heat reservoirs (the outdoor and indoor air), the efficiency of heat pump generally exceeds 100%. However, this depends on the specific model of heat pump, how well it is installed, the temperatures of the two reservoirs and other environmental factors.
Energy efficiency for heat pumps is the ratio of the heating or cooling capacity (in kW) to the electrical power input (in kW) to run the heat pump in a laboratory at a particular temperature. The two measures are the coefficient of performance (COP) in heating mode and the energy efficiency ratio (EER) in cooling mode (BRANZ, 2016).
There is a common incorrect view that the COP is a fixed number that can be multiplied by the input energy into the heat pump to determine the heat output of the heat pump and that the COP is solely determined by the heat pump model. In fact, to ensure results are as consistent and repeatable as possible, the determination of the COP is achieved by tightly controlling the environmental conditions during testing under AS/NZS 3823.1.1:2012 Performance of electrical appliances – Airconditioners and heat pumps – Part 1.1: Non-ducted airconditioners and heat pumps – Testing and rating for performance. The COP for an actual heat pump will vary with the indoor and outdoor environmental conditions as well as having a residual degree of uncertainty with the general measurement.
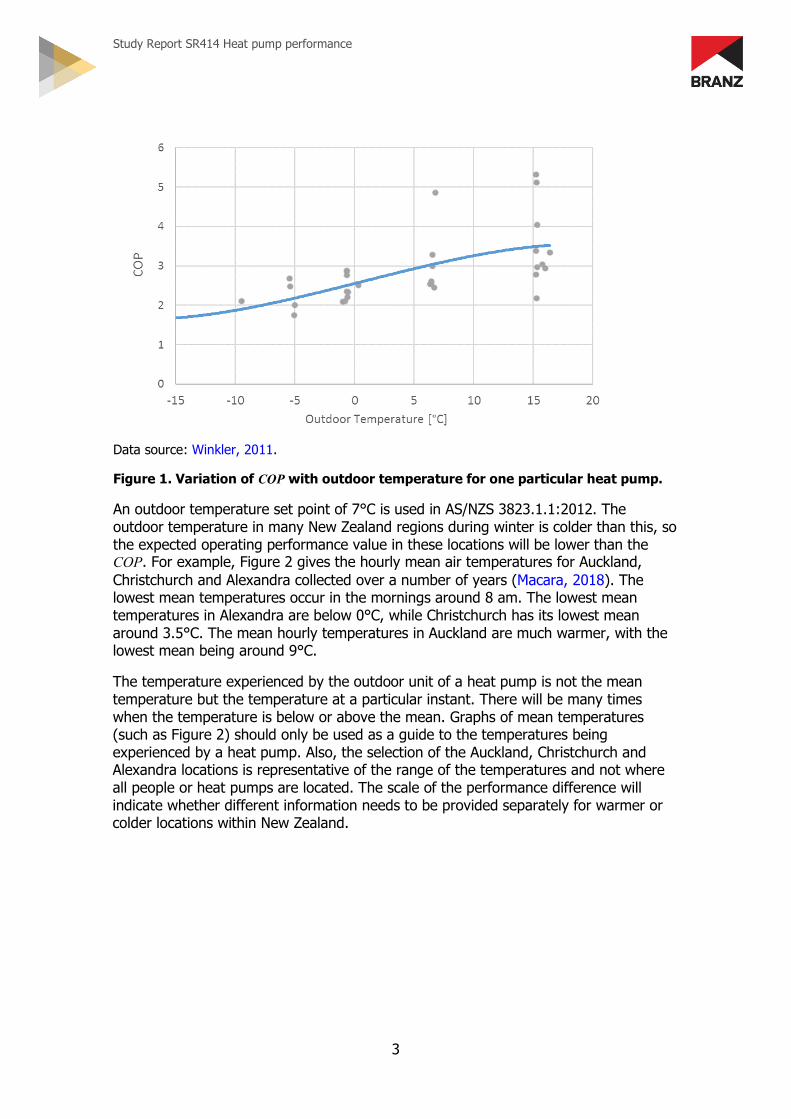
Figure 1 shows a graph of the heat pump efficiency (COP) for extensive testing of one particular heat pump unit (Winkler, 2011) for a variety of outdoor temperatures. The indoor air temperature was generally kept at around 20°C. However, some tests were conducted at a higher indoor temperature around 23°C, while there were also several tests at lower indoor temperatures (14–17°C). The COP can be seen to appreciably decrease as the outdoor temperatures drops.
Study Report SR414 Heat pump performance
3
Data source: Winkler, 2011.
Figure 1. Variation of COP with outdoor temperature for one particular heat pump.
An outdoor temperature set point of 7°C is used in AS/NZS 3823.1.1:2012. The outdoor temperature in many New Zealand regions during winter is colder than this, so the expected operating performance value in these locations will be lower than the COP. For example, Figure 2 gives the hourly mean air temperatures for Auckland, Christchurch and Alexandra collected over a number of years (Macara, 2018). The lowest mean temperatures occur in the mornings around 8 am. The lowest mean temperatures in Alexandra are below 0°C, while Christchurch has its lowest mean around 3.5°C. The mean hourly temperatures in Auckland are much warmer, with the lowest mean being around 9°C.
The temperature experienced by the outdoor unit of a heat pump is not the mean temperature but the temperature at a particular instant. There will be many times when the temperature is below or above the mean. Graphs of mean temperatures (such as Figure 2) should only be used as a guide to the temperatures being experienced by a heat pump. Also, the selection of the Auckland, Christchurch and Alexandra locations is representative of the range of the temperatures and not where all people or heat pumps are located. The scale of the performance difference will indicate whether different information needs to be provided separately for warmer or colder locations within New Zealand.

Study Report SR414 Heat pump performance
4
Data source: Macara, 2018.
Figure 2. Mean hourly July temperatures in Auckland, Christchurch and Alexandra.
Another difficulty in understanding the performance of heat pumps is defining the system boundaries (Gleeson & Lowe, 2013; Staffell, Brett, Brandon & Hawkes, 2012). The standard conditions the heat pumps are tested to are static, and it makes sense to define the performance of the heat pump as:
𝐶𝐶𝐶𝐶𝐶𝐶 =𝑄𝑄𝐻𝐻𝐻𝐻𝐸𝐸𝐻𝐻𝐻𝐻
Eq 1
where COP = coefficient of performance
QHP = heat provided by the heat pump
EHP = electrical energy required by to operate the heat pump
The performance of the heat pump over a heating season will need to be considered over a range of temperatures. It is also necessary to consider the additional electrical energy required to operate the frost removal system as well as any auxiliary heating the system may require. A seasonal performance factor (SPF) may be defined as:
𝑆𝑆𝐶𝐶𝑆𝑆 =𝑄𝑄𝐻𝐻𝐻𝐻 + 𝑄𝑄𝑎𝑎𝑎𝑎𝑎𝑎
𝐸𝐸𝐻𝐻𝐻𝐻 + 𝐸𝐸𝑎𝑎𝑎𝑎𝑎𝑎 + 𝐸𝐸𝑓𝑓𝑎𝑎𝑓𝑓 + 𝐸𝐸𝑓𝑓𝑓𝑓𝑓𝑓𝑓𝑓𝑓𝑓 Eq 2
where SPF = seasonal performance factor
QHP = heat provided by the heat pump (varying temperatures)
Qaux = heat provided by the auxiliary heating system
EHP = electrical energy to operate the heat pump (varying temperatures)
Eaux = electrical energy required for the auxiliary heating system

Study Report SR414 Heat pump performance
5
Efan = electrical energy required for the fans
Efrost = electrical energy required for frost system
AS/NZS 3823.4.2:2014 Performance of electrical appliances – Airconditioners and heat pumps – Part 4.2: Air-cooled air conditioners and air-to-air heat pumps – Testing and calculating methods for seasonal performance factors – Heating seasonal performance factor allows a seasonal performance factor to be calculated for the winter – the heating seasonal performance factor (HSPF).
In moving from the static case of the COP to the dynamic case for the SPF or HSPF, there was an implicit assumption that the heat pump would be in operation continuously. There is no tradition in New Zealand to heat homes continuously. Heating is largely manually operated, one room at a time (Isaacs et al., 2010; Centre for Advanced Engineering, 1996).
The infrequency of heating was seen in the heat pumps study (Burrough et al., 2015) where 73% of the heat pumps were in a low power state for more than half of the time. One of the primary differences between heat pump use and other types of heaters (as reported in HEEP) is that heat pumps are more commonly used in the mornings
During the morning operation of a heat pump, the outdoor conditions are likely to be cold, and the outdoor unit may be at risk from frosting up. Defrosting the outdoor unit will take time and will require energy, thereby reducing the performance (SPF) of the heat pump. If the occupants turn the heat pump off overnight and then manually turn it on when they wake up, the indoor temperatures may also be cold. The heat pump will need to operate at a heavy load, consuming more energy with a lower performance.
The occupants will often want the space to reach the set point air temperature as soon as possible. Many people falsely believe that, if they set the thermostat temperature on the heat pump to a higher value, the heat pump will get to an acceptable temperature faster. In reality, this behaviour results in lower performance and excessive energy use.
For occupants who are away from their home for much of the day, the operation of the heat pump in the morning is only for a short period of time. The heat pump is then turned off once the indoor temperatures have achieved a suitable temperature and the outdoor temperatures have become less severe.

Study Report SR414 Heat pump performance
6
3. Examination of one heat pump To examine the effect on energy performance of switching the heat pump on, an example household was identified from the heat pumps study (Burrough et al., 2015). This example household had regular daily use of the heat pump and then had a change of behaviour. The usage changed from having the heat pump off overnight and being turned on in the mornings to having the heat pump left on continuously. This heat pump was previously identified in Appendix A of Burrough et al. (2015).
This example heat pump was from a household in a provincial town in Otago. The heat pump was a large-capacity heat pump with a heating output of 9.2 kW, putting it into the 5% of heat pumps whose capacity is greater than 9 kW.
Figures 3 and 4 show yearly monitored data to illustrate the varying heat pump usage. This variation is shown using carpet plots of the indoor temperature and heat pump electricity use. A carpet plot is a plot of three variables – the horizontal axis gives the day of the year (increasing from left to right), while the vertical axis gives the time of day starting at midnight at the bottom of the graph and extending to 22:59 at the top of the graph. At the intersection of these two variables, the variable of interest is plotted as a blob of colour according to the scale on the right. Missing data is displayed as white. The carpet plot displays all of the data at once but also allows seasonal variations as well as time of day patterns to be examined.
For the temperature graph (Figure 3), the colours used for the comfortable range of 18–24°C are shades of green. Temperatures over 24°C are shown by colours ranging from orange to deep red to represent the warmest temperatures. Temperatures below 18°C start off a light blue and become increasingly darker as the temperature drops.
Figure 3. Carpet plot of the indoor temperature in the example house.

Study Report SR414 Heat pump performance
7
For the heat pump energy use graph (Figure 4), the greater the energy use of the heat pump, the darker the blue.
Figure 4. Carpet plot of the electricity use of the heat pump in the example house.
The date of the change of behaviour was mid-winter on 18 July so it was decided to restrict the analysis to 5 weeks before and 5 weeks after this date. Figures 5 and 6 show close-ups of the carpet plots in Figures 3 and 4, which makes the individual daily operation much easier to see. The carpet plots show that, before the behaviour change, when the heat pump comes on at around 6 am, the indoor temperatures are cold, often getting into the purple range of below 12°C (Figure 5).
Figure 5. Carpet plot of the indoor temperature in the example house 5 weeks before and after the behaviour change (red line).

Study Report SR414 Heat pump performance
8
The electrical energy use shows dark blue colours before the behaviour change, indicating a high electrical loading on the heat pump (Figure 6).
Figure 6. Carpet plot of the electricity use of the heat pump in the example house 5 weeks before and after the behaviour change (red line).
Figure 7 shows box and whisker plots of the 6 am outdoor temperatures recorded by a nearby meteorological station over the 5 weeks before and after the behavioural change. The median outdoor temperature at 6 am before the change was 0.6°C, while the median temperature after the behavioural change was slightly higher at 1.4°C with the temperature distribution higher and more extended. The outdoor temperature when the heat pump is first switched on in the morning is cold, typically operating below the 2°C temperature set point but sometimes getting down to a low of -6.2°C.
Data source: https://cliflo.niwa.co.nz.
Figure 7. Box and whisker plots of the 6 am temperatures from a nearby meteorological station 5 weeks before and after the behaviour change.
Figures 5 and 6 reveal that the behaviour change is not as singular on 18 July as the broader pattern would suggest. For the 5 weeks before, the heat pump is operated at

Study Report SR414 Heat pump performance
9
6 am and is then turned off after an hour or so. The heat pump is then used in the evenings but is also turned on in the middle of the day from time to time. For a week and a half before 18 July, the heat pump is left on after having turned it on in the morning.
Histograms of the before and after indoor temperature distributions are shown in Figure 8. The mean temperature before the change was 16.6°C while the mean temperature after the change was 18.0°C. The temperatures before 18 July exhibit a long tail of low temperatures, with temperatures below 16°C for 39% of the time. The temperatures after 18 July show a peak in the 16–17°C range, indicating the minimum set point may be around this temperature. After the behaviour change, the temperatures were below 16°C less than 4% of the time.
Figure 8. Histograms of 10-minute indoor temperatures 5 weeks before (left) and after (right) the behaviour change.
It is somewhat obvious that continuous operation of the heat pump will reduce the amount of low temperatures experienced within the room but a more unknown result would be the impact the change of behaviour had on the electricity use of the heat pump. Figure 9 plots the electricity use of the heat pump as a 5-minute time series, 5 weeks before and after the behaviour change, which is shown by the red line.
Figure 9. Electricity use of the heat pump 5 weeks before and after the behaviour change with a 5-minute data resolution.

Study Report SR414 Heat pump performance
10
This graph is intriguing in that, before the behavioural change, the heat pump operates at much higher levels but the spacing between the peaks is less intense (the colouring seems lighter). After the behaviour change, the heat pump operates at a lower level peaking at less than half the values before the change. The intensity of the colouring after the change is more intense, suggesting that the heat pump is operating more frequently than before. It is not clear which side of the change has the greater electricity use. The electricity use was averaged over each day and is shown as a blue overlay in Figure 10. The daily electricity use after the change is more consistent and, over the 5-week period, actually used 13% less electricity than before the behavioural change. It is difficult to attribute this change to ‘saving’ of electricity, as there are many additional factors that are not considered such as total heat output or the fact there were higher outdoor temperatures (see Figure 7) after the behavioural change.
Figure 10. Electricity use of the heat pump 5 weeks before and after the behaviour change with a 5-minute data resolution overlaid with the daily average (blue).
The histograms of the electricity usage before and after the change are shown in Figure 11.
Figure 11. Histograms of 5-minute electricity use before (left) and after (right) the behaviour change.
This may be of particular interest to electricity distributors as it appears that the peak loadings on the electricity grid from the heat pump can be substantially reduced. Requiring a heat pump to provide a high heating load, such as heating a cold room on a cold morning, will require a high power demand. Providing more heating to the space
Study Report SR414 Heat pump performance
11
continuously will shift the morning heating demand to a moderate or low demand to provide less instant heat to an already warm room on that cold morning. With the heat pump operating throughout the night, it is also likely that the defrost electricity requirements will be less intensive as well. The extent to which defrosting is occurring before the behavioural change is not immediately apparent.
Summary The continuous operation for this particular heat pump provides better outcomes than operating the heat pump manually. The periods of time where the room is excessively cold (below 16°C) is reduced from around 40% of the time to less than 4% of the time. The temperatures were cool but not excessively cold throughout the day. The outdoor unit will potentially require less defrosting. The heat pump places less demand on the electricity grid at times of peak use.
Before considering the role the wider thermal environment within the house plays, the factors influencing heat pump performance can be summarised as follows:
• The indoor and outdoor temperature: The performance of a heat pump depends on the heat pump as well as the indoor and outdoor temperatures.
• The system boundary: To determine overall performance, it is necessary to include all additional energy use from frost systems and other items.
• The loading on the system: When the heat pump is only operated in demanding conditions (heating cold rooms on cold mornings), the system performance will be reduced.

Study Report SR414 Heat pump performance
12
4. Measured data It is important not to overgeneralise the example heat pump in section 3.
Heating only in the early mornings and evenings had a lower daily average electricity use than having the heat pump on continuously. When the heat pump was also being used in the afternoons and mornings, the daily heat pump electricity use was higher than that for leaving the heat pump on continuously. Figure 12 gives the proportion of the time the heat pump is not in a low energy state – that is the proportion of the time the heat pump is drawing more the 40 W.
Figure 12. Proportion of the time the heat pump is not in a low energy state (40 W).
The threshold for this heat pump seems to be roughly half of the time. Where the heat pump is on for at least this amount of time, it seems beneficial to leave the heat pump on continuously.
While this threshold cannot be verified for other heat pumps, it may be useful to use this 50% threshold to estimate how many households that heat intensively could possibly benefit from leaving their heat pump on continuously (if they are not already operated that way). Figure 13 reproduces a graph for Burrough et al. (2015) that shows the proportion of time each of the heat pumps was on. Around 27% of the heat pumps were used for more than 50% of the time over winter and could possibly benefit from being left on continuously.
The other revealing aspect from Figure 13 is the high number of heat pumps that are used only infrequently – 36% are used for less than 15% of the time and would likely be prohibitively expensive to leave operating all the time.
Burrough et al. (2015) also reported on the change of electricity costs since this installation of the heat pump (reproduced in Figure 14). This shows a very mixed picture of roughly even numbers of households experiencing increased energy costs to the numbers of households experiencing reduced energy costs. This suggests that it is not just a process of replacing less-efficient heating with more-efficient heating but that extended heater operation and changes of heating behaviour are taking place after the installation of the heat pumps.

Study Report SR414 Heat pump performance
13
Source: Burrough et al., 2015.
Figure 13 Proportion of time each heat pump is on over winter (June, July, August) (n=136).
Source: Burrough et al., 2015.
Figure 14. Change in energy costs since acquiring heat pump.
Building characteristics One of the interesting characteristics of the heat pump examined in section 3 was how matched the temperature response was (Figure 5) to the operation of the heat pump (Figure 6). The fast response of the temperature to the operation of the heat pump in the morning is partly due to the large heating capacity (9.2 kW) of the heat pump. The large loading (cold room, cold outdoors) requires the heat pump to work hard at a lower level of efficiency. For the start of the 5-week period, the heat pump is only operated for 1 hour, but the indoor temperature quickly changes from dark blues (temperatures in the low teens) to light blues (temperatures in the mid-teens). After the heating period ends, the temperatures changes more slowly from light blue to dark blue. The speed of this change will depend on how well insulated and airtight the home is. If the house is well insulated and airtight, the speed at which the indoor

Study Report SR414 Heat pump performance
14
temperature drops will be slow. Otherwise, the drop in temperature will be much faster.
A poorly insulated and draughty home will place a much greater loading on a heat pump. Within a poorly insulated home, the room temperatures will quickly cool down, requiring the heat pump to work at a higher loading more often. This is particularly important if the heat pump is manually turned on and off.
Manually switching the heat pump on and off requires high levels of electricity use for periods of time, requiring the heat pump to work much harder than when it is left continuously on (see Figure 15).
Figure 15. Detail of the tail (5-minute electricity use over 1000 W) for the heat pump electricity use before (left) and after (right) the behaviour change.
Some people would suggest the best way to operate a heat pump is to turn it off as much as possible and to use timers to allow the heat pump to operate 30 minutes before heating is required.
If the heat pump in such a situation is undersized, when the timer activates, the heat pump will be heavily loaded and will struggle to bring the room to the set point air temperature, only heating the room slowly.
Alternatively, if the heat pump is oversized, the heat pump will be able to provide much more heat, but this heat is delivered when the conditions are unfavourable (the outdoor air in the morning is cold as well as the room being cold) and therefore at a lower level of performance.
It is not clear how best to heat a cold room on a cold morning. Rather than delivering a large amount of heat when conditions are unfavourable (and the efficiency is lower), there may be an advantage in continuing to heat the room throughout the night so that the indoor temperature is maintained and the loading on the heat pump in the morning is reduced.
The Consumer website (Consumer, 2018) offers some practical advice on other actions that may be useful to reduce the loading on a heat pump. This includes setting the temperature to a lower temperature (18°C instead of 24°C) and closing the doors to the room so the volume of air the heat pump is trying to heat is not too large.
A superior situation would be where the building is well insulated and airtight so that the indoor temperatures remain at a reasonable level. When the heat pump activates, it is not required to work hard, and only a lower heating level would be required from the heat pump.

Study Report SR414 Heat pump performance
15
This situation is analogous to the concept of the building as a thermal battery. Energy is stored in the building as heat – keeping the house interior warm. The battery is discharged by the heat loss from the building, the rate of which depends on the insulation and airtightness of the building. To be useful, the battery needs charging. Charging is done by solar gains through the windows during the day, but for most homes, this is insufficient and additional charging from heaters is required. Resistance electric heating has a fixed efficiency, in which case, the best strategy is heat when it is needed. Heat pumps have a variable efficiency depending on the temperatures inside and outside the house, in which case, alternate strategies of when and how much heating is required need to be explored. These difficult concepts also need to be explained to the users of heat pumps, so work will also be required on how best to communicate this information.
The correct sizing of a heat pump is an important issue. An undersized heat pump will struggle to provide sufficient heat for a cold room. An oversized heat pump will allow large amounts of heat to be applied when it may not be the most effective time.
Measurement options The heat pumps study (Burrough et al., 2015) was designed as a nationally representative random sample. In addition to the measured performance of the heaters, there would be a range of heat pump types, climates, house designs and household characteristics.
One of the difficulties with the heat pumps study was that the intended method to establish performance proved difficult to apply to each of the heat pumps. This study looked to apply the ‘missing heat’ method developed in HEEP to estimate the heat output of solid fuel burners. This method estimated the heat loss from room dimensions, construction details and insulation levels and then used the room temperature record to estimate how the heat output from the heater matched the observed increase in room temperature. Part of the difficulty with applying the HEEP missing heat method was that, many times, the heat pump was installed as a secondary heating source so additional (unmonitored) heating was entering the monitored room. Many households were selected that only used the heat pump as a secondary heating source to supplement a wood burner or other form of heater or used the heat pump in locations such as bedrooms or in kitchen/dining rooms, which have particular heating needs.
Even when the heat pump is the sole source of purchased heating into the room, there are other heat sources to account for. This includes heat gain from solar radiation through the windows, the heat from room occupants and any usage of electrical appliances within that room. Some of these heat flows can be accounted for, as the algorithms to account for the heat gains from solar radiation are a fundamental part of computer simulation programs (see section 5).
In order to allow for the statistical number of heat pumps to be monitored, the extent of monitoring for each heat pump was kept to a minimum of the electrical input to the heat pump and the temperature response of the room in which the heat pump was operating. No experimental determination of the response to the operation of the heat pump was undertaken. An improved methodology would look to measure the response of the room directly. This would involve operating heaters of known output such as portable electric resistive heaters to measure the rate of temperature change within the room. This would improve the understanding of the temperature response to the

Study Report SR414 Heat pump performance
16
room but would add considerable time to the set-up and potentially require accommodating the occupants for the duration of the experiments.
The limited monitoring failed to allow for alternative methods to be used to establish the performance of the heat pumps. Additional monitoring of the indoor unit such as the inlet air temperatures, delivery temperatures and some sort of estimation of air delivery volume from fan characteristics (from measured fan speed or power demand) would have provided an alternative method to estimate heat pump performance (Christensen et al., 2011).
There are further opportunities to extract insights from the heat pump data. These may need to be found from exploratory analysis of the data. For example, the speed at which the temperature changes in Figure 5 as it relates to the amount of electricity input into the heat pump (Figure 6) was assumed to be a fixed factor. This may need to be examined across the range of outdoor temperatures for it to help with predicting the heat output of the heat pump.
Another approach is to ignore the heat output of the heat pump and to consider the impacts on wider measurement of resulting room temperatures and required electricity input to the heat pump from some variation in the experiment. Rather than having the experiment as an observational study like the overall heat pumps study, the experiment becomes an interventionist study. This is like the behavioural change experiment that fortuitously occurred (section 3) but is more systematically controlled.
The interventions could occur in a range of homes and could be on a week-on week-off format or similar to make seasonal comparisons easier. The interventions themselves could be either operational (using the heat pump a certain way) or from physical changes (for example, changing characteristics of the indoor units).
There would be a high degree of intrusion in operating this type of study, and participants would need to be actively engaged. This would suggest that an outcome directly beneficial to the occupants, such as understanding what way of using the heat pump uses the least energy, may be desirable.
Rather than maintaining a field study project, there would be the option of undertaking the experiments within an experimental building. This further controls the variability within the experiment but introduces the problem of how to account for the occupants and their behaviours.
The interventionist approach includes room performance, so how much the results from this method can be generalised needs to be considered.
Measurement summary The air temperature within a room depends on how well insulated and airtight the home is as well as the operation of the heat pump.
A well insulated and airtight home acts like a battery, storing thermal energy that’s slowly losing its charge. The effectiveness of ‘charging’ this battery with a heat pump depends on when it is done. For example, in the early morning, it will have a low efficiency as both the outdoor and indoor temperatures are cold.
Sizing is important. An undersized heat pump will struggle to provide sufficient heat to a cold room. An oversized heat pump will allow large amounts of heat to be applied when it may not be the most effective time.

Study Report SR414 Heat pump performance
17
From the heat pumps study, around 27% of heat pumps were operated more than 50% of the time, which potentially could benefit from being operated continuously (if they are not already being operated in this way). The heat pumps study also found that 36% of the heat pumps were only used infrequently (less than 15% of the time) so would not be good candidates for being left on continuously.
Future measurement projects involving heat pumps could include more detailed measurement of the heat pump operating characteristics to allow for the measurement of heat output from the heat pump directly.
Future projects may also use controlled experiments focused more broadly on temperature outcomes and heat pump electricity requirements subject to particular operational or physical variations.

Study Report SR414 Heat pump performance
18
5. Simulation Computer simulation programs (referred to here as simulation tools) are increasingly being used to assist with building design for indoor environmental quality (IEQ). Generally, simulation tools model complex building physics interactions of energy heat gains and losses. Examples include, thermal energy (heating, cooling and ventilation), lighting (artificial and daylighting) and moisture simulation.
In general, IEQ simulation tools can be separated into two broad categories – building component or system design simulation tools and whole-building simulation tools. Building component simulation tools calculate the performance of individual and isolated building elements, often under a set of user-defined internal and external environmental conditions. By comparison, whole-building simulation tools calculate the interrelated influences of the many aspects of building IEQ, including indoor air temperature, mechanical heating and cooling loads and their specific system design capacities and controlled and uncontrolled natural ventilation amongst others.
Both building component and whole-building simulation tools are capable of heat pump performance and design sizing simulation. Examples of each are the Heat Pump Design Model (HPDM) (Oak Ridge National Laboratory, 2018) and EnergyPlus (https://energyplus.net/) respectively.
The simulation of heat pumps is useful not only for building design but also for building research. Indeed, many of the issues previously identified by this report would benefit from further investigation, with simulation being the most appropriate research methodology. For example, whole-building simulation provides a means to systematically determine more realistic performance values across New Zealand to ensure New Zealanders are getting warm, dry and healthy homes as cost-effectively as possible. Whole-building simulation can account for variations in outdoor climate, houses with different insulation and airtightness standards, building occupant behaviour such as operating the heat pumps at unfavourable times (cold inside, cold outside) when they are most needed and time-variable COP values instead of static COP values applied uniformly.
However, preceding any form of simulation-based research investigation, a robust understanding of the methodology for how to reliably and consistently simulate performance compared to reality is required. This form of methodology development consists of two parts – simulation validation and simulation calibration. Validation is the development and confirmation that the mathematical algorithms used to describe the building physics are accurate. This is typically the reasonability of the simulation tool’s software provider and is demonstrated by showing compliance with BESTEST-EX and/or ANSI/ASHRAE 140 standards. Calibration is the verification that the user of the simulation tool or modeller is using the tool correctly to generate accurate results. In both cases, accuracy is defined by the comparison of simulated results to measured real-world data – for example, the data collected from Burrough et al. (2015).
To date, much of the existing published research on heat pump simulation has primarily focused on the methodologies for accurately calculating their performance – the two issues of validation and calibration. Due to their complexity, the output has been the development and publication of standardised modelling assumptions and methods to represent a ‘business as usual’ or defined average heat pump system. However, these are often a simplification of the real-world heat pump systems (Haller et al., 2012), and their detail, quality and ability to calculate “accurate enough” results

Study Report SR414 Heat pump performance
19
can vary (Underwood et al., 2017). Important characteristics that have to be assessed are defrosting and part loads.
Heat pumps models with a higher level of detail and even models of specific system componentry are available (Cutler et al., 2013), one example being the Building Component Library for EnergyPlus (https://bcl.nrel.gov/) administered by the National Renewable Energy Laboratory in the United States. The heat pump technologies available in this library and from most other published sources will need to be carefully examined to assess how well they match the characteristics of heat pumps in New Zealand homes.
Summary of simulation issues Simulation tools provide a pathway to examine the interplay between building performance and heat pump performance.
Appropriately verified and calibrated simulations will allow systematic analysis of the contributing factors affecting heat pump performance.
Sizing of heat pump systems is an important issue and may be thoroughly examined using a variety of system sizes using a simulation approach.

Study Report SR414 Heat pump performance
20
6. Collective impact The analysis in section 4 focused on addressing information gaps for better understanding performance of individual heat pumps. This information would feed in to creating more accurate models of heat pumps that can be used in simulation models as discussed in section 5. These simulation models could be paired with national stock level information, such as that in Figure 16, which shows the 26% improvement in overall efficiency of heat pumps sold in New Zealand between 2004 and 2014.
Source: E3 Equipment Energy Efficiency, 2016. © Commonwealth of Australia (Department of Industry, Innovation and Science) 2016. Creative Commons 3.0 Australia Licence.
Figure 16. Sales-weighted COP and EER performance for heat pumps sold in New Zealand.
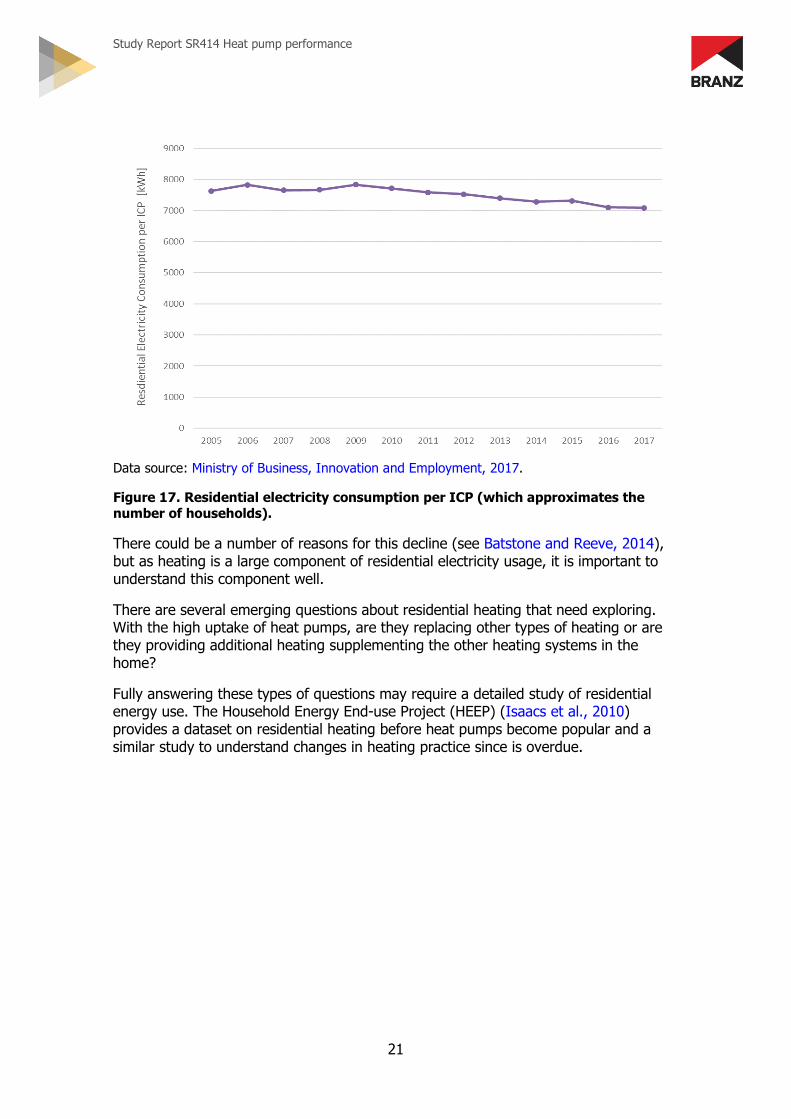
This simulation-stock pairing would allow national impacts to be explored and better understood. For example, Figure 17 shows the change in residential electricity consumption since 2005 and that residential electricity use has declined.
Study Report SR414 Heat pump performance
21
Data source: Ministry of Business, Innovation and Employment, 2017.
Figure 17. Residential electricity consumption per ICP (which approximates the number of households).
There could be a number of reasons for this decline (see Batstone and Reeve, 2014), but as heating is a large component of residential electricity usage, it is important to understand this component well.
There are several emerging questions about residential heating that need exploring. With the high uptake of heat pumps, are they replacing other types of heating or are they providing additional heating supplementing the other heating systems in the home?
Fully answering these types of questions may require a detailed study of residential energy use. The Household Energy End-use Project (HEEP) (Isaacs et al., 2010) provides a dataset on residential heating before heat pumps become popular and a similar study to understand changes in heating practice since is overdue.
Study Report SR414 Heat pump performance
22
7. Conclusion Heat pump performance is not a fixed factor and should not be confused with COP.
Heat pump performance varies with:
• indoor and outdoor temperatures • what additional energy use is included (for example, the energy use of the defrost
system) • the loading on the system – performance will be reduced when only operating in
demanding conditions (heating cold rooms on cold mornings).
A poorly insulated home will place a greater loading on a heat pump than a well-insulated and airtight home.
Sizing is important. An undersized heat pump will struggle to provide sufficient heat to a cold room. An oversized heat pump will allow large amounts of heat to be applied when it may not be the most effective time.
A heat pump that is turned on and off manually for more than half the time may benefit from being operated continuously. A heat pump from the heat pumps study that was initially turned off overnight and used intermittently during the day was seen to perform favourably when left on continuously.
Whether it is favourable to leave a heat pump on continuously is not well understood. There is a trade-off between improved operating efficiency from continuously operating a heat pump and the additional heat losses from having a warm room for a greater proportion of the time. This type of trade-off is well suited to being answered using simulation tools, which allow for many variations of climate, household insulation level and heat pump scheduling to be examined to best understand how to operate a heat pump efficiently. Simulation tools promise to be an important technique to examine heat pump performance.
There is likely value in further exploring the measurement data. Future measurement projects could include more detailed measurements of the heat pump operating characteristics including measuring the heat output of the heat pump.
Future projects may also use controlled experiments focused more broadly on temperature outcomes and heat pump electricity requirements subject to particular operational or physical variations.

Study Report SR414 Heat pump performance
23
References Batstone, S. & Reeve, D. (2014). Trends in residential electricity consumption.
Auckland, New Zealand: Sapere Research Group.
BRANZ. (2016). Heat pumps. Bulletin 600. Judgeford, New Zealand: BRANZ Ltd.
Buckett, N. (2007). National impacts of the widespread adoption of heat pumps in New Zealand. Study Report SR169. Judgeford, New Zealand: BRANZ Ltd.
Burrough, L., Saville-Smith, K. & Pollard, A. (2015). Heat pumps in New Zealand. BRANZ Study Report SR329. Judgeford, New Zealand: BRANZ Ltd.
Centre for Advanced Engineering. (1996). Energy efficiency: A guide to current and emerging technologies. Volume 1: Buildings and transportation. Christchurch, New Zealand: Centre for Advanced Engineering, University of Canterbury.
Christensen, D., Fang, X., Tomerlin, J., Winkler, J. & Hancock, E. (2011). Field monitoring protocol: Mini-split heat pumps. Washington, DC: US Department of Energy.
Consumer. (2018). Heat pump FAQs. Retrieved from https://www.consumer.org.nz/articles/heat-pump-faqs
Cutler, D., Winkler, J., Kruis, N., Christensen, C. & Brandemuehl, M. (2013). Improved modeling of residential air conditioners and heat pumps for energy calculations. Golden, Colorado: National Renewable Energy Laboratory.
E3 Equipment Energy Efficiency. (2016). Consultation regulation impact statement – air conditioners and chillers: Regulatory reform opportunities and improving energy efficiency outcomes. Canberra, Australia: Department of Industry, Innovation and Science.
Gleeson, C. P. & Lowe, R. (2013). Meta-analysis of European heat pump field trial efficiencies. Energy and Buildings, 66, 637–647.
Haller, M. Y., Bertram, E., Dott, R., Afjei, T., Ochs, F. & Hadorn, J.-C. (2012). Review of component models for the simulation of combined solar and heat pump heating systems. Energy Procedia, 30, 611–622.
Isaacs, N., Camilleri, M., Burrough, L., Pollard, A., Saville-Smith, K., Fraser, R., Rossouw, P., & Jowett, J. (2010). Energy use in New Zealand houses: Final report on the Household Energy End-Use Project (HEEP). Study Report SR221. Judgeford, New Zealand: BRANZ Ltd.
Macara, G. R. (2018). The climate and weather of New Zealand. NIWA Science and Technology Series Number 74. Wellington, New Zealand: NIWA.
Ministry of Business, Innovation and Employment. (2017). Energy in New Zealand 2017. Wellington, New Zealand.
Oak Ridge National Laboratory.(2018). DOE/ORNL heat pump design model. Retrieved from https://hpdmflex.ornl.gov/hpdm/wizard/welcome.php

Study Report SR414 Heat pump performance
24
Roy, R., Caird, S. & Potter, S. (2010). Getting warmer: A field trial of heat pumps. London, UK: The Energy Saving Trust.
Staffell, I., Brett, D., Brandon, N. & Hawkes, A. (2012). A review of domestic heat pumps. Energy and Environmental Science, 5, 9291–9306.
Statistics New Zealand. (2017). 2018 Census report on final content. Wellington, New Zealand.
Underwood, C., Royapoor, M. & Sturm, B. (2017). Parametric modelling of domestic air-source heat pumps. Energy and Buildings, 139, 578–589.
White, V. & Jones, M. (2017). Warm, dry, healthy? Insights from the 2015 House Condition Survey on the presence of insulation, ventilation, heating and mould in New Zealand houses. Study Report SR372. Judgeford, New Zealand: BRANZ Ltd.
Winkler, J. (2011). Laboratory test report for Fujitsu 12RLS and Mitsubishi FE12NA mini-split heat pumps. Washington, DC: US Department of Energy.
Copyright © 2022 FDOKUMEN