Study Packet Week 1 Statistics CP
12
Study Packet Week 1 Statistics CP
-
Upload
khangminh22 -
Category
Documents
-
view
1 -
download
0
Transcript of Study Packet Week 1 Statistics CP
Study Packet Week 1
Statistics CP
Chapter 9
Parent Guide with Extra Practice © 2009, 2014 CPM Educational Program. All rights reserved. 105
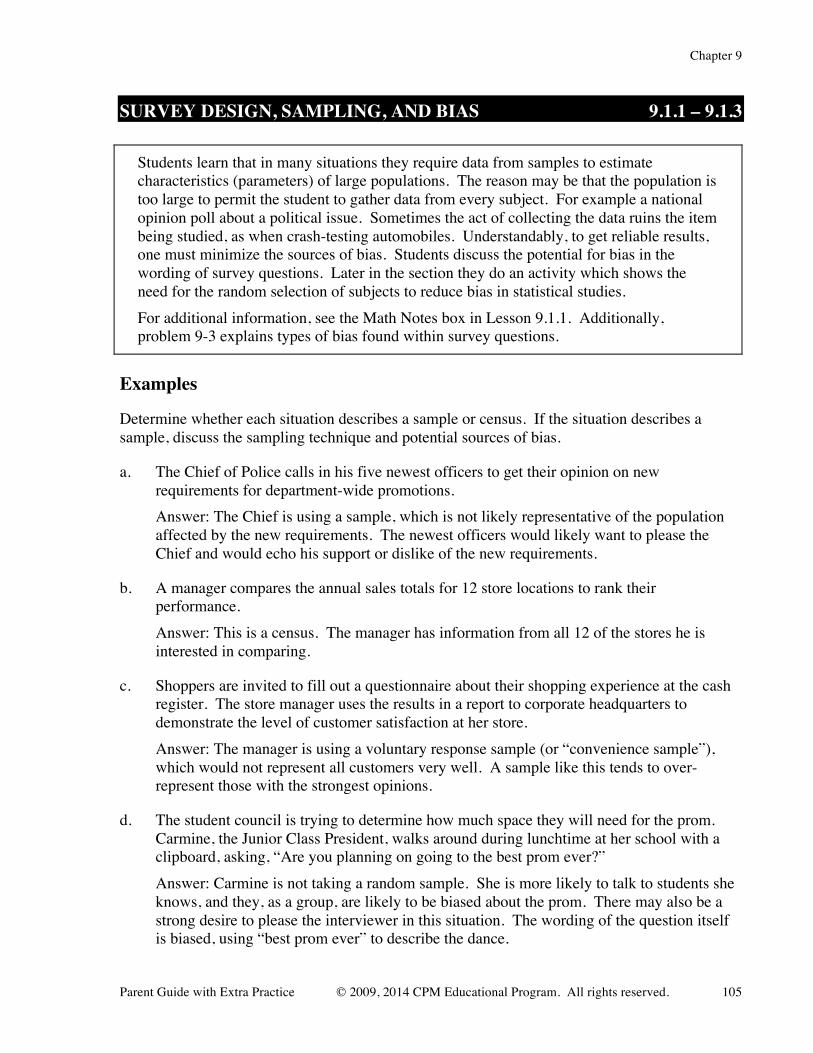
SURVEY DESIGN, SAMPLING, AND BIAS 9.1.1 – 9.1.3
Students learn that in many situations they require data from samples to estimate characteristics (parameters) of large populations. The reason may be that the population is too large to permit the student to gather data from every subject. For example a national opinion poll about a political issue. Sometimes the act of collecting the data ruins the item being studied, as when crash-testing automobiles. Understandably, to get reliable results, one must minimize the sources of bias. Students discuss the potential for bias in the wording of survey questions. Later in the section they do an activity which shows the need for the random selection of subjects to reduce bias in statistical studies. For additional information, see the Math Notes box in Lesson 9.1.1. Additionally, problem 9-3 explains types of bias found within survey questions.
Examples Determine whether each situation describes a sample or census. If the situation describes a sample, discuss the sampling technique and potential sources of bias.
a. The Chief of Police calls in his five newest officers to get their opinion on new requirements for department-wide promotions.
Answer: The Chief is using a sample, which is not likely representative of the population affected by the new requirements. The newest officers would likely want to please the Chief and would echo his support or dislike of the new requirements.
b. A manager compares the annual sales totals for 12 store locations to rank their performance.
Answer: This is a census. The manager has information from all 12 of the stores he is interested in comparing.
c. Shoppers are invited to fill out a questionnaire about their shopping experience at the cash register. The store manager uses the results in a report to corporate headquarters to demonstrate the level of customer satisfaction at her store.
Answer: The manager is using a voluntary response sample (or “convenience sample”), which would not represent all customers very well. A sample like this tends to over-represent those with the strongest opinions.
d. The student council is trying to determine how much space they will need for the prom. Carmine, the Junior Class President, walks around during lunchtime at her school with a clipboard, asking, “Are you planning on going to the best prom ever?”
Answer: Carmine is not taking a random sample. She is more likely to talk to students she knows, and they, as a group, are likely to be biased about the prom. There may also be a strong desire to please the interviewer in this situation. The wording of the question itself is biased, using “best prom ever” to describe the dance.
106 © 2009, 2014 CPM Educational Program. All rights reserved. Core Connections Algebra 2
Problems Determine whether each situation describes a sample or census. If it is a sample, discuss the sampling technique and potential sources of bias.
1. A math teacher wants to determine whether playing classical music during testing benefits high school math students. He plays classical music to half of his classes while they test, and compares their scores to the other half of his classes, who tested without the music.
2. A sports news reporter wants to know the win-loss record of the local high school girls lacrosse team, so he looks at the league website and sees that they have 8 wins and 5 losses.
3. A battery manufacturer wants to monitor the durability and peak voltage of its products. A machine is programmed to select every 1000th battery from the production line and subject it to a series of tests.
4. Scott is doing a report on the risk factors for cancer. He asks all of the members of his PE class: “Do you have a family history of cancer?” and “Do you eat 5 servings of fruits and vegetables each day?”
Answers
1. Because the math teacher is using his data to make a statement about all high school math students (the population), his classes represent a sample of those students. His students would have many things in common, like where they live and how they were taught, which other high school math students do not have. They would be a poor representation of the population. The teacher may also be biased in grading the exams to obtain the results he favors.
2. This is a census. The reporter has access to every game outcome for the team he is researching and is not using the information to draw conclusions about other teams or the sport of lacrosse in general.
3. The batteries tested represent a sample of those being made. They might be a reasonable representation of the population of batteries. However, if the 1000th battery is usually made at the same time every day, or corresponds to some other variable like periodic machine maintenance, it might be subject to bias.
4. Scott’s PE class represents a sample of people or students. However this is a convenience sample and cannot be considered a reliable representation of the population of people or students. The question order may cause bias in the results as people being reminded of a disease like cancer would likely want to appear concerned enough to be eating a healthy diet with lots of fruits and vegetables. Members of a PE class may be more inclined to be thinking about health issues such as diet.
Chapter 9
Parent Guide with Extra Practice © 2009, 2014 CPM Educational Program. All rights reserved. 107
TESTING CAUSE AND EFFECT WITH EXPERIMENTS AND CONCLUSIONS FROM OBSERVATIONAL STUDIES 9.2.1 and 9.2.2
Two ways to gather information for statistical studies are observational studies and experiments. Observational studies seek to collect data about subjects without changing them, while experiments impose treatments (variables of interest) upon the subjects. Observational studies are generally easier to perform but cannot demonstrate cause-and-effect relationships because it is not possible to separate the many effects of all the lurking variables (those outside of what is being observed directly). For additional information, see the Math Notes box in Lesson 9.2.1.
Examples For each question below:
• Does a census or a sample make more sense in this situation? • Should an observational study or an experiment be carried out to answer the question? • If an observational study is suitable and asks for an association between variables, discuss
the effects of possible lurking variables. • If an experiment would be suitable, outline an experimental design.
a. Is there a relationship between drinking green tea and longevity? Answer: Because it would be impossible to find every green tea consumer this study would
need to rely on sampling. Green tea would not be a difficult treatment to administer in an experiment but because life-spans are being measured, an experiment would be impractical. An observational study may find a relationship between these two variables but would be unable to establish cause and effect because of the many possible lurking variables. Perhaps people who choose to drink green tea also choose to be more health conscious in other ways such as smoke less than the general population. They may also tend to be of higher income and have better access to health care. Hence their longevity causes could really be smoking less and having better health care, not from drinking green tea.
b. What is the mean verbal SAT score in the state of Colorado for a given year? Answer: This information is easily found by a census.
c. What percentage of razorback clams show signs of stress from acidic ocean water? Answer: One could not find every clam for study and the stress testing of the clams may
harm them, so a sample would be appropriate. It would be important to gather razorback clams from a variety of locations as environmental conditions may vary considerably.
d. Would brighter classroom lighting increase exam scores? Answer: This would require using a sample of students in a controlled experiment. One
could take student volunteers and give them the same instruction on a topic, then randomly assign them to classrooms with different lighting levels for the same exam. The mean test scores from each group could be compared.
108 © 2009, 2014 CPM Educational Program. All rights reserved. Core Connections Algebra 2
Problems For each question:
• Does a census or a sample make more sense in this situation?
• Should an observational study or an experiment be carried out to answer the question?
• If an observational study is suitable and asks for an association between variables, discuss the effects of possible lurking variables.
• If an experiment would be suitable, outline an experimental design. 1. Is there a relationship between the temperature of water and its electrical resistance? 2. What is the mean distance students commute to school in your county? 3. What percentage of car crashes causing injury occurred when at least one driver was
impaired by drugs or alcohol? 4. Is there an association between baldness and being colorblind? Answers 1. One would have to work with samples of water in this situation. This question would best
be answered as an experiment. Begin with water from the same source so its other variables like impurities remain constant and divide it into several like containers. Randomly assign different temperatures to the water containers and measure the electrical resistance between two wires inserted an equal distance apart in each container, then compare results.
2. For most counties, surveying every student about commute distances is not possible, so a
random sample of students could be used to represent the population. This is clearly an observational study because the question seeks to determine how students commute without imposing any changes upon them.
3. This kind of information is routinely collected by law enforcement, so census data is likely
available. 4. This study would require samples from the population. An observational study is the only
reasonable alternative because an experiment would require imposing baldness or colorblindness upon subjects. A lurking variable here is gender. Men are more often colorblind and more often bald than women, so if the study included both genders then it would likely find an association.
Chapter 9
Parent Guide with Extra Practice © 2009, 2014 CPM Educational Program. All rights reserved. 109
RELATIVE FREQUENCY HISTOGRAMS 9.3.1
When the frequencies in a frequency table are divided by the total number of data points, the frequencies become ratios, and the frequency table becomes a relative frequency table. Histograms show the information from frequency tables and relative frequency histograms display information from relative frequency tables. In this section histograms or their associated tables are used to translate ranges of data into percentages. Note: Many of these lessons require the use of a graphing calculator. Instructions for using a TI-83/84+ calculator can be found at cpm.org or studenthelp.cpm.org.
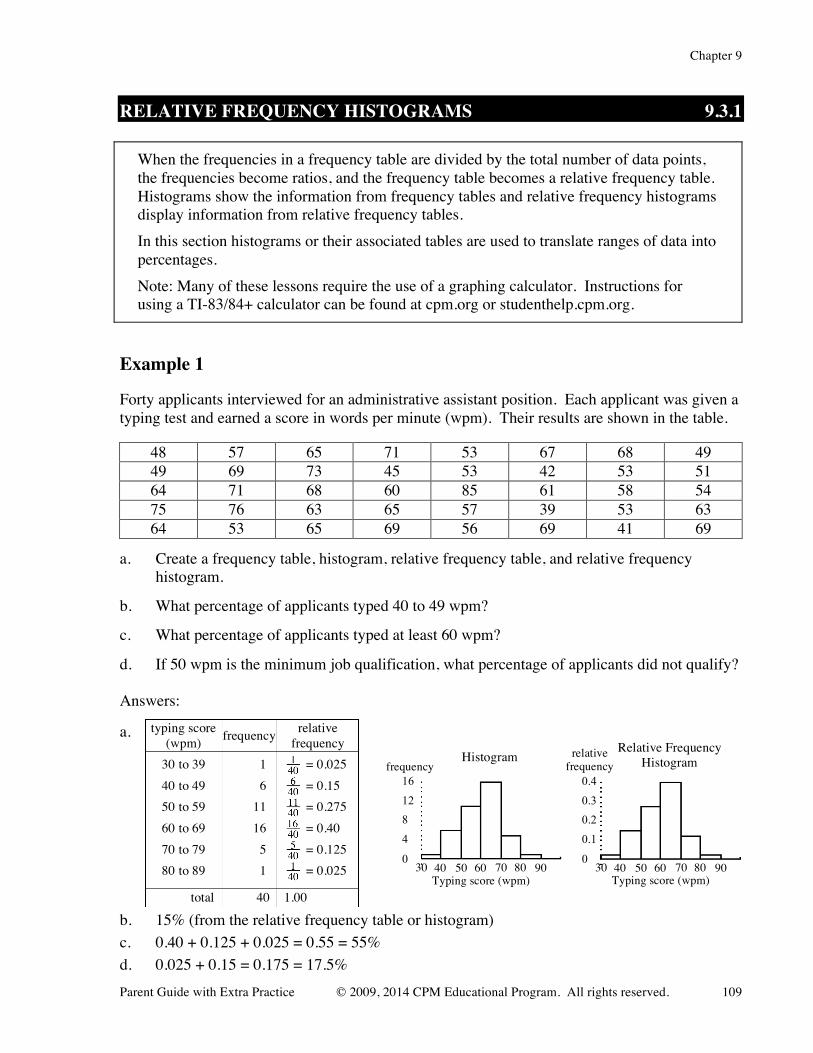
Example 1 Forty applicants interviewed for an administrative assistant position. Each applicant was given a typing test and earned a score in words per minute (wpm). Their results are shown in the table.
48 57 65 71 53 67 68 49 49 69 73 45 53 42 53 51 64 71 68 60 85 61 58 54 75 76 63 65 57 39 53 63 64 53 65 69 56 69 41 69
a. Create a frequency table, histogram, relative frequency table, and relative frequency histogram.
b. What percentage of applicants typed 40 to 49 wpm?
c. What percentage of applicants typed at least 60 wpm?
d. If 50 wpm is the minimum job qualification, what percentage of applicants did not qualify? Answers: a. b. 15% (from the relative frequency table or histogram) c. 0.40 + 0.125 + 0.025 = 0.55 = 55% d. 0.025 + 0.15 = 0.175 = 17.5%
typing score (wpm) frequency relative
frequency 30 to 39 40 to 49 50 to 59 60 to 69 70 to 79 80 to 89
1 6
11 16
5 1
= 0.025 = 0.15 = 0.275 = 0.40 = 0.125 = 0.025
total 40 1.00
0.4
0.3 0.2
0.1
0 30 40 50 60 70 80 90
relative frequency
Typing score (wpm)
Relative Frequency Histogram
16
12 8
4
0 30 40 50 60 70 80 90
frequency
Typing score (wpm)
Histogram
110 © 2009, 2014 CPM Educational Program. All rights reserved. Core Connections Algebra 2
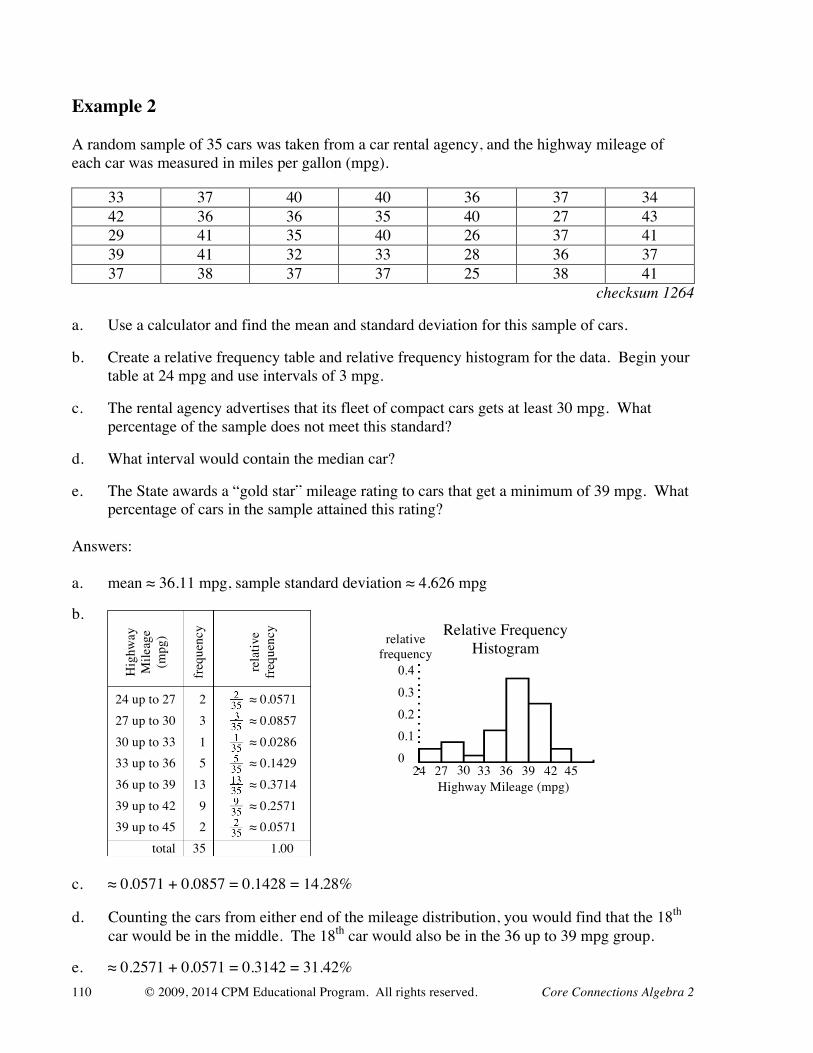
Example 2 A random sample of 35 cars was taken from a car rental agency, and the highway mileage of each car was measured in miles per gallon (mpg).
33 37 40 40 36 37 34 42 36 36 35 40 27 43 29 41 35 40 26 37 41 39 41 32 33 28 36 37 37 38 37 37 25 38 41
checksum 1264 a. Use a calculator and find the mean and standard deviation for this sample of cars. b. Create a relative frequency table and relative frequency histogram for the data. Begin your
table at 24 mpg and use intervals of 3 mpg. c. The rental agency advertises that its fleet of compact cars gets at least 30 mpg. What
percentage of the sample does not meet this standard? d. What interval would contain the median car? e. The State awards a “gold star” mileage rating to cars that get a minimum of 39 mpg. What
percentage of cars in the sample attained this rating? Answers: a. mean ≈ 36.11 mpg, sample standard deviation ≈ 4.626 mpg b. c. ≈ 0.0571 + 0.0857 = 0.1428 = 14.28% d. Counting the cars from either end of the mileage distribution, you would find that the 18th
car would be in the middle. The 18th car would also be in the 36 up to 39 mpg group. e. ≈ 0.2571 + 0.0571 = 0.3142 = 31.42%
Hig
hway
M
ileag
e (m
pg)
freq
uenc
y
rela
tive
freq
uenc
y
24 up to 27 27 up to 30 30 up to 33 33 up to 36 36 up to 39 39 up to 42 39 up to 45
2 3 1 5
13 9 2
≈ 0.0571 ≈ 0.0857 ≈ 0.0286 ≈ 0.1429 ≈ 0.3714 ≈ 0.2571 ≈ 0.0571
total 35 1.00
0.4
0.3
0.2
0.1
0 24 27 30 33 36 39 42
relative frequency
Highway Mileage (mpg)
Relative Frequency Histogram
45
Chapter 9
Parent Guide with Extra Practice © 2009, 2014 CPM Educational Program. All rights reserved. 111
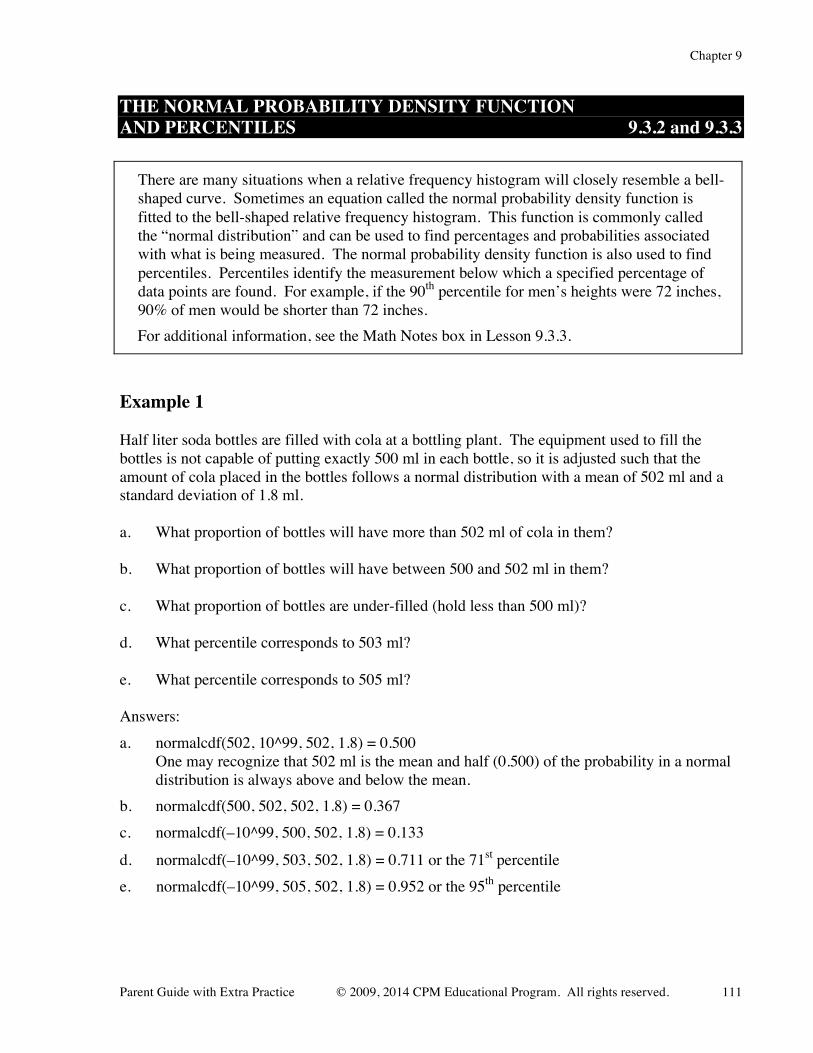
THE NORMAL PROBABILITY DENSITY FUNCTION AND PERCENTILES 9.3.2 and 9.3.3
There are many situations when a relative frequency histogram will closely resemble a bell-shaped curve. Sometimes an equation called the normal probability density function is fitted to the bell-shaped relative frequency histogram. This function is commonly called the “normal distribution” and can be used to find percentages and probabilities associated with what is being measured. The normal probability density function is also used to find percentiles. Percentiles identify the measurement below which a specified percentage of data points are found. For example, if the 90th percentile for men’s heights were 72 inches, 90% of men would be shorter than 72 inches. For additional information, see the Math Notes box in Lesson 9.3.3.
Example 1 Half liter soda bottles are filled with cola at a bottling plant. The equipment used to fill the bottles is not capable of putting exactly 500 ml in each bottle, so it is adjusted such that the amount of cola placed in the bottles follows a normal distribution with a mean of 502 ml and a standard deviation of 1.8 ml. a. What proportion of bottles will have more than 502 ml of cola in them? b. What proportion of bottles will have between 500 and 502 ml in them? c. What proportion of bottles are under-filled (hold less than 500 ml)? d. What percentile corresponds to 503 ml? e. What percentile corresponds to 505 ml? Answers: a. normalcdf(502, 10^99, 502, 1.8) = 0.500
One may recognize that 502 ml is the mean and half (0.500) of the probability in a normal distribution is always above and below the mean.
b. normalcdf(500, 502, 502, 1.8) = 0.367 c. normalcdf(–10^99, 500, 502, 1.8) = 0.133
d. normalcdf(–10^99, 503, 502, 1.8) = 0.711 or the 71st percentile e. normalcdf(–10^99, 505, 502, 1.8) = 0.952 or the 95th percentile

112 © 2009, 2014 CPM Educational Program. All rights reserved. Core Connections Algebra 2
Example 2 Commercial cherry trees produce fruit according to a normal distribution with an average of 90 kg of cherries per tree and a standard deviation of 11 kg per tree. a. What is the probability that a tree produces at least 95 kg of cherries? b. What is the probability that a tree yields between 85 and 105 kg of cherries? c. What percentile would a harvest of 80 kg be for a single tree? Answers: a. normalcdf(95, 10^99, 90, 11) = 0.325 b. normalcdf(85, 105, 90, 11) = 0.589
c. normalcdf(–10^99, 80, 90, 11) = 0.182 or the 18th percentile Problems 1. Concrete is loaded into trucks for a large construction project according to a normal
distribution. The mean amount loaded is 230 cubic feet with a standard deviation of 7 cubic feet. Concrete trucks are rated by the number of cubic yards they can carry, and 9 cubic yards is a common maximum load. Hence the expression “the whole nine yards.”
a. What proportion of the trucks will be loaded with between 220 and 240 cubic feet?
b. What proportion of trucks are loaded with more concrete than the 9 cubic yard maximum. (3 feet = 1 yard)
c. 235 cubic feet is what percentile load?
d. If a particular job requires at least 220 cubic yards of concrete, what is the probability there will not be enough concrete in a single truck?
2. Assume the annual snowfall in the village of Thalhammer follows a normal distribution
with a mean of 185 cm and standard deviation of 36 cm.
a. Less than 100 cm of snow in a year is considered drought conditions in Thalhammer. What is the chance that a particular year will have drought conditions?
b. The Rivera Valley lies below Thalhammer. Residents of Rivera Valley are placed on a flood-warning from snowmelt in the spring if annual snowfall in Thalhammer is greater than 250 cm. What is the probability the Rivera Valley residents will be placed on a flood-warning this spring?
c. What percentile corresponds to 160 cm of annual snowfall in Thalhammer?
Chapter 9
Parent Guide with Extra Practice © 2009, 2014 CPM Educational Program. All rights reserved. 113
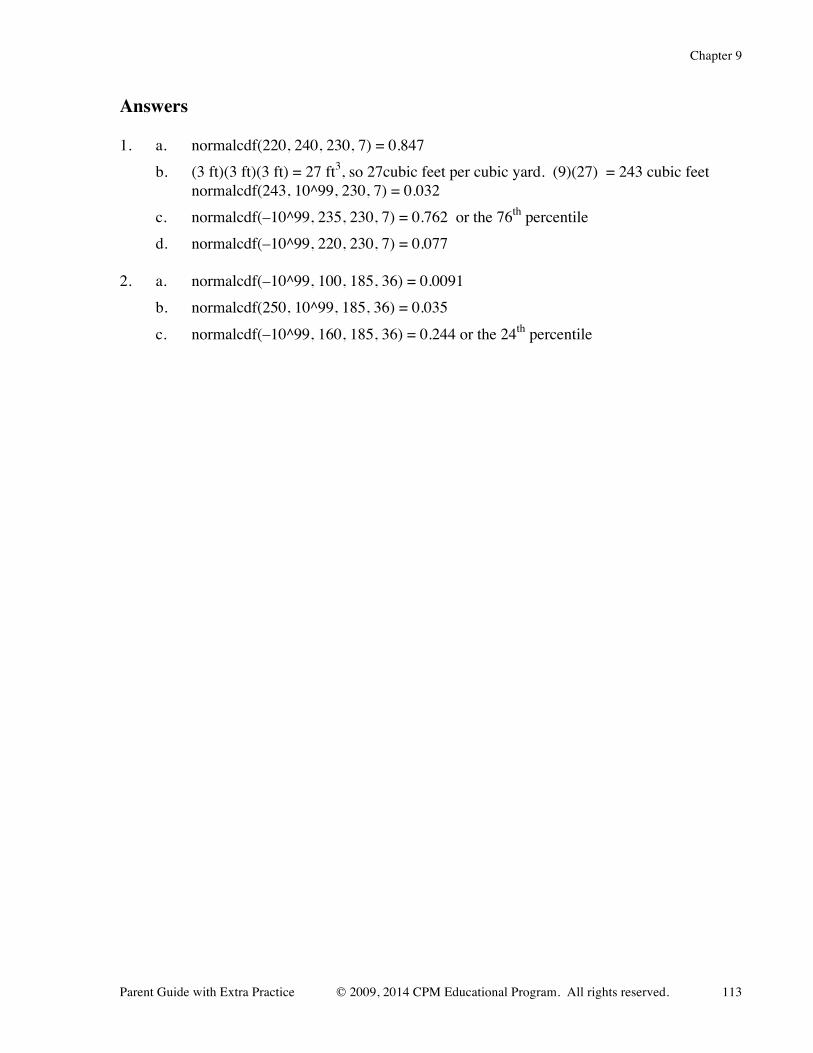
Answers 1. a. normalcdf(220, 240, 230, 7) = 0.847 b. (3 ft)(3 ft)(3 ft) = 27 ft3, so 27cubic feet per cubic yard. (9)(27) = 243 cubic feet
normalcdf(243, 10^99, 230, 7) = 0.032 c. normalcdf(–10^99, 235, 230, 7) = 0.762 or the 76th percentile d. normalcdf(–10^99, 220, 230, 7) = 0.077 2. a. normalcdf(–10^99, 100, 185, 36) = 0.0091 b. normalcdf(250, 10^99, 185, 36) = 0.035 c. normalcdf(–10^99, 160, 185, 36) = 0.244 or the 24th percentile
114 © 2009, 2014 CPM Educational Program. All rights reserved. Core Connections Algebra 2
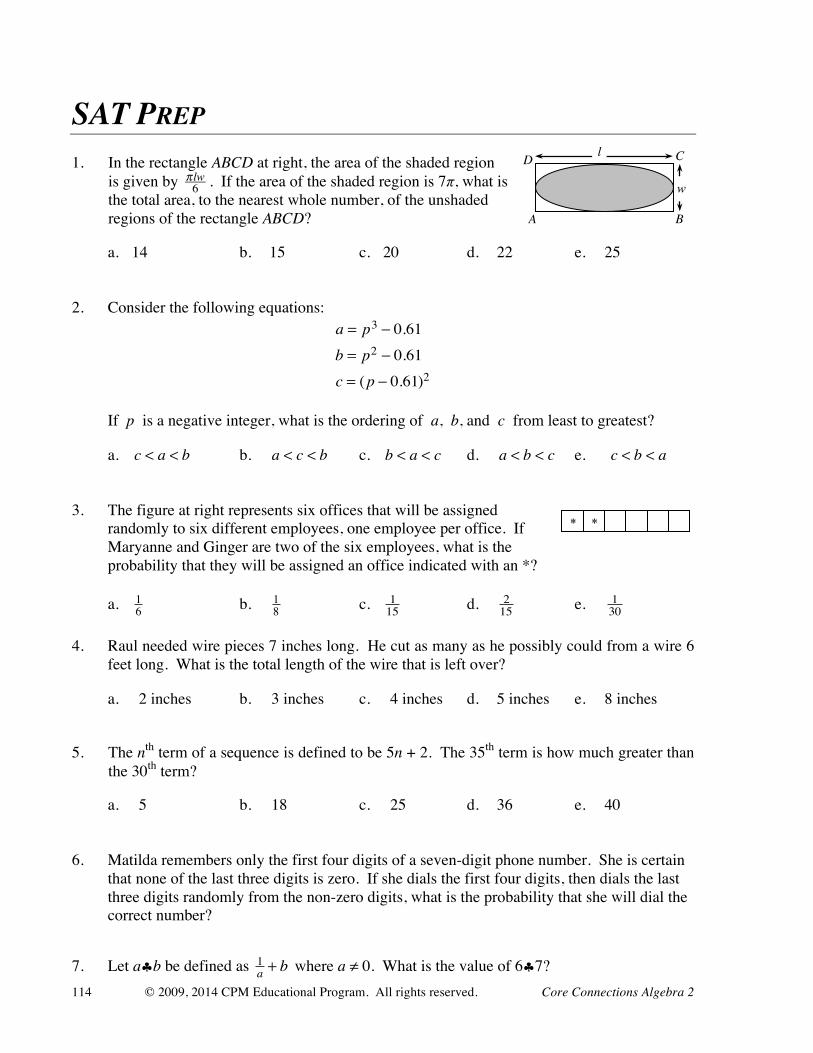
SAT PREP 1. In the rectangle ABCD at right, the area of the shaded region
is given by π lw6 . If the area of the shaded region is 7π, what is the total area, to the nearest whole number, of the unshaded regions of the rectangle ABCD?
a. 14 b. 15 c. 20 d. 22 e. 25
2. Consider the following equations: a = p3 − 0.61b = p2 − 0.61c = (p − 0.61)2
If p is a negative integer, what is the ordering of a, b, and c from least to greatest?
a. c < a < b b. a < c < b c. b < a < c d. a < b < c e. c < b < a
3. The figure at right represents six offices that will be assigned randomly to six different employees, one employee per office. If Maryanne and Ginger are two of the six employees, what is the probability that they will be assigned an office indicated with an *?
a. 16 b. 1
8 c. 115 d. 2
15 e. 130
4. Raul needed wire pieces 7 inches long. He cut as many as he possibly could from a wire 6
feet long. What is the total length of the wire that is left over?
a. 2 inches b. 3 inches c. 4 inches d. 5 inches e. 8 inches
5. The nth term of a sequence is defined to be 5n + 2. The 35th term is how much greater than
the 30th term?
a. 5 b. 18 c. 25 d. 36 e. 40 6. Matilda remembers only the first four digits of a seven-digit phone number. She is certain
that none of the last three digits is zero. If she dials the first four digits, then dials the last three digits randomly from the non-zero digits, what is the probability that she will dial the correct number?
7. Let a♣b be defined as 1a + b where a ≠ 0. What is the value of 6♣7?
l
w
A B
C D
* *
Chapter 9
Parent Guide with Extra Practice © 2009, 2014 CPM Educational Program. All rights reserved. 115
8. If 4xy + 1 = 1, what is the value of xy? 9. Eight consecutive integers are arranged in order from smallest to the largest. If the sum of
the first four integers is 206, what is the sum of the last four integers? 10. If the points A(4, 1), B(4, 8), and C(–3, 8) form the vertices of a triangle, what is the area of
the triangle? Answers 1. C 2. D 3. C 4. A 5. C
6. 1729
7. 436
8. 0 9. 222 10. 24.5