Study on the economic impact of an agreement between the ...
102
ICF International, 3rd Floor, Kean House, 6 Kean Street, London, WC2B 4AS T +44 (0)20 7092 3000 F +44 (0)20 7092 3001 icfi.com Study on the economic impact of an agreement between the EU and the Republic of Turkey FINAL REPORT 14 OCTOBER 2014
-
Upload
khangminh22 -
Category
Documents
-
view
0 -
download
0
Transcript of Study on the economic impact of an agreement between the ...

ICF International, 3rd Floor, Kean House, 6 Kean Street, London, WC2B 4AS
T +44 (0)20 7092 3000 F +44 (0)20 7092 3001 icfi.com
Study on the economic
impact of an agreement
between the EU and the
Republic of Turkey
FINAL REPORT
14 OCTOBER 2014

Study on the economic impact of an agreement between the EU and the Republic of Turkey
Document Control
Document title Study on the economic impact of an agreement between the EU and the
republic of Turkey
Prepared by Enrico Pastori, Alessio Sitran, Caterina Rosa, Dorota Bielanska (TRT), Artem
Korzhenevych, Marco Artavia (DIW ECON), Andrew Jarvis (ICF)
Checked by Andrew Jarvis
Date 14 October 2014
This report is the Copyright of ICF Consulting Ltd and has been prepared by ICF Consulting Ltd under
contract to the European Commission. The contents of this report may not be reproduced in whole or
in part, nor passed to any organisation or person without the specific prior written permission of the
ICF has used reasonable skill and care in checking the accuracy and completeness of information
supplied by the client and/or third parties in the course of this project. ICF is however unable to
warrant either the accuracy or completeness of client and/or third party information nor that it is fit for
any purpose. ICF does not accept responsibility for any legal, commercial or other consequences that
may arise directly or indirectly as a result of the use by ICF of inaccurate or incomplete client and/or
third party information in the course of this project or its inclusion in project outcomes.
The information and views set out in this report are those of the author(s) and do not
necessarily reflect the official opinion of the Commission. The Commission does not
guarantee the accuracy of the data included in this.
study. Neither the Commission nor any person acting on the Commission’s behalf
may be held responsible for the use which may be made of the information contained
therein.

Study on the economic impact of an agreement between the EU and the Republic of Turkey
Contents
EXECUTIVE SUMMARY .................................................................. I
1 INTRODUCTION .................................................................... 1
1.1 Study objectives .................................................................................................................... 1
1.2 Structure of the report .......................................................................................................... 1
1.3 Market and regulatory context .............................................................................................. 1
2 BILATERAL AGREEMENTS AND THE ITF MULTILATERAL
QUOTA SYSTEM .......................................................................... 6
2.1 The role of the EU in regulating road freight services with third countries ............................. 6
2.2 Bilateral agreements between EU Member States and Turkey ............................................... 8
2.3 Bilateral quotas ..................................................................................................................... 8
2.4 The ITF multilateral quota system ........................................................................................ 13
3 EU – TURKEY TRADE: COMMODITIES AND TRENDS ................ 14
4 EU - TURKEY ROAD-BASED TRADE ........................................ 17
5 THE ROAD FREIGHT SECTOR IN THE EU AND TURKEY ............. 22
5.1 The EU international road freight sector .............................................................................. 22
5.2 The Turkish international road freight sector ....................................................................... 26
5.3 Distribution of the EU – Turkey road freight market ............................................................ 27
5.4 Cost comparison of EU and Turkish road transport operators .............................................. 29
6 THE REGULATORY FRAMEWORK FOR ROAD FREIGHT
TRANSPORT IN TURKEY AND ITS ALIGNMENT TO THE EU ROAD
TRANSPORT ACQUIS .................................................................. 31
7 THE LIBERALISATION SCENARIOS ......................................... 36
8 IMPACT ASSESSMENT ......................................................... 38
8.1 Reference scenario .............................................................................................................. 38
8.2 Full liberalisation ................................................................................................................. 39
8.2.1 Impacts on value of trade ........................................................................................................................... 39
8.2.2 Macroeconomic and sectoral impacts ........................................................................................................ 40
8.2.3 Impact on the EU-Turkey haulage market .................................................................................................. 41
8.2.4 Changes in distribution of traffic ................................................................................................................ 41

Study on the economic impact of an agreement between the EU and the Republic of Turkey
8.3 Transit liberalisation ............................................................................................................ 42
8.3.1 Impacts on value of trade ........................................................................................................................... 43
8.3.2 Macroeconomic and sectoral impacts ........................................................................................................ 43
8.3.3 Impact on scale of traffic flows ................................................................................................................... 44
8.1 Transit liberalisation + additional EU permits ....................................................................... 44
8.2 EU management of quotas .................................................................................................. 45
8.3 Summary ............................................................................................................................. 45
9 CONCLUSIONS .................................................................... 47
Appendices
Appendix A References
Appendix B Current EU legislative framework applying to the road freight sector
Appendix C Bilateral agreements signed by Turkey with EU Member States
Appendix D ECMT (ITF) Licenses distribution
Appendix E Data and figures related to Turkey market and EU - Turkey trade
Appendix F Impact assessment methodology

Study on the economic impact of an agreement between the EU and the republic of Turkey
LIST OF ABBREVIATIONS
AETR European Agreement concerning the Work of Crews of Vehicles engaged in International Road
Transport
BWTO Border Waiting Times Observatory
CAGR Compound annual growth rate
EC European Commission
ECJ European Court of Justice
ECMT European Conference of Ministers of Transport
EEC European Economic Community
EU European Union
EU 27 EU12 + EU 15
EU 28 The 28 Member States of the European Union (EU 13+ EU 15)
EU12 Bulgaria, Cyprus, Czech Republic, Estonia, Hungary, Latvia, Lithuania, Malta, Poland,
Romania, Slovakia, Slovenia.
EU13 EU12 plus Croatia
EU15 Austria, Belgium, Denmark, Finland, France, Germany, Greece, Ireland, Italy, Luxembourg,
Netherlands, Portugal, Spain, Sweden and United Kingdom
HGV Heavy Goods Vehicle
IMF International Monetary Fund
IRU International Road Transport Union
ITF International Transport Forum (formerly ECMT)
MIO Million
NFD Negotiation Framework Document
NST-07 Classification system for transport statistics (NST 2007)
SITC Standard International Trade Classification
UND International Transporters Association of Turkey
UNECE United Nations Economic Commission for Europe
USD United States Dollars
WTO World Trade Organization

Study on the economic impact of an agreement between the EU and the republic of Turkey
COUNTRY ABBREVIATIONS
EU Member States
AT Austria IE Ireland
BE Belgium IT Italy
BG Bulgaria LT Lithuania
CY Cyprus LU Luxembourg
CZ Czech Republic LV Latvia
DE Germany MT Malta
DK Denmark NL Netherlands
EE Estonia PL Poland
EL Greece PT Portugal
ES Spain RO Romania
FI Finland SE Sweden
FR France SI Slovenia
HR Croatia SK Slovakia
HU Hungary UK United Kingdom
Other countries
TR Turkey

Study on the economic impact of an agreement between the EU and the republic of Turkey
Page i
Executive summary
A high level analysis has been carried out of the impact of gradual liberalisation of access to the
market for road freight services operated between the EU and Turkey. Such services are currently
regulated by bilateral intergovernmental agreements between Member States and Turkey. These
agreements impose quota and permit arrangements on hauliers from both sides. The study
concludes that an EU agreement which abolished these requirements would deliver positive boost to
trade, output and employment for both parties. The largest gains come from removal of transit
permits while; remove of bilateral permitting arrangements would have a smaller effect. Full
liberalisation could boost total trade by more than €3 billion per year. Liberalisation increases the
EU’s road-freighted exports to Turkey less than it does imports from Turkey under all scenarios.
Bilateral intergovernmental agreements impose constraints and costs on road freight services between
EU Member States and Turkey Road transport services operating between EU Member States and Turkey are regulated by bilateral
intergovernmental agreements signed by individual EU Member States. These agreements set the
conditions under which transport services can be operated and, in particular, establish the number and
nature of the permits that are required to perform a transport operation between the signatory Member State
and Turkey. The permits are usually administered by the relevant ministry for transport, and are issued on a
regular basis, according to specific requirements. The permit system imposes operational constraints on
operators and an administrative burden. The additional costs associated with these arrangements are
reflected in the price of final goods supplied to the market.
There are significant differences among the agreements signed by Member States with Turkey, not least in
the variety and mix of permits they provide for. Some agreements provide different classes of permit for
transit trade and bilateral trade, others do not. Permits can be specific to the vehicle type (e.g. according its
Euro emissions class). In some cases requirements, e.g. for a haulier in transit to buy a special permit, are
imposed on Turkish operators but not those of other third countries (e.g. Iran, Serbia).
In 2013 a total of 961,087 permits of all types were issued to Turkish road transport companies by the 25 EU
Member States with which Turkey has bilateral road transport agreements (only Cyprus, Ireland and Malta
have not signed agreements). The majority were bilateral or transit permits (42% and 31% respectively).
Bulgaria and Germany grant the largest number of permits (31.3% and 17.7% respectively), followed by
Croatia (6.4%), Romania (6.1%), Greece (5.7%) and Italy (5.2%). Over the last five years (2009-2013) the
allocation of all types of bilateral permits granted by this ‘top six’ group of Member States remained broadly
unchanged.
Alongside the permits provided by bilateral agreements, the International Transport Forum (ITF) operates a
quota system that provides multilateral licenses for the international carriage of goods by road by transport
undertakings established in a member country of the European Conference of Ministers of Transport
(ECMT). The licenses apply to carriage of goods between ECMT Member countries or in transit through the
territory of one or several ECMT member country(ies). The vehicles must be registered in an ECMT member.
The system for allocating quota among ECMT Member Countries encourages better environmental
performance through a bonus scheme. Annual quotas for Euro V Safe lorries account for 75% of all quotas
issued. As of 1 January 2014 4,258 annual licenses were issued to Turkish operators, of which 3,740 (87%)
were valid for Euro V Safe lorries.
Analysis suggests that the EU hauliers have access to sufficient permits but regularly experience problems
with the interpretation of rules at a local level by the Turkish authorities. Turkish hauliers report
problems with shortages of transit and bilateral permits. The information gathered for this study suggests that EU truck operators have access to enough permits to
carry goods to and from Turkey for the permit supply not to be a constraint to market access. For the EU15

Study on the economic impact of an agreement between the EU and the republic of Turkey
Page ii
in particular this situation arises in part from the cost competitiveness of Turkish hauliers: shippers and
forwarders from the EU15 tend to use haulage services from Turkey to take advantage of their lower
charges. EU12 hauliers are better placed to compete with their Turkish counterparts.
Organisations represented hauliers based in Romania, Poland and Bulgaria suggest that the current
permitting arrangements create operational problems for EU operators in Turkey even where there is no
deficit in overall supply. Their complaints relate primarily to the interpretation of regulations at a local level,
with anecdotal reports of Turkish authorities: asking for permits also for vehicles below 3.5 tonnes maximum
permitted weight (which are out of scope of bilateral permits); asking for a third country permit (instead of the
bilateral permit) according to the origin of invoice, rather than the place of production or loading; and not
recognising permits or considering them as false or already used.
The same organisations also cite problems with use of ECMT licences, specifically cases of the Turkish
authorities: restricting the use of ECMT permits to trips requiring a minimum number of days; restricting the
use of ECMT permits by determining the country of origin of the transport operation to be the country in
which the invoice was issued rather than the place of loading as stated in the CMR and TIR; and not taking
into consideration multimodal transport operations.
Empirical data on the frequency of occurrence of such problems have not been located.
Turkey has three land border crossings with EU countries that are used by goods vehicles (with Greece and
Bulgaria). Data on border crossing waiting times at the Bulgarian border suggest typical wait times of around
three hours. Trucks leaving Turkey to come into the EU tend to wait longer than those leaving the EU to
enter Turkey.
For Turkish hauliers the principal issue is that demand for transit permits exceeds the supply provided for
free by some Member States (Italy, Austria, Hungary, Slovenia, and Romania). There is a shortage of
bilateral permits for certain Member States (in particular France and Spain).
Once the stock of free transit permits for Turkish operators is exhausted, certain Member States (e.g.
Romania, Greece. Hungary, Bulgaria), grant transit permits in return for payment of a fee. This imposes
additional costs on the Turkish operators affected
The routes that connect Turkey to its most important trading partners in the EU (Germany, Italy, France,
United Kingdom, Spain) require road freight operators to pass through the territory of third countries (mostly
other EU Member States). This transit traffic is most concentrated in Greece and Bulgaria but extends into
Slovenia, Austria, Hungary, Poland, Czech Republic, and other Member States.
Despite these constraints EU-Turkey trade has grown rapidly over the past decade Turkey is among the most important of the EU’s trading partners. Fuelled in part by EU investment in Turkey,
the EU’s exports to and imports from the country have increased rapidly since 1995. Trade volumes fell after
the 2007 economic crisis but have since recovered, with the rebound in exports being particularly strong
(Figure 1.1). In 2012 EU exports to Turkey were worth €75.1 billion and imports from Turkey were valued as
€47.8 billion. DG TRADE (2012) identified Turkey as the EU’s 7th largest source of imports and 5th largest
export market. Turkey’s trade with other regions has been growing much faster than its trade with the EU, in
particular over the last 5 years.
Germany, Italy, France, Spain and the UK are the most significant exporters to Turkey and provide the
largest EU markets for Turkish goods (on a value basis). Eurostat data the importance of chemicals, food,
wood products, basic metals and machinery in the EU’s exports to Turkey and food, textiles, mechanical and
machinery from Turkey to the EU.

Study on the economic impact of an agreement between the EU and the republic of Turkey
Page iii
Forty five per cent (by value) of Turkey’s trade with the EU in 2013 was carried by road. In tonnage terms,
road’s share is 22% for imports and 12% for exports. These data exclude, however, freight carried on ro-ro
services. Ro-ro services are an important part of the overall transport system that supports EU-Turkey trade.
Ro-ro’s share of EU-Turkey road traffic varies by Member State. As a general rule it is much higher for trade
with EU15. Ro-ro services had a twofold advantage: (i) they facilitated growth in trade in circumstances
where permit quotas have been kept constant and are insufficient to meet demand (e.g. Italy, France, and
Spain); (ii) they are used to avoid transit through countries that impose limitations on Turkish hauliers, such
as restrictions on the number of transit permits (e.g. Hungary, Slovenia, and Romania).
Figure EX.1 EU exports to Turkey have grown more rapidly than imports in recent years
EU – Turkey trade, US$ millions
Source: World Bank (2014), Evaluation of the EU-TURKEY Customs Union (IMF Direction of Trade Statistics); for years 2012-2013: UND data, Turkish interchanges with EU28.
EU haulage firms, mostly from eastern Member States, have about a third of the EU-Turkey road freight
market
The road haulage market in the EU comprises around 600,000 predominantly small enterprises, with an
average size of four employees per company. Hauliers from the eastern Member States have cost
advantages over EU15 hauliers where they are allowed to compete. Transport within and between EU15
Member States are mainly carried out by EU15 hauliers but movement of freight by road between EU15 and
EU12 countries is carried out almost exclusively by EU12 hauliers. Firms from the eastern Member States
dominate international transport both in bilateral exports/import activities and in crosstrades. Supported by
those successes in the intra-EU market, the heavy truck fleet registered in the eastern EU has grown
significantly since 2002 while that in the western EU has shrunk.
Across the EU as a whole, 43% of all vehicle-km are registered by vehicles that are less than 4 years old,
22% of vehicle-km by vehicles ranging from 4 to 6 years and a further 22% by vehicles 6 to 10 years old.
Vehicles that are more than 10 years old account only for the 13% of total traffic (though there is more use of
older vehicles in the EU12 than in the EU15).
EU hauliers have around a third of the road freight import trade (including ro-ro traffic) from Turkey. There
are very substantial differences between the western and eastern EU markets. In 2013 hauliers from the
EU15 had only 13% of the Turkey import market for those countries whereas hauliers from the EU13 carried
almost two thirds of the imports to the EU13. Overall, the share of road freight between EU and Turkey that

Study on the economic impact of an agreement between the EU and the republic of Turkey
Page iv
is carried by EU vehicles has been rising slowly in recent years as EU13 hauliers have gained an increasing
share of the tradeFigure 5.11. A similar trend is observed in the freight export trade to Turkey.
An estimated 700 Turkish haulage firms operate in the EU market. Between them they have 53,000 vehicles
(21,000 tractors, 2,000 lorries and 30,000 semitrailers). Almost two thirds of the Turkey international road
freight fleet meets the Euro V standard. This is partly a consequence of alignment with EU legislation and
partly driven by the bonus granted within the ECMT license system, which awards additional travel permits
based on the environmental performance of the vehicles used. Seventy-nine per cent of the vehicles of the
first nine companies listed as per ECMT license distribution criteria are Euro V.
Available data suggest that vehicle operating costs for Turkish firms are similar to those of their EU12
competitors but their wage costs are lower. Diesel costs in Turkey are higher than those in most of the
comparator Member States but Turkish truck operators benefit from a tax concession (corresponding to
nearly half of the fuel price) when buying fuel before export trips from Turkey.
Turkey has made significant progress towards alignment with the EU acquis on road transport but there
are some gaps still to be filled Turkey has treaty-based relations with the EU initiated under the framework of an association regime
grounded on the Ankara Agreement that Turkey signed with the European Economic Community (EEC) in
1963. The Agreement envisaged a three-staged approach to establishing a customs union whilst declaring
Turkey’s right to full membership once the custom union was completed (as it was in 1995 when Decision No
1/951 of the EC-Turkey Association Council was adopted). Decision No 1/95 provided a stimulus to efforts to
align its domestic law with the EU acquis.
Turkey received ‘candidate country’ status in 1999. Accession negotiations were formally opened in 2005. A
Negotiation Framework Document was adopted with the purpose of determining the principles of EU-Turkey
negotiations, the rules of the negotiations as well as the negotiation chapters. Transport policy was one of
the chapters suspended in December 2006 by the European Commission after Turkey failed to fully
implement the Additional Protocol to the Association Agreement. A dialogue between Turkey and the
Commission started in December 2013 pending the reopening of that chapter. This acknowledges the efforts
Turkey has made to align its road transport legislation with that of the EU and to improve its administrative
and enforcement capacity.
The most important developments in the modernisation of Turkey’s road transport sector have been the
adoption of a framework law (Road Transport Law) and a by-law (Road Transport Regulation) on road
transport that came into force in 2003 and 2004 respectively. These aim to govern the Turkish road transport
sector in line with the corresponding EU standards and requirements. The Road Transport Regulation was
updated in 2009 to reflect the latest developments in EU legislation.
Improvements have been achieved in implementation of the digital tachograph system. Measures to
regulate work and rest periods, driver training and roadside technical checks on commercial vehicles have
also been implemented though there is not yet complete alignment in all areas. An important step was taken
towards closing the gap between Turkish and EU law on driving licences in 2013 when Turkey become a
party of the Convention on Road Traffic2 (the ‘Vienna Convention’).
1 Decision No 1/95 of the EC-Turkey Association Council of 22 December 1995 on implementing the final phase of the Customs
Union. 2 The Convention on Road Traffic, of 1968, also known as the Vienna Convention on Road Traffic, as it was concluded in
Vienna in 1968, regulates all facets of driving behaviour, such as speed and distance between vehicles, intersections and obligation to give way. Moreover, it details the technical conditions for the admission of vehicles to international traffic and provides models for domestic and international driving permits.

Study on the economic impact of an agreement between the EU and the republic of Turkey
Page v
This study compared a business-as-usual baseline scenario with a set of liberalisation scenarios
representing removal or reform of existing quota and permitting arrangements The liberalisation scenarios examined in this study were defined according to the regulatory requirements
removed. The principal requirements of interest to this study are: permits granted on the basis of bilateral
agreements concluded to facilitate exchanges between couples of countries; and permits granted on the
basis of bilateral agreements concluded to enable transit on the territory of a country for trade relations
among another partner country and a third country. Another variable of interest that is the contracting party,
i.e. who is entitled to negotiate quotas. As an example, the EU may be given legal ownership of the
negotiation process and replace Member States in the agreement of quotas with external contracting
partners. This may in itself have liberalisation effects, e.g. if it changes the number and distribution of quotas.
The scenarios tested are shown in Table EX.1. Differences in trade, output and employment in 2016 were
modelled using a combination of: (i) an econometric gravity model for the estimation of future trade and
transport flows; (ii) an elasticity-based estimation of the response of trade flows to trade cost changes; and
(iii) input-output analysis which allows the study of economy-wide and sector-specific consequences of the
liberalisation scenarios. Although the modelling approach taken suggests that the changes in volume occur
immediately after the deregulation, in practice it would take a number of years for the market to adjust. In the
business as usual scenario the projected number of trips conducted in 2016 by EU and Turkish hauliers
importing goods into the EU is up 13% on 2012, at 470,000, up 13% on 2012.
Table EX.1 Definition of liberalisation scenarios
Nr Scenario Name Bilateral
permits
Transit
permits
EU permits /
licenses
EU agreements
1 Business as usual
no change to
baseline
no change to
baseline none none
2a Transit liberalisation
Agreement
adaptation removal none
Not required, but transit
liberalisation needs a
decision of individual
Member States
2b
Transit liberalisation +
additional EU permits
Agreement
adaptation removal
add according to
real needs yes
3 EU management of quotas removal removal
bilateral EU
permits yes
4 Full liberalisation removal removal not necessary not necessary
For all liberalisation scenarios it is assumed that there would be clauses committing the external partner and
EU to fair and consistent interpretation and administration of the rules, and a mechanism to deal with reports
of deviation from that practice. The aim of this would be eliminate the problems reportedly experienced by
some EU hauliers with ad hoc inspections and requirements being imposed at a local level by officials in
Turkey. The removal of the tax concession available to Turkish hauliers to offset diesel fuel costs is not
modelled.
The changes associated with the four scenarios, as compared to that baseline, are summarised in Table
EX.2. The modelling suggests that all four liberalisation scenarios are associated with positive impacts on
trade, output and employment for both the EU and Turkey.
The analysis suggests that full liberalisation would increase the value of EU-Turkey trade by an estimated
€3.5 billion, out of which €1.9 billion are additional imports from Turkey and €1.6 billion are exports to
Turkey. The largest expected effect is a rise in imports from Turkey into Germany, France, the Netherlands,

Study on the economic impact of an agreement between the EU and the republic of Turkey
Page vi
and the UK as the reduction of transport costs in central Europe makes Turkish goods more competitive.
Trade with EU Member States that are close neighbours of Turkey also increases, but not by as much in
relative terms. Removal of the transit quota system generates more than 90% of the benefits seen under full
liberalisation. This signals the opportunity cost of current transit permit arrangements. The other scenarios
deliver impacts that lie between those of transit and full liberalisation.
The macroeconomic effects on the EU economy of full liberalisation are too small to measure. They are
more significant for Turkey, with an increase in GDP estimated at 0.15%. The modelling also suggests that
EU consumers would enjoy some savings from liberalisation (as a result of lower prices) of around €145
million per year.
The employment effect in the Turkish economy is estimated to be in the order of 25,000 new jobs (0.1%).
The EU is projected to see an additional 14,000 jobs over and above the business as usual scenario.
Liberalisation expands the total size of the road haulage market between the EU and Turkey. Hauliers from
the EU12 are expected to be better placed to compete for this additional business than firms from the EU15
due to their more competitive cost structure. However, Turkish hauliers, which already have a large share of
the EU-Ukraine market, would be expected to carry a significant fraction of the additional traffic. Any
agreement to liberalise current quota arrangements should include terms that provide assurance that EU
hauliers will not be subject to interference when they conduct legitimate trade, and that controls will be
applied according to the law. This should address the problems that EU hauliers report with ad hoc
inspections and inconsistent interpretation of the law.
Liberalisation would benefit EU firms looking to source inputs and products from Turkey, and those selling
into the Turkish market. Of the €2.3 billion of additional output projected for the Turkish economy, an
estimate of €0.15 billion relates to EU-majority owned firms, mainly in the textiles, chemicals and machinery
industries.
Negative impacts of liberalisation are an increase in road traffic and associated environmental impact. In the
full liberalisation scenario an additional 40,000 road trips are forecast, resulting in increased carbon
emissions is estimated at over 60kt CO2e.
Table EX.2 Summary of liberalisation scenarios for Turkey
Liberalisation of freight transport between EU and Turkey
Transit liberalisa
-tion Additional
quotas EU manage-
ment
Full liberalisa-
tion
Effects on the EU, change with respect to
BAU:
EU road exports to Turkey, mln € 1466 1566 1566 1566
change in % 4.6% 4.6% 4.6% 4.9%
EU road imports from Turkey, mln € 1781 1841 1841 1894
change in % 7.4% 7.7% 7.7% 7.9%
Employment, thousand new jobs 13.2 14.1 14.1 14.1
Direct consumer cost savings, mln € 136 143 143 143
Selected effects in Turkey:
Output expansion, mln € 2122 2193 2193 2257
change in % 0.20% 0.20% 0.20% 0.21%
Extra output of EU-majority owned firms, mln € 148 153 153 158
Employment effect, thousand new jobs 23.4 24.2 24.2 24.9
GDP effect, % 0.14% 0.15% 0.15% 0.15%
Additional GHG emissions, Gg CO2 eq./yr 61 64 64 67

Study on the economic impact of an agreement between the EU and the republic of Turkey
Page 1
1 Introduction
1.1 Study objectives
The purpose of this study was to identify and quantify the impacts expected from liberalisation of
market access for road freight transport services arising from agreements that might be negotiated
between the EU and Turkey. This report provides an assessment of the prospective economic impacts
of such agreements based on appraisal of a number of carefully specified scenarios. It contains a
comparative analysis of key aspects of the road freight sector in the EU and Turkey, the market and
trade flows and other contextual factors. The study was produced under a contract between the
European Commission (DG MOVE) and ICF International. The work was conducted by a team drawn
from ICF International, TRT and DIW Econ.
1.2 Structure of the report
The report is structured into sections that provide:
• A description of the bilateral agreements that apply to road freight services between the EU and
Turkey and the ITF quota system
• A profile of the EU’s overall trade with Turkey and that fraction which is carried by road
• A comparative assessment of the international road freight sectors in the EU and Turkey
• Details of the regulatory framework governing road freight transport in Turkey and its alignment to
the EU road transport acquis;
• A description of the liberalisation scenarios that have been evaluated;
• The expected quantitative and qualitative impacts of the scenarios.
• Conclusions on the analysis.
The report starts, in the sub-section below, with an introductory discussion of the context – the
importance and structure of EU-Turkey trade, the role of road freight and how the operation of EU-
Turkey road freight market is currently influenced by regulation and regulatory practices.
1.3 Market and regulatory context
Turkey is a significant trading partner for the EU. Fuelled in part by EU investment in Turkey, the EU’s
exports to and imports from the country have increased rapidly since 1995. Trade volumes fell after
the 2007 economic crisis but have since recovered (Figure 1.1). Turkey’s trading relations have been
strengthening across the EU, not just with its immediate neighbours and the Mediterranean economies
with which it has traditional links. The structure of this trade is explained in more detail in section 3.

Study on the economic impact of an agreement between the EU and the republic of Turkey
Page 2
Figure 1.1 EU exports to, and imports from Turkey (US$ millions)
Source: World Bank (2014), Evaluation of the EU-TURKEY Customs Union (IMF Direction of Trade Statistics); for years 2012-
2013: UND data, Turkish interchanges with EU28.
In tonnage terms 20%-25% of the EU’s imports from Turkey and 10%-15% of exports to Turkey are
carried by road (Table 1.1). These goods constitute, however, nearly half of the EU-Turkey import-
export trade when measured by value (Figure 1.2). Details of the structure of road freight trade are
provided in section 4.
The efficiency of road transport services is an important enabler of growth in commerce between the
EU and Turkey. The development of the road freight sector over this period, in both the EU and
Turkey, has supported trade growth. The sector has demonstrated a capacity to adapt to changing
regulatory requirements and, on occasion, to find way to mitigate the constraints that they can impose
on operations (e.g. bypassing transit countries and their permit requirements by use of ro-ro ferry
services that carry trucks deeper into the EU). Section 5 gives a comparative analysis of the structure
and costs of the EU and Turkish road haulage industries.
Table 1.1 EU-Turkey trade by mode of transport (‘000 tonnes)
EU-27’s IMPORTS from Turkey EU-27’s EXPORTS to Turkey
2008 2009 2010 2011 2012 2013 2008 2009 2010 2011 2012 2013
Road 5,146 4,734 5,099 5,248 5,271 5,334 4,873 4,261 5,190 5,617 5,614 5,661
Rail 326 226 314 375 262 277 1,369 1,180 1,361 1,130 1,217 1,253
Sea 20,522 16,170 17,508 18,740 15,755 17,445 25,533 26,514 32,316 34,211 38,283 38,890
Air 39 35 45 49 58 52 70 83 86 88 83 83
Unknown 333 277 86 143 190 330 3 11 60 1 0 0
Fixed Installations 416 599 577 656 592 564 0 0 0 0 0 0
Total 26,782 22,042 23,631 25,211 22,128 24,002 31,848 32,050 39,014 41,047 45,197 45,887
Road share (%) 19% 21% 22% 21% 24% 22% 15% 13% 13% 14% 12% 12%
Source: EUROSTAT data (EXTRA EU27 Trade by Mode of Transport)

Study on the economic impact of an agreement between the EU and the republic of Turkey
Page 3
Figure 1.2 Road’s share of the import trade from Turkey (measured by value) has grown while its
share of export trade has declined
Share of EU exports/imports with Turkey that is carried by road, by value
Source: TRT elaboration on EUROSTAT data (EXTRA EU27 Trade by Mode of Transport)
Growth in trade was facilitated by the Ankara Agreement3 that Turkey signed with the European
Economic Community (EEC) in 1963 and its subsequent extensions / modifications, and the customs
union which was completed in 1995 (Decision No 1/954). By agreeing to enter the customs union,
Turkey took a large step towards integration with the EU.
Projections suggest future increases in trade in the years ahead. The IMF expects exports to grow at
an average of more than 5% from 2013 to 2017, while import growth is forecast to exceed 9.5% during
the same period (Figure 1.3).
Figure 1.3 Turkey’s import growth is expected to outpace export expansion over the next 5 years
Forecast growth of imports & exports, Turkey, 2011- 2018
Source: Investment Support and Promotion Agency of Turkey, IMF5
3 Agreement Establishing an Association Between the European Economic Community and Turkey (Signed at Ankara, 1
September 1963). 4 Decision No 1/95 of the EC-Turkey Association Council of 22 December 1995 on implementing the final phase of the
Customs Union. 5 Valuation of exports are based on free on board (FOB), valuation of imports are based on cost, insurance, freight (CIF).
a: actual f: forecast
-5%
0%
5%
10%
15%
20%
2011a 2012a 2013f 2014f 2015f 2016f 2017f 2018f
Imports Exports

Study on the economic impact of an agreement between the EU and the republic of Turkey
Page 4
Road transport services operating between EU Member States and Turkey are regulated by bilateral
intergovernmental agreements signed by individual Member States. These agreements set the
conditions under which transport services can be operated and, in particular, establish the number and
nature of the permits that are required to perform a transport operation between EU Member States
and Turkey. The permit system imposes operational constraints on operators and an administrative
burden for both contracting countries. The permits are usually administered by the relevant ministry for
transport, and are issued on a regular basis, according to specific requirements. The additional costs
associated with these arrangements will be reflected in the price of final goods supplied to the market.
The routes that connect Turkey to its most important trading partners in the EU (Germany, Italy,
France, United Kingdom, Spain) require road freight operators to pass through the territory of third
countries (mostly other EU Member States). This transit traffic is most concentrated in Greece and
Bulgaria but extends into Slovenia, Austria, Hungary, Poland, Czech Republic, and other Member
States. It is also subject to regulation and permits.
There are significant differences among the agreements signed by Member States with Turkey. Some
agreements provide different classes of permit for transit trade and bilateral trade, others do not.
Permits can be specific to the vehicle type (e.g. according to Euro emissions class of the vehicle
used). In some cases requirements, e.g. for a haulier in transit to buy a special permit, are imposed
on Turkish operators but not those of other third countries (e.g. Iran, Serbia). At the same time, EU
hauliers operating in Turkey can be subject to additional checks and controls. Table 1.2 lists the
principal issues identified during the research for this study.

Study on the economic impact of an agreement between the EU and the republic of Turkey
Page 5
Table 1.2 There are permit-related and operational constraints to road transport between Turkey
and EU
Number of permits and
practical issues
EU hauliers have access to a sufficient supply of Turkish permits,
though they often have to use one permit to enter in Turkey with an
empty vehicle (in general permits are required only for laden
vehicles) and in some cases spend two permits instead of one to
accelerate bureaucratic procedures to leave Turkey.
Representatives of EU hauliers report the application of ad hoc
controls (e.g. on the origin and destination of route based on the
invoice heading) when entering Turkey. These result in unscheduled
increases in waiting times, and in some case in high penalties.
For Turkish hauliers the principal issue is that demand for transit
permits exceeds the supply provided by some Member States (Italy,
Austria, Hungary, Slovenia, and Romania).
Turkish hauliers also complain about deficit of bilateral permits for
certain Member States (e.g. France, Spain).
The supply number of permits (including both bilateral and transit
permits) has been kept nearly stable, rather than growing in line with
trade flows.
Payable permits EU hauliers do not have payable permits, since these are allowed
only for transit operations.
Once the stock of free transit permits for Turkish operators is
exhausted, certain Member States (e.g. Romania, Greece. Hungary,
Bulgaria), grant transit permits in return for payment of a fee. This
imposes additional costs on the Turkish operators affected.
Needs of detour or modal
shift
To avoid permit restriction Turkish operators may find alternative
routes by, for example:
- Using ro-ro services operating between southern / western
Turkish ports and Trieste in Italy and Toulon in France.
These avoid transit through countries that impose particular
constraints.
- Making detours, such as trips from Turkey to France that
bypass Italy by taking a northern route.
Such alternatives usually imply additional costs due to longer
distance, time and charges for the use of the other modes (ro-ro or
rail).

Study on the economic impact of an agreement between the EU and the republic of Turkey
Page 6
2 Bilateral agreements and the ITF multilateral quota system
Within the EU international transport operations are fully liberalised. There are harmonised common
rules that provide open market access in international road transport between EU Member States and
limited market access for domestic operations performed by non-residents (cabotage). By contrast,
road transport services operating between EU Member States and third countries are mostly based on
bilateral intergovernmental agreements signed by individual Member States and those third countries.
2.1 The role of the EU in regulating road freight services with third countries
The Lisbon Treaty provides a role for the EU in agreements with third counties (Box 2.1) but to date
international road transport has been, almost exclusively, the responsibility of Member States. To
date, the EU has been mandated to conclude an international agreement with Switzerland which,
since 2002, has liberalised its commercial road transport market (both passenger and freight). Other
examples are the Stabilisation and Association Agreements concluded with the Western Balkans
countries i.e. Albania, Bosnia and Herzegovina, the former Yugoslav Republic of Macedonia,
Montenegro and Serbia including Kosovo (see Box 2.2).
Box 2.1: The Lisbon Treaty defines the EU’s competence to conclude international agreements
with third countries in the field of transport
Following the provisions laid down in Article 207(5) of the Treaty on the Functioning of the EU,
the EU has an external competence to negotiate and conclude international agreements in the
area of transport. However, this competence is not exclusive but has to be shared with the
Member States. The EU needs to be authorised and empowered by the Member States
(through the Council).
Nevertheless, the jurisprudence set by the European Court of Justice (ECJ) has established the
doctrine of implied competences in the ground-breaking AETR case6 where it has recognised
that, when an internal competence (for example in the area of transport) is exercised with the
purpose of achieving a community objective (the common transport policy) and when the
Union’s participation in the international agreement is necessary for the attainment of one of the
objectives laid down by the Treaty, the EU has also the power to extend this competence
externally and, therefore, has the power to conclude an international agreement.
Three decades later in the Open Skies case, the ECJ has further clarified that the AETR
principle also applies in the case a conflict between the provision of an international agreement
and the internal EU legislation is absent. The Court has stated that the EU has exclusive
competence where the international commitments fall within the scope of common rules or the
area covered by such rules. In such a case a Member State cannot enter into international
commitments even if there is no contradiction between those commitments and the EU common
rules7.
6 Case 22/70 Commission v. Council (AETR) [1971] ECR 263, 275. Cited in Weibel, 2014, pp. 4-5.
7 Case C‐466/98 Commission v. United Kingdom [2002] ECR‐9427. Cited in Weibel, 2014, pp. 4-5.

Study on the economic impact of an agreement between the EU and the republic of Turkey
Page 7
Box 2.2: The EU has signed a bilateral road transport agreement with Switzerland and
Stabilisation and Association Agreements with the Western Balkan countries
The first example of an international bilateral agreement signed by the EU with third countries is
the bilateral road transport agreement concluded in 2002 with Switzerland. This accord was
agreed after a long, complex negotiating process that had reflected not only the specific
characteristics of the inland transport market (the agreement covers both the road and rail
sectors), but also the distinctive characteristics of transit transport across the Alps. The
Agreement was intended to deliver a gradual and mutual opening of markets in rail and road
transport, along with the promotion of rail freight transport and the speeding up of customs
formalities.
The core provisions of the agreement are the commitment made by Switzerland to increase the
maximum permissible weight of truck loads from 28 to 40 tonnes, and the recognition by the EU
of the legality of a non-discriminatory tax on heavy goods vehicles. The purpose of the Swiss
tax was to encourage and increase the use of rail freight in general and, in particular, for freight
transit across its territory.
The agreement liberalizes the road transport market between the EU and Switzerland and
opens up the market for transport between EU Member States ("grand cabotage") to Swiss
carriers. It also provides for the mutual recognition of the licences needed to gain admission to
the occupation, a general harmonization of technical standards, and coordination of transport
policies, in particular where combined rail-road transport is concerned (WTO, 2010).
A second example of international agreement signed by the EU with third countries is
represented by the Stabilisation and Association Agreement concluded with the Western Balkan
countries. This Agreement constitutes the framework of relations between the European Union
and the Western Balkan countries for implementation of the Stabilisation and Association
Process, establishing a free trade area between the EU and the country concerned and
identifying common political and economic objectives and encourage regional co-operation. In
the context of accession to the European Union, the agreement serves as the basis for
implementation of the accession process.
The transport sector is governed by Chapter III (“Supply of Services”) of each individual SAA
signed by the EU and its Western Balkan partners. Specifically, Chapter III makes a reference
to a dedicated protocol8 on land transport that sets down the rules applicable to the relationship
between the signatory parties with the purpose of mutually ensuring unrestricted road transit
traffic. The protocols also require the effective application of the principle of non-discrimination
and the progressive harmonisation of the transport legislation of each Balkan country with the
corresponding EU acquis. The Stabilisation and Association Council is the competent body that,
as part of the overall progress in the achievement of the objectives set by Chapter III, examines
ways of creating the conditions necessary for improving freedom to provide air and inland
transport services.
8 With the exception of FYROM Macedonia, protocols on land transport are contained in the SAAs signed between the
European Communities, on the one part, and Albania, Bosnia and Herzegovina, Montenegro and Serbia, on the other part. Protocols are, therefore, applicable as follows: for Albania, Protocol 5 on Land Transport (Article 59 of the bilateral SAA signed with the European Communities); for Bosnia and Herzegovina, Protocol 3 on Land Transport (Article 59 of the bilateral SAA signed with the European Communities); for Serbia, Protocol 4 on Land Transport (Article 61 of the bilateral SAA signed with the European Communities); for Montenegro, Protocol 4 on Land Transport (Article 61 of the bilateral SAA signed with the European Communities).

Study on the economic impact of an agreement between the EU and the republic of Turkey
Page 8
2.2 Bilateral agreements between EU Member States and Turkey
Bilateral agreements vary in scope and depth9. The regulatory regime they set up is usually an
indicator of the degree of openness and the economic ties between the signatory countries. This may
not apply where the signatory parties are geographical distant consequently. The negotiation and
conclusion of road transport bilateral agreements is motivated by a variety of political and economic
factors. The absence of either full market liberalisation or effective multilateral agreements in this
domain make bilateral agreements between countries the primary legal instrument for international
road transport services.
With the exception of Cyprus, Ireland and Malta, all EU Member States have concluded bilateral road
transport agreements with Turkey (see Appendix C). All these bilateral agreements allow vehicles
registered in the territory of contracting parties to transit the territory of both parties. A different
reasoning applies, conversely, to permits involving third countries, which must be explicitly granted.
2.3 Bilateral quotas
A feature of the bilateral agreements on road freight services is the application of a system of quotas.
These authorise hauliers of the signatory parties to conduct bilateral, transit or third-country transport
operations, as long as they hold a permit for the country with which the bilateral accord has been
concluded. Therefore, these bilateral agreements divide, on a reciprocity basis, the traffic between the
two signatory parties to the exclusion of all others (with the marginal exception of "third country"
quotas). The number of permits is usually set on an annual basis.
There are five general types of permit:
• bilateral transport permits, which grant the right to carry goods from one signatory country and vice
versa;
• transit permits, which grant the right to carry goods in transit through the territory of the country
specified in the permit;
• bilateral and transit permits, which are a combination of the two permits above;
• third country permits, which grant the right to carry goods from the country indicated on the permit
to any third country or vice versa; this type of permit is also termed “triangular transport”; and
• universal permits, which are a combination of all the permits cited above.
In addition to these general categories of permits, specific types of bilateral permits can also be
issued. There are, for example, multi-conventional (or multi-entry) permits that are delivered annually
and that are limited to 5 vehicles per permit. Other specific permits can be granted for empty entrance
or return load. Unless otherwise provided for in a bilateral agreement, payable transit permits can also
be issued in addition.
Some Member States have both free and payable transit permits. Charges for these payable transit
permits are completely independent of the road use charges. The transit permit charges collected from
Turkish trucks in selected countries are shown in Table 2.1.
9 World Bank (2013). Quantitative Analysis of Road Transport Agreements (QuARTA). Washington.

Study on the economic impact of an agreement between the EU and the republic of Turkey
Page 9
Table 2.1 Estimated transit payable permit charge for selected countries
Country Transit Permit Charge (Round Trip)
Greece 100 € (transit); 25 € (bilateral)
Bulgaria 86 €
Romania 236 €
Hungary 436 €
Source: UND data and World Bank (2014)10
.
As a general rule permits are exchanged on a reciprocal basis. It means that the quantities of permits
for country A trucks to carry goods to country B and vice versa are comparable.
According to the available information, EU truck operators have access to enough permits to carry
goods to and from Turkey for the permit supply not to be a constraint to market access. For the EU15
in particular this situation arises from the differences in the cost competitiveness of Turkish as
compared to EU hauliers. Shippers and forwarders from the EU15 tend to use haulage services from
Turkey to take advantage of their lower charges. This is demonstrated quantitatively by the respective
market shares (see Figure 5.11 and Figure 5.13). As explained below, the road traffic between EU15
and Turkey can be seen as a market where, in case of liberalisation, EU12 operators can viably
compete with Turkish hauliers.
Given the permits surplus, EU15 countries have not been keen to issue additional permits. This has
resulted in the overall number of permits issued changing little over recent years.
The situation is different for EU12 operators. These are more competitive with Turkey hauliers. They
have other issues to consider and face various type of obstacles while entering the Turkish market.
Consultations with representative organisations for hauliers based in Romania11
, Poland12
and
Bulgaria13
suggest that the current permitting arrangements create operational problems for EU
operators in Turkey14
. Their complaints relate less to the availability of permits than to the
interpretation of regulations at a local level, with anecdotal reports of Turkish authorities:
• asking for permits also for vehicles below 3.5 tonnes maximum permitted weight (i.e. vehicles that
are out of scope of the bilateral permitting arrangements);
• asking for a third country permit, instead of the bilateral permit, according to the origin of invoice,
rather than the place of production or loading;
• not recognising permits or considering them as false or already used and thus forcing to use an
additional permit in order to speed up the procedures required to leave Turkey with a laden truck
(a practice that decreases the effective supply of usable permits).
Empirical data on the frequency of such problems have not been located.
In 2013 a total of 961,087 permits of all types (including third country) were issued to Turkish road
transport companies by the 25 EU Member States with which Turkey has bilateral road transport
agreements. Bilateral and transit permits account for the largest share (42% and 31% respectively),
while the combined bilateral and transit permits together make up 12% of all permits granted. Three
EU countries (Greece, Hungary and Romania) issue payable permits. Lastly, third country permits
account for 2% of the totality of permits of all types issued.
10
World Bank (2014). Evaluation of the EU-Turkey Customs Union. Washington. 11
Interviews to the National Association of hauliers in Romania (UNTRR). 12
Interview to the National Association of hauliers in Poland (ZMPD). 13
Interview to the National Association of hauliers in Bulgaria (AEBTRI). 14
This problems have been reported mostly by EU12, but generally apply to all EU operators.

Study on the economic impact of an agreement between the EU and the republic of Turkey
Page 10
As shown in Figure 2.1, Bulgaria and Germany account for the largest proportions of permits of all
types granted, with 31.3% and 17.7% respectively (Table 2.1). They are followed by Croatia (6.4%),
Romania (6.1%), Greece (5.7%) and Italy (5.2%). As a general case, the Member States granting the
largest number of permits of all types today are those which were the earliest to agree bilateral
accords with Turkey (Bulgaria, Germany, Hungary, Romania, and Italy).
Figure 2.1: Bulgaria and Germany grant the largest number of permits (all types) to Turkish hauliers
Distribution of permits granted by Member States to Turkey
`
Source: Compiled by the authors based on UND and Turkish Transport Ministry data
Over the last five years (2009-2013) the allocation of bilateral permits granted by this ‘top six’ group of
Member States remained broadly unchanged (Table 2.2), though Romania’s allocation increased by
20% in 2011 as compared to 2010 with a further increase by 3% in 2012. The allocation from Croatia
rose by 8% in the 2009-2010 period.
Table 2.2 Bilateral permits granted to Turkey by selected EU Member States over the period 2009-
2013
Year
EU Member States
Bulgaria Germany Croatia Romania Greece Italy
2009 293,000 167,550 56,757 48,000 55,000 49,211
2010 298,000 167,550 61,500 48,000 53,000 48,554
Change ’09-‘10 0% 0% +8% 0% -4% -1%
2011 298,500 170,050 61,500 57,500 55,000 48,794
Change ’10-’11 0% +1% 0% +20% +4% 0%
2012 300,600 170,050 61,500 59,000 55,000 49,535
Change ’11-’12 +1% 0% 0% +3% 0% +2%
2013 300,600 170,050 61,500 59,000 55,000 49,530
Change ’12-’13 0% 0% 0% 0% 0% 0%
Source: Compiled by the authors based on UND data
Bulgaria; 31,3%
Germany; 17,7%Croatia; 6,4%Romania; 6,1%
Greece; 5,7%
Italy; 5,2%
Rest of the EU; 27,6%
Study on the economic impact of an agreement between the EU and the republic of Turkey
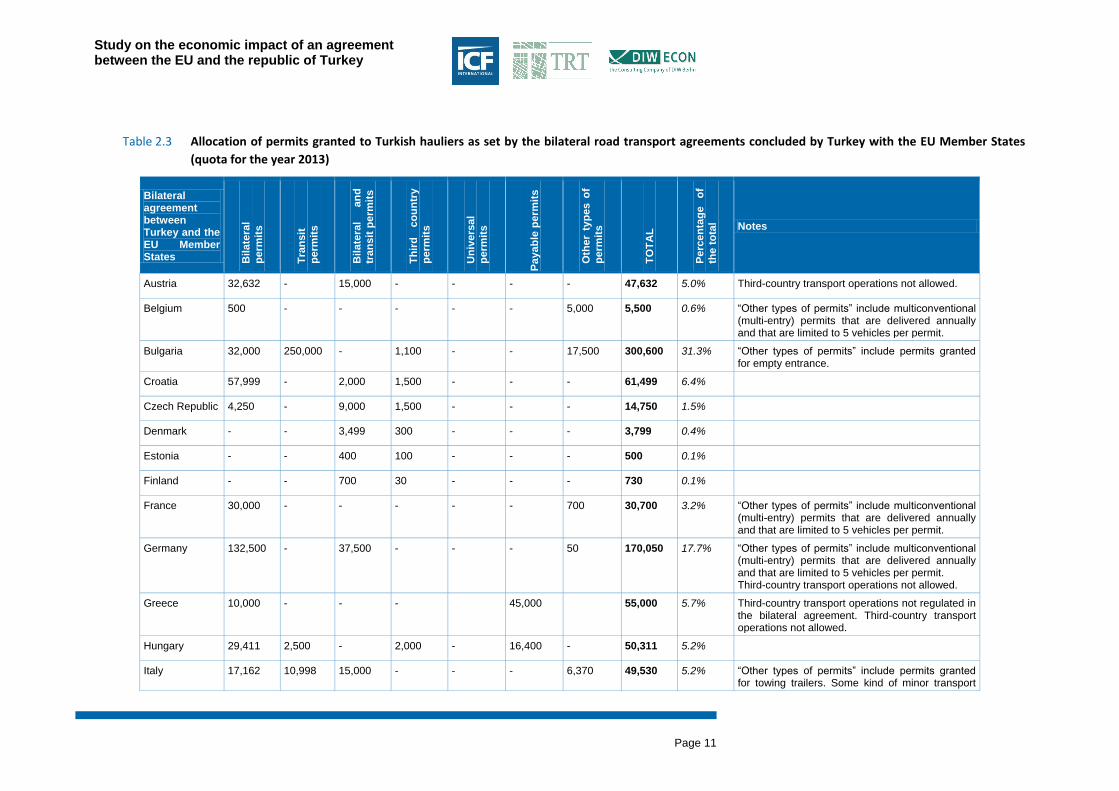
Page 11
Table 2.3 Allocation of permits granted to Turkish hauliers as set by the bilateral road transport agreements concluded by Turkey with the EU Member States
(quota for the year 2013)
Bilateral agreement between Turkey and the EU Member States B
ilate
ral
perm
its
Tra
nsit
perm
its
Bilate
ral
an
d
tran
sit
perm
its
Th
ird
co
un
try
perm
its
Un
ivers
al
perm
its
Paya
ble
perm
its
Oth
er
typ
es o
f
perm
its
TO
TA
L
Perc
en
tag
e
of
the t
ota
l Notes
Austria 32,632 - 15,000 - - - - 47,632 5.0% Third-country transport operations not allowed.
Belgium 500 - - - - - 5,000 5,500 0.6% “Other types of permits” include multiconventional (multi-entry) permits that are delivered annually and that are limited to 5 vehicles per permit.
Bulgaria 32,000 250,000 - 1,100 - - 17,500 300,600 31.3% “Other types of permits” include permits granted for empty entrance.
Croatia 57,999 - 2,000 1,500 - - - 61,499 6.4%
Czech Republic 4,250 - 9,000 1,500 - - - 14,750 1.5%
Denmark - - 3,499 300 - - - 3,799 0.4%
Estonia - - 400 100 - - - 500 0.1%
Finland - - 700 30 - - - 730 0.1%
France 30,000 - - - - - 700 30,700 3.2% “Other types of permits” include multiconventional (multi-entry) permits that are delivered annually and that are limited to 5 vehicles per permit.
Germany 132,500 - 37,500 - - - 50 170,050 17.7% “Other types of permits” include multiconventional (multi-entry) permits that are delivered annually and that are limited to 5 vehicles per permit. Third-country transport operations not allowed.
Greece 10,000 - - - 45,000 55,000 5.7% Third-country transport operations not regulated in the bilateral agreement. Third-country transport operations not allowed.
Hungary 29,411 2,500 - 2,000 - 16,400 - 50,311 5.2%
Italy 17,162 10,998 15,000 - - - 6,370 49,530 5.2% “Other types of permits” include permits granted for towing trailers. Some kind of minor transport

Study on the economic impact of an agreement between the EU and the republic of Turkey
Page 12
Bilateral agreement between Turkey and the EU Member States B
ilate
ral
perm
its
Tra
nsit
perm
its
Bilate
ral
an
d
tran
sit
perm
its
Th
ird
co
un
try
perm
its
Un
ivers
al
perm
its
Paya
ble
perm
its
Oth
er
typ
es o
f
perm
its
TO
TA
L
Perc
en
tag
e
of
the t
ota
l Notes
are liberalised. Third country transport operations not allowed.
Latvia - - 700 400 - - - 1,100 0.1%
Lithuania - - 800 125 - - 350 1,275 0.1% “Other types of permits” include permits granted for return load.
Luxembourg - - 800 - - - - 800 0.1% Empty entrance not allowed. Special permits are required if weight or dimensions of entering vehicles exceed the permissible upper limits. Third-country transport operations not allowed.
Netherlands - - 2,000 1,350 - - 3,500 6,850 0.7% “Other types of permits” include multiconventional (multi-entry) permits that are delivered annually and that are limited to 5 vehicles per permit.
Poland - 10,000 - 4,000 - - - 14,000 1.5%
Portugal - - 400 100 - - 25 525 0.1% “Other types of permits” include multiconventional (multi-entry) permits that are delivered annually and that are limited to 5 vehicles per permit. Quotas of permits are allocated to vehicles≥ EURO 1.
Romania 7,000 29,000 - - - 23,000 - 59,000 6.1% Third-country transport operations not allowed.
Slovakia - - 25,000 3,000 - - - 28,000 2.9%
Slovenia 42,338 - - 3,338 - - 45,676 4.8%
Spain 6,760 - 6,760 0.7% Third-country transport operations not allowed.
Sweden 6,000 - - 500 - - - 6,500 0.7%
United Kingdom - - - - - - - 0% Bilateral transport liberalised. Cabotage is not allowed. Third-country transport operations not allowed.
TOTAL 401,792 302,498 119,559 19,343 - 84,400 33,495 961,087 100%
Source: Compilation by the authors based on UND data (2014) and Acebo-Gomez & Pombo (2009)

Study on the economic impact of an agreement between the EU and the republic of Turkey
Page 13
Data on utilisation of permits can signal how the permit system is affecting trade between partners.
Analysis of the information collected for this study shows that:
• There was only instance of the supply of annual bilateral permits issued by the ‘top six’ Member
States being exhausted over the 2009-2013 period (for Germany, in 2010), in all other cases some
of the quota was available but not used15
;
• In case some cases there has been a sizeable surplus of permits in this group of Member States
(e.g. Bulgaria, where, averaged over 2009-2013, 44% of permits were unused).
• Among other Member States the picture is mixed:
‒ In some cases the annual quota of bilateral permits is almost fully used (e.g. on average only
0.13% of permits remain unused in Austria, 2% in France and 2% in Spain);
‒ In Romania the annual allocation of free transit permits was normally exhausted in the 2009-
2013 period but a large share of the payable permits were not used (43% in 2012 and 89% in
2013);
‒ In Hungary the proportion of unused permits has steadily increased over the last five years
(from 4.6% in 2009 to 54.7% in 2013), but transit permit were insufficient to cover demand.
2.4 The ITF multilateral quota system
Alongside the permits that are based on bilateral agreements, the International Transport Forum
(ITF16
) operates a multilateral quota system that provides multilateral licenses for the international
carriage of goods by road by transport undertakings established in a member country of the European
Conference of Ministers of Transport (ECMT). The licenses apply to carriage of goods between ECMT
Member countries or in transit through the territory of one or several ECMT Member country(ies). The
vehicles must be registered in an ECMT Member country.
These licences can be grouped into two principal categories:
• annual licenses, which are valid for one calendar year, and
• short-term licenses, which are only valid for 30 days.
Licences can be used by only one vehicle at a time. The country of loading can be different from the
country of origin of the goods loaded. An ECMT licence does not authorise cabotage.
The allocation of the quota among ECMT Member Countries is determined according to average
ranking of countries by ten criteria17
. The quota system incorporates promotion of better environmental
15
In 2009, for the selected EU Member States reported in Table 2.4, the average proportion of non used permits amounted at 20.6% (with Croatia and Bulgaria showing respectively the minimum (4%) and the maximum (39%) proportion of non used permits. For the ensuing years the average proportion of non used permits were as follows: 17.4%, 20%, 24.2% and lastly 25.4%. In this respect it is interesting to notice that since 2010 the share of non used permits has increased by 8% and that compared to other selected Member States Bulgaria has always showed the largest proportion of non used permits (respectively 40% in 2010, 44% in 2011 and 2012 and, finally, 52% in 2013). 16
The International Transport Forum evolved from the ECMT in 2006/7. At the time, ministers decided to invite new members from non-European countries in order to address transport issues on a global level and for all transport modes, and to create a public platform for a broad policy dialogue. 17
The ten criteria are: total freight transport by road (million tonne-kilometre); contribution to ECMT budget; gross domestic product; growth in gross domestic product; population; country area; percentage use of ECMT licences; use of TIR carnets in ECMT countries; trade in goods (billion USD); non intra-EU/EEA/CH trade. Data on the distribution of licences are provided in Appendix D.

Study on the economic impact of an agreement between the EU and the republic of Turkey
Page 14
performance through a bonus scheme18
. Annual quotas for Euro V Safe lorries account for 75% of all
quotas issued19
. As of 1 January 2014 4,258 annual licenses were issued to Turkish operators, of
which 3,740 (87%) are valid for EURO5 Safe lorries.
In consultations the representative organisations for hauliers based in Romania20
, Poland21
and
Bulgaria22
cited a number of problems with use of ECMT licences in Turkey. These relate to the
Turkish authorities:
• restricting the use of ECMT permits to trips requiring a minimum number of days. This is imposed
unilaterally and based also on the origin of invoice rather than the place of origin of the goods or
place of loading;
• restricting the use of ECMT permits by determining the country of origin of the transport operation
to be the country in which the invoice was issued rather than the place of loading as stated in the
CMR and TIR. If the country of loading is a ECMT member but the country from which the invoice
was issued is not an ECMT member then the authorities prohibit the use of an ECMT permit.
• Not taking into consideration multimodal transport operations, and instead asking for third country
permits also for goods arrived in the exporting country by rail, sea, air and transported by road to
Turkey.
Empirical data on the frequency of occurrence of such problems have not been located.
3 EU – Turkey trade: commodities and trends
Turkey is among the most important trading partners for the EU. According to DG TRADE (2012),
Turkey is the EU’s 7th most significant source of imports and 5th most significant export market.
Within Europe, Turkey is the EU’s main export partner after Switzerland, Russia and Norway.
Overall, the EU’s trade balance with Turkey is positive. EU exports to Turkey were worth €75.1 billion
in 2012, up 2.8% compared to 2011 and 69% since 2009. Imports from Turkey were worth €47.8
billion in 2012, up more than 30% over the same period. Figure 3.1 shows the trend for 2008-2012,
and illustrates the recovery in trade after the 2007-2008 economic crisis.
The distribution of this trade by Member State is shown in Figure 3.2. Germany, Italy, France, Spain
and the UK are the most significant exporters to Turkey and provide the largest EU markets for
Turkish goods (on a value basis). Most individual Member States run a trade surplus with Turkey; the
UK and Netherlands are the principal exceptions.
18
EURO3 safe lorry: Coefficient x2; EURO4 safe lorry: Coefficient x6; EURO5 safe lorry: Coefficient x10; EURO6 safe lorry: Coefficient x12. 19
See Figure D.1 in Appendix D. 20
Interviews to the National Association of hauliers in Romania (UNTRR). 21
Interview to the National Association of hauliers in Poland (ZMPD). 22
Interview to the National Association of hauliers in Bulgaria (AEBTRI).

Study on the economic impact of an agreement between the EU and the republic of Turkey
Page 15
Figure 3.1 The EU’s trade balance with Turkey is positive and increasing
Source: European Commission, DG TRADE
Figure 3.2 Germany and Italy had the largest positive trade balance with Turkey in 2013
EU Member States’ trade balance with Turkey in 2013 (Billion Euro)
Source: Adapted from TurkStat data
Commodity analysis Turkey is an important investment destination for EU companies. This has led to an increasing degree
of integration of Turkish affiliates in EU supply and production networks. In general EU subsidiary
companies are substantially larger and have a much higher propensity to participate in export markets
than domestic owned firms (World Bank, 2014). The three main sectors with a significant presence of

Study on the economic impact of an agreement between the EU and the republic of Turkey
Page 16
EU-majority owned firms are chemicals, chemical products and man-made fibres, motor vehicles, and
food products and beverages. These sectors are also prominent in the EU-Turkey import-export
trade, as illustrated by the charts below. EU imports from Turkey are concentrated in machinery and
various manufactured goods. Exports to Turkey are more differentiated, including chemicals and raw
materials.
Figure 3.3 EU’s exports to Turkey by commodity type
Transported goods by SITC classification; EU’s export to Turkey (Value, million euro)
Source: EUROSTAT data
Figure 3.4 EU imports from Turkey by commodity type
Transported goods by SITC classification; EU imports from Turkey (Value, million euro)
Source: EUROSTAT data

Study on the economic impact of an agreement between the EU and the republic of Turkey
Page 17
The composition of Turkey’s trade has changed over time. Exports of manufactured goods such as
vehicles and electronics have risen faster than exports from ‘traditional’ sectors such as textiles and
processed food products.
Turkey has been successful in building its automotive industry in recent years, attracting investment
from firms such as Toyota, Ford, Hyundai, MAN, Renault, Fiat, Mercedes and Isuzu. Turkey is the
largest bus manufacturer in Europe and expects to become the third largest auto manufacturer in
Europe by 2015. There has been growth in automotive parts manufacture as well as in vehicle
assembly.
After the automotive sector, the second largest export sector is iron and steel. Turkey is the 8th largest
crude steel producer in the world. It is the largest importer of scrap steel in the world; over 22 million
tonnes of scrap steel were imported in 2012.
Eurostat data showing the category of goods (by volume) confirm the importance of chemicals, food,
wood products, basic metals and machinery from in the EU’s exports to Turkey and food, textiles,
mechanical and machinery from Turkey to the EU.
A more detailed analysis of inbound and outbound flows would be helpful in understanding how much
of the foreign trade is linked to supply chains of EU owned firms. Though these data would not add
information on the potential for road transport. Much of EU-Turkey import-export trade is carried by
ship, especially raw materials and semi-finished products.
4 EU - Turkey road-based trade
Forty five per cent (by value) of Turkey’s trade with the EU in 2013 was carried by road. This share,
which has been relatively stable, is higher than road’s share of Turkey’s global trade (23% by value of
overall trade in 2013, down from 37% in 2000. In tonnes, the road share is 22% for imports and 12%
for exports. Turkey’s trade with other regions has been growing much faster than its trade with the
EU, in particular over the last 5 years. Figure 4.1 shows the trends in EU exports and imports to/from
Turkey in tonnage terms since 2008. Road freighted exports grew faster than imports (+15% in 5
years as compared to less than 5% over the same period) in tonnage terms.
Figure 4.1 Measured in tonnage terms, imports carried by road into the EU from Turkey have stalled
while the road freight export market from the EU to Turkey has been growing
Evolution of EU’s imports/exports by road from/to Turkey 2008-2013 (2008=100)
Source: EUROSTAT (calculated on a tonnage basis)

Study on the economic impact of an agreement between the EU and the republic of Turkey
Page 18
As would be expected from Figure 3.2, the balance of road freight trade varies across the Member
States. Germany, France and Italy export a higher volume of goods by road to Turkey than they
import. Bulgaria, Romania and Poland import more by road from Turkey than they export23
.
Ro-ro services have become established as an environmentally and economically efficient to road for
moving goods to and from Turkey24
. This type of service was originally developed by Turkish
operators and ship owners to bypass the troubles in the Western Balkans in the 1990s. Nowadays
these services are used to avoid transit through countries that impose limitations on Turkish hauliers,
such as restrictions on the number of transit permits (e.g. Hungary, Slovenia, and Romania).
The first ro-ro services ran between Turkey and Trieste in the North Adriatic sea but there are now
also services between Turkey and Toulon in the south of France (from Toulon the trailer and
semitrailers must be moved by French hauliers). These services are operated by Turkish ship owners
and are almost entirely used by Turkish truck operators. For the Italian service, the trailer or semitrailer
is stowed on the ferry in Turkey and the drivers and tractors pick up the load in the port of Trieste.
This system is now used by Turkish operators for more than 40% of the trips between the EU and
Turkey (Appendix E, Figure E.3 and Figure E.4).
Ro-ro’s share of EU-Turkey road traffic varies by Member State. As a general rule it is much higher for
trade with EU15, particularly with Italy, France, Spain and Portugal. Ro-ro services have facilitated
growth in trade in circumstances where permit quotas have been kept constant and are insufficient to
meet demand (e.g. Italy, France, and Spain).
The following charts present the ro-ro share of road freighted trade between EU MS and Turkey. For
important partners such as Germany, UK and Belgium, the ro-ro is part of a multimodal transport
implying a ro-ro stretch heading in Trieste/Toulon combined with road transport for the intra EU
portion.
Figure 4.2 Ro-ro’s share of trips from Turkey to EU by Turkish vehicles by EU Member (2013) 25
Source: UND data
23
This excludes goods carried on road vehicles using ro-ro shipping services. Charts illustrating the balance of bilateral road freight trade with Turkey for these countries are provided in Appendix E. 24
Rail has a small market share, though projects that aim to increase the rail freight traffic between the EU and Turkey are in progress. 25
Northern Cyprus is shown in the chart though only Turkey has commercial relationships with that jurisdiction. Conversely Turkey does not recognise the Republic of Cyprus.

Study on the economic impact of an agreement between the EU and the republic of Turkey
Page 19
Figure 4.3 Ro-ro’s share of trips from EU to Turkey by Turkish vehicles by EU Member (2013)
Source: UND data
An estimate of the scale of road freight traffic taking account of both road-only and ro-ro movements
has been made for this study and is shown in Table 4.2. The number of trips is derived from data
provided by the Turkish authorities. The tonnage estimates are based on an assumed load factor of
18 tonnes/vehicle. It suggests that road freighted imports from Turkey to the EU exceed exports in
tonnage terms.
Table 4.2 Estimation of total tonnes transported to/from EU-28 Member States by EU and Turkish
Vehicles, in two directions, ro-ro services included
Turkey - EU28 flows EU28 - Turkey flows
Trips
Year Turkish Vehicles EU Vehicles Total trips
Turkish Vehicles EU Vehicles Total trips
2010 296,691 126,297 422,988 248,751 96,553 345,304
2011 297,334 140,211 437,545 263,848 117,802 381,650
2012 297,648 138,023 435,671 267,325 110,726 378,051
2013 291,159 144,108 435,267 267,300 118,826 386,126
Tonnes transported (‘000) *
EU’s IMPORTS from Turkey EU’s EXPORTS to Turkey
Year By Turkish vehicles By EU Vehicles
Total EU’s Imports
By Turkish Vehicles By EU Vehicles
Total EU’s Exports
2010 5,340 2,273 7,614 4,478 1,738 6,215
2011 5,352 2,524 7,876 4,749 2,120 6,870
2012 5,358 2,484 7,842 4,812 1,993 6,805
2013 5,241 2,594 7,835 4,811 2,139 6,950
* 18 tonnes/truck has been assumed
Source: TRT analysis based on UND data
On the basis of trips data recorded, it is possible to provide an overview of the balance of trips and
trade (in tonnes) for major EU partners of Turkey. While Germany and Italy have a positive balance
(exports outmatching imports) towards Turkey, the other selected countries, including France show a
negative balance.
When these results are compared to data that exclude ro-ro trips (Figure E.2 in Appendix E), the major
difference in results is for France. On a road-alone basis France appears to be a net exporter; when
ro-ro is included it is a net importer. In the case of France, Turkish stakeholders consulted claim that
France issues too few bilateral permits and that there is also a deficit of transit permits available from
Italy. These factors explain why consideration of ro-ro is essential to any comprehensive and
complete analysis of EU – Turkey trade.

Study on the economic impact of an agreement between the EU and the republic of Turkey
Page 20
Figure 4.4 International road freight transport balance between Turkey and the main EU trading
partners (trips)
Source: TRT analysis of UND data
The balance of flows is confirmed by figures related to empty trips. Though not related specifically to
EU-Turkey trade, Turkish data record empty and laden vehicles at each border crossing per direction
(inbound and outbound Turkey). The figure below demonstrates that the rate of empty trips is higher
for foreign vehicles (mostly European) than for Turkish vehicles, and higher on average for vehicles
entering Turkey than vehicles leaving the country.

Study on the economic impact of an agreement between the EU and the republic of Turkey
Page 21
Table 4.3 Empty trucks account for a higher share of trucks coming into Turkey from Europe than of
those heading for Europe
Share of empty Turkish and foreign vehicles crossing the Turkish border en route to/from
whole Europe, including transit traffic
Source: UND data
Border crossings Turkey has three land border crossings with EU countries that are used by goods vehicles (with
Greece and Bulgaria). Data at border crossings were provided by Turkish institutions. Figure 4.5
shows the location and the flows of Turkish vehicles recorded at the road border crossings towards
EU , in Greece and Bulgaria
Figure 4.5 The busiest land border crossings for the road freight movements between the EU and
Turkey are on the Bulgaria-Turkey border
Truck movements between the EU and Turkey at land borders (2013)
Source: Authors’ analysis of UND data
2%
10%
3% 3% 3%
9%
2%
8%
4% 3% 3%
8%
0%
5%
10%
15%
20%
25%
30%
35%
TURKISH FOREIGN TURKISH FOREIGN TURKISH FOREIGN
Land Border Ro-Ro Border Total
From Turkey to EU
2012 2013
17%
28%
2%
31%
12%
28%
16%
25%
3%
32%
11%
26%
0%
5%
10%
15%
20%
25%
30%
35%
TURKISH FOREIGN TURKISH FOREIGN TURKISH FOREIGN
Land Border Ro-Ro Border Total
From EU to Turkey
2012 2013

Study on the economic impact of an agreement between the EU and the republic of Turkey
Page 22
Data on border crossing waiting times at the Bulgarian border suggest typical wait times of around
three hours. Trucks leaving Turkey to come into the EU tend to wait longer than those leaving the EU
to enter Turkey (Table 4.4)26
. Waiting times spiked upwards during recent disputes between Turkey
and Bulgaria due to roadside checks performed by Bulgarian and Turkish authorities.
Table 4.4 Estimated waiting times at border between Bulgaria and Turkey (hours)
Border crossing Outbound EU-Turkey (hours)
Inbound Turkey-EU (hours)
2007 2008 2009 2010 2011
2007 2008 2009 2010 2011
Bulgaria-Turkey
Kapitan Andreevo (BG)
Kapikule (TR)
1.1 1.3 1.7 2.8 3.0
3.3 3.5 3.3 3.3 3.1
Source: IRU’s BWTO
5 The road freight sector in the EU and Turkey
5.1 The EU international road freight sector
The road haulage market in the EU comprises around 600,000 predominantly small enterprises, with
an average size of four employees per company. This number has been stable over recent years.
Eighty per cent of companies have fewer than 10 employees; 99% have fewer than 50 employees27
.
The size distribution of firms varies by Member State (Figure 5.1). The distribution of employment
across these firms of different sizes also varies. For example 60% of sector employees in Poland work
in firms with between one and five employees; the equivalent figure in Austria is 10% (Figure 5.2).
In 2012 road transport in the EU 27 generated close to 1,700 billion tonne-km, 4% less than in 2004
and roughly 13% less than in the peak year of 2007. Of this, international operations account for
around one third (the rest being national transport)28
.
26
These data come from a database managed by the IRU. The database does not hold information about waiting times at the Ipsala and Hamzabeyli border crossings. 27
EC 2014, COM (2014) 222 final 28
idem

Study on the economic impact of an agreement between the EU and the republic of Turkey
Page 23
Figure 5.1 Eighty per cent of EU hauliers have fewer than ten employees
Number of road transport firms in EU countries per type of firm, 2011
Source: TRT analysis of Eurostat data
Figure 5.2 The concentration of employment in large (>50 employee) firms varies significantly across the
EU road haulage market
Number of employees in road transport firms in EU countries per type of firm, 2011
Source: TRT analysis of Eurostat data
For the EU as a whole, domestic transport accounts for two thirds of the road freight market.
International activities are a much more significant part of the market for the EU12 than the EU15
(Figure 5.3).
0%
10%
20%
30%
40%
50%
60%
70%
80%
90%
100%
Estonia Spain Italy Latvia Lithuania Austria Poland Slovenia Slovakia Finland
From 1 to 5 employees From 6 to 9 employees From 10 to 19 employees From 20 to 49 employees 50 employees or more
0%
10%
20%
30%
40%
50%
60%
70%
80%
90%
100%
Estonia Spain Italy Latvia Lithuania Austria Poland Slovenia Slovakia Finland
From 1 to 5 employees From 6 to 9 employees From 10 to 19 employees From 20 to 49 employees 50 employees or more

Study on the economic impact of an agreement between the EU and the republic of Turkey
Page 24
Figure 5.3 Non-domestic markets are more important to EU12 hauliers than their EU15 counterparts
Share of national and international transport activities of EU road operators (in %)
Source: European Parliament, 2013
Hauliers from the eastern Member States are cost competitive with EU15 hauliers where they are
allowed to compete. Transport within and between EU15 Member States are mainly carried out by
EU15 hauliers but movement of freight by road between EU15 and EU12 countries is carried out
almost exclusively by EU12 hauliers (Figure 5.4).
Figure 5.4 EU12 hauliers carry most of the road freight moved between the EU15 and EU12
International road freight transport activities between and within 15 “old” and 12 “new” EU
member states; by origin of HGV (2010, billion tkm)
Source: European Commission, 2011
Firms from the eastern Member States dominate international transport both in bilateral exports/import
activities29
(Figure 5.5) and in crosstrades30
(74% of which are carried out by hauliers from EU12
countries).31
The biggest share of EU crosstrades are carried out by hauliers from Poland (27%)
followed by those from the Czech Republic (10%), Slovakia (8%), Hungary and Lithuania (7% each)
(Figure 5.6).
29
Bilateral international transport regards the activities where either the loading or unloading activity takes place in the country where the vehicle is registered 30
Crosstrade refers to trading activities where loading and unloading take place in two different countries, neither of which is the country where the vehicle is registered. 31
International freight transport include bilateral, crosstrade and cabotage activities.
0%
10%
20%
30%
40%
50%
60%
70%
80%
EU27 EU15 EU12
67%
78%
34%32%
22%
66%
National transport activities International transport activities

Study on the economic impact of an agreement between the EU and the republic of Turkey
Page 25
Figure 5.5 EU12 hauliers have a larger share of their domestic intra-EU import/export trade than do
hauliers in the EU15
Share of home based vehicles in tonne-km generated in exports to and imports from other EU27
countries in 2010(%)
Source: European Commission, 2011
Figure 5.6 Polish hauliers handle more than a quarter of EU crosstrade
Origin of hauliers active in crosstrade in the EU in 2010 (based on tonne-km)
Source: European Commission, 2011
Note: data on small transport firms (1-5 employees) are not available for Latvia
Supported by those successes in the intra-EU market, the heavy truck fleet in the eastern EU has
grown significantly since 2002 while that in the western EU has shrunk (Figure 5.7).
PL, 27%
CZ, 10%
SK, 8%
HU, 7%LT, 7%
NL, 6%
DE, 5%
BG, 5%
SI, 5%
Others, 20%

Study on the economic impact of an agreement between the EU and the republic of Turkey
Page 26
Figure 5.7 The EU12 HGV fleet has been expanding while the EU15’s has shrunk
Index of the number of registered heavy lorries (over 10.0 tonnes) in EU 15 and EU12 countries,
2002 to 2012 (2002=100)
Source: TRT analysis of Eurostat data
The EU road freight fleet is relatively new. Across the EU as a whole, 43% of all vehicle-km are
registered by vehicles of less than 4 years, 22 % of vehicle-km by vehicles ranging from 4 to 6 years
and a further 22% by vehicles that are 6 to 10 years old. Vehicles that are more than 10 years old
account only for the 13% of total traffic. There is more use of older vehicles in the EU12 as compared
to the EU15. As an example, 24% of vehicle-km by hauliers from the EU12 are registered by trucks
that are more than 10 years old, as compared to just 10% in the EU15 (Figure 5.8).
Figure 5.8 On a vehicle-km basis EU12 hauliers are, in total, more reliant on older vehicles than their EU15
counterparts
Age distribution of HGV used by EU hauliers, 2010. Share in total vehicle-km
EU15 EU12
Source: European Commission, 2011
5.2 The Turkish international road freight sector
In Turkey, there are around 600,000 vehicles with a loading capacity over 3.5 tonnes used for
domestic and international goods transport. According to data provided by UND, as of March 2014,
the Turkish international road freight transport sector has 2,087 firms with a total fleet of 60,878 trucks,
15,149 lorries and 71,219 semi-trailers and around 500,000 persons employed. 34% of those
50
100
150
200
250
300
2002 2003 2004 2005 2006 2007 2008 2009 2010 2011 2012
EU 12
EU 15
<4 y46%
4 - 6 y23%
6 - 10 y21%
>10 y10%
<4 y
4 - 6 y
6 - 10 y
>10 y
<4 y32%
4 - 6 y20%
6 - 10 y24%
>10 y24%
<4 y
4 - 6 y
6 - 10 y
>10 y

Study on the economic impact of an agreement between the EU and the republic of Turkey
Page 27
companies (700 firms) operate in the EU market with 53,000 vehicles (21,000 tractors, 2,000 lorries
and 30,000 semitrailers).
The Turkish fleet has engines that meet Euro III, IV or V emission standards (Figure 5.9). This is partly
a consequence of alignment with EU legislation and partly driven by the bonus granted within the
ECMT license system, which awards additional travel permits based on the environmental
performance of the vehicles used. By illustration, 79% of the vehicles of the first nine companies listed
as per ECMT license distribution criteria are Euro V (Table E.7 in Appendix E).
Figure 5.9 Almost two thirds of the Turkey international road freight fleet meets the Euro V standard
Turkish international road freight fleet by vehicle motor type (2013)
Source: UND
There are 569 foreign capital companies established in Turkey operating in road transportation. They
represent 25% of the total companies operating in Turkey in the international road freight transport
sector (which includes hauliers, forwarders and agents).
Data on the concentration of the market have not been located, though some indication is provided by
the distribution of ECMT licenses. The 4,258 yearly permits available in 2014 were distributed to
around 750 different companies. 358 permits went to 10 enterprises, and 55 to just one firm.
5.3 Distribution of the EU – Turkey road freight market
EU hauliers have around a third of the road freight import trade (including ro-ro traffic) from Turkey
(Figure 5.10) though the average figure masks very substantial differences between the western and
eastern EU markets. In 2013 hauliers from the EU15 had only 13% of the Turkey import market for
those countries whereas hauliers from the EU13 carried almost two thirds of the imports to the EU13.
Overall, the share of road freight between EU and Turkey that is carried by EU vehicles has been
rising slowly in recent years as EU13 hauliers have gained an increasing share of the trade (Figure
5.11). A similar trend is observed in the freight export trade to Turkey.
33%7.077
4%888
63%13.765
Euro III
Euro IV
Euro V

Study on the economic impact of an agreement between the EU and the republic of Turkey
Page 28
Figure 5.10 EU hauliers are gradually winning a large share of the road freight import trade from Turkey
but account for only a third of trips
Market shares in EU28 imports from Turkey
Source: TRT analysis of UND data
Figure 5.11 Turkish hauliers carry most of the EU15’s road freight imports from Turkey but are less
successful in the EU13 market
Market shares in EU15 and EU13 imports from Turkey
EU15 EU13
Source: TRT elaboration on UND data
Figure 5.12 A large majority of the EU’s road exports to Turkey are carried by Turkish hauliers
Market shares in EU28 exports to Turkey
Source: TRT elaboration based on UND data

Study on the economic impact of an agreement between the EU and the republic of Turkey
Page 29
Figure 5.13 As with imports, Turkish hauliers manage most of the EU15’s road freight export market but
much less of the EU13 market
Market shares in EU15 and EU13 exports to Turkey
EU15 EU13
Source: TRT elaboration on UND data
5.4 Cost comparison of EU and Turkish road transport operators
This section compares the costs of Turkish road transport operators with those of hauliers from
selected EU countries. The EU countries used for this comparison are:
• those which are closest to Turkey borders and for which relevant data are available i.e. Hungary
and Romania; and
• Turkey’s major EU trading partner countries, i.e. Poland, Italy, Germany and France.
Cost data for the EU countries have been analysed at a higher level of disaggregation than for Turkey.
Diesel costs refer to 2014. All figures for Europe, with the exceptions of fuel costs, refer to 2010 while
all figures for Turkey refer to the current year. All costs strictly related to vehicle operation and
maintenance have been reported in €/km. Wage data refer to yearly compensation.
Vehicle related costs are similar to those charged in the selected eastern Member States (Hungary,
Poland and Romania), and lower than rates in the selected western Member States (Italy, Germany
and France). The taxes paid for vehicle are similar for almost all the countries considered with the
exceptions of Romania, where the value is very low (€0.002/km) (Table 5.1, Figure 5.14).
Table 5.1 Non-labour costs of Turkish hauliers are comparable to those of their EU competitors
Comparison of main costs of transport firms between EU countries and Turkey
Costs Value TR HU PL RO IT DE FR
Insurance €/km 0.047 0.031 0.043 0.023 0.091 0.067 0.078
Vehicle taxes €/km 0.009 0.012 0.009 0.002 0.008 0.024 0.008
Diesel cost* €/l 1.571 1.344 1.218 1.420 1.677 1.434 1.298
Maintenance -repairs
€/km 0.034 0.051 0.042 0.041 0.075 0.064 0.068
Wages €/yr 19,980 28,315 23,967 22,181 51,485 47,930 56,654
Source: Authors’ analysis on the basis of Ernst and Young, 2011, http://www.fuel-prices-europe.info/index.php?sort=4, UND.
"*": Diesel cost include VAT.

Study on the economic impact of an agreement between the EU and the republic of Turkey
Page 30
Figure 5.14 Hauliers from the EU15 comparator countries have higher insurance and maintenance costs
than those from Turkey and the EU12
Cost of transport firms in Turkey and in EU countries, €/km
Source: Authors’ analysis on the basis of Ernst and Young, 2011, UND.
Figure 5.15 Diesel costs at the pump in Turkey are higher than those of most comparator Member States
but a tax concession significantly reduces the effective cost of fuel for hauliers serving the
export market
Diesel costs in Turkey and in EU countries, €/l
Source: http://www.fuel-prices-europe.info/index.php?sort=4.
Diesel costs in Turkey are higher than those in most of the comparator Member States but, as a
measure to support the export, truck operators benefit from a tax concession (corresponding to nearly
half of the fuel price) when buying fuel at the border before export trips from Turkey. The average
price in this case is far lower than for the EU countries.
Truck driver salaries in Turkey are the lowest of the comparator group (€1,665 per month) but close to
level seen in Romania (€1,848) and Poland (€1,997). The differential between Turkish salaries and
those in some other EU states is much larger, e.g. Italy (€4,920), Germany (€3,994) and France
(€4,721).
0,047
0,031
0,043
0,023
0,091
0,067
0,078
0,009 0,012 0,0090,002
0,008
0,024
0,008
0,034
0,0510,042 0,041
0,075
0,0640,068
TR HU PL RO IT DE FR
Insurance Vehicle taxes Maintenance
1.571
1.3441.218
1.420
1.677
1.4341.298
TR HU PL RO IT DE FR

Study on the economic impact of an agreement between the EU and the republic of Turkey
Page 31
Turkish transport operators pay employer social contributions32
which (at 28%) are comparable to
those in Hungary and Romania, much lower than for example in France (46% of social contributions)
and Italy (39%). The lowest percentages of contributions are paid by employers in Poland (17%) (see
Figure 5.16).
Figure 5.16 Turkish hauliers’ non-wage labour costs are similar to those of their eastern EU counterparts
Level of wages and social contributions (%) paid by transport firms to drivers in Turkey and
relevant EU countries (Euro/year)
Source: Authors’ analysis based on Ernst and Young, 2011, UND.
Notes: Figures for EU refer to the year 2010 while figures for Turkey refer to the current year. In Romania the social
contributions vary from 20.8% to 30.8%; an average of 25.8% has been considered.
6 The regulatory framework for road freight transport in Turkey and
its alignment to the EU road transport acquis
This section describes the regulatory baseline for the impact assessment beyond the permitting
system, i.e. the fit between the EU acquis as it relates to road freight transport and Turkish national
legislation.
Turkey has treaty-based relations with the EU, initiated under the framework of an association regime
grounded on the Ankara Agreement33
that Turkey signed with the European Economic Community
(EEC) in 1963. The Ankara Agreement - which came into effect on 1st December 1964 and was further
extended with the Additional Protocol34
that entered into force in 1973 - set out basic common goals to
guide the bilateral economic and trade relations between Turkey and the EEC, and envisaged a three-
staged approach for ultimately establishing a customs union whilst declaring Turkey’s right to full
32
For Turkey the “social contribution paid by the employer” refer to the “wages charges for employer before concessions/deductions” while for EU countries these refer to ”contributions for public welfare and accident insurance paid by the employer” 33
Agreement Establishing an Association Between the European Economic Community and Turkey (Signed at Ankara, 1 September 1963). 34
Additional Protocol and Financial Protocol signed on 23 November 1970, annexed to the Agreement establishing the Association between the European Economic Community and Turkey and on measures to be taken for their entry into force - Final Act – Declarations. Official Journal L 293 , 29/12/1972 P. 0004 – 0056.
19,980
28,31523,967
22,181
51,48547,930
56,654
28.4%
28.5%17%
25.8%
38%19% 46%
TR HU PL RO IT DE FR
Wages Net of the Social Contributions(€) Social Contributions %

Study on the economic impact of an agreement between the EU and the republic of Turkey
Page 32
membership, once the custom union was completed (as it was in 1995 when Decision No 1/9535
of the
EC-Turkey Association Council was adopted).
By agreeing to enter the customs union, Turkey made a major step towards the integration with the
EU. For the customs union to operate smoothly, Turkey had to embrace a large part of the EU’s
legislation, in particular, laws relating to customs, trade policy, competition and the protection of
intellectual, industrial and commercial property. As such, Decision No 1/95 provided a stimulus to
efforts to align its domestic law with the EU acquis.
Turkey took an important step down the path to accession to the EU in 1999 when it received (as laid
down in Article 28 of the Ankara Agreement) ‘candidate country’ status. Accession negotiations were
formally opened in 2005. Simultaneously, a Negotiation Framework Document (NFD) was adopted
with the purpose of determining the principles of EU-Turkey negotiations, the rules of the negotiations
as well as the negotiation chapters. These high level initiatives define the framework for consideration
of the alignment of Turkey’s national legislation with the EU rules in the area of road freight transport.
Transport policy was one of the eight chapters suspended in December 2006 by the European
Commission after Turkey failed to fully implement the Additional Protocol to the Association
Agreement. Pending the reopening of that chapter, a dialogue between Turkey and the European
Commission started on 9 December 2013. This acknowledged the efforts the country is making to
align its road transport legislation to the corresponding EU norms and to improve its administrative and
enforcement capacity. It provides a platform for information exchange and development of common
solutions in problematic segments of the road transport sector.
The most important developments in the modernisation of Turkey’s road transport sector have been
the adoption of a framework law (Road Transport Law36
) and a by-law (Road Transport Regulation37
)
on road transport that came into force in 2003 and 2004 respectively (Turkish Ministry of Transport
and Communications, 2011; Isik 2007 and 2010)). These aim to govern the Turkish road transport
sector in line with the corresponding EU standards and requirements, and so pave the way for
improving the sector’s quality, competitiveness and reliability in the services provided. The Road
Transport Regulation was updated in 2009 to reflect the latest developments in EU legislation.
As acknowledged by the EC in its 201238
and 201139
reports on the progress made by Turkey on its
path to EU membership, further important improvements have been achieved in the implementation of
the digital tachograph system, which works efficiently and is in compliance with AETR rules (now it
also covers domestic transport operations) (EC, 2012).
Measures to regulate work and rest periods, driver training and roadside technical checks on
commercial vehicles have also, in the judgement of the Commission, been implemented adequately
(EC, 2012). In January 2013 Turkey become a party of the Convention on Road Traffic40
(commonly
known as the Vienna Convention), so taking an important step towards the alignment of driver
licences to the EU standards.
35
Decision No 1/95 of the EC-Turkey Association Council of 22 December 1995 on implementing the final phase of the Customs Union. 36
Road Transport Law No 4925 of 19 July 2003. 37
Road Transport Regulation (Official Gazette of the Republic of Turkey No 25571 of 2 September 2004). 38
European Commission (2012). Commission Staff Working Document “Turkey 2012 Progress Report” (SWD(2012) 336 final), accompanying the document “Communication from the Commission to the European Parliament and the Council: Enlargement Strategy and Main Challenges 2012-2013. 39
European Commission (2011). Commission Staff Working Paper “Turkey 2011 Progress Report” (SEC(2011) 1201 final, accompanying the document” Communication from the Commission to the European Parliament and the Council: Enlargement Strategy and Main Challenges 2011-2012. 40
The Convention on Road Traffic, of 1968, also known as the Vienna Convention on Road Traffic, as it was concluded in Vienna in 1968, regulates all facets of driving behaviour, such as speed and distance between vehicles, intersections and obligation to give way. Moreover, it details the technical conditions for the admission of vehicles to international traffic and provides models for domestic and international driving permits.

Study on the economic impact of an agreement between the EU and the republic of Turkey
Page 33
Despite this progress, however, EC reports suggest that technical and implementation capacity lag
behind the normative developments and require further improvements. Table 2.25 below gives an
overview of the alignment of Turkey’s road transport legislation to the corresponding EU acquis. A
more detailed discussion of the Turkish legislation and its fit to the EU acquis is provided in Appendix
E.2.

Study on the economic impact of an agreement between the EU and the republic of Turkey
Page 34
Table 6.1 Overview of the alignment of Turkey’s road transport legislation to the corresponding EU acquis
Field of intervention
Relevant EU norms and requirements
Transposing act(s) Current degree of alignment Reasons for non-convergence/Hindrances to full convergence
Degree of further alignment required
Access to the market and the profession
Regulations (EC) No 1071/2009 on access to the profession Regulation (EC) No 1072/2009 on access to the market Main requirements: Set the following basic criteria for engagement in the occupation of road transport operator
Effective and stable establishment.
Good repute.
Appropriate financial standing.
Professional competence.
Road Transport Law of 19 July 2003
Road Transport Regulation of 2 September 2004
Regulation on Training for Professional Competence in Road Transport Operations.
Partially aligned. Only the basic requirements set by the EU acquis for the access to the market and the profession have been transposed into Turkish national law.
Not provided. Full harmonization to this legislation shall be considered in the Turkey accession process.
Social aspects of road transport
Regulation (EC) No 561/2006 on driving hours and rest periods. Main requirements: Sets common rules for maximum daily driving times, breaks and rest periods of professional drivers engaged in road freight and passenger transport.
Labour Law of 10 June 2003
Law on Working Time of 6 April 2004
Road Transport Regulation of 2 September 2004
Partially aligned All main provisions governing driving times and rest periods of professional drivers have been introduced in Turkey. However, self-employed drivers are excluded from its scope of application and, therefore, not aligned to the provisions laid down in Directive 2002/15/EC.
Not relevant. Need of further alignment is identified with respect to self-employed drivers, who are at present excluded from the scope of the Labour Law whose provisions are, consequently, not consistent with Directive 2002/15/EC. Studies on further harmonisation of national legislation by Ministry of Labour and Social Security are still continuing.
Regulation (EEC) No 3821/85 on the digital tachograph. Main requirements: Set requirements on construction, installation, use and testing of recording equipment (tachograph).
Law on “Tachograph Devices used in International Road Transport” of 21 May 2010
Law on “Inspection and Sealing of Recording Equipment” of 12 January 2012
Law on “Recording Equipment Workshop Services” of 14 February 2012
Fully aligned. All main provisions governing the implementation of the tachograph have been introduced in Turkey. Turkey has adapted to the system via completing required legal and structural harmonization. For domestic operations, the implementation of the digital tachograph will be gradually achieved (by 2017).
Not relevant. No need of further alignment identified.

Study on the economic impact of an agreement between the EU and the republic of Turkey
Page 35
Field of intervention
Relevant EU norms and requirements
Transposing act(s) Current degree of alignment Reasons for non-convergence/Hindrances to full convergence
Degree of further alignment required
Driving licenses Directive 2006/126/EC on driving licenses. Main requirements: Set requirements on minimum requirements of driver training and testing, minimum standards for driving examiners and progressive access of young people to the categories of two-wheeled vehicles.
Amendment to the Law on Road Transport of 2 August 2013.
Not aligned. Turkey has ratified the Vienna Convention on Road Traffic as well as of the European Agreement supplementing this Convention. However, its system is not yet aligned to the EU acquis.
Not provided. Not provided. Studies are still
underway with the purpose of
identifying procedures to
secure an effective
implementation of this new
regulatory setting.
Technical standards
Directive 96/53/EC on dimensions and weights of road vehicles. Main requirements: Establishes maximum weight and dimensions of heavy commercial vehicles.
Law on “Procedures for Loading of Road Vehicles of 8 November 2011
Fully aligned. The current legislative framework is completely aligned to the provisions laid in Directive 96/3/EC.
Not relevant. No need of further alignment identified.
Directive 92/6/EEC on speed limitation devices as amended by Directive 2002/85/EC. Main requirements: Establishes the requirements for installing speed limitations devices to commercial vehicle engaged in freight and passenger transport operations.
Amendment to the Law on Road Transport of 19 February 2014
Fully aligned. Fitting of speed limitation devices now compulsory.
Transport of dangerous goods
Directive 2008/68/EC on dangerous goods. Main requirements: Establishes a common regime for all aspects of the inland transport of dangerous goods, by road, rail, and inland waterway.
Law on “Carriage of Dangerous Goods by Road
Fully aligned. New regulatory framework aligned to the corresponding EU acquis since 1 January 2014
Not relevant. No need of further alignment identified.

Study on the economic impact of an agreement between the EU and the Republic of Turkey
Page 36
7 The liberalisation scenarios
This section explains the scenarios for liberalisation of the EU-Turkey road freight sector that have
been examined as part of this study. The scenarios are defined according to the regulatory
requirements that are removed. The principal requirements of interest to this study are:
• Permits granted on the basis of bilateral agreements concluded to facilitate exchanges between
couples of countries;
• Permits granted on the basis of bilateral agreements concluded to enable transit on the territory of
a country for trade relations among another partner country and a third country. In this respect, a
further differentiation can be made between permits granted for free and so called “payable”
permits.
Another variable that should be taken into account is the contracting party, i.e. who is entitled to
negotiate quotas. As an example, the EU may be given legal ownership of the negotiation process
and replace Member States in the agreement of quotas with external contracting partners. This may in
itself have liberalisation effects, e.g. if it changes the number and distribution of quotas.
The scenarios are:
• Business as Usual. This scenario assumes the quota systems continue as today under Member
State control. They are assumed to evolve according to the market needs and the negotiations
between partners. It embodies certain assumptions about evolution of legislation (further alignment
to the EU acquis and the subsequent enforcement of the legislation), macroeconomics (GDP,
trade) and microeconomics (operating costs including as main factor, labour costs) and the
number of permits granted (number and type) with special attention to transit issues and payable
transit in specific countries.
• Transit liberalisation. This scenario sees a move to free transit for the external partner (Turkey).
It should solve the issue which stakeholders, such as the Turkish hauliers, see as the principal
constraint on EU-Turkey trade. The application would entail some practical problems as all
bilateral agreements would need to be discussed in order to clearly quantify the number of bilateral
permits to be granted. Today, in some cases, transit and bilateral permits are negotiated together.
• Transit liberalisation plus additional EU permits. This scenario aims to remove the constraints
to trade imposed by the limited number of permits currently issued. The estimation of demand,
relevant to determination of ‘real needs’ as indicated in the table, needs to be clearly defined. The
result is very close to a full liberalization context.
• EU management of quotas. This scenario assumes that the EU has legal ownership of the
negotiation process with external partners. This requires allocation of the number of permits
globally negotiated by the EU with the partner country to Member States.
• Full liberalisation. This entails a full liberalisation of services between the EU and Turkey.
Provided that it will lead to a reduction of control over the inbound and outbound flows, a full
opening scenario would require strong measures that can secure the proper enforcement of the
EU regulations as well as surveillance to guarantee that fees and other restrictions are not
introduced at national level to undermine the intent of the liberalisation. In this scenario, also
ECMT licenses system would be affected by liberalization and, therefore, a strong reduction of the
overall ECMT licenses distributed shall be considered alike.
For all liberalisation scenarios it is assumed that there would be clauses committing the external
partner and EU to fair and consistent interpretation and administration of the rules, and a mechanism

Study on the economic impact of an agreement between the EU and the Republic of Turkey
Page 37
to deal with reports of deviation from that practice. The aim of this would be eliminate the problems
reportedly experienced by some EU hauliers with ad hoc inspections and requirements being imposed
at a local level by officials in Turkey.
The timing of the transition is also crucial. The initial hypothesis is that all actions proposed are
immediate (e.g. starting in 2015 or 2016), without considering gradual changes that would be very
difficult either to define or to control. in case, whether the objective is full opening, e.g. by 2020,
transition phases can be represented by “intermediate” scenarios.
The scenarios are summarised in Table 7.1.
Table 7.1 Definition of liberalisation scenarios
Nr Scenario Name Bilateral
permits
Transit
permits
EU permits /
licenses
EU agreements
1 Business as usual
no change to
baseline
no change to
baseline none none
2a Transit liberalisation
Agreement
adaptation removal none
Not required, but
transit liberalisation
needs a decision
of individual
Member States
2b Transit liberalisation +
additional EU permits
Agreement
adaptation removal
add according
to real needs yes
3 EU management of quotas removal removal
bilateral EU
permits yes
4 Full liberalisation removal removal not necessary not necessary

Study on the economic impact of an agreement between the EU and the Republic of Turkey
Page 38
8 Impact assessment
This section provides the estimated transport and economic impacts of the scenarios described
above, by comparison with the reference scenario. The figures are based on the use of: (i) an
econometric gravity model for the estimation of future trade and transport flows, (ii) an elasticity-based
estimation of the response of trade flows to trade cost changes, and (iii) input-output analysis which
allows the study of economy-wide and sector-specific consequences of the liberalisation scenarios.
The approach taken and assumptions used are described in detail in Appendix F. The sections below
only present and discuss the key results of the assessment. After presenting the reference case, we
report in detail on the results of the full liberalisation scenario, and later discuss findings from
intermediate liberalisation scenarios.
All reported results refer to the year 2016 as a probable year of the implementation of the change in
regulation. Prices are fixed at the level of 2012. The results of liberalisation scenarios come from
static modelling experiments. This means that the reported changes relative to the reference scenario
apply to each following year. More specifically, the reported increase of annual trade volume by 1%
relative to the reference scenario means that the trade volume is predicted to be 1% higher not only in
one year, but in every year following the implementation of the change in regulation.
Though the modelling suggests an instant response from the economy to the regulation change, in
practice these effects will take some time to fully materialize, as the economy will have to adapt to the
new situation. New production capacities have to be built, the personnel trained, the trading partners
found and the contracts signed. The full extent of the liberalisation impact would be realized three to
five years years after the regulatory changes.
8.1 Reference scenario
The reference, or ‘business as usual’ (BAU), scenario represents the situation in which the bilateral
quota system continues as it is today to 2016. Thus, the EU has no active role in the management of
permits. This baseline serves as the reference scenario for the evaluation of the consequences of the
liberalisation scenarios simulated.
Table 8.1 The model suggests a 13% growth in import road freight trips between 2012 and 2016 in
the business-as-usual scenario
Import trips from Turkey to:
Data for 2012 Business as usual scenario
Estimate for 2016
Turkish vehicles EU vehicles Total trips
Turkish vehicles EU vehicles Total trips
EU15 226197 12245 238442 252265 13623 265888
EU13 67740 108972 176712 79200 124471 203671
Eastern EU* 59119 107396 166515 69346 122773 192118
Northern EU 25247 0 25247 29544 0 29544
Southern EU 66285 4359 70644 71787 4709 76497
Western EU 143286 9462 152748 160788 10612 171400
Total EU 293937 121217 415154 331465 138094 469559
(% change) (+13%) (+14%) (+13%)
Source: UND data and own calculations
* Eastern EU: Bulgaria, Czech Republic, Hungary, Poland, Romania, Slovakia Northern EU: Baltic States, Denmark, Sweden, Finland, Great Britain Southern EU: Croatia, Greece, Italy, Portugal, Slovenia, Spain Western EU: Austria, Belgium, France, Germany, Luxembourg, the Netherlands

Study on the economic impact of an agreement between the EU and the Republic of Turkey
Page 39
In 2016 the estimated number of trips by EU and Turkish hauliers importing goods into the EU is
470,000, up 13% on 2012. This projection takes account of the current economic growth forecasts
(IMF) for Turkey and for the EU Member States.
8.2 Full liberalisation
The full liberalisation scenario involves the abolition of bilateral and transit permits. Where payable
permits and additional ad hoc rules for transit exist in the EU countries, we assume that the rules
applied to Turkish hauliers will be the same as the rules applied to EU hauliers (e.g. no requirement to
use train service in Austria).
It is estimated that a one-way trip to southern Germany via Austria will become €600 cheaper. The trip
through Serbia, Hungary and Slovakia to Poland will become €300 cheaper, and a trip to Romania –
€100 cheaper. The largest absolute savings are realised on routes that cross both, Hungary and
Austria. The ferry connections to Trieste (Italy) and Toulon (France) will remain attractive for hauliers
(cheaper than a trip by road). The share of traffic using these ro-ro connections is assumed to remain
unchanged in the scenarios.
8.2.1 Impacts on value of trade The analysis suggests that full liberalisation would increase the value of EU-Turkey trade by an
estimated €3.5 billion, out of which €1.9 billion are additional imports from Turkey and €1.6
billion are exports to Turkey. The largest expected effect is a rise in imports from Turkey into
Germany, France, the Netherlands, and the UK as the reduction of transport costs in central Europe
makes Turkish goods more competitive. Trade with EU Member States that are close neighbours of
Turkey also increases, but not by as much in relative terms.
A large part of the EU road exports to Turkey is transported by the Turkish vehicles. The significant
reduction of travel costs for Turkish hauliers in the liberalisation scenario thus leads to an increase in
the volume of EU exports to Turkey. An estimated increase of export value by €1.6 billion corresponds
to +2.1% of EU goods exports to Turkey and +0.1% of total extra-EU exports.
Lower trade barriers mean that Turkish products will be available at a lower price to consumers. The
direct savings for the final consumers in the EU economy are estimated at €140 million per annum.
Table 8.2 In value terms, full liberalisation boosts EU imports from Turkey by 7.9% and exports by
4.9%, as compared to business-as-usual
Full liberalisation scenario, 2016
Additional EU road imports, million Euro
Additional EU road exports, million Euro
Direct consumer savings, million Euro
EU15 1542 1289 95
EU13 352 277 47
Eastern EU* 250 216 43
Northern EU 349 271 11
Southern EU 279 234 27
Western EU 1016 845 61
Total EU 1894 1566 143
Change rel. to BAU, % 7.9% 4.9%
Source: DIW Econ. *see footnote to Table 8.1

Study on the economic impact of an agreement between the EU and the Republic of Turkey
Page 40
8.2.2 Macroeconomic and sectoral impacts The growth in trade with Turkey will have positive impacts on the sectors of the EU economy most
actively participating in these trade relations: mainly, manufacturing of machinery, vehicles, and
equipment, metals production, production of furniture, etc. The Member States with largest positive
effects are also the ones most actively involved in trade with Turkey: Germany, France, UK, Romania,
Bulgaria. It is, however, not possible to trace the impacts precisely. Given the small share of Turkey in
the overall EU exports and imports, the macroeconomic effects for individual countries are negligible.
The growth of EU exports to Turkey obviously requires more production activity and additional labour
input. The total effect on EU employment is estimated to be in the order of 14 thousand new jobs
(0.01% of total employment).
One potential effect is the substitution of within-EU or third-country imports with Turkish products. The
analysis of such processes would require the knowledge of price differentials and consumer
preferences for a range of commodities stemming from different destinations and is beyond the scope
of this study.
Table 8.3 Modelling suggests that effects of full liberalisation will be greatest in the textiles sector
Sectoral effects of the full liberalisation scenario in Turkey
Sector Output effect, €
mln
Output effect on
EU-majority
owned firms, €
mln
Employment
effect, thousand
persons
Agriculture, Hunting, Forestry and Fishing 91 0 4.7
Mining and Quarrying 10 0 0.0
Food, Beverages and Tobacco 76 7 0.4
Textiles and Textile Products 834 30 7.4
Leather, Leather and Footwear 1 0 0.0
Wood and Products of Wood and Cork 1 0 0.0
Pulp, Paper, Paper , Printing and Publishing 19 1 0.2
Coke, Refined Petroleum and Nuclear Fuel 5 0 0.0
Chemicals and Chemical Products 185 33 0.6
Rubber and Plastics 11 2 0.1
Other Non-Metallic Mineral 31 2 0.4
Basic Metals and Fabricated Metal 286 14 2.9
Machinery, nec 280 30 3.7
Electrical and Optical Equipment 138 15 1.1
Transport Equipment 211 22 2.3
Manufacturing, nec; Recycling 55 2 0.9
Services 23 0.2
Total 2257 158 24.9
Total change compared to BAU scenario, % 0.21% 0.52% 0.10%
Source: DIW Econ

Study on the economic impact of an agreement between the EU and the Republic of Turkey
Page 41
There will be additional cost savings for public budgets associated with the removal of the bilateral
negotiation processes on the composition and distribution of permits (administrative costs). It was not
possible to quantify these cost savings due to lack of data.
For Turkey, the input-output modelling suggests that road transport liberalisation with the EU can
boost output by around €2.3 billion, compared to the reference scenario. This effect would be
concentrated in certain sectors: textile production (37%), machinery and equipment (28%), agriculture
and food products (8%), metal products (13%), chemical products (8%).
The employment effect in the Turkish economy is estimated to be in the order of 25 thousand new
jobs. This corresponds to an increase by around 0.1% of total employment. The effect on Turkish GDP
is estimated to be +0.15%.
EU-majority owned firms have a significant presence in some sectors of the Turkish economy. Thus,
the overall expansion of output due to additional export demand will have an impact on the turnover
and profits of such firms. Out of the total figure of €2.3 billion of additional turnover, an estimated
€0.16 billion, or seven per cent, would accrue to EU-majority owned firms, mainly in the textiles,
chemicals and machinery industries. It is expected that the Turkish haulage industry would capture
most of the increase in volume of the EU-Turkey road freight market, as described further below.
8.2.3 Impact on the EU-Turkey haulage market With the modelling approach taken, full liberalisation results in 8% more import trips from
Turkey than seen under the business-as-usual scenario. The reason is that without the border
barriers imposed by the quota restrictions, the potential of Turkish exports (induced by the size of the
EU economy) can be realized to a greater extent. Under the assumptions made, the number of trips
by EU hauliers increases only slightly, by 3% (Turkish quotas pose no significant restriction to EU
exports). The additional growth is mainly captured by Turkish hauliers whose trips increase by 11%.
Table 8.4 Full liberalisation is projected to trigger an eight per cent increase in road haulage trips as
compared to business-as-usual
Predicted import trips by road in the full liberalisation scenario
Import trips from Turkey to:
Full liberalisation scenario
Estimation for 2016
Turkish vehicles EU vehicles Total trips
EU15 275190 13805 288995
EU13 91817 127762 219580
Eastern EU 80314 126043 206357
Northern EU 33068 0 33068
Southern EU 76614 4780 81395
Western EU 177011 10745 187755
Total EU 367007 141568 508575
Change rel. to BAU, % 11% 3% 8%
Source: DIW Econ. Numbers may not add up exactly due to rounding. *see footnote to Table 8.1
8.2.4 Changes in distribution of traffic It is inevitable, given the location of the routes between Turkey and its largest EU markets that the
growth in road freight traffic will be unevenly distributed across the EU Member States.
Abolition of current rules and charges, such as the transit permit charges imposed on Turkish vehicles,
would prompt certain changes in the routes chosen by the hauliers. The modelling suggests that
changes in transport costs will see some traffic redirected from routes using roads in Croatia,
Slovenia, and Poland to routes through Hungary and Czech Republic. This primarily relates to trips to
northern Germany and further to Denmark and Sweden. Another change is that a lot of traffic that

Study on the economic impact of an agreement between the EU and the Republic of Turkey
Page 42
formerly went through Romania is redirected via Serbia, which offers shorter routes. The largest
projected increases in truck movements following liberalisation are expected in Bulgaria and Hungary.
The cost-efficient ro-ro connections to Trieste and Toulon will continue to be used by the Turkish
hauliers (shares of traffic using these connections are assumed to remain the same as in the current
data).
Table 8.5 The modelling suggests some redistribution of EU-Turkey road freight traffic among
Member States
Distribution of total Turkey-EU import trips (bilateral and transit) in the 2016 scenarios
Country Business as usual scenario
Full liberalisation scenario
Absolute change Relative change
Austria 158072 165699 7628 5%
Belgium 27047 29040 1993 7%
Bulgaria 327361 358111 30750 9%
Croatia 81631 50030 -31601 -39%
Czech Republic 23321 48464 25144 108%
Denmark 3463 5714 2251 65%
Estonia 239 720 481 202%
Finland 629 1479 850 135%
France 44933 48400 3466 8%
Germany 164786 182372 17587 11%
Greece 42470 43756 1286 3%
Hungary 82744 128795 46051 56%
Italy 129773 140242 10469 8%
Latvia 450 1200 751 167%
Lithuania 851 1828 977 115%
Luxembourg 429 782 353 82%
Netherlands 14973 16629 1656 11%
Poland 28654 25784 -2871 -10%
Portugal 202 795 593 294%
Romania 148853 141038 -7815 -5%
Slovakia 53985 66327 12342 23%
Slovenia 78556 47034 -31522 -40%
Spain 9083 10188 1105 12%
Sweden 5444 5561 118 2%
United Kingdom 20210 21358 1148 6%
Source: DIW Econ
8.3 Transit liberalisation
We now consider the case with partial liberalisation in 2016 that simulates the abolition of transit
permits only (including ad hoc transit charges).
In this scenario the retention of bilateral quotas could mean a constraint to EU market access for
Turkish vehicles and vice versa. However, as the current data (2012-2014) suggest, given the
maximum amount of available quotas, the only existing bilateral restriction for Turkish vehicles arises
from the quota allocation in Spain (Figure F.5, Appendix F). We argue that this restriction is currently

Study on the economic impact of an agreement between the EU and the Republic of Turkey
Page 43
overcome using the ECMT permits. We assume that it will be possible to overcome this shortage
using ECMT licenses also in the business-as-usual scenario.
For the transit liberalisation scenario coming into force in 2016, we estimate that a deficit of bilateral
quotas will arise for Italy (around 3,500 additional bilateral permits required in 2016), Finland (800),
Lithuania (100), and, again, Spain (3,500). In all other cases the current bilateral permits will still be
sufficient.
8.3.1 Impacts on value of trade The analysis suggests that transit liberalisation would increase the value of EU-Turkey trade by
an estimated €3.3 billion, of which €1.8 billion are additional imports from Turkey and €1.5
billion are exports to Turkey. The reduction in impacts as compared to the full liberalisation scenario
is primarily due to the residual border barriers presented by bilateral permits that lead to travel delays
(time spent to arrange the permits and get them on board of the vehicle). However, as the principal
barriers - the transit charges - are abolished in this scenario, the overall impacts are very close to the
impacts of the full liberalisation scenario.
Table 8.6 In value terms, transit liberalisation boosts EU imports from Turkey by 7.4% and exports by
4.6%, as compared to business-as-usual
Import trips from Turkey to:
Transit liberalisation scenario, 2016
Additional EU road imports, million Euro
Additional EU road exports, million Euro
Direct consumer savings, million Euro
EU15 1488 1244 92
EU13 293 222 44
Eastern EU 200 166 41
Northern EU 334 261 11
Southern EU 258 216 26
Western EU 989 823 59
Total EU 1781 1466 136
Change rel. to BAU, % 7.4% 4.6%
Source: DIW Econ. Numbers may not add up exactly due to rounding. *see footnote to Table 8.1
8.3.2 Macroeconomic and sectoral impacts For Turkey, input-output modelling suggests that road transport liberalisation with the EU will boost
output by around €2.1 billion.
The employment effect in the Turkish economy is estimated to be in the order of 23 thousand new
jobs. This corresponds to an increase by around 0.09% of total employment. The effect on Turkish
GDP is estimated to be +0.14%.
Some sectors of the Turkish economy are characterized by significant presence of EU-majority owned
firms. Thus, the overall expansion of output due to additional export demand will have an impact on
the turnover and profits of such firms. Out of the total figure of €2.1 billion of additional turnover, €0.15
billion are on the part of EU-majority owned firms, mainly in the textiles, chemicals and machinery
industries.

Study on the economic impact of an agreement between the EU and the Republic of Turkey
Page 44
Table 8.7 The textile sector is the largest beneficiary of transit liberalisation
Sectoral effects of the transit liberalisation scenario in Turkey
Sector Output effect, €
mln
Output effect on
EU-majority
owned firms, €
mln
Employment
effect, thousand
persons
Agriculture, Hunting, Forestry and Fishing 85 0 4.5
Mining and Quarrying 9 0 0.0
Food, Beverages and Tobacco 72 6 0.4
Textiles and Textile Products 784 28 7.0
Leather, Leather and Footwear 1 0 0.0
Wood and Products of Wood and Cork 1 0 0.0
Pulp, Paper, Paper , Printing and Publishing 17 1 0.1
Coke, Refined Petroleum and Nuclear Fuel 5 0 0.0
Chemicals and Chemical Products 174 31 0.6
Rubber and Plastics 11 2 0.1
Other Non-Metallic Mineral 29 2 0.3
Basic Metals and Fabricated Metal 269 14 2.7
Machinery, nec 263 28 3.5
Electrical and Optical Equipment 130 14 1.0
Transport Equipment 198 21 2.2
Manufacturing, nec; Recycling 52 2 0.9
Services 22 0.2
Total 2122 148 23.4
Total change compared to BAU scenario, % 0.20% 0.49% 0.09%
Source: DIW Econ
8.3.3 Impact on scale of traffic flows With the modelling approach taken, full liberalisation results in 7% more import trips from Turkey than
seen under the business-as-usual (BAU) scenario.
8.1 Transit liberalisation + additional EU permits
A scenario of transit liberalisation and adjustment of bilateral permits according to real needs is almost
equivalent to the full liberalisation scenario in terms of key impacts. The actually needed amount of
permits would then correspond to the number of trips estimated using the gravity method. Therefore
the impact of trade value and macroeconomic impacts will be the same. However, there will still be a
need to issue permits and to get them on board trucks. Therefore, the time savings included in the
overview of the benefits of the full liberalisation scenario will not be fully realized in the case of an
incomplete liberalisation. The difference to the effects of the full liberalisation scenario on traffic flows
will be a decrease in the order of 1-2%.

Study on the economic impact of an agreement between the EU and the Republic of Turkey
Page 45
Table 8.8 Transit liberalisation is projected to trigger a seven per cent increase in road haulage trips
as compared to business-as-usual
Predicted import trips by road in the transit liberalisation scenario
Import trips from Turkey to:
Transit liberalisation scenario
Estimation for 2016
Turkish vehicles EU vehicles Total trips
EU15 274316 13781 288097
EU13 90815 124651 215465
Eastern EU 79451 122931 202382
Northern EU 32872 0 32872
Southern EU 76230 4756 80986
Western EU 176577 10745 187322
Total EU 365130 138432 503563
Change rel. to BAU, % 10% 0% 7%
Source: DIW Econ. Numbers may not add up exactly due to rounding. *: see footnote to Table 8.1
8.2 EU management of quotas
If EU takes over the negotiations over the bilateral quotas and can redistribute the whole amount of
quotas currently issued, then the remaining surplus of quotas issued, e.g. by Bulgaria and Germany
(monotype quotas) will be enough to compensate any deficit in other countries. Therefore, the impacts
on trade and output will be the same as in the scenario with additional EU permits.
8.3 Summary
Analysis of different liberalisation options between EU and Turkey suggests that the largest economic
impact comes from removal of transit quotas. Restrictions on transit, including certain ad hoc rules
applied by some Member States are the key barrier for EU imports from Turkey, while managed by
Turkish road operators.
Transit liberalisation leads to increase in the value of EU-Turkey trade by an estimate of €3.5 billion
per annum, out of which €1.9 billion are additional imports from Turkey and €1.6 billion are exports to
Turkey.
The ‘transit plus additional permits’ scenario and the ‘EU management of permits’ scenario have,
under the modelling approach adopted, effects roughly equivalent to that of full liberalisation except
that they provide somewhat smaller cost savings for the hauliers and the final consumers.
In terms of macroeconomic impacts, the effects of full liberalisation on the EU as a whole are very
small. The employment effect in the Turkish economy is estimated to be in the order of 25 thousand
new jobs (0.1%). The effect on Turkish GDP is estimated to be +0.15%. Out of the total figure of €2.3
billion of additional output for the Turkish economy, an estimate of €0.15 billion relates to EU-majority
owned firms, mainly in the textiles, chemicals and machinery industries. Most of the increase in road
freight is expected to be carried by Turkish hauliers though there would be new opportunities for EU
firms.
The EU road freight sector, though still characterised by differences between EU15 and EU13 based
operators, has a proven capacity to adapt. In changes that followed the enlargement of the EU and
market liberalisation demonstrated how quickly the market can react. The cross trade share gained by
EU13 operators shows that these countries are highly competitive also with respect to extra-EU
operators (see Section 5.4). It suggests that the opening of the road freight market with neighbouring
countries such as Turkey could represent a major opportunity for operators based in those countries.
The large share held by Turkish operators in the exchanges with EU15 countries may be contended

Study on the economic impact of an agreement between the EU and the Republic of Turkey
Page 46
and bring benefits especially to EU-13 operators. The removal of the current problems experienced by
some EU hauliers in Turkey is assumed to be part of the package. The impacts of the removal of the
tax concession relating to fuel costs that is enjoyed by Turkish hauliers working the EU export market
have not been modelled.
The current arrangements have economic consequences but also a social dimension. The long time
the drivers have to wait at the borders for instructions can provoke stress and compromise road
safety. It makes it more difficult for drivers to complete the trip according to their schedule whilst taking
the uninterrupted rest as required by the AETR rules.
There is also an environmental dimension in so far as total road traffic increases. The number of
import trips from Turkey into the EU rises by 8% (approximately +40,000 trips). The countries most
affected are Hungary, Czech Republic, Bulgaria, and Germany. The additional traffic produces 60-70
ktonnes of CO2 equivalent per year in the EU. In addition, further adverse effects, such as noise and
air pollution are generated.
The overview of key impacts of the alternative scenarios is contained in the following table.
Table 8.9 Summary of liberalisation scenarios for Turkey
Liberalisation of freight transport between EU and Turkey
Transit liberalisa-
tion Additional
quotas EU manage-
ment
Full liberalisa-
tion
Effects on the EU, change with respect to
BAU:
EU road exports to Turkey, mln € 1466 1566 1566 1566
change in % 4.6% 4.6% 4.6% 4.9%
EU road imports from Turkey, mln € 1781 1841 1841 1894
change in % 7.4% 7.7% 7.7% 7.9%
Employment, thousand new jobs 13.2 14.1 14.1 14.1
Direct consumer cost savings, mln € 136 143 143 143
Selected effects in Turkey:
Output expansion, mln € 2122 2193 2193 2257
change in % 0.20% 0.20% 0.20% 0.21%
Extra output of EU-majority owned firms, mln € 148 153 153 158
Employment effect, thousand new jobs 23.4 24.2 24.2 24.9
GDP effect, % 0.14% 0.15% 0.15% 0.15%
Additional GHG emissions, Gg CO2 eq. per year 61 64 64 67

Study on the economic impact of an agreement between the EU and the Republic of Turkey
Page 47
9 Conclusions
This report has considered the impacts of removing some or all of the bilateral quota and permitting
arrangements that current apply to road freight services operating between EU Member States and
Turkey.
It concludes that regulatory reform would yield overall benefits in terms of growth in trade, economic
output and jobs. The great impact comes from removing the quota instruments that currently cause
the greatest constraints on trade – the transit permits required by Turkish hauliers passing through
many Member States.
Benefits of liberalisation accrue to both the EU and Turkey. The modelling suggests that if the quota
system is removed, in full or in part, EU exports to Turkey will grow more rapidly than under a
business-as-usual scenario. This will support employment and prosperity within the EU.
Imports from Turkey into EU are expected to grow even faster than EU exports. This import growth will
benefit the Turkish economy, but also the EU consumers that will enjoy lower prices for Turkish goods
as regulatory costs are removed from the supply chain, and the EU firms with production facilities in
Turkey that sell back into the EU market.
Any agreement to liberalise current quota arrangements should include terms that provide assurance
that EU hauliers will not be subject to interference when they conduct legitimate trade, and that
controls will be applied according to the law.
Further alignment of Turkish law to the EU acquis in the area of commercial road transport is also
required. Turkey, a candidate country, has committed itself to a quick approximation to the relevant
EU norms. Further harmonisation of enforcement and controls must be included in any agreement.
The extensive use of ro-ro for Turkey-EU freight illustrates how alternative modes can compete on
trade routes. The removal of transit and bilateral constraints for Turkish hauliers may lead to a shift in
the market in favour of road. Moves to liberalise road freight should be accompanied by consideration
of how to sustain the competitiveness of ro-ro services, in line with the EU’s policy of shifting road
freight to other modes (e.g. via Motorways of the Sea programme).

Study on the economic impact of an agreement between the EU and the Republic of Turkey
Page 48
Appendix A. References
Assistance to the Turkish road transport sector, Project fiche, Project No TR 0403.08, Twinning No
TR/2004/IB/TR/01
Gomez-Acebo & Pombo (2009). Study of Bilateral Agreements on Road Freight Transport entered into
by the EU Member States and Third Countries.
European Commission, TRACECA IDEA (2011). “Transport dialogue and interoperability between the
EU and its neighbouring countries and Central Asian countries”, Working Paper 7.2; Transport Model
Development, Base Year and Forecast Models, EuropeAid 2008/155-683.
European Commission (2011). Commission Staff Working Paper “Turkey 2011 Progress Report”
(SEC(2011) 1201 final, accompanying the document” Communication from the Commission to the
European Parliament and the Council: Enlargement Strategy and Main Challenges 2011-2012.
European Commission (2011). DG Mobility and transport, Unit D.3 Land transport, Road Freight
Transport Vademecum, 2010 Report, Market trends and structure of the road haulage sector in
the EU in 2010, September 2010
European Commission (2012). Commission Staff Working Document “Turkey 2012 Progress Report”
(SWD(2012) 336 final), accompanying the document “Communication from the Commission to the
European Parliament and the Council: Enlargement Strategy and Main Challenges 2012-2013.
European Commission (2014). Report from the Commission to the European Parliament and the
Council on the State of the Union Road Transport Market, COM (2014) 222 final, April 2014
European Parliament (2013), Social and working conditions in the international road freight sector.
Investment Support and Promotion Agency of Turkey (2013). The Logistics Industry in Turkey,
November 2013
IZI Metodi, analisi e valutazioni economiche, Ernst & Young (2011). Servizio di monitoraggio sulle
attività delle aziende di autotrasporto, June 2011
Izzet ISIK (2007). Approximation of the EU Road transport Acquis in Turkey, Ministry of transport of
Turkey head of Department, Istanbul
Izzet ISIK (2010). Ministry of Transport, Road Safety
Ministry of Transport and Communication (2011). Transportation in Turkey, country report, October
2011.
Turkish Ministry of EU Affaires (2014). Note on progress in Turkish road transport sector
Turkish Ministry of Transport and Communications (2011). Transportation in Turkey.
UND (2009). Quota-free Europe Action Plan, in pursuit of acquired rights.
World Bank (2013). Quantitative Analysis of Road Transport Agreements (QuARTA). Washington.
World Bank (2014). Evaluation of the EU-TURKEY Customs Union

Study on the economic impact of an agreement between the EU and the Republic of Turkey
Page 49
Appendix B. Current EU legislative framework applying to the road
freight sector
B.1 Current EU legislative framework applying to the road freight sector
The EU acquis in the area of road freight transport is large in scope. Over the last two decades the EU
has modernised, streamlined and further harmonised a fragmented body of rules that was no longer
adequate to cope with the complexity of, and the new challenges posed by, the newly formed market
and social conditions that were triggered by the liberalisation process that occurred in this economic
domain during the 1990s. Competition has intensified following the completion of the internal market
and the two EU enlargement processes that occurred in 2004 and 2007.
Against this background, two principal objectives have remained at the heart of the legislation: (i)
reducing distortions of competition by ensuring that transport operators are placed on an equal footing
and are subject to the same set of harmonised rules, while (ii) improving compliance of transport
operators with social legislation and road safety rules.
One area where the legislative intervention of the EU has played a pivotal role in creating a new
regulatory framework that aims at removing disparities and market distortions between transport
companies operating is the access to the road market sector. This is, at present, liberalised in both
goods and passenger transport, with the partial exception of cabotage.
Although Article 71 (Title V) of the Treaty of Rome explicitly provides for the freedom to supply
international inland transport services and for the obligation to establish the conditions of access for
non-resident hauliers to domestic road freight haulage in a Member State (i.e. the rules that would
govern cabotage), it took almost 40 years to complete the liberalisation process. Historically, access to
the market for road transport services in Europe was subject to bilateral intergovernmental
agreements on the basis of which the governments annually agreed on road permit quotas for freight
road transport. It was only through adoption of Regulation (EEC) No 881/9241
and, one year later, of
Regulation (EEC) 3118/9342
that the system based on quota restrictions was abolished (as from 1
January 1993) and cabotage authorised. This was initially subject to licence under a quota system and
later, as from 1 July 199843
, allowed under a Community licence without quantitative restrictions.
These two pieces of EU legislation - Regulations (EEC) No 881/92 and 3118/93 – had defined the
rules for international road freight transport within the EU for almost 15 years, before being replaced
by Regulation (EC) No 1072/200944
that came into effect in May 2011. This new Regulation - which
defines the terms of access to the international haulage market - is the legislative response to the
evolution of the road freight transport sector that followed the liberalisation and the completion of the
internal market, as well as of the increase in competition that followed EU enlargement in 2004 and
2007. It clarifies the terms of cabotage operations, so as to avoid any potential market distortions or
disturbances45
. In addition, the Regulation promotes harmonisation across Member States, providing ,
41
Council Regulation (EEC) 881/92 of 26 March 1992 on access to the market in the carriage of goods by road within the Community to or from the territory of a Member State or passing across the territory of one or more Member States (OJ L 95 of 09.04.1992). 42
Council Regulation (EEC) No 3118/93 of 25 October 1993 laying down the conditions under which non-resident carriers may operate national road haulage services within a Member State. 43
It is worth reminding that the adoption of Regulations (EEC) 881/92 and 3118/93 followed the Court of Justice ruling of 22 May 1985 which set 1 January 1993 as the target date for establishing the internal market. 44
Regulation (EC) No 1072/2009 of 21 October 2009 on common rules for access to the international road haulage market. 45
Unlike in Regulation (EEC) No 3118/93 which only permitted cabotage operations conducted on a "temporary basis" by non-resident transport operators, without precisely defining the notion of "temporariness", Article 8 of Regulation (EC) No 1072/2009 states that cabotage should be limited to a maximum of three operations within a period of seven days and within the 7-day period hauliers can either perform cabotage in one Member State only or in one or more Member States as long as it is allowed for a maximum of one operation within three days in each Member State.

Study on the economic impact of an agreement between the EU and the Republic of Turkey
Page 50
for example, standardisation of certified copies of Community Licences and Driver Attestations /
Community Authorisations.
An additional area where the EU has intervened to harmonise existing rules is the access to the
profession. A liberalised single market should have uniform provisions regarding access to the
profession. Regulation (EC) No 1071/200937, which applies from 4 December 2011 and repeals
Directive 96/26/EC36, moves in this direction and lays down a set of norms that aim to clarify the
existing legal setting, as well as to increase the effectiveness of their implementation across all EU
Member States.
Efforts have been made as well to harmonise social and working conditions for employees in the
road transport sector, as well as to improve general road safety. Ideally, liberalisation - and the
consequential increase in competition - should have been accompanied by a parallel process of
harmonisation in employment and working conditions of road freight transport workers, and
professional drivers in particular, so as to secure equal operating conditions for transport companies
across all EU Member States. This has, however, not happened. Wide differences in terms of labour
and social market structures, regulations and enforcement mechanisms continue to exist across the
EU.
To date, the regulatory framework on the social aspects for the road transport sector46
has been
consolidated in Directive 2002/15/EC47
(known as the “Working Time Directive”) and Regulation (EC)
No 561/200648
, the latter being enforced through the mechanisms established by Directive
2006/22/EC49
. Regulation (EC) 561/2006 is of particular importance because of its role in defining
maximum driving hours and minimum rest periods of professional drivers (of vehicles with a
permissible mass higher 3.5 tonnes). It has played an essential role in both improving road safety and
working conditions and promoting fair competition amongst drivers across all EU Member States.
To prove that they are respecting Regulation (EC) No 561/2006, in compliance with Regulation (EEC)
No 3821/8550
, road hauliers must install a recording equipment (a “tachograph”). Member States are
required to establish adequate enforcement mechanisms in accordance with Directive 2006/22/EC51
(known as the “Enforcement Directive”).
Finally, Directive 2003/59/EC52
contributes to the efforts to improve road safety in Europe by setting
standards for new drivers and maintaining and enhancing, through initial qualification and periodic
training, the professionalism of existing truck and bus drivers throughout the EU.
46
This regulatory framework is further complemented by Regulation (EEC) No 3821/198519 (referred to as the “Tachograph regulation” on the recording device) and Directive 2003/59/EC (referred to as the ”Training Directive” introducing the Certificate of Professional Competence, or CPC), 47
Directive 2002/15/EC of 11 March 2002 on the organisation of the working time of persons performing mobile road transport activities. 48
Regulation (EC) No 561/2006 of 15 March 2006 on the harmonisation of certain social legislation relating to road transport and amending Council Regulations (EEC) No 3821/85 and (EC) No 2135/98 and repealing Council Regulation (EEC) No 3820/85 49
Directive 2006/22/EC of 15 March 2006 on minimum conditions for the implementation of Council Regulations (EEC) No 3820/85 and (EEC) No 3821/85 concerning social legislation relating to road transport activities and repealing Council Directive 88/599/EEC. 50
Council Regulation (EEC) No 3821/85 of 20 December 1985 on recording equipment in road transport 51
Directive 2006/22/EC of 15 March 2006 on minimum conditions for the implementation of Council Regulations (EEC) No 3820/85 and (EEC) No 3821/85 concerning social legislation relating to road transport activities and repealing Council Directive 88/599/EEC. 52
Directive 2003/59/EC of 15 July 2003 on the initial qualification and periodic training of drivers of certain road vehicles for the carriage of goods or passengers, amending Council Regulation (EEC) No 3820/85 and Council Directive 91/439/EEC and repealing Council Directive 76/914/EEC.

Study on the economic impact of an agreement between the EU and the Republic of Turkey
Page 51
Box B.1: The AETR Agreement
Signed on 1 July 1970 with the support of the United Nations Economic Commission for Europe
(UNECE), the AETR Agreement has since been signed and ratified by 46 Contracting Parties.
The Agreement (per Article 2 (“Scope”)) applies in the territory of each Contracting Party and to
all international road transport undertaken by any vehicle registered in the territory of the said
Contracting Party or in the territory of any other Contracting Party. Similar to the EU legislation,
the Agreement applies to vehicles used for the carriage of goods that exceed 3.5 tonnes and
passenger vehicles with a capacity of more than nine persons including the driver. Journeys to
or through the countries that are signatories to the AETR Agreement are subject to AETR rules.
These rules apply to the whole journey, including any EU countries passed through.
From September 2010, the AETR rules have been amended to recognise the digital tachograph
and are closely aligned with Regulation (EC) No 561/2006.
Harmonisation efforts for vehicles have focused on technical standards, particularly their weight, size
and emissions. For example, to improve road safety and to facilitate the internal market and the free
movements of transport services, Directive 96/53/EC53
established standard limit values for the weight
and size of commercial vehicles, making sure that Member States do not restrict circulation of vehicles
which comply with these limits from performing international transport operations within their
territories.
Directive 2002/85/EC54
, which repealed and widened the scope of Directive 92/6/EEC55
, requires the
fitting of speed limitation devices on commercial vehicles. Originally restricted to N3 vehicles (heavy
goods vehicles with maximum mass above 12 tonnes) and M3 vehicles (buses) above ten tonnes,
Directive 2002/85/EC extended the obligation to fit a speed limiter to N2 vehicles (smaller HGVs with
maximum mass between 3.5 and 12 tonnes) and M2 vehicles (buses with more than eight seats +
plus a driver's seat with maximum mass not exceeding 5 tonnes) and M3 vehicles below ten tonnes.
A further example of EU law that relates as much as road safety as to competition between transport
companies operating in different Member States is Directive 2009/40/EC56
on roadworthiness. This
Directive aims to foster approximation of Member States’ national laws on roadworthiness tests for
motor vehicles and their trailers, with the aim of promoting greater harmonisation in the frequency of
checks and the standards of checking methods that are in use across the EU.
A further area where legislation has pursued twin goals of increasing road safety and guaranteeing a
level playing field to transport operators concerns are the rules and requirements for transport of
dangerous goods. These rules are set in Directive 2008/68/EC57
, which establishes a common
regime for all aspects of the inland transport of dangerous goods, by road (Annex I), rail (Annex II) and
inland waterway (Annex III).
53
Council Directive 96/53/EC of 25 July 1996 laying down for certain road vehicles circulating within the Community the maximum authorized dimensions in national and international traffic and the maximum authorized weights in international traffic. 54
Directive 2002/85/EC of 5 November 2002 amending Council Directive 92/6/EEC on the installation and use of speed limitation devices for certain categories of motor vehicles in the Community. 55
Council Directive 92/6/EEC of 10 February 1992 on the installation and use of speed limitation devices for certain categories of motor vehicles in the Community. 56
Directive 2009/40/EC of 6 May 2009 on roadworthiness tests for motor vehicles and their trailers, as amended by Directive 2010/48/EU. 57
Directive 2008/68/EC of 24 September 2008 on the inland transport of dangerous goods.

Study on the economic impact of an agreement between the EU and the Republic of Turkey
Page 52
Appendix C. Bilateral agreements signed by Turkey with EU Member
States
Table C.1 EU Member States with which Turkey has concluded bilateral road transport agreement
EU Member State Agreement concluded Date of conclusion Post-accession modifications
Austria 21 January 1971 21 February 1978
Belgium 10 January 1970 26 October 1977
Bulgaria 16 April 1977 29 July 1979 and 27 January 2007
Croatia 9 January 1998 -
Cyprus No agreement concluded
Czech Republic 30 June 1981 -
Denmark 14 July 1977 22 February 2007
Estonia 9 October1995 -
Finland 3 August 1977 -
France 14 November 1969 10 November 1976
Germany 21 December 1977 -
Greece 4 April 1970 -
Hungary 14 September 1969 21 August 1978
Ireland No agreement concluded
Italy 30 June 1971 21 February 1978
Latvia 21 January 1996 -
Lithuania 10 February 1994 -
Luxembourg 25 May 1988 -
Malta No agreement concluded
Netherlands 6 December 1971 21 February 1978 and 24 April 2003
Poland 14 May 1978 15 Aril 2003
Portugal 9 May 2005 -
Romania 30 April 1977 -
Slovakia 14 March 1982 -
Slovenia 20 October 2001 -
Spain 3 March 1998 -
Sweden 14 May 1978 -
United Kingdom 14 May 1978 20 May 2009
Source: Compilation by the authors based on Acebo-Gomez & Pombo (2009) and UND data

Study on the economic impact of an agreement between the EU and the Republic of Turkey
Page 53
Table C.2 Comparison of the number of bilateral permits (excluding third country) granted to, and used by
Turkish hauliers by selected EU Member States over the period 2009-2013
Year
EU Member States
Bulgaria Germany Croatia Greece Italy
2009 Granted 292,500 167,550 55,000 55,000 48,000
Used 178,285 134,127 52,531 40,361 41,666
Remaining 39% 20% 4% 27% 13%
2010 Granted 97,000 167,550 60,000 55,000 48,000
Used 177,092 167,550 51,227 37,542 43,048
Remaining 40% 0% 15% 32% 10%
2011 Granted 297,000 170,050 60,000 55,000 48,000
Used 166,609 138,172 52,346 45,698 44,687
Remaining 44% 19% 13% 17% 7%
2012 Granted 283,000 170,050 60,000 55,000 48,000
Used 157,421 128,559 52,792 39,589 41,984
Remaining 44% 24% 12% 28% 13%
2013 Granted 299,500 170,050 60,000 55,000 48,000
Used 143,665 129,363 51,138 39,436 43,363
Remaining 52% 24% 15% 28% 10%
Source: Compiled by the authors based on UND data
Table C.3 Permits issued by Romania and Hungary: comparison between number of permits granted and
used
Year Type of
permits
Romania Hungary
Granted Used Remaining Granted Used Remaining
2009 Free 25,000 24,998 1% 24,423 24,423 0%
Payable 23,000 19,497 15.2% 16,400 15,649 4.6%
2010 Free 25,000 25,000 0% 27,500 27,329 1%
Payable 23,000 19,445 15.5% 16,400 13,658 16.7%
2011 Free 30,500 30,457 1% 24,189 24,179 1%
Payable 23,000 21,427 6.84% 16,400 13,560 17.3%
2012 Free 33,000 32,430 1% 27,390 27,378 1%
Payable 23,000 13,184 42.7% 16,400 12,699 22.6%
2013 Free 36,000 35,996 1% 31,911 31,898 1%
Payable 23,000 2,510 89.1% 16,400 7,438 54.7%
Source: Compiled by the authors based on UND data

Study on the economic impact of an agreement between the EU and the Republic of Turkey
Page 54
Appendix D. ECMT (ITF) Licenses distribution
Globally, as at 1st January in 2014 37,376 annual licenses and 15,336 licenses were issued covering
43 ECMT Member States.
Table D.1 Distribution of ECMT Multilateral annual licenses among all ECMT Member States as at 1st
January 2014
ECMT Country EURO3 Safe lorries
EURO4 Safe lorries
EURO5 Safe lorries
EURO6 Safe lorries
Total annual licenses
Albania 120 24 110 - 254
Armenia 150 24 60 12 246
Austria - - 96 - 96
Azerbaijan 160 180 100 - 440
Belarus - - 2,560 - 2,560
Belgium 80 150 150 - 440
Bosnia-Herzegovina
- - 1,280 - 1,280
Bulgaria 60 - 1,160 - 1,220
Croatia - - 1,500 - 1,500
Czech Republic
144 492 140 - 776
Denmark 40 72 120 120 352
Estonia 118 138 540 - 796
Finland 100 120 100 60 380
France 80 240 300 - 620
Georgia 106 60 330 - 496
Germany 220 240 690 - 1,150
Greece 80 5 5 - 90
Hungary 108 90 700 - 898
Ireland 10 18 40 36 104
Italy - 268 - - 268
Latvia 70 240 570 - 880
Liechtenstein - 6 10 12 28
Lithuania 150 132 650 - 932
Luxembourg 2 100 108 210
Macedonia - - 1,310 84 1,394
Malta 20 42 30 24 116
Moldova 20 42 30 24 116
Montenegro - - 560 - 560
Netherlands 50 120 200 240 610
Norway 24 72 110 120 326
Poland 120 600 1,410 2,130
Portugal 44 48 100 60 252
Romania - 192 1,510 - 1,702
Russia - - 670 - 670
Serbia - - 1,790 - 1,790
Slovakia - 600 500 - 1,100

Study on the economic impact of an agreement between the EU and the Republic of Turkey
Page 55
ECMT Country EURO3 Safe lorries
EURO4 Safe lorries
EURO5 Safe lorries
EURO6 Safe lorries
Total annual licenses
Slovenia 164 48 410 - 622
Spain 106 180 70 - 356
Sweden 60 150 120 120 450
Switzerland 18 60 150 180 408
Turkey 344 174 3,740 - 4,258
Ukraine - 360 2,940 - 3,300
United Kingdom
20 60 50 60 190
Total 2,768 5,271 28,041 1,296 37,376
Source: Compilation by the authors based on ITF data
Figure D.1 ECMT licenses distribution incentivises the use of greener vehicles (licences
by truck categories, 2002-2014)
Source: International Transport Forum, 2014

Study on the economic impact of an agreement between the EU and the Republic of Turkey
Page 56
Appendix E. Data and figures related to Turkey market and EU Turkey
trade
E.1 Trade and transport data
Turkey is aiming to reach its full potential as an international trading hub. Strategically positioned
on a traditional and historic trade route between Asia and Europe, it has seen its foreign trade
growing with all areas of the world in recent years. IMF projections suggest Turkish exports will
grow on average more than 5% from 2013 to 2017, while import growth is expected to exceed
9.5% during the same period. Growth in Turkey’s foreign trade is expected to drive continued
expansion in its transportation and logistics industries.
Figure E.1 Turkey’s import growth is expected to outpace export expansion over the next 5 years
Forecast growth of imports & exports, Turkey, 2011- 2018
Source: Investment Support and Promotion Agency of Turkey, IMF58
58
Valuation of exports are based on free on board (FOB), valuation of imports are based on cost, insurance, freight (CIF). a: actual f: forecast
-5%
0%
5%
10%
15%
20%
2011a 2012a 2013f 2014f 2015f 2016f 2017f 2018f
Imports Exports

Study on the economic impact of an agreement between the EU and the Republic of Turkey
Page 57
Table E.1 Main EU partners of Turkey (million Euro); all transport modes
Country name EU's IMPORTS from Turkey EU's EXPORTS to Turkey
2009 2010 2011 2012 2013 2009 2010 2011 2012 2013
EU 15 Countries
AUSTRIA 578 624 756 779 799 863 1,076 1,248 1,270 1,319
BELGIUM 1,287 1,468 1,762 1,832 1,944 1,691 2,403 2,841 2,870 2,900
DENMARK 494 571 634 765 759 422 508 528 561 617
FINLAND 141 223 253 234 225 573 836 928 864 939
FRANCE 4,441 4,521 4,888 4,816 4,815 5,061 6,107 6,622 6,672 6,093
GERMANY 7,020 8,573 10,022 10,204 10,339 10,078 13,136 16,483 16,653 18,253
GREECE 1,168 1,084 1,114 1,091 1,083 809 1,149 1,832 2,750 3,170
IRELAND 211 254 255 269 285 587 655 602 658 626
ITALY 4,212 4,859 5,635 4,951 5,069 5,419 7,587 9,646 10,395 9,715
LUXEMBURG 14 19 39 40 40 57 86 117 113 103
NETHERLANDS 1,526 1,844 2,330 2,521 2,669 1,819 2,355 2,874 2,842 2,534
PORTUGAL 290 350 320 342 465 298 378 435 503 513
SPAIN 2,008 2,646 2,814 2,887 3,270 2,694 3,623 4,450 4,685 4,845
SWEDEN 534 707 850 921 867 1,364 1,441 1,647 1,658 1,543
UK 4,230 5,415 5,858 6,756 6,616 2,482 3,506 4,200 4,379 4,727
Sub-total EU 15 28,154 33,159 37,528 38,410 39,244 34,218 44,845 54,453 56,873 57,897
EU 13 Countries
BULGARIA 991 1,120 1,164 1,311 1,487 795 1,274 1,777 2,147 2,084
CROATIA 0 0 0 0 152 0 0 0 0 146
CYPRUS59
1 0 1 3 1 0 0 1 0 0
CZECH REP. 349 520 637 611 583 734 993 1,263 1,560 1,979
ESTONIA 77 67 94 131 149 73 109 266 243 194
HUNGARY 318 330 366 402 493 700 1,035 1,074 919 927
LATVIA 47 49 84 99 114 37 53 93 125 130
LITHUANIA 109 156 197 214 303 59 89 106 171 134
MALTA 475 305 644 713 668 96 147 235 167 57
POLAND 943 1,124 1,264 1,441 1,555 1,296 1,960 2,514 2,376 2,401
ROMANIA 1,573 1,944 2,069 1,940 1,976 1,615 2,583 2,730 2,520 2,712
SLOVAKIA 155 342 289 304 329 580 693 642 678 841
SLOVENIA 426 271 443 426 504 178 218 250 243 230
Sub-total EU 13 5,464 6,229 7,252 7,597 8,314 6,162 9,155 10,950 11,150 11,835
TOTAL EU 28 33,617 39,389 44,781 46,006 47,558 40,381 54,000 65,404 68,023 69,732
Source: UND on TurkStat data
59
SOUTHERN CYPRUS

Study on the economic impact of an agreement between the EU and the Republic of Turkey
Page 58
Table E.2 International annual road freight transport; EU imports from Turkey (‘000 tonnes)
REPORTING COUNTRY 2008 2009 2010 2011 2012 2013
EU 15 Countries
AUSTRIA 340 325 335 333 296 258
BELGIUM 161 143 175 168 175 201
DENMARK 59 52 51 55 56 53
FINLAND 9 11 17 25 20 19
FRANCE 319 257 283 326 336 343
GERMANY 1,147 916 1,158 1,295 1,218 1,203
GREECE 482 455 328 303 285 255
IRELAND 20 2 1 1 1 3
ITALY 133 109 127 125 135 137
LUXEMBURG 12 3 4 7 8 7
NETHERLANDS 133 113 167 166 181 213
PORTUGAL 8 7 18 6 4 5
SPAIN 91 78 93 106 100 114
SWEDEN 34 32 53 53 71 60
UK 3 1 2 2 152 170
Sub-total EU 15 2,951 2,506 2,812 2,972 3,038 3,040
EU 13 Countries BULGARIA 709 1,062 926 895 905 936
CROATIA No data available
CYPRUS 0 0 0 0 0 0
CZECH REP. 108 87 114 136 138 144
ESTONIA 3 3 3 3 3 4
HUNGARY 124 98 113 109 109 133
LATVIA 7 7 10 10 9 9
LITHUANIA 13 11 10 12 14 14
MALTA No data available
POLAND 270 249 277 280 284 299
ROMANIA 881 637 731 724 659 645
SLOVAKIA 52 47 65 74 85 83
SLOVENIA 28 28 38 33 29 26
Sub-total EU 13 2,195 2,228 2,287 2,276 2,233 2,294
TOTAL EU 28 5,146 4,734 5,099 5,248 5,271 5,334
Source: EUROSTAT; EXTRA EU27 Trade by reporting country

Study on the economic impact of an agreement between the EU and the Republic of Turkey
Page 59
Table E.3 International annual road freight transport; EU export to Turkey (‘000 tonnes)
REPORTING COUNTRY 2008 2009 2010 2011 2012 2013
EU 15 Countries
AUSTRIA 145 137 157 182 225 214
BELGIUM 335 299 355 379 353 334
DENMARK 21 18 22 24 22 25
FINLAND 14 12 26 17 20 17
FRANCE 511 441 509 547 460 410
GERMANY 1,469 1,065 1,319 1,409 1,368 1,398
GREECE 281 309 265 219 255 208
IRELAND 3 3 4 4 5 5
ITALY 327 285 349 368 376 392
LUXEMBURG 8 10 29 30 29 34
NETHERLANDS 263 254 335 303 299 358
PORTUGAL 5 3 3 5 5 6
SPAIN 110 90 109 118 125 132
SWEDEN 54 36 51 47 62 77
UK 15 9 3 3 86 95
Sub-total EU 15 3,562 2,972 3,537 3,654 3,689 3,705
EU 13 Countries
BULGARIA 459 488 627 710 674 725
CROATIA No data available
CYPRUS 0 0 0 0 0 0
CZECH REP. 81 69 100 126 134 154
ESTONIA 0 1 3 4 2 1
HUNGARY 108 104 142 171 162 162
LATVIA 1 15 2 4 4 3
LITHUANIA 1 1 4 5 2 4
MALTA No data available
POLAND 158 178 260 362 320 275
ROMANIA 414 330 370 447 483 484
SLOVAKIA 48 54 81 76 93 97
SLOVENIA 41 46 63 57 51 51
Sub-total EU 13 1,312 1,288 1,653 1,963 1,926 1,956
TOTAL EU 28 4,873 4,261 5,190 5,617 5,614 5,661
Source: EUROSTAT; EXTRA EU27 Trade by reporting country

Study on the economic impact of an agreement between the EU and the Republic of Turkey
Page 60
Figure E.2 International road freight transport balance between Turkey and the main EU trading
partners (‘000 tonnes)
Source: EUROSTAT; EXTRA EU27 Trade by reporting country

Study on the economic impact of an agreement between the EU and the Republic of Turkey
Page 61
Table E.4 Empty entrance – empty exit by Turkish and foreign vehicles (border gates) to/from whole
Europe, including transit traffic
BORDER GATE
TURKISH & FOREIGN TRUCK
2012 2013
EXIT ENTRY EXIT ENTRY
EMPTY LOADED Total EMPTY LOADED
Total EMPTY LOADED Total EMPTY LOADED Total
Land Border*
TURKISH 4,950 220,311 225,261 37,737 183,075 220,812 3,805 198,060 201,865 31,976 166,723 198.699
FOREIGN 17,980 168,300 186,280 55,233 141,007 196,240 15,953 176,497 192,450 50,640 149,959 200.599
Land Border subtotal 22.930 388,611 411,541 92,970 324,082 417,052 19,758 374,557 394,315 82,616 316,682 399,298
Ro-Ro Border**
TURKISH 3,687 115,804 119,491 2,544 116,413 118,957 5,118 129,081 134,199 3,434 131,332 134.766
FOREIGN 616 18,708 19,324 5,673 12,420 18,093 682 20,924 21,606 7,121 15,403 22.524
Ro-Ro Border subtotal 4.303 134,512 138,815 8,217 128,833 137,050 5,800 150,005 155,805 10,555 146,735 157,290
Total TURKISH 8,637 336,115 344,752 40,281 299,488 339,769 8,923 327,141 336,064 35,410 298,055 333.465
FOREIGN 18,596 187,008 205,604 60,906 153,427 214,333 16,635 197,421 214,056 57,761 165,362 223.123
Total 27.233 523,123 550,356 101,187 452,915 554,102 25,558 524,562 550,120 93,171 463,417 556,588
Source: UND data
* HAMZABEYLI, İPSALA, KAPIKULE ** AMBARLI, ÇEŞME, HAYDARPAŞA, PENDIK, İSKENDERUN, MERSİN
Figure E.3 Share of the Turkish hauliers’ trips from Turkey to the EU by border crossing type (2013)
(ro-ro traffic is shown in shades of blue, land crossings in shade of red)
39% of the EU’s import loaded trips from Turkey to Europe (also to non EU Member States) are
made via ro-ro terminals (2013)
Border Gate Trips (Imports to EU)
İPSALA (LAND) 35,528
HAMZABEYLI (LAND) 51,744
KAPIKULE (LAND) 109,960
TEKİRDAĞ-TRIESTE (RO-RO)
1,087
AMBARLI-TRIESTE (RO-RO)
10,235
ÇEŞME-TRIESTE (RO-RO)
21,778
HAYDARPAŞA-TRIESTE/UKRAINE (RO-RO)
28,066
PENDIK-TRIESTE (RO-RO)
50,794
MERSIN-TRIESTE/ Northern Cypriot Republic (RO-RO)
15,718
Total 324,910
Source: Authors’ analysis of UND data (EU’s Import loaded Trips to EU from Turkey by Turkish vehicles (by border gate))

Study on the economic impact of an agreement between the EU and the Republic of Turkey
Page 62
Figure E.4 Share of the Turkish haulers’ trips from the EU to Turkey by border crossing type (2013)
46% of the EU’s export loaded trips from Europe (also from non EU Member States) to Turkey
pass through ro-ro borders (2013)
Border Gate Trips Exports from EU)
İPSALA (LAND) 24,588
HAMZABEYLI (LAND)
38,596
KAPIKULE (LAND) 92,164
TEKİRDAĞ-TRIESTE (RO-RO)
300
AMBARLI-TRIESTE (RO-RO)
9,292
ÇEŞME-TRIESTE (RO-RO)
20,454
HAYDARPAŞA-TRIESTE/UKRAINE (RO-RO)
28,271
PENDIK-TRIESTE (RO-RO)
57,918
MERSIN-TRIESTE/ Northern Cypriot Republic (RO-RO)
17,431
Total 289,014
Source: Authors’ analysis of UND data (EU’s Export loaded Trips from EU to Turkey by Turkish vehicles (by border gate))

Study on the economic impact of an agreement between the EU and the Republic of Turkey
Page 63
Figure E.5 International annual road freight transport - goods loaded in EU reporting country and
unloaded in Turkey (by group of goods NST07; ‘000t)
Source: EUROSTAT

Study on the economic impact of an agreement between the EU and the Republic of Turkey
Page 64
Figure E.6 International annual road freight transport - goods loaded in Turkey and unloaded in EU
reporting country (by group of goods NST07; ‘000t)
Source: EUROSTAT

Study on the economic impact of an agreement between the EU and the Republic of Turkey
Page 65
Table E.5 EU’s Import loaded road trips from Turkey to European countries by Turkish Vehicles (2013),
share of land and ro-ro trips
EU’s IMPORT TRIPS BY ROAD FROM TURKEY to EU BY TURKISH VEHICLES in 2013
COUNTRY OF DESTINATION WESTERN LAND TRIPS WESTERN & SOUTHERN RO-RO TRIPS
TOTAL EU’s Import 2013
Share Ro-Ro
EU 15 Countries
AUSTRIA 4,630 2,035 6,665 31%
BELGIUM 3,561 4,336 7,897 55%
DENMARK 1,767 299 2,066 14%
FINLAND 460 91 551 17%
FRANCE 8,764 18,992 27,756 68%
GERMANY 47,879 37,458 85,337 44%
GREECE 16,163 30 16,193 0%
IRELAND 118 45 163 28%
ITALY 8,190 32,294 40,484 80%
LUXEMBURG 118 201 319 63%
NETHERLANDS 7,697 2,918 10,615 27%
PORTUGAL 93 182 275 66%
SPAIN 3,365 7,120 10,485 68%
SWEDEN 3,411 1,308 4,719 28%
UK 8,489 8,497 16,986 50%
Sub-total EU 15 114,705 115,806 230,511 50%
EU 13 Countries
BULGARIA 11,924 1 11,925 0%
CROATIA 1,352 39 1,391 3%
CYPRUS60
- 3,169 3,169 100%
CZECH REP. 2,810 496 3,306 15%
ESTONIA 101 8 109 7%
HUNGARY 3,329 263 3,592 7%
LATVIA 172 2 174 1%
LITHUANIA 528 21 549 4%
MALTA No data available
POLAND 7,437 1,733 9,170 19%
ROMANIA 23,797 3 23,800 0%
SLOVAKIA 1,866 320 2,186 15%
SLOVENIA 995 336 1,331 25%
Sub-total EU 13 54,311 6,391 60,702 11%
TOTAL EU 28 169,016 122,197 291,213 42%
Other European Countries ALBANIA 3,897 - 3,897 0%
BELARUS 1,964 259 2,223 12%
BOSNIA HERZEGOVINA 3,007 29 3,036 1%
KOSOVO 97 - 97 0%
LIECHTENSTEIN 3 5 8 63%
MACEDONIA 4,591 - 4,591 0%
MOLDAVIA 1,544 1 1,545 0%
MONTENEGRO 294 - 294 0%
NORWAY 677 178 855 21%
SERBIA 4,122 1 4,123 0%
SWITZERLAND 1,940 1,426 3,366 42%
UKRAINE 2,399 493 2,892 17%
Sub-total Other European Countries 24,535 2,392 26,927 9%
TOTAL Europe 193,551 124,589 318,140 39%
Source: UND data
60
NORTHERN CYPRUS

Study on the economic impact of an agreement between the EU and the Republic of Turkey
Page 66
Table E.6 EU’s Export loaded road trips from European countries to Turkey by Turkish Vehicles (2013),
share of land and ro-ro trips
EU’s EXPORT TRIPS BY ROAD FROM EU TO TURKEY BY TURKISH VEHICLES IN 2013
COUNTRY OF LOADING WESTERN LAND TRIPS WESTERN RO-RO TRIPS TOTAL EU’s Export 2013
Share Ro-Ro
EU 15 Countries
AUSTRIA 4,343 955 5,298 18%
BELGIUM 2,256 2,594 4,850 53%
DENMARK 865 96 961 10%
FINLAND 477 55 532 10%
FRANCE 4,951 14,758 19,709 75%
GERMANY 63,341 44,136 107,477 41%
GREECE 11,382 30 11,412 0%
IRELAND - 2 2 100%
ITALY - 60,382 60,382 100%
LUXEMBURG 44 386 430 90%
NETHERLANDS 4,586 1,622 6,208 26%
PORTUGAL 87 143 230 62%
SPAIN - - - -
SWEDEN 2,319 143 2,462 6%
UK 3,231 2,849 6,080 47%
Sub-total EU 15 97,882 128,151 226,033 57%
EU 13 Countries
BULGARIA 6,785 - 6,785 0%
CROATIA 513 7 520 1%
CYPRUS61
- 642 642 100%
CZECH REP. 2,552 94 2,646 4%
ESTONIA 40 18 58 31%
HUNGARY 4,857 46 4,903 1%
LATVIA 27 - 27 0%
LITHUANIA 173 8 181 4%
MALTA No data available
POLAND 9,076 368 9,444 4%
ROMANIA 19,379 2 19,381 0%
SLOVAKIA 3,965 17 3,982 0%
SLOVENIA 3,914 29 3,943 1%
Sub-total EU 13 51,281 1,231 52,512 2%
TOTAL EU 28 149,163 129,382 278,545 46%
Other European Countries ALBANIA 313 - 313 0%
BELARUS 464 291 755 39%
BOSNIA HERZEGOVINA 706 3 709 0%
KOSOVO 8 - 8 0%
LIECHTENSTEIN 2 - 2 0%
MACEDONIA 446 - 446 0%
MOLDAVIA 175 51 226 23%
MONTENEGRO 7 - 7 0%
NORWAY 521 13 534 2%
SERBIA 1,586 - 1,586 0%
SWITZERLAND 1,424 878 2,302 38%
UKRAINE 224 1,115 1,339 83%
Sub-total Other European Countries 5,876 2,351 8,227 29%
TOTAL Europe 155,039 131,733 286,772 46%
Source: UND data
61
NORTHERN CYPRUS

Study on the economic impact of an agreement between the EU and the Republic of Turkey
Page 67
Table E.7 Engine rating of the vehicles of the first nine companies listed as per ECMT license distribution
criteria
COMPANY NAME Fleet operating to Europe
EURO III EURO IV EURO V EURO VI TOTAL
OMSAN LOJİSTİK A.Ş. 268 35 194 - 497
NETLOG LOJİSTIK HİZMETLERİ A.Ş. 31 10 329 - 370
MARS LOJİSTİK ULUSL.TAŞ.DEP.DAĞ.VE TİC.A.Ş. 7 - 355 - 362
EKOL LOJİSTİK A.Ş. 2 - 291 - 293
EKOL LOJİSTİK LTD.ŞTİ. - - 292 - 292
BARSAN GLOBAL LOJİSTİK VE GÜMRÜK MÜŞAVİRLİĞİ ANONİM ŞİRKETİ
1 - 288 - 289
MERTUR OTOMOTİV VE TAŞIMACILIK ANONİM ŞİRKETİ 161 5 79 - 245
GÖK-BORA ULUSLARARASI NAKLİYAT VE TİCARET ANONİM ŞİRKETİ
50 8 157 - 215
EYÜP LOJİSTİK ULUSLARARASI KARA VE DENİZ NAKLİYATI TİCARET ANONİM ŞİRKETİ
2 2 208 - 212
Total 522 60 2,193 - 2,775
% 18.8% 2.2% 79.0% 0.0% 100.0% Source: UND
The data above suggest that hauliers from EU12 countries would be cost competitive with Turkish
operators, especially in bilateral trades (i.e. eastern EU country-Turkey). Activities related to cross-
trades are less likely to involve Turkish operators given that such activities are likely to be related to
the principle of “free movement of workers” which accordingly only involves hauliers of the EU
Member States.
A complete analysis of the trends of these variables over the last year cannot be done due to lack of
comprehensive time series. The EU market has, however, seen some specific changes that can be
observed in:
• faster growth of international road market operated by Eastern countries hauliers;
• increase of the number of road transport companies established in the EU12 countries, (many are
subsidiaries of holding companies based in EU15);
• intangible changes in road freight market concentration (measured e.g. through changes in
average dimension of companies and market shares held by bigger operators).

Study on the economic impact of an agreement between the EU and the Republic of Turkey
Page 68
Table E.8 Number of loaded trips made by Turkish vehicles from Turkey to each EU destination country
Destination Country
2004 2005 2006 2007 2008 2009 2010 2011 2012 2013 Change
EU 15 Countries
AUSTRIA 6,073 7,168 7,500 7,757 7,635 6,404 6,267 6,927 6,901 6,668 -3.4%
BELGIUM 5,881 4,807 6,024 7,168 7,526 6,542 7,194 8,280 8,085 7,895 -2.4%
DENMARK 1,282 1,673 2,200 2,276 2,630 2,129 2,182 1,891 2,272 2,064 -9.2%
FINLAND 179 353 328 508 636 827 732 606 578 551 -4.7%
FRANCE 18,421 19,405 22,556 25,731 24,833 21,584 27,869 28,633 28,079 27,753 -1.2%
GERMANY 61,285 63,970 70,651 81,152 81,660 68,825 80,684 90,104 87,845 85,313 -2.9%
GREECE 19,974 23,568 26,200 28,403 31,113 27,490 20,406 18,846 16,976 16,184 -4.7%
IRELAND 341 364 212 345 290 300 194 206 153 163 6.5%
ITALY 30,492 37,599 37,184 37,743 36,053 29,414 34,628 36,004 37,699 40,473 7.4%
LUXEMBURG 241 363 316 139 671 225 205 328 370 319 -13.8%
NETHERLANDS 8,395 8,609 9,181 11,222 10,761 9,197 10,750 10,967 12,006 10,610 -11.6%
PORTUGAL 107 135 142 281 380 258 263 183 183 275 50.3%
SPAIN 3,843 4,452 5,546 7,374 6,955 5,829 7,574 7,135 8,143 10,485 28.8%
SWEDEN 2,210 2,513 2,748 3,506 3,384 2,780 3,675 4,394 4,644 4,721 1.7%
UK 17,469 17,988 20,157 23,862 18,375 14,068 16,208 15,742 17,060 16,981 -0.5%
Sub-total EU 15 176,193 192,967 210,945 237,467 232,902 195,872 218,831 230,246 230,994 230,455 -0.2%
EU 13 Countries
BULGARIA 13,529 18,451 19,153 25,068 28,079 25,094 14,972 10,898 12,317 11,926 -3.2%
CROATIA 2,546 2,754 3,548 3,938 3,703 2,480 1,707 1,538 1,686 1,391 -17.5%
CYPRUS62
0 0 0 4,119 4,978 3,833 4,750 3,114 3,558 3,169 -10.9%
CZECH REP. 1,026 1,452 1,594 2,645 3,364 2,727 3,206 3,849 3,688 3,305 -10.4%
ESTONIA 5 2 24 46 117 28 55 28 69 109 58.0%
HUNGARY 4,612 5,389 5,641 6,334 5,869 4,535 4,265 3,765 3,209 3,589 11.8%
LATVIA 3 25 98 118 74 94 115 155 168 173 3.0%
LITHUANIA 126 131 224 291 284 170 140 253 456 553 21.3%
MALTA No data available
POLAND 5,267 5,563 7,235 10,973 9,586 8,487 8,920 8,684 9,804 9,180 -6.4%
ROMANIA 25,391 33,609 35,868 53,294 49,348 32,279 35,585 31,263 28,116 23,792 -15.4%
SLOVAKIA 400 710 837 1,769 1,686 1,749 2,522 2,083 1,985 2,186 10.1%
SLOVENIA 1,090 1,087 1,137 1,557 1,353 1,199 1,623 1,458 1,598 1,331 -16.7%
Sub-total EU 13 53,995 69,173 75,359 110,152 108,441 82,675 77,860 67,088 66,654 60,704 -8.9%
Sub-total EU 28 230,188 262,140 286,304 347,619 341,343 278,547 296,691 297,334 297,648 291,159 -2.2%
Other European Countries
ALBANIA 3,192 3,733 3,326 4,658 4,864 4,559 3,828 3,854 3,909 3,895 -0.4%
BELARUS 95 234 318 507 590 673 1,184 1,513 2,043 2,344 14.7%
BOSNIA HERZEGOVINA 176 694 405 331 176 170 3,156 3,384 3,139 3,034 -3.3%
KOSOVO 0 0 0 0 329 86 120 86 108 97 -10.2%
LIECHTENSTEIN 0 0 0 0 15 22 9 4 8 8 0.0%
MACEDONIA 5,043 4,640 4,625 5,891 6,728 6,674 6,080 5,412 5,029 4,589 -8.7%
MOLDAVIA 1,232 1,489 1,855 2,765 3,312 1,648 1,773 1,778 1,575 1,548 -1.7%
MONTENEGRO 0 0 0 51 417 348 368 411 396 294 -25.8%
NORWAY 327 360 470 530 570 545 744 681 789 855 8.4%
SERBIA 5,398 5,668 6,571 9,199 7,956 5,862 3,858 3,582 3,729 4,122 10.5%
SWITZERLAND 2,151 1,955 2,207 2,585 2,575 3,065 3,336 3,445 3,511 3,366 -4.1%
UKRAINE 1,761 2,894 3,064 3,678 6,192 4,704 4,976 5,404 5,421 5,159 -4.8%
Sub-total Other European Countries 19,375 21,667 22,841 30,195 33,724 28,356 29,432 29,554 29,657 29,311 -1.2%
TOTAL 249,563 283,807 309,145 377,814 375,067 306,903 326,123 326,888 327,305 320,470 -2.1%
Source: UND data
62
NORTHERN CYPRUS

Study on the economic impact of an agreement between the EU and the Republic of Turkey
Page 69
Table E.9 Number of loaded trips made by foreign vehicles from Turkey to each EU destination country
Destination Country 2010 2011 2012 2013 Change
EU 15 Countries
AUSTRIA 2,741 2,575 2,507 2,478 -1.2%
BELGIUM 2,038 1,573 1,771 1,493 -15.7%
DENMARK 946 1,126 874 976 11.7%
FINLAND 425 736 383 375 -2.1%
FRANCE 4,560 5,069 6,450 6,106 -5.3%
GERMANY 12,443 12,098 10,589 13,131 24.0%
GREECE 1,127 1,344 1,155 1,093 -5.4%
IRELAND 149 50 118 42 -64.4%
ITALY 2,928 3,052 2,982 3,349 12.3%
LUXEMBURG 3 18 6 22 266.7%
NETHERLANDS 1,933 1,796 1,861 1,948 4.7%
PORTUGAL 167 169 269 245 -8.9%
SPAIN 2,668 2,473 2,730 2,068 -24.2%
SWEDEN 307 322 315 473 50.2%
UK 2,219 1,643 1,634 1,631 -0.2%
Sub-total EU 15 34,654 34,044 33,644 35,430 5.3%
EU 13 Countries
BULGARIA 43,037 49,667 46,003 44,915 -2.4%
CROATIA 1,191 1,047 1,099 1,074 -2.3%
CYPRUS63
12,728 14,973 15,737 16,305 3.6%
CZECH REP. 3,611 4,198 5,178 5,423 4.7%
ESTONIA 237 336 542 785 44.8%
HUNGARY 2,949 3,848 4,305 4,718 9.6%
LATVIA 410 341 393 512 30.3%
LITHUANIA 1,297 1,277 1,535 1,426 -7.1%
MALTA No data available
POLAND 8,324 10,091 9,742 10,167 4.4%
ROMANIA 15,021 17,241 16,422 19,903 21.2%
SLOVAKIA 2,448 2,717 3,121 3,075 -1.5%
SLOVENIA 390 431 302 375 24.2%
Sub-total EU 13 91,643 106,167 104,379 108,678 4.1%
Sub-total EU 28 126,297 140,211 138,023 144,108 4.4%
Other European Countries
ALBANIA 560 651 813 1,024 26.0%
BELARUS 1,427 1,095 1,371 1,857 35.4%
BOSNIA HERZEGOVINA 1,473 1,696 2,145 2,483 15.8%
KOSOVO 58 62 119 177 48.7%
LIECHTENSTEIN 0 0 2 5 150.0%
MACEDONIA 7,936 6,666 7,114 7,427 4.4%
MOLDAVIA 2,371 5,594 6,172 6,079 -1.5%
MONTENEGRO 264 151 242 243 0.4%
NORWAY 27 52 80 96 20.0%
SERBIA 3,074 3,476 4,307 4,691 8.9%
SWITZERLAND 400 562 482 598 24.1%
UKRAINE 6,434 10,393 12,460 13,332 7.0%
Sub-total Other European Countries 24,024 30,398 35,307 38,012 7.7%
TOTAL 150,321 170,609 173,330 182,120 5.1%
Source: UND data
63
NORTHERN CYPRUS

Study on the economic impact of an agreement between the EU and the Republic of Turkey
Page 70
Table E.10 Market share of foreign and Turkish vehicles in import trips from Turkey’s western border to the
EU, by destination country
Destination Country
2010 2011 2012 2013
EU 15 Countries Foreign Vehicles
Turkish Vehicles
Foreign Vehicles
Turkish Vehicles
Foreign Vehicles
Turkish Vehicles
Foreign Vehicles
Turkish Vehicles
AUSTRIA 30.4% 69.6% 27.1% 72.9% 26.6% 73.4% 27.1% 72.9%
BELGIUM 22.1% 77.9% 16.0% 84.0% 18.0% 82.0% 15.9% 84.1%
DENMARK 30.2% 69.8% 37.3% 62.7% 27.8% 72.2% 32.1% 67.9%
FINLAND 36.7% 63.3% 54.8% 45.2% 39.9% 60.1% 40.5% 59.5%
FRANCE 14.1% 85.9% 15.0% 85.0% 18.7% 81.3% 18.0% 82.0%
GERMANY 13.4% 86.6% 11.8% 88.2% 10.8% 89.2% 13.3% 86.7%
GREECE 5.2% 94.8% 6.7% 93.3% 6.4% 93.6% 6.3% 93.7%
IRELAND 43.4% 56.6% 19.5% 80.5% 43.5% 56.5% 20.5% 79.5%
ITALY 7.8% 92.2% 7.8% 92.2% 7.3% 92.7% 7.6% 92.4%
LUXEMBURG 1.4% 98.6% 5.2% 94.8% 1.6% 98.4% 6.5% 93.5%
NETHERLANDS 15.2% 84.8% 14.1% 85.9% 13.4% 86.6% 15.5% 84.5%
PORTUGAL 38.8% 61.2% 48.0% 52.0% 59.5% 40.5% 47.1% 52.9%
SPAIN 26.0% 74.0% 25.7% 74.3% 25.1% 74.9% 16.5% 83.5%
SWEDEN 7.7% 92.3% 6.8% 93.2% 6.4% 93.6% 9.1% 90.9%
UK 12.0% 88.0% 9.5% 90.5% 8.7% 91.3% 8.8% 91.2%
Sub-total EU 15 13.7% 86.3% 12.9% 87.1% 12.7% 87.3% 13.3% 86.7%
EU 13 Countries
BULGARIA 74.2% 25.8% 82.0% 18.0% 78.9% 21.1% 79.0% 21.0%
CROATIA 41.1% 58.9% 40.5% 59.5% 39.5% 60.5% 43.6% 56.4%
CYPRUS64
72.8% 27.2% 82.8% 17.2% 81.6% 18.4% 83.7% 16.3%
CZECH REP. 53.0% 47.0% 52.2% 47.8% 58.4% 41.6% 62.1% 37.9%
ESTONIA 81.2% 18.8% 92.3% 7.7% 88.7% 11.3% 87.8% 12.2%
HUNGARY 40.9% 59.1% 50.5% 49.5% 57.3% 42.7% 56.8% 43.2%
LATVIA 78.1% 21.9% 68.8% 31.3% 70.1% 29.9% 74.7% 25.3%
LITHUANIA 90.3% 9.7% 83.5% 16.5% 77.1% 22.9% 72.1% 27.9%
MALTA No data available
POLAND 48.3% 51.7% 53.7% 46.3% 49.8% 50.2% 52.6% 47.4%
ROMANIA 29.7% 70.3% 35.5% 64.5% 36.9% 63.1% 45.5% 54.5%
SLOVAKIA 49.3% 50.7% 56.6% 43.4% 61.1% 38.9% 58.4% 41.6%
SLOVENIA 19.4% 80.6% 22.8% 77.2% 15.9% 84.1% 22.0% 78.0%
Sub-total EU 13 54.1% 45.9% 61.3% 38.7% 61.0% 39.0% 64.2% 35.8%
Sub-total EU 28 29.9% 70.1% 32.0% 68.0% 31.7% 68.3% 33.1% 66.9%
Other European Countries
ALBANIA 12.8% 87.2% 14.5% 85.5% 17.2% 82.8% 20.8% 79.2%
BELARUS 54.7% 45.3% 42.0% 58.0% 40.2% 59.8% 44.2% 55.8%
BOSNIA HERZEGOVINA 31.8% 68.2% 33.4% 66.6% 40.6% 59.4% 45.0% 55.0%
KOSOVO 32.6% 67.4% 41.9% 58.1% 52.4% 47.6% 64.6% 35.4%
LIECHTENSTEIN 0.0% 100.0% 0.0% 100.0% 20.0% 80.0% 38.5% 61.5%
MACEDONIA 56.6% 43.4% 55.2% 44.8% 58.6% 41.4% 61.8% 38.2%
MOLDAVIA 57.2% 42.8% 75.9% 24.1% 79.7% 20.3% 79.7% 20.3%
MONTENEGRO 41.8% 58.2% 26.9% 73.1% 37.9% 62.1% 45.3% 54.7%
NORWAY 3.5% 96.5% 7.1% 92.9% 9.2% 90.8% 10.1% 89.9%
SERBIA 44.3% 55.7% 49.2% 50.8% 53.6% 46.4% 53.2% 46.8%
SWITZERLAND 10.7% 89.3% 14.0% 86.0% 12.1% 87.9% 15.1% 84.9%
UKRAINE 56.4% 43.6% 65.8% 34.2% 69.7% 30.3% 72.1% 27.9%
Sub-total Other European Countries 44.9% 55.1% 50.7% 49.3% 54.3% 45.7% 56.5% 43.5%
TOTAL 31.6% 68.4% 34.3% 65.7% 34.6% 65.4% 36.2% 63.8%
Source: TRT elaboration on UND data (Number of EU’s import loaded trips made by Turkish/Foreign vehicles from Turkey to
each EU destination country)
64
NORTHERN CYPRUS

Study on the economic impact of an agreement between the EU and the Republic of Turkey
Page 71
Table E.11 Number loaded trips made by Turkish vehicles from each EU origin country to Turkey
COUNTRY OF LOADING 2010 2011 2012 2013 CHANGE
EU 15 Countries
AUSTRIA 5,248 5,641 6,301 4,361 -31%
BELGIUM 4,068 4,117 3,981 4,561 15%
DENMARK 730 942 939 886 -6%
FINLAND 567 502 471 489 4%
FRANCE 22,381 20,439 20,317 18,351 -10%
GERMANY 84,615 95,521 95,256 99,062 4%
GREECE 14,484 11,543 11,985 11,164 -7%
IRELAND 85 28 21 52 148%
ITALY 46,514 49,736 52,709 57,980 10%
LUXEMBURG 4 275 177 417 136%
NETHERLANDS 3,571 4,315 4,215 5,546 32%
PORTUGAL 43 106 95 227 139%
SPAIN 6,522 5,949 5,345 6,673 25%
SWEDEN 2,891 2,927 2,506 2,308 -8%
UK 6,917 7,455 6,023 5,405 -10%
Sub-total EU 15 198,640 209,496 210,341 217,482 3%
EU 13 Countries
BULGARIA 7,120 5,984 6,823 6,469 -5%
CROATIA 1,021 451 382 483 26%
CYPRUS65
1,846 532 666 544 -18%
CZECH REP. 2,190 2,468 1,789 2,151 20%
ESTONIA 17 15 27 47 74%
HUNGARY 5,365 4,848 4,656 4,545 -2%
LATVIA 1 11 22 26 18%
LITHUANIA 97 79 120 180 50%
MALTA No data available
POLAND 7,851 9,505 11,400 9,021 -21%
ROMANIA 17,471 22,489 22,870 18,884 -17%
SLOVAKIA 3,866 3,695 3,483 3,714 7%
SLOVENIA 3,266 4,275 4,746 3,754 -21%
Sub-total EU 13 50,111 54,352 56,984 49,818 -13%
Sub-total EU 28 248,751 263,848 267,325 267,300 0%
Other European Countries
ALBANIA 359 281 337 310 -8%
BELARUS 493 465 635 907 43%
BOSNIA HERZEGOVINA 744 603 732 671 -8%
KOSOVO 0 1 4 8 100%
LIECHTENSTEIN 0 0 0 1 -
MACEDONIA 1,059 730 391 423 8%
MOLDAVIA 340 239 289 173 -40%
MONTENEGRO 22 20 3 7 133%
NORWAY 302 362 439 522 19%
SERBIA 1,444 1,293 1,202 1,445 20%
SWITZERLAND 1,691 2,196 2,112 2,034 -4%
UKRAINE 1,725 2,853 2,820 5,807 106%
Sub-total Other European Countries
8,179 9,043 8,964 12,308 37%
TOTAL 256,930 272,891 276,289 279,608 1%
Source: UND data
65
NORTHERN CYPRUS

Study on the economic impact of an agreement between the EU and the Republic of Turkey
Page 72
Table E.12 Number of loaded trips made by foreign vehicles from each EU origin country to Turkey
COUNTRY OF Merchandise 2010 2011 2012 2013 CHANGE
EU 15 Countries
AUSTRIA 4,334 5,205 3,410 3,350 -2%
BELGIUM 1,065 1,047 936 1,069 14%
DENMARK 262 236 247 355 44%
FINLAND 636 314 467 418 -10%
FRANCE 2,917 4,471 3,811 4,161 9%
GERMANY 10,887 13,166 10,294 14,495 41%
GREECE 391 986 654 670 2%
IRELAND 147 45 12 49 308%
ITALY 3,975 4,977 4,716 5,046 7%
LUXEMBURG 4 23 24 103 329%
NETHERLANDS 2,145 1,934 1,912 2,567 34%
PORTUGAL 6 5 56 35 -38%
SPAIN 1,430 1,911 1,711 1,171 -32%
SWEDEN 252 339 327 514 57%
UK 666 569 518 651 26%
Sub-total EU 15 29,117 35,228 29,095 34,654 19%
EU 13 Countries
BULGARIA 34,164 38,843 36,098 35,598 -1%
CROATIA 188 447 229 340 48%
CYPRUS No data available
CZECH REP. 2,964 3,261 3,915 4,867 24%
ESTONIA 82 154 99 31 -69%
HUNGARY 5,594 8,362 9,084 8,655 -5%
LATVIA 28 77 73 85 16%
LITHUANIA 320 437 181 184 2%
MALTA No data available
POLAND 9,078 12,226 10,523 9,679 -8%
ROMANIA 9,930 13,741 15,226 18,747 23%
SLOVAKIA 4,094 3,586 4,781 4,082 -15%
SLOVENIA 994 1,440 1,422 1,904 34%
Sub-total EU 13 67,436 82,574 81,631 84,172 3%
Sub-total EU 28 96,553 117,802 110,726 118,826 7%
Other European Countries
ALBANIA 21 34 53 95 79%
BELARUS 651 769 1,138 1,299 14%
BOSNIA HERZEGOVINA 94 139 235 477 103%
KOSOVO 4 0 5 1 -80%
LIECHTENSTEIN 0 0 0 9 -
MACEDONIA 2,759 2,763 2,927 3,158 8%
MOLDAVIA 1,232 1,209 910 1,905 109%
MONTENEGRO 10 2 21 13 -38%
NORWAY 38 36 38 33 -13%
SERBIA 1,266 1,856 2,390 2,745 15%
SWITZERLAND 358 401 319 515 61%
UKRAINE 5,233 5,352 6,329 7,572 20%
Sub-total Other European Countries 11,666 12,561 14,365 17,822 24%
TOTAL 108,219 130,363 125,091 136,648 9%
Source: UND data

Study on the economic impact of an agreement between the EU and the Republic of Turkey
Page 73
Table E.13 Market shares of foreign and Turkish vehicles in exports from the EU to Turkey (western
border) by EU country of origin
Origin Country 2010 2011 2012 2013
EU 15 Countries Foreign Vehicles
Turkish Vehicles
Foreign Vehicles
Turkish Vehicles
Foreign Vehicles
Turkish Vehicles
Foreign Vehicles
Turkish Vehicles
AUSTRIA 45.2% 54.8% 48.0% 52.0% 35.1% 64.9% 43.4% 56.6%
BELGIUM 20.7% 79.3% 20.3% 79.7% 19.0% 81.0% 19.0% 81.0%
DENMARK 26.4% 73.6% 20.0% 80.0% 20.8% 79.2% 28.6% 71.4%
FINLAND 52.9% 47.1% 38.5% 61.5% 49.8% 50.2% 46.1% 53.9%
FRANCE 11.5% 88.5% 17.9% 82.1% 15.8% 84.2% 18.5% 81.5%
GERMANY 11.4% 88.6% 12.1% 87.9% 9.8% 90.2% 12.8% 87.2%
GREECE 2.6% 97.4% 7.9% 92.1% 5.2% 94.8% 5.7% 94.3%
IRELAND 63.4% 36.6% 61.6% 38.4% 36.4% 63.6% 48.5% 51.5%
ITALY 7.9% 92.1% 9.1% 90.9% 8.2% 91.8% 8.0% 92.0%
LUXEMBURG 50.0% 50.0% 7.7% 92.3% 11.9% 88.1% 19.8% 80.2%
NETHERLANDS 37.5% 62.5% 30.9% 69.1% 31.2% 68.8% 31.6% 68.4%
PORTUGAL 12.2% 87.8% 4.5% 95.5% 37.1% 62.9% 13.4% 86.6%
SPAIN 18.0% 82.0% 24.3% 75.7% 24.2% 75.8% 14.9% 85.1%
SWEDEN 8.0% 92.0% 10.4% 89.6% 11.5% 88.5% 18.2% 81.8%
UK 8.8% 91.2% 7.1% 92.9% 7.9% 92.1% 10.7% 89.3%
Sub-total EU 15 12.8% 87.2% 14.4% 85.6% 12.2% 87.8% 13.7% 86.3%
EU 13 Countries
BULGARIA 82.8% 17.2% 86.7% 13.3% 84.1% 15.9% 84.6% 15.4%
CROATIA 15.6% 84.4% 49.8% 50.2% 37.5% 62.5% 41.3% 58.7%
CYPRUS66
No data available
CZECH REP. 57.5% 42.5% 56.9% 43.1% 68.6% 31.4% 69.4% 30.6%
ESTONIA 82.8% 17.2% 91.1% 8.9% 78.6% 21.4% 39.7% 60.3%
HUNGARY 51.0% 49.0% 63.3% 36.7% 66.1% 33.9% 65.6% 34.4%
LATVIA 96.6% 3.4% 87.5% 12.5% 76.8% 23.2% 76.6% 23.4%
LITHUANIA 76.7% 23.3% 84.7% 15.3% 60.1% 39.9% 50.5% 49.5%
MALTA No data available
POLAND 53.6% 46.4% 56.3% 43.7% 48.0% 52.0% 51.8% 48.2%
ROMANIA 36.2% 63.8% 37.9% 62.1% 40.0% 60.0% 49.8% 50.2%
SLOVAKIA 51.4% 48.6% 49.3% 50.7% 57.9% 42.1% 52.4% 47.6%
SLOVENIA 23.3% 76.7% 25.2% 74.8% 23.1% 76.9% 33.7% 66.3%
Sub-total EU 13 57.4% 42.6% 60.3% 39.7% 58.9% 41.1% 62.8% 37.2%
Sub-total EU 28 28.0% 72.0% 30.9% 69.1% 29.3% 70.7% 30.8% 69.2%
Other European Countries
ALBANIA 5.5% 94.5% 10.8% 89.2% 13.6% 86.4% 23.5% 76.5%
BELARUS 56.9% 43.1% 62.3% 37.7% 64.2% 35.8% 58.9% 41.1%
BOSNIA HERZEGOVINA 11.2% 88.8% 18.7% 81.3% 24.3% 75.7% 41.6% 58.4%
KOSOVO 100.0% 0.0% 0.0% 100.0% 55.6% 44.4% 11.1% 88.9%
LIECHTENSTEIN - - - - - - 90.0% 10.0%
MACEDONIA 72.3% 27.7% 79.1% 20.9% 88.2% 11.8% 88.2% 11.8%
MOLDAVIA 78.4% 21.6% 83.5% 16.5% 75.9% 24.1% 91.7% 8.3%
MONTENEGRO 31.3% 68.8% 9.1% 90.9% 87.5% 12.5% 65.0% 35.0%
NORWAY 11.2% 88.8% 9.0% 91.0% 8.0% 92.0% 5.9% 94.1%
SERBIA 46.7% 53.3% 58.9% 41.1% 66.5% 33.5% 65.5% 34.5%
SWITZERLAND 17.5% 82.5% 15.4% 84.6% 13.1% 86.9% 20.2% 79.8%
UKRAINE 75.2% 24.8% 65.2% 34.8% 69.2% 30.8% 56.6% 43.4%
Sub-total Other European Countries 58.8% 41.2% 58.1% 41.9% 61.6% 38.4% 59.2% 40.8%
TOTAL 29.6% 70.4% 32.3% 67.7% 31.2% 68.8% 32.8% 67.2%
Source: TRT elaboration on UND data (Number of EU’s export loaded trips made by Turkish/Foreign vehicles to Turkey from
each origin country)
66
NORTHERN CYPRUS

Study on the economic impact of an agreement between the EU and the Republic of Turkey
Page 74
E.2 Turkish legislation and its alignment with the EU acquis
Access to the market and the profession In the area of access to the market and the profession, theTurkish legislative framework is defined by:
the Road Transport Law67
; Road Transport Regulation68
; and Regulation on Training for Professional
Competence in Road Transport Operations. This legislation introduces:
• Conditions for admission to occupation and market access;
• A new licensing system/mechanism for transport operations;
• Rights, responsibilities and obligations for the carriers and transport undertakings as well as
consumers/users;
• Rules regarding competition in the sector and rules for control and inspection;
• Rights, responsibilities and obligations of the personnel who work in transport sector;
• Rules and procedures for training and obtaining the Professional Competence Certificate;
• Rules and procedures for transport of dangerous goods by road.
Turkey has its own authorization system for road transport operators that is based on requirements
that are consistent with Regulation (EC) No 1071/2009, but Turkish legislation is only partially
harmonized with the EU acquis. Full harmonization to EU norms shall be considered in context of
accession.
Social aspects of road transport activities In Turkey three authorities have responsibilities in setting rules for driving and rest times, and their
enforcement. These authorities are:
• the Ministry of Labour and Social Security (MoLSS), which is in charge of the definition of norms
on working time and, therefore, on driving times and rest periods;
• the Ministry of Interior (Road Traffic Police), which is responsible for the enforcement of such
rules; and
• the Ministry of Industry and Trade, which is responsible for establishing the technical specifications
for recording equipment (tachographs).
Working time, driving times and rest periods are governed by three main pieces of legislation:
• Labour Law69
. This law, which came into effect in 2003, regulates rights and obligations
concerning working conditions and the work environment of employers and workers employed with
a labour contract. Self-employed drivers are excluded from the scope of this law;
• Law on Working Time70
. This law, enacted in 2004, describes the principles governing the
application of working time. It defines working time as the period of time the employee spends at
the workplace. As with the Labour Law, self-employed drivers are excluded from its scope;
67
See previous note 29 on page 48. 68
See previous note 30 on page 48. 69
Labour Law No 4587 of 10 June 2003 (Official Gazette of the Republic of Turkey No 25134 of 10 June 2003). 70
Law on Working Time (Official Gazette of the Republic of Turkey No 25425 of 6 April 2004).

Study on the economic impact of an agreement between the EU and the Republic of Turkey
Page 75
• Road Transport Regulation71
. Adopted in 2004, this law applies to all drivers (including self-
employed) of vehicles that either carry goods for commercial purposes and whose weight limit
exceeds 3.5 tonnes, or which transport passengers for commercial purposes and whose transport
capacity exceed 9 persons, including the driver.
Turkey has also ratified (in 2003) the ILO Convention concerning Hours of Work and Rest Periods in
Road Transport. It is a signatory to the AETR Agreement and in 2013 became party to Amendment
Packages No. 4, 5 and 6 among the aims of which are monitoring of the implementation of the
Agreement, the mandatory use of the digital tachograph and the improvement of road and traffic
control safety. Once this process is completed, regulation of working and resting periods will be
aligned with the EU, and Turkey will have remedied its deficiencies regarding inspection.
Driving time and rest periods are governed by national rules which are almost aligned to the AETR
rules. Given that the AETR rules are strongly aligned with Regulation (EC) No 561/2006, it can be
argued that the Turkish legislation approximates closely to the corresponding EU acquis, though
studies on further harmonisation of the national legislation by Ministry of Labour and Social Security
and are still continuing. Equally, it is also worth underlining that self-employed drivers are still excluded
from the scope of the Labour Law cited above and, therefore, the regulatory setting in this domain
cannot be considered aligned to the EU acquis under the provisions laid down in Directive
2002/15/EC. Table E.19 compares the Turkish, AETR and EU regulation of driving times and rest
periods.
The Ministry of Transport, Maritime Affairs and Communications is the national authority responsible
for the implementation of the digital tachograph in Turkey. Article 3-(1) of the Takograf Cihazları
Muayene Ve Damgalama Yönetmeliği governs the transition from analogue to digital tachograph
devices. In compliance with the AETR rules, and by enacting the By-law on “Tachograph Devices
used in International Road Transport72
”, Turkey has made mandatory, since 1 January 2011, the fitting
of digital tachograph for all commercial vehicles engaged in both international freight (goods vehicles
with mass above 3.5 tonnes) and passenger (buses carrying more than nine people including the
driver) transport operations. Turkey has then achieved its adaptation to the tachograph system by
completing the required legal and structural harmonization and the system is now fully operational.
Statutory fitting of such devices for domestic operations applies from 30 June 2014 as required by the
by-law on “Inspection and Sealing of Recording Equipment”73
and the by-law on “Recording
Equipment Workshop Services”74
but, while newly registered vehicles will have to be equipped with a
digital tachograph, older vehicles will be required to gradually equip digital tachographs within a five
year period (until 2017).
71
See previous note 30. 72
By-law on “Tachograph Devices used in International Road Transport” (Official Gazette of the Republic of Turkey Jo 27587 of 21 May 2010). 73
By-law on “Inspection and Sealing of Recording Equipment” (Official Gazette of the Republic of Turkey No 28171 of 12 January 2012. 74
By-law on “Recording Equipment Workshop Services” (Official Gazette of the Republic of Turkey No 28204 of 14 February 2012).

Study on the economic impact of an agreement between the EU and the Republic of Turkey
Page 76
Table E.14 Comparison between domestic, AETR and EU rules governing driving times and rest periods
Item Domestic provision AETR provision EU provision
Daily driving time Maximum 9 hours. Maximum 9 hours. This
may be extended to 10
hours not more than twice
during the week.
Maximum 9 hours. This
may be extended to 10
hours not more than twice
during the week.
Daily rest At least 11 hours of
consecutive rest (regular
daily rest period). This
may be reduced to a
minimum of 9 consecutive
hours not more than 3
times in a week.
At least 11 hours of
consecutive rest (regular
daily rest period). This
may be reduced to a
minimum of 9 consecutive
hours not more than 3
times in a week.
At least 11 hours of
consecutive rest (regular
daily rest period). This
may be split into two
periods of at least 3 and 9
uninterrupted hours
respectively.
Weekly rest 24 hours. 45 consecutive hours.
This may be reduced to a
minimum of 36
consecutive hours if taken
at the place where the
vehicle or the driver is
normally based, or to a
minimum of 24
consecutive hours if taken
elsewhere.
45 consecutive hours.
This may be reduced to a
minimum of 24
consecutive hours if
compensated for by an
equivalent period of rest
taken in one block before
the end of the third week
following the week in
question. The
compensating rest must
be attached to a period of
rest of at least 9 hours.
Break 45 minutes after a driving
period of 4.5 hours. This
break may be replaced by
breaks of at least 15
minutes each distributed
over the driving period.
45 minutes after a driving
period of 4.5 hours. This
break may be replaced by
breaks of at least 15
minutes each distributed
over the driving period or
immediately after this
period.
45 minutes after a driving
period of 4.5 hours. This
break may be replaced by
a break of at least 15
minutes followed by a
break of at least 30
minutes each distributed
over the driving period.
Source: Compiled by the authors based on Turkish legislation, AETR Agreement and Regulation (EC) No 561/2006
Driving licenses On 22 January 2013 Turkey became a signatory party of the Vienna Convention on Road Traffic as
well as of the European Agreement75
supplementing this Convention. This Convention has been
ratified by means of Law No. 6299 “Ratifying Our Accession to the Convention on Road Traffic and the
European Agreement Supplementing This Convention”76
. This required amendment of the Law on
Road Transport No 2918 by adopting Law No 6495 “Amending Certain Laws and Decree Laws”77
, a
change which harmonized driving licences issued in Turkey with those in EU and international
recognition thereof. Studies are to identify procedures to ensure effective implementation of the new
regulations are in progress.
75
The European Agreement supplementing the Convention, which was concluded under UNECE auspices in 1971, is aimed at achieving greater uniformity in the rules governing road traffic in Europe. To this end, the European Agreement establishes road safety standards that are stricter than those of the Convention. It also makes obligatory provisions that are of recommendatory nature in the Convention. 76
By-law No 6299 (Official Gazette of the Republic of Turkey No 28288 of 10 May 2012). 77
By-law No 6495 (Official Gazette of the Republic of Turkey No 28726 of 2 August 2013).

Study on the economic impact of an agreement between the EU and the Republic of Turkey
Page 77
Technical standards (maximum weights and dimensions of commercial vehicles) Article 128 of the Road Transport Regulation and the Law on “Procedures for Loading of Road
vehicles78
” regulate the weight and dimensions of vehicles and vehicle combinations. Their provisions
are fully aligned to Directive 96/53/EC, as also illustrated by the comparison between national and EU
requirements as reported in Table E.20 and Table E.21.
Table E.15 Comparison between domestic and EU rules governing permissible maximum dimension (in
metres)
Country Height Width
Length
Lorry on trailer Road Train Articulated
vehicle
EU-28 4 m 2.55 m 12 m 18.75 m 16.5 m
Turkey 4 m 2.55 m 12 m 18.75 m 16.5 m
Source: Compiled by the authors based on Turkish legislation and EU Directive 96/53/EC
Table E.16 Comparison between domestic and EU rules governing permissible maximum weight of
commercial vehicles (in tonnes)
Country
Weight
per
bearing
axle
Weight
per drive
axle
Lorry 2
axles
Lorry 3
axles
Road-train
4 axles
Road-train
5 or more
axles
Articulated
vehicle 5
or more
axles
EU-28 10 11.5 18 26 36 40 40
Turkey 10 11.5 18 25 32 40 40
Source: Compiled by the authors based on Turkish legislation and EU Directive 96/53/EC
The legal base is further complemented by alignment to the provisions of the UNECE International
Convention on the Harmonization of Frontier Controls of Goods that Turkey ratified in 2006. Annex 879
(“Facilitating border crossing procedures for international road transport”), which entered into force in
2008, introduced a set of new measures aiming at simplifying and coordinating a large number of
administrative procedures, including those dealing with:
• the technical control of road vehicles, by accepting the International Technical Inspection
Certificate; and
• the acceptance of the International Vehicle Weight Certificate.
In 2012 a new circular80
was issued for scrapping commercial vehicles manufactured before 1990.
This circular resulted in the scrapping of 107,052 buses, trucks, oil tankers, tow trucks, minibuses and
small trucks.
Technical standards (speed limitation devices) The fitting of speed limitation devices has been made compulsory for certain types of vehicles
following the adoption in January 2014 of an amendment81
to the Law on Road Transport.
78
By-law on “Procedures for Loading of Road Vehicles (Official Gazette of the Republic of Turkey No 28461 of 8 November 2011). 79
The amendments to Annex 8 have been transposed into the EU acquis by means of Council Decision 2009/161/EC of 25 September 2008 Approving on behalf of the Community Annex 8 to the International Convention on the Harmonisation of Frontier Controls of Goods. 80
Communiqué No. 66 on the Withdrawal of Certain Road Motor Vehicles from Traffic ((Official Journal of Turkey No 28470 of 17 November 2012).

Study on the economic impact of an agreement between the EU and the Republic of Turkey
Page 78
Transport of dangerous goods Turkey has been a contracting party of the European Agreement concerning the International Carriage
of Dangerous Goods by Road (commonly known as the ADR Agreement) since 22 February 2010.
Entering this agreement has made it possible for Turkey to overcome the main obstacle to alignment
to the EU legislation in this field.
The provisions set by the ADR Agreement were transposed into the national legislation by the
adoption in 2007 of the By-law on “Carriage of Dangerous Goods by Road”, later replaced on 1
January 2014 by a new law82
that defines an updated regulatory framework for the carriage of
dangerous goods by road. Also procedures and principles governing the liability, obligations and
labour conditions of the parties involved in the carriage of dangerous goods are provided.
However, as noted by the latest EC progress report for Turkey (EC, 2013), dangerous goods transport
remains an area of concern in the light of the insufficient number of competent staff in the newly
established Directorate General for Dangerous Goods, despite a marked increase in the number of
road checks.
81
By-law amending the Law on Road Transport (Official Gazette of the Republic of Turkey No 28918 of 19 February 2014). 82
By-law on “Carriage of Dangerous Goods by Road” (Official Gazette of the Republic of Turkey No 28801 of 24 October 2013.

Study on the economic impact of an agreement between the EU and the Republic of Turkey
Page 79
Appendix F. Impact assessment methodology
In this section we describe the approach used to evaluate the liberalisation scenarios. We apply two
key methodologies: (i) the econometric gravity model for the estimation of trade and transport flows
and (ii) the input-output analysis which allows the study of economy-wide and sector-specific
consequences of the liberalisation scenarios. In the following we describe both methods as well as the
background of the baseline scenario.
F.1 Methods
Gravity equation estimation The first step in the analysis is the estimation of transport flows in the absence of the current bilateral
agreements on road transport, which pose an additional barrier to trade between Turkey and the EU
Member States. This additional trade restriction (in addition to other key barriers, such as distance,
waiting time at the border, tariffs) arises if the number of transport permits allocated to the hauliers is
substantially less than the demand for road transport accompanying trade between the countries, but
also if the process of obtaining permits is bureaucratic and imposes substantial time costs and direct
monetary costs.
For the purpose of determining the theoretical trade flows in the absence of bilateral quotas we turn to
the well-known approach of a gravity model. This approach is known to provide a very good fit to real
world trade and transport data. At the core of the model is a view of trade between two countries as
resulting from their mere “mass” in terms of economic activity (total supply of goods and total demand
for goods). The larger the two countries, the larger will the trade flow between them be, all other
factors left aside. Trade is facilitated by geographical and cultural proximity, and is suppressed by
border barriers. The gravity model takes both types of effects into account by including distance as an
explanatory variable, as well as including different types of factors determining the height of border
barriers (common language, common land border, trade agreements and alike). More factors may be
included in the model in order to reflect other specific features of trade between the countries.
In order to estimate the parameters of the gravity model for the liberalisation scenarios, the data for
Turkey cannot be used since its trade has been subject to the constraints of the bilateral agreements.
Rather, we need to select a country that is already integrated in the EU road freight market. After a
preliminary analysis considering several alternatives, we selected to use data on Poland in order to
estimate the parameters of the gravity relationship under the conditions of quota-free transport. The
fact that Poland is an EU member, while Turkey is not, is an important difference. However, no large
neighbouring country with liberalized transport relations (Switzerland, Norway) can be used as a good
approximation for Turkey for the purposes of this analysis. Moreover, the customs union between
Turkey and the EU improves the comparability of trade relations of Poland and Turkey with the EU.
For the projection of Turkey’s trade under the liberalisation scenarios, the estimated gravity model is
used with the data corresponding to Turkey (GDP, trade distances and bordering countries). An
additional factor used for the estimation of Turkey’s road exports in the liberalisation scenario is the
population having Turkish roots per country. This is an important factor for Germany, Bulgaria,
Netherlands, Austria, and France.
The regression model for Poland has the following form:
( ) ( ) ( ) ( )
where Poland (and later Turkey) is denoted with letter and the partner country with (for );
is the error term and contains all unknown explanatory factors. The distance taken is the weighted
(regional GDPs as weights) least distance per road between countries, for most countries this is close
to simple distance between capital cities. Additionally, we include two dummy variables which allow to

Study on the economic impact of an agreement between the EU and the Republic of Turkey
Page 80
consider whether the trading partner has a large international sea port and whether the trading
partners share a common border.
The data used for the gravity model are:
(i) countries’ GDP: Eurostat, IMF;
(ii) transport flows from Poland: Eurostat (International annual road freight transport - goods
loaded in reporting country, by group of goods and type of transport (1 000 t), from 2008
onwards;
(iii) port: 1 for Germany (Hamburg), Belgium (Antwerp), Netherlands (Rotterdam), France
(Marseille).
We estimated the regression for Poland using data from the period 2009-2012. The regression
provided a very good fit, explaining more than 95% of variation in the road export flows.
Table F.1 Gravity model parameter estimates for Poland
Variable Coefficient
(standard error)
Log GDP Poland 0.79 (0.17)
Log GDP destination 0.82(0.09)
Log distance -2.10 (0.33)
Common border 0.76 (0.34)
Intercontinental port 0.64 (0.32)
These results are then applied to Turkey. We replace the GDP of Poland by the GDP of Turkey and
replace all the distances to the trading partners, starting now from Istanbul. All GDP values are
projected up to 2016 using the IMF forecast. The Turkish hauliers in the full liberalisation scenario are
assumed to face the same freedom of bilateral trade and transit as the EU hauliers.
Input-output analysis The input-output analysis is a quantitative economic technique which represents the
interdependencies between the branches of an economy. It can be used to study the response of the
different sectors of an economy to a change in one given sector.
The input-output model goes back to Wassily Leontief, who in 1936 published the first input-output
table for the U.S. economy from the year 1919. Since then, a variety of international, national and
regional tables have been created. Due to their central importance for the national accounting,
Leontief was awarded in 1973 with the Nobel Prize.
As part of the input-output approach, a distinction is made between the descriptive evaluation of the
input-output table and the input-output analysis. In the last, assumptions based on the economic
theory of production are considered in the computations conducted.
Next, (i) the structural design of the input-output table is described, (ii) the concept behind the input-
output analysis is explained and (iii) the data used for the purposes of input-output analysis is
presented.
(i) Structural design of the input-output table
Input-output tables present in a systematic way all economic activities undertaken in a country. They
show how goods and services produced by a certain industry in a given year are distributed among
the industry itself, other industries, households, etc., and present the results in a matrix (row and
column) format. In this way, the input-output table summarises the inputs and outputs of all domestic

Study on the economic impact of an agreement between the EU and the Republic of Turkey
Page 81
economic sectors and describes the production processes and the transactions in the economy.
Figure F.1 shows a schematic diagram of the input-output table (IOT).
Figure F.1 Schematic diagram of the input-output table (IOT)
Demand sector (buyer)
Supply sector (seller)
Intermediate demand Final demand
To
tal d
em
an
d
Prim
ary
se
cto
r
Seco
nd
ary
se
cto
r
Te
rtia
ry s
ecto
r
Con
su
mptio
n
Investm
ent
Expo
rts
Intermediate input
Primary
sector
Intermediate input
matrix
(1st quadrant)
Final demand matrix
(2nd
quadrant)
Secondary
sector
Tertiary
sector
Total …. Intermediate demand Final demand
Gross value added
components
…
Primary input matrix
(3rd
quadrant)
…
…
Total demand equals
total supply
Imports
Total supply
The intermediate input matrix describes the interdependencies between the economic activities. For
example, the columns show the domestic intermediate goods consumed by the corresponding
activities.
In addition to the intermediate demand of goods used as inputs, the input-output table also gives the
final demand. The matrix of final demand provides the distribution of the produced goods between the
elements of the final demand, namely: public and private consumption, investments and exports.
The third quadrant represents the primary input matrix. This primarily includes salaries, and the net
operating surplus.
(ii) Concept behind the input-output analysis
In contrast to the descriptive analysis, the input-output analysis (IOA) is a model-based evaluation of
the input-output table. The underlying assumptions in the standard static model are:
changes over time are not considered (constant production technologies);
each group of commodities is supplied by only one production sector;
linear homogeneous production technologies (factor input quantities change proportionally to
the output changes);
homogeneous output within a sector (produced goods within a sector are of identical quality);

Study on the economic impact of an agreement between the EU and the Republic of Turkey
Page 82
heterogeneous production processes between economic sectors.
The starting point for the static model is the following equation system based on the input-output table:
Where represent the elements of the intermediate input matrix; is the total final demand for the
group of commodities of the sector; and is the total demand (which is equal to total supply) for the
products of the sector.
Then, it is possible to compute the coefficients, , which show the direct purchases by each sector
from every other sector. Due to the assumption of linear homogenous production techniques the
following can be expressed with:
Thus, the above system of equations can be represented as follows:
In matrix notation, this equation corresponds to system:
The solution of this equation system is then:
( )
( ) ( ) ( )
( )
Where denotes the identity matrix.
The matrix ( ) is also called the Leontief inverse and is of central importance since it gives the
direct and indirect input requirements per unit (i.e. 1 euro) of total demand. In this way, the
consequences of a new vector of total final demand can be analysed by computing:
( )
which gives the changes in total supply.
The analysis can be expanded to consider also the employment effects. In this case, the employment
data per economic sector is required. For example, let , for , be the vector containing
the corresponding data (in number of persons employed) for each sector . Then, the change in
employment by sector, can be found using the following formula:

Study on the economic impact of an agreement between the EU and the Republic of Turkey
Page 83
(iii) Data used
The IOT used for the analysis is obtained from the World Input-Output Database (WIOD). We use
Turkey’s IOT from 2011. It provides information about the interrelationship between 35 economic
sectors. For the purpose of reporting, we have aggregated some of the sectors and this aggregated
IOT is presented in Table F.2.
Table F.2 The Turkish IOT in current prices for 2011
Source: compiled by authors based on the WIOD
For the analysis of the employment effects two data sources are used: (i) the Turkish Statistical
Institute (TurkStat) which gives aggregated data for 18 sectors for the period 2009-2013, and (ii) the
WIOD which gives data for 35 sectors but for the period 1995-2009. We used both sources to
disaggregate the most recent data from TurkStat based on the ratios of the disaggregated sectors with
respect to totals of aggregated sectors from WIOD. In this way, a disaggregated database of
employment is generated for the year 2013.
The data disaggregated to 35 sectors, IOT (2011) and employment data (2013), are used for the
analysis. However, for simplicity, aggregated data are presented in 10 sectors.
Table F.3 Turkish employment data for 2013 (no. of people in thousands)
Source: compiled by authors based on WIOD and TurkStat data
Ag. Min. Man. Util. Cons. Whl. Hot. Trans. Post Oth. Total Consumpt. Invest. Exports Total
Ag. 11,610 87 35,241 5 23 135 3,107 58 3 841 51,109 39,587 1,665 6,321 47,573 98,682
Min. 52 390 8,523 2,420 1,054 645 90 10 23 343 13,551 2,241 1,153 2,601 5,995 19,546
Man. 6,524 1,582 127,224 1,279 15,997 4,101 6,133 7,294 1,220 19,573 190,926 127,031 35,234 128,117 290,382 481,308
Util. 706 684 7,228 19,425 1,010 1,729 1,163 251 352 3,980 36,528 8,703 409 747 9,860 46,387
Const. 179 35 161 135 938 293 52 72 92 2,371 4,329 419 71,777 2,642 74,837 79,167
Whl. 4,914 1,295 45,649 1,782 6,340 5,440 2,017 7,444 755 8,233 83,869 35,236 19,856 279 55,371 139,240
Hot. 23 183 504 51 136 1,081 59 2,560 47 1,026 5,669 33,744 127 12 33,884 39,553
Trans. 2,425 916 26,924 1,012 3,413 7,942 1,939 33,186 908 7,809 86,475 63,821 11,312 10,928 86,062 172,536
Post 26 77 1,263 59 194 3,421 268 1,208 1,349 2,969 10,835 14,561 99 331 14,991 25,826
Oth. 1,983 873 15,295 698 3,140 16,017 2,912 8,115 5,343 34,047 88,422 217,946 4,850 5,041 227,837 316,259
Imports 4,165 953 65,414 979 9,473 5,201 2,750 13,043 992 10,244
Total 32,607 7,076 333,426 27,844 41,716 46,005 20,491 73,241 11,086 91,437
Gross v.a. 66,075 12,471 147,882 34,367 37,450 93,236 19,063 99,296 14,740 224,822
98,682 19,546 481,308 62,210 79,167 139,240 39,553 172,536 25,826 316,259
Intermediate Demand Final Demand Total
demand
Total supply
Inte
rme
dia
te i
np
uts
Turkey (2013)
Agriculture, forestry and fishing 6,015
Mining and quarrying 105
Manufacturing 4,632
Electricity, gas, steam, water supply, sewerage etc 218
Construction 1,782
Wholesale and retail trade 3,518
Accommodation and food service activities 1,308
Transportation and storage 1,152
Information and communication 254
Others 6,539
Total 25,523

Study on the economic impact of an agreement between the EU and the Republic of Turkey
Page 84
F.1.1 Background of the business as usual scenario
Current situation and outlook The ‘business as usual scenario’ represents the situation in which the quota system and the permits
granted are entered as they are today and projected to 2016, without an active role in the
management of permits foreseen for the EC. This baseline serves as the reference scenario for the
evaluation of the consequences of the liberalisation scenarios simulated.
We summarise the current situation including main developments of the Turkish economy and of the
trade facilitated by the road transport between Turkey and the EU. This summary is the basis for the
projection of the import trips from Turkey to the EU and of the development of the issued permits until
2016. For more details on past developments see Section 3.
Turkey’s economy is growing at a higher rate than the EU’s economy. This pattern is observed in the
past data and projected to continue in the near future (see Figure F.2).
Figure F.2 Real GDP index in Turkey and the EU from 2005 to 2019
Note: ‘h’ in the time axis denotes historic and ‘p’ projection. Base year 2005 =100; Source: compiled by authors based on IMF
data, World Economic Outlook (WEO) 2014
The imports from Turkey show a clear positive trend and it can be expected that they will continue to
grow, taking into consideration the positive GDP growth projection for 2014 to 2016. However, the
imports from Turkey to the EU were reasonably stable from 2009 to 2013, resulting in a decrease of
the share of exports destined to the EU (see Figure F.3).
100
110
120
130
140
150
160
170
180
Turkey EU

Study on the economic impact of an agreement between the EU and the Republic of Turkey
Page 85
Figure F.3 Turkish exports and share of exports with destination in the EU
Source: compiled by authors based on Turkstat data, foreign trade statistics database
The share of Turkey’s exports destined for the EU that are carried by road has slightly increased from
approximately 45% in 2008 to 50% in 2013. This is probably the result of a negative development in
the trade balance of Turkey with the EU. There was also an increase in trips from the EU to Turkey
that carried Turkish products on their way return leg back to the EU. This trade might otherwise have
been covered by the Turkish transport sector (i.e. by sea). In this way, the share of road transportation
increases without significant changes in the absolute number of trips. A decrease of the share of
Turkish exports covered by sea is also recorded.
The EU has been losing market share in total Turkish road exports. The latter shows a clear positive
trend while the quantity of road trips (by Turkish vehicles) to the EU remains constant (see Figure F.4).
Figure F.4 Total Turkish road exports and market share of Turkish vehicles going to the EU
Source: compiled by authors based on UND data
36
38
40
42
44
46
48
50
0
20,000
40,000
60,000
80,000
100,000
120,000
140,000
Share
(in
%)
Export
s (
in m
illion €
)
TUR total exports (left axis)
TUR exports to the EU (left axis)
Share of TUR exports to EU (right axis)
0
5
10
15
20
25
30
35
40
45
0
200,000
400,000
600,000
800,000
1,000,000
1,200,000
1,400,000
EU
share
(in
%)
No. of export
trips
Total (all destinations)
Destination EU
Share of freights to EU

Study on the economic impact of an agreement between the EU and the Republic of Turkey
Page 86
The number of export trips covered by Turkish vehicles from Turkey to the EU has remained fairly
constant, which gives an indication that the quota system may be posing a constraint for the Turkish
road transport industry. Key countries for which the number of used bilateral and transit permits comes
very close to the total number of issued permits (thus giving an indication of where the trade constraint
might be binding) are Austria, Italy, Hungary, Slovenia, Croatia, Romania, and Spain (see Figure F.5).
Figure F.5 Countries indicating constraints to the Turkish road transportation sector
Permits issued and used in 2012 (No. of trips) Countries with permit use higher than 85%
Note: in the diagram on the right the red colour denotes countries with a permit use rate higher than 90%, yellow
denotes countries with permit use rates higher or equal to 85% and below 90%, different shades of blue and grey
denote countries with use rates below 85%.
Source: compiled by authors based on UND data
Finally, Figure F.6 shows that for the countries with high shares of permits used, the number of
permits issued varies. For Austria it increased in 2010 and has been falling since; Slovenia’s permits
seem to remain around the 2010 level; Romania’s permits are reasonably constant since 2011;
Hungary had two consecutive years of increase since 2011; and Italy and Croatia remain constant.
For Croatia only data since 2011 are presented.
0
20,000
40,000
60,000
80,000
100,000
120,000
140,000
160,000
180,000
200,000
AT
BG
HR
CZ
DK
DE
GR
HU IT RO
SK
SL
ES
Permits issued (2012)
Permits used (estimated)
282,000

Study on the economic impact of an agreement between the EU and the Republic of Turkey
Page 87
Figure F.6 Development of permits issued in selected countries (index, 2009=100)
Source: compiled by authors based on UND data
The brief description of the ‘business as usual scenario’ shows that Turkey is increasing exports to
destinations other than the EU. Furthermore, it is clear that the moderate increase of Turkish exports
per road to the EU is being covered by EU-registered vehicles. As a consequence, for the projection
period until 2016 it is assumed that the exports trips per road from Turkey to the EU will grow more
slowly than the GDP growth. In contrast, the trips by EU vehicles carrying Turkish exports are
assumed to further increase following the GDP development.
The number of permits issued according to the bilateral agreements seems to vary over time at the
country level. However, it is difficult to identify clear trends. In consequence, the total number of
permits issued for Turkish vehicles by individual Member States is assumed to remain constant until
2016.
Another important question to address in the scenario description is what happens to the costs of the
Turkish operators. Here, we lack relevant time series data. In the absence of such data, we assume
that the labour costs of Turkish hauliers change in line with the historical development of real labour
cost (4% p.a., according to TurkStat). Other cost components are assumed to remain constant in real
terms.
F.2 Estimation of the transit traffic distribution for 2012
The key question for the evaluation of the liberalisation scenarios is: does the current quota system
make transport operators deviate from optimal behaviour, and in what way? Section 2 described the
existing system of market access and transit quotas that derives from the set of bilateral agreements
signed between the EU Member States and Turkey. Data on the number of permits issued by every
Member State have been gathered as well as data on their usage. The usage of permits data can
actually be interpreted as giving the number of trucks that enter and cross each of the Member States
on the way from Turkey to the final destination. In addition, data have been gathered on the actual
export trips by Turkish trucks to all EU Member States and to other countries. Unfortunately, no
precise data exist on the distribution of these trips across different alternative routes.
From the perspective of any individual Turkish transport operator, the trucks should take the cheapest
route (taking account of the time costs) from the point of loading to the point of unloading of the carried
goods. By default, one would expect all transport operators to follow this simple rule. In reality,
quantitative restrictions as well as high transit permit charges make operators deviate from the optimal
routes.
60
70
80
90
100
110
120
130
140
150
160
2009 2010 2011 2012 2013
AT HR HU IT SL RO

Study on the economic impact of an agreement between the EU and the Republic of Turkey
Page 88
As mentioned above, no data on the exact distribution of the export trips across different alternative
routes exists. For the later analysis of the liberalisation scenario, we however do need such a picture.
Knowing that the trucks do deviate from the optimal routes, we therefore make an estimate of this
distribution by relying on the data of permit usage, augmented in some cases by additional numbers
provided by the UND.
The starting point for this estimation is the statistics of actual export trips from Turkey to different
countries (second column of Table F.4).
We distribute these trips across different alternative routes by using the data on the issued transit and
market access permits. In each country, the total number of these permits gives a lower bound on the
number of Turkish trucks that enter and cross the territory of the country (it is a lower bound because
of the existence of ECMT permits that are also actively used by the Turkish hauliers).
Moreover, we received some additional information from UND, such as that the total number of
Turkish trucks that enter Austria is around 130,000. The UND also provides data on how many trips
are conducted via the RoRo connections to Trieste and Odessa, and how many - by road through
Western borders of Turkey. We take account of the fact that Italy does not require transit permits for
trucks arriving in Trieste and then going north through Austria.
The general rule we use is that the trucks follow the cheapest routes whenever possible, and only
deviate if they face quantitative restrictions given by the actually used number of permits. These
restrictions lead to the formulation of a set of ad hoc rules (Box F.1), which seem to deliver a picture of
trips that is consistent with the statistics.
In order to decide, which route is the cheapest, we have assembled a database covering possible
routes that can be taken by Turkish trucks, including the routes involving ferry usage (ferries to Italy
(Trieste), France (Toulon), Ukraine (Odessa)). Using the detailed cost data provided by UND, we have
calculated total costs for a one-way trip of a standard truck. This includes distance-related costs (fuel,
tires, repairs), time-related costs (wages, insurance, other indirect costs), permit charges, tolls, and
ferry charges.
The resulting distribution of trips is displayed in Table F.4 (column 4). We are able to match the
statistics for permits usage quite well, with a few important exceptions.

Study on the economic impact of an agreement between the EU and the Republic of Turkey
Page 89
Table F.4 Estimation of the distribution of transit export trips by Turkish vehicles
Сountry
Export trips by Turkish carriers,
2012
Total number of used bilateral and
transit permits, 2012*
Estimate of the implied bilateral and transit trips,
2012
Estimate of the implied transit
trips, 2012
Austria 6901 112120*** 131788 124887
Belgium 8085 23439** 23432 15347
Bulgaria 12317 153445 166980 154663
Croatia 1686 52792 67326 65640
Czech Republic 3688 5736 16865 13177
Denmark 2272 2801 3061 789
Estonia 69 226 214 145
Finland 578 496 578 0
France 28079 38111** 38111 10032
Germany 87845 129471** 139759 51914
Greece 16976 39589 39914 22938
Hungary 3209 40077 50556 47347
Italy 37699 41766 111368 73669
Latvia 168 342 382 214
Lithuania 456 691 693 237
Luxembourg 370 500 370 0
Montenegro 396 394 396 0
Netherlands 12006 11969 12006 0
Norway 789 1038 789 0
Poland 9804 5500 15354 5550
Portugal 183 183** 183 0
Romania 28116 47749 75950 47834
Serbia 3729 71508 80288 76559
Slovakia 1985 17659 31404 29419
Slovenia 1598 44022*** 66044 64446
Spain 8143 5542 8326 183
Sweden 4644 4346 4644 0
United Kingdom 17060 0 17213 153 * Bilateral trips from Turkey to Poland, Romania, Slovenia and the UK are liberalised.
** France, Belgium, Portugal and Germany issue permits that allow multiple uses by the same vehicle.
*** GREEN bonus permits issued by Austria and Slovenia are counted twice as they allow a free entrance for each round-trip
Ro-Ro ticket purchase.
Source: UND, own calculations
Austria is a critical transit country for Turkish trucks. UND reports over 130,000 Turkish trucks crossing
Austria, which exceeds the number of used permits by roughly 20,000. The explanation for this
phenomenon may well be the use of ECMT licenses. Turkey received 3200 ECMT licenses in 2012.
These allow market access and transit throughout Europe and can be used for several trips by the
same vehicle. Assuming 20 trips per year (less than one round trip in two weeks), this gives 64000
trips that could be made by Turkish vehicles. Even with less frequent trips, it is clear that the existing
deficit of transit permits in Austria can be solved (and is apparently solved) with the help of ECMT
permits. The same explanation can be applied to the cases of Hungary, Croatia, Germany, Bulgaria,
Czech Republic, Slovakia and Spain, where the estimate is also higher than the actual number of
used bilateral and transit permits. Overall, we can estimate the number of used ECMT permits as the
sum of the extra permits needed for Croatia, Hungary and Italy (the most thin transit area), which
equals 36000 or 11% of total export trips to the EU.

Study on the economic impact of an agreement between the EU and the Republic of Turkey
Page 90
Box F.1: Ad-hoc assumptions used for trips distribution
Trips to UK:
90% of traffic goes by road through Germany and Belgium
10% of traffic goes through France after entering through Toulon
Trips by road to Benelux, Scandinavia, France, the UK:
75% of traffic goes through Croatia, Slovenia, Austria
25% of traffic goes through Hungary, Austria
Trips to Germany:
5% of traffic goes through Romania, Poland and Slovakia
15% of traffic goes through Romania, Hungary, Slovakia, and Czech Republic
26% of traffic goes through Croatia, Slovenia, Austria
10% of traffic goes through Romania, Hungary, Austria
44% of traffic goes through the port of Trieste and Austria (UND data)
Trips to France:
38% of traffic goes through the port of Trieste and crosses Italy
31% of traffic goes by the direct ferry through Toulon
31% goes by road through Austria, Germany
All traffic to Baltic States goes through Ukraine (some of it through RoRo to Odessa)
All RoRo traffic to Spain and Portugal travels via Toulon
Transit by road through Romania: Baltic States, Poland, Slovakia, Hungary, Czech Republic
The cases of Romania, Poland, and the UK are different, because there the deviation between the
used permits and the estimated trips is caused by the fact that the bilateral trips are liberalised (i.e.
they do not require a permit). In the case of UK the transit (which is very small, mainly to Ireland) is
already liberalised. The estimated transit traffic is estimated in the column 5 of Table F.4, which is just
the difference between the columns 4 and 2.
One more special case is Italy, where the part of the transit traffic that goes from Trieste to Austria
does not require transit permits. UND data suggests that there are around 58,000 transit trips from the
port of Trieste to the north that do not appear in the permits statistics.
With these additional explanations, we can say that the assumed distribution of trips delivers a picture
that is consistent with the available statistics. The numbers in columns 4 and 5 of Table F.4 are the
basis for comparing the trips in the baseline scenario and the liberalisation scenarios.